Article

Detection of Small Size Traffic Signs Using Regressive Anchor Box Selection and DBL Layer Tweaking in YOLOv3

1
Department of Electronic Engineering, NED University of Engineering and Technology, Karachi 75270, Pakistan
2
Dhanani School of Science and Engineering, Habib University, Karachi 75290, Pakistan
3
Department of Electronics and Communication Engineering, Hanyang University ERICA Campus, Ansan 15588, Gyeonggi-do, Korea
4
Department of Electrical Engineering, University of Engineering and Technology, Narowal Campus, Lahore 54890, Pakistan
5
Department of Computer Science, National University of Computer and Emerging Sciences, Islamabad, Chiniot-Faisalabad Campus, Chiniot 35400, Pakistan
6
Institute of Software Development and Engineering, Innopolis University, Innopolis 420500, Russia
*
Author to whom correspondence should be addressed.
Submission received: 22 October 2021 / Revised: 29 November 2021 / Accepted: 2 December 2021 / Published: 6 December 2021
(This article belongs to the Special Issue Advanced Intelligent Imaging Technology Ⅲ)

Abstract

:
Traffic sign recognition is a key module of autonomous cars and driver assistance systems. Traffic sign detection accuracy and inference time are the two most important parameters. Current methods for traffic sign recognition are very accurate; however, they do not meet the requirement for real-time detection. While some are fast enough for real-time traffic sign detection, they fall short in accuracy. This paper proposes an accuracy improvement in the YOLOv3 network, which is a very fast detection framework. The proposed method contributes to the accurate detection of a small-sized traffic sign in terms of image size and helps to reduce false positives and miss rates. In addition, we propose an anchor frame selection algorithm that helps in achieving the optimal size and scale of the anchor frame. Therefore, the proposed method supports the detection of a small traffic sign with real-time detection. This ultimately helps to achieve an optimal balance between accuracy and inference time. The proposed network is evaluated on two publicly available datasets, namely the German Traffic Sign Detection Benchmark (GTSDB) and the Swedish Traffic Sign dataset (STS), and its performance showed that the proposed approach achieves a decent balance between mAP and inference time.

1. Introduction

The recent advancements in technology moved our society towards an intelligent transportation system. This allows humans to delineate the road conditions ahead of time yielding lesser human error and accidents. Today’s modern cars incorporate Advanced Driver Assistance Systems (ADAS) such as collision warning, human detection, de-raining systems, and de-hazing systems. Hence, the quality of human daily life is improved. The future commercial autonomous driverless cars or intelligent vehicles are likely equipped with self-localization, scene understanding, path planning, and collision avoidance capabilities. A car that can adjust its speed according to the speed limit sign on-road and navigate to its destination safely is in demand. The prime requirement for such cars is an accurate and real-time traffic sign recognition system.
Typically, the traffic sign recognition system is divided into two steps; (1) localization of traffic signs from road view images, (2) classification of traffic signs to the specific categories. Vast research material pertaining to this field is available and researchers are able to achieve high precision and recall values. For example, Serna [1] and Gupta [2] reported near 100% traffic sign detection accuracy on the German Traffic Sign Detection Benchmark (GTSDB) [3]. However, its real-time recognition with resource-limited constraints in a real scenario is still a challenging task.
Classical object feature extraction methods, such as gradients, color, and texture use contour, color, and texture features to locate traffic signs. Nonetheless, these features in the current demand are not promising. Such features change with illumination conditions, and the presence of similar shapes or color objects in the background can cause false detection. Hence, in today’s era, researchers are focused on convolutional neural network (CNN) based features. CNN-based detectors include Region Proposals networks such as Fast R-CNN [4], Faster R-CNN [5] and Mask R-CNN [6]. There are also single-pass image-based CNN detectors such as Single Shot Multibox Detector [7] and YOLO [8]. Region Proposal-based CNN detectors achieve higher accuracy but are slow in real-time bounding boxes prediction. Single-pass image detectors provide better inference time, but are error-prone and yield less accuracy.
For an autonomous car, inference time is as equally crucial as accuracy; this gives more reaction time, to make timely and appropriate decisions to prevent fatal accidents. A 100% accurate method is useless if it is not able to detect traffic signs in due time. Similarly, a real-time detector with limited accuracy has no importance. Thus, researchers are working to achieve optimal values for accuracy and inference time. This will make traffic sign detection faster and precise. In this paper, we propose an improved single image pass CNN-based YOLOv3 network framework for real-time traffic sign recognition, which is more accurate and faster at detecting traffic signs than the state-of-the-art methods.
The main contributions of this paper focus on the framework of the YOLOv3 algorithm and are summarized as follows:
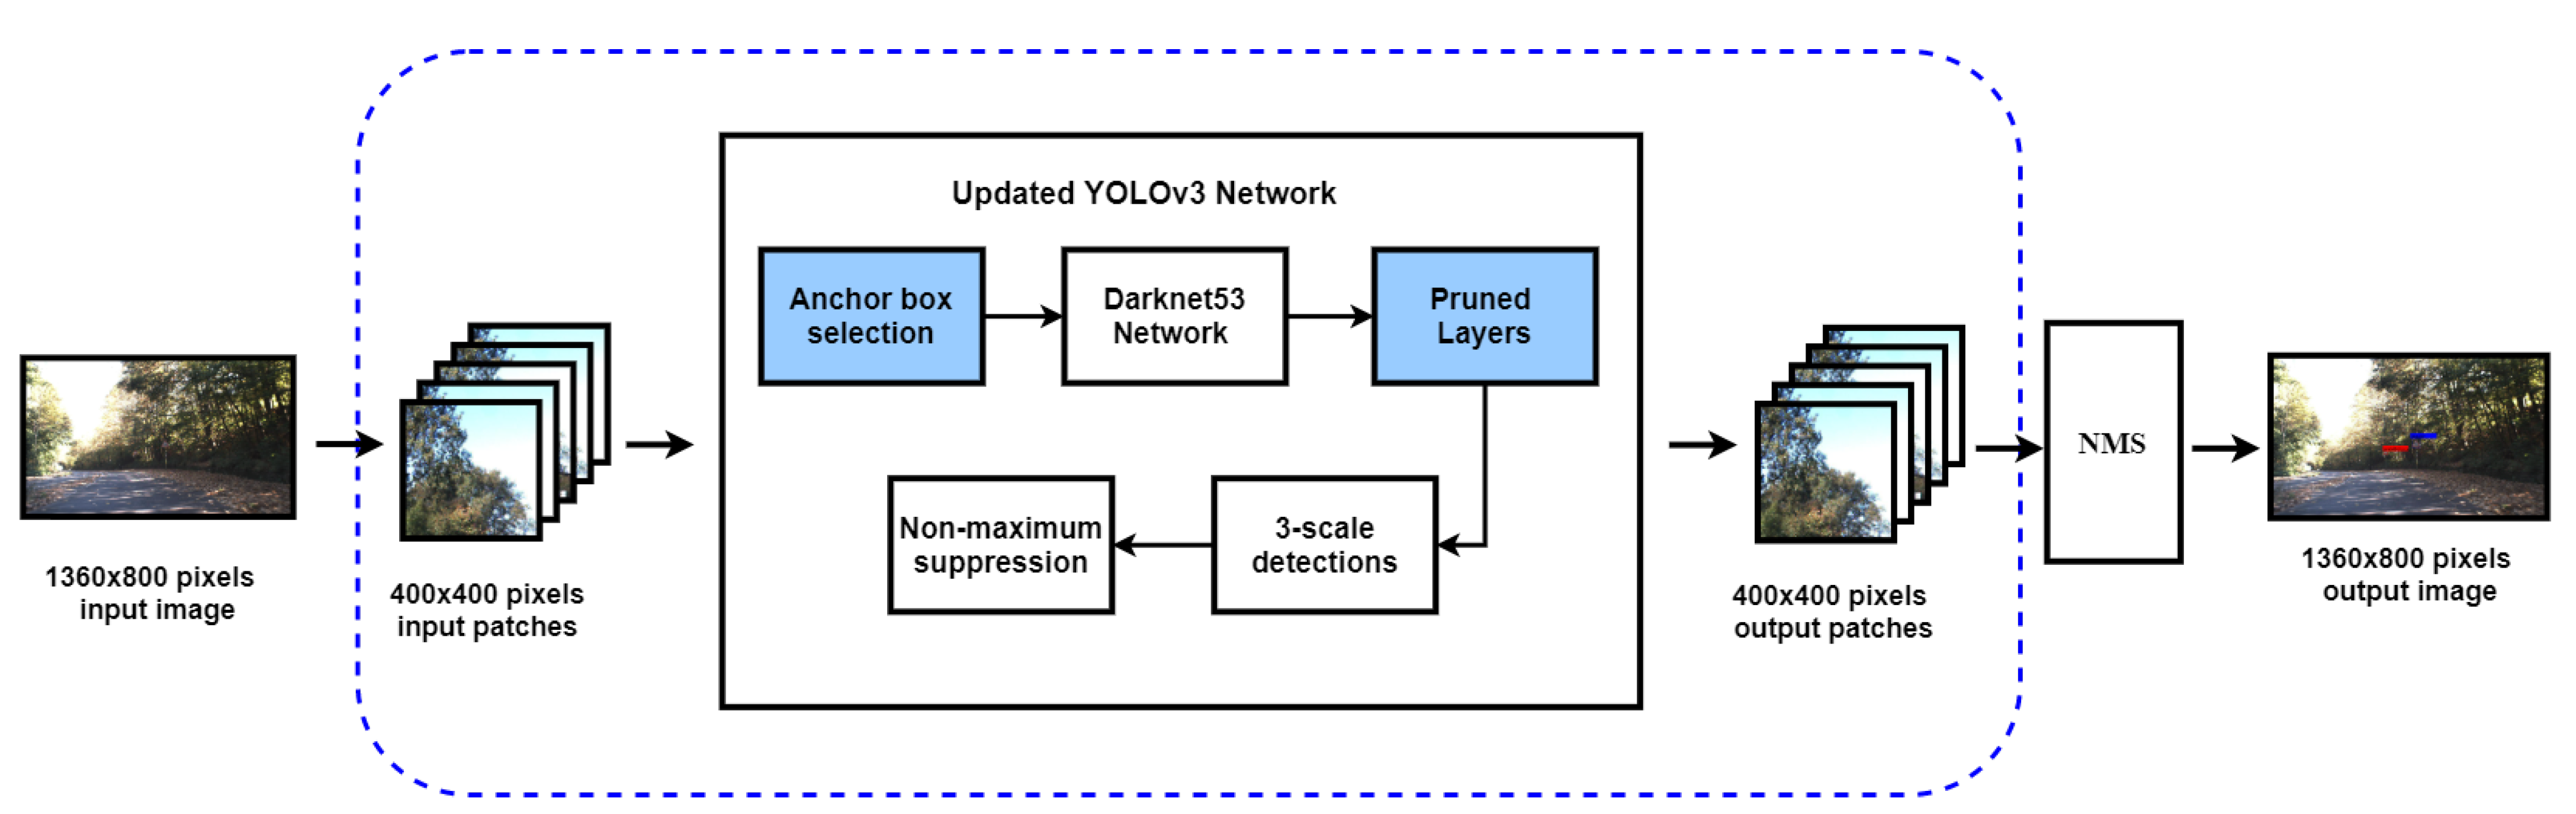
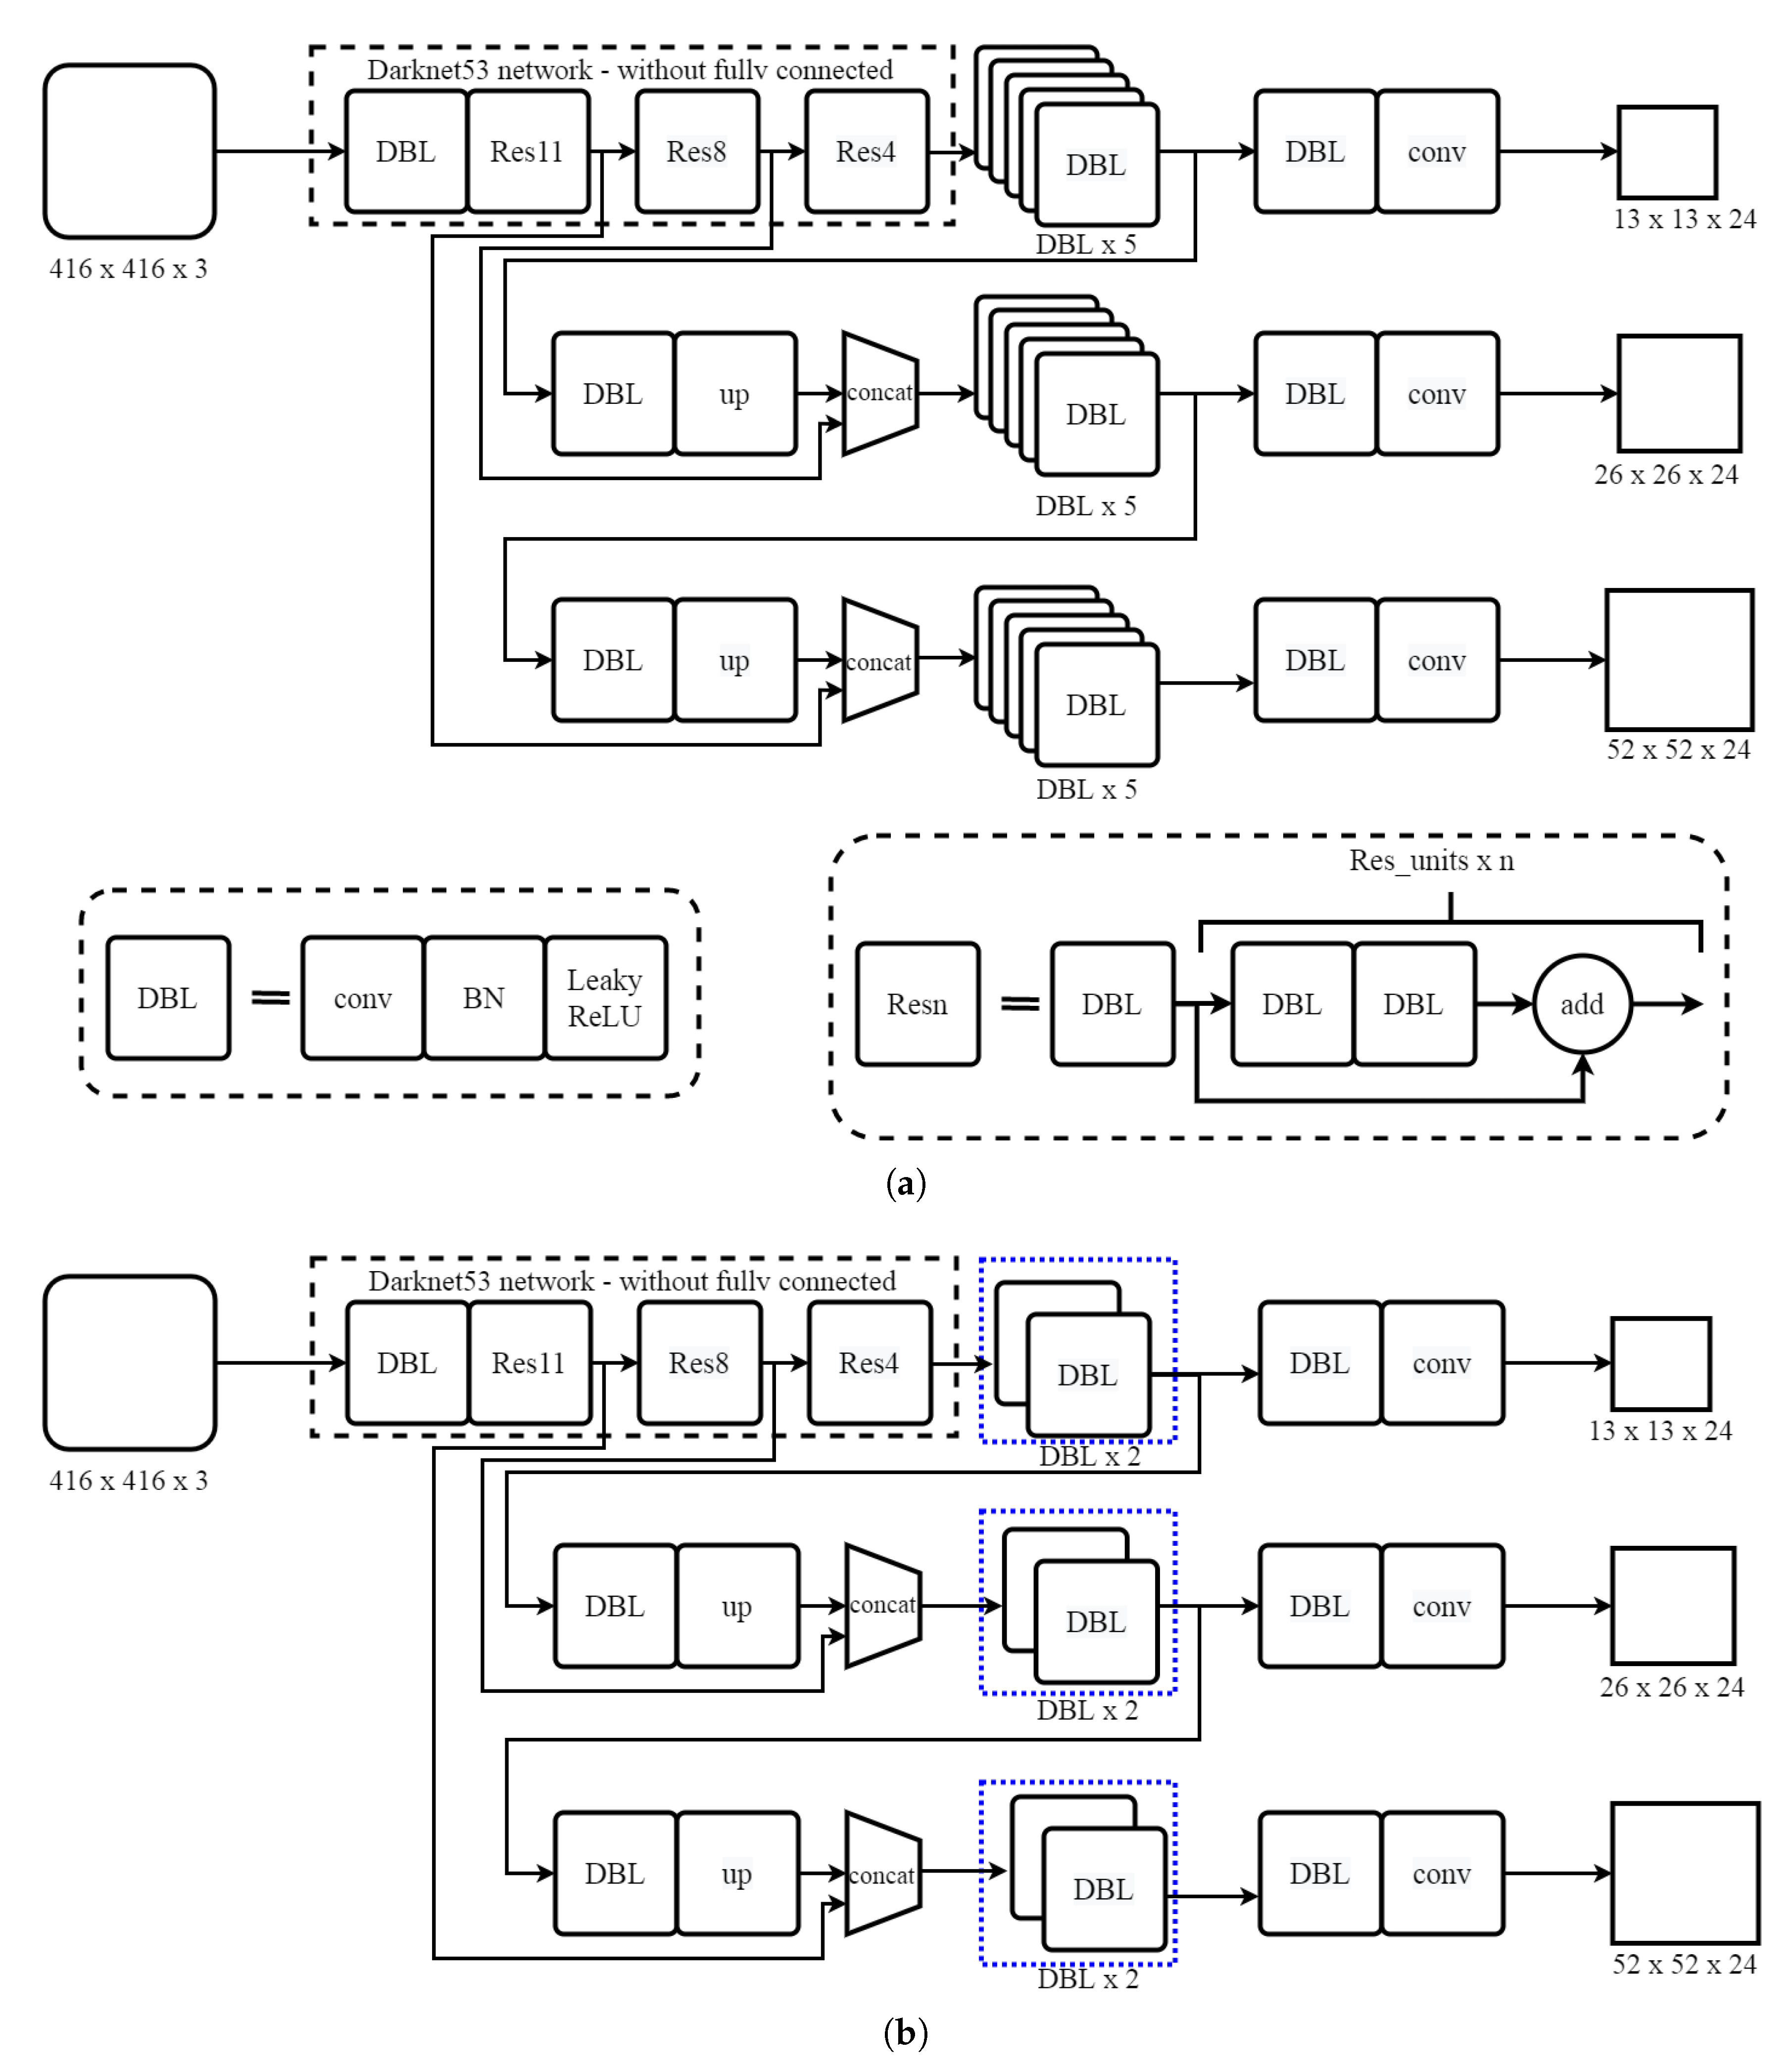
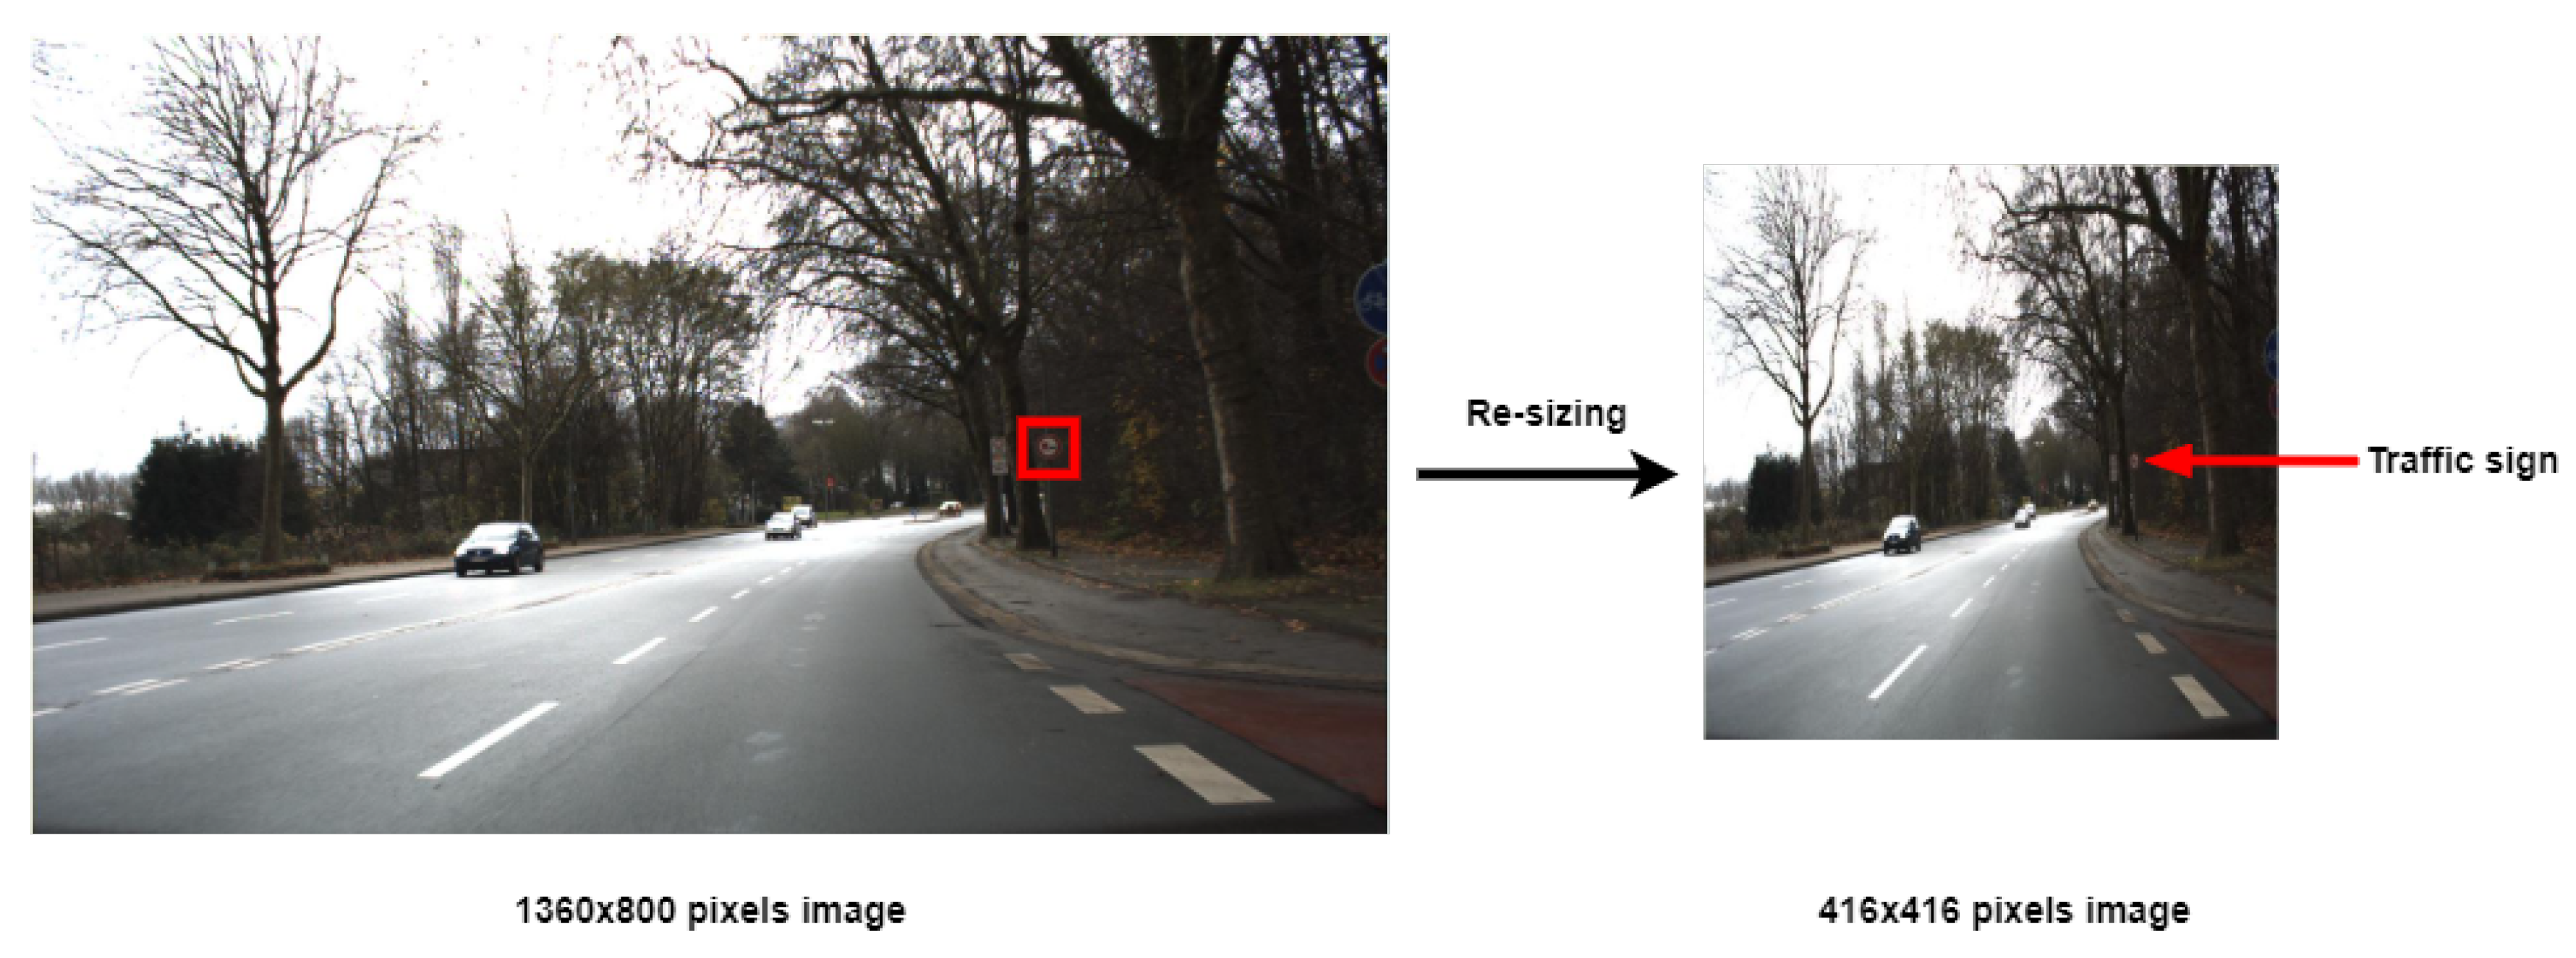
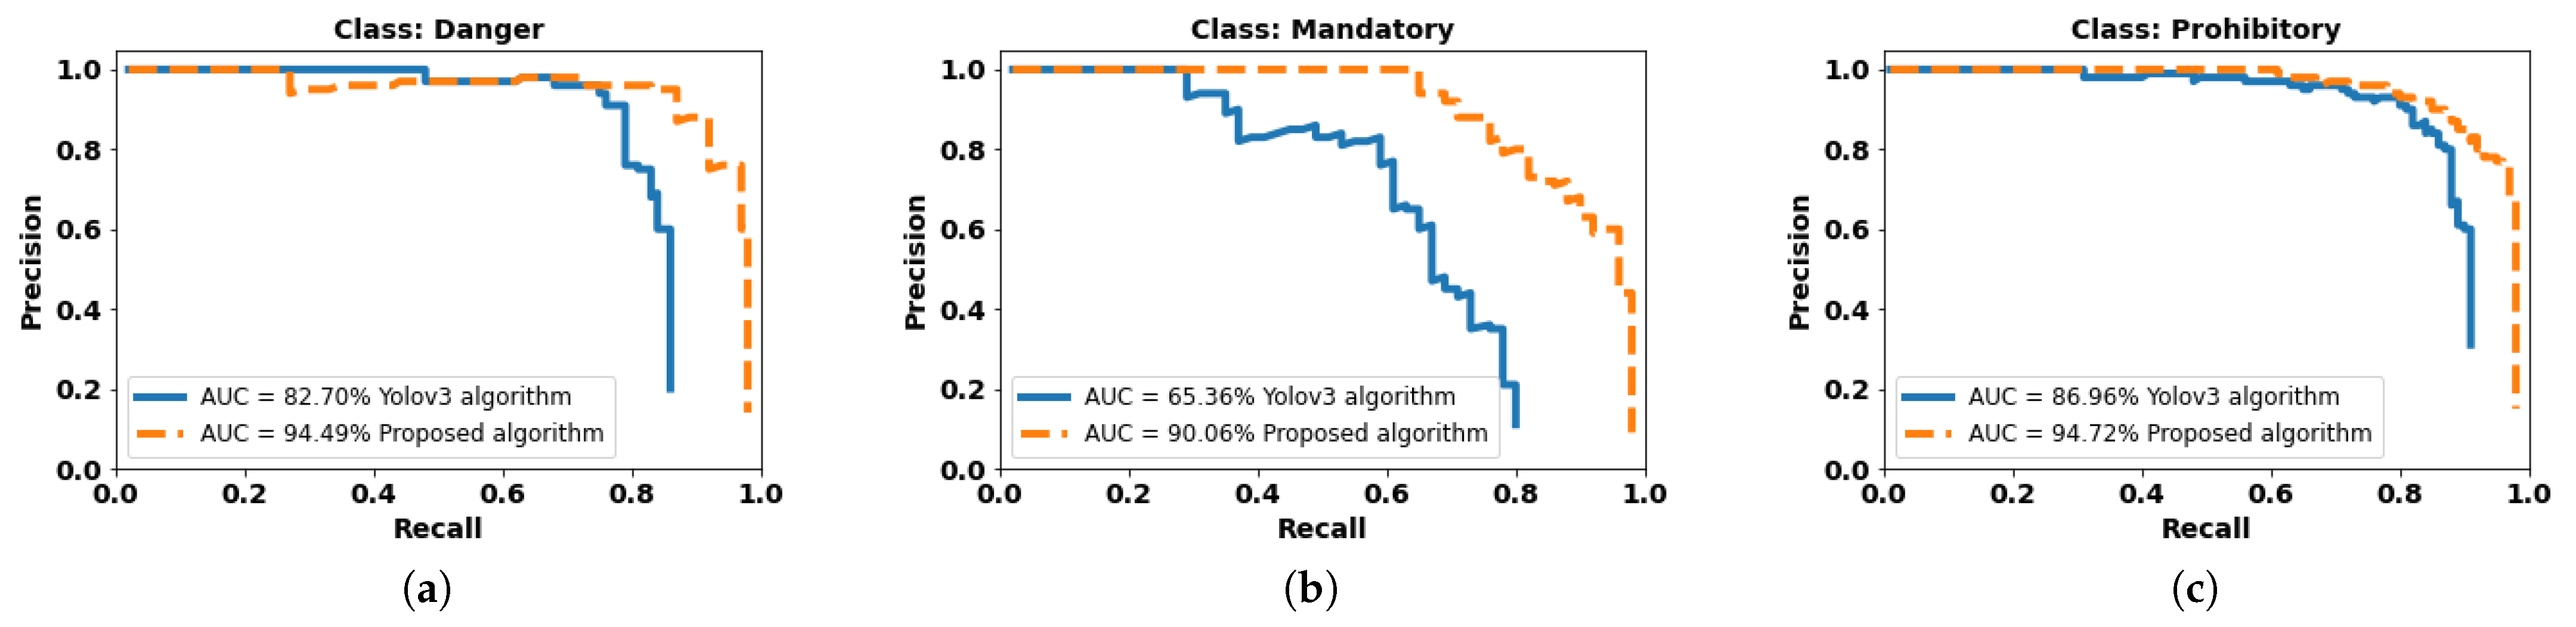
  • Tweaked YOLOv3 model for smaller object detection: YOLOv3 model uses multiple DBL layers for object detection. For larger object size relative to image size, these DBL layers are sufficient however, for a smaller object such as a traffic sign, useless features are being learned. We propose pruning a few of those layers and validating the rationale on GTSDB.
    This improvement helped in extraction and saving fine details of traffic signs. In addition, a new strategy for training and testing is proposed. Instead of using the whole image at once, it was broken into patches and those patches were used for training and testing. We report an increased accuracy of 14% from the default YOLOv3 accuracy, fewer false detections, and log-average miss rate. We also evaluated the proposed network framework on two publicly available datasets, namely GTSDB (German Traffic Sign Detection Benchmark) and STS (Swedish Traffic Sign) dataset [9], giving 16% and 5% rise in mAP, respectively.
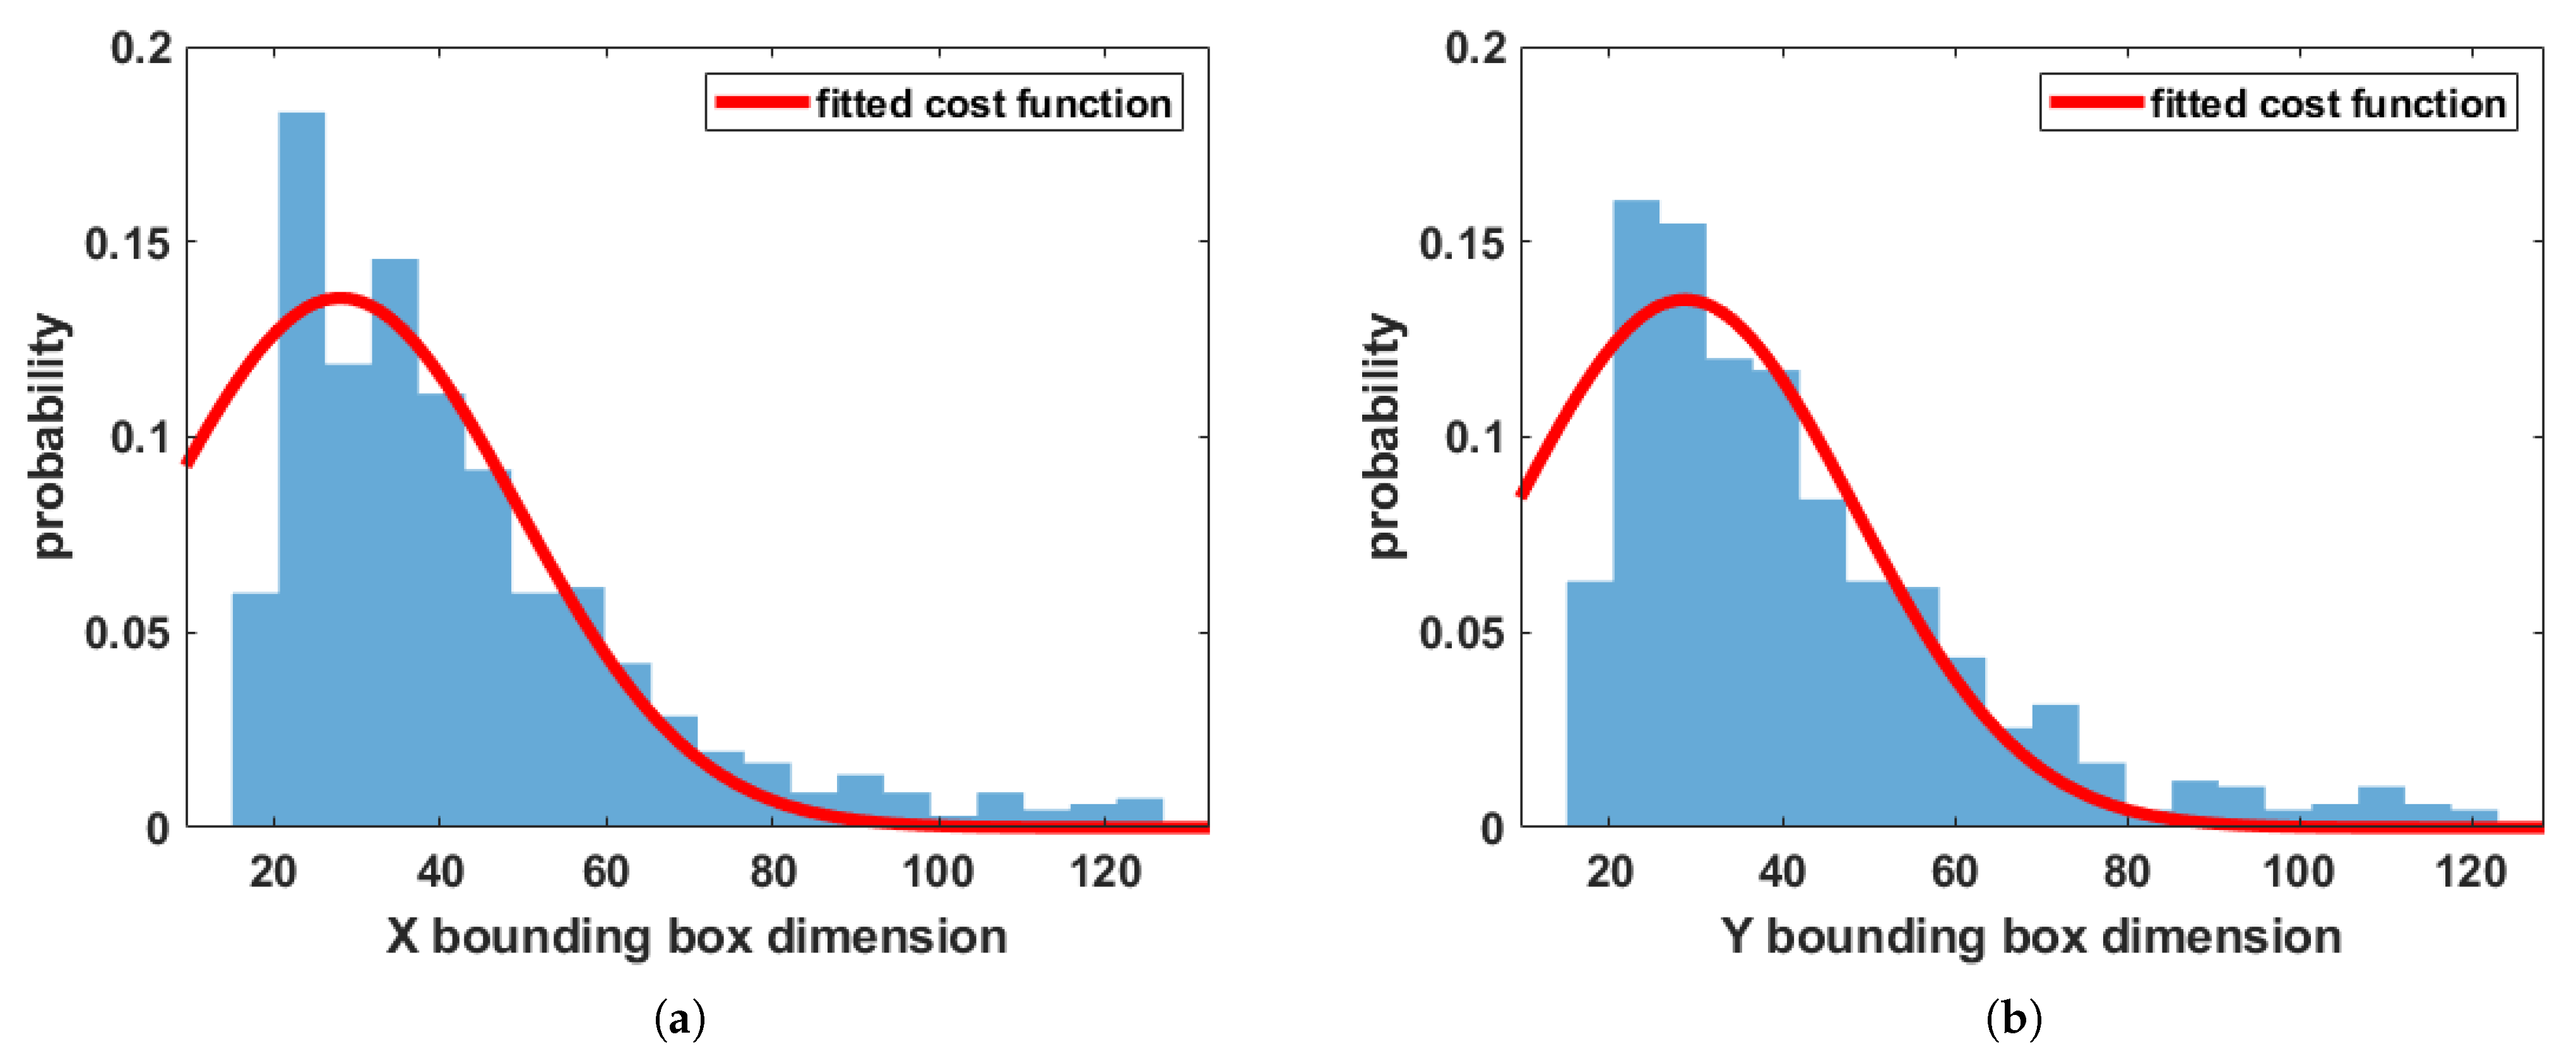
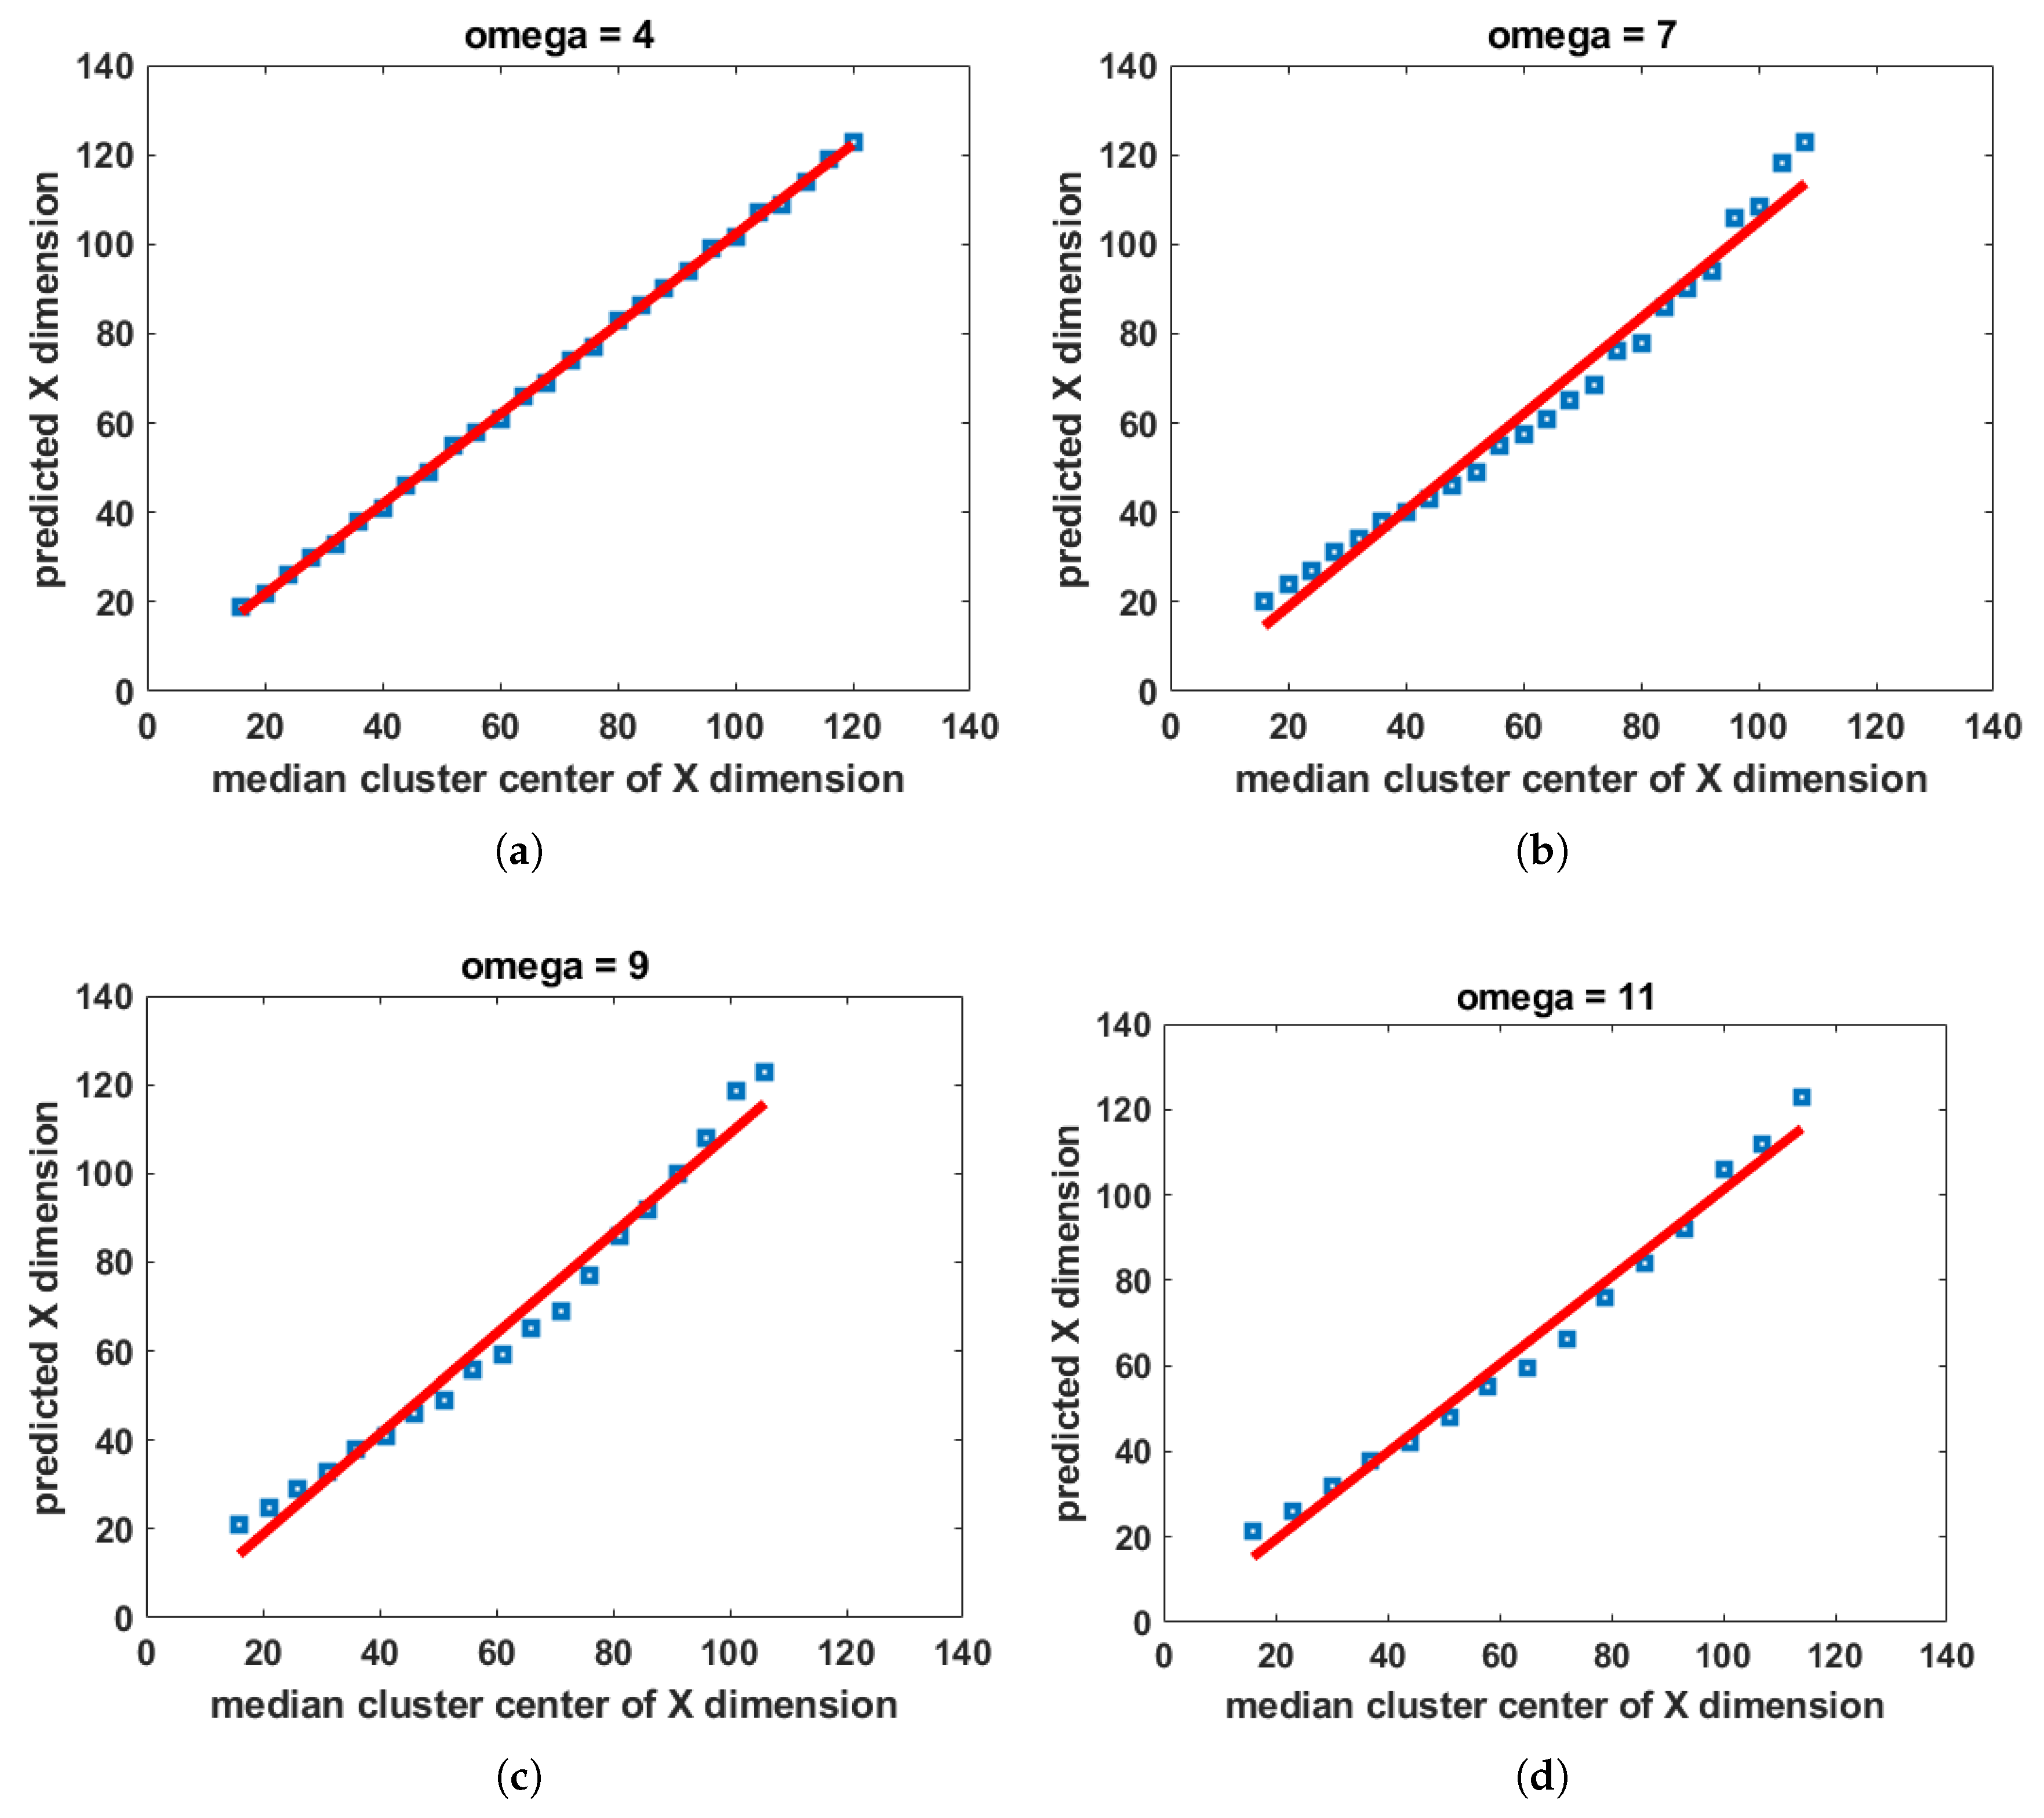
  • Regressive anchor box selection: While analyzing the traffic sign size distribution in the German and Swedish traffic sign training set, we noticed that the majority of the traffic sign sizes are smaller and concentrated in the range from 20 pixels to 40 pixels. The base technique in YOLOv3 uses k-means clustering to select the anchors.
    We propose to make this selection adaptive using a regression model. We designed a cost function that adds more weight (by assigning higher numbers of clusters) to the bounding box size distribution where a majority of the traffic signs are concentrated. This helps us to select most of the anchors from the pixel value range that contains most of the traffic signs sizes and lesser anchors from the lesser concentration regions. The cost function helps the regression model to adapt the traffic sign sizes for any dataset. As a result, the detection accuracy of the traffic signs on GTSDB was further increased by 2% in addition to the increased accuracy achieved with the tweaked YOLOv3 detector. We noted that the increase in 2% accuracy was due to the perfect placement of anchors on test samples. The proposed model is adaptive and can be used with any object.
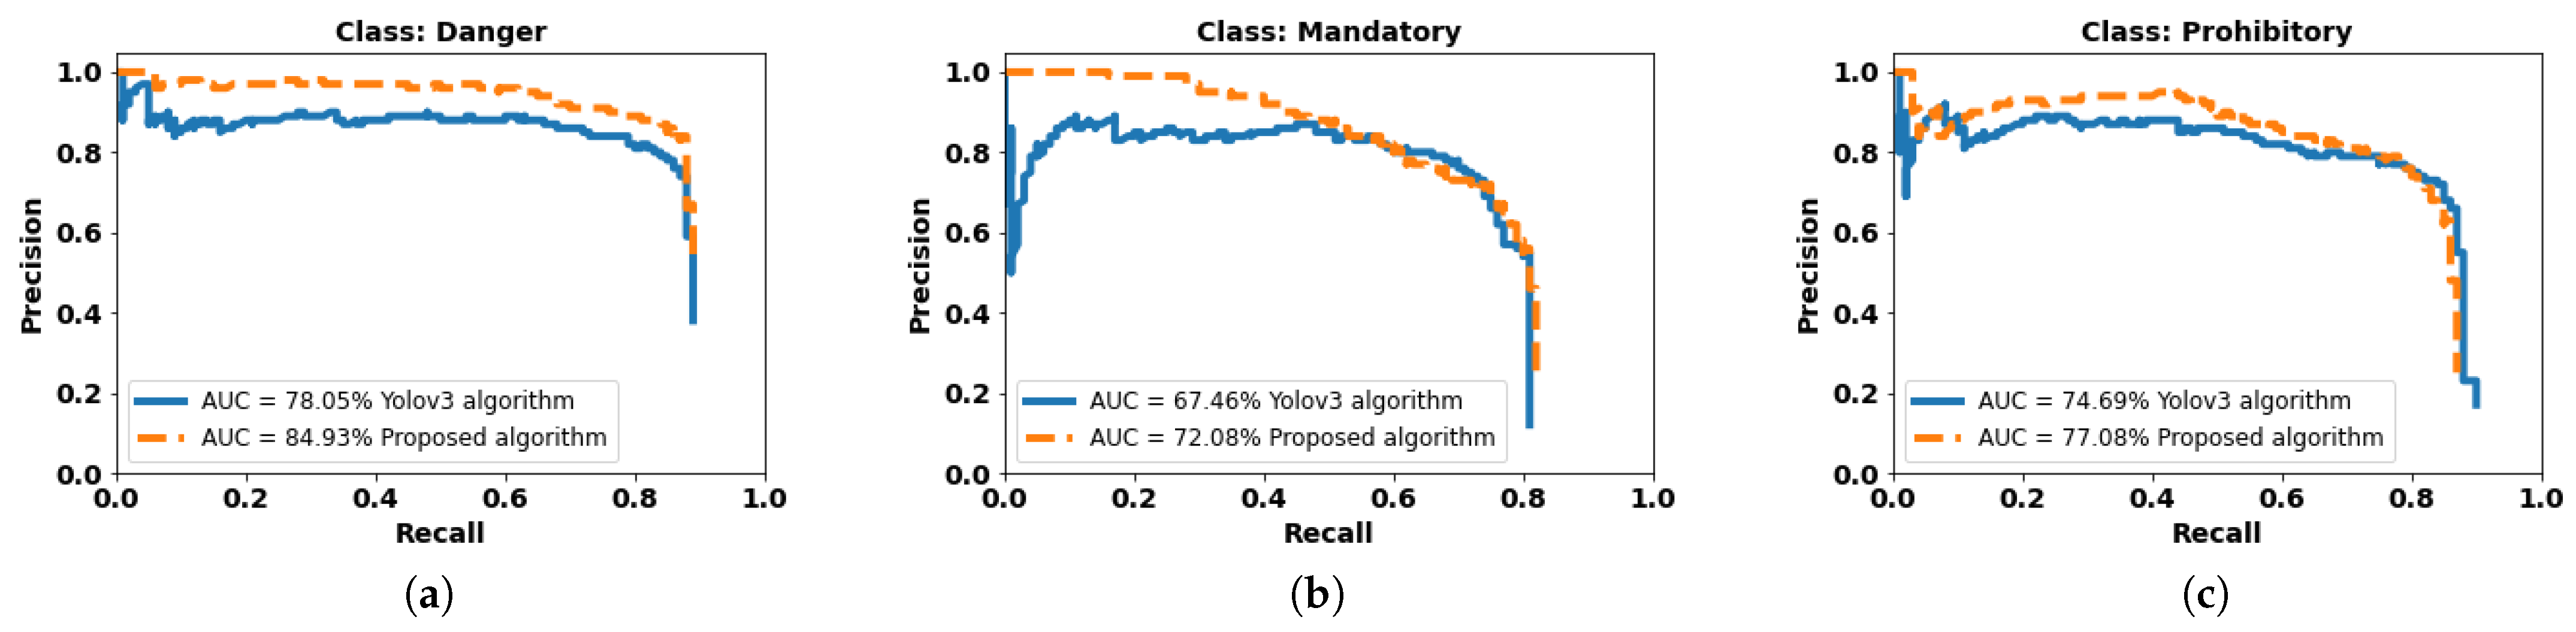
  • Focal loss: In this research, we also investigated the effect of incorporating focal loss [10] as Objectness score. We note that the hyper-parameters in focal loss are object shape as well as size-dependent. The optimal values for alpha and gamma for traffic signs have also been determined. Our proposed method achieved higher mean Average Precision (mAP) and equal Log Average Miss Rate (LAMR) as compared with the Focal loss implemented YOLOv3 detector.
The rest of the paper is organized as follows: Section 2 discusses some recent related works. Section 3 and Section 4 discuss the proposed methodology and experimental results, respectively. Finally, Section 5 concludes the paper.

2. Related Work

Traffic sign recognition has been a hot research field for the last decade. It is an essential module for autonomous cars and an automatic driver assistance system (ADAS). Various approaches have been pitched for accurate and real-time traffic sign detection. Since traffic signs follow standard color and shape, prime approaches have been based on color and shape detection. Researchers exploited the use of these features to detect and recognize traffic signs. Gupta and Choudhary [2] proposed a traffic sign detection and recognition framework based on Grassmann Manifolds. It uses HSV color segmentation for detection.
The authors in [11] enhanced red and blue channels of an RGB image. Histogram of Oriented Gradient (HOG) was applied and an SVM and KNN classifier was used to classify the traffic sign and non-traffic sign regions. Yang et al. in [12] proposed a Colour Probability Model to determine the color distribution of traffic signs. In this work the authors used Ohta space [13] instead of RGB space. The authors in [14] incorporated the constrained Hough Transform to determine the shape of traffic signs. Other methods such as the Radial symmetry detector [15] used traffic sign appearance features. It should be noted that the color and shape-based detectors are not promising for traffic sign detection in real-time road scenarios, since these features are affected by illumination, weather conditions, and occlusions. Moreover, background objects with similar shapes and colors may trigger false detections.
Some research works addressed the aforementioned issues using its standard shape and color as its unique identity. The authors in [16] used different channels of shape and color features for traffic sign detection. The researchers in [17] managed traffic sign detection by extracting a region of interest (ROIs) with the help of Maximally Stable Extremal Regions (MSERs) [18].
The recent developments in deep learning proved that CNN is more effective towards traffic sign detection than handcrafted features. CNN-based detectors consist of two categories: two-stage and single-stage detectors. The former detection technique is more robust in detecting traffic signs with higher accuracy than the later one. Jia Li et al. [19] proposed a three-stage traffic sign recognition system. This system was composed of three main components i.e., Faster RCNN [3] detector, Hough transform for localization refinement, and CNN-based classifier. The authors in [1] Serna et al. used Mask RCNN [6] for traffic sign detection and localization. They also proposed CNN based classifier to predict more than two traffic signs. The system was able to achieve 96.16% mAP in the GTSDB dataset [3] with the processing speed of 3.3 FPS. Although the performance of the algorithm in [1] is outstanding, 30 FPS is required for real-time detection. Single-stage detectors can achieve real-time traffic sign detection.
Single-stage detectors determine bounding box coordinates and classification scores simultaneously in a single run hence, improving inference speed for detectors. Single-stage detectors by their architectures were designed to avoid region proposal or sliding windows. Lee and Kim [20] proposed a traffic sign detection system that used Single Shot Detector [7] to output precise boundary corners of the detected traffic sign. The authors in [21] used the SSD model with Feature Pyramid Network [22] for multi-scale traffic sign detection. To overcome the low inter-class variation in traffic signs, a lower-level feature map was used for classification. The authors of [23] used Gaussian modeling to determine the uncertainty in bounding box coordinates predicted by YOLOv3, which was further used to enhance the detection accuracy. A modified YOLOv3 based traffic sign recognition system was proposed in [24], obtaining an average precision of 52.32% for LSITSD [25] test images with higher inference time than state-of-the-art systems.
Overall, most of the proposed detectors are either accurate or fast. However, the need of a good trade-off between accuracy and processing time is still required. Since these are crucial parameters of a detection system, which demands further research to investigate an optimal way for precise traffic sign detection in minimum time. Furthermore, accurate detection of a small traffic sign is also important. Traffic signs have standard sizes but their apparent sizes vary with the distance between the camera and the sign. The farther a sign, the smaller it appears; the closer a sign, the bigger it appears. Therefore, for the accurate detection of faraway traffic signs, there is a dire need for appropriate anchor boxes.

3. Proposed Method

YOLOv3 is a state-of-the-art single-pass fast object detection network. It processes a complete image at once by implicitly using contextual information about shape, size, and structure. YOLOv3 network is an amalgam of residual and feature pyramid networks which significantly benefits detection and classification-related tasks. Nonetheless, it still lags in terms of detection accuracy of smaller objects with reference to image size. For COCO dataset [26], it attained 31% mAP [27] with an inference time of 29 ms equivalent to 34.5 frames per second, which is a real-time performance. But due to its low mAP, it cannot be used as a real-time object detector. Furthermore, the COCO dataset includes objects of larger size that cover typically 50–70% of the image area. On the other hand, traffic signs appear much smaller in an image, covering only 2–5% of an image. In YOLOv3, K-means clustering is used to determine best-fit anchor boxes for a particular data set.
Furthermore, the random selection of initial K-means centroids in YOLOv3 sometimes results in good accuracy and at times it is worse. Hence, multiple executions are required to determine the optimal values. Anchor boxes’ size and scale have a major effect on Average Precision. Unlike Faster RCNN, it is not trained for a region of interest (ROIs). Rather the network fits the chosen anchor boxes over the objects to be detected in different segments of the image. This anchor box fitting over an object takes a long time with anchor boxes of improper sizes and scales. Besides, sometimes it misses out on true detections and outputs much false detection, leading to lower Average Precision values.
To manage smaller object detection with higher accuracy and lower false detections due to improper bounding box placement, we propose an improved YOLOv3 network along with the anchor box selection method. The block diagram of the proposed method is shown in Figure 1. There are two improvements in the YOLOv3 network; the network layers pruning and replacement of the default anchor box algorithm with the regression-based anchor box selection. In addition, the input image is divided into patches of 400 × 400 pixels and passed through the improved network for traffic sign detection. The output patches are consolidated into the original input image size and redundant detections were removed through a non-maximum suppression block.

3.1. Regressive Anchor Box Selection

As detection accuracy is dependent on the correct localization of an object inside an image, optimal size and shape of anchor boxes are necessary. The designer of YOLOv3 proposed to use the K-means clustering for anchor box selection. This method takes into account the ground truth boxes dimension very well but fails to comprehend the ground truth distribution density. It could be noted that the distribution of ground truth bounding box dimensions are different in all datasets. Some may have a majority of bounding boxes dimensions lesser than 20 pixels or some greater than 60 pixels. A reasonable approach would be to assign majority anchor boxes in the higher concentration range of the bounding box dimension and vice versa to achieve better localization.
To achieve this we analyzed the bounding box dimension distribution of the GTSDB training set as shown in Figure 2. The figure shows bounding box dimensions on the x-axis and the probability of the y-axis. The probability on the y-axis underlines the majority bounding box concentration areas. Furthermore, the figure also shows the fitted cost function on to the bounding box distribution. The cost function can be explained with the following Equations (1) and (2).
W = S × C F
C F = e d ( p , q ) α n
d ( p , q ) = i = 1 m ( q i p i ) 2
where W be the probability-weighted number of clusters, S represents a peak value for a maximum number of clusters, C F represents the cost function, n is the number of histogram probabilities, α is a hyper-parameter, and d ( p , q ) represents the Euclidean distance between the current histogram probability and lowest histogram probability of the bounding boxes dimensions as shown in the Equation (3).
The fitted cost function on to the bounding box distribution represents the amount of focus our proposed algorithm would have for finding the anchor boxes. It should be noted that higher concentration areas have a higher focus than the lower concentration areas of the bounding box distribution. In the proposed method, we translated the focus as the amount of probability-weighted clusters W to exist and S define a maximum number of clusters that may form. Hence, the nearer we are towards the high concentration area, the more clusters are to be formed and vice versa. Once probability-weighted clusters from Equation (1) are formed, the Median is calculated. In the higher concentration regions, large numbers of clusters are formed to accommodate more anchors than the lower concentration regions. We then fitted a linear regression model using least-squares in the acquired Median values from the clusters as shown in Figure 3.
By conducting experiments, we found that changing the number of elements per cluster also influences the subsequent anchor boxes. We denote this term as Omega and empirically found that when Omega is four, the algorithm yields the highest traffic sign detection accuracy. Finally, we predict the anchors from the linear model by taking random samples in the range from the lowest bounding box dimension to the highest bounding box dimension. Seventy percent of random samples were taken from the higher concentration regions and the remaining thirty percent from the lower concentration region. The split 70–30% was acquired by adding up the probabilities of higher concentration region (from pixel 18 to 50) and lower concentration region (from pixel 51 onwards). In Figure 3, it is observed that for all the values of Omega, Median cluster values in the higher concentration regions are more in number than lower concentration regions.
The nine anchors obtained from the proposed regressive anchor selection scheme give us the detection accuracy of 93.09% on the GTSDB. We note that the proposed method learns the sizes of bounding box dimensions (i.e., minimum and maximum values) from the training set. In addition, it also learns the object dimension i.e., horizontal, vertical, or square object, which enables us to find the most pertinent anchors necessary for object detection and localization.

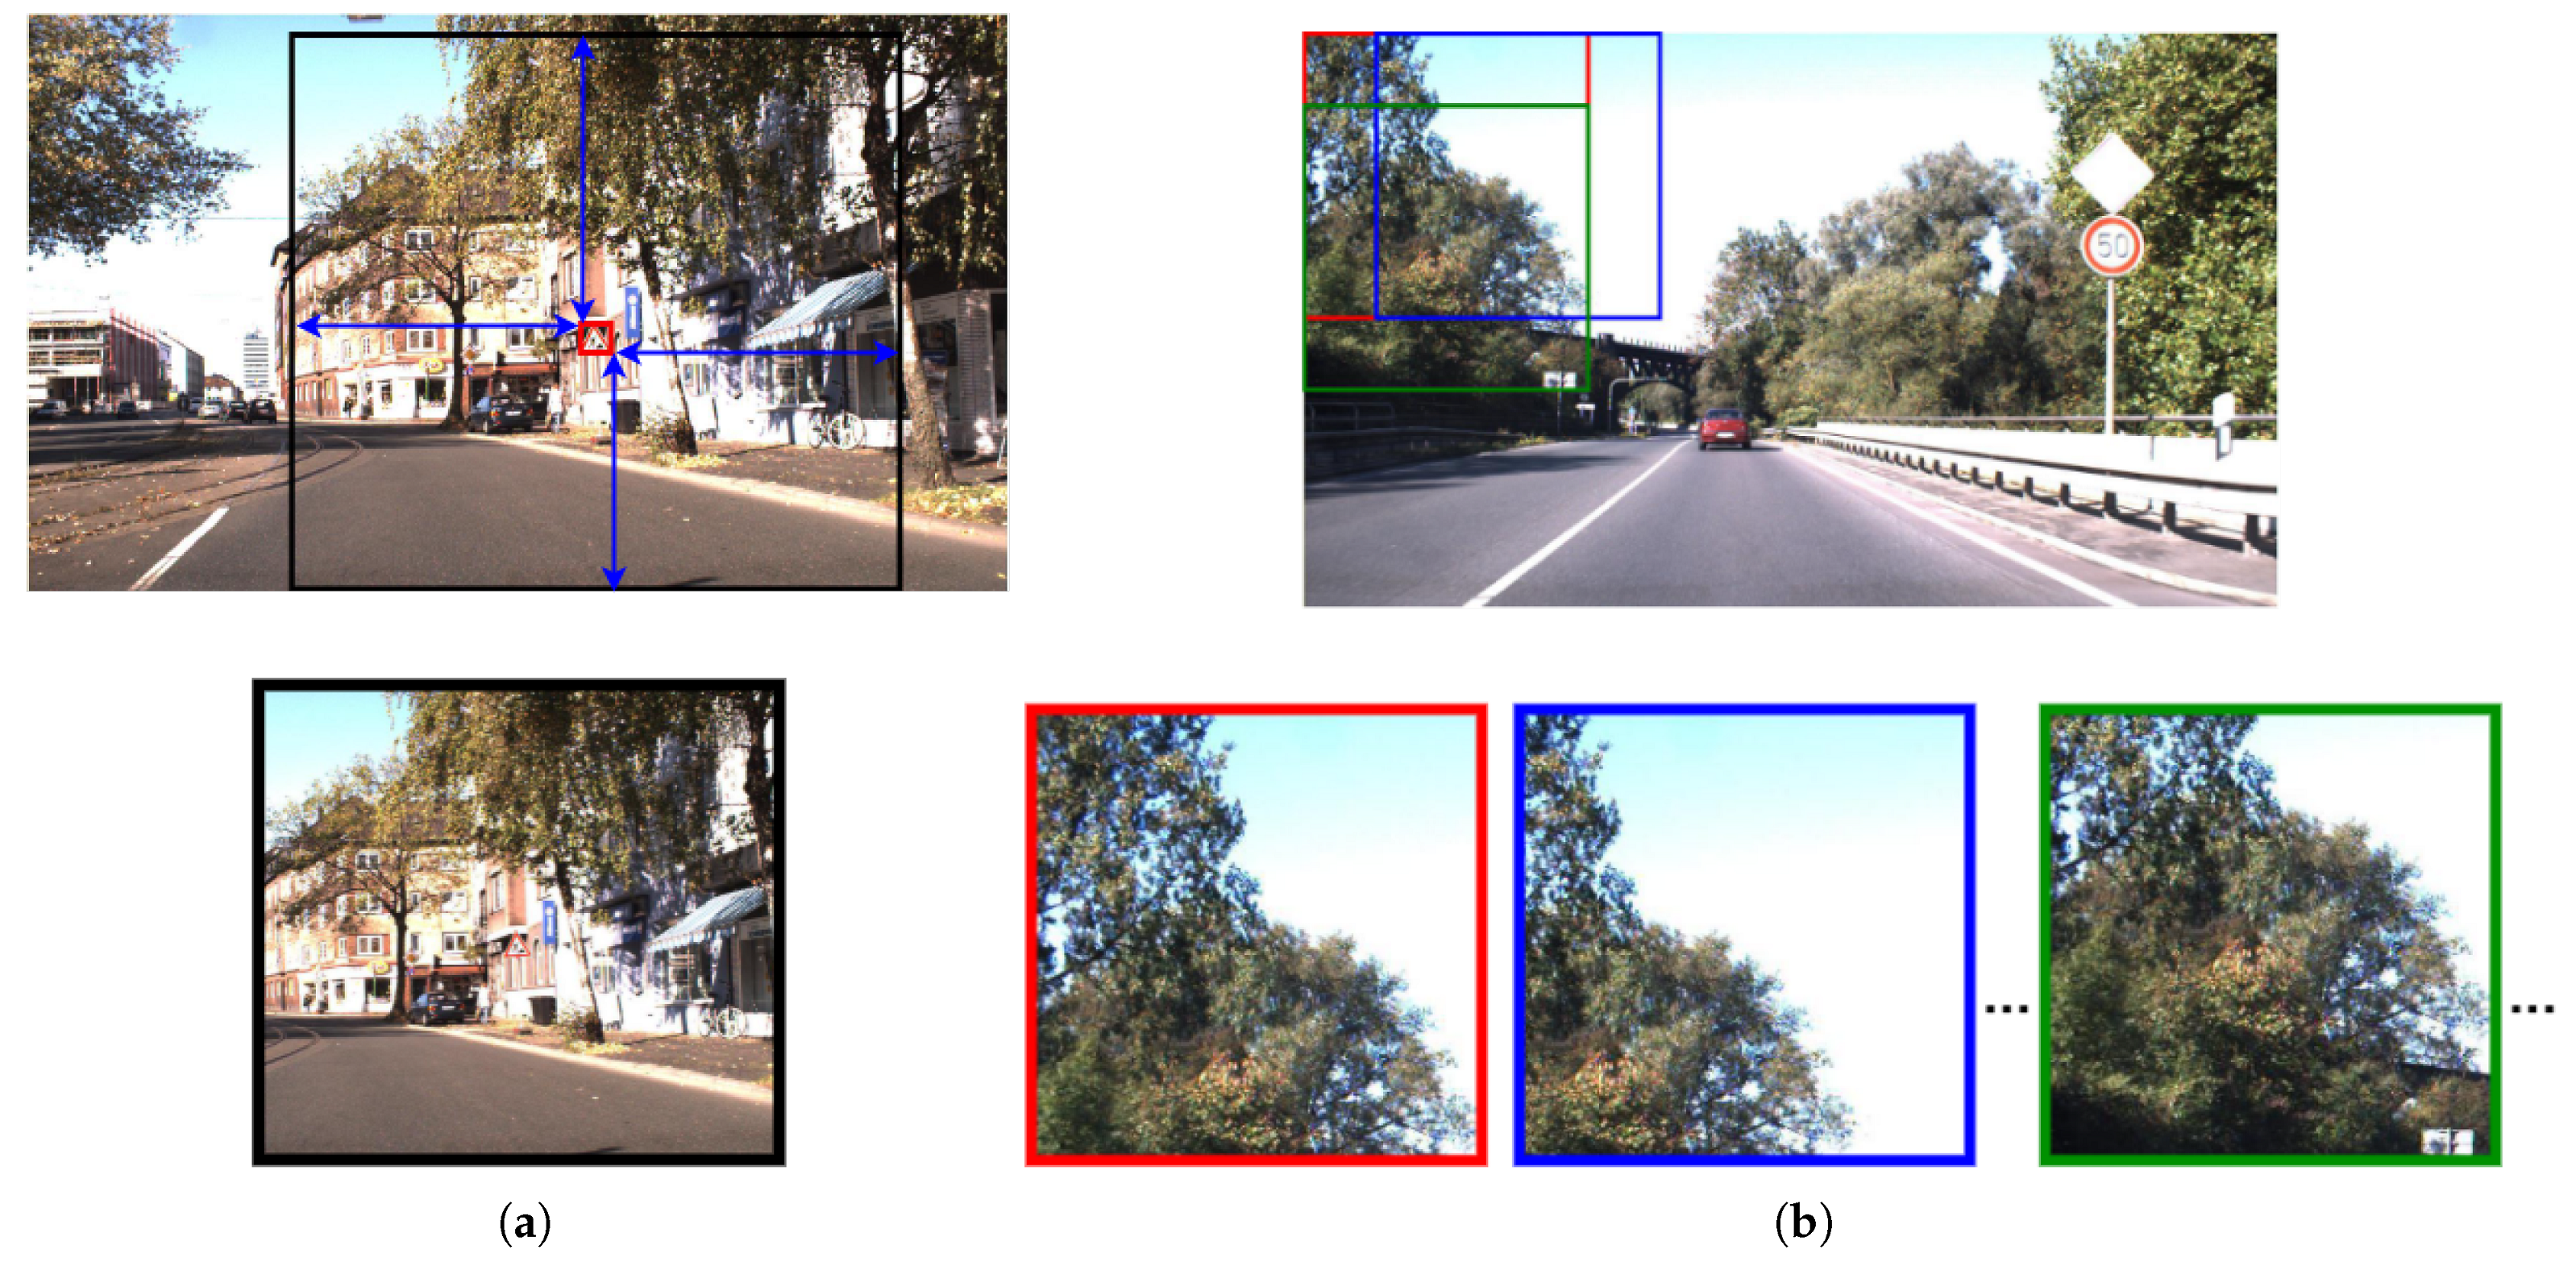
3.2. YOLOv3 Coupled with Patch-Wise Detection Strategy

YOLOv3 is a convolutional neural network that finds objects at three different scales of input image similar to the feature pyramid network. YOLOv3 uses the darknet-53 network as a feature extractor and additional seven convolutional layers at each stage for detection. The output feature map of the deepest level is upsampled at a stride of two and concatenated with a shallower feature map for detecting smaller objects in an image. This upsampling takes place twice in the network to locate different size objects in an image. The YOLOv3 network is shown in Figure 4a, where each convolutional layer is followed by batch normalization and Leaky ReLU activation function represented by the DBL block.
Generally, traffic signs are smaller objects compared with other objects in an image. In the 1360 × 800 pixels images of GTSDB, the largest traffic sign is 128 × 128 pixels. Hence, traffic signs occupy only 1.5% of the total image pixel area. The deeper networks learn about an object’s subtle appearance and its texture while the shallower layers learn about strokes and shape features of an object image. In the case of the traffic sign detection, those fine appearance and texture features are less important than shape features. Therefore, the natural idea for the detection of small objects like traffic signs is to use an output feature map of forefront layers and avoid deeper layers. In short, traffic layers signs do not need a deeper network, as their size is small. Therefore, we propose to reduce the network length to a customized value in order to detect the traffic signs of different sizes with a lesser miss rate.
We reduced the stack of five DBL layers at each detection level to two DBL layers, to make the network shallow as shown in Figure 4b. This reduction of the DBL block stack at each detection stage yielded lesser false positives and lowered the log-average miss rate (LAMR). Henceforth, improving mean Average Precision and overall performance of the YOLOv3 network. Therefore, we conclude that for smaller objects like traffic signs, five DBL layers are redundant in the network, and since traffic signs are small objects in road scenes, the output feature map of deeper networks is not required.
During the experiments, we noted while training and testing the network that the input image size was taken as 416 × 416 pixels. The input image to the network was scaled to 416 × 416 pixels and then it was forwarded to the network. It should be noted that rescaling a large image (e.g., 1360 × 800 pixels image in GTSDB) to the small dimensions of 416 × 416 pixels, makes small objects such as traffic signs very tiny as shown in Figure 5. This results in the loss of discriminative features, hence, it becomes difficult for the trained network to detect such minute objects.
To cope with this, we propose to break the input image into patches. Splitting the image in patches was also proposed in [28], which helped to speed up the detection process in terms of FPS. This technique was also used in [29] to detect vanishing points, yielding six times speed up the detection process and increased detection accuracy by 5.6%. In our proposed method, the patch-wise input strategy solved the problem of disappearing small objects while retaining the essence of the road scenario. This prevents smaller object features from being lost due to image resizing and helps in improving the detection speed.
The network was trained with patches of training images of size varying from 400 × 400 pixels to 800 × 800 pixels. These patches are obtained from the bounding box annotations. The dimensions acquired from the annotation were extended 400 pixels in all four directions. A maximum limit constraint was applied in some cases when this extension exceeded original image dimensions. After the patch extraction, the annotations were re-calculated and saved in a .CSV file.
As an example, consider an image of size 1360 × 800 pixels image shown in Figure 6a, it has one traffic sign with bounding box annotations [763, 426, 812, 473]. Its extended coordinates will be [363, 26, 1212, 873]. All of the coordinates are within dimension limits of the training image except the last one exceeds 800. Therefore, it is constrained to 800. The patch obtained from the aforementioned image is shown at the bottom of Figure 6a.
Similarly, the test images were forward into the network in the form of patches of size 400 × 400 pixels as illustrated in Figure 6b. A 400 × 400 pixels-sized window slides over the entire image with a stride of 100 pixels. The portion of the image captured in the window is cropped and saved as shown at the bottom of Figure 6b. The window slides to the next position with a stride of 100, as shown by the blue border square image. This image patch-wise cropping continues until the window reaches the right border of the image. A new position was attained in the y-direction with a stride of 100 as shown by the green square in the image. The sliding and cropping continue along the x-axis. This process was repeated until the complete image was covered by the sliding window. These patches were forwarded into the network for detection. Once the detection is complete, the patches were recombined into a single image to re-create the original test image.
The proposed patch-wise training helped in retaining the fine features of traffic signs, which were lost because of the re-sizing of an input image to a lesser number of pixels. The proposed method improved recall percentage by 20% and subsequent detection accuracy by 13% as compared with the default rescaling.

3.3. Focal Loss as Objectiveness Score

YOLOv3 computes four-loss functions namely: object confidence loss, classification loss, bounding box centroid, and width-height loss. Bounding box width-height loss is computed using a mean of square errors between predictions and labels. Other loss functions are computed using Binary Cross-Entropy (BCE) loss. In the proposed network, the loss function for confidence score loss is computed using the focal loss function [10]. Focal loss is considered an effective loss function for the detection of small-sized objects or when there is an imbalance of different class samples. Traffic signs appear smaller than the other objects in an image size of 1360 × 800 . Hence, there exists a great deal of class imbalance among the samples of traffic signs and background objects. Therefore, we conclude that it is appropriate to use the Focal loss function for traffic signs.
Focal loss function in Equation (5) is a modified version of binary cross-entropy loss as shown in Equation (4):
B C E l o s s = log ( p t )
F L = α t ( 1 p t ) γ × ( log ( p t ) )
where α t is hyperparameter and γ is focusing or modulating parameter, the optimal values of which are required to be determined empirically. Lin et al. [10] suggested optimal values for both parameters based on COCO dataset [26]. This dataset contains regular-sized objects with reference to the image, while traffic signs appear much smaller than those objects, the optimal values of 0.25 and 2 for alpha and gamma, respectively, fail. We adopted the experimentation process of [10] and found the optimal value of hyper-parameter alpha for the traffic signs by keeping gamma constant. Then by using each obtained value of alpha, gamma was varied, yielding an optimal gamma value. Hence, experiments prove that for traffic signs, these parameters have an optimal value of 0.75 and 1 for alpha and gamma, respectively, as shown in Figure 7.

4. Experimental Results and Discussion

The proposed approach is implemented using Keras with Tensorflow backend using GitHub repository [30] as a base algorithm. The experiments were performed on Google CoLab, utilizing Tesla T4 GPU with 16 GB memory and 12 GB RAM. The proposed network was evaluated from six different aspects: mAP, precision, recall, false positives, log-average miss rate, and inference time.
The network training process can be divided into two steps; first, the Darknet53 network was fixed and the rest of the network was trained for ten epochs with a batch size of thirty-two keeping the learning rate to 1 × 10 3 . Then after obtaining a stable loss, the complete network was trained for fifty epochs with a batch size of eight, and the learning rate was reduced to 1 × 10 4 . The Adam algorithm is used for loss functions optimization with a learning rate decay of 0.1 per three epochs for constant validation data set loss. Training and testing images were given as patches to the network as discussed in Section 3.2.

4.1. Datasets

The proposed network was trained and tested on two different datasets, namely: German Traffic Sign Detection Benchmark (GTSDB) and Swedish Traffic Sign (STS). GTSDB is a widely used data set, containing 600 training images and 300 testing images of size 1360 × 800 pixels. The size of traffic signs in the images ranges from 16 × 16 pixels to 128 × 128 pixels. While the number of traffic signs in an image varies from 0 to 6. The dataset includes traffic signs of three superclasses: danger, mandatory, and prohibitive.
STS is a more complex and bigger data set than GTSDB, with 20,000 images of size 1280 × 960 pixels, among those 20% are annotated. The size of the traffic sign in an image varies from 12 × 12 pixels to 156 × 156 pixels. The dataset was gathered from Swedish highways and cities road with a 1.6-megapixel camera. The dataset can be divided into three superclasses: danger, mandatory, and prohibitive. In experiments, Part0 of Set1 is used as a training set and Part0 of Set2 is used as the test set, considering only visible traffic signs.

4.2. Regressive Anchor Box Selection

Experiments were performed on the default YOLOv3 network and the proposed tweaked YOLOv3 network with two sets of anchor boxes. The first set was obtained from the default YOLOv3 anchor box selection algorithm. And the second set was obtained from the proposed regressive anchor box selection algorithm for the GTSDB dataset. Both sets of anchor boxes were tested on the default and the proposed YOLOv3 network. Here by default YOLOv3 network, we mean the default method of image resizing, and the proposed YOLOv3 network includes pruned network with patch-wise technique. The comparative results are depicted in Table 1. Results show that for the proposed Regressive algorithm the recall percentage and AUC have improved, and the proposed tweaked network model helps in obtaining near to 100% recall percentage for the tuned network as shown in Table 1.

4.3. Updating Network Layers

Experiments were performed on the YOLOv3 network using GTSDB dataset for finding the optimal number of layers for traffic sign detection. The effect of removing redundant DBL layers in the network is illustrated in Figure 8, in terms of Mean Average Precision (MAP) and Average Precision for each category. The results follow a Gaussian trajectory; where mAP for the network improves with a reduction of DBL layers and reaches a maximum value of 93.09%, then moving further there is a drop in mAP values. The updated network was evaluated on STS Dataset, resulting 5% rise in mAP than the original model as shown in Figure 8. Figure 9 and Figure 10 illustrate Precision-recall curves of the original and proposed YOLOv3 algorithm for all three classes of GTSDB and STS Dataset, respectively. Here by original YOLOv3 algorithm, we mean default method of image resizing and proposed algorithm includes pruned network with patch-wise technique. For this experiment, regression anchor boxes are used.
Training the network with image patches helped to achieve better mAP and inference time. Resizing a 1360 × 800 image to 416 × 416 pixels can vanish the pixels of a traffic sign. The effect of the proposed training method on the network accuracy (mAP) and inference time is illustrated in Figure 11. The experiments were performed using the proposed training technique and the results in terms of mAP and inference time were compared with the default YOLOv3 network. The proposed approach is 7.5 times faster in detection speed than the generalized rescaling method often used by the default YOLOv3 method.
Table 2 compares the Average Precision results of different state-of-the-art methods for the GTSDB dataset. Among all, our method outperforms in terms of accuracy and inference time. Our proposed network model can detect even the blurred sign beside the visible ones. It also successfully detected small size traffic signs from the test images. Figure 12 and Figure 13 shows some qualitative detection result samples from STS and GTSDB dataset, respectively.

4.4. Focal loss Implementation

Focal loss is a modified version of Cross-Entropy (CE) loss. It is widely used in object classification problems. CE loss can be used for n number of object classes. For n = 2 , CE loss is named as Binary Cross-Entropy (BCE) loss, comprising of only two labels for the two object classes. In addition, a network’s accuracy can also be determined by the Log-Average Miss Rate (LAMR) evaluation metrics. It is computed by averaging the miss rate on the false positive per image (FPPI) ranging from 10 2 to 10 0 .
Experiments prove that the optimal values of alpha and gamma suggested in [10] for object detection do not remain valid for the Traffic sign dataset. Table 3 states average precision values for different values of gamma and alpha. For CE loss ( γ = 0), it failed quickly since the network was diverging during training, even for the range 0 < γ < 1. Hence, γ was initiated to 1 to find an optimal value for α . The optimal values of α range from 0.5 to 0.75 for the traffic sign dataset as deduced from Table 3. The maximum achieved mAP for α = 0.75, when γ = 1, with 0.01 mean LAMR of all three super-classes, while for α = 0.5 there is a slight decrease in mAP by 0.71% with mean LAMR of 0.04.
While keeping alpha constant and increasing the value of hyper-parameter gamma, the mAP decreases as shown in Table 3; hence it can be stated that for traffic sign dataset 0.75 and 1 are optimal values of hyper-parameters alpha and gamma, respectively. By using the obtained hyper-parameter values of alpha and gamma, the network accuracy declined by 0.68%. Therefore, we concluded that the proposed tweaked network with regressive anchor box selection technique outperforms the focal loss adjusted network in the small size traffic sign detection.

5. Conclusions

This paper addresses the problem of an accurate and real-time traffic sign recognition system. We propose a regressive anchor box selection algorithm that suggests the best-fit anchor set obtained majorly from the higher concentration traffic sign regions of the dataset. The obtained anchors improve precision-recall percentage and thus mean Average Precision of the network. Furthermore, we propose a modified YOLOv3 network, which is faster and more accurate than the state-of-the-art methods. The pruning of higher-level feature map benefits include reducing false positives and lowering log-average miss rate. The proposed network and approach for anchor box determination aids in obtaining a decent balance between accuracy and inference time.
Although focal loss adjustments help in detecting smaller objects in an image, they do not work for our modified network. Our proposed network is robust enough to detect small traffic signs without focal loss adjustment implementation. It also discovered that the optimal values of alpha and gamma for the traffic sign dataset are 0.75 and 1, respectively. The proposed method is evaluated on GTSDB [3] and STS [9] datasets. Experiments show that the proposed method is more real-time, accurate, robust, and competitive than the state-of-the-art methods.

Author Contributions

Conceptualization, Y.R., H.A., D.M.S.B. and W.T.T.; Data curation, Y.R., H.A., D.M.S.B. and W.T.T.; Formal analysis, Y.R., H.A., D.M.S.B., W.T.T. and M.M.; Funding acquisition, M.A. and M.M.; Investigation, Y.R., H.A., D.M.S.B. and W.T.T.; Methodology, Y.R., H.A., D.M.S.B. and W.T.T.; Project administration, M.M.; Supervision, M.A.; Validation, Y.R., H.A., D.M.S.B. and M.A.; Visualization, Y.R., H.A., D.M.S.B., M.A. and M.M.; Writing—original draft, Y.R., H.A., D.M.S.B., W.T.T. and M.M.; Writing—review & editing, W.T.T., M.A. and M.M. All authors have read and agreed to the published version of the manuscript.

Funding

This research has been financially supported by The Analytical Center for the Government of the Russian Federation (Agreement No. 70-2021-00143 dd. 01.11.2021, IGK 000000D730321P5Q0002). This work was also supported by the Higher Education Commission of Pakistan under the National Research Program for Universities grant number 8348.

Institutional Review Board Statement

Not applicable.

Informed Consent Statement

Not applicable.

Data Availability Statement

This research has been conducted on publicly available datasets, namely German Traffic Sign dataset and Swedish Traffic Sign dataset, which can be accessed using following links: http://benchmark.ini.rub.de/?section=gtsdb&subsection=dataset and https://www.cvl.isy.liu.se/research/datasets/traffic-signs-dataset/, respectively.

Conflicts of Interest

The authors declare no conflict of interest.

Abbreviations

The following abbreviations are used in this manuscript:
BCEBinary cross entropy
lamrlog-average miss rate
mAPmean Average Precision
FPPIFalse Positive Per Image

References

  1. Serna, C.; Ruicheck, Y. Traffic signs detection and classification for European urban environments. IEEE Trans. Intell. Transp. Syst. 2020, 21, 4388–4399. [Google Scholar] [CrossRef]
  2. Gupta, A.; Choudhary, A. A Framework for Real-time Traffic Sign Detection and Recognition using Grassmann Manifolds. In Proceedings of the ITSC 2018: International Conference on Intelligent Transportation Systems, Maui, HI, USA, 4 November 2018. [Google Scholar]
  3. The German Traffic Sign Detection Benchmark. Available online: http://benchmark.ini.rub.de/?section=gtsdb&subsection=dataset (accessed on 9 July 2020).
  4. Girshick, R. Fast r-cnn. In Proceedings of the IEEE International Conference on Computer Vision (ICCV), Santiago, Chile, 7–13 December 2015; pp. 1440–1448. [Google Scholar]
  5. Ren, S.; He, K.; Girshick, R. Faster R-CNN: Towards real-time object detection with region proposal networks. IEEE Trans. Pattern Anal. Mach. Intell. 2017, 39, 1137–1149. [Google Scholar] [CrossRef] [PubMed] [Green Version]
  6. He, K.; Gkioxari, G.; Girshick, R. Mask R-CNN. In Proceedings of the IEEE International Conference on Computer Vision (ICCV), Venice, Italy, 22–29 October 2017; pp. 2961–2969. [Google Scholar]
  7. Liu, W.; Anguelov, D.; Erhan, D. SSD: Single shot multibox detector. In Proceedings of the IEEE International Conference on Computer Vision (ICCV), Amsterdam, The Netherlands, 11–14 October 2016; pp. 21–37. [Google Scholar]
  8. Redmon, J.; Divvala, S.; Girshick, R. You only look once: Unified, real time object detection. In Proceedings of the IEEE Computer Society Conference on Computer Vision and Pattern Recognition, Las Vegas, NV, USA, 18–20 June 2016; pp. 779–788. [Google Scholar]
  9. Swedish Traffic Signs Dataset. Available online: https://www.cvl.isy.liu.se/research/datasets/traffic-signs-dataset/ (accessed on 27 December 2020).
  10. Tsung-Yi, L.; Goyal, P.; Girshick, R. Focal loss for dense object detection. In Proceedings of the IEEE International Conference on Computer Vision (ICCV), Venice, Italy, 22–29 October 2017; pp. 2980–2988. [Google Scholar]
  11. Khalid, S.; Muhammad, N.; Sharif, M. An automatic measurement of the traffic sign with digital segmentation and recognition. Inst. Eng. Technol. 2019, 13, 269–279. [Google Scholar] [CrossRef]
  12. Yang, Y.; Luo, H.; Xu, H. Towards real time traffic sign detection and classification. IEEE Trans. Intell. Transp. Syst. 2016, 17, 2022–2031. [Google Scholar] [CrossRef]
  13. Ohta, Y.; Kanade, T.; Sakae, T. Color information for region segmentation. Comput. Graph. Image Process. 1980, 13, 222–241. [Google Scholar] [CrossRef]
  14. Gonzalez, A.; Garrido, M.; Fernandez, D. Automatic Traffic Signs and Panels Inspection System Using Computer Vision. IEEE Trans. Intell. Transp. Syst. 2011, 12, 485–499. [Google Scholar] [CrossRef]
  15. Barnes, N.; Zelinsky, A.; Fletcher, L. Real-time speed sign detection using radial symmetry detector. IEEE Trans. Intell. Transp. Syst. 2008, 9, 322–332. [Google Scholar] [CrossRef]
  16. Yuan, Y.; Xiong, Z.; Wang, Q. An incremental framework for video-based traffic sign detection, tracking, and recognition. IEEE Trans. Intell. Transp. Syst. 2017, 18, 1918–1929. [Google Scholar] [CrossRef]
  17. Luo, H.; Yang, Y.; Tong, B. Traffic sign recognition using a multi-task convolutional neural network. IEEE Trans. Intell. Transp. Syst. 2018, 19, 110–1111. [Google Scholar] [CrossRef]
  18. Donoser, M.; Bischof, H. Efficient Maximally Stable Extremal Region (MSER) Tracking. In Proceedings of the IEEE Computer Society Conference on Computer Vision and Pattern Recognition, New York, NY, USA, 17–22 June 2006. [Google Scholar]
  19. Li, J.; Wang, Z. Real time traffic sign recognition based on efficient CNNs in the wild. IEEE Trans. Intell. Transp. Syst. 2019, 20, 975–984. [Google Scholar] [CrossRef]
  20. Lee, H.; Kim, K. Simultaneous traffic sign detection and boundary estimation using convolutional neural network. IEEE Trans. Intell. Transp. Syst. 2018, 19, 1652–1663. [Google Scholar] [CrossRef] [Green Version]
  21. Chen, E.; Rothing, P.; Zeisler, J. Investigating low level features in CNN for traffic sign detection and recognition. In Proceedings of the 2019 IEEE Intelligent Transportation Systems Conference, ITSC 2019, Auckland, New Zealand, 27–30 October 2019. [Google Scholar]
  22. Lin, T.; Dollar, P.; Girshick, R. Feature Pyramid Networks for Object Detection. In Proceedings of the Conference on Computer Vision and Pattern Recognition (CVPR), Honolulu, HI, USA, 21–26 July 2017. [Google Scholar]
  23. Choi, J.; Chun, D.; Kim, H. Gaussian YOLOv3: An accurate and fast object detector using localization uncertainty for autonomous driving. In Proceedings of the IEEE International Conference on Computer Vision (ICCV), Seoul, Korea, 27–28 October 2019. [Google Scholar]
  24. Doval, G.; Al-Kaff, A.; Beltran, J. Traffic sign detection and 3D localization via deep convolutional neural networks and stereo vision. In Proceedings of the 2019 IEEE Intelligent Transportation Systems Conference, ITSC 2019, Auckland, New Zealand, 27–30 October 2019. [Google Scholar]
  25. Github Repository for LSI Traffic Sign Detection Dataset. Available online: https://github.com/lsi-uc3m/lsitsd (accessed on 1 November 2020).
  26. Common Objects in Context Dataset. Available online: https://cocodataset.org/#download (accessed on 27 December 2020).
  27. Redmon, J.; Farhadi, A. YOLOv3: An incremental improvement. arXiv 2018, arXiv:1804.02767. [Google Scholar]
  28. Rehman, Y.; Ahmed Khan, J.; Shin, H. Efficient coarser-to-fine holistic traffic sign detection for occlusion handling. IET Image Process. 2018, 12, 2229–2237. [Google Scholar] [CrossRef]
  29. Fan, X.; Riaz, I.; Rehman, Y.; Shin, H. Vanishing point detection using random forest and patch-wise weighted soft voting. IET Image Process. 2016, 10, 900–907. [Google Scholar] [CrossRef]
  30. Github Repository for Train Your Own YOLO. Available online: https://github.com/AntonMu/TrainYourOwnYOLO (accessed on 17 October 2020).
Figure 1. Proposed block diagram for small objects (traffic signs) in an image. The dotted rectangle is the proposed technique and the shaded blue blocks are proposed modifications.
Applsci 11 11555 g001
Figure 2. Distribution of traffic sign Bounding Boxes dimension with fitted cost function on the training set of GTSDB (a) Distribution of X Bounding Box dimension with fitted cost function (b) Distribution of Y Bounding Box dimension with fitted cost function.
Applsci 11 11555 g002
Figure 3. Regression models for finding the anchor boxes. (a) regressive model predictions for anchors when omega is 4 (b) regressive model predictions for anchors when omega is 7 (c) regressive model predictions for anchor when omega is 9 (d) regressive model predictions for anchors when omega is 11 (Omega represents number of elements per cluster).
Applsci 11 11555 g003
Figure 4. Network models (a) original YOLOv3 network (b) tweaked YOLOv3 network – modifications are highlighted with blue dotted squares.
Applsci 11 11555 g004
Figure 5. Effect of larger image resizing on traffic sign features.
Applsci 11 11555 g005
Figure 6. Patch-wise detection strategy (a) train image patch (b) test image patches.
Applsci 11 11555 g006
Figure 7. Effect of varying alpha and gamma on mAP (a) when gamma is set to 1 and alpha is varied (b) when gamma is varied keeping optimal value of alpha equal 0.75 constant.
Applsci 11 11555 g007
Figure 8. (a): Effect of network layers on Average Precision for GTSDB dataset. (b): Effect of layers pruning on Average Precision and mean Average Precision for STS dataset.
Applsci 11 11555 g008
Figure 9. Precision-recall curves of STS dataset for Original and proposed YOLOv3 network (a) Danger class (b) Mandatory class (c) Prohibitory class.
Applsci 11 11555 g009
Figure 10. Precision-recall curves of GTSDB dataset for Original and proposed YOLOv3 network (a) Danger class (b) Mandatory class (c) Prohibitory class.
Applsci 11 11555 g010
Figure 11. Effect of training technique on mAP and inference time for GTSDB dataset.
Applsci 11 11555 g011
Figure 12. Detection results on STS Dataset (a) traffic sign recognition in different illumination conditions, (b) Small size traffic sign recognition, (c) A partial view traffic sign recognition, (d) Variable size Traffic Signs in an image.
Applsci 11 11555 g012
Figure 13. Detection results on GTSDB dataset; (ac) Small size traffic sign recognition, (d) Blurred traffic sign recognition.
Applsci 11 11555 g013
Table 1. Comparison of anchor box algorithms and YOLOv3 network model.
Anchor Box Selection AlgorithmEvaluation MetricDefault YOLOv3 NetworkProposed YOLOv3 Network
Default-KmeansRecall percentage77.23%96.83%
AUC75.57%91.82%
Ours-RegressiveRecall percentage85.32%98.13%
AUC78.34%93.09%
Table 2. Comparison with state-of-the-art methods for GTSDB dataset.
MethodsmAPInference Time
SSD + FPN + ITA [20]80.30%-
Faster RCNN-Mobilenets [19]84.50%0.13 s
Mask RCNN [1]96.16%0.32 s
Ours93.09%0.04 s
Table 3. mAP results for focal loss implementation on GTSDB dataset. Top result in each class are highlighted in bold.
GammaAlphaDangerMandatoryProhibitorymAPMean Lamr
00.25, 0.50, 0.75-----
1.00.2597.92%57.92%95.20%83.68%0.16
1.00.5097.61%97.61%93.62%91.70%0.04
1.00.7598.30%85.01%93.92%92.41%0.01
1.00.8091.17%82.55%95.77%89.83%0.07
1.00.8597.82%73.21%95.50%88.84%0.16
1.00.9990.00%74.22%94.70%86.31%0.09
1.20.7596.75%70.95%91.45%86.38%0.05
1.50.7593.63%85.52%94.96%91.37%0.04
Ours94.49%90.06%94.72%93.09%0.11
Publisher’s Note: MDPI stays neutral with regard to jurisdictional claims in published maps and institutional affiliations.

