
Statistical Modeling for PM10, PM2.5 and PM1 at Gangneung Affected by Local Meteorological Variables and PM10 and PM2.5 at Beijing for Non- and Dust Periods


Abstract
:1. Introduction
2. Study Area and Data Analysis
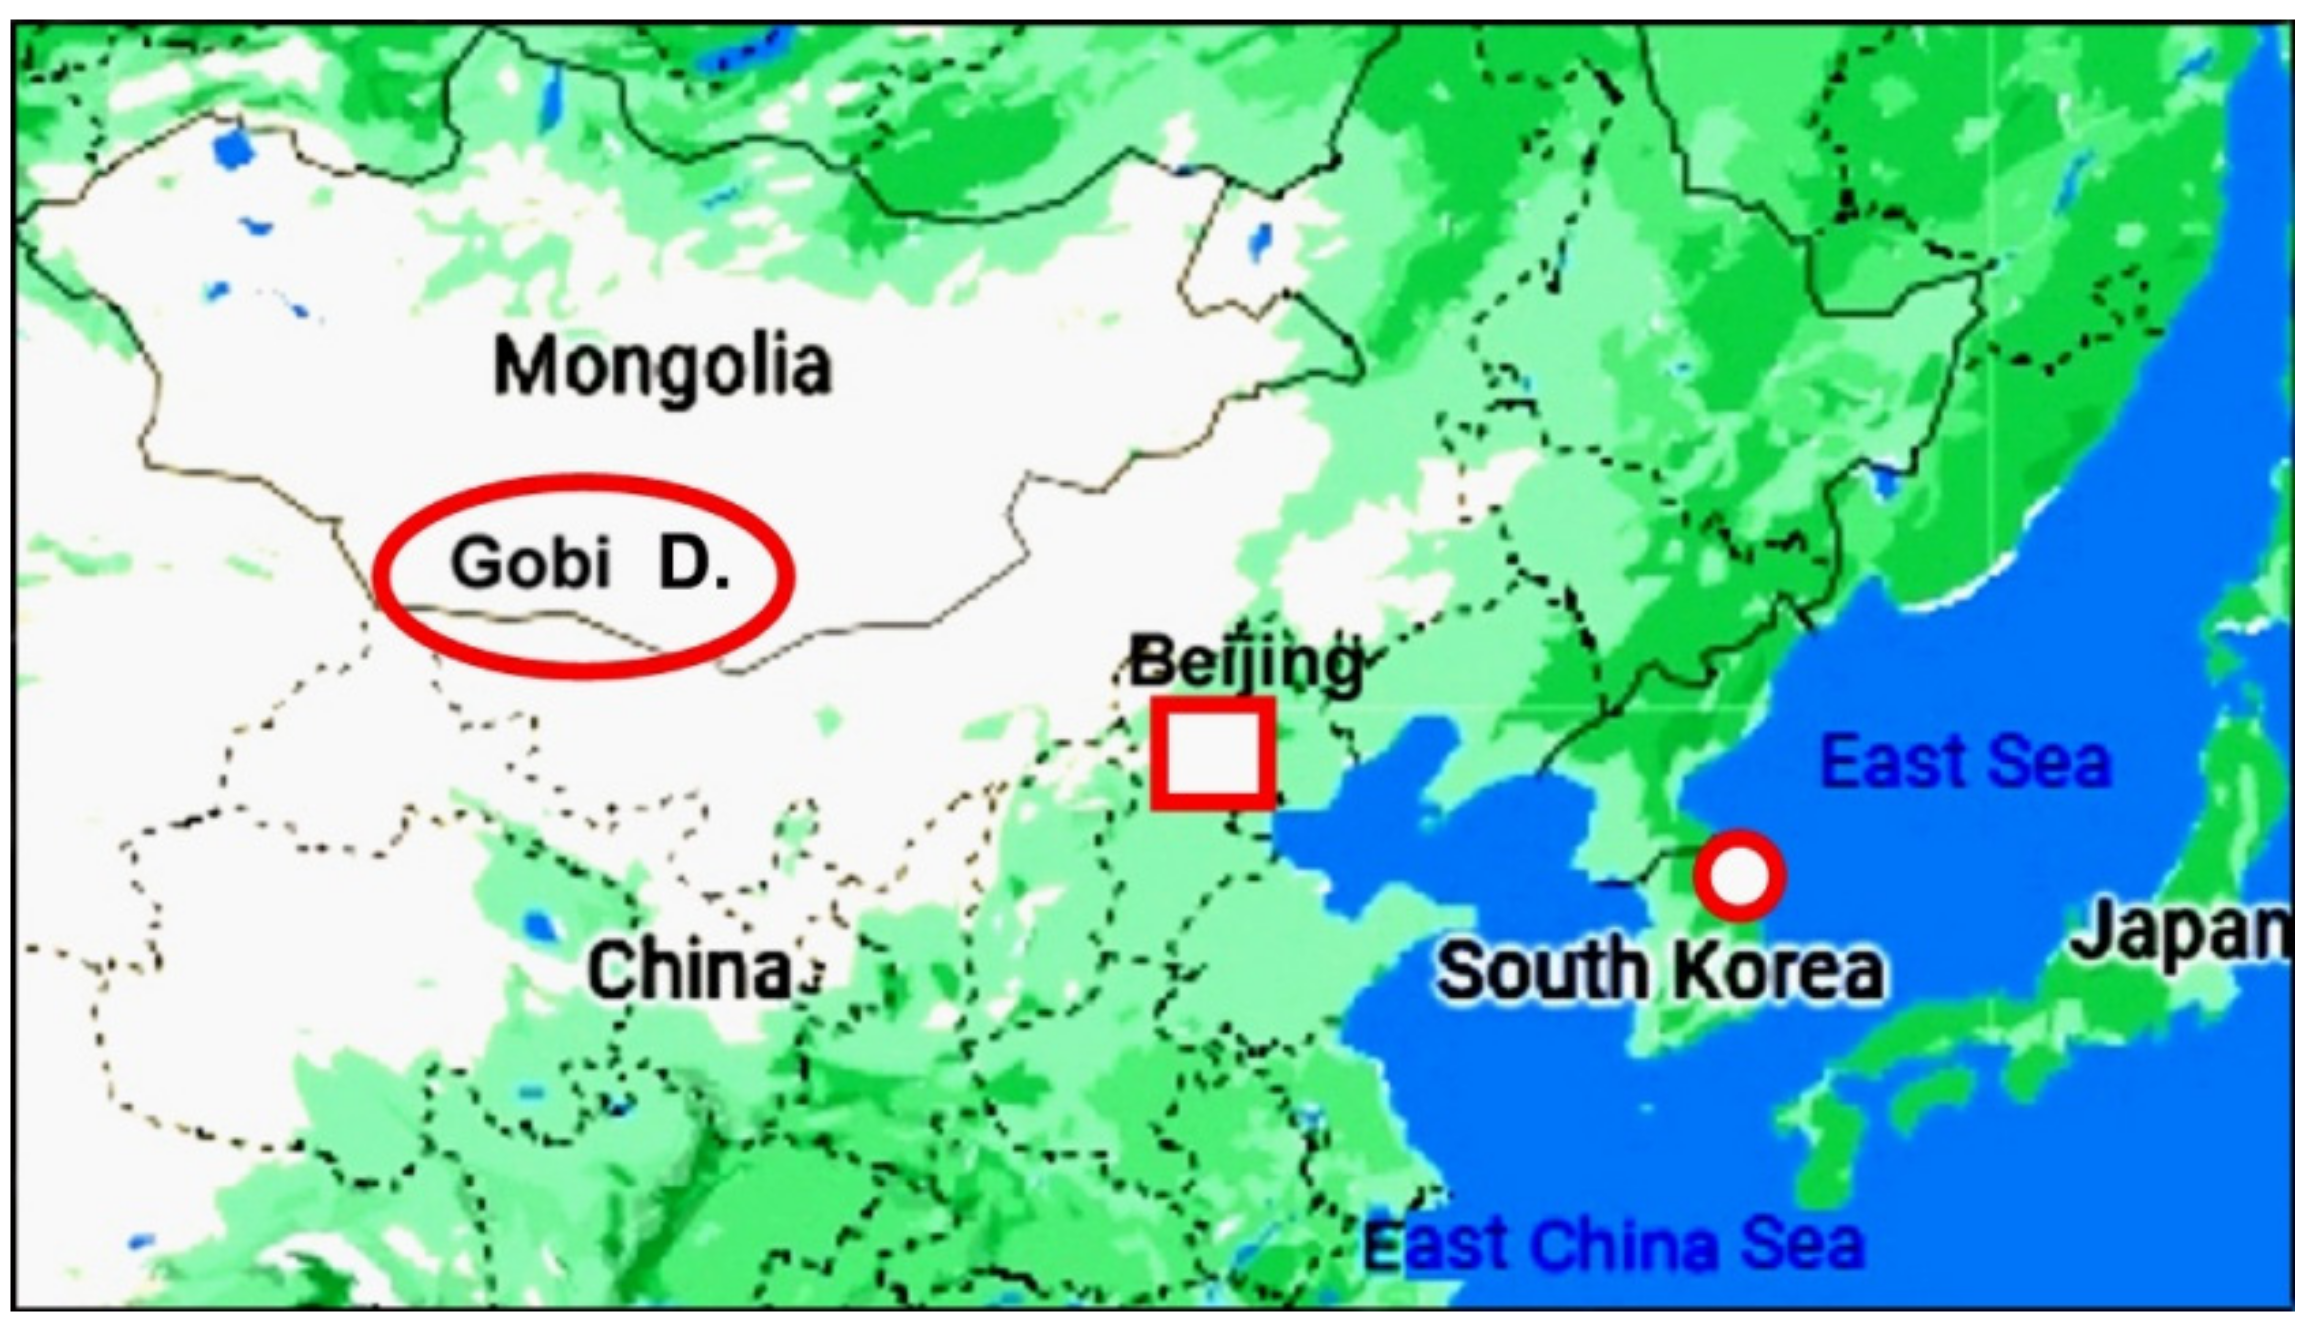
2.1. Study Area
2.2. Data and Analysis
3. Results and Discussion
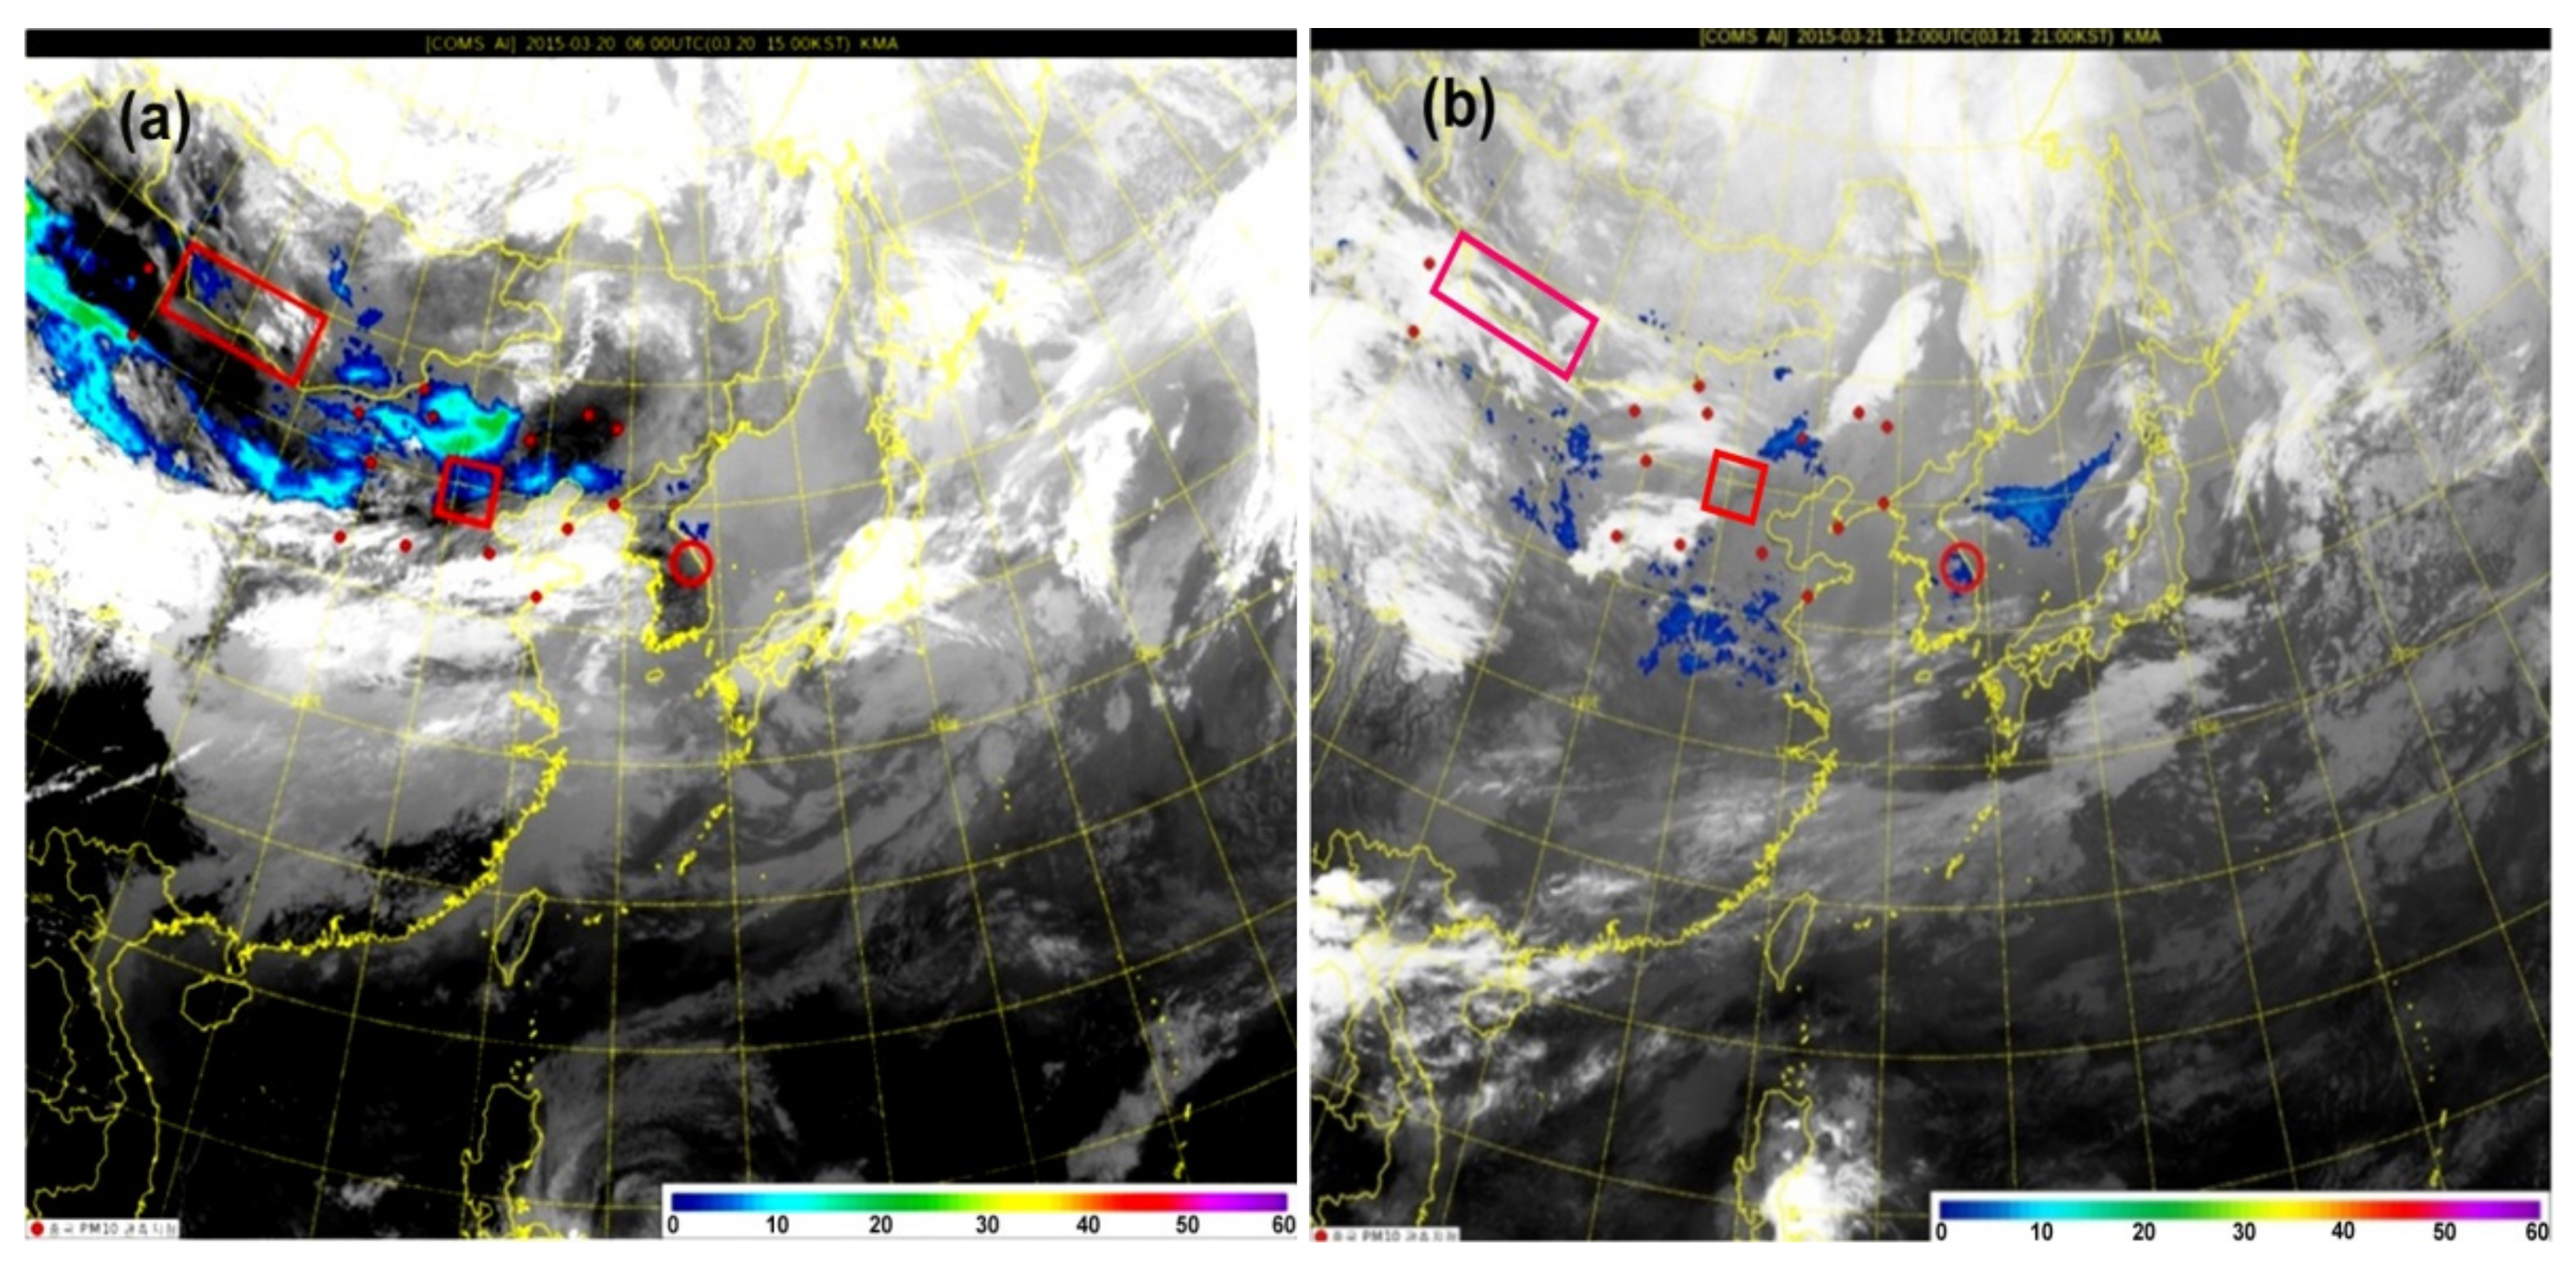
3.1. Satellite Images of Yellow Dust Transport
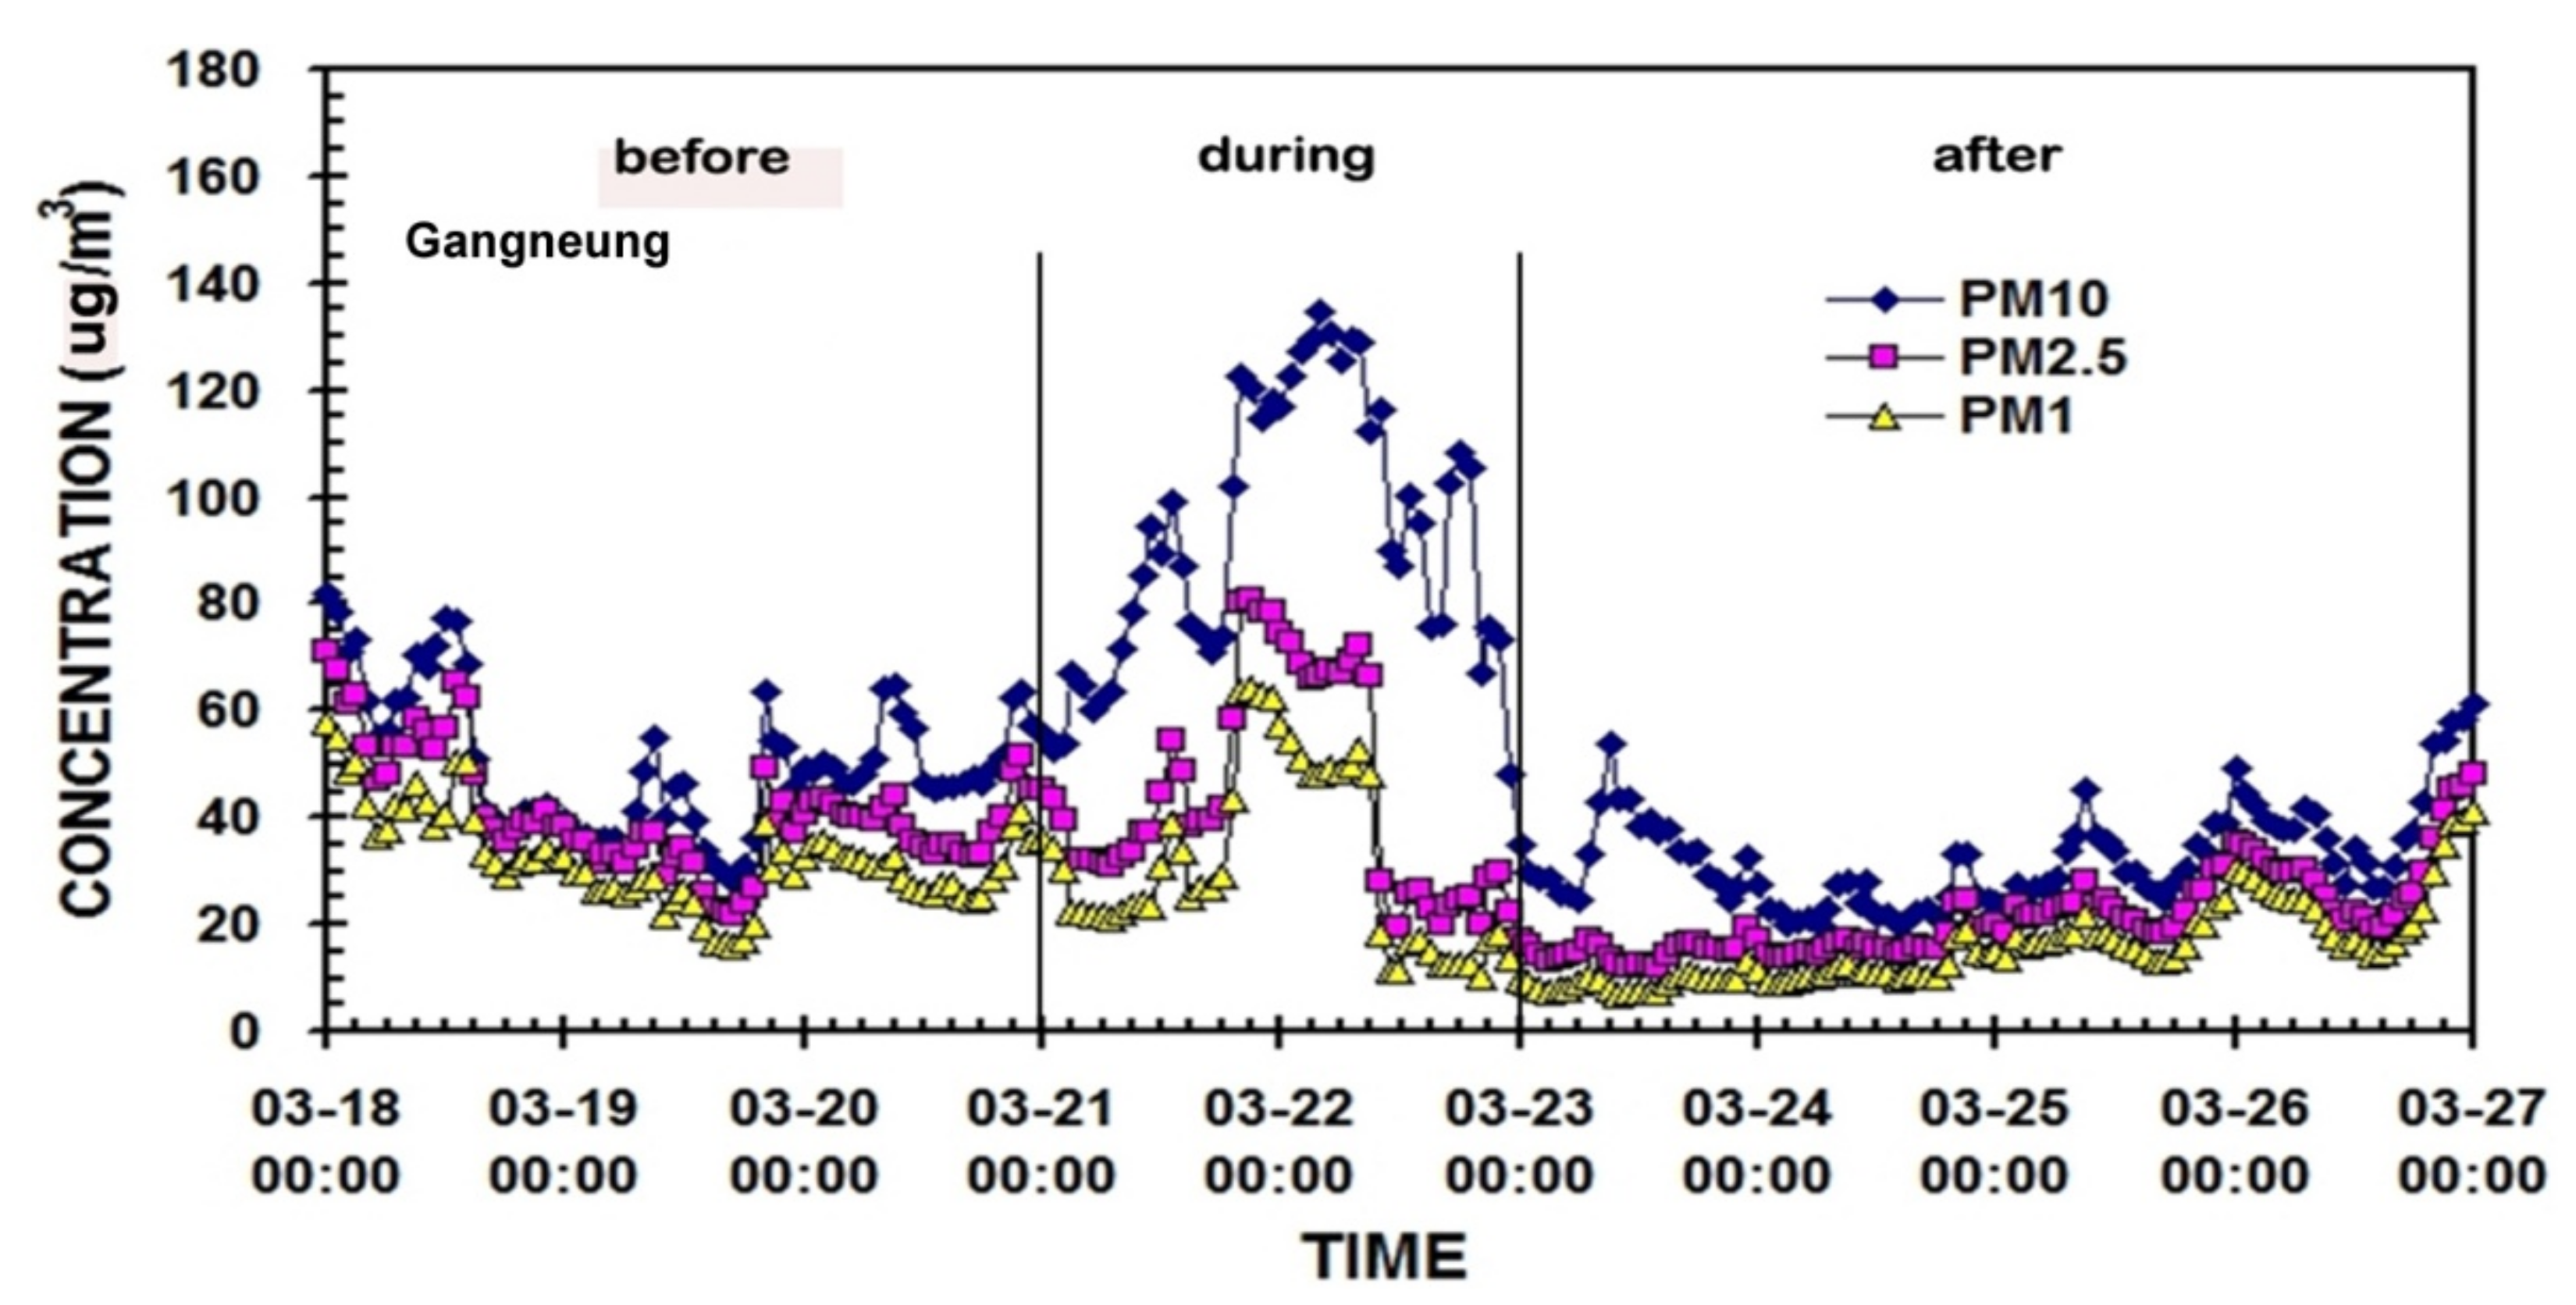
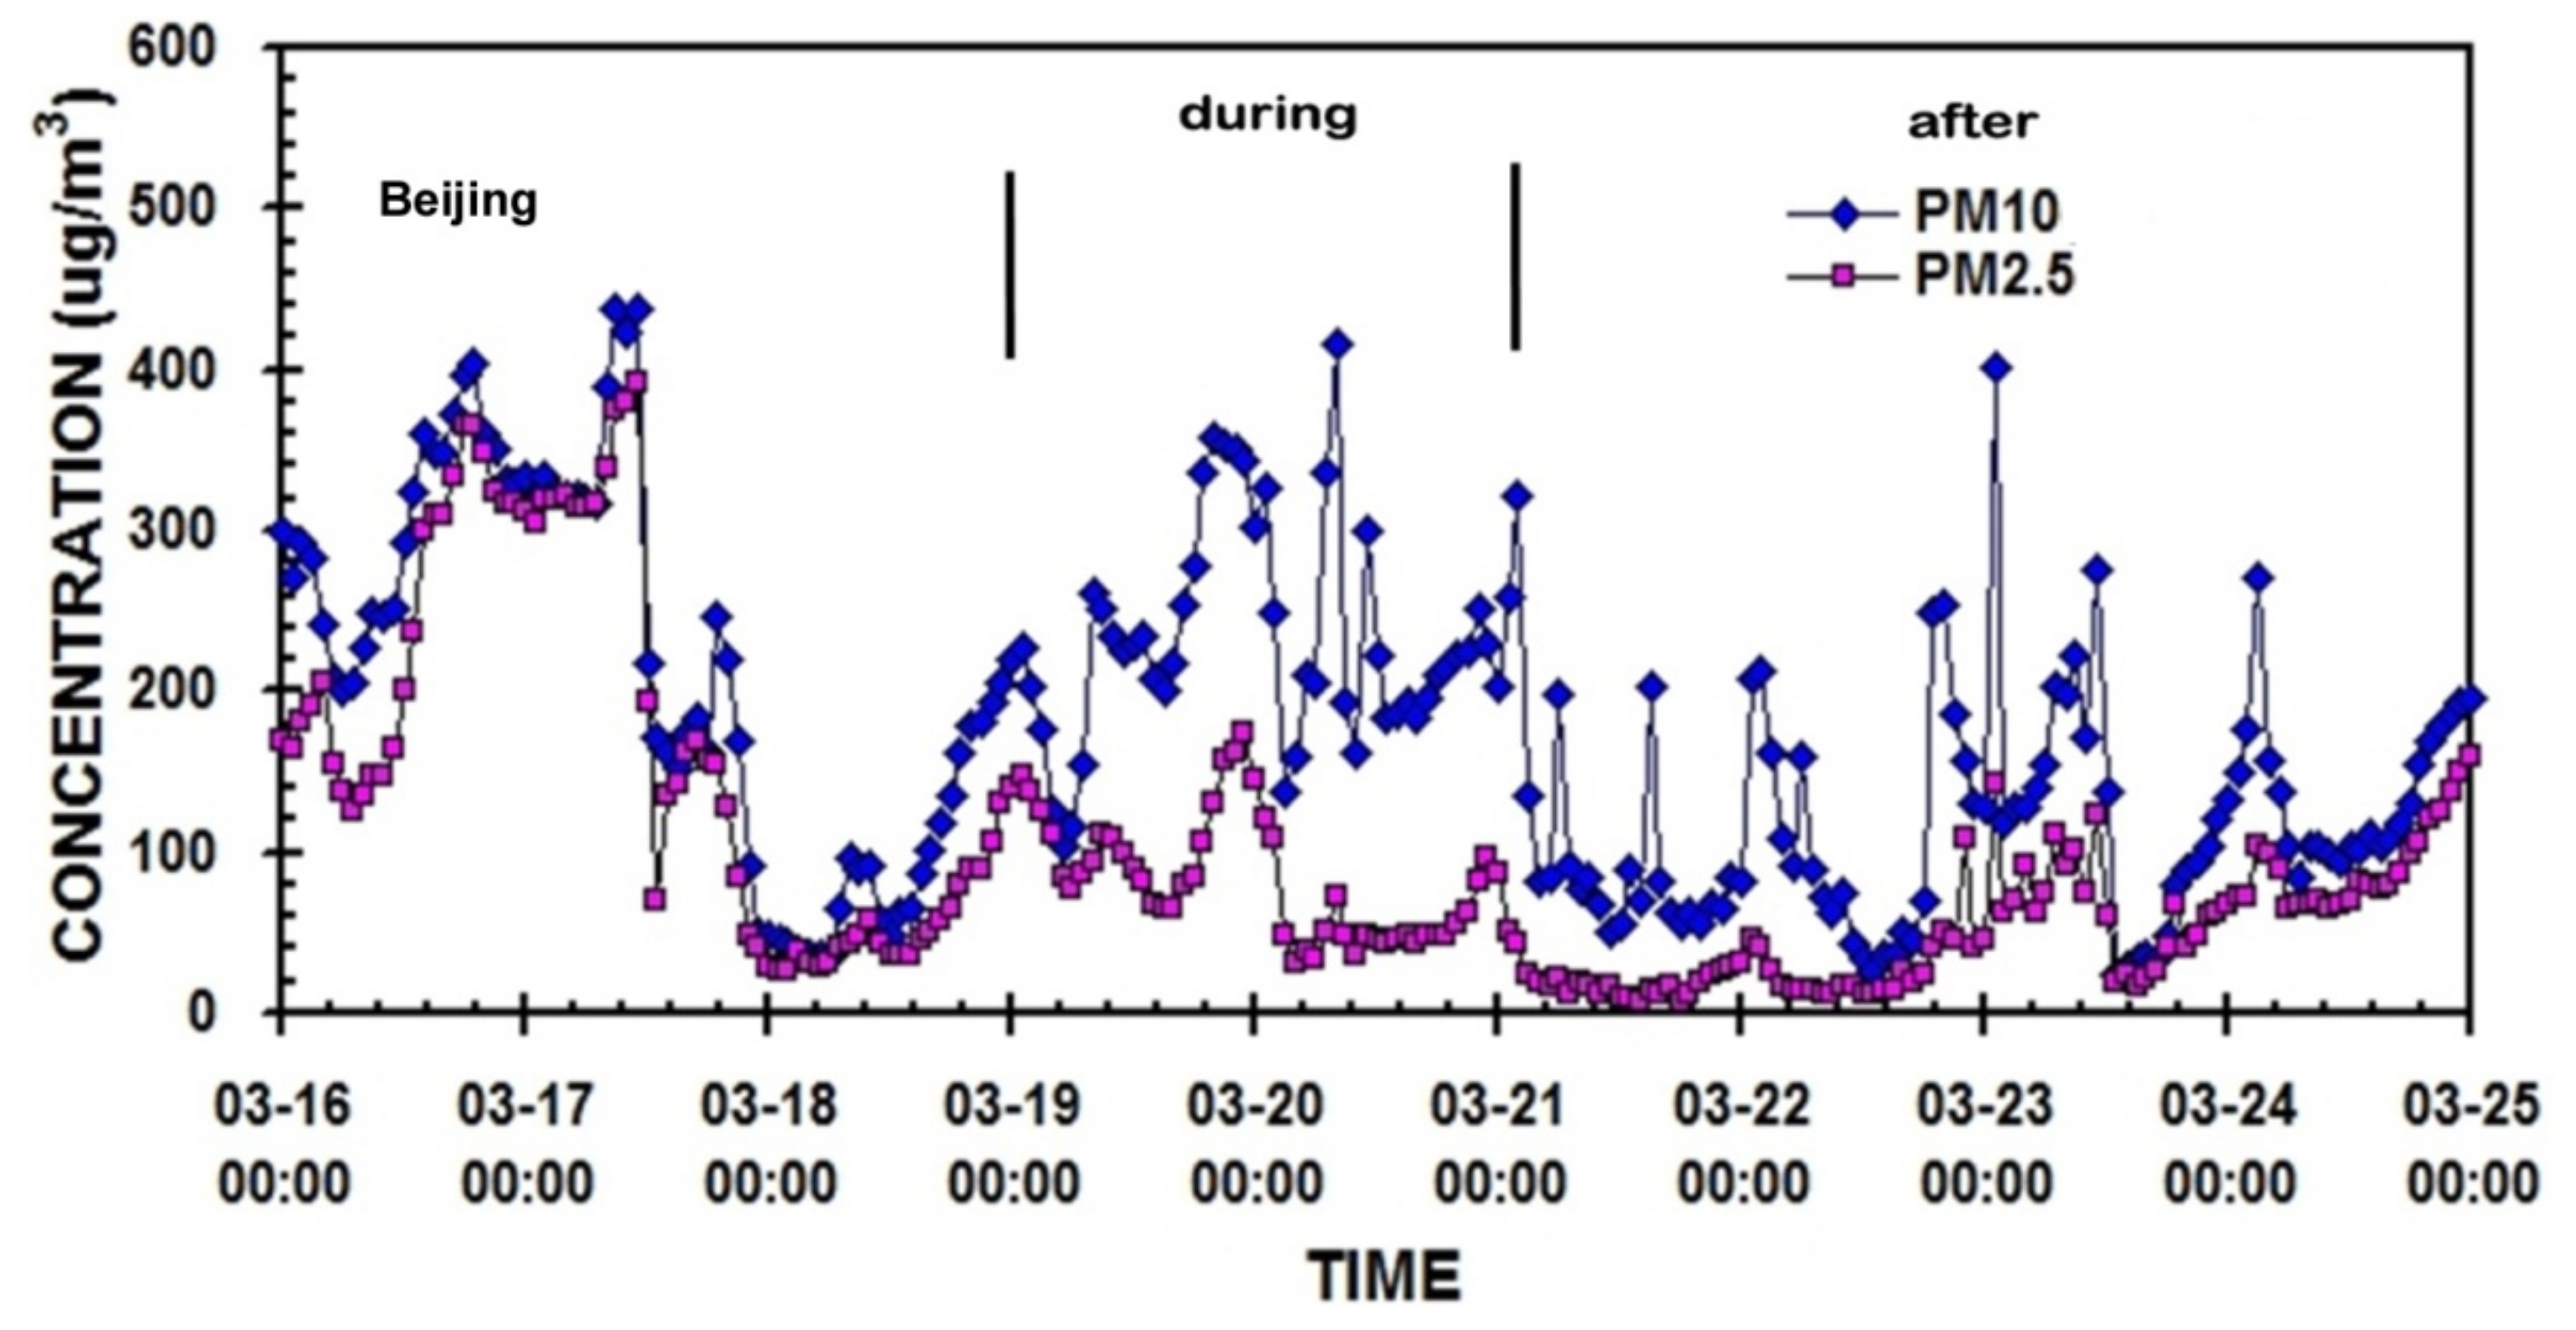
3.2. Hourly PM10, PM2.5 and PM1 Concentrations before, during and after the Dust Periods
3.3. Correlation Matrix and Predictive Regression Equations among PM10, PM2.5 and PM1 (Gangneung) Associated with PM10 and PM2.5 (Beijing)
3.4. Partial Correlation Matrix among PMs of Gangneung (G) and PMs of Beijing (B)
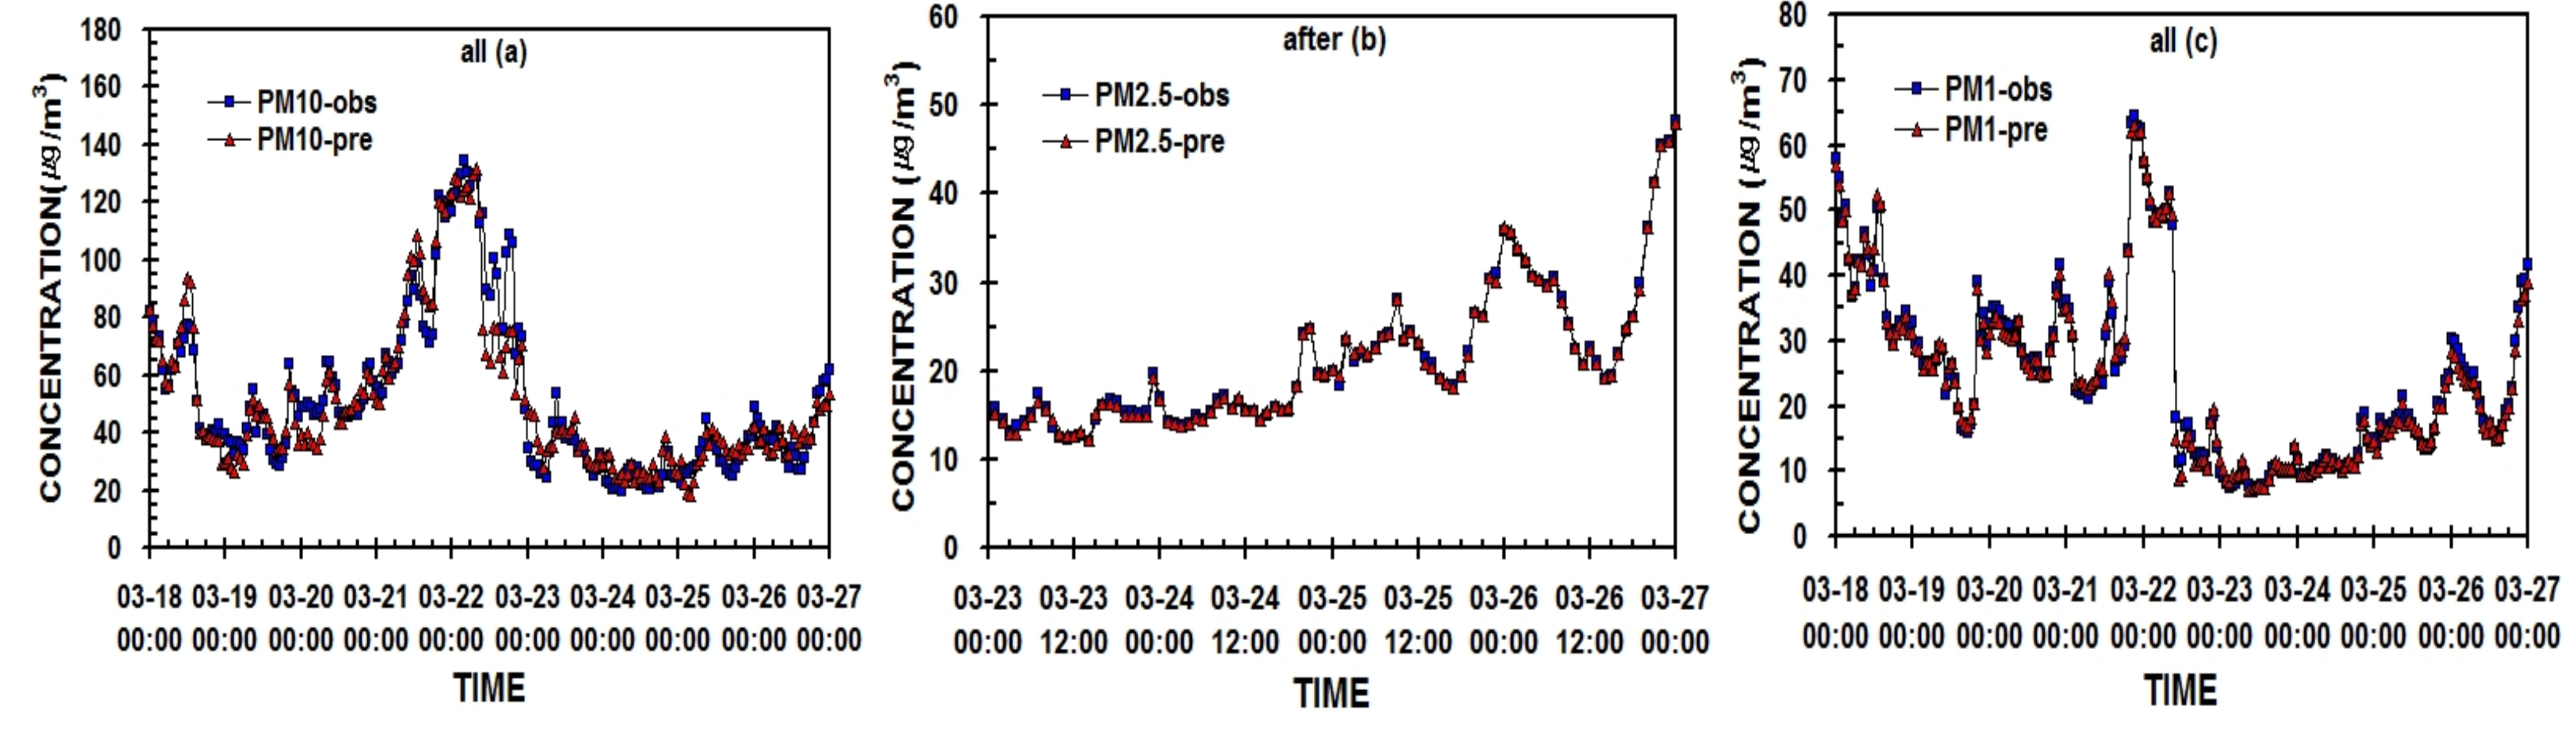
3.5. Validation of Models
4. Conclusions
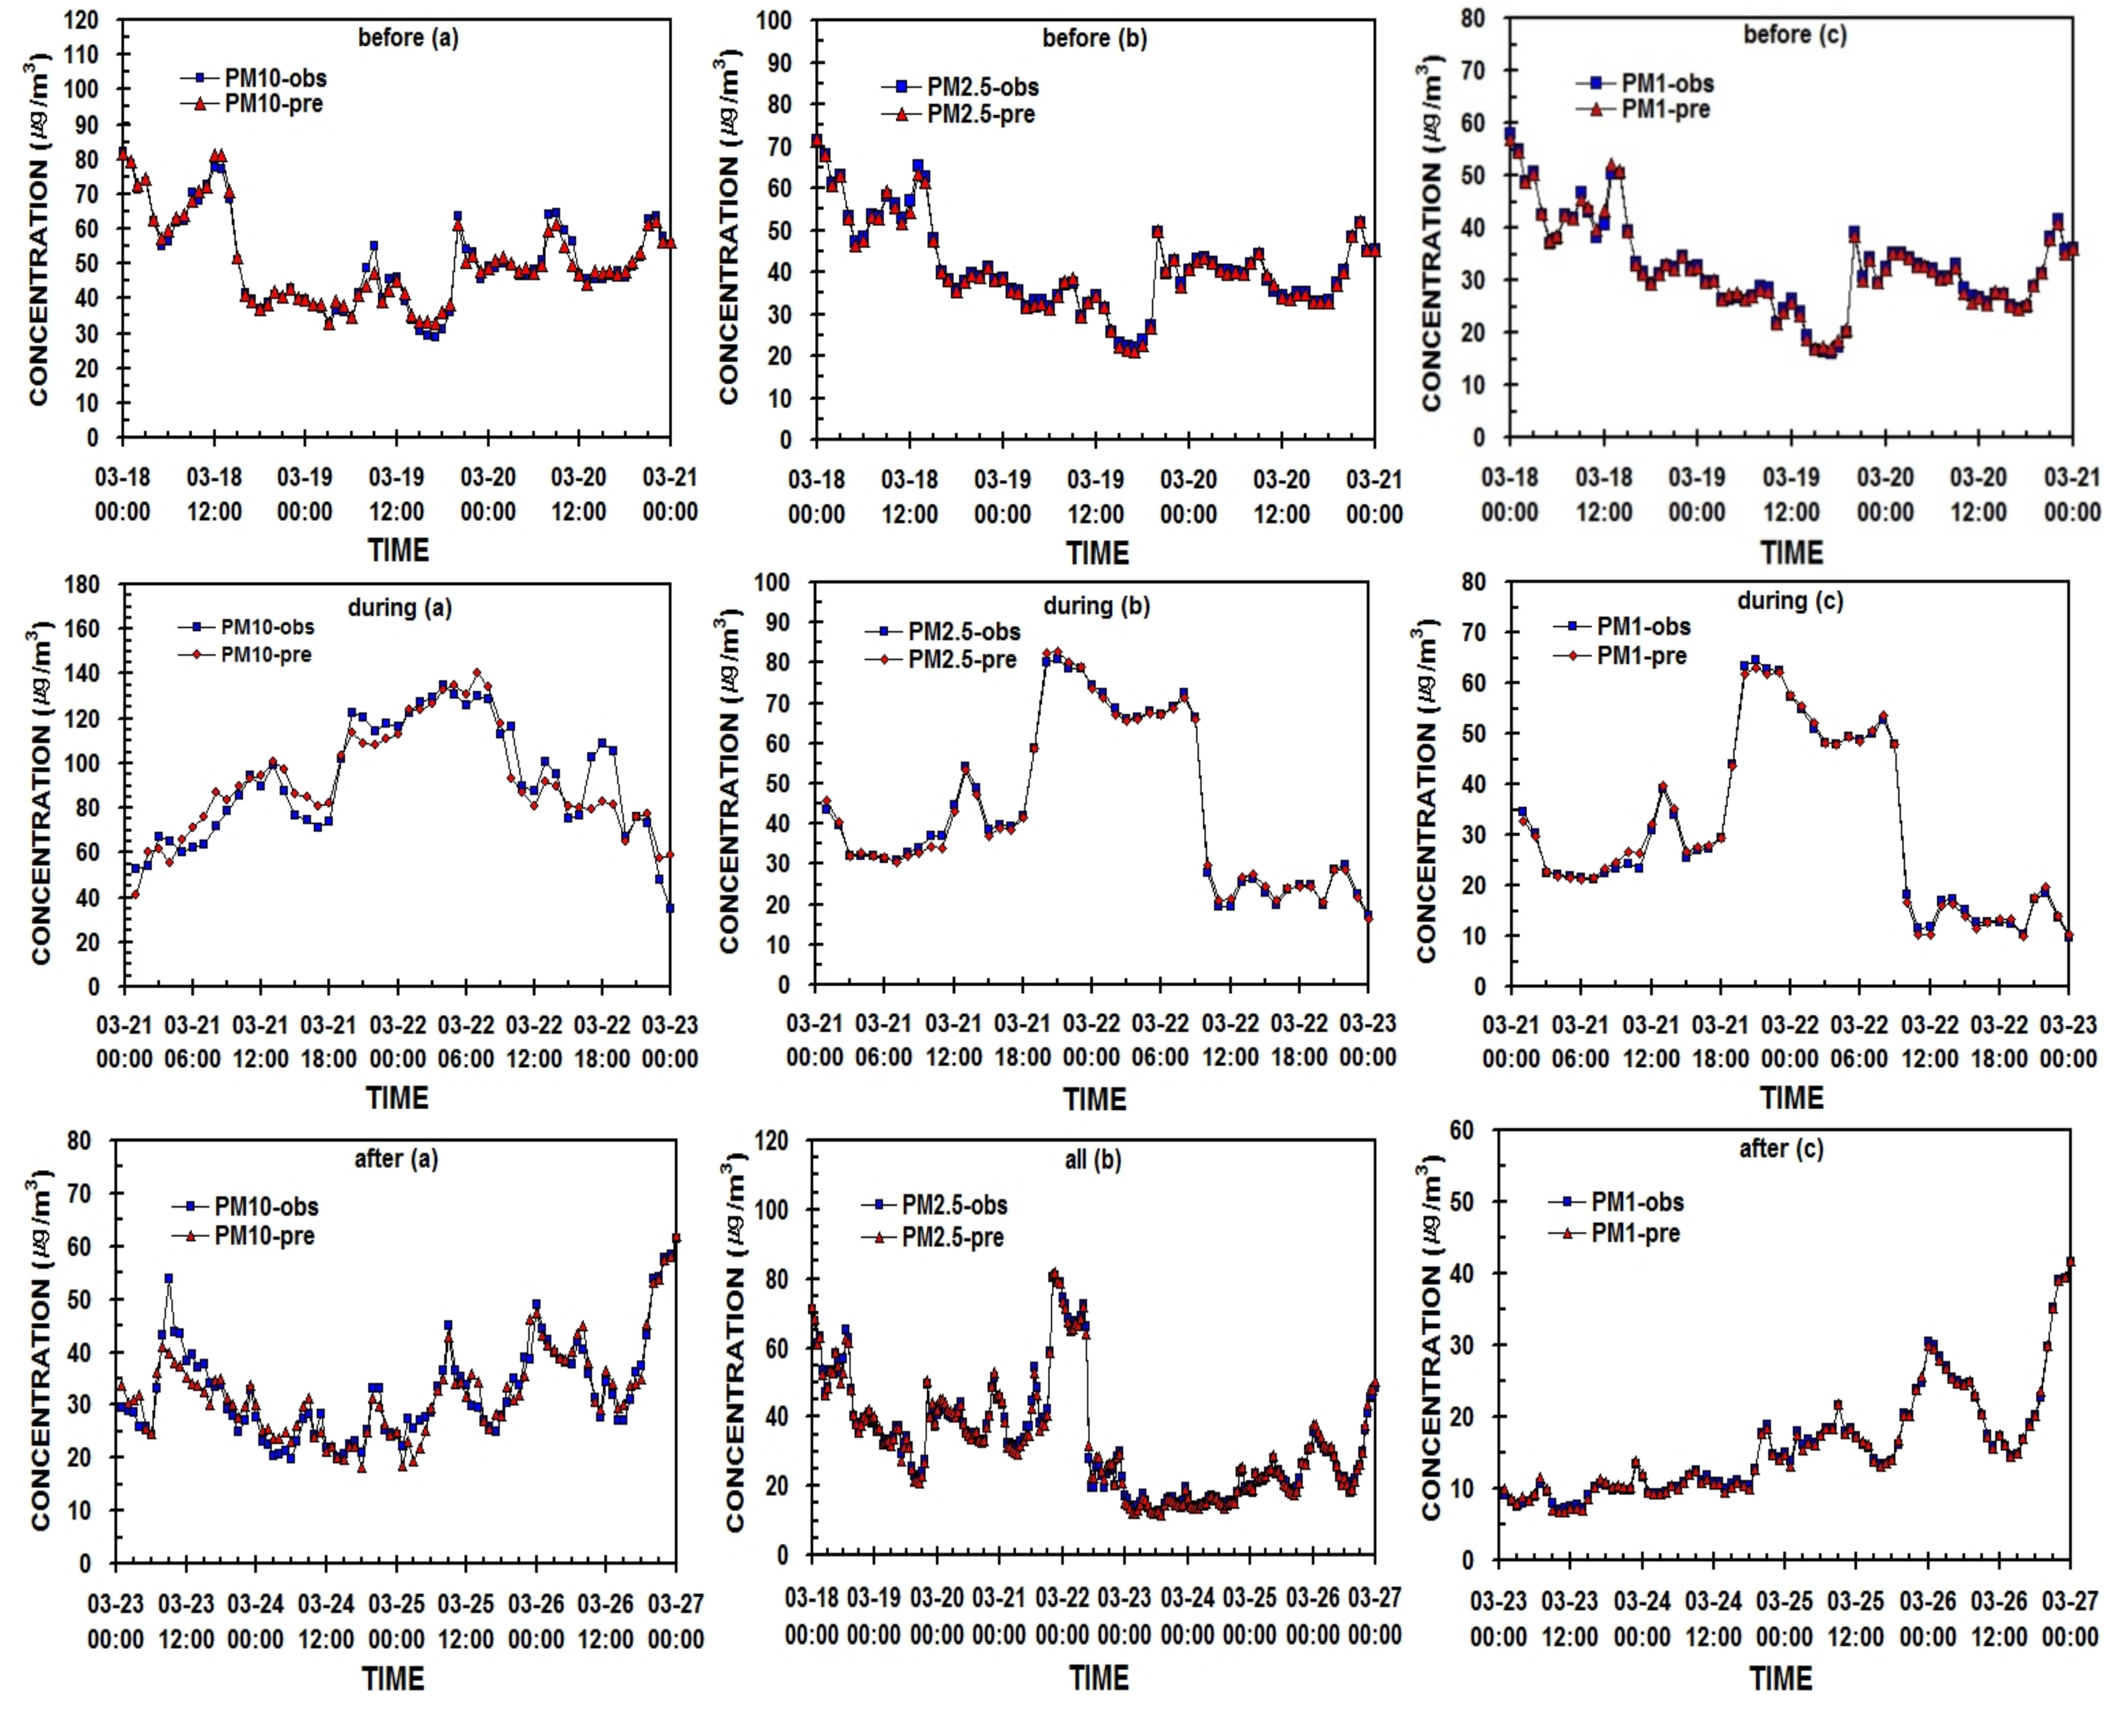
- Before and after the dust period, PM10, PM2.5 and PM1 concentrations showed as being very high at 09:00 LST of the morning rush hour by the increasing of the emitted pollutants from vehicles on the road. Their maxima values were detected at 20:00 to 22:00 LST of the evening departure time, with additional pollutants from resident heating boilers. However, during the dust period, these peak trends were not found under the persistent accumulation of dusts and particulate matters in Gangneung city from the Gobi Desert and Beijing city.
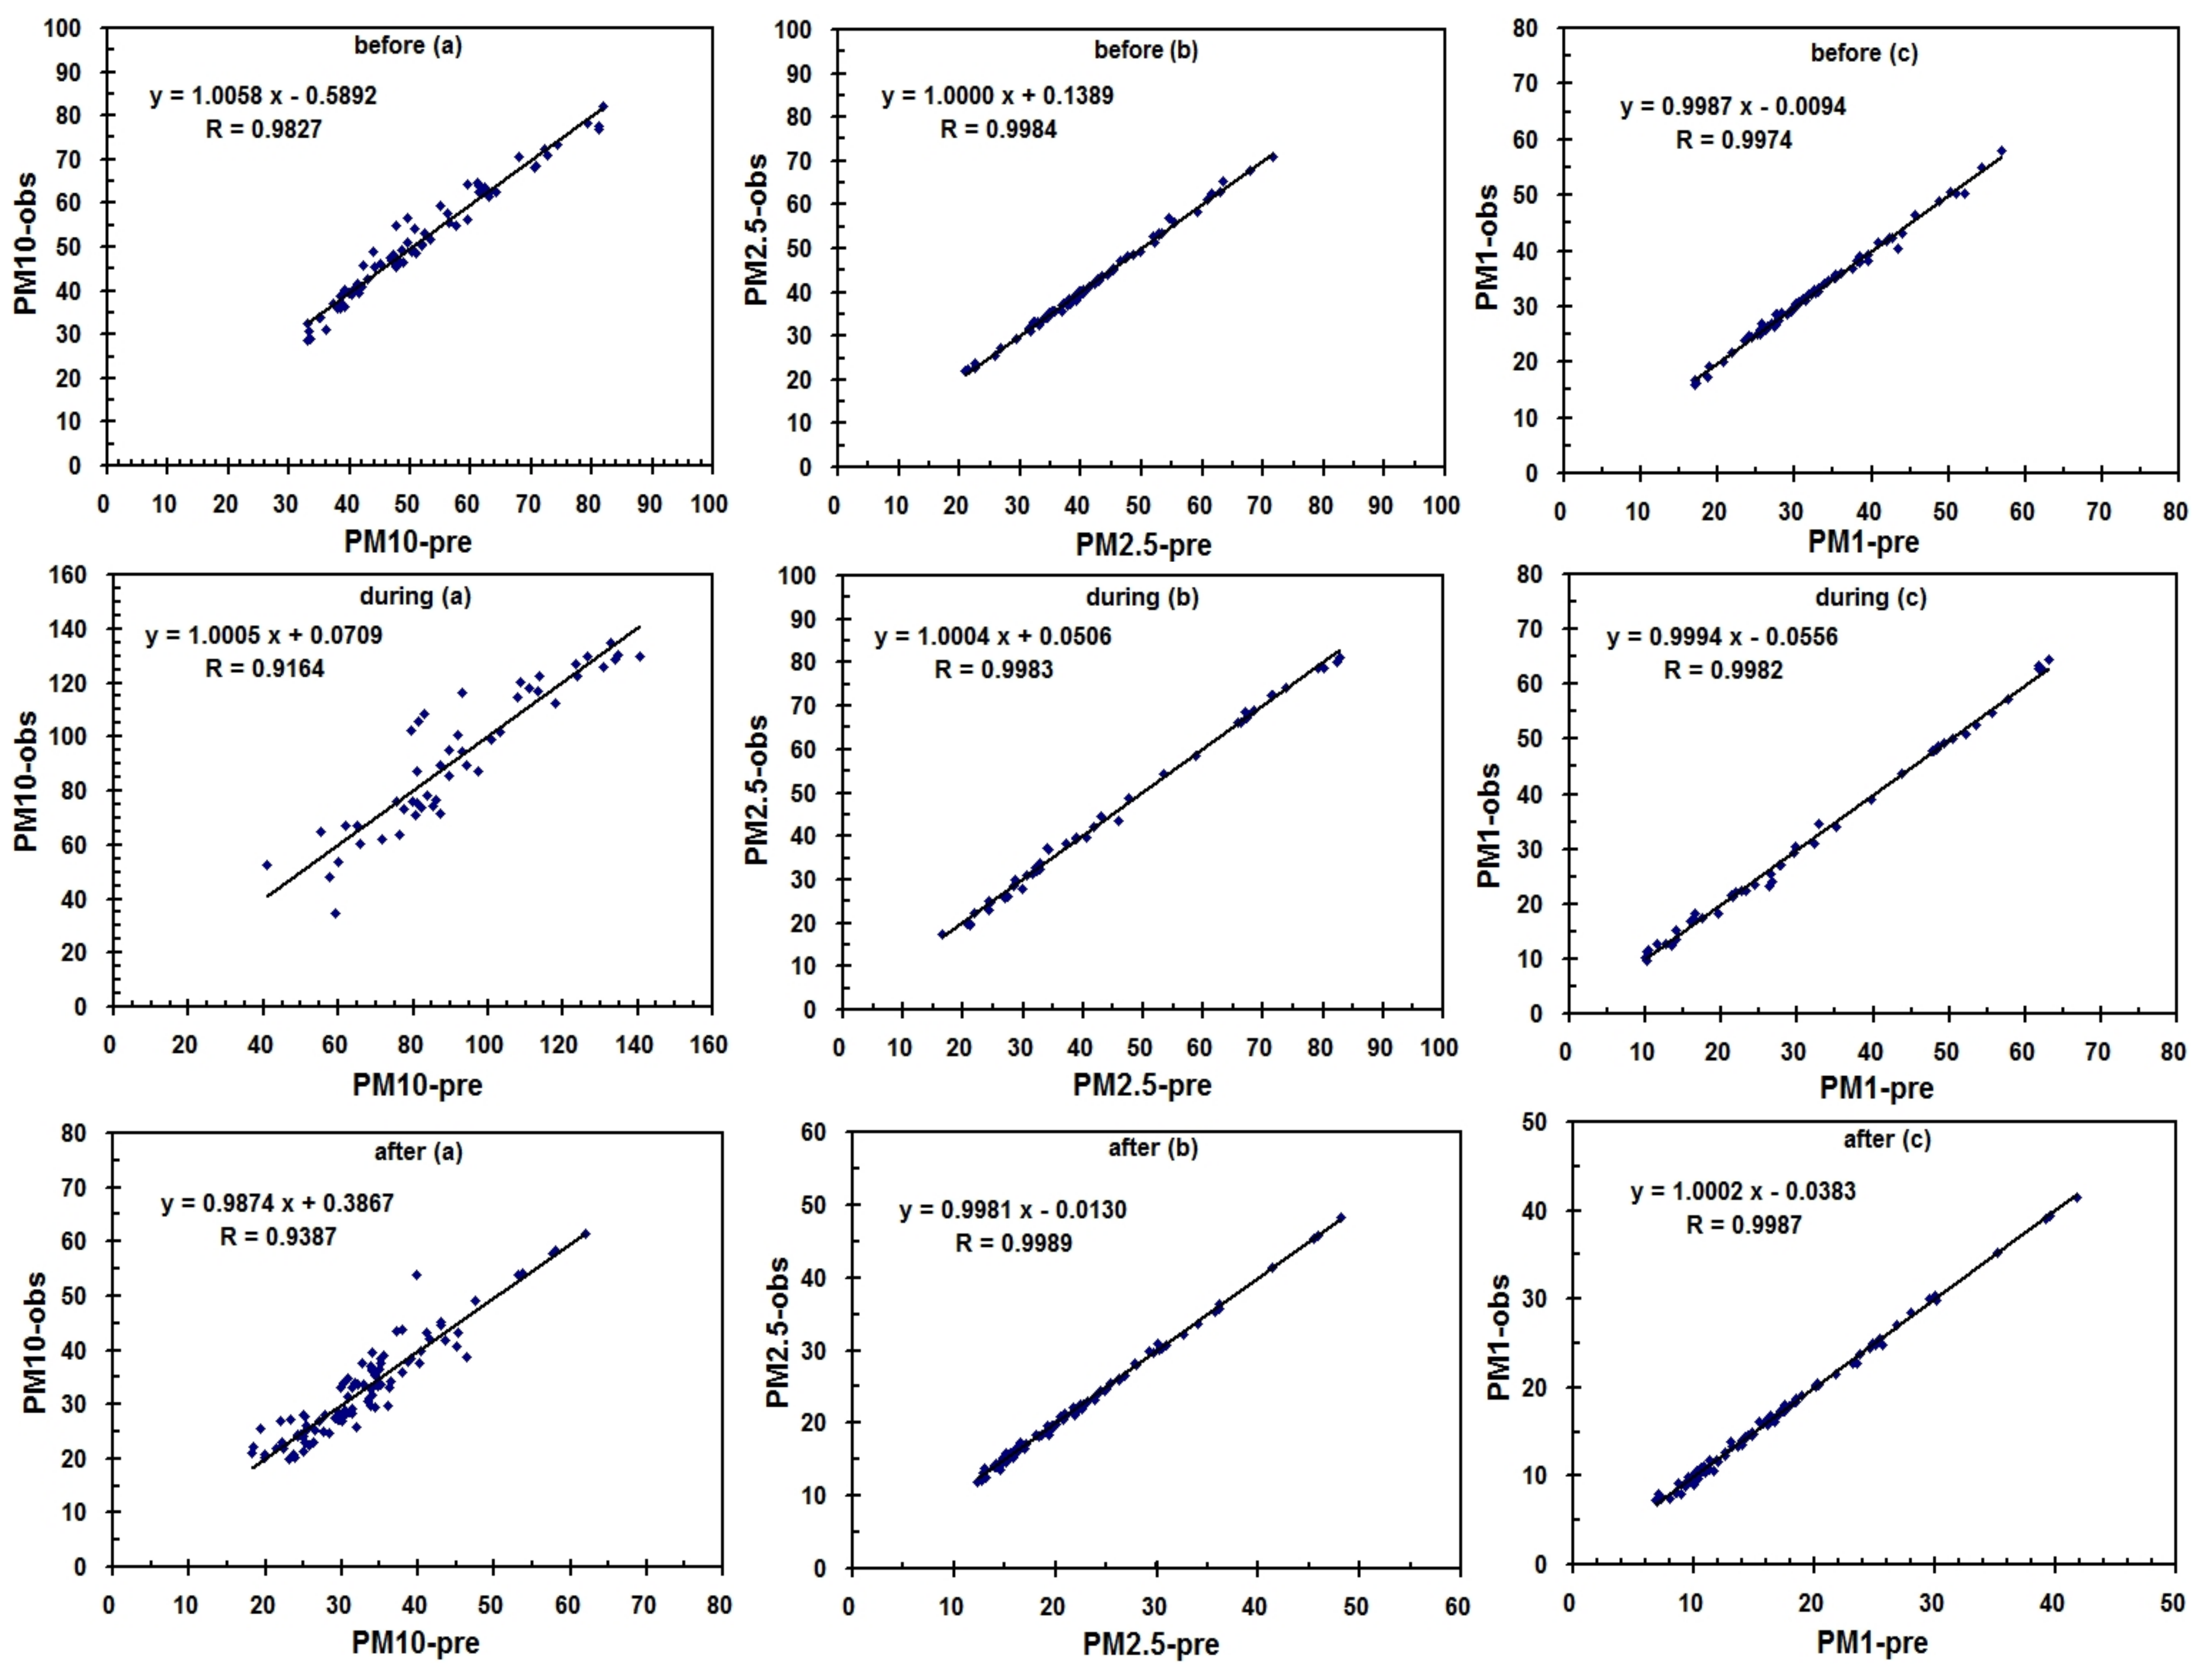
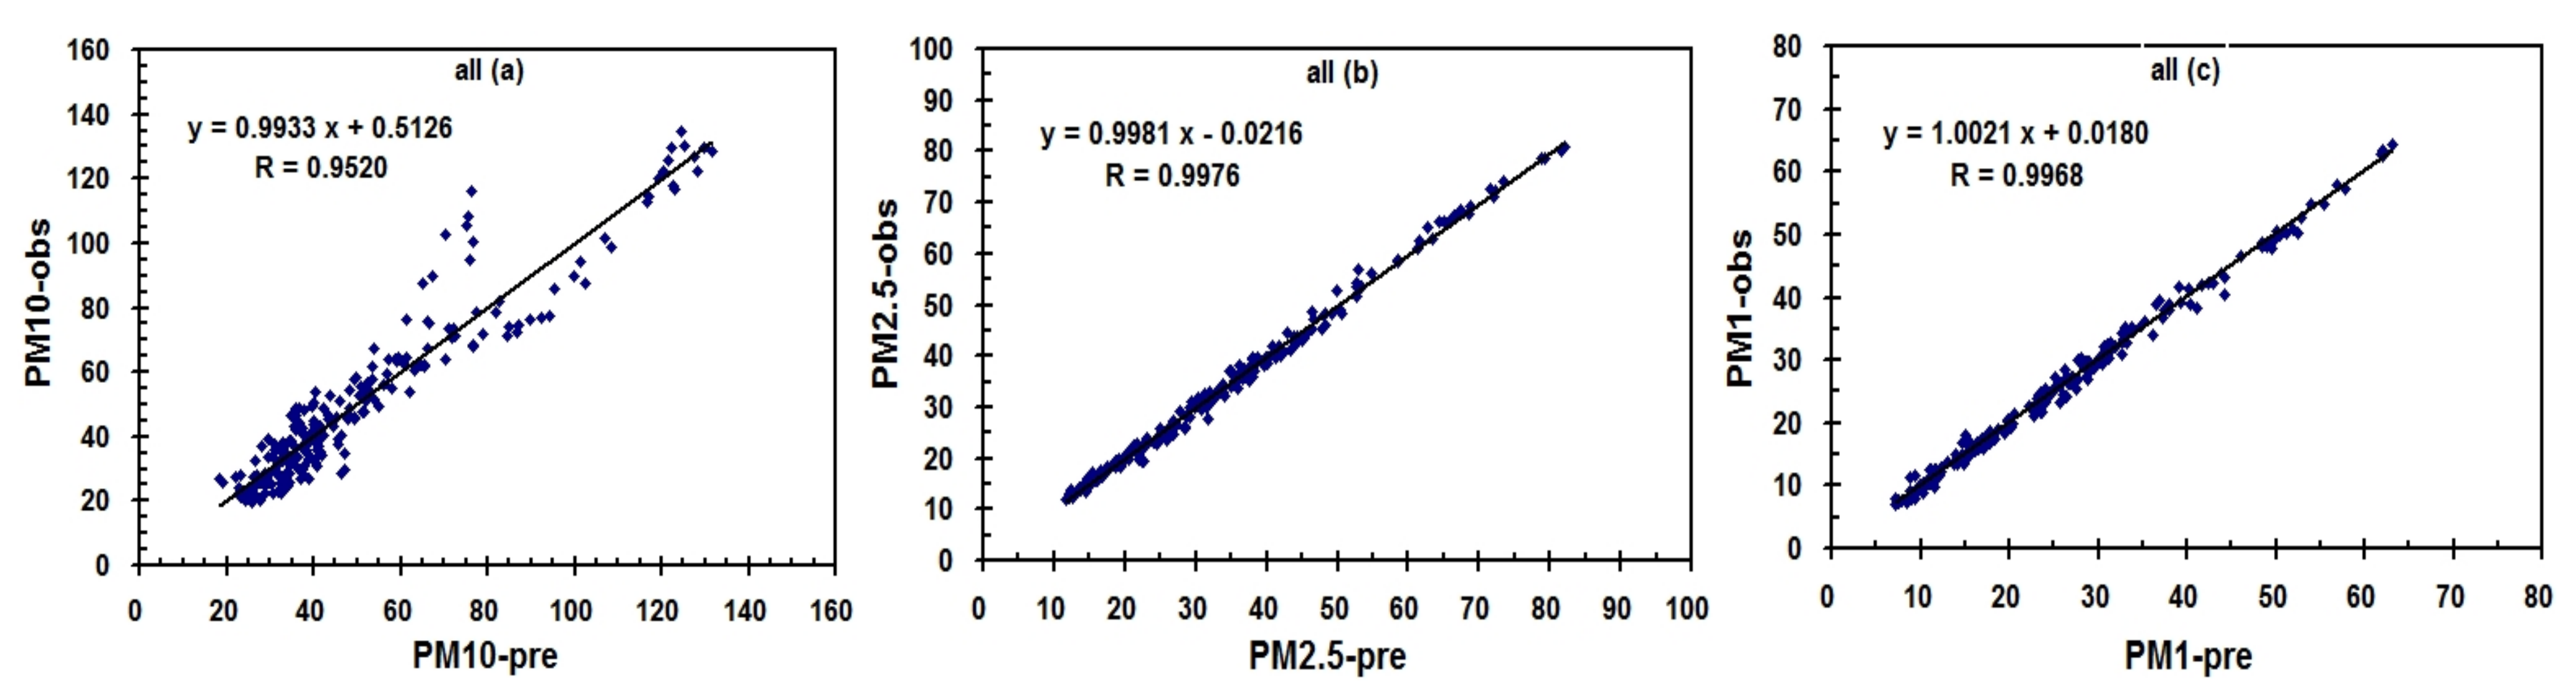
- Correlation coefficients among PM10, PM2.5 and PM1 in Gangneung, using multiple regression statistical models, were in the range of 0.916 to 0.998, and the significant level of the regression was p < 0.001, showing all the coefficients to be significant.
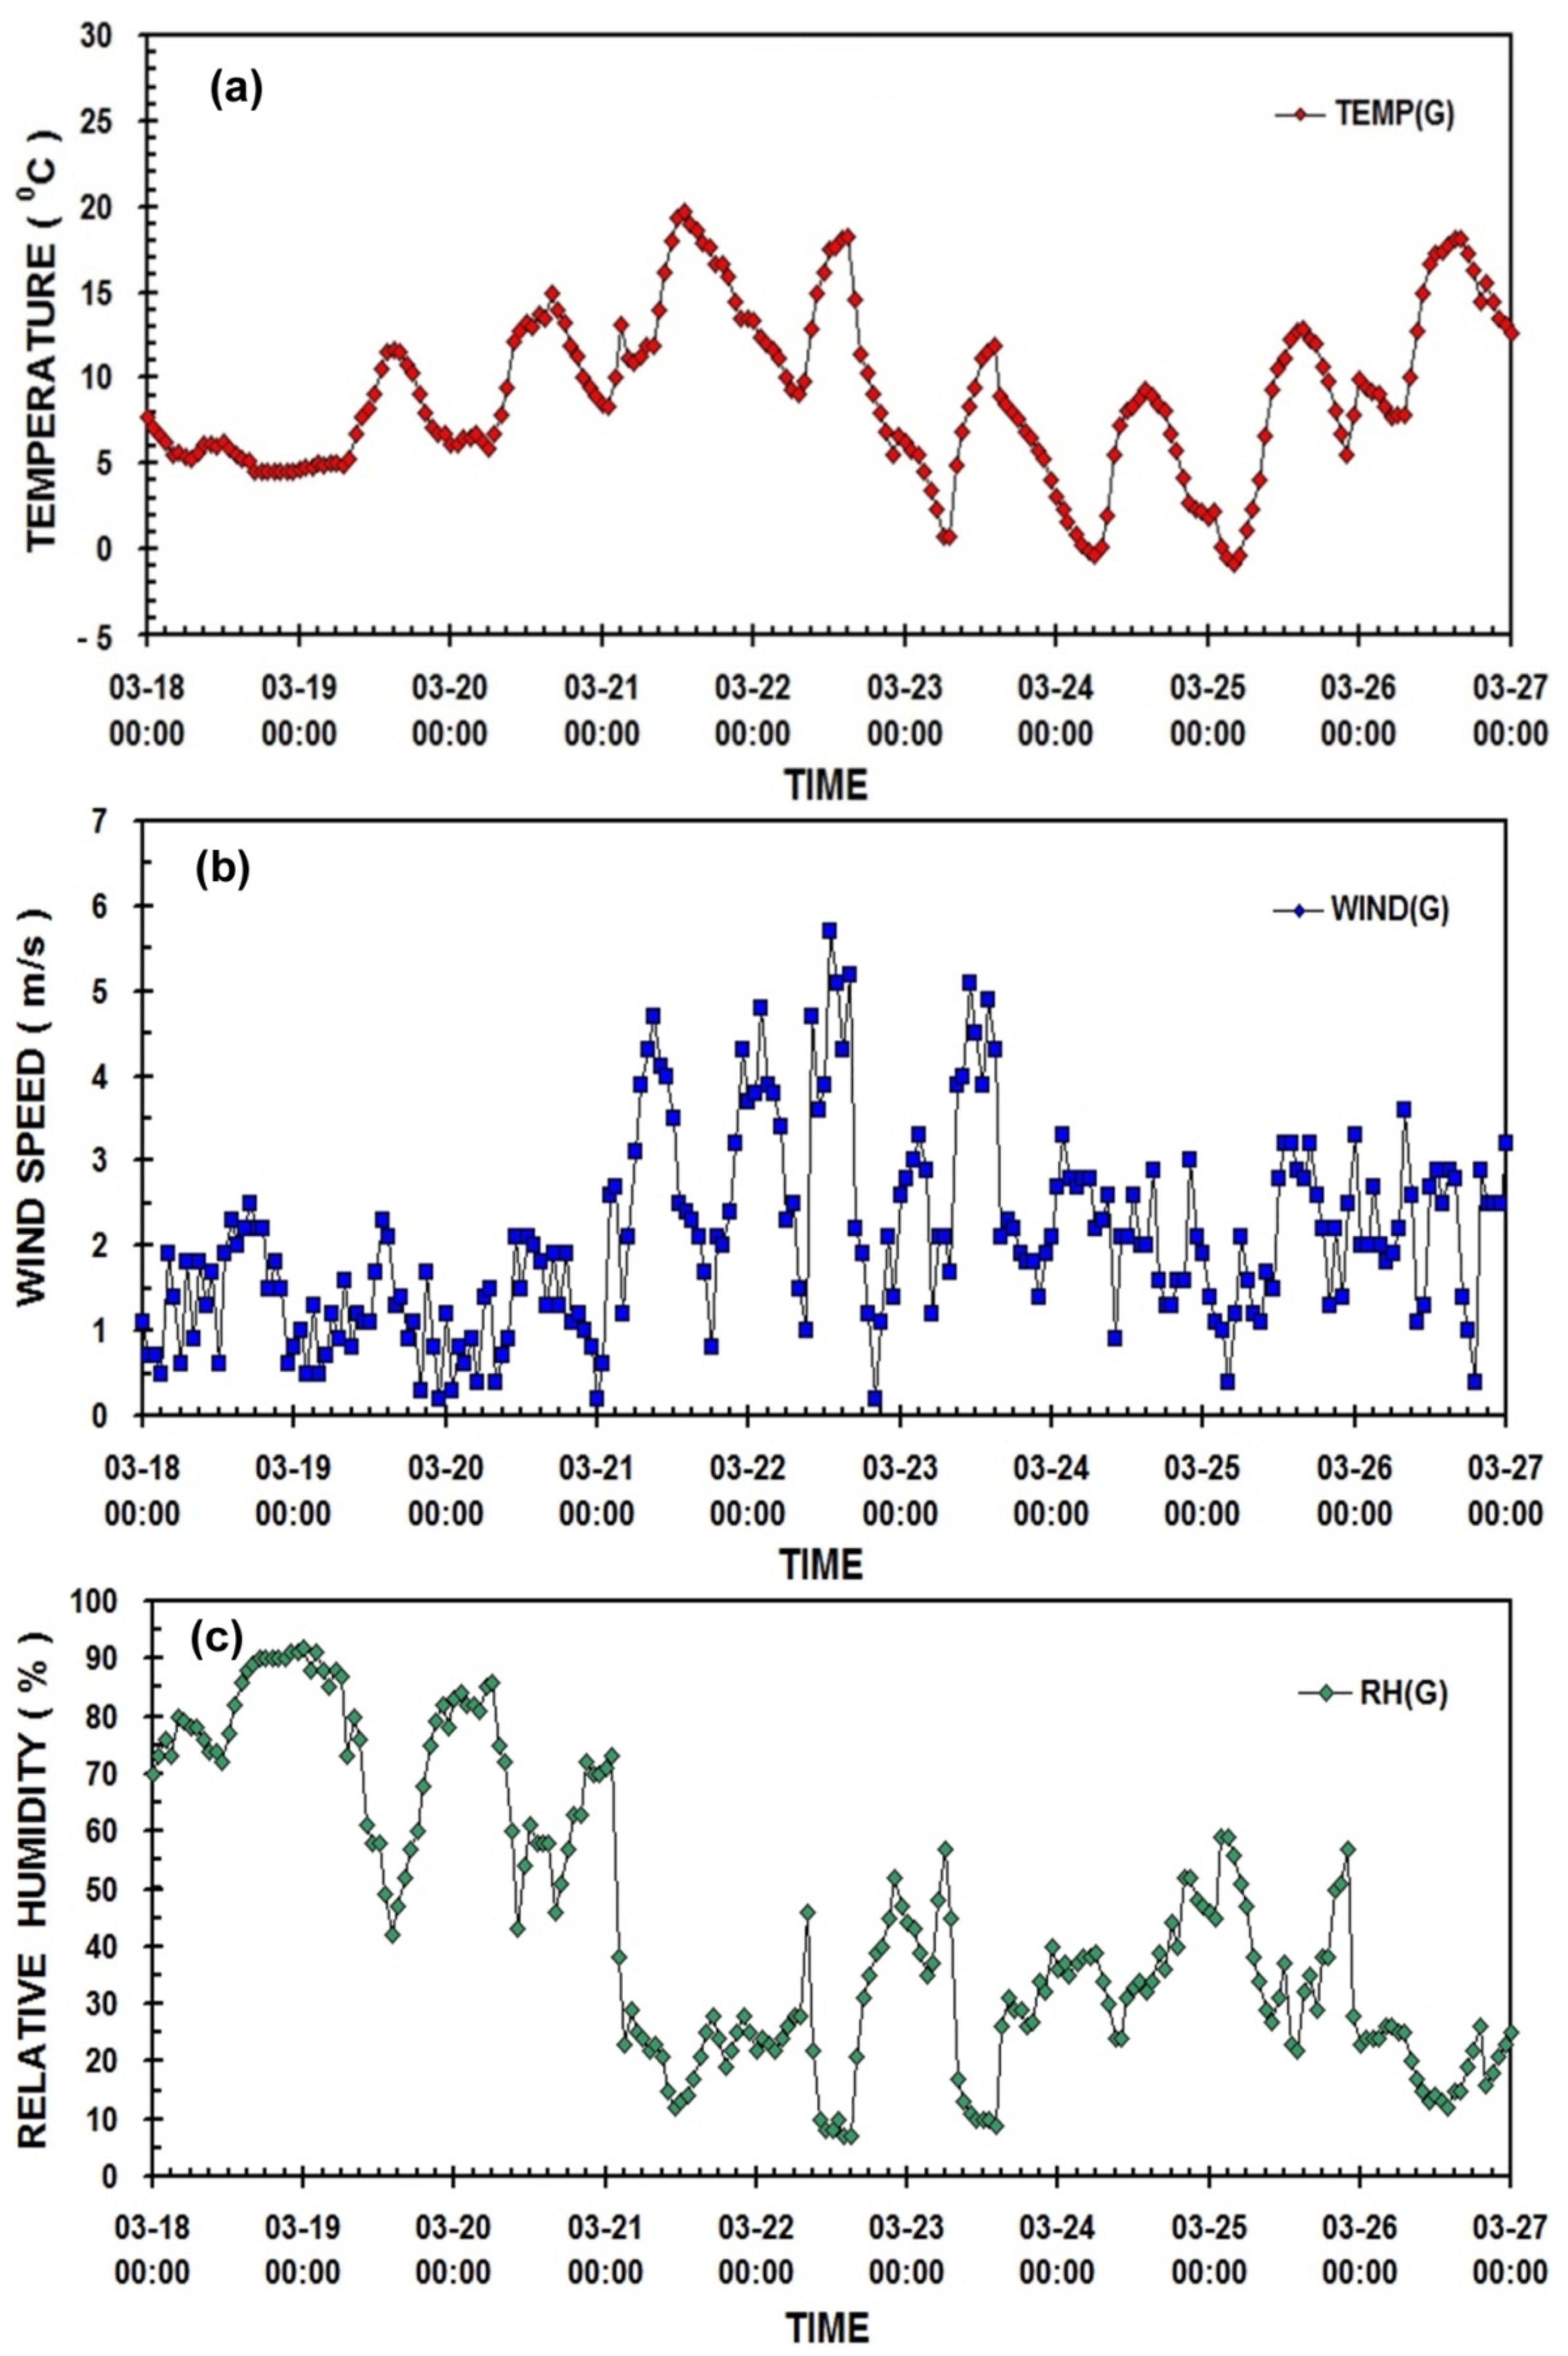
- Before the dust period, PM10 of Gangneung city is positively influenced by its relative humidity, but it is negatively by the local air temperature, wind speed, PM10 and PM2.5 of Beijing. PM2.5 of Gangneung city is positively influenced by its relative humidity and PM10 of Beijing, but it is negatively influenced by others. PM1 is negatively influenced by its air temperature and wind speed, except for others.
- During the dust period, PM10 of Gangneung city is positively influenced by the local air temperature, wind speed and PM10 of Beijing, except for others. PM2.5 concentration is negatively influenced by the local wind speed and relative humidity, except for others. PM1 of Gangneung is positively influenced by all variables.
- After the dust period, PM10 of Gangneung city is negatively influence by local relative humidity, except for others. PM2.5 and PM1 in Gangneung city are negatively influenced by the local wind speed and relative humidity, except for others. For all periods, PM10 of Gangneung city is negatively influence by the local relative humidity, except for others, but PM2.5 and PM1 are negatively influenced by the local wind speed, except for others.
- Multivariate statistical models were devised to predict each PM concentration. The observed and calculated PM concentrations were compared each other, and new linear regression prediction models to reproduce the original observed PM values were also suggested.
Author Contributions
Funding
Data Availability Statement
Acknowledgments
Conflicts of Interest
References
- Westerholm, R.; Almen, J.; Li, H.; Rannug, U.; Rosen, A. Exhaust emission from gasoline-fulled light duty vehicle operated in different driving conditions; a chemical and biological characterization. Atmos. Environ. B 1992, 26, 79–90. [Google Scholar] [CrossRef]
- Li, C.; Dai, Z.; Yang, L.; Ma, Z. Spatiotemporal characteristics of air quality across Weifang from 2014–2018. Int. J. Environ. Res. Public Health 2019, 16, 3122. [Google Scholar] [CrossRef] [Green Version]
- Chow, J.C. Health effects of fine particulate air pollution; Lines that connect. J. Air Waste Manag. Assoc. 2006, 56, 707–708. [Google Scholar] [CrossRef] [PubMed]
- Huang, D.; Xu, J.; Zhang, S. Valuing the health risks of particulate air pollution in the Pearl River Delta, China. Environ. Sci. Policy. 2012, 15, 38–47. [Google Scholar] [CrossRef]
- Shen, F.; Ge, X.; Hu, J.; Nie, D.; Tian, L.; Chen, M. Air pollution characteristics and health risks in Henan Province, China. Environ. Res. Sci. 2017, 156, 625–634. [Google Scholar] [CrossRef] [PubMed]
- Bhaskar, B.V.; Mehta, V.M. Atmospheric particulate pollutants and their relationship with meteorology in Ahmedabad. Aerosol Air. Qual. Res. 2010, 10, 301–315. [Google Scholar] [CrossRef] [Green Version]
- Cheng, Y.; He, K.B.; Du, Z.Y.; Zheng, M.; Duan, F.K.; Ma, Y.L. Humidity plays an important role in the PM2.5 pollution in Beijing. Environ. Pollut. 2015, 197, 68–75. [Google Scholar] [CrossRef]
- Li, X.; Ma, Y.; Wang, Y.; Liu, N.; Hong, Y. Temporal and spatial analyses of particulate matter (PM10 and PM2.5) and its relationship with meteorological parameters over an urban city in northeast China, 2017. Atmos. Res. 2017, 198, 185–193. [Google Scholar] [CrossRef]
- Shi, C.; Yuan, R.; Wu, B.; Meng, Y.; Zhang, H.; Zhang, H.; Gong, Z. Meteorological conditions to PM2.5 pollution in winter 2016/2017 in the western Yangtze River Delta, China. Sci. Total Environ. 2018, 642, 1221–1232. [Google Scholar] [CrossRef] [PubMed]
- Park, D.; Ha, K. Characteristics of PM10, PM2.5, CO2 and CO monitored in interiors and platforms of subway train in Seoul, Korea. Environ. Int. 2008, 34, 629–634. [Google Scholar] [CrossRef] [PubMed]
- Zhao, S.; Yu, Y.; Yin, D.; He, J.; Liu, N.; Qu, J.; Xiao, J. Annual and diurnal variations of gaseous and particulate pollutants in 31 provincial capital cities based on in sit air quality monitoring data from China National Environmental Monitoring Center. Environ. Int. 2016, 86, 92–106. [Google Scholar] [CrossRef] [PubMed]
- Ma, X.; Jia, H. Particulate matter and gaseous pollutions in three megacities over China: Situation and implication. Atmos. Environ. 2016, 140, 476–494. [Google Scholar] [CrossRef]
- Xiao, K.; Wang, Y.K.; Wu, G.; Fu, B.; Zhu, Y. Spatiotemporal characteristics of air pollutions (PM10, PM2.5, SO2, NO2, O3, and CO) in the inland basin city of Chengdu, Southwest China. Atmosphere 2018, 9, 74. [Google Scholar] [CrossRef] [Green Version]
- Li, F.; Liu, Y.; Lu, J.J.; Liang, L.; Harmer, P. Ambient air pollution in China poses a multi-faceted health threat to outdoor physical activity. J. Epidemiol. Community Health 2015, 69, 201–204. [Google Scholar] [CrossRef] [Green Version]
- He, J.Q.; Yu, X.N.; Zhu, B.; Yuan, L.; Ma, J.; Shen, L.; Zhu, J. Characteristics of Aerosol Extinction and Low Visibility in Haze Weather in Winter of Nanjing, China. Environ. Sci. 2016, 36, 1645–1653. Available online: http://www.zghjkx.com.cn/EN/abstract/abstract14655.shtml (accessed on 20 March 2021).
- Choi, H.; Speer, M.S. Effects of atmospheric circulation and boundary layer structure on the dispersion of suspended particulates in the Seoul metropolitan area. Meteorol. Atmos. Phys. 2006, 92, 239–254. [Google Scholar] [CrossRef]
- Zhang, X.; Arimoto, R.; An, Z.; Chen, T.; Zhang, G.; Zhu, G.; Wang, X. Atmospheric trace elements over source regions for Chinese dust: Concentrations, sources and atmospheric deposition on the Loess Plateau. Atmos. Environ.-A 1993, 27, 2051–2067. [Google Scholar] [CrossRef]
- Chung, Y.; Yoon, M. On the Occurrence of Yellow Sand and Atmospheric Loadings. Atmos. Environ. 1996, 30, 2387–2397. Available online: http://www.koreascience.or.kr/article/JAKO199411921388674.page (accessed on 20 June 2021). [CrossRef]
- Chung, Y.S.; Kim, H.S.; Natsagdorj, L.; Jugder, D.; Chen, S.J. On Yellow Sand Occurred During 1997–2000. J. Korean Meteorol. Sci. 2001, 37, 305–316. Available online: https://www.dbpia.co.kr/journal/articleDetail?nodeId=NODE00952163 (accessed on 20 June 2021).
- Wang, X.; Ma, Y.; Chen, H.; Wen, G.; Chen, S.; Tao, Z.; Chung, Y. The relation between sandstorms and strong winds in Xinjiang, China. Water Air Soil Pollut. 2003, 3, 67–79. [Google Scholar] [CrossRef]
- Zhang, Y.; Zhong, Y. The simulation and diagnosis for a strong wind associated northeast low. Acta Meteorol. Sin. 1985, 43, 97–105. [Google Scholar]
- Choi, H.; Zhang, Y.H. Predicting duststorm evolution with the vorticity theory. Atmos. Res. 2008, 89, 338–350. [Google Scholar] [CrossRef]
- Tegen, I.; Fung, I. Modeling of mineral dust in the atmosphere: Sources, transport, and optical thickness. J. Geophys. Res.-D 1994, 99, 22897–22914. [Google Scholar] [CrossRef]
- Kotamarthi, V.R.; Carmichael, G.R. The long range transport of pollutants in the Pacific Rim region. Atmos. Environ.-A 1990, 24, 1521–1534. [Google Scholar] [CrossRef]
- McKendry, I.G.; Hacker, J.P.; Stull, R.; Sakiyama, S.; Mignacca, D.; Reid, K. Long-range transport of Asian dust to the Lower Fraser Valley, British Columbia, Canada. J. Geophys. Res. Atmos.-D 2001, 106, 18361–18370. [Google Scholar] [CrossRef]
- Lin, T. Long-range transport of yellow sand to Taiwan in Spring 2000: Observed evidence and simulation. Atmos. Environ. 2001, 35, 5873–5882. [Google Scholar] [CrossRef]
- Carmichael, G.R.; Hong, M.; Ueda, H.; Chen, L.; Murano, K.; Park, J.K.; Lee, H.; Kim, Y.; Kang, C.; Shim, S. Aerosol composition at Cheju Island, Korea. J. Geophys. Res.-D 1997, 102, 6047–6061. [Google Scholar] [CrossRef]
- Kim, Y.J.; Kim, K.W.; Kim, S.D.; Lee, B.K.; Han, J.S. Fine particulate matter characteristics and its impact on visibility impairment at two sites in Korea: Seoul and Incheon. Atmos. Environ. 2000, 40, 593–609. [Google Scholar] [CrossRef]
- Choi, H. Characteristics of Hourly Variation of Gaseous Pollutant Concentration at Gangneung, Korea for Yellow Sand Event Period in Winter Case Study of 14–16 February 2005. J. Clim. Res. 2011, 6, 59–76. Available online: https://www.kci.go.kr/kciportal/ci/sereArticleSearch/ciSereArtiView.kci?sereArticleSearchBean.artiId=ART001533093 (accessed on 20 June 2021).
- Zhao, D.; Chen, H.; Yu, E.; Luo, T. PM2.5/PM10 ratios in eight economic regions and their relationship with meteorology in China. Adv. Meteorol. 2019, 15, 5296725. [Google Scholar] [CrossRef] [Green Version]
- Choi, H. Comparison of PM1, PM2.5 and PM10 concentrations in a mountainous coastal city, Gangneung before and after the Yellow Dust event in spring. J. Environ. Sci. 2008, 17, 633–645. [Google Scholar] [CrossRef]
- Choi, H. Impact of Fine Particulate Matters Transported from Gobi Desert to Particulate Concentrations (PM10, PM2.5, PM1) for Yellow Sand Event Period in Fall-Case study of 27 October 2003. J. Climate Res. 2010, 5, 219–233. Available online: https://www.kci.go.kr/kciportal/ci/sereArticleSearch/ciSereArtiView.kci?sereArticleSearchBean.artiId=ART001493480 (accessed on 20 June 2021).
- Lee, M.S.; Chung, J.D. Impact of yellow dust transport from Gobi Desert on fractional ratio and correlations of temporal PM10, PM2.5 and PM1 at Gangneung city in fall. J. Environ. Sci. 2012, 21, 217–231. [Google Scholar] [CrossRef] [Green Version]
- Choi, H.; Zhang, Y.H.; Takahashi, S. Recycling of suspended particulates by the interaction of sea-land breeze circulation and complex coastal terrain. Meteorol. Atmos. Phys. 2004, 87, 109–120. [Google Scholar] [CrossRef]
- Choi, H.; Choi, D.S. Concentrations of PM10, PM2.5, and PM1 influenced by atmospheric circulation and atmospheric boundary layer in the Korean mountainous coast during a duststorm. Atmos. Res. 2008, 89, 330–337. [Google Scholar] [CrossRef]
- Choi, H.; Zhang, Y.H.; Kim, K.H. Sudden high concentration of TSP affected by atmospheric boundary layer in Seoul metropolitan area during duststorm period. Environ. Int. 2008, 34, 635–647. [Google Scholar] [CrossRef] [PubMed]
- Choi, H.; Choi, D.S.; Choi, S.M. Meteorological condition and atmospheric boundary layer influenced upon temporal concentrations of PM1, PM2.5 at a Coastal City, Korea for Yellow Sand Event from Gobi Desert. Dis. Adv. 2010, 3, 309–315. [Google Scholar]
- Uzan, L.; Alpert, P. The coastal boundary layer and air pollution—A high temporal resolution analysis in the East Mediterranean coast. Open Atmos. Sci. J. 2012, 6, 9–18. [Google Scholar] [CrossRef] [Green Version]
- Choi, H. Trapping effect of a calm zone by lee side-internal gravity waves and cyclonic winds on sudden high concentrations of particulate matters combined with the Yellow Dusts from Gobi Desert in the Korean eastern coast. Dis. Adv. 2013, 6, 101–111. [Google Scholar]
- He, J.H.; Ding, S.; Liu, D.F. Exploring the spatiotemporal pattern of PM2.5 distribution and its determinants in Chinese cities based on a multilevel analysis approach. Sci. Total Environ. 2019, 659, 1513–1525. [Google Scholar] [CrossRef]


| Period | Multi-Correlation Coefficient | Predictive Regression Equation | |
|---|---|---|---|
| 18/03/2015 to 21/03/2015 (Before dust period) | 0.983 | PM10(G) = | 3.353 × PM2.5(G) − 2.708 × PM1(G) |
| + 0.601 × T(G) − 1.240 × W(G) + 0.009 × RH(G) | |||
| − 0.006 × PM10(B) + 0.002 × PM2.5(B) − 2.206 | |||
| 0.998 | PM2.5(G) = | 0.211 × PM10(G) + 0.917 × PM1(G) | |
| − 0.245 × T(G) + 0.269 × W(G) − 0.035 × RH(G) | |||
| + 0.006 × PM10(B) − 0.007 × PM2.5(B) + 4.638 | |||
| 0.997 | PM1(G) = | − 0.193 × PM10(G) + 1.038 × PM2.5(G) | |
| + 0.258 × T(G) − 0.240 × W(G) + 0.049 × RH(G) | |||
| − 0.005 × PM10(B) + 0.006 × PM2.5(B) − 5.710 | |||
| 21/03/2015 to 23/03/2015 (During dust period) | 0.916 | PM10(G) = | 3.560 × PM2.5(G) − 3.114 × PM1(G) |
| − 0.914 × T(G) + 4.444 × W(G) − 0.360 × RH(G) | |||
| + 0.082 × PM10(B) − 0.252 × PM2.5(B) + 42.893 | |||
| 0.998 | PM2.5(G) = | 0.047 × PM10(G) + 1.166 × PM1(G) | |
| − 0.043 × T(G) − 0.525 × W(G) − 0.009 × RH(G) | |||
| − 0.001 × PM10(B) − 0.019 × PM2.5(B) + 7.359 | |||
| 0.998 | PM1(G) = | − 0.030 × PM10(G) + 0.842 × PM2.5(G) | |
| + 0.042 × T(G) + 0.406 × W(G) + 0.009 × RH(G) | |||
| + 0.001 × PM10(B) + 0.020 × PM2.5(B) − 6.874 | |||
| 23/03/2015 to 27/03/2015 (After dust period) | 0.941 | PM10(G) = | 6.841 × PM2.5(G) − 6.102 × PM1(G) |
| − 0.548 × T(G) + 1.859 × W(G) − 0.433 × RH(G) | |||
| − 0.008 × PM10(B) + 0.002 × PM2.5(B) − 1.628 | |||
| 0.998 | PM2.5(G) = | 0.090 × PM10(G) + 0.946 × PM1(G) | |
| + 0.061 × T(G) − 0.182 × W(G) + 0.044 × RH(G) | |||
| + 0.002 × PM10(B) − 0.001 × PM2.5(B) + 1.747 | |||
| 0.998 | PM1(G) = | − 0.088 × PM10(G) + 1.042 × PM2.5(G) | |
| − 0.060 × T(G) + 0.185 × W(G) − 0.043 × RH(G) | |||
| − 0.002 × PM10(B) + 0.003 × PM2.5(B) − 1.908 | |||
| 18/03/2015 to 27/03/2015 (all periods) | 0.954 | PM10(G) = | 5.826 × PM2.5(G) − 5.670 × PM1(G) |
| + 0.554 × T(G) + 3.456 × W(G) − 0.112 × RH(G) | |||
| + 0.039 × PM10(B) − 0.018 × PM2.5(B) − 12.128 | |||
| 0.998 | PM2.5(G) = | 0.104 × PM10(G) + 1.059 × PM1(G) | |
| − 0.003 × T(G) − 0.328 × W(G) + 0.019 × RH(G) | |||
| + 0.005 × PM10(B) − 0.010 × PM2.5(B) + 1.350 | |||
| 0.997 | PM1(G) = | − 0.088 × PM10(G) + 0.924 × PM2.5(G) | |
| + 0.006 × T(G) + 0.268 × W(G) − 0.014 × RH(G) | |||
| − 0.005 × PM10(B) + 0.010 × PM2.5(B) − 1.246 | |||
| Period | Item | PM10 (G) | PM2.5 (G) | PM1 (G) | Temp (G) | Wind (G) | RH (G) | PM10 (B) | PM2.5 (B) |
|---|---|---|---|---|---|---|---|---|---|
| Before | PM10 (G) | 1.000 | 0.913 | 0.854 | −0.112 | −0.218 | 0.019 | −0.035 | −0.260 |
| PM2.5 (G) | 1.000 | 0.989 | −0.385 | −0.150 | 0.320 | 0.210 | −0.003 | ||
| PM1 (G) | 1.000 | −0.444 | −0.132 | 0.403 | 0.267 | 0.067 | |||
| Temp (G) | 1.000 | 0.100 | −0.897 | −0.701 | −0.694 | ||||
| Wind (G) | 1.000 | −0.009 | 0.084 | 0.131 | |||||
| RH (G) | 1.000 | 0.623 | 0.644 | ||||||
| PM10 (B) | 1.000 | 0.952 | |||||||
| PM2.5 (B) | 1.000 | ||||||||
| During | PM10 (G) | 1.000 | 0.725 | 0.689 | 0.117 | 0.244 | −0.286 | 0.407 | −0.119 |
| PM2.5 (G) | 1.000 | 0.996 | 0.030 | −0.013 | −0.007 | 0.567 | 0.411 | ||
| PM1 (G) | 1.000 | 0.041 | 0.005 | −0.005 | 0.574 | 0.466 | |||
| Temp (G) | 1.000 | 0.395 | −0.794 | 0.060 | −0.021 | ||||
| Wind (G) | 1.000 | −0.651 | −0.103 | −0.056 | |||||
| RH (G) | 1.000 | 0.112 | 0.226 | ||||||
| PM10 (B) | 1.000 | 0.459 | |||||||
| PM2.5 (B) | 1.000 | ||||||||
| After | PM10 (G) | 1.000 | 0.732 | 0.709 | 0.419 | 0.212 | −0.470 | 0.279 | 0.584 |
| PM2.5 (G) | 1.000 | 0.997 | 0.346 | −0.180 | −0.111 | 0.391 | 0.847 | ||
| PM1 (G) | 1.000 | 0.356 | −0.171 | −0.127 | 0.372 | 0.846 | |||
| Temp (G) | 1.000 | 0.209 | −0.741 | −0.167 | 0.344 | ||||
| Wind (G) | 1.000 | −0.475 | −0.095 | −0.225 | |||||
| RH (G) | 1.000 | 0.190 | −0.110 | ||||||
| PM10 (B) | 1.000 | 0.551 | |||||||
| PM2.5 (B) | 1.000 | ||||||||
| All | PM10 (G) | 1.000 | 0.767 | 0.685 | 0.453 | 0.247 | −0.166 | 0.458 | 0.091 |
| PM2.5 (G) | 1.000 | 0.990 | 0.217 | −0.121 | 0.273 | 0.583 | 0.425 | ||
| PM1 (G) | 1.000 | 0.179 | −0.158 | 0.325 | 0.580 | 0.479 | |||
| Temp (G) | 1.000 | 0.355 | −0.548 | −0.036 | −0.133 | ||||
| Wind (G) | 1.000 | −0.623 | −0.100 | −0.281 | |||||
| RH (G) | 1.000 | 0.391 | 0.629 | ||||||
| PM10 (B) | 1.000 | 0.780 | |||||||
| PM2.5 (B) | 1.000 |
Publisher’s Note: MDPI stays neutral with regard to jurisdictional claims in published maps and institutional affiliations. |
© 2021 by the authors. Licensee MDPI, Basel, Switzerland. This article is an open access article distributed under the terms and conditions of the Creative Commons Attribution (CC BY) license (https://creativecommons.org/licenses/by/4.0/).
Share and Cite
Choi, S.-M.; Choi, H. Statistical Modeling for PM10, PM2.5 and PM1 at Gangneung Affected by Local Meteorological Variables and PM10 and PM2.5 at Beijing for Non- and Dust Periods. Appl. Sci. 2021, 11, 11958. https://0-doi-org.brum.beds.ac.uk/10.3390/app112411958
Choi S-M, Choi H. Statistical Modeling for PM10, PM2.5 and PM1 at Gangneung Affected by Local Meteorological Variables and PM10 and PM2.5 at Beijing for Non- and Dust Periods. Applied Sciences. 2021; 11(24):11958. https://0-doi-org.brum.beds.ac.uk/10.3390/app112411958
Chicago/Turabian StyleChoi, Soo-Min, and Hyo Choi. 2021. "Statistical Modeling for PM10, PM2.5 and PM1 at Gangneung Affected by Local Meteorological Variables and PM10 and PM2.5 at Beijing for Non- and Dust Periods" Applied Sciences 11, no. 24: 11958. https://0-doi-org.brum.beds.ac.uk/10.3390/app112411958