Article

Assessment of an Improved Three-Diode against Modified Two-Diode Patterns of MCS Solar Cells Associated with Soft Parameter Estimation Paradigms

by
Ahmed S. Bayoumi
1,
Ragab A. El-Sehiemy
2,
Karar Mahmoud
3,4,
Matti Lehtonen
3 and
Mohamed M. F. Darwish
3,5,*
1
Department of Engineering Physics, Faculty of Engineering, Kafrelsheikh University, 33516 Kafrelsheikh, Egypt
2
Department of Electrical Engineering, Faculty of Engineering, Kafrelsheikh University, 33516 Kafrelsheikh, Egypt
3
Department of Electrical Engineering and Automation, School of Electrical Engineering, Aalto University, 02150 Espoo, Finland
4
Department of Electrical Engineering, Faculty of Engineering, Aswan University, 81542 Aswan, Egypt
5
Department of Electrical Engineering, Shoubra Faculty of Engineering, Benha University, 11629 Cairo, Egypt
*
Author to whom correspondence should be addressed.
Submission received: 2 January 2021 / Revised: 19 January 2021 / Accepted: 21 January 2021 / Published: 25 January 2021
(This article belongs to the Section Electrical, Electronics and Communications Engineering)

Abstract

:
Recently, the use of multi-crystalline silicon solar cells (MCSSCs) has been increasing worldwide. This work proposes a novel MCSSC pattern for achieving a more accurate emulation of the electrical behavior of solar cells. Specifically, this pattern is dependent on the modification of the double diode model of MCSSCs. Importantly, the proposed pattern has an extra diode compared to the previously modified double-diode model (MDDM) described in the literature for considering the defect region of MCSSC to form a modified three diode model (MTDM). For estimating the parameters of the proposed MTDM, two metaheuristic algorithms called closed-loop particle swarm optimization (CLPSO) and elephant herd optimization (EHO) are developed, which have superior convergence rates. The competitive algorithms are executed on experimental data based on a MCSSC of area 7.7 cm2 from Q6-1380 and CS6P-240P solar modules under different irradiance and temperature levels for both MDDM and MTDM. Also, the proposed elephant herd optimization soft paradigm is extended for a high irradiance level at 1000 W/m2 on an R.T.C. France Solar cell. The proposed new optimization models are more efficient in dealing with the natural characteristics of the MCSSC. The simulation results show that the MTDM gives more accurate solutions as a model to the MCSSC compared with the results reported in the literature. From the viewpoint of soft computing paradigms, the EHO outperforms CLPSO in terms of the solution quality and convergence rates.

1. Introduction

Modern life depends mainly on the aids of modern devices and machines. These technologies made the lifestyle energy consuming and the need for energy is increasing every day. The merits of renewable energy sources over traditional fossil fuels make them promising alternatives to be used in the future and prompt researchers to invest more time in their study [1]. Of these energies, photovoltaic (PV) is highly attractive because of its availability and the fact it produces almost no pollution. The cheap current technology for fabricating multi-crystalline silicon (MCS) solar cells (MCSSCs) makes them widely used and opens the door to researchers to focus on the modeling of such PV cells [2].
The basis of MCSSCs are multi-crystalline silicon wafers that contain single crystalline grains with grain boundaries between them for different crystallographic orientations [3,4]. The current leakage in the MCS solar cells is correlated to their grain bounds and it is most probable that recombination will occur [5]. Thus, it is possible to say that an important issue of research in MCS solar cells is the necessity of introducing these effects in an accurate model to describe the physical effects of the grain boundaries [6]. In the related literature, it is possible to find several models of PV cells; the basics are the single-, double-, and three- diode models that are abbreviated as SDM, DDM, and TDM, respectively. Each model has a certain increasing degree of complexity as the number of parameters to be estimated increases [7].
The simple construction of the PV cell ensures two differently doped semiconductor layers forming a PN junction when the irradiation exists; the cell absorbs the photons from incident light and yields carriers (or electron-hole pairs). This produces a potential difference across the junction. Then, the charge carriers jump to flow through the outer circuit. An ideal PV cell model is constituted by a photo current source connected with a diode in parallel. This is the simplest model that only has three unknown parameters to be estimated: the photocurrent Ipv, the ideality factor η, and the diode reverse saturation current Is.
However, the previous ideal model is not commonly used in PV simulations to explain the physical concepts of PV cells. A series resistance (Rs) added to the ideal model makes it more realistic. This resistance represents the contact resistance between the silicon and electrode surfaces [7]. A parallel resistance is also added to the diode Rp to consider the leakage current in the PN junction. This model is known as SDM and has five parameters to be estimated (Ipv, η, Is, Rs, and Rp) [8]. The DDM can be considered as a more accurate way of modeling PV cells. It considers the depletion region current loss recombination. With an additional parallel diode, the resulting model now has seven parameters to be estimated (Ipv, η1, Is1, η2, Is2, Rp, and Rs) [9]. Although the models mentioned above are the ones most used in the literature, there are other PV cell models. The single diode model with capacitance [10], drift-diffusion model [11], three-diode model [1,12], multi-dimension diode model [13], and modified two diode models are some examples of different improved representations of PV cells. An improved model was applied for organic solar cells in [14]. Reference [15] reviews the methods that were developed for finding the optimal parameters of various solar cell models. As the need of finding the best model is of interest, recently, a modified two diode model was presented to cover the research gap of modeling the behavior of MCS solar cells, especially under low illumination conditions. That resulted in a need for more accurate models; for that reason, the modified DDM (MDDM) was proposed [14]. Here a modified TDM (MTDM) is explored to describe the physics of this type of PV cells more precisely. On the other hand, these methods were sought to arouse more accurate estimation techniques for the calculation of the parameters of each model. The main reason for this its large effect on the efficiency and maximum power point tracking computations. These estimation methods are split into three main categories, namely, analytical approaches, meta-heuristic optimization techniques, and hybrid methods from the two previous categories [15].
Finding the parameters of these models is of interest to many researchers. These algorithms have been applied for optimizing the PV cells parameters of SDM and DDM but there is a small number of works in this field for TDM and smaller for MDDM and almost no one for MTDM.
The recent advanced methods for parameter estimation of PV cells can be summarized as follows:
  • In [16], the authors estimate the DDM, MDDM, and TDM parameters by using the moth-flame optimizer.
  • In [17], the bacterial foraging (BF) algorithm was developed to estimate the parameters for two operating conditions (normal and shading conditions);
  • In [18], the generalized oppositional teaching-learning optimizer was employed to estimate the parameters and speed up the conversion process.
  • In [19], two methods are used to estimate the PV cell parameters based on differential evolution accomplished with an iteratively updated mutation effect and the other one is a hybrid evolutionary algorithm. It was noticed that these two methods have good performance and high accuracy.
  • In [20], another method called the flower pollination algorithm was proposed for low solar irradiance levels. The estimated and experimental results are almost identical.
  • The artificial bee colony algorithm was employed in [21] to identify solar cell parameters.
  • In [22], the artificial bee swarm optimizer was used for parameter identification based on the PV cell single- and double- diode models.
  • A harmony search-based algorithm was introduced to estimate the unidentified solar cell parameters with the usage of single- and double-diode models in [23];
  • A simulated annealing algorithm [24] estimated the parameters of different solar cell models, namely single-, double-diode models and photovoltaic module. They help to verify the proposed approach outcomes.
  • The pattern search [25] and genetic algorithms [26] estimated the parameters of SDM and DDM.
  • Bird mating optimizer [27] estimates the parameters of a PV solar array that is modeled by SDM.
  • In [6], a modified DDM analysis of MCSSC at low illumination levels was presented.
  • In [28], a procedure based on three points approach was developed for PV parameters estimation.
  • In [29], the PV crystalline-silicon modules are represented by various parameters with a single exponential model.
  • In [30], another optimization algorithm called the moth-search optimizer was developed for the parameter estimation of three junction PV panels.
  • In [31], an improved shuffled complex evolution algorithm was developed for estimating the parameters of solar cells.
  • In [32], the coyote optimization algorithm is proposed for parameter estimation of the three-diode model of solar cell and models. The considered TDM doesn’t consider the recombination defects in the solar cell.
  • An extensive review presenting the available approaches for the PV parameter estimation was presented in [33].
  • In [34], an interval branch and bound optimization algorithm were proposed for parameter estimation of three photovoltaic models while the EHO was presented for extracting the parameters using three Perovskite solar cell models which represent the third generation of solar cells [35].
  • In [36], the forensic optimization algorithm was developed for parameter extraction of three solar cell models.
In the previous survey, the main models that represent solar cells as single-, double, and triple diode models were reported. Several optimization methods were developed to find the optimal parameters of each model. The number of variables varied from five unknowns to nine unknowns. Finding both a suitable model and the best parameters of the suggested model is still an open research area. In this regard, this paper is concerned with dealing with both aspects: finding a more accurate model by proposing a modified three diode model and proposing two soft paradigms for finding the optimal parameters of the modified three diode model (MTDM) that is proposed for the first time in this work. The MTDM offers a more accurate physical representation for different solar cell types under different operation conditions. Therefore, these models are efficient in dealing with the natural characteristics of the MCS solar cell. In this work, the proposed models are investigated based on experimental data reported in the previous literature.
In the direction of soft computing, two methods are considered in the current work. A well-established particle swarm optimization (PSO) version is presented for the parameter estimation of the proposed models. The proposed version is developed to speed up the convergence to reduce the number of iterations and to enhance the overall solution quality. Added to that, it continuously modulates the inputs of each iteration with the aid of the fitness and control variables obtained from the previous iteration. The closed-loop particle swarm optimization (CLPSO) is proposed in this study. Also, anew swarm search-based method called elephant herding optimization (EHO), which mimics the behavior of elephant groups, is tested in this paper. The EHO algorithm finds much fitter solutions compared to DE, GA, and BBO for most benchmark problems [37].
This study provides a bi-dimensional assessment study. The first one assesses the proposed MTDM versus MDDM, while the second dimension represents an assessment of the quality of the solutions obtained by the two soft computing paradigms. The main contributions of the current study can be summarized as follows:
  • The novel application of two soft computing techniques for estimating the parameter of MSC solar cell models.
  • The proposed novel pattern of the MSC solar cell with a modified three diode model.
  • The performance evaluation of two competitive optimization algorithms.
  • The simulation results in high accuracy of the proposed MTDM, which are assessed with DDM and MDDM.
The coming sections of this work are ordered as follows: Section 2 illustrates the photovoltaic (PV) models. The parameter estimation problem formulation is presented in Section 3. Section 4 presents the proposed soft parameter estimation paradigms CLPSO and EHO. Section 5 describes the evaluation, simulation, and results which will be discussed. Finally, Section 6 of this paper contains its conclusions and outcome.

2. Photovoltaic Modeling

The PV cells have been investigated using many electronic models to describe their natural characteristics. The importance of MSC solar cells creates a need for more complicated models to include the different effects of grains and grain boundaries in addition to the leakage, recombination, and other effects [12,38].

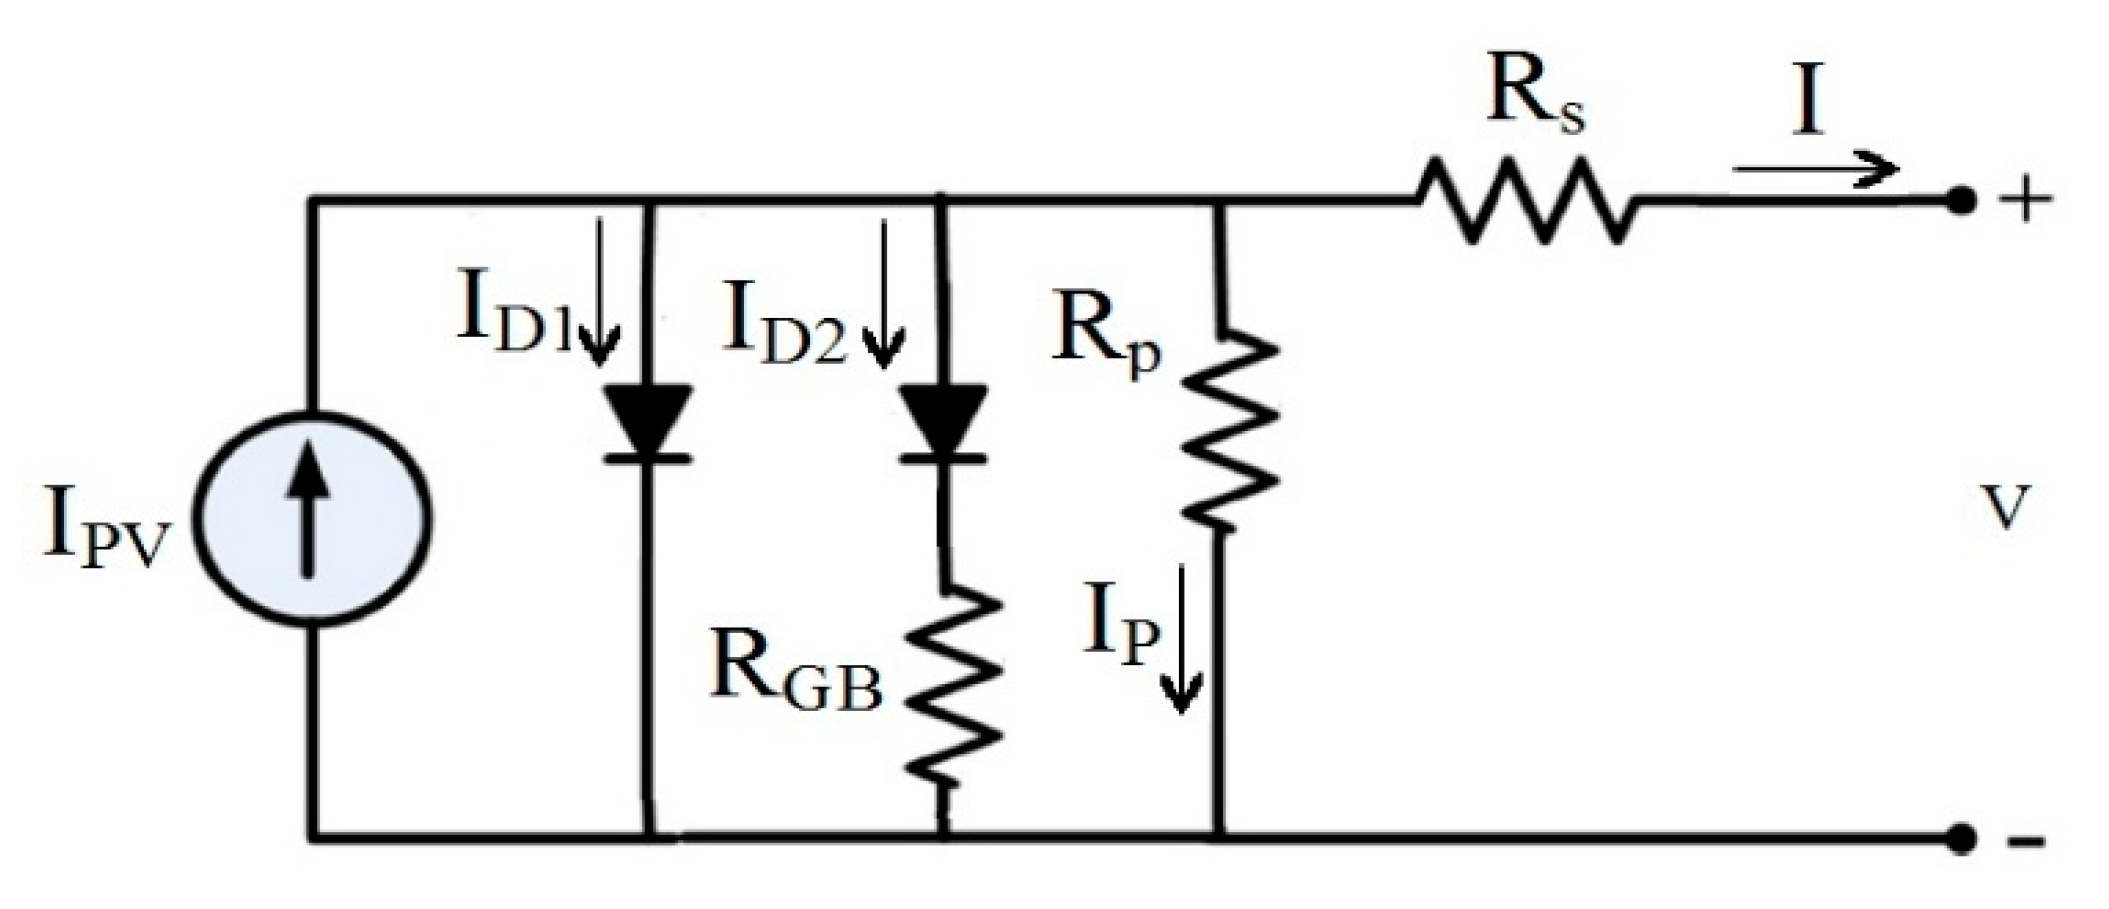
2.1. MDDM Representation

When irradiation exists, the P–N junction uses the energy of photons to produce electron-hole pairs [15]. A potential difference across the junction arose and carriers starts to flow in the circuit, so the elementary description of an illuminated PV cell is a current source (IPV) in parallel with a P–N junction diode (D1). Another diode (D2) is added to consider the effect of recombination current loss in the depletion region in the model of a PV cell. RGB is a series resistance connected to the second diode (D2) to take into consideration the resistivity in the vicinity of grain boundaries as it is higher than the resistance within the crystallites [16]. RS is a series resistance that represents the effect of the contact resistance between silicon and electrode surfaces, the resistance of electrodes, and the current flow resistance. RP is a parallel resistance that should be added to consider the effect of the leakage current of P–N junction. The above-described model is shown in Figure 1.
The mathematical equations of this approach are formulated as follows:
I D 1   = I s 1 [ exp ( V + I R s η 1 V T ) 1 ]
in which IS1 is the reverse saturation current, η1 is the ideality factor of (D1), I and VT are given by:
I = I P V     I D 1   I D 2     I P  
and:
V T = K B T / q
where, KB is Boltzmann’s constant, T is the absolute temperature, and q is the electron’s charge. The currents ID2 and IP are calculated by:
I D 2   = I s 2 [ exp ( V + I R s I D 2   R G B η 2 V T ) 1 ]
and:
I P   =   V + I R s R P
where IS2 is the reverse saturation current, η2 is the ideality factor of (D2), and V is the cell output voltage. The IPV, IS1, η1, IS2, η2, RGB, RP, and Rs are the eight parameters that would be estimated.

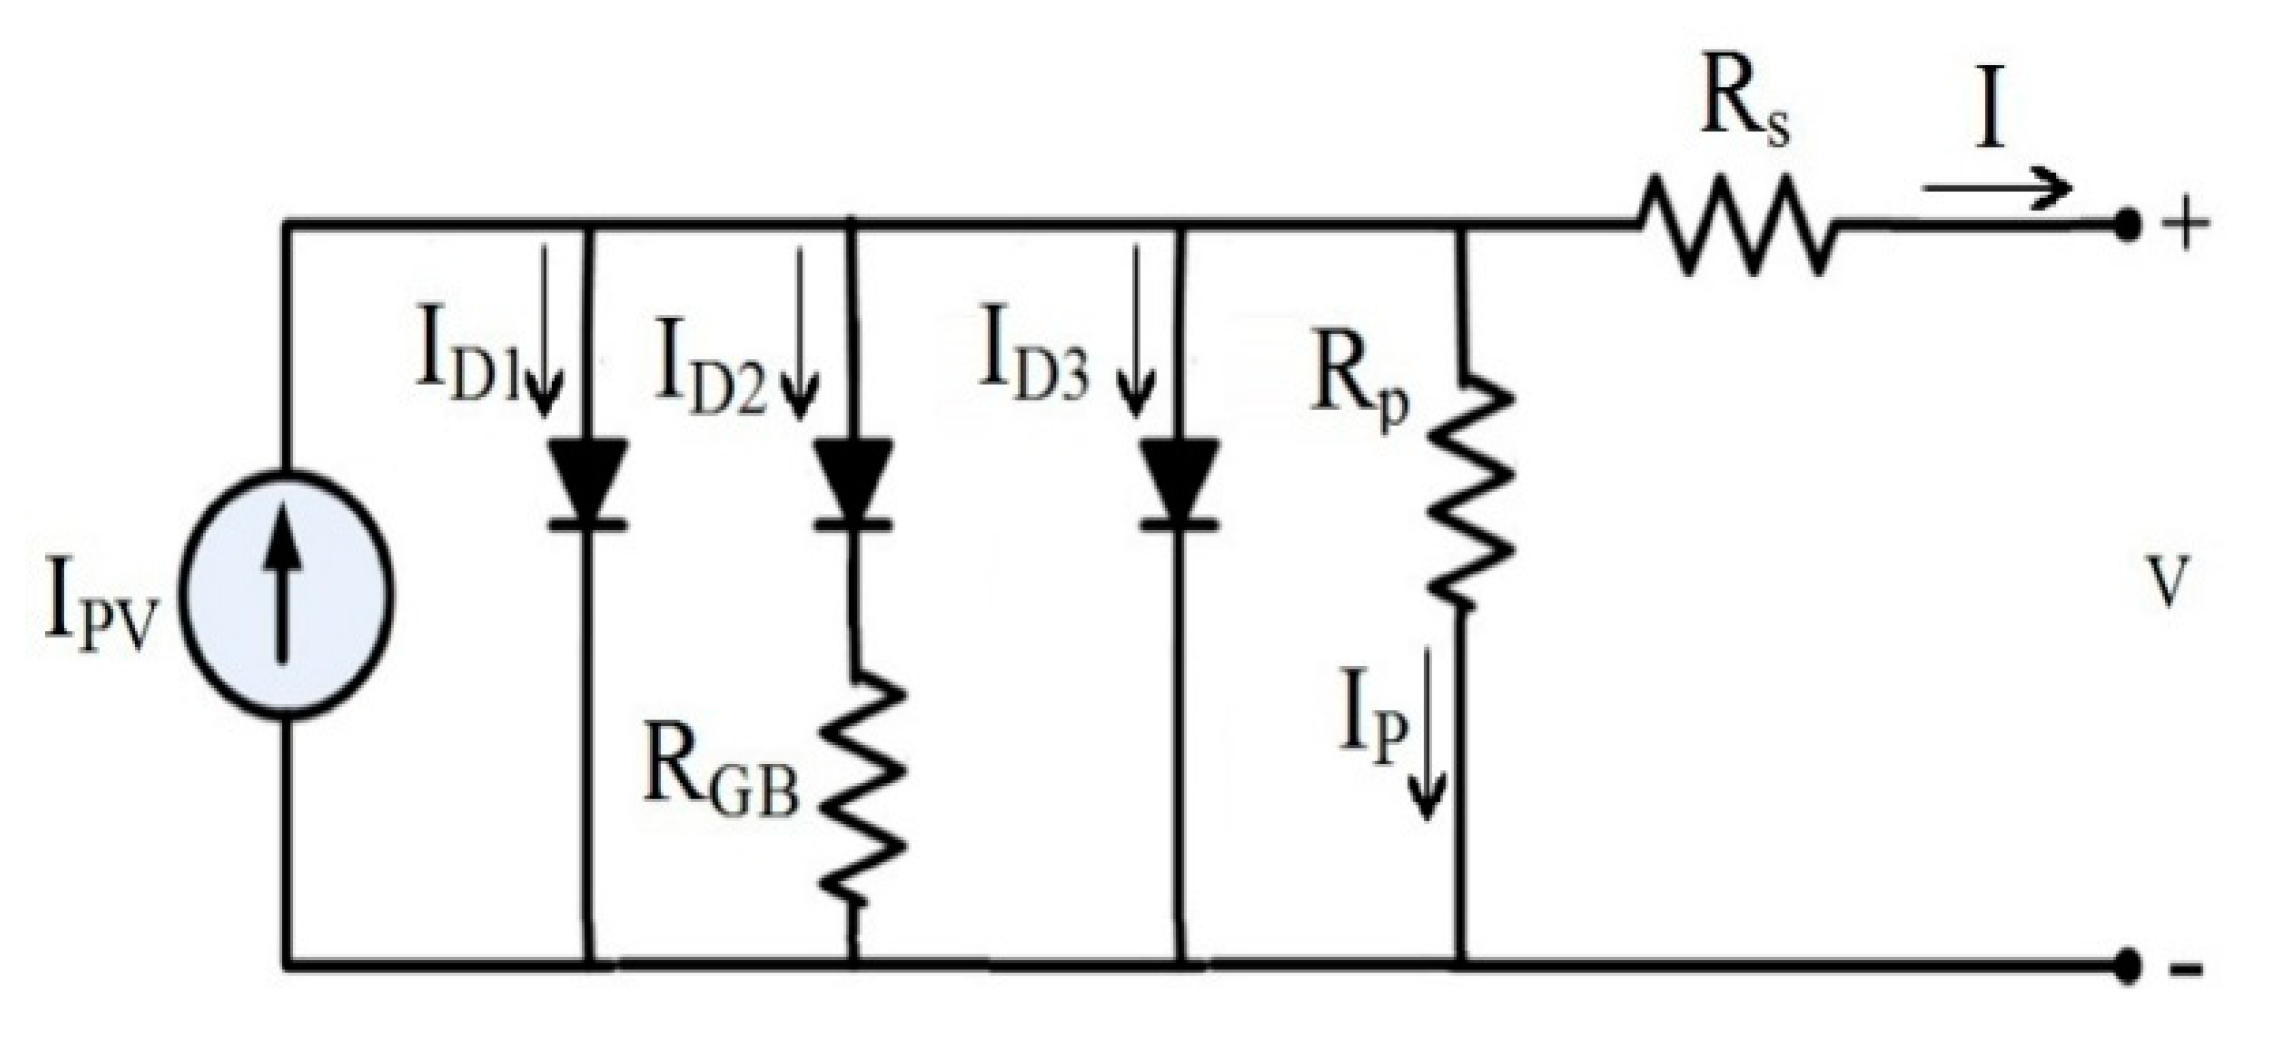
2.2. MTDM Representation

A third diode (D3) is introduced to account for the recombination in the defect region, boundaries of the grains, and the large leakage current [17] as shown in Figure 2.
Now the current equation would be:
I = I P V     I D 1   I D 2   I D 3     I P  
I D 3   = I s 3 [ exp ( V + I R s η 3 V T ) 1 ]          
where IS3 is the reverse saturation current and η3 is the ideality factor of (D3).

3. Problem Formulation

The purpose of the modeling process of PV cells is to establish the most suitable circuit equivalent to the physical processes that occur during the operation of the cells. The next step is to estimate these circuit parameters at a minimum error level between the experimental data and the calculated data, e.g., at the highest closeness between experimental and calculated data. The optimization process inputs are the solution vector (X), the boundary values of this vector, and the objective function which indicate the best approximation of the parameters. The solution vector is defined as follows:
  • There are eight elements in the solution vector for the MDDM arranged as follows: X = (IPV, IS1, η1, IS2, η2, RGB, RP, RS).
  • There are ten elements in the solution vector for the MTDM arranged as follows: X = (IPV, IS1, η1, IS2, η2, RGB, RP, RS, IS3, η3).
The parameters upper and lower limits are selected as in [18]. The root mean square error (RMSE) has been chosen as the objective function and is calculated as follows:
R M S E =   1 N ( I I e x p ) 2
where N is the number of data entries from the measuring process. The utilized optimization methods explore the optimal MDDM and MTDM parameters considering minimum RMSE as the main objective function.

4. Proposed Soft Parameter Estimation Paradigms

In this paper, two soft parameter estimation paradigms are proposed. These methods are:

4.1. Closed-Loop Particle Swarm Optimization

Basically, the PSO is stimulated by the attitude of swarming through the process of finding food sources. Several applications with a number of modified versions of the PSO were presented in the literature as in [39,40,41,42,43]. The proposed CLPSO is a modified version of the standard PSO algorithm. It modulates the boundaries by considering feedback from the output parameters (control variables and fitness function) for improving the solution quality. PSO uses particles that represent the unknown parameters to be estimated. Every particle moves through the defined search domain to find a global solution. In the proposed CPSO, the control variables velocity and location can be obtained using the following Equations:
V n e w = V o l d +   c 1 · r a n d · ( P b e s t x o l d ) +   c 2 · r a n d · (   g b e s t x o l d )
x n e w = x o l d +   V n e w
where x o l d and V o l d are, respectively, represent the current particle position and velocity; P b e s t is the best individual particle position; g b e s t refers to the global best swarm position; the r a n d function refers to the number in the unity domain between (0, 1); constant c 1 ,   c 2 are called the conditioned learning factors by Equation (11) as:
c 1   +   c 2     4
The aim is to apply this algorithm to the proposed models of PV cells. Then the CLPSO is described as follows:
Step 1:
The positions and velocities of each swarm are started randomly.
Step 2:
The RMSE is used to evaluate the fitness of each particle.
Step 3:
For particles in the same position, their finesses are compared together to obtain the best position for a certain position. This is called the personal best Pbest. The personal best is updated at each iteration.
Step 4:
Choose the best fitness particle compared to all other particles in the historical Pbest archive to get the global best gbest;
Step 5:
Updating the velocity and position are carried out by Equations (9) and (10), respectively.
Step 6
Check the objective function if it has been improved and modulate the boundaries of the search space. The modified parameters’ boundaries are updated as Algorithm 1, where δ is the modulation parameter at iteration k.
Algorithm 1. Dynamic modification of control variable parameters
1: Read until iteration k
2: Update the control variables x using Equations (9) and (10)
3: Evaluate the fitness function RMSEk
4: Update the upper and lower limits
5:       ifRMSEk < RMSEk-1
6:              take    ( U p p e r   l i m i t ) k   =   ( U p p e r   l i m i t ) k 1 ( ( U p p e r   l i m i t ) k 1 x k ) . δ
7: ( L o w e r   l i m i t ) n e w   =   ( L o w e r   l i m i t ) o l d +   ( x n e w ( L o w e r   l i m i t ) o l d ) . δ
8:       else
9:              take   ( U p p e r   l i m i t ) k   =   ( U p p e r   l i m i t ) k 1
10: ( L o w e r   l i m i t ) k   =   ( L o w e r   l i m i t ) k 1
11:      end if
12:k = k + 1
13: Go to Step 2, and the procedure described above is repeated until the stopping criteria are satisfied

4.2. Elephant Herd Optimization

The second soft computing paradigm is called the elephant herd optimization algorithm. Its nature emulates the life of elephants that live in social groups with a few clans. Each clan lives under the leadership of female elephants. Besides, male elephants live separately from the clan. Male elephants leave their clans while they are growing up. To emulate this elephant behavior to solve optimization problems, the EHO algorithm applies three main rules [4,37]:
(1)
Building the population of elephants: in this rule, a certain number of clans with fixed male and female elephants are considered.
(2)
A mutation process that identifies a fixed percentage of the male elephant will be excluded and live outside their clan.
(3)
Identify a female elephant to be the clan leader.
The proposed EHO is described in the following sequence:
  • The initial population of elephants is randomly created.
  • The population size is divided into a defined number of clans.
  • Compute the fitness function of each population element.
  • According to their elephant fitness function, updating each clan individually by applying clan operator using Equation (12). The old positions ( x c i , j ) or elephant j in the clan c i can be updated to new positions as x n e w , c i ,   j   as :
x n e w ,     c i , j =   x c i , j   +   α   × ( x b e s t ,   c i   x c i ,   j )   ×   r  
where α and rϵ[0, 1]. α is defined as the scale factor that finds the influence of matriarch c i on x c i , j . x n e w , c i , j represents matriarch c i ;
  • The following position is influenced by the matriarch c i ;
  • The updated fittest elephant is obtained from Equation (13) as:
x n e w , c i ,     j =   β   ×   x c e n t e r , c i
where βϵ[0, 1] and x c e n t e r , c i is the center of clan ci, and for the d-th dimension it can be calculated as:
x c e n t e r , c i =   1 n c i j 1 n c i x c i , j , d
where 1≤ d ≤ D refers to the dimension at the dth order, and the total dimension is abbreviated by D. n c i refers to the number of elephants in the clan c i . x c i , j , d refers to the dth individual elephant x c i , j ;
  • Separating operator: this operator emulates the leaving of male elephants in their group and living alone. This separating process can be modeled as:
x w o r s t , c i =   x m i n + ( x m a x   x m i n + 1   ) × r a n d
where x m a x and x m i n are, respectively, the elephant individual position maximum and minimum boundaries. x w o r s t , c i refers to the poorest individual elephant in the clan ci. randϵ[0, 1];
Many points which can affect the results of the EHO algorithm are considered as drawbacks in EHO, such as generating the separating operator in Equation (15) that affects x w o r s t ,   c i by creating a new member that may change to the worst member value. Then it is possible to say that Equation (15) does not guarantee one will get better values all the time.

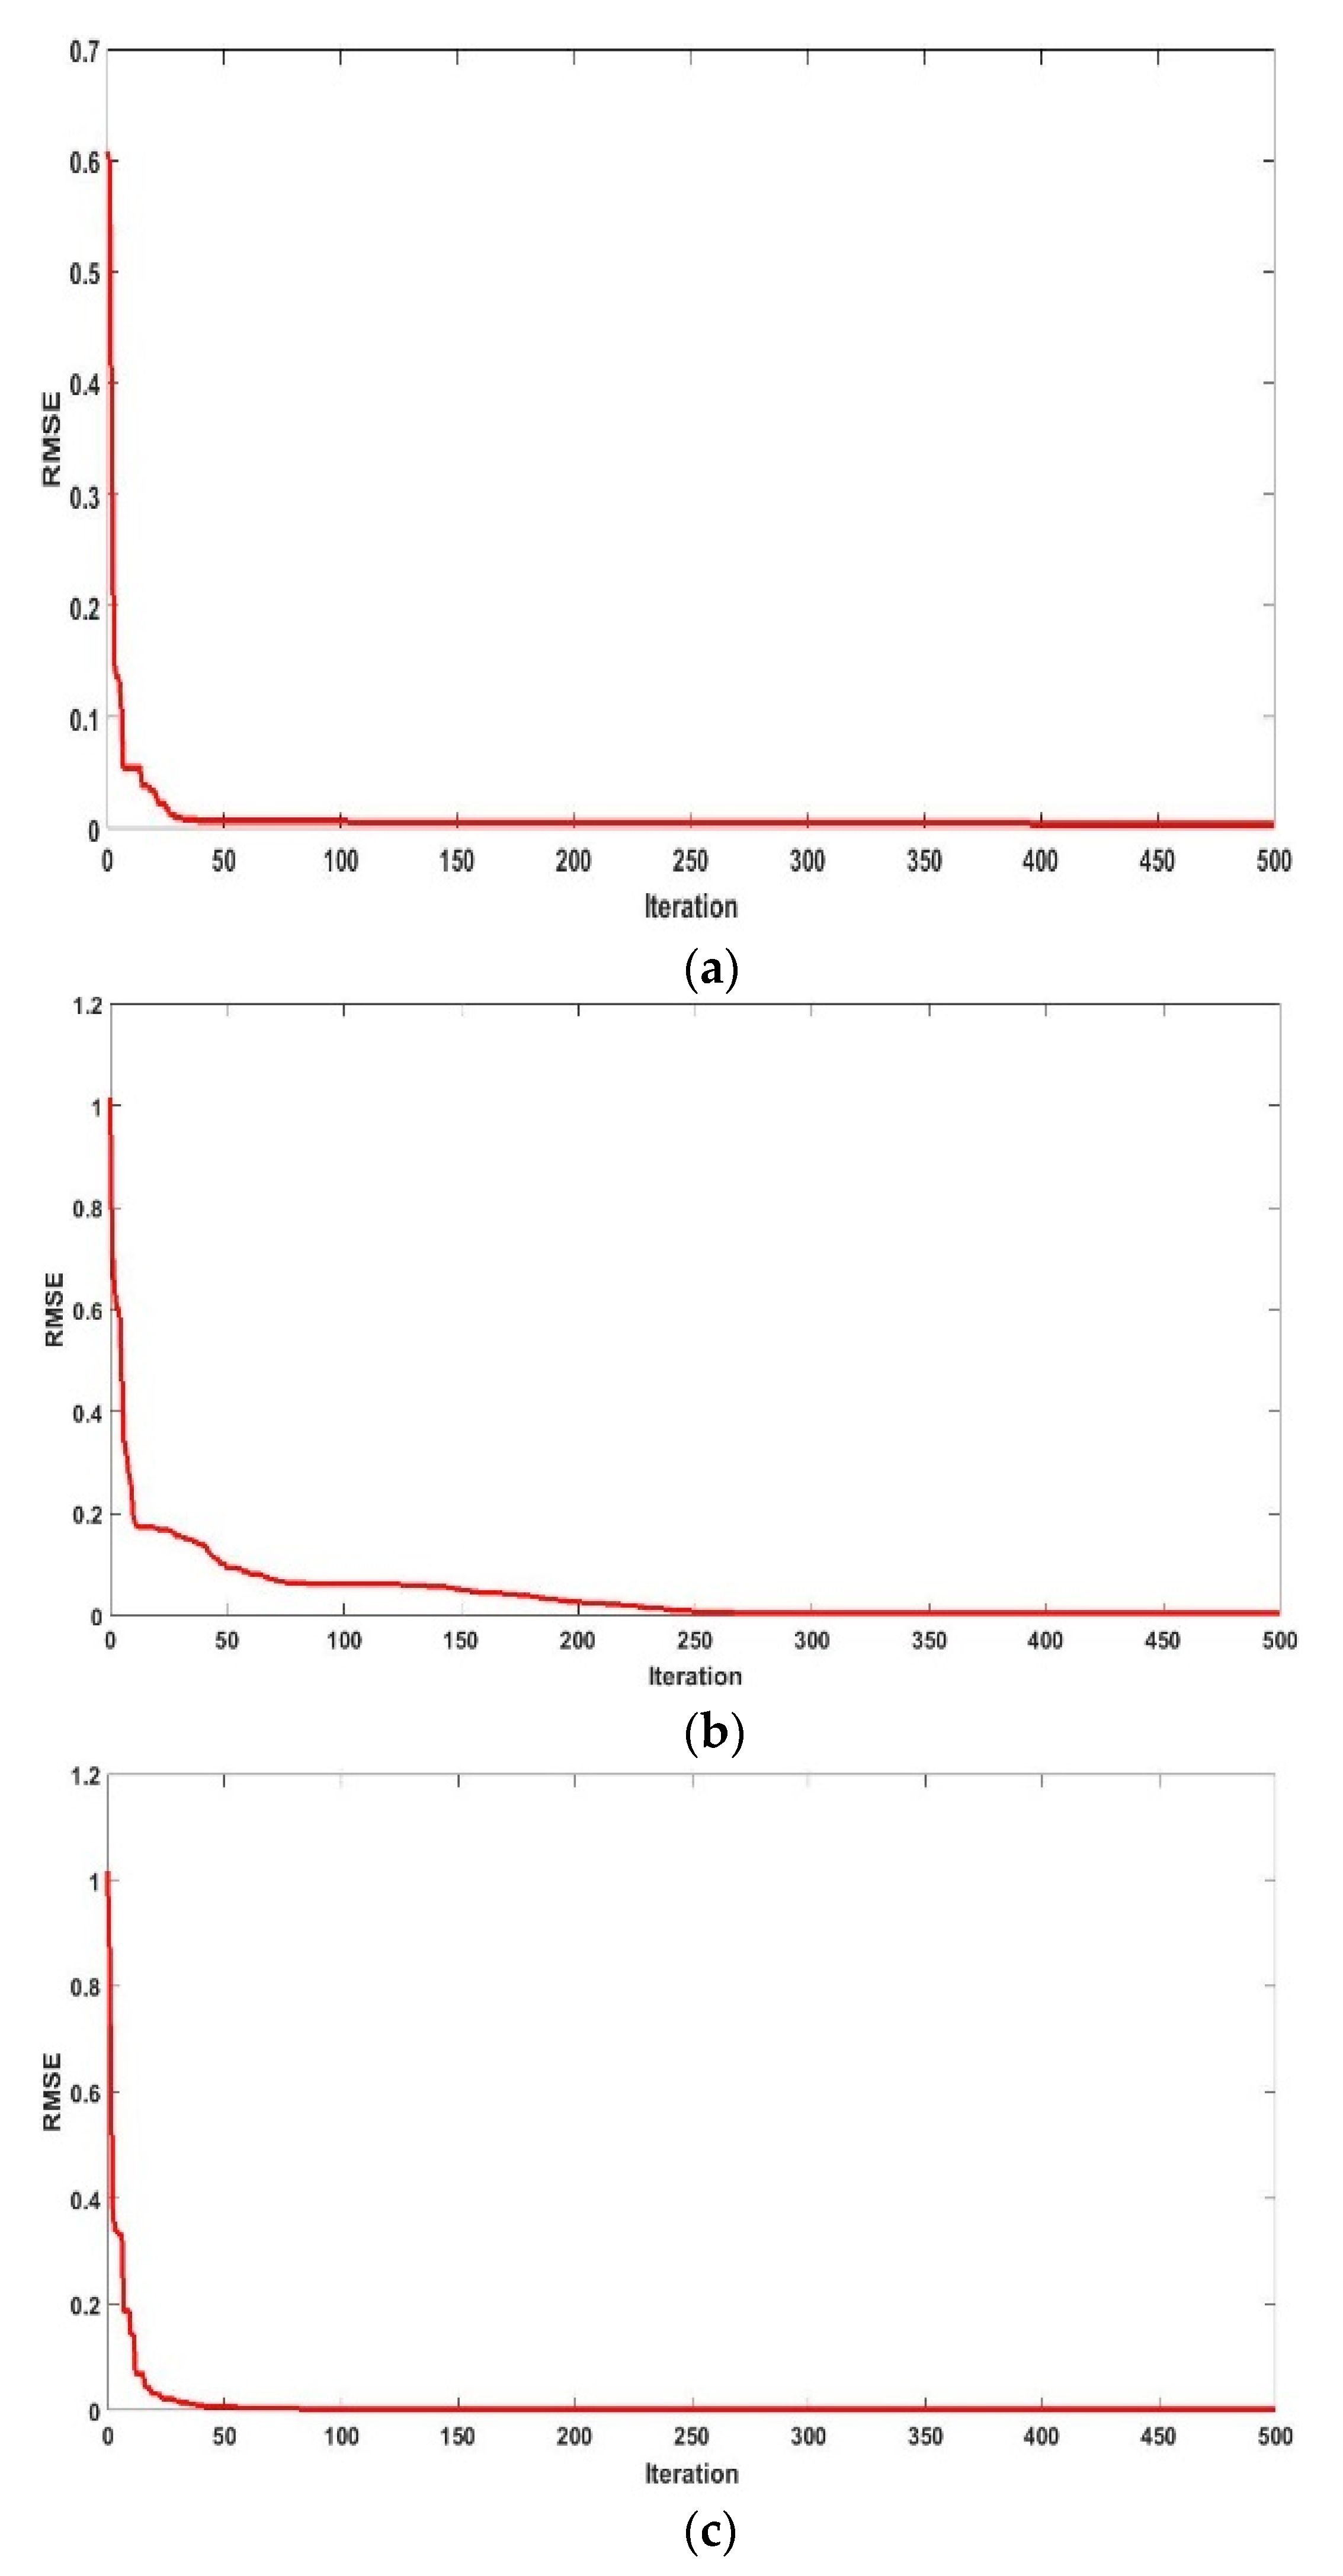
5. Results and Discussion

Two models called MDDM and MTDM are considered in this section for the solar cell parameters estimation problem using two CLPSO and EHO algorithms under different irradiance and temperature levels. The computation proceeds on a stated data in [12] for the 7.7 cm2—Q6-1380 multi-crystalline solar cell at low irradiation level and also a CS6P-240P solar module under different irradiance, temperature levels, and a 57 mm diameter commercial silicon solar cell (R.T.C. France) at 1000 W/m2 [43] are implemented. The cell (I-V) curves are obtained from [12]. The studied models are introduced to emulate this cell. CLPSO and EHO algorithms are applied to the two models to extract their unknown parameters.
Table 1 reports the open-circuit voltage and short circuit current for the tested cells at different irradiance and the corresponding fill factor for each case. It is noticed that a low fill factor (0.5404) of the Q6-1380, which is low. The fill factor is computed by using Equation (16) as:
Fill   factor   ( FF ) = P M P V O C   .     I S C

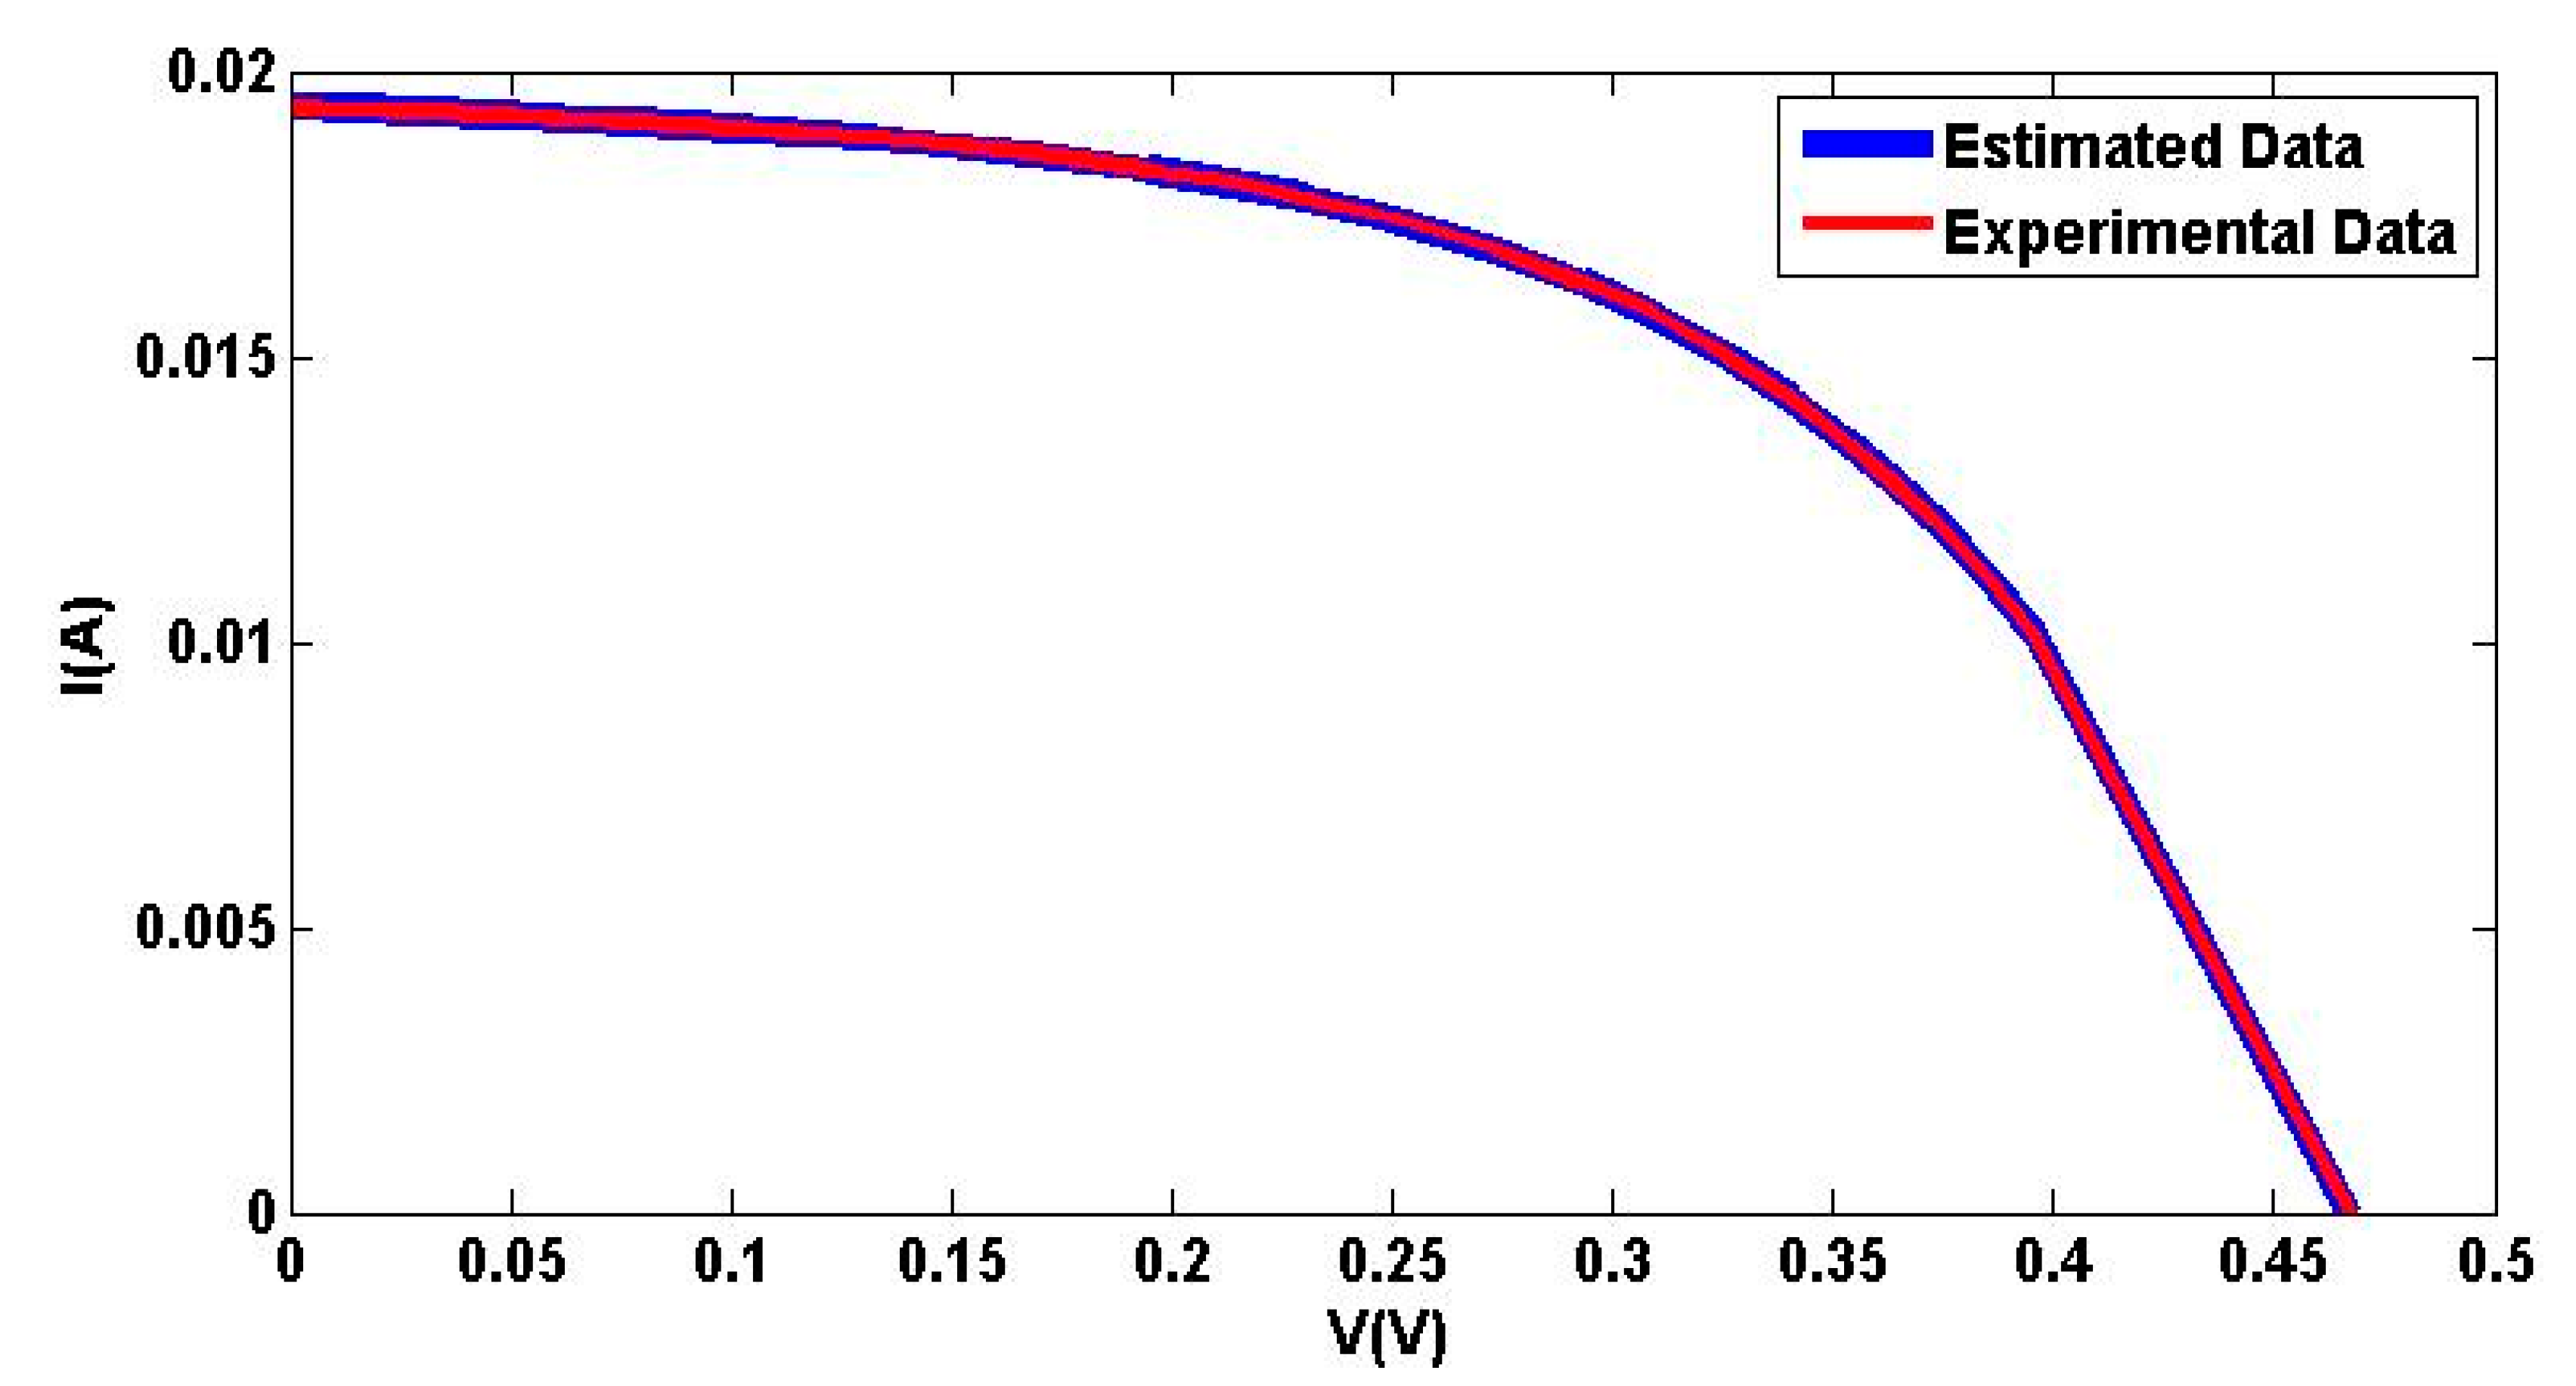
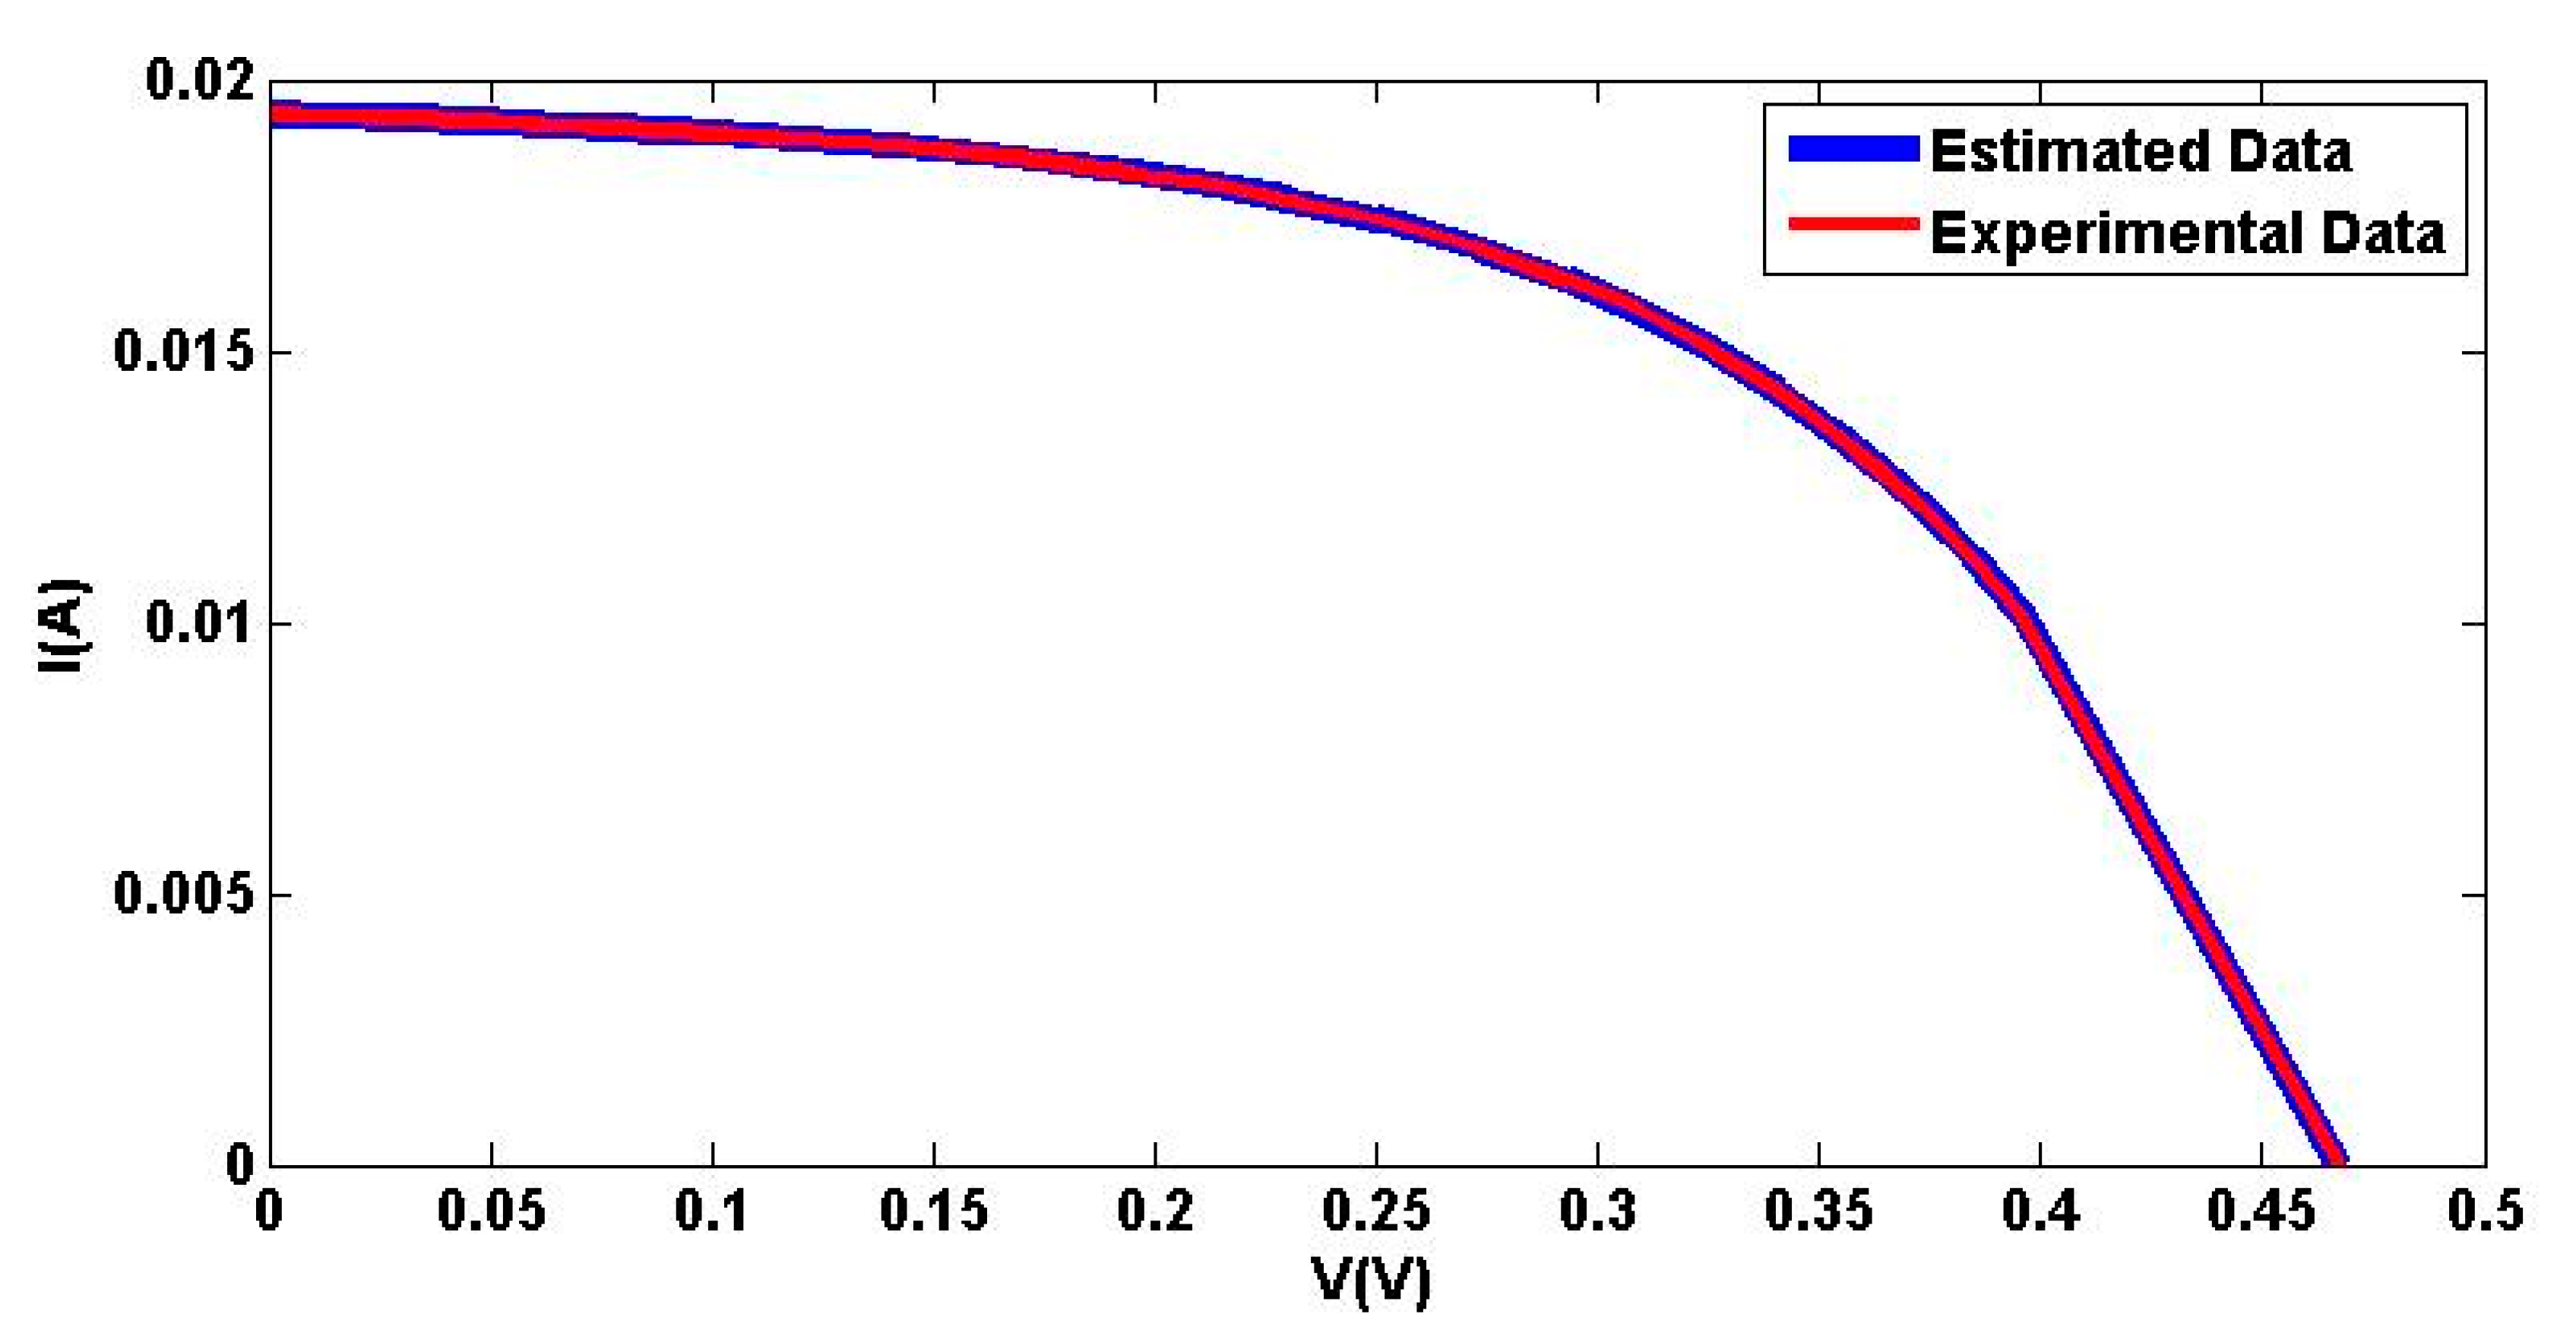
5.1. Simulation Results for a 7.7 cm2 Q6-1380 Multi-Crystalline Solar Cell

In Table 2, estimation of the unknown parameters is listed for the two considered models obtained with the two soft computing algorithms, the CLPSO and EHO algorithms, that are presented in Section 3 and Section 4. This table shows the settings of the eight and ten unknown parameters for the MDDM and MTDM, respectively. The fitness functions, that are obtained by CLPSO for the MDDM and MTDM, are 8.7545 × 10⁻⁵ and 5.9516 × 10⁻⁵, respectively. Thus, a reduction of 32.02% is achieved. The fitness functions that are obtained by EHO for the MDDM and MTDM are 1.823 × 10⁻⁵ and 1.4386 × 10⁻⁵, respectively, so a reduction of 21.12% is achieved. Therefore, we can conclude that MTDM leads to more accurate parameters compared with MDDM. From the viewpoint of the solution method, the EHO has the lowest fitness functions for both MDDM and MTDD compared with CLPSO, so we can say that the EHO is more reliable for solving the parameter estimation problem than CLPSO. In Table 3, the statistical indices of the studied cases are presented. Also, as shown in Table 2 and Table 3, the first rank in the reduction of the calculated RMSE is achieved by using the estimated parameters of the MTDM compared with the MDDM. On the other hand, the EHO method shows more accurate results but slower convergence than the CLPSO, as described in Figure 3, Figure 4, Figure 5 and Figure 6.
Moreover, it can be noticed that the EHO algorithm reaches the least level of the RMSE that is achieved for MTDM followed by EHO for MDDM, then MTDM by CLPSO, and at last MDDM by CLPSO. Furthermore, the EHO based estimated (I–V) characteristic is assessed versus experimental ones for MDDM and MTDM in Figure 7 and Figure 8, respectively, under low irradiation and at room temperature.
The above results prove that the MTDM has a better closeness to the reality compared to MDDM for MCSSC at low illumination. It is also clear that the EHO is a more accurate technique than CLPSO but slower than it. The results, after this research and referring to previous literature [16] for multi-crystalline solar cells, are that the MTDM has the best physical behavior accomplished by EHO algorithm that involves error analysis and (I–V) curves justification.

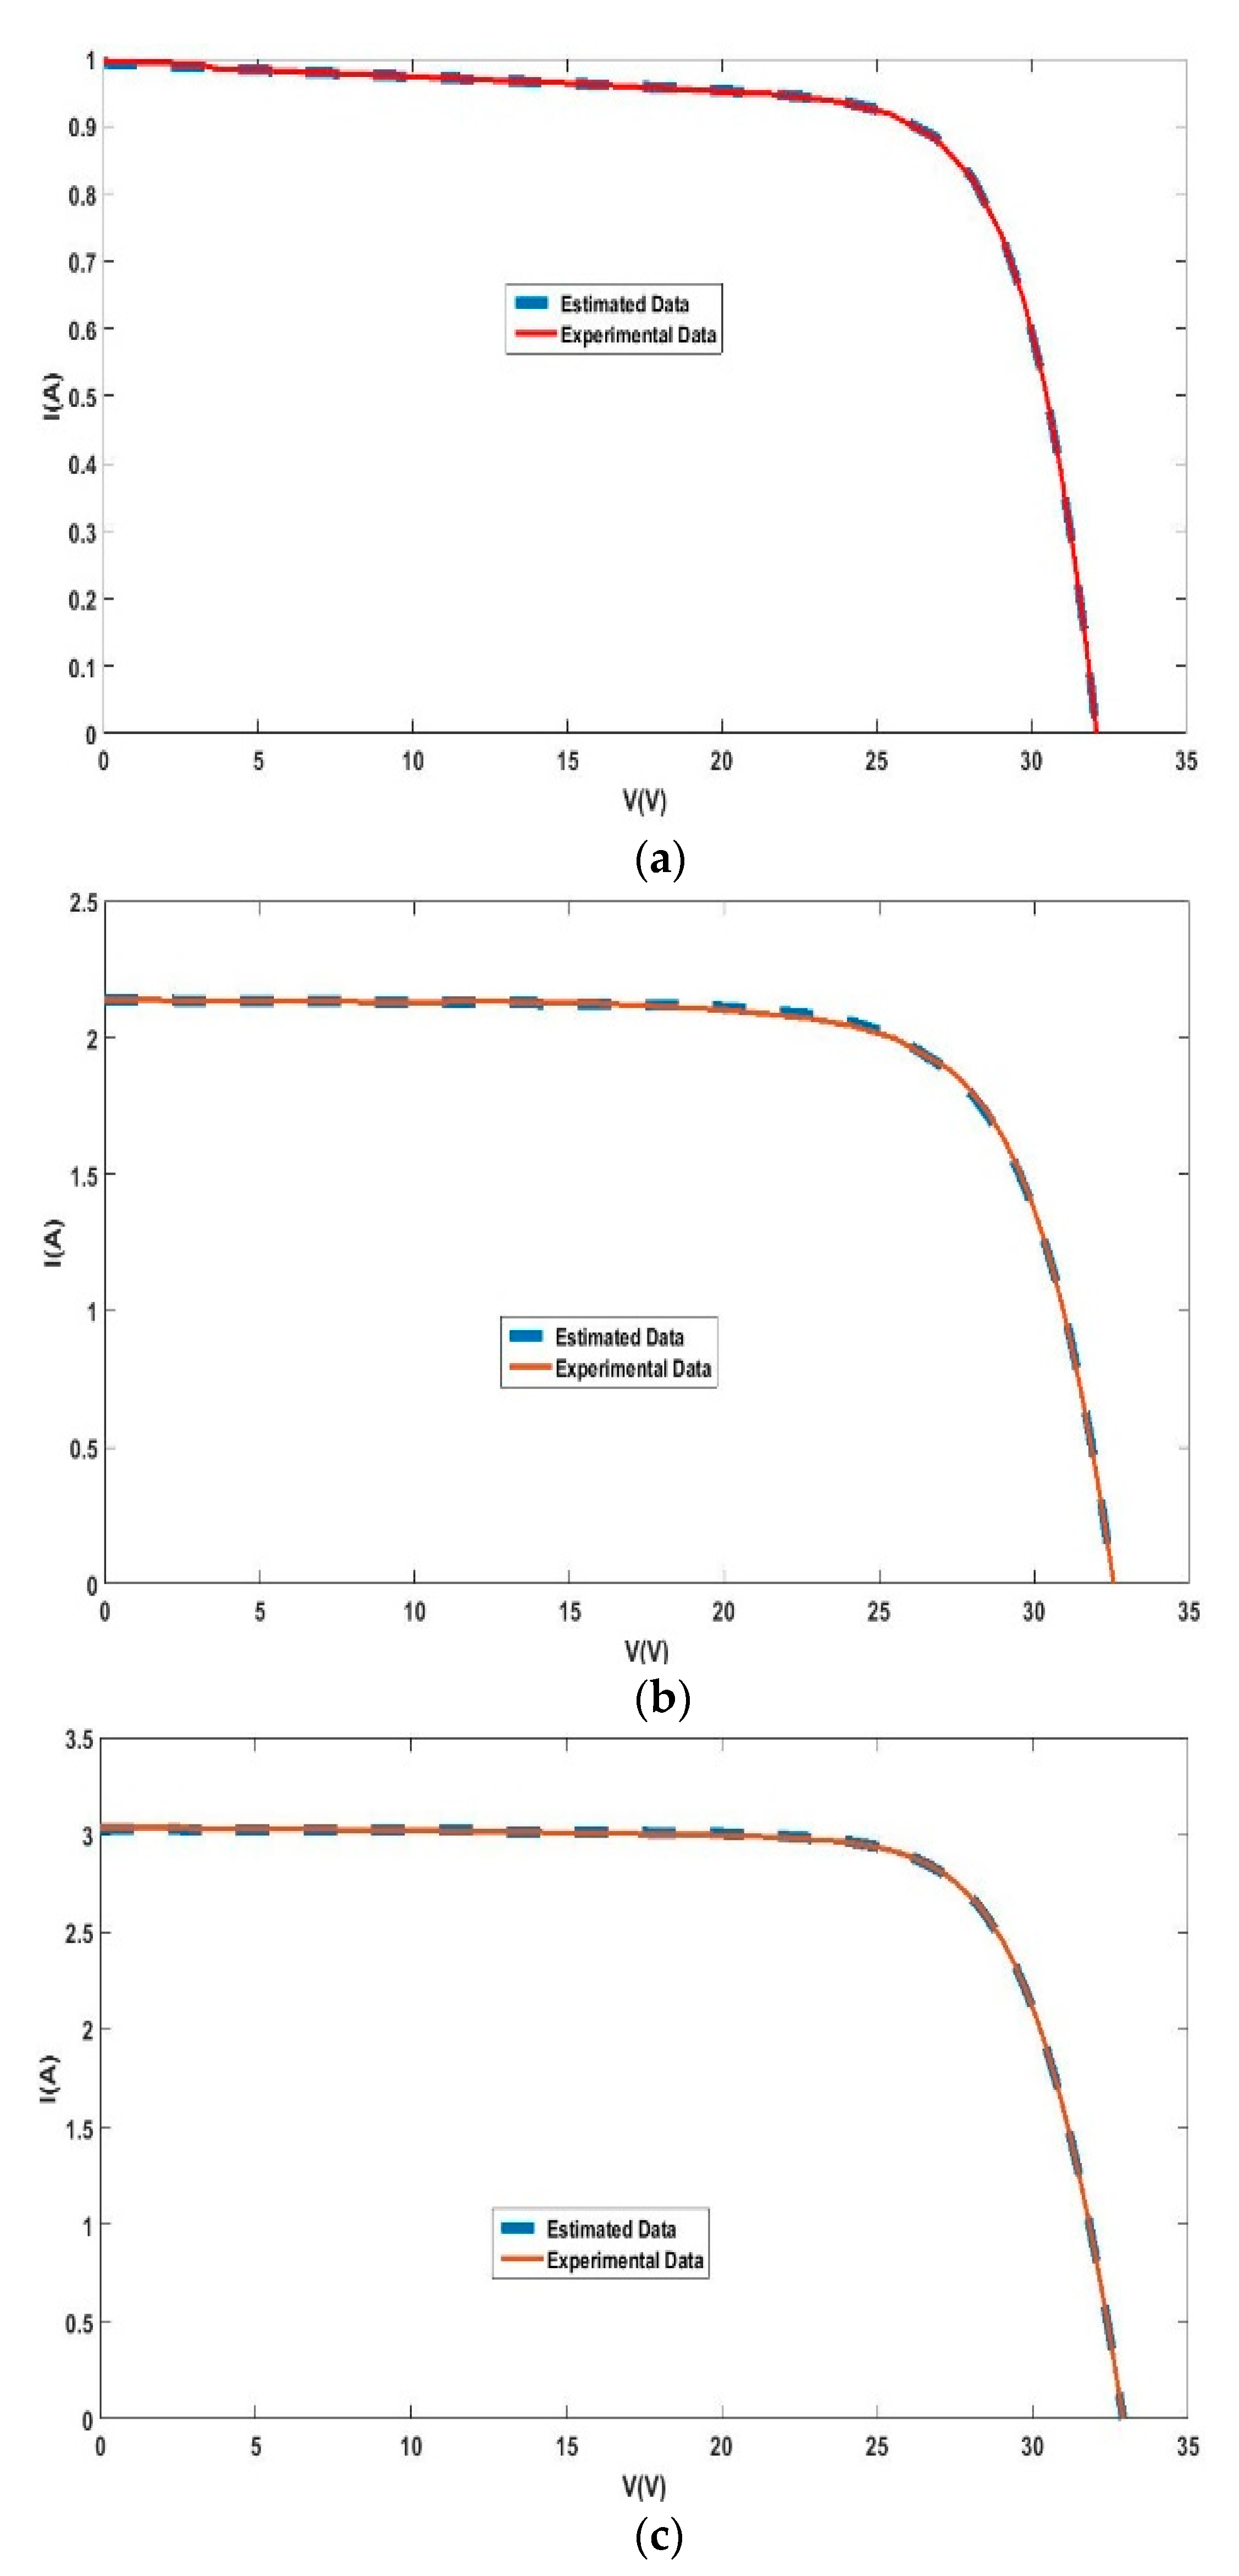
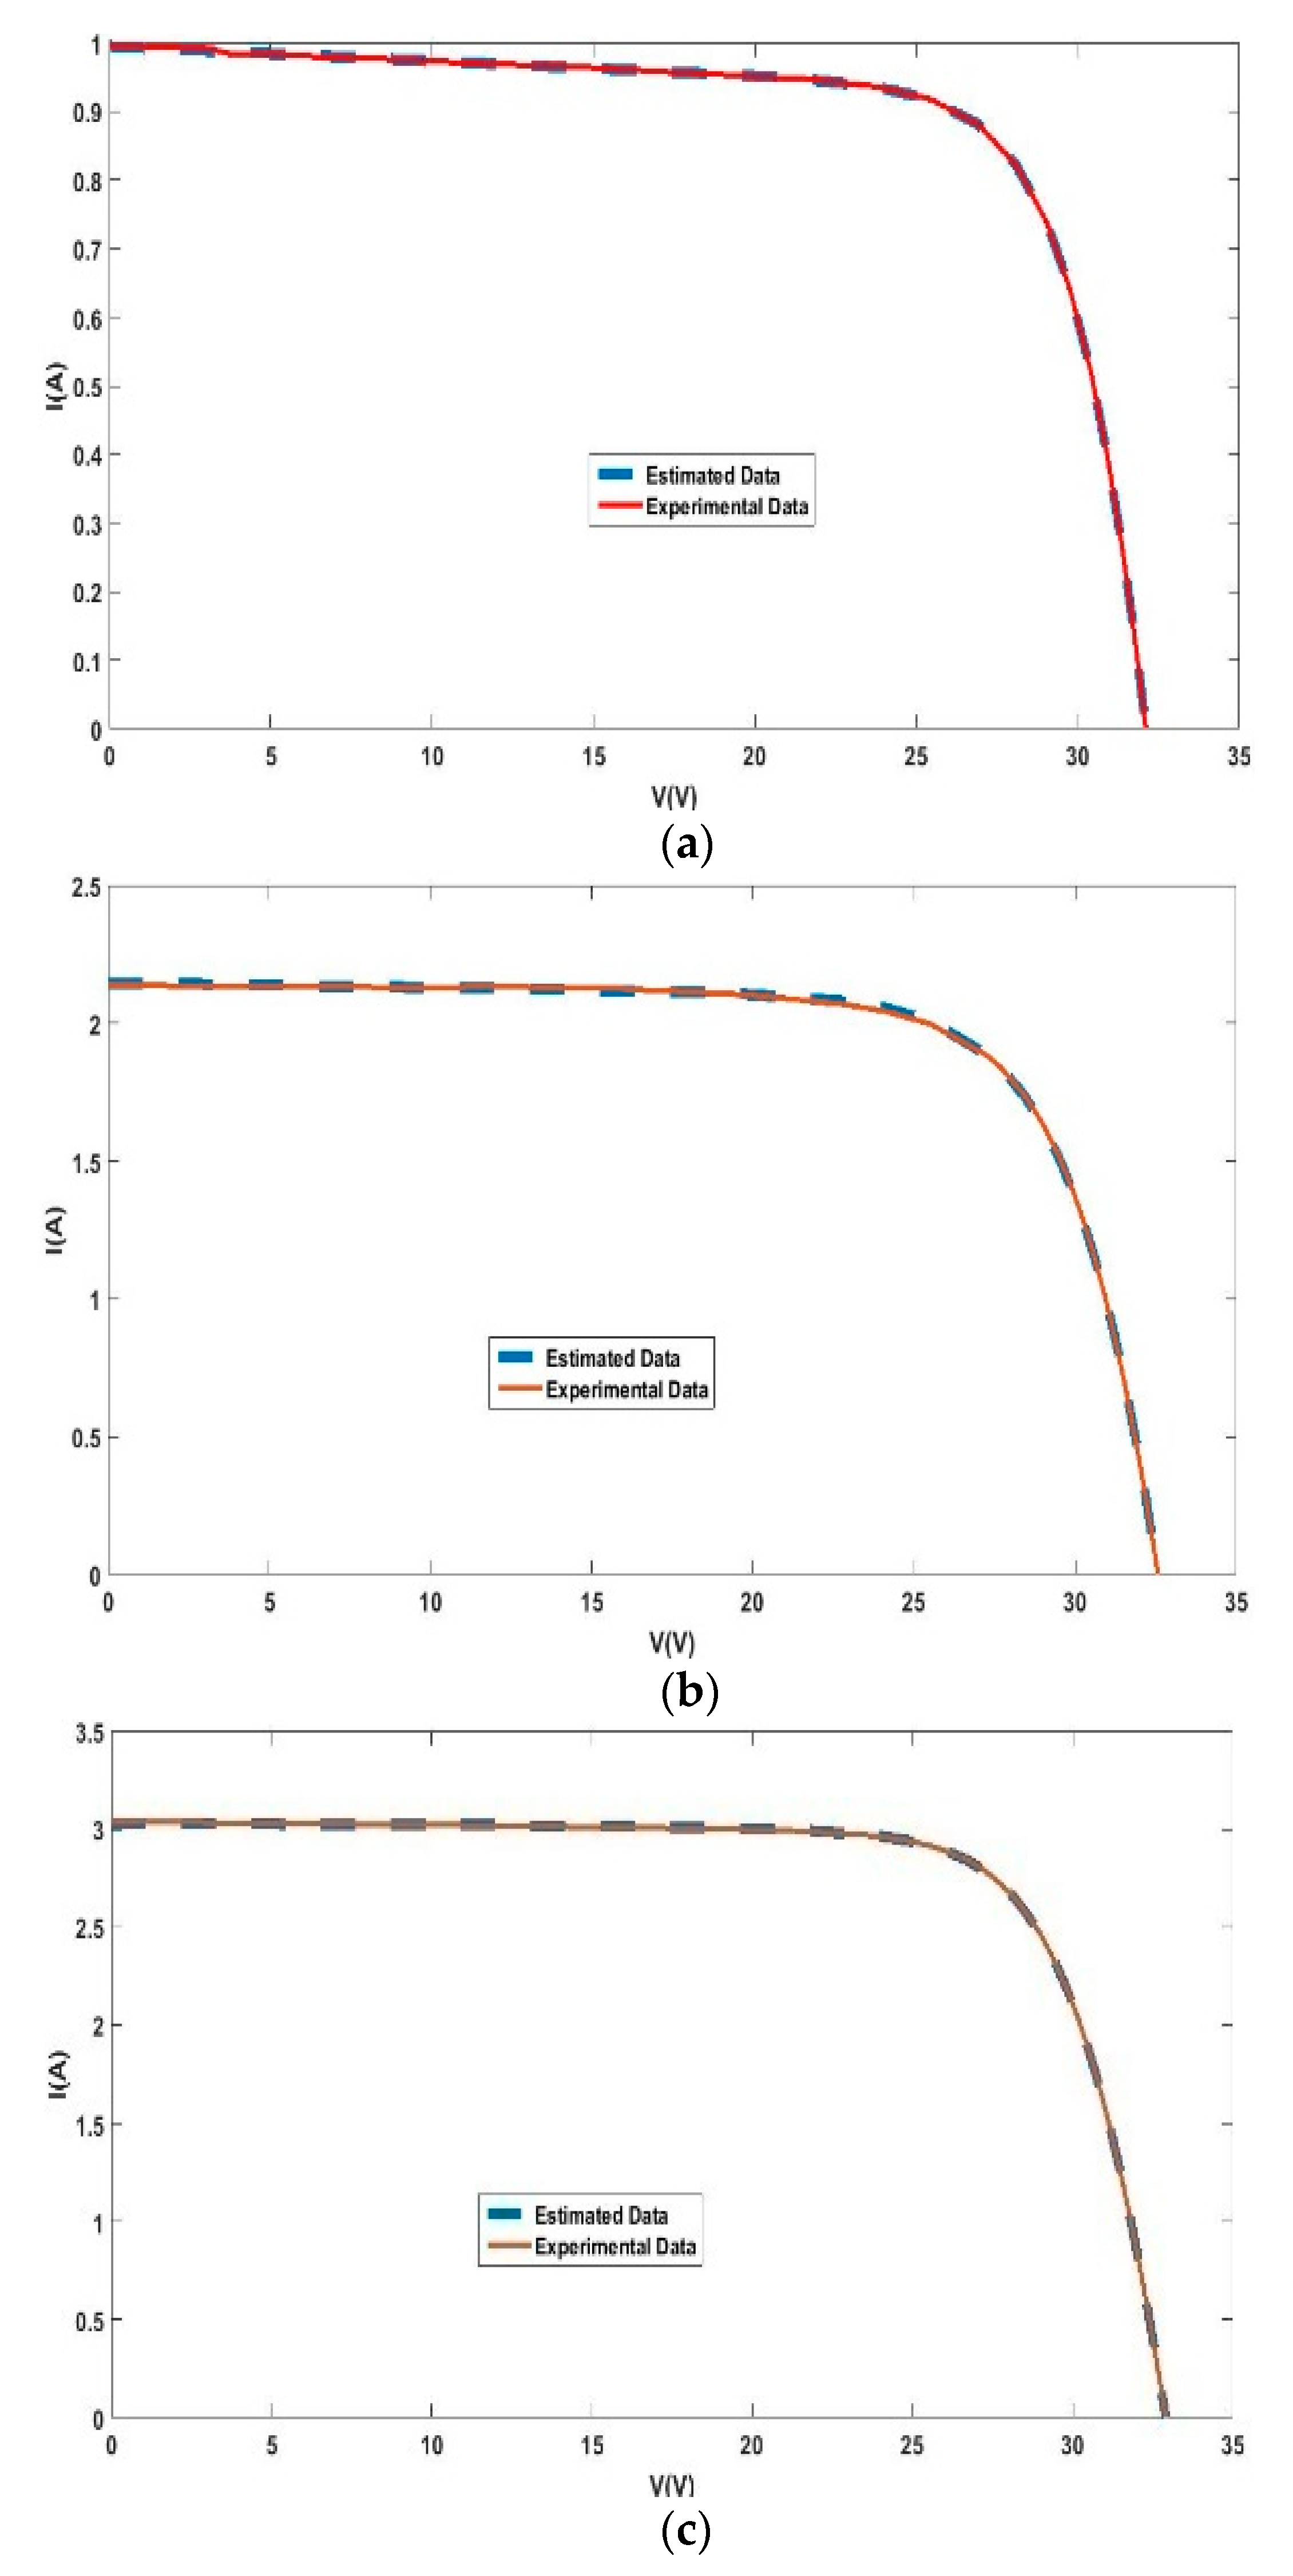
5.2. Simulation Results for a CS6P-240P Solar Module

As obtained in Section 5.1, it was proven that EHO has the lowest RMSE compared with CLPSO. Now we validate the EHO for the tested module (CS6P-240P solar module) to assess the performance of MTDM versus MDDM. Table 4 shows the settings of the extracted eight and ten unknown parameters for the MDDM and MTDM, respectively, at different irradiation levels of the CS6P-240P solar module by using EHO for the two modified double and triple diode models at irradiation levels of 109.2, 246.65 and 347.8 W/m2, respectively, while the corresponding temperature levels are: 310.32, 313.05 and 316.95 K, respectively. The fitness functions as shown in Table 5, that are obtained by EHO for the MDDM and MTDM are equal 0.0013393 and 9.6257 × 10⁻⁴, respectively, at 109.2 W/m2–310.32 K, and also equal 0.0055185 and 0.00385204, respectively at 109.2 W/m2–313.05 K and finally equal to 0.00385204 and 0.0029326, respectively at 109.2 W/m2–316.95K. The standard deviation for all tested cases has the lowest level based on MTDM compared with that obtained with MDDM, so we can say that the MTDM leads to more accurate parameters compared with MDDM at different environmental conditions of irradiation and temperature.
The statistical indices for the three cases studied are reported in Table 5. Figure 9 and Figure 10 show the convergence rates for the three cases studied using EHO for the MDDM and MTDM, respectively. Figure 11 and Figure 12 show that the extracted parameters lead to the high closeness between the estimated V-I curves using the MTDM compared with MDDM.

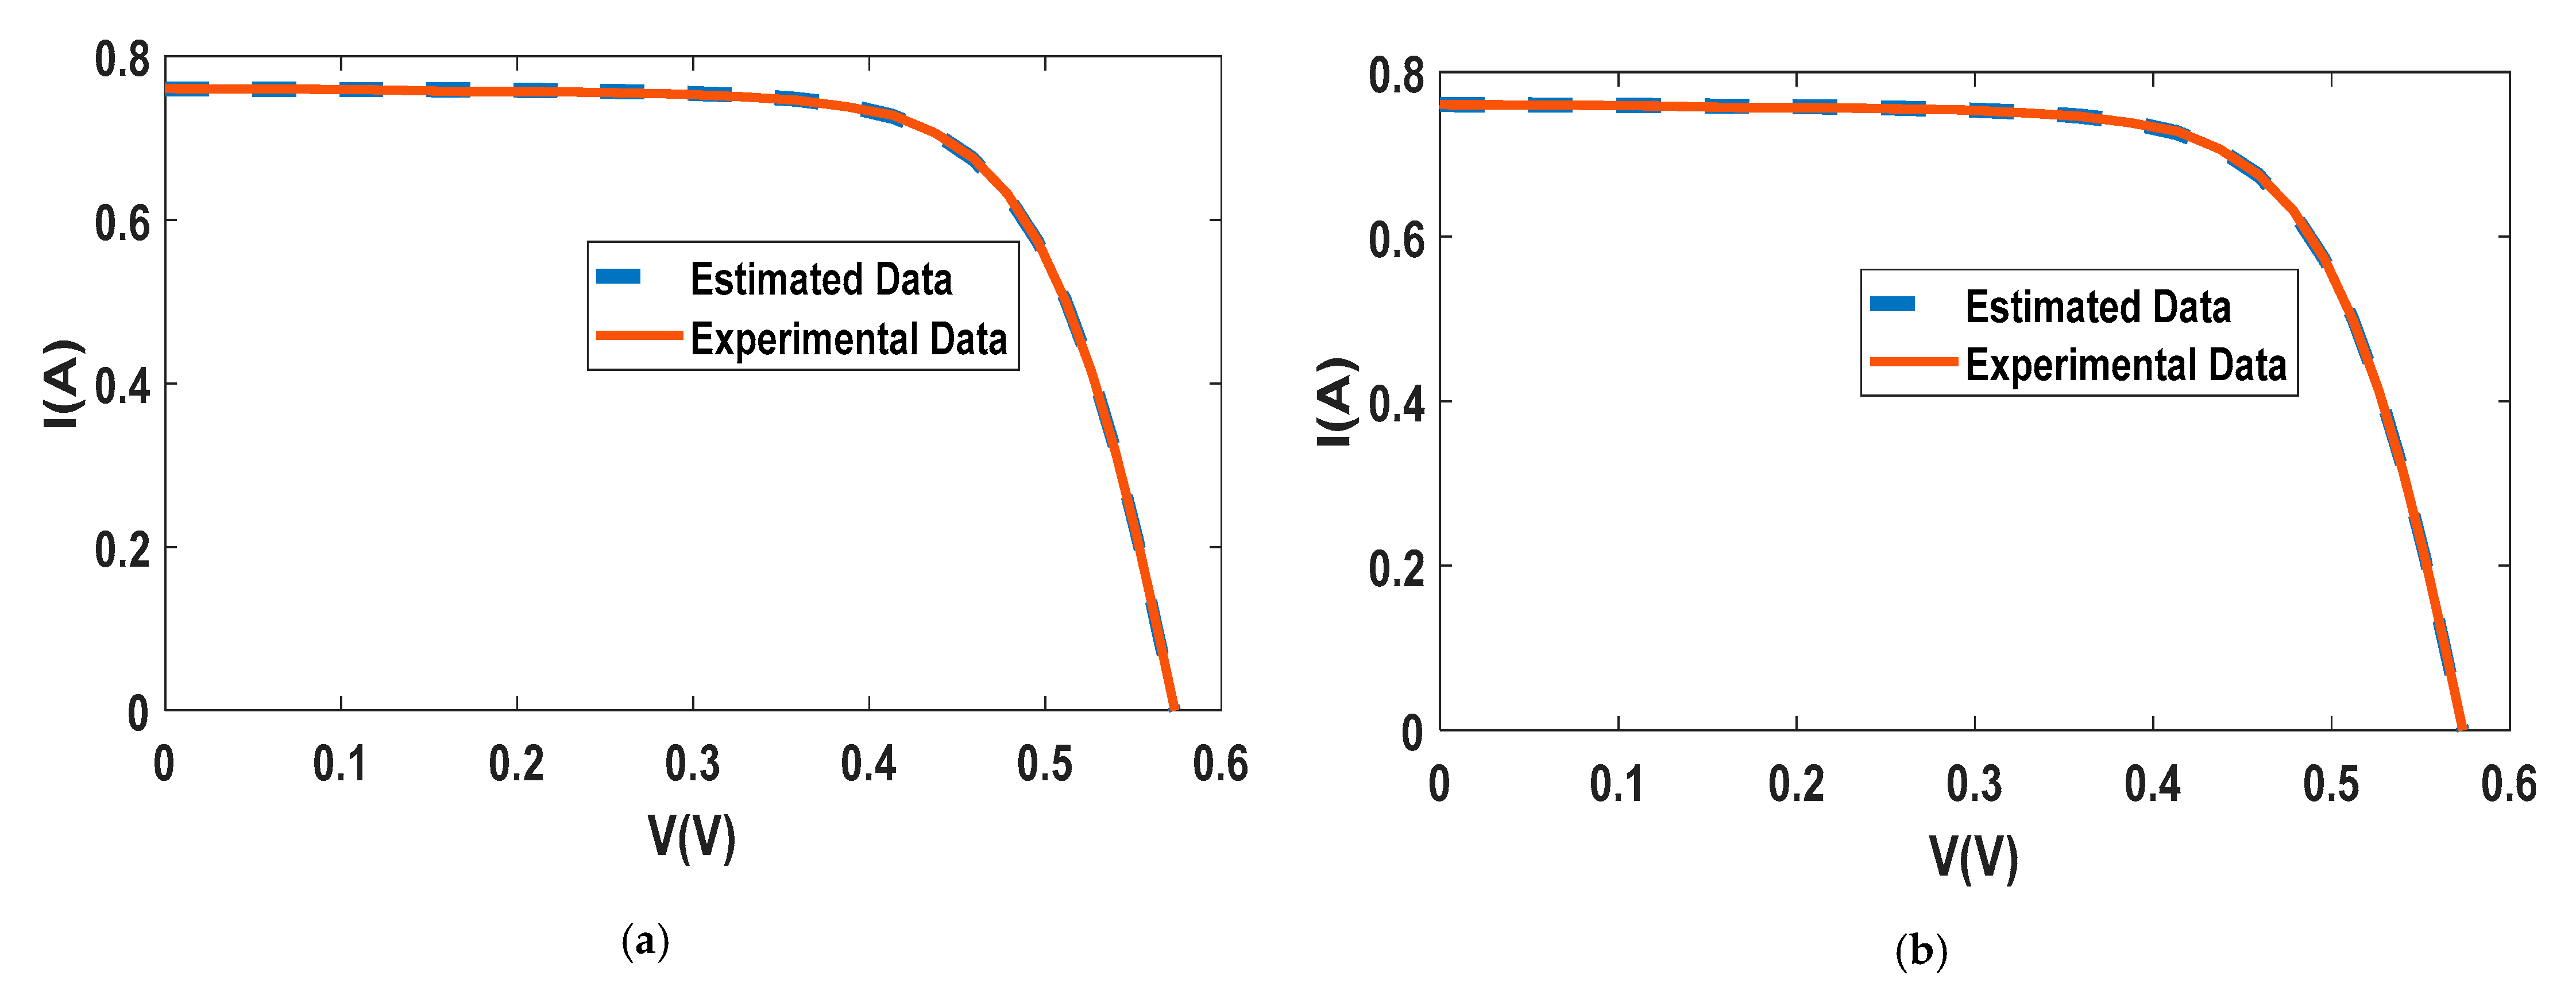
5.3. Simulation Results for a 57 mm Diameter Commercial (R.T.C. France) Silicon Solar Cell at 1000 W/m2 and 306 K

Table 6 shows the extracted parameters by using EHO for the two modified double and triple diode models at irradiation levels of 1000 W/m2, while the corresponding temperature level is 306 K. The statistical indices for this case study are reported in Table 7. Figure 13 shows the convergence rates for this case study using EHO for the MDDM and MTDM, respectively. Figure 14 shows the extracted parameters lead to the high closeness between the estimated V-I curves using the MDDM and MTDM.

5.4. Comparison with Previous Methods

Table 8 compares the fitness function (RMSE) obtained by the proposed EHO with FPA [16], DEIM [16] and MFO [16] for Q6-1380 cells and CS6P-240P modules for the tested cases. It is clear that the proposed EHO has the best fitness function for all cases studied compared with all competitive algorithms.

6. Conclusions

In this paper, a new modification to the MDDM has been developed to provide a more accurate physical model of the MCSSC, especially at low irradiation conditions. The model parameters of the MTDM have been estimated using two soft parameter estimation paradigms called CLPSO and EHO. The simulation results have assessed the parameters estimated by the two competitive methods for the MDDM and MTDM. The MTDM shows better convergence and lower error than the MDDM and also, the I–V curve is much closer to the experimental data which was tested on a MCSSC of a Q6-1380 cell of 7.7 cm2 area under low-level irradiation. Added to that, extracting the parameters under various irradiation and temperature levels has been employed for a CS6P-240P solar module. The proposed new optimization models have shown efficient performance in dealing with the natural characteristics of the MCSSC compared with previous studies and demonstrate an efficient optimizer with high accuracy. From the obtained results, the MTDM can be considered a promising more accurate solution physical model for MCSSC, especially at low illumination levels. In future work, the uncertainty of the climate condition as well as the shading effect will be incorporated in the estimation model of MCSSC.

Author Contributions

All authors have contributed to the preparation of this manuscript. A.S.B. and R.A.E.-S. designed the idea strategy, studied the data, and wrote the manuscript. M.M.F.D. and K.M. revised and proofread the manuscript, also designed some figures. Finally, R.A.E.-S. and M.L. reviewing, editing, and supporting different improvements for the manuscript. All authors have read and agreed to the published version of the manuscript.

Funding

This work was supported by the Department of Electrical Engineering and Automation, Aalto University, Espoo, Finland.

Institutional Review Board Statement

Not applicable.

Informed Consent Statement

Not applicable.

Data Availability Statement

The data presented in this study are available on request from the corresponding author.

Conflicts of Interest

The authors declare no conflict of interest.

References

  1. Qais, M.H.; Hasanien, H.M.; Alghuwainem, S. Identification of electrical parameters for three-diode photovoltaic model using analytical and sunflower optimization algorithm. Appl. Energy 2019, 250, 109–117. [Google Scholar] [CrossRef]
  2. Lin, Z.X.; Huang, B.; He, G.N.; Yang, W.F.; He, Q.Y.; Li, L.X. High efficiency enhancement of multi-crystalline silicon solar cells with syringe-shaped ZnOnanorod antireflection layers. Thin Solid Films 2018, 653, 151–157. [Google Scholar] [CrossRef]
  3. Derbali, L.; Ezzaouia, H. Efficiency improvement of multicrystalline silicon solar cells after surface and grain boundaries passivation using vanadium oxide. Mater. Sci. Eng. B Solid-State Mater. Adv. Technol. 2012, 177, 1003–1008. [Google Scholar] [CrossRef]
  4. Derbali, L.; Ezzaouia, H. Electrical properties improvement of multicrystalline silicon solar cells using a combination of porous silicon and vanadium oxide treatment. Appl. Surf. Sci. 2013, 271, 234–239. [Google Scholar] [CrossRef]
  5. Mukherjee, S.; Farid, S.; Stroscio, M.A.; Dutta, M. Modeling polycrystalline effects on the device characteristics of cdte based solar cells. In Proceedings of the2015 International Workshop on Computational Electronics (IWCE), West Lafayette, IN, USA, 2–4 September 2015; pp. 1–4. [Google Scholar]
  6. Kassis, A.; Saad, M. Analysis of multi-crystalline silicon solar cells at low illumination levels using a modified two-diode model. Sol. Energy Mater. Sol. Cells 2010, 94, 2108–2112. [Google Scholar] [CrossRef]
  7. Chin, V.J.; Salam, Z.; Ishaque, K. Cell modelling and model parameters estimation techniques for photovoltaic simulator application: A review. Appl. Energy 2015, 154, 500–519. [Google Scholar] [CrossRef]
  8. Bai, J.; Liu, S.; Hao, Y.; Zhang, Z.; Jiang, M.; Zhang, Y. Development of a new compound method to extract the five parameters of PV modules. Energy Convers. Manag. 2014, 79, 294–303. [Google Scholar] [CrossRef]
  9. Orioli, A.; Di Gangi, A. A procedure to evaluate the seven parameters of the two-diode model for photovoltaic modules. Renew. Energy 2019, 139, 582–599. [Google Scholar] [CrossRef]
  10. Suskis, P.; Galkin, I. Enhanced photovoltaic panel model for MATLAB-Simulink environment considering solar cell junction capacitance. In Proceedings of the IECON 2013-39th Annual Conference of the IEEE Industrial Electronics Society, Vienna, Austria, 10–13 November 2013. [Google Scholar] [CrossRef]
  11. Lumb, M.P.; Bailey, C.G.; Adams, J.G.J.; Hillier, G.; Tuminello, F.; Elarde, V.C.; Walters, R.J. Analytical drift-diffusion modeling of GaAs solar cells incorporating a back mirror. In Proceedings of the 2013 IEEE 39th Photovoltaic Specialists Conference (PVSC), Tampa, FL, USA, 16–21 June 2013. [Google Scholar] [CrossRef]
  12. Nishioka, K.; Sakitani, N.; Uraoka, Y.; Fuyuki, T. Analysis of multicrystalline silicon solar cells by modified 3-diode equivalent circuit model taking leakage current through periphery into consideration. Sol. Energy Mater. Sol. Cells 2007, 91, 1222–1227. [Google Scholar] [CrossRef]
  13. Soon, J.J.; Low, K.-S.; Goh, S.T. Multi-dimension diode photovoltaic (PV) model for different PV cell technologies. In Proceedings of the 2014 IEEE 23rd International Symposium on Industrial Electronics (ISIE), Istanbul, Turkey, 1–4 June 2014. [Google Scholar] [CrossRef]
  14. Mazhari, B. An improved solar cell circuit model for organic solar cells. Sol. Energy Mater. Sol. Cells 2006, 90, 1021–1033. [Google Scholar] [CrossRef]
  15. Jordehi, A.R. Parameter estimation of solar photovoltaic (PV) cells: A review. Renew. Sustain. Energy Rev. 2016, 61, 354–371. [Google Scholar] [CrossRef]
  16. Allam, D.; Yousri, D.; Eteiba, M. Parameters extraction of the three-diode model for the multi-crystalline solar cell/module using Moth-Flame Optimization Algorithm. Energy Convers. Manag. 2016, 123, 535–548. [Google Scholar] [CrossRef]
  17. Awadallah, M.A. Variations of the bacterial foraging algorithm for the extraction of PV module parameters from nameplate data. Energy Convers. Manag. 2016, 113, 312–320. [Google Scholar] [CrossRef]
  18. Chen, X.; Yu, K.; Du, W.; Zhao, W.; Liu, G. Parameters identification of solar cell models using generalized oppositional teaching learning-based optimization. Energy 2016, 99, 170–180. [Google Scholar] [CrossRef]
  19. Muhsen, D.H.; Ghazali, A.B.; Khatib, T.; Abed, I.A. Parameters extraction of double diode photovoltaic modules model based on hybrid evolutionary algorithm. Energy Convers. Manag. 2015, 105, 552–561. [Google Scholar] [CrossRef]
  20. Alam, D.; Yousri, D.; Eteiba, M. Flower pollination algorithm based solar PV parameter estimation. Energy Convers. Manag. 2015, 101, 410–422. [Google Scholar] [CrossRef]
  21. Oliva, D.; Cuevas, E.; Pajares, G. Parameter identification of solar cells using artificial bee colony optimization. Energy 2014, 72, 93–102. [Google Scholar] [CrossRef]
  22. Askarzadeh, A.; Rezazadeh, A. Artificial bee swarm optimization algorithm for parameters identification of solar cell models. Appl. Energy 2013, 102, 943–949. [Google Scholar] [CrossRef]
  23. Askarzadeh, A.; Rezazadeh, A. Parameter identification for solar cell models using harmony search-based algorithms. Sol. Energy 2012, 86, 3241–3249. [Google Scholar] [CrossRef]
  24. El-Naggar, K.M.; AlRashidi, M.R.; AlHajri, M.F.; Al-Othman, A.K. Simulated annealing algorithm for photovoltaic parameters identification. Sol. Energy 2012, 86, 266–274. [Google Scholar] [CrossRef]
  25. AlRashidi, M.; Alhajri, M.; El-Naggar, K.; Al-Othman, A. A new estimation approach for determining the I–V characteristics of solar cells. Sol. Energy 2011, 85, 1543–1550. [Google Scholar] [CrossRef]
  26. Ismail, M.S.; Moghavvemi, M.; Mahlia, T.M.I. Characterization of PV panel and global optimization of its model parameters using genetic algorithm. Energy Convers. Manag. 2013, 73, 10–25. [Google Scholar] [CrossRef]
  27. Askarzadeh, A.; Coelho, L.d.S. Determination of photovoltaic modules parameters at different operating conditions using a novel bird mating optimizer approach. Energy Convers. Manag. 2015, 89, 608–614. [Google Scholar] [CrossRef]
  28. Chin, V.J.; Salam, Z. A New Three-point-based Approach for the Parameter Extraction of Photovoltaic Cells. Appl. Energy 2019, 237, 519–533. [Google Scholar] [CrossRef]
  29. Murtaza, A.F.; Munir, U.; Chiaberge, M.; Di Leo, P.; Spertino, F. Variable parameters for a single exponential model of photovoltaic modules in crystalline-silicon. Energies 2018, 11, 2138. [Google Scholar] [CrossRef] [Green Version]
  30. Fathy, A.; Elaziz, M.A.; Sayed, E.T.; Olabi, A.; Rezk, H. Optimal parameter identification of triple-junction photovoltaic panel based on enhanced moth search algorithm. Energy 2019, 188, 116025. [Google Scholar] [CrossRef]
  31. Gao, X.; Cui, Y.; Hu, J.; Xu, G.; Wang, Z.; Qu, J.; Wang, H. Parameter extraction of solar cell models using improved shuffled complex evolution algorithm. Energy Convers. Manag. 2018, 157, 460–479. [Google Scholar] [CrossRef]
  32. Qais, M.H.; Hasanien, H.M.; Alghuwainem, S.; Nouh, A.S. Coyote optimization algorithm for parameters extraction of three-diode photovoltaic models of photovoltaic modules. Energy 2019, 187, 187. [Google Scholar] [CrossRef]
  33. Abbassi, R.; Abbassi, A.; Mohamed, J.; Chebbi, S. Identification of unknown parameters of solar cell models: A comprehensive overview of available approaches. Renew. Sustain. Energy Rev. 2018, 90, 453–474. [Google Scholar] [CrossRef]
  34. Chenouard, R.; El-Sehiemy, R.A. An interval branch and bound global optimization algorithm for parameter estimation of three photovoltaic models. Energy Convers. Manag. 2020, 205, 112400. [Google Scholar] [CrossRef]
  35. Zaky, A.A.; El Sehiemy, R.A.; Rashwan, Y.I.; Elhossieni, M.A.; Gkini, K.; Kladas, A.; Falaras, P. Optimal Performance Emulation of PSCs using the Elephant Herd Algorithm Associated with Experimental Validation. ECS J. Solid State Sci. Technol. 2019, 8, Q249–Q255. [Google Scholar] [CrossRef]
  36. Shaheen, A.M.; Ginidi, A.R.; El-Sehiemy, R.A.; Ghoneim, S.S.M. A Forensic-Based Investigation Algorithm for Parameter Extraction of Solar Cell models. IEEE Access 2021, 9, 1–20. [Google Scholar] [CrossRef]
  37. Elhosseini, M.A.; El-Sehiemy, R.A.; Rashwan, Y.I.; Gao, X. On the performance improvement of elephant herding optimization algorithm. Knowl.-Based Syst. 2019, 166, 58–70. [Google Scholar] [CrossRef]
  38. Abbas, A.S.; El-Sehiemy, R.A.; Abou El-Ela, A.; Ali, E.S.; Mahmoud, K.; Lehtonen, M.; Darwish, M.M.F. Optimal Harmonic Mitigation in Distribution Systems with Inverter Based Distributed Generation. Appl. Sci. 2021, 11, 774. [Google Scholar] [CrossRef]
  39. Barakat, A.F.; El Sehiemy, R.A.; Elsaid, M. Close Accord on Particle Swarm Optimization Variants for Solving Non-Linear Optimal Reactive Power Dispatch Problem. Int. J. Eng. Res. Afr. 2020, 46, 88–105. [Google Scholar] [CrossRef]
  40. El Sehiemy, R.A.; Selim, F.; Bentouati, B.; Abido, M. A novel multi-objective hybrid particle swarm and salp optimization algorithm for technical-economical-environmental operation in power systems. Energy 2020, 193, 116817. [Google Scholar] [CrossRef]
  41. Abou-El-Ela, A.A.; El-Sehiemy, R.A. Optimized generation costs using a modified particle swarm optimization version. In Proceedings of the 2008 12th International Middle-East Power System Conference, Aswan, Egypt, 12–15 March 2008; pp. 420–424. [Google Scholar]
  42. Abou El-Ela, A.A.; El-Sehiemy, R.A.; El-Ayaat, N.K. Multi-objective Binary Particle Swarm optimization Algorithm for Optimal Distribution System Reconfiguration. In Proceedings of the 2019 21st International Middle East Power Systems Conference (MEPCON), Cairo, Egypt, 17–19 December 2019; pp. 435–440. [Google Scholar]
  43. Easwarakhanthan, T.; Bottin, J.; Bouhouch, I.; Boutrit, C. Nonlinear minimization algorithm for determining the solar cell parameters with microcomputers. J. Sol. Energy 1986, 4, 1–12. [Google Scholar] [CrossRef]
Figure 1. Modified double diode model.
Applsci 11 01055 g001
Figure 2. Modified three diode model.
Applsci 11 01055 g002
Figure 3. Convergence rate for the MDDM using CLPSO.
Applsci 11 01055 g003
Figure 4. Convergence rate of the MTDM using CLPSO.
Applsci 11 01055 g004
Figure 5. Convergence rate of the MDDM using EHO.
Applsci 11 01055 g005
Figure 6. MTDM convergence rate using EHO.
Applsci 11 01055 g006
Figure 7. Experimental versus estimated (I–V) characteristic for MDDM using EHO.
Applsci 11 01055 g007
Figure 8. Experimental versus estimated (I–V) characteristic for MTDM using EHO.
Applsci 11 01055 g008
Figure 9. Convergence rates at different environmental impacts using EHO for MDDM; (a) at 109.2 W/m2 and 310.32 K, (b) at 246.65 W/m2 and 313.32 K, and (c) at 347.8 W/m2 and 316.95 K.
Applsci 11 01055 g009
Figure 10. Convergence rates at different environmental impacts using EHO for MTDM; (a) at 109.2 W/m2 and 310.32 K, (b) at 246.65 W/m2 and 313.32 K, and (c) at 347.8 W/m2 and 316.95 K.
Applsci 11 01055 g010
Figure 11. Estimated V-I versus experimental V-I at different environmental impacts using EHO for MTDM;(a) at 109.2 W/m2 and 310.32 K, (b) at 246.65 W/m2 and 313.32 K, and (c) at 347.8 W/m2 and 316.95 K.
Applsci 11 01055 g011
Figure 12. Estimated V-I versus experimental V-I at different environmental impacts using EHO for MTDM;(a) at 109.2 W/m2 and 310.32 K, (b) at 246.65 W/m2 and 313.32 K, and (c) at 347.8 W/m2 and 316.95 K.
Applsci 11 01055 g012
Figure 13. Convergence rates using EHO for 57 mm diameter commercial (R.T.C. France) silicon solar cell at 1000 W/m2 and 306 K; (a) for MDDM, (b) for MTDM.
Applsci 11 01055 g013
Figure 14. Estimated V-I versus experimental V-I using EHO for 57 mm diameter commercial (R.T.C. France) silicon solar cell at 1000 W/m2 and 306 K; (a) for MDDM, (b) for MTDM.
Applsci 11 01055 g014
Table 1. Basic open circuit and short circuit current for tested solar cells.
CellIrradiance Level (W/m2)VOC (V)ISC (A)PMP (W)FF
Q6-138098.40.4670.019360.0048830.5401
CS6P-240P
solar module
109.232.10.996823.710.7410
246.6532.562.13851.350.7376
347.832.913.035760.7609
R.T.C. France10000.57310.76020.31150.7150
Table 2. Estimated MDDM and MTDM parameters by CLPSO and EHO algorithms for Q6-1380 solar cell at the irradiance level (9.84 mW/cm2) and room temperature (300 K).
MethodModelIPV (mA)ID1 (μA)η1ID2 (mA)η2RGB (Ω)RP (Ω)RS (Ω)ID3 (μA)η3
CLPSOMDDM19.345.7555 × 10−51.23230.62794.24170.65384423.40.21658--
MTDM19.480.0027913.05810. 30573.56060.58204699.7280.20237513.1343.9793
EHOMDDM19.490.1 × 10−61.3130.16623.1570.01371479.50.7651--
MTDM19.450.0018654.4620.23033.2880.40685678.370.208020.77614.09837
Table 3. Statistical analysis for MDDM and MTDM by CLPSO and EHO algorithms for Q6-1380 solar cell at irradiance level (9.84 mW/cm2) and room temperature (300 K).
MethodModelBest OFWorst OFAverage OFStandard Deviation
CLPSOMDDM8.7545 × 10−50.00300.00146.3378 × 10−4
MTDM5.9516 × 10−50.00125.6233 × 10−42.5014 × 10⁻⁴
EHOMDDM1.823 × 10−58.346 × 10−42.54 × 10−42.179 × 10⁻⁴
MTDM1.4386 × 10−58.3759 × 10−42.16428 × 10−42.1835 × 10⁻⁴
Table 4. The extracted parameters for MDDM and MTDM by EHO algorithms for CS6P-240P solar module at different irradiance and temperature levels.
Rad.
(W/m2)
Temp.
K
ModelIPV (A)IS1 (μA)η1IS2 (mA)η2RGB (Ω)RP (Ω)RS (Ω)IS3 (μA)η3
109.2310.32MDDM0.993690.0012110.0058510.83159095000.2902543--
MTDM0.996630.004481.00030.002521.0613460.03831466.130.7338250.00015673.24194
246.65313.05MDDM2.137812.94501.63040.094441.16390.082899341275.630.1444726--
MTDM2.14680.05851.11635.290561.56860.26401624.9540.294834308.6834.9497
347.8316.95MDDM3.02850.0153251494.5293.13340.00022166.530.4051--
MTDM3.031520.01546812756.7334.50810.42393.820.40891.2395564.2
Table 5. Statistical analysis for MDDM and MTDM by EHO algorithms for CS6P-240P solar module at different irradiance and temperature levels.
Rad. Level
(W/m2)
Temp.
K
ModelBest OFWorst OFAverage OFStandard Deviation
109.2310.32MDDM0.00133930.03010530.00946140.0075341
MTDM9.6257× 10−40.02742300.00734080.0038365
246.65313.05MDDM0.00551850.02456090.01021170.0053391
MTDM0.003852040.01387370.00962880.0023624
347.8316.95MDDM0.003852040.1285550.0207380.020095
MTDM0.00293260.2778650.0389630.053252
Table 6. The extracted parameters for MDDM and MTDM by EHO algorithms for 57 mm diameter commercial (R.T.C. France) silicon solar cell at 1000 W/m2 and 306 K.
Rad.
(W/m2)
ModelIPV (A)IS1 (μA)η1IS2 (mA)η2RGB (Ω)RP (Ω)RS (Ω)IS3 (μA)η3
1000MDDM0.760010.254471.32330.306513.29110.262543740.80.03848--------
MTDM0.761320.381051.35531.45134.990.011915810.038063.31325.091
Table 7. Statistical analysis for MDDM and MTDM by EHO algorithms for 57 mm diameter commercial (R.T.C. France) silicon solar cell at 1000 W/m2 and 306 K.
Rad. Level
(W/m2)
ModelBest OFWorst OFAverage OFStandard Deviation
1000MDDM0.0015570.01320050.00659340.0037673
MTDM0.0012330.01312530.00597610.0039343
Table 8. Comparison of simulation results of EHO with corresponding results in the literature.
CellIrradiation level (W/m2)FPA [16]DEIM [16]MFO [16]Proposed EHO
Q6-138098.4 3.0946 10 5 2.4353 10 5 1.9904 10 5 1.823 10 5
CS6P-240P
solar module
109.20.0072050.0057210.0053260.0013393
246.650.018860.016850.0135370.0055185
347.80.0202470.0170530.0165830.00385204
Publisher’s Note: MDPI stays neutral with regard to jurisdictional claims in published maps and institutional affiliations.

