A Tool for the Rapid Seismic Assessment of Historic Masonry Structures Based on Limit Analysis Optimisation and Rocking Dynamics


Abstract
:Featured Application
Abstract
1. Introduction
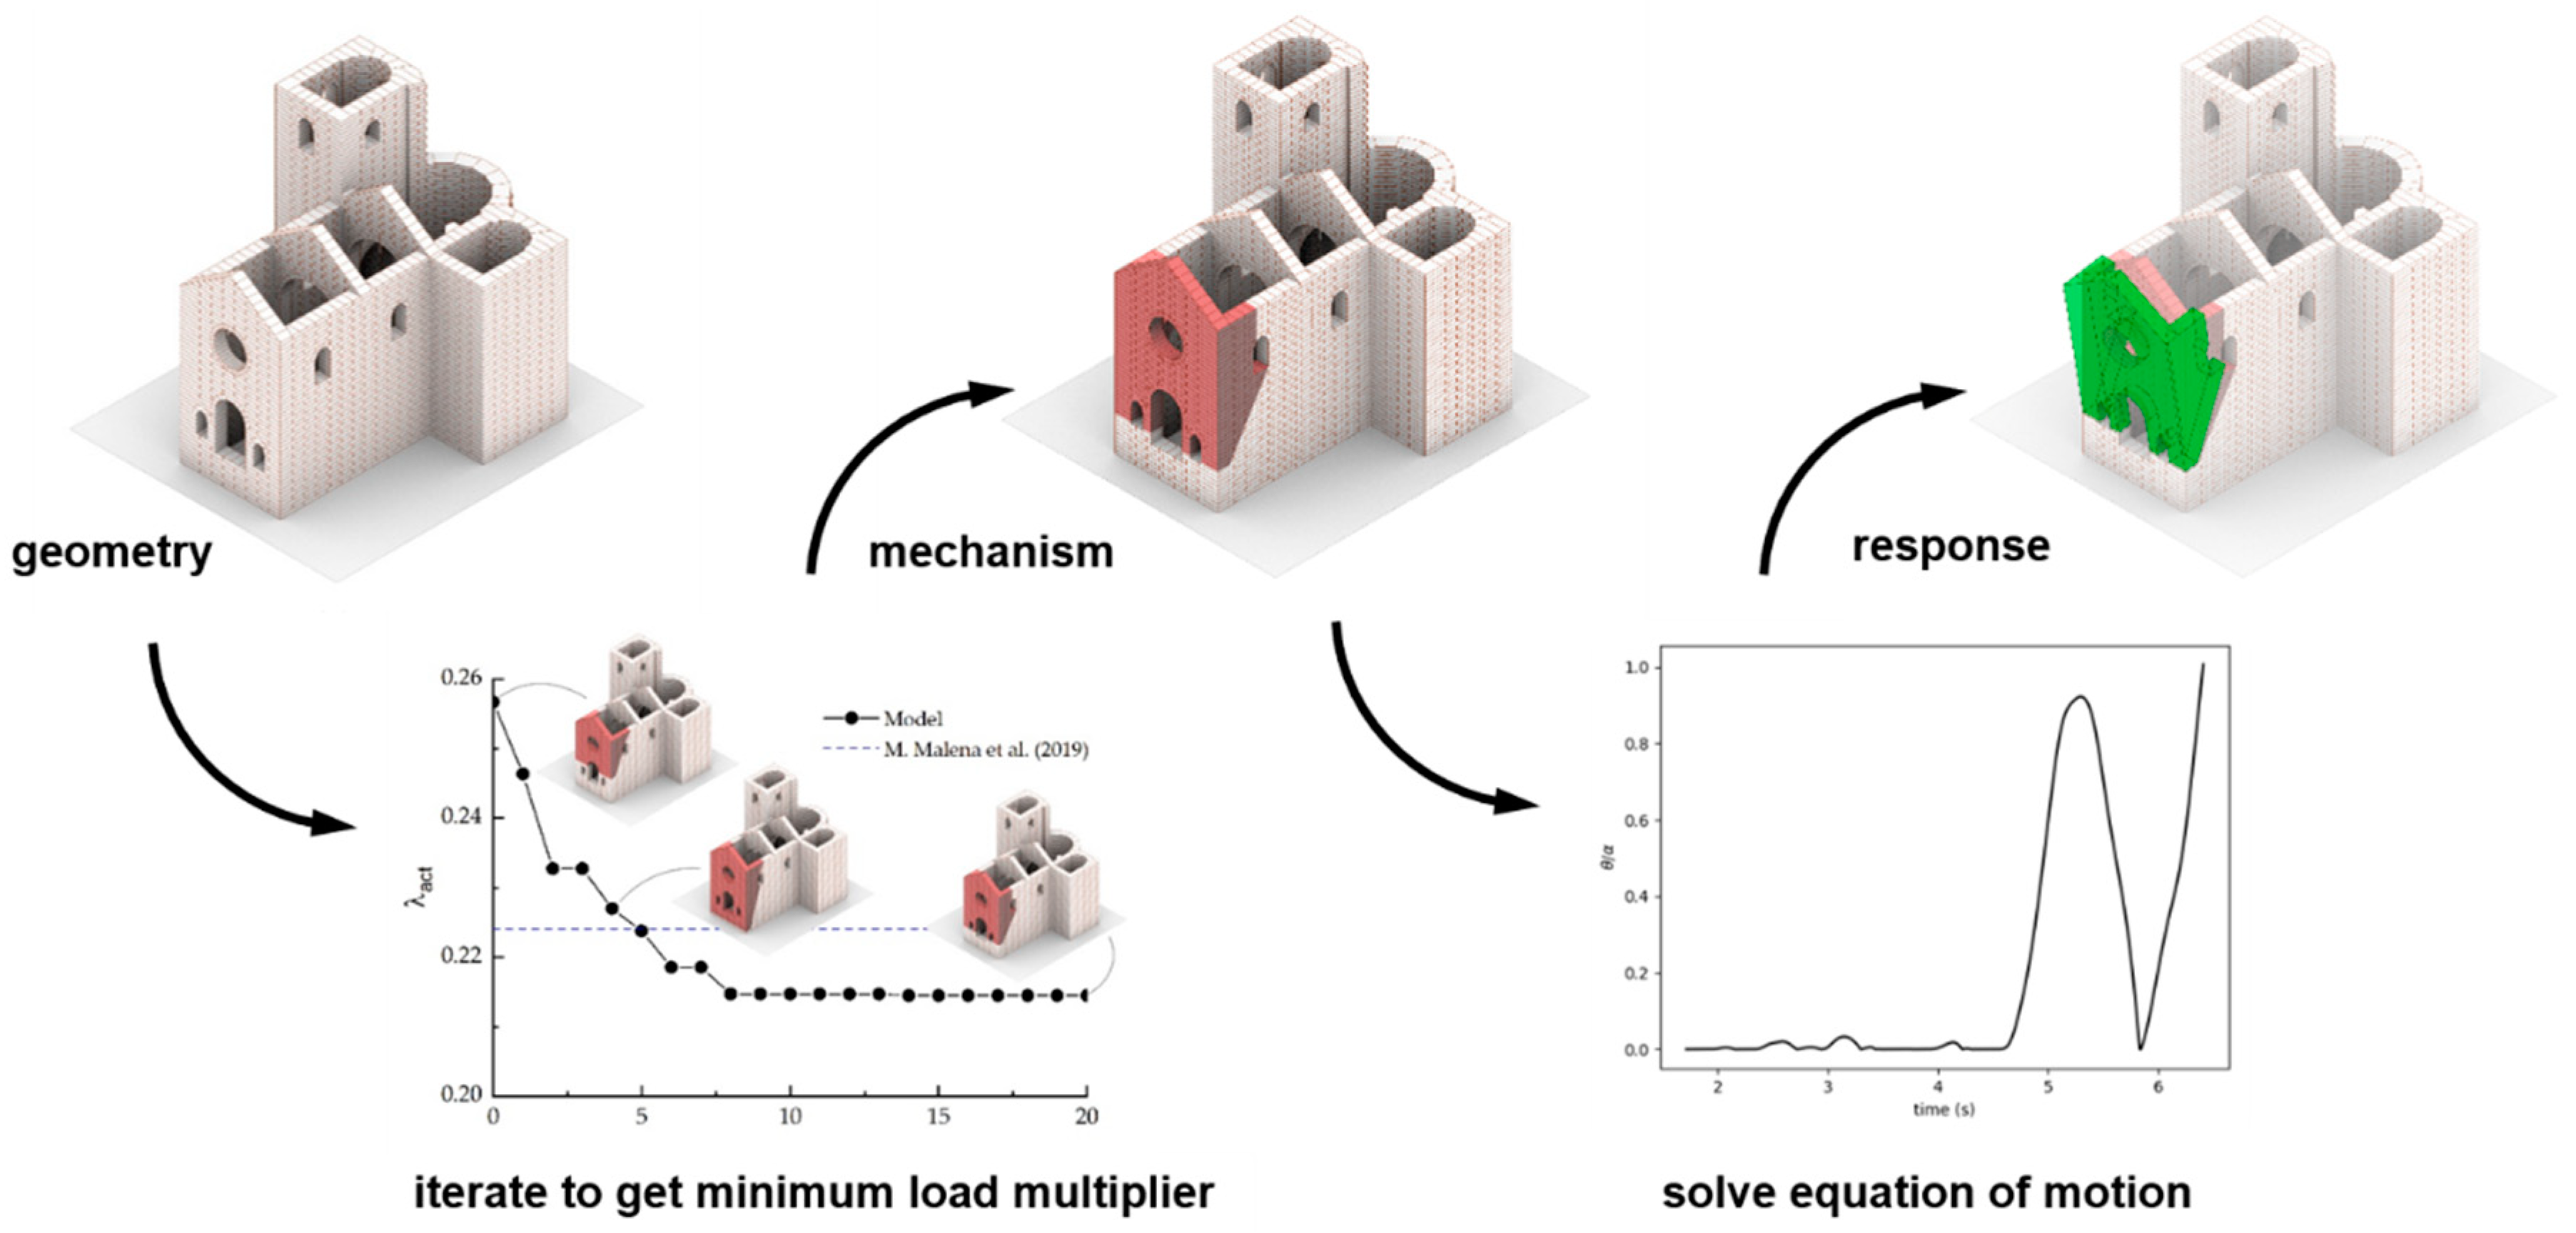
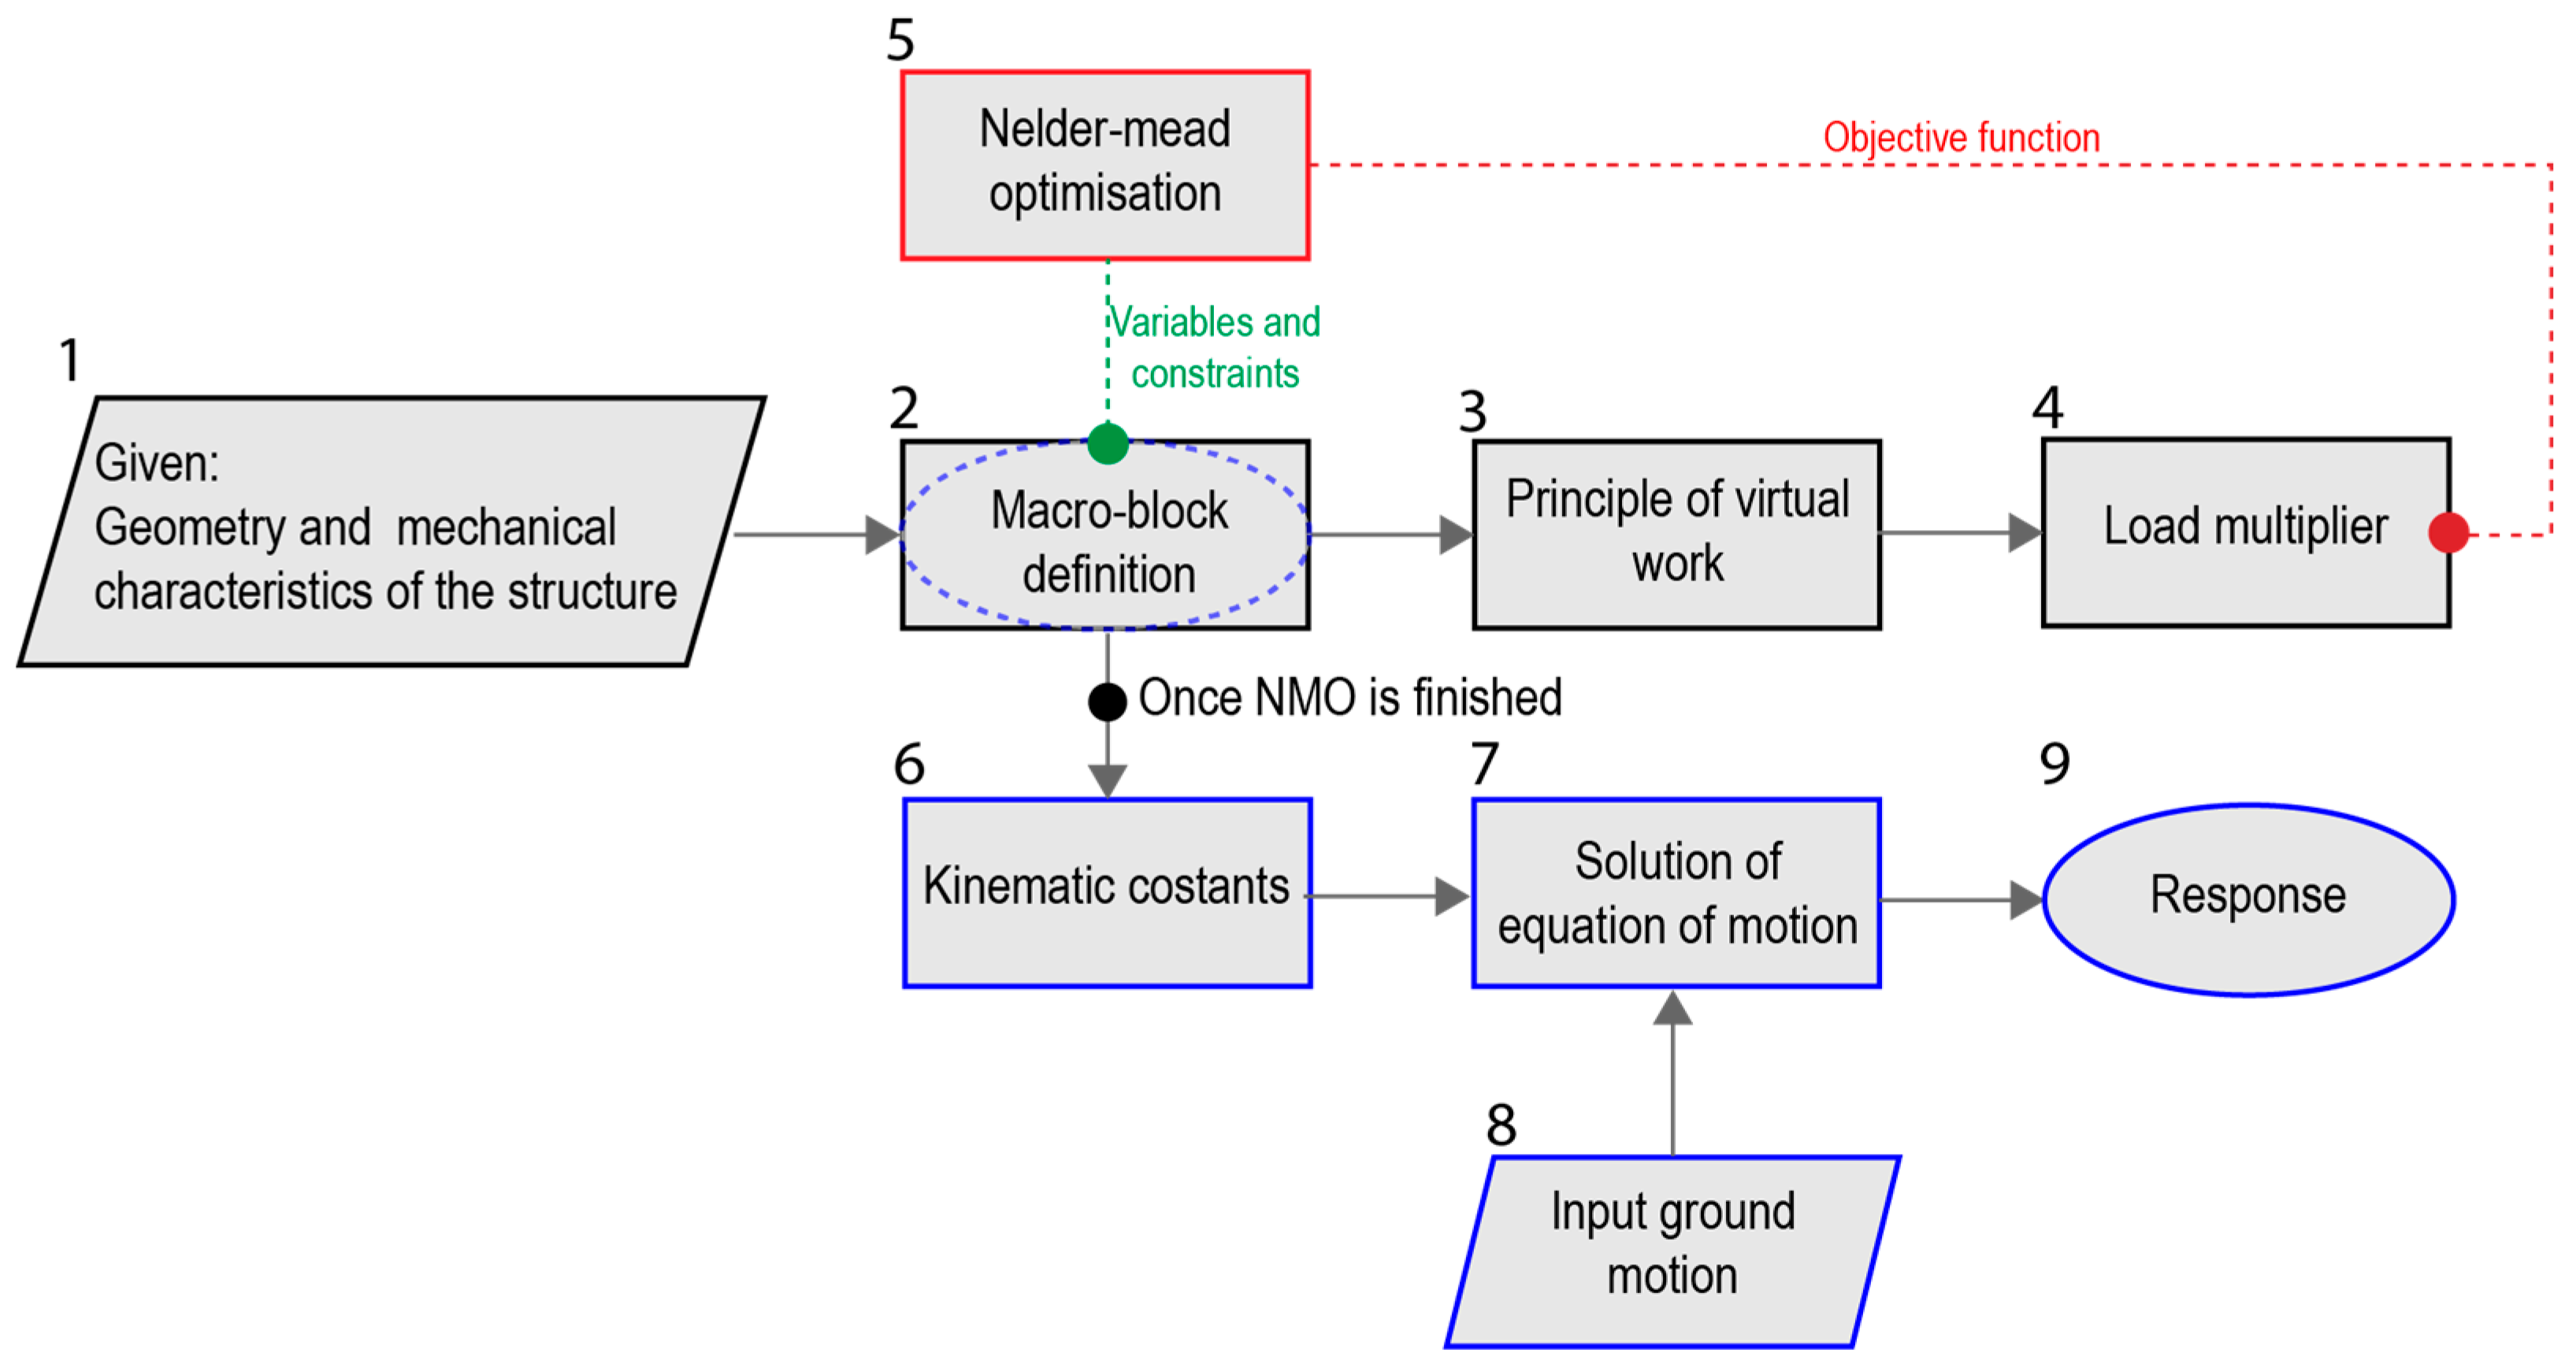
2. Methodology
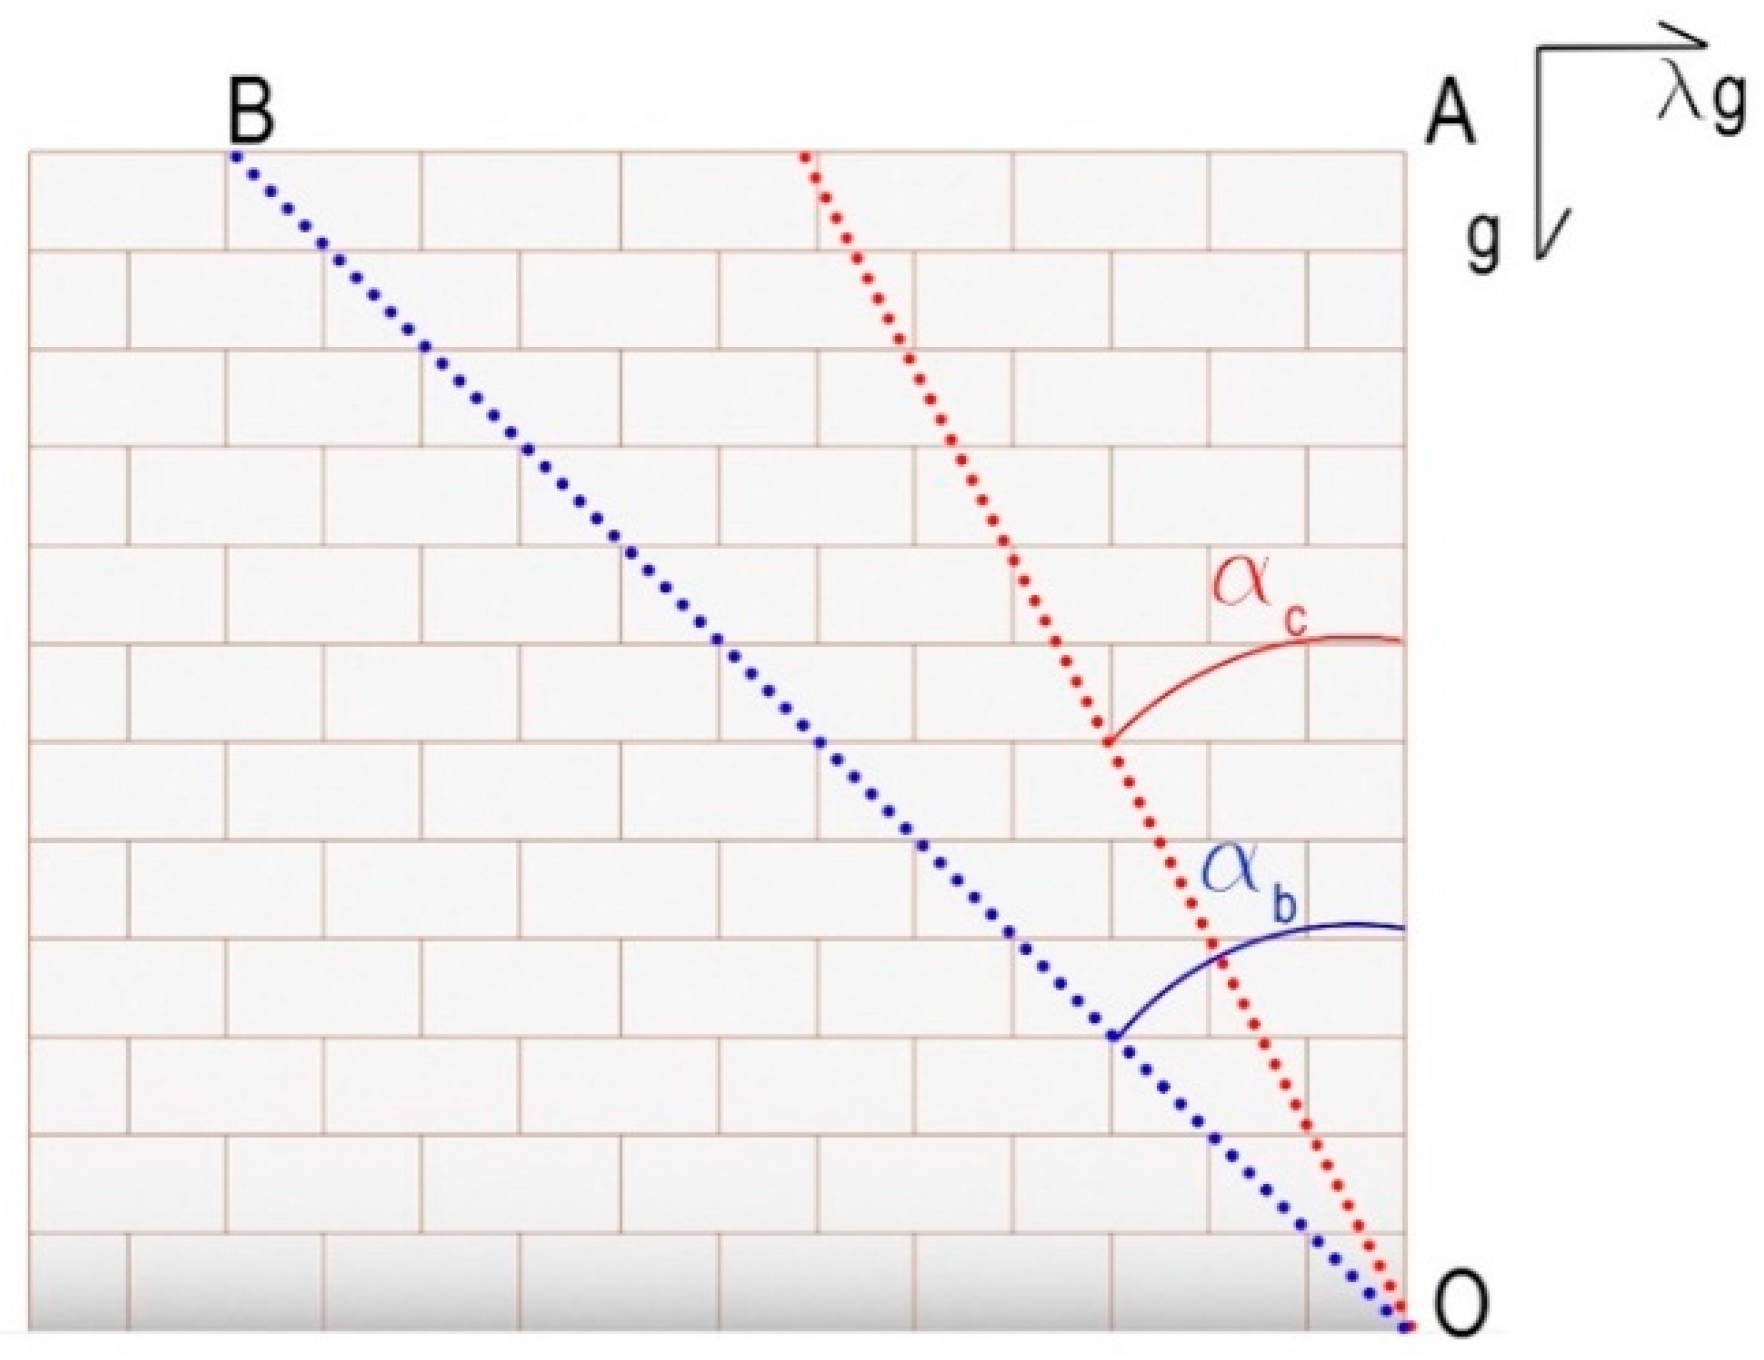
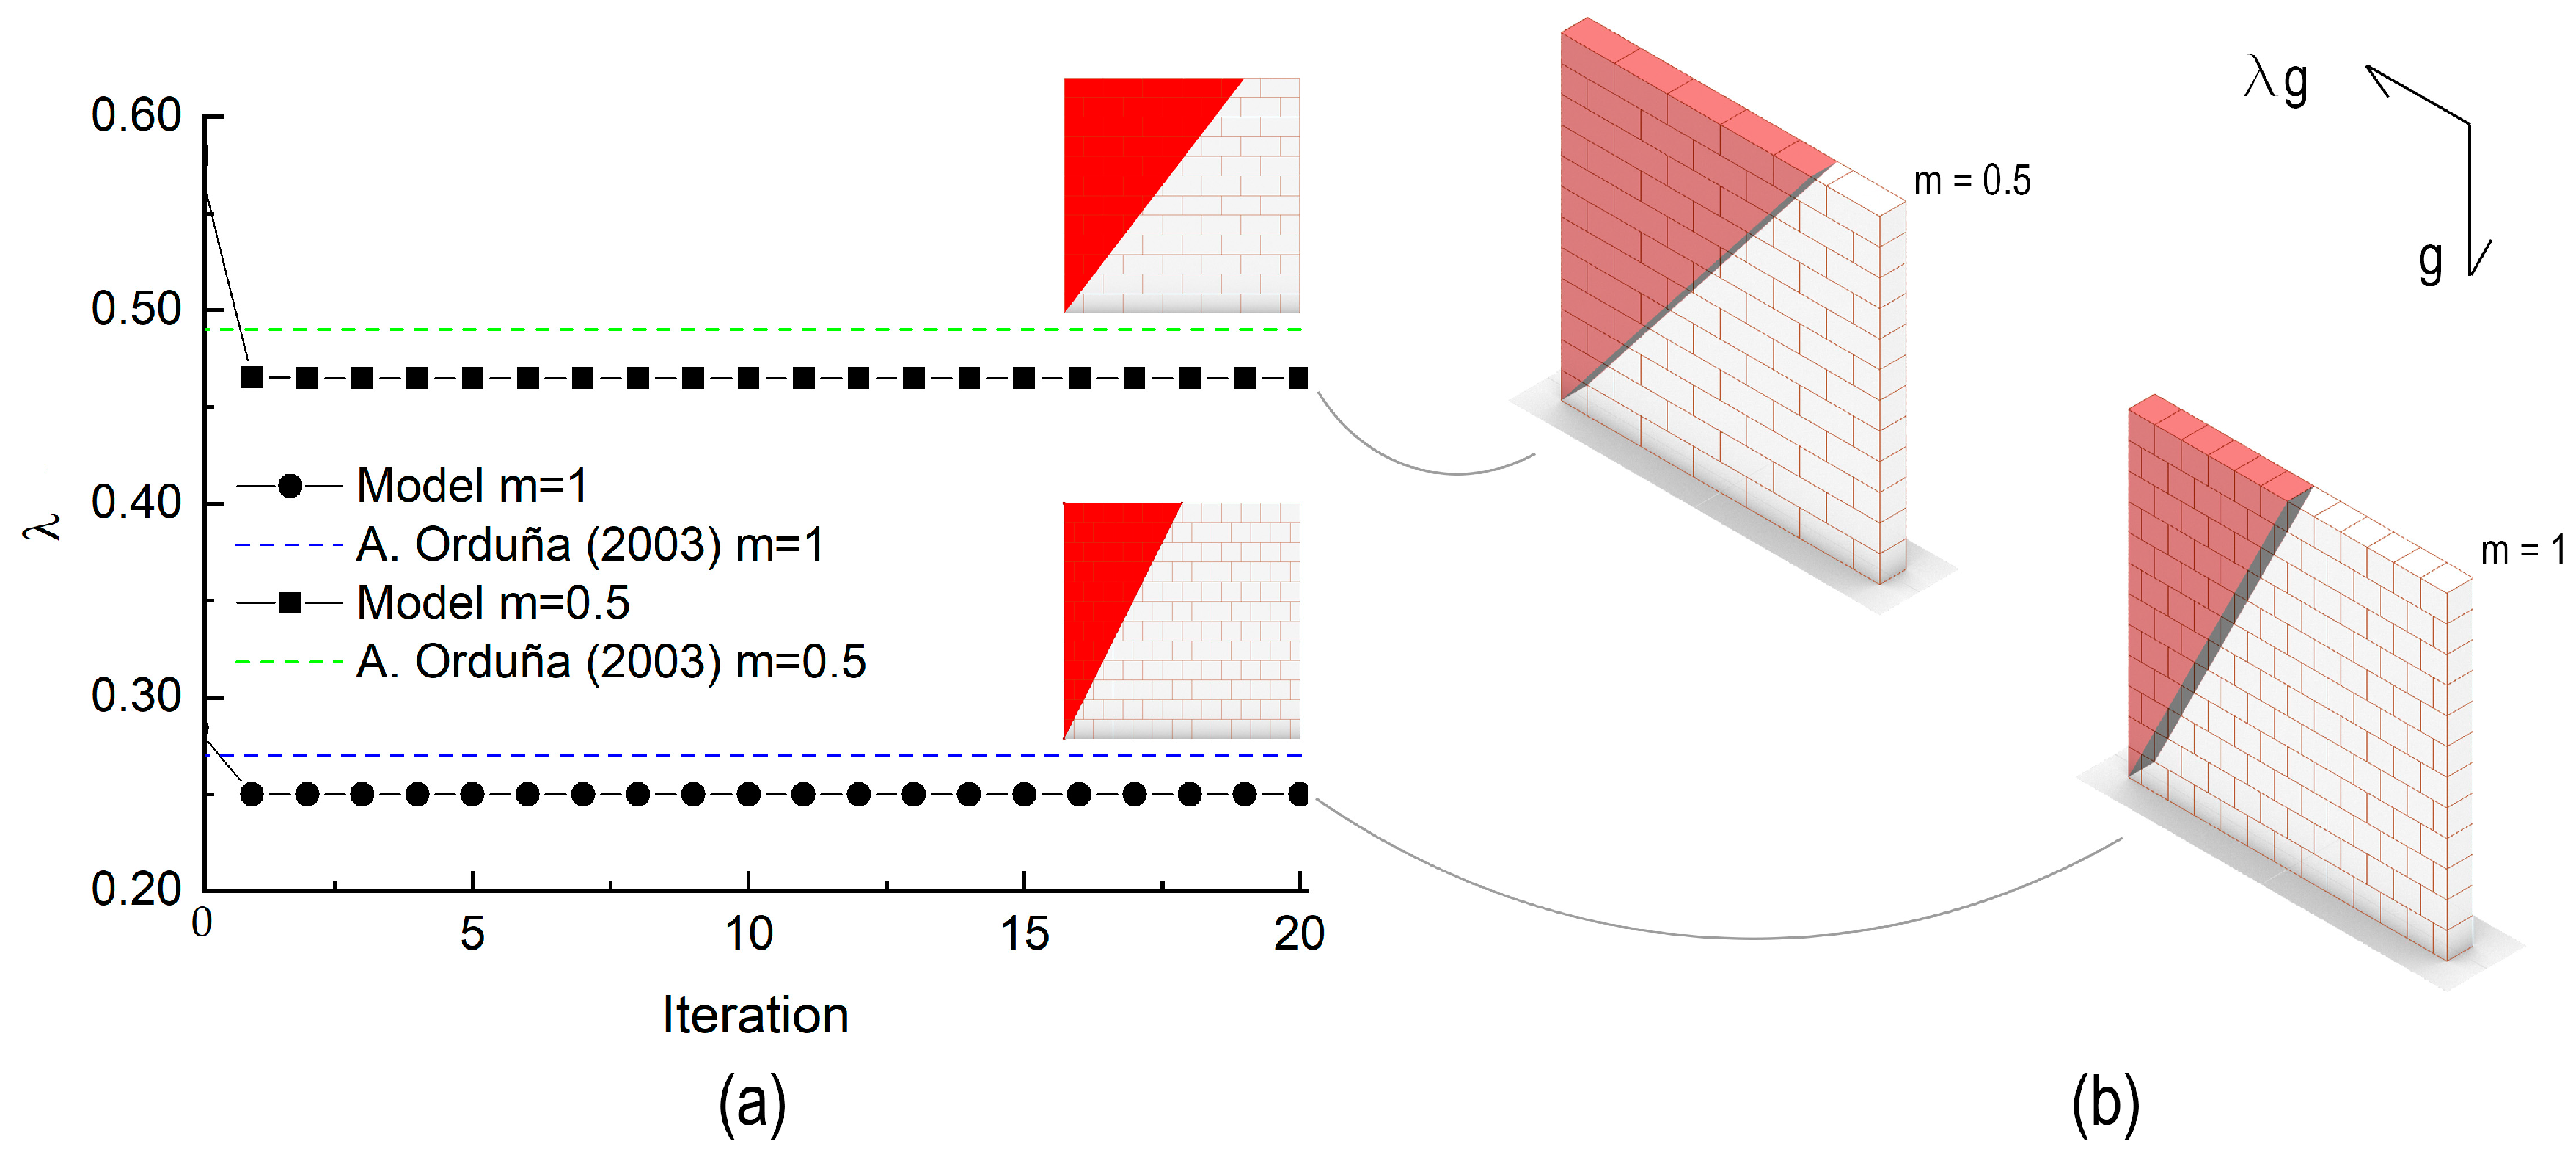
2.1. Upper-Bound Limit Analysis
2.2. Non-Linear Dynamic (Rocking) Analysis
3. Numerical Implementation
4. Validation of the Upper-Bound Limit Analysis Procedure
4.1. Solid Masonry Wall Loaded in-Plane
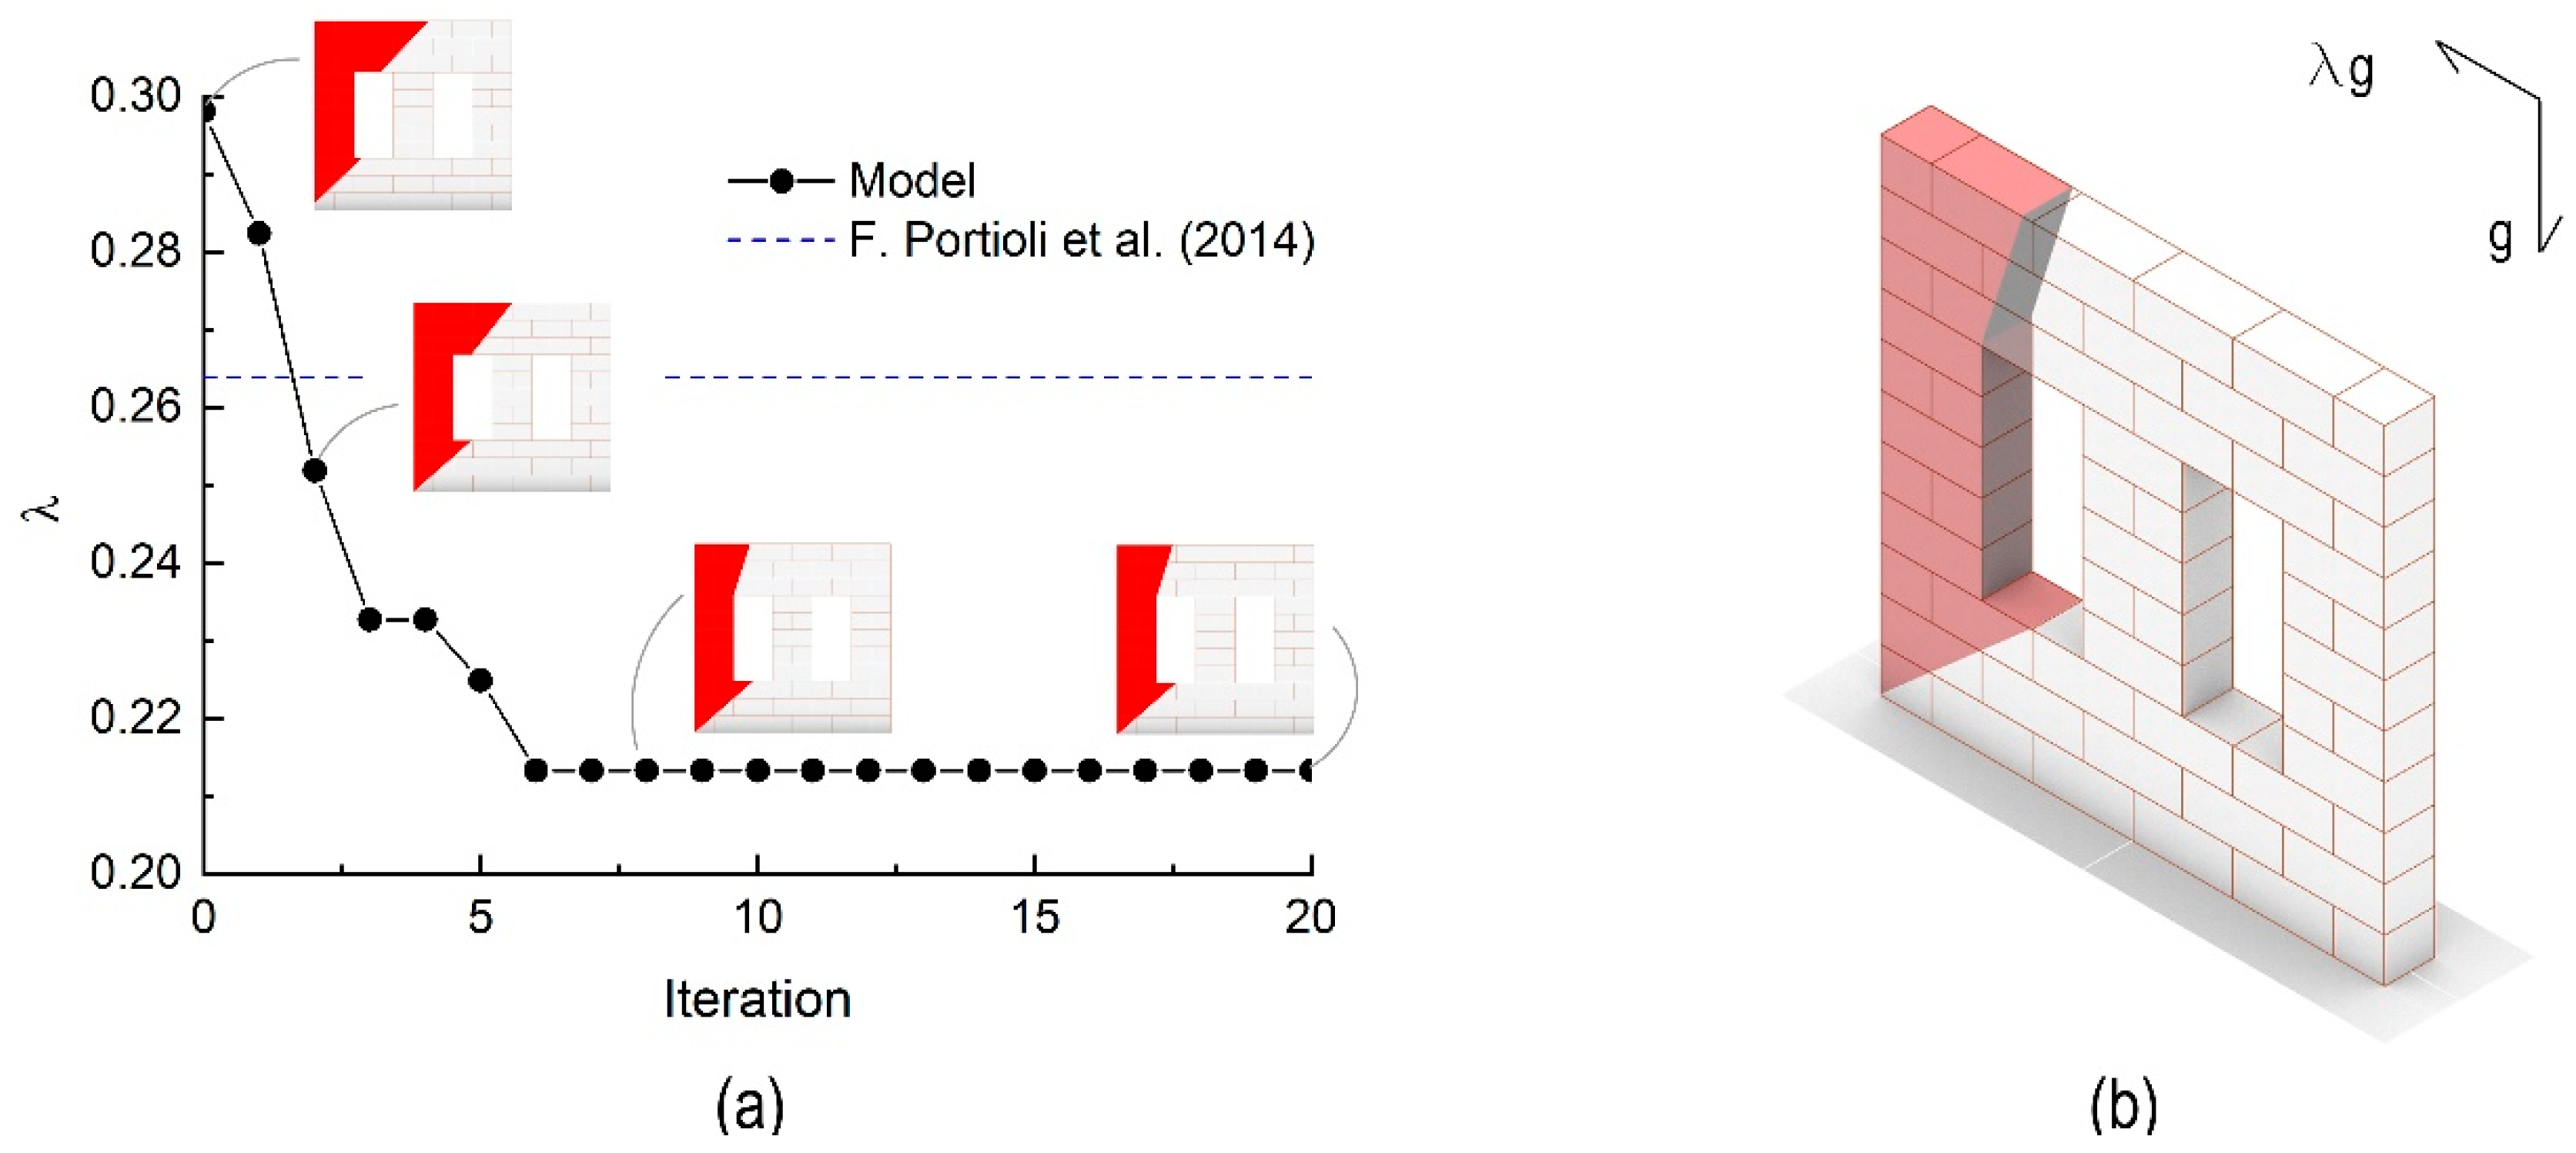
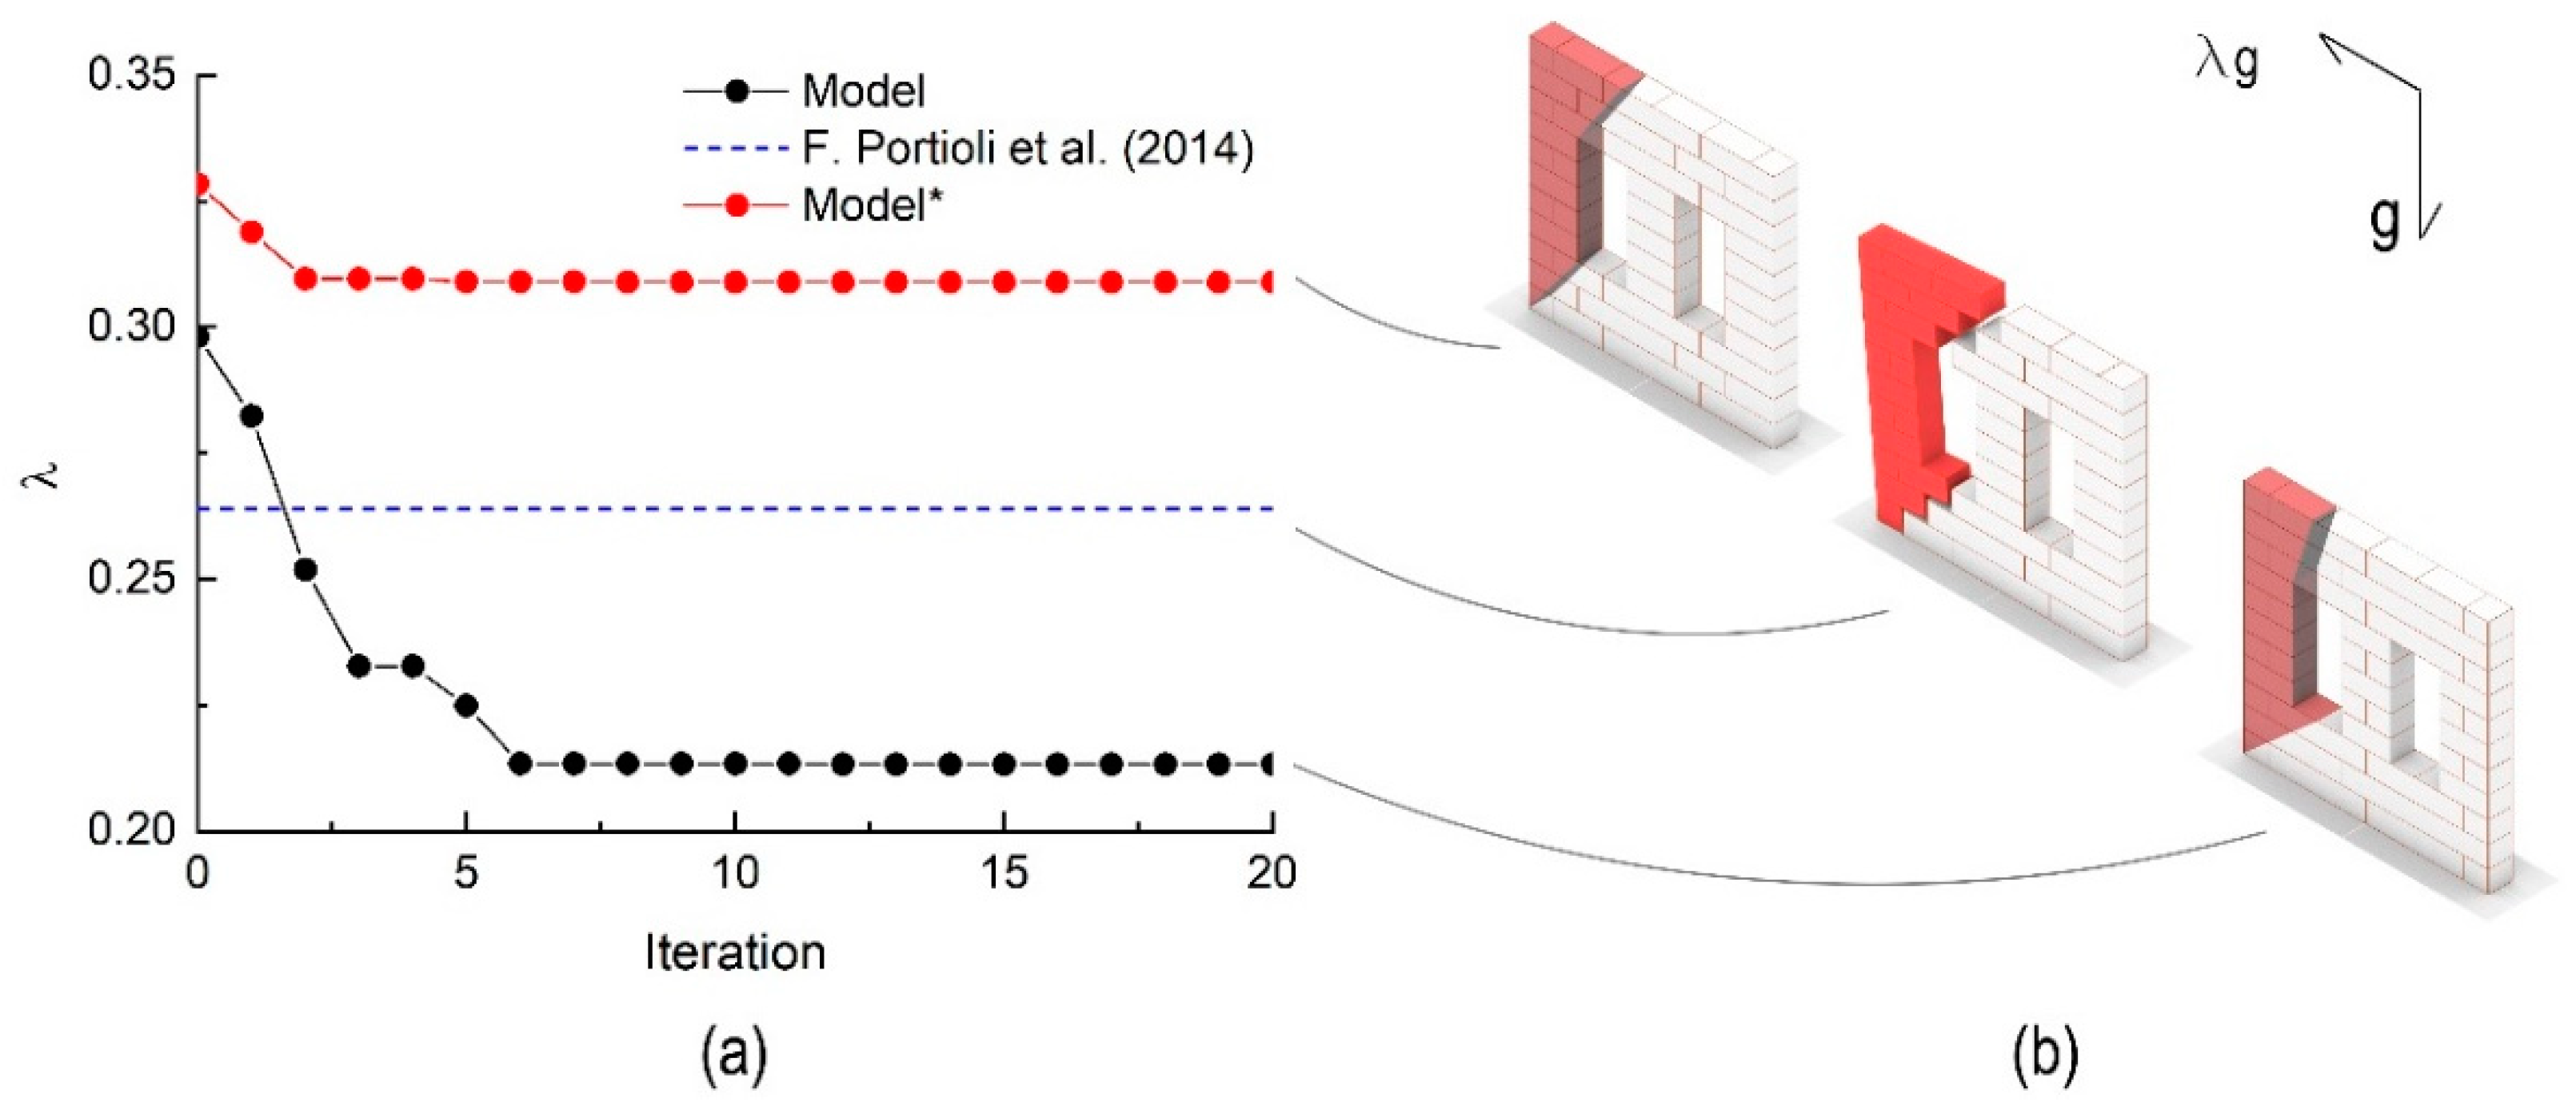
4.2. Masonry Wall with Openings Loaded In-Plane
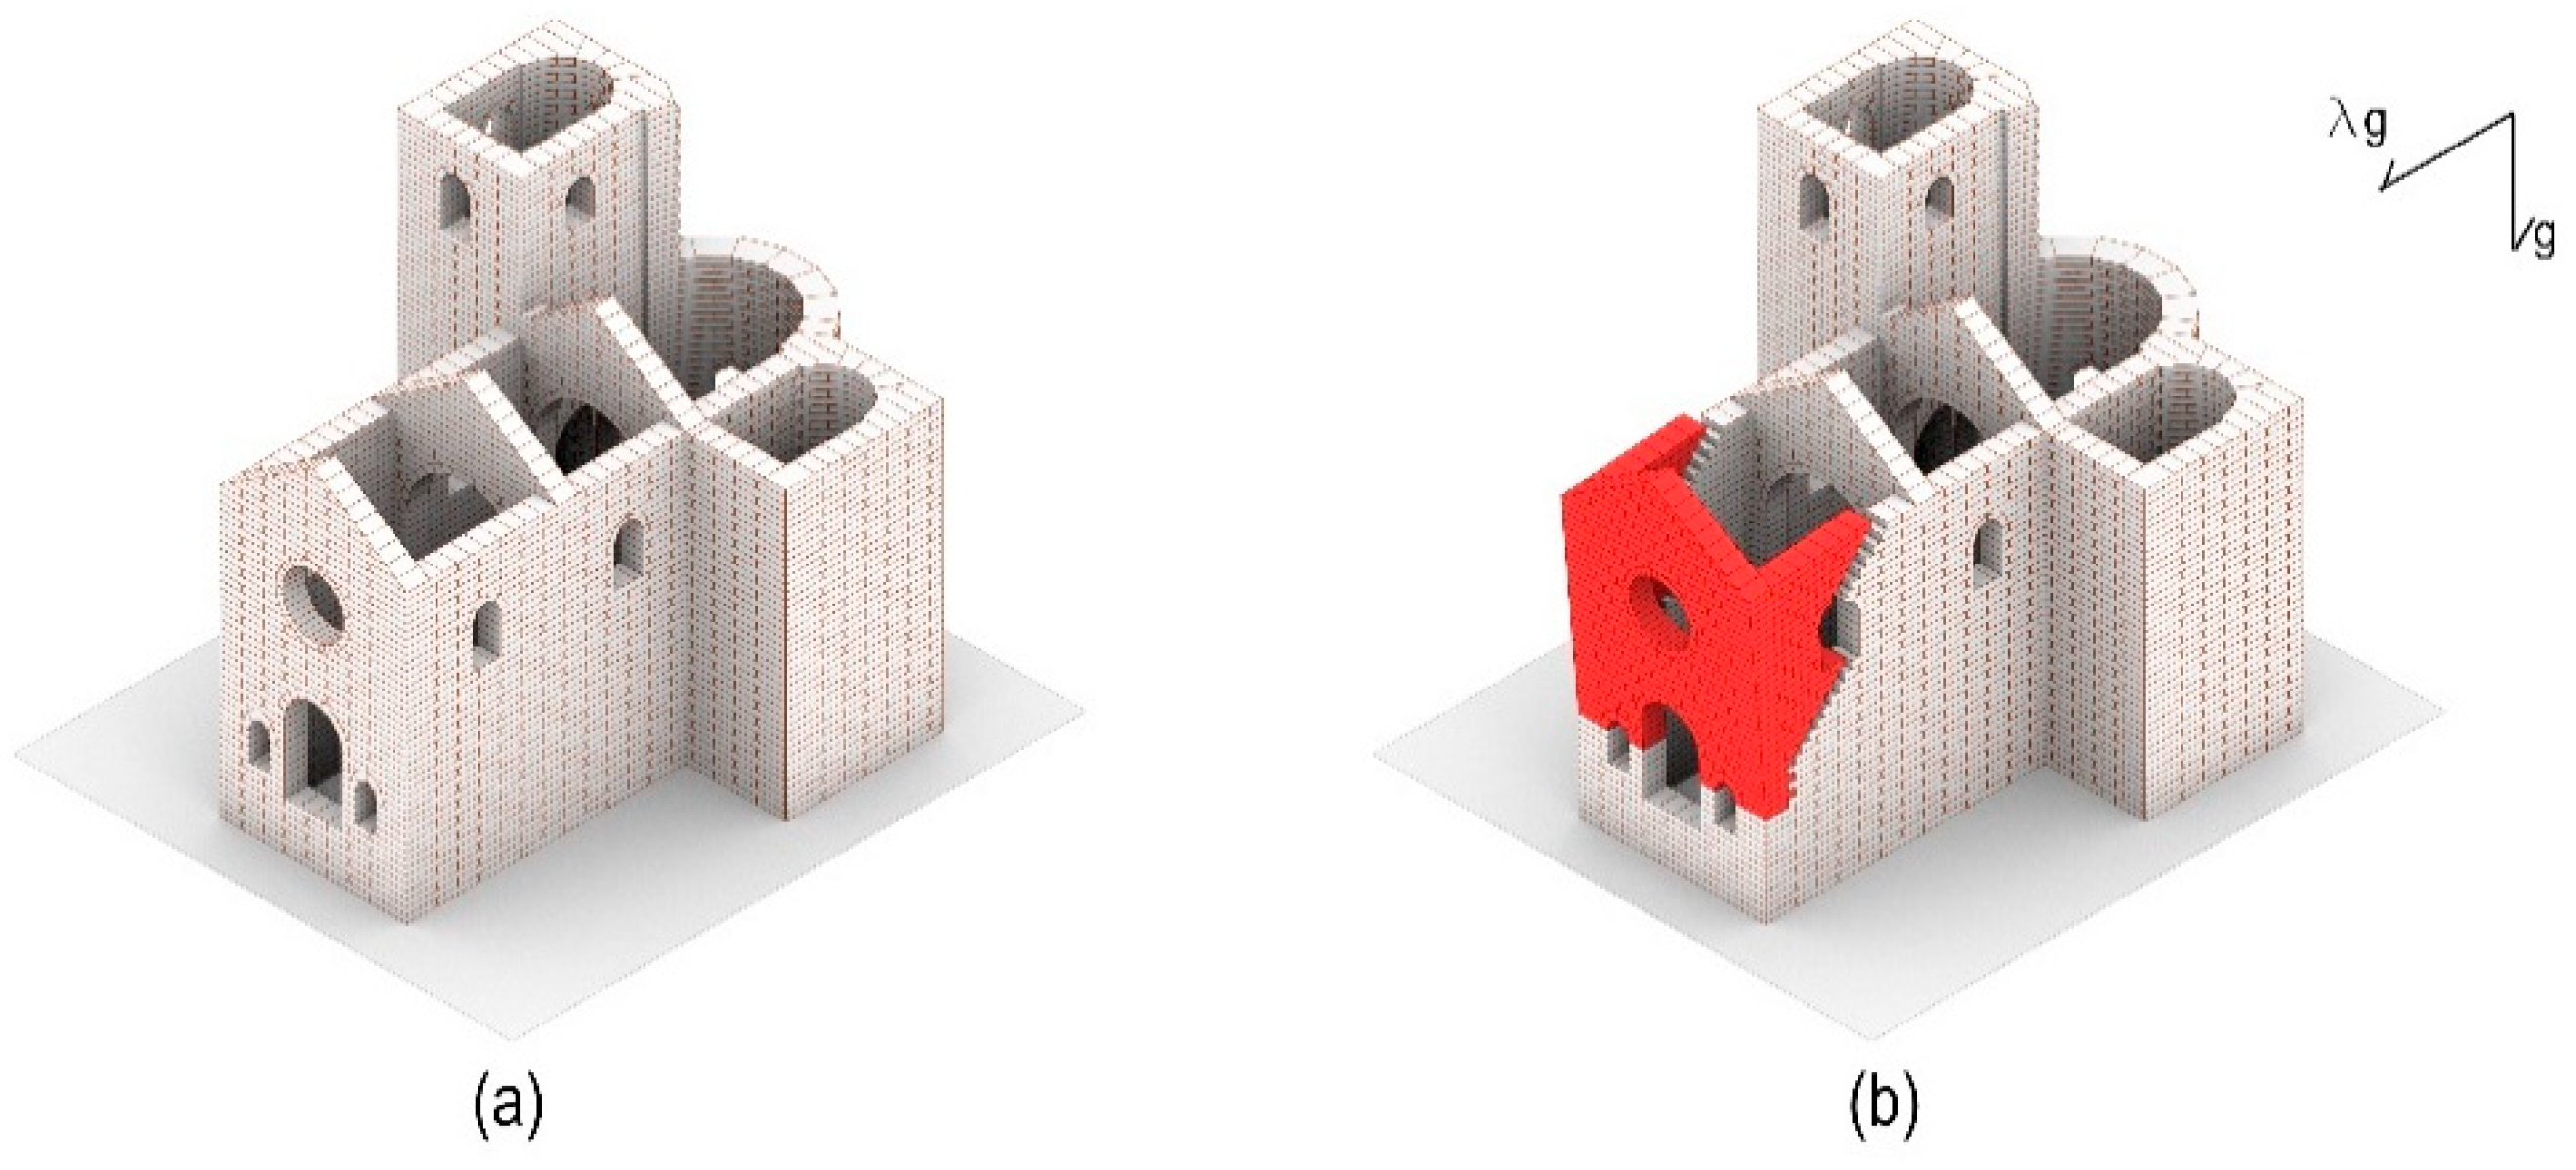
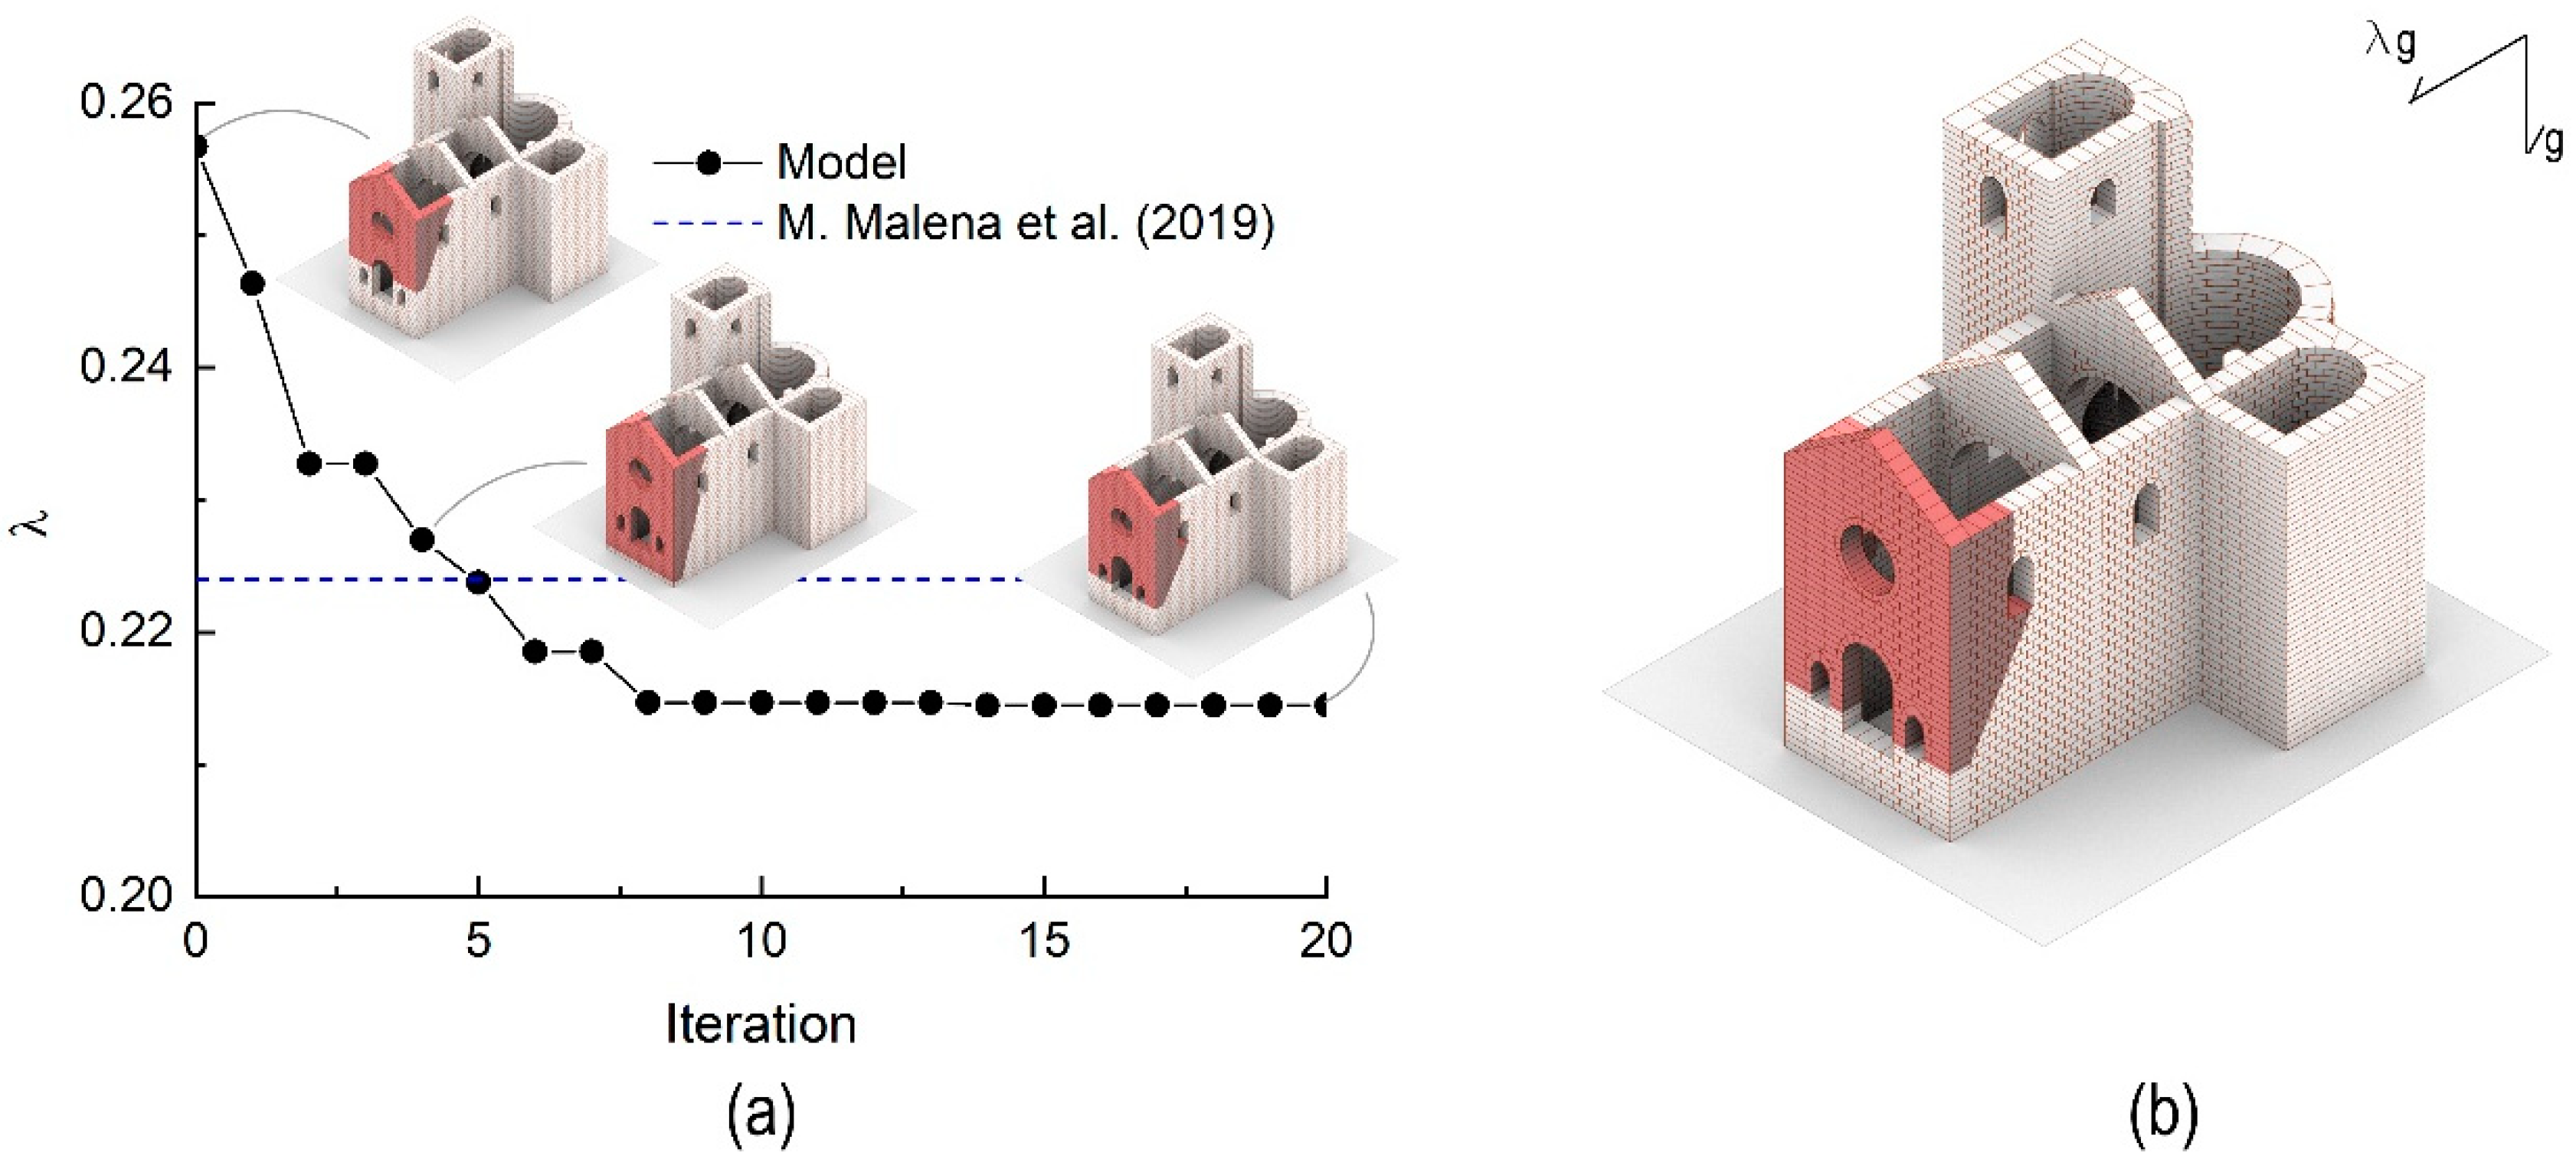
4.3. Church Loaded Out-of-Plane
5. The Step towards Full Dynamic Seismic Assessment Tools
5.1. Code Based Assessment According to the Italian Building Code
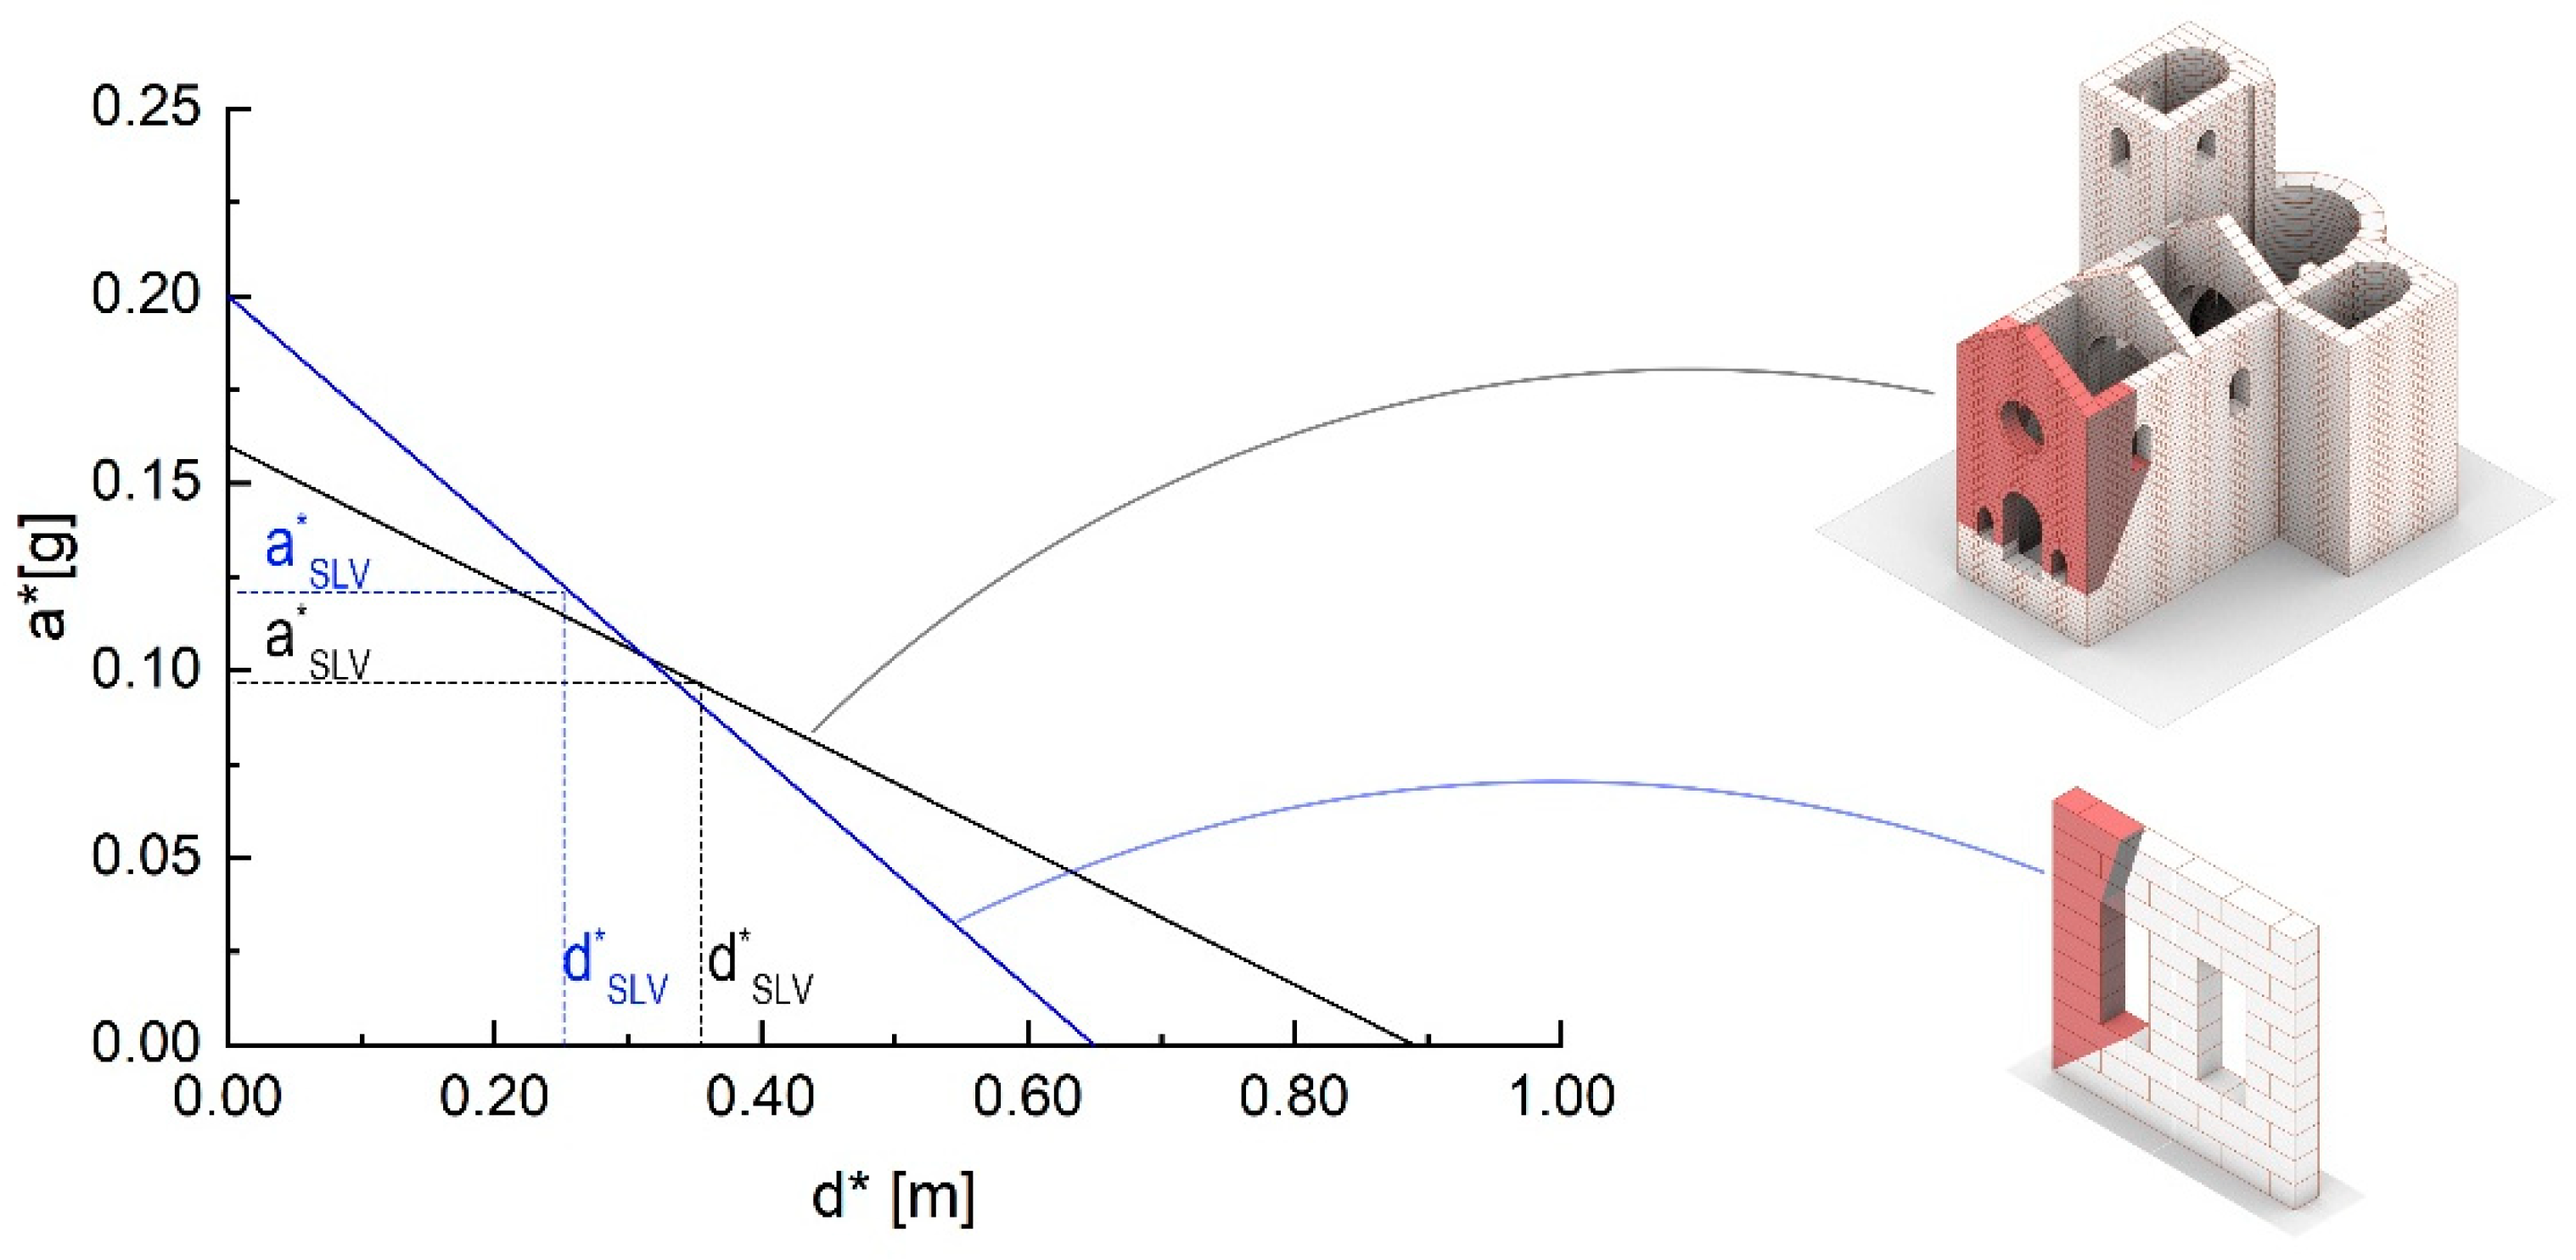
5.2. Comparison of Rocking Analysis Results with Code-Based Assessment Procedures
5.2.1. Masonry Wall Loaded in Its Plane with Openings
5.2.2. Church Loaded Out-of-Plane
6. Conclusions
- The upper bound limit analysis coupled with the NMM tool is able to find the minimum load multiplier and the associate collapse mechanism in less than 5 s.
- The scale effect is not considered in the force-based approach, which can lead to considerably different results to those obtained from the displacement-based procedure.
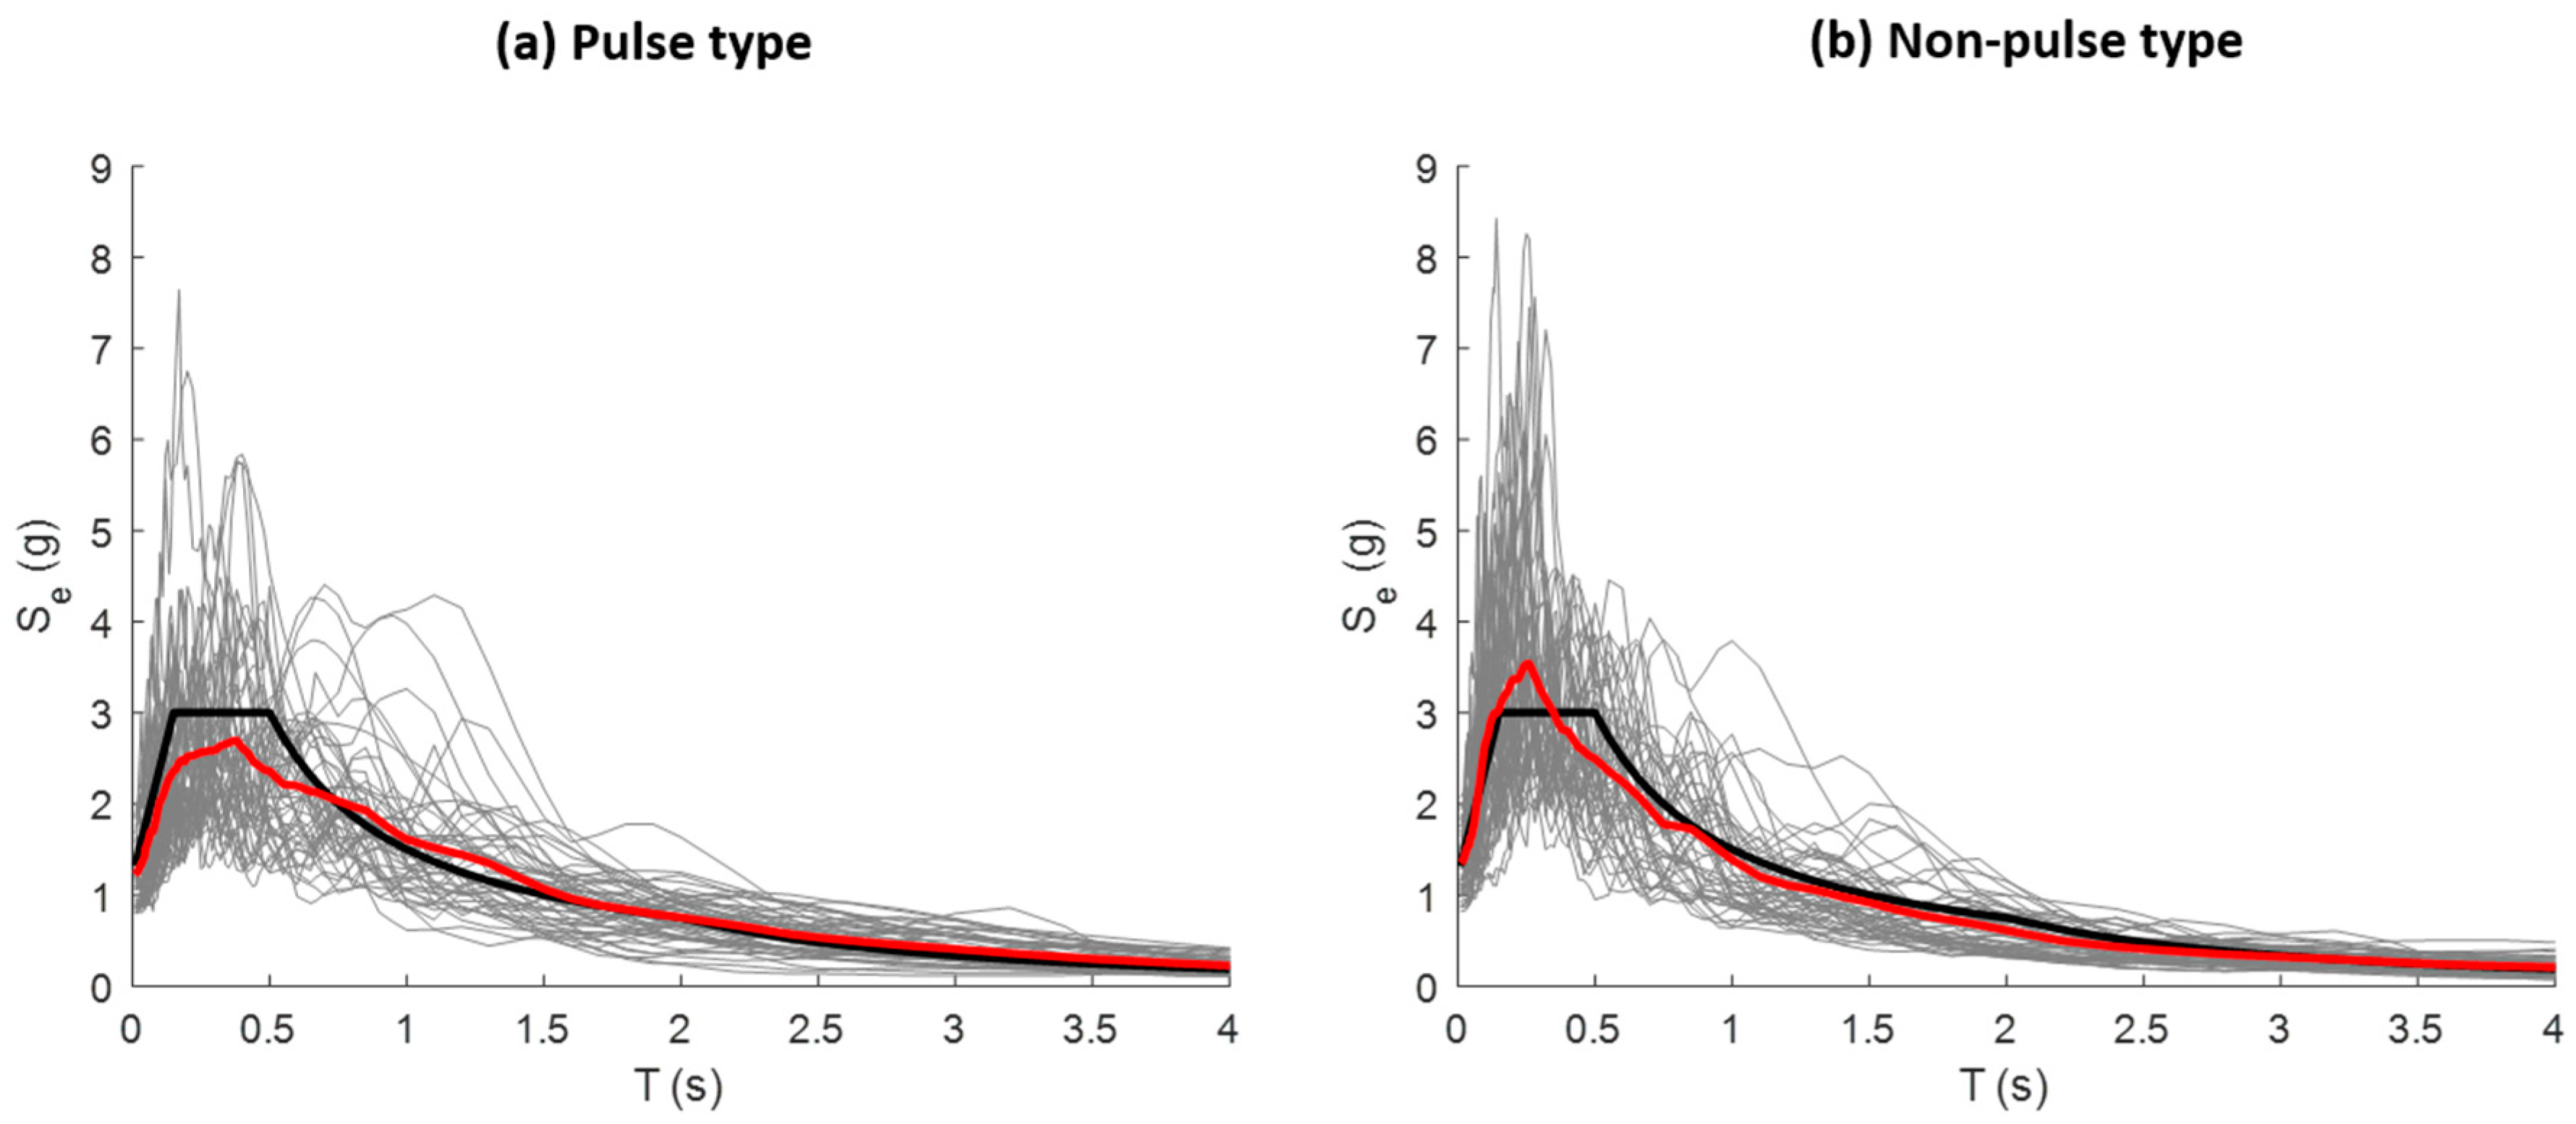
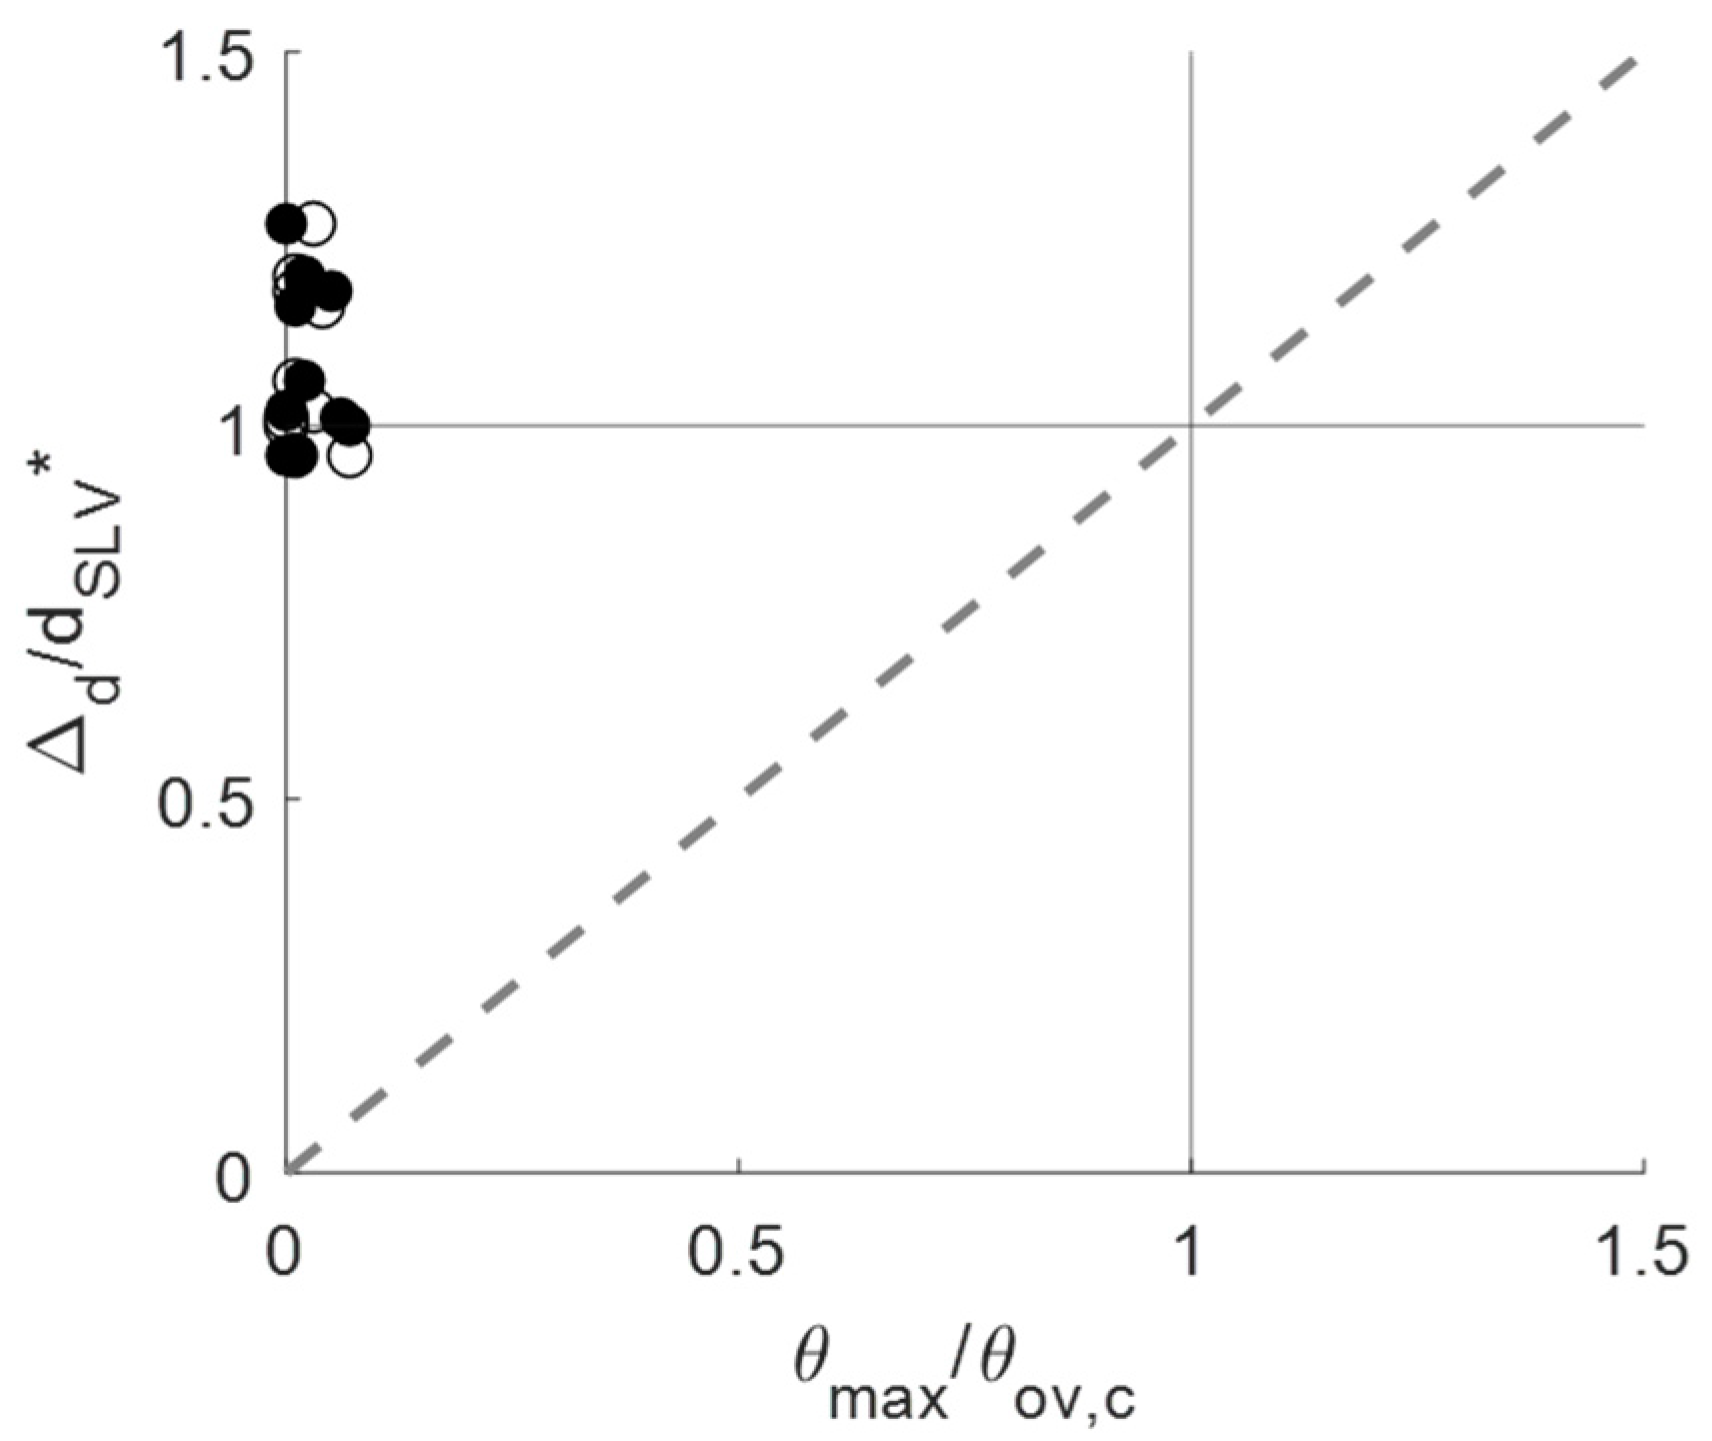
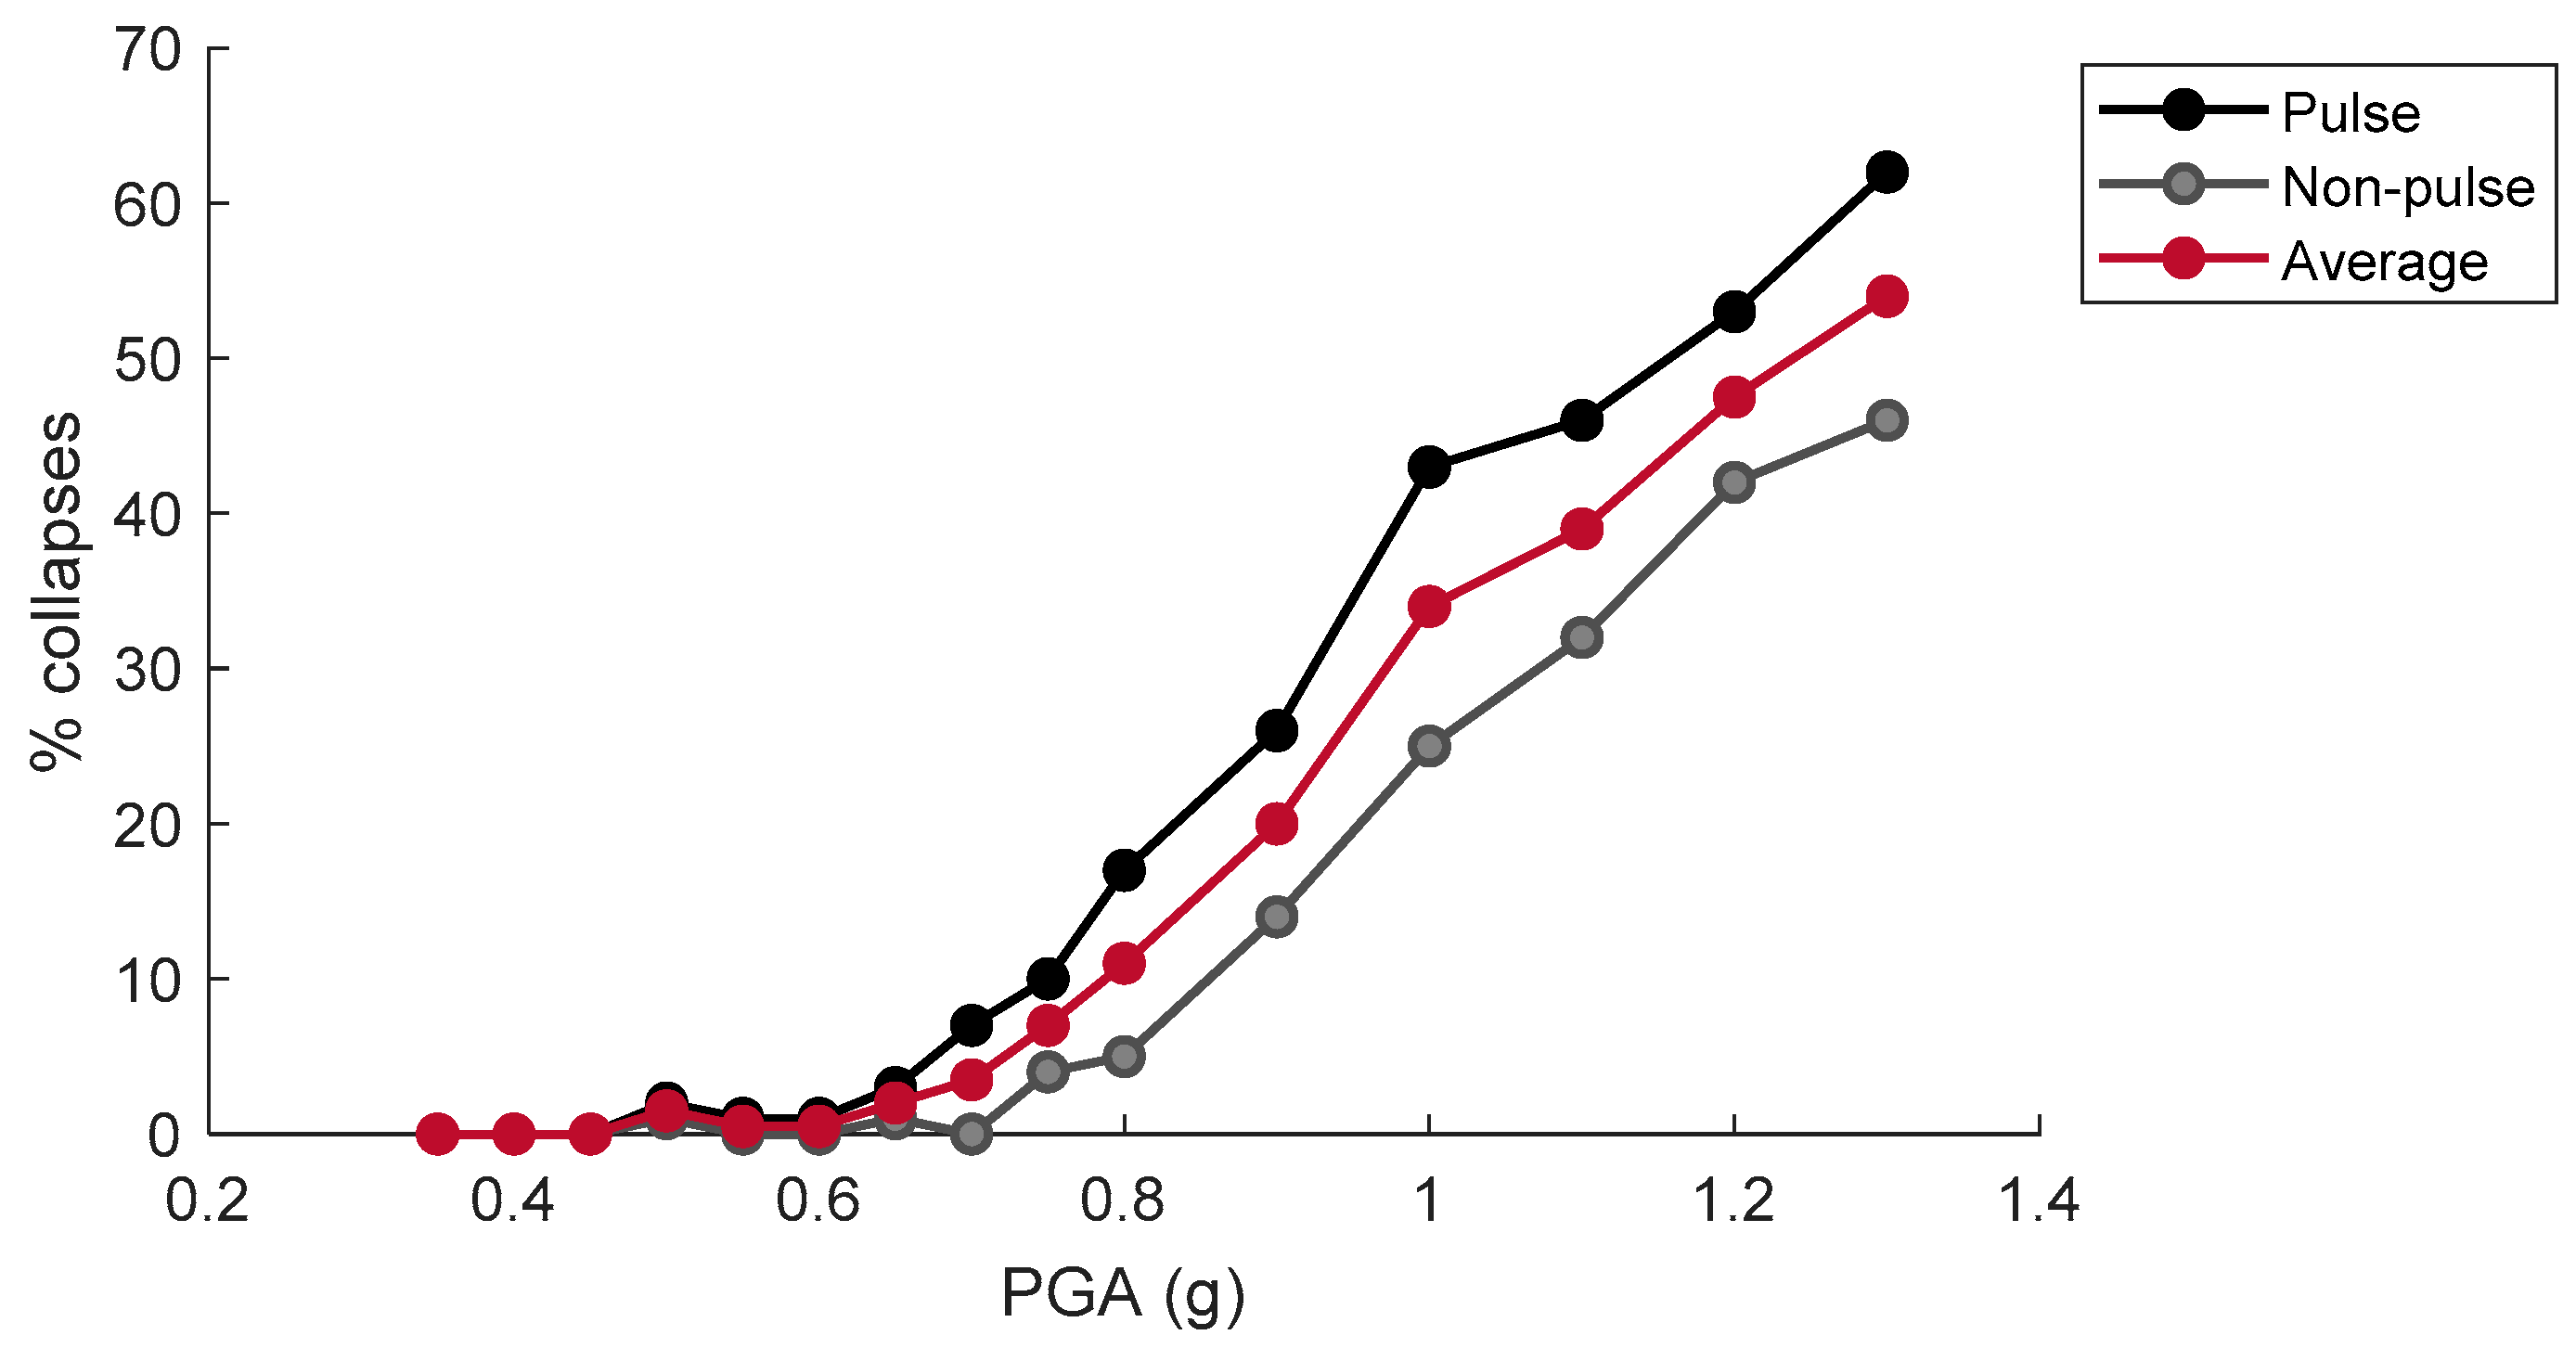
- Both the displacement-based method and rocking dynamics were able to capture the sensitivity of the response to ground motion characteristics - specifically the more destructive influence of the pulse-type ground motions. However, the code-based procedure tends to predict larger displacement demands than the rocking model, which in practice may result in expensive and at times unnecessary interventions, while also not being able to reproduce motion evolution over time.
- The solution to the rocking equation of motion is obtained, on average, within a maximum of 10 s, thus demonstrating the ability of the proposed tool/procedure to conduct a large number of analyses in a time frame compatible with engineering practice.
- The definition of safety requires a full stochastic approach, which is the objective of the work currently being developed by the authors.
Author Contributions
Funding
Institutional Review Board Statement
Informed Consent Statement
Data Availability Statement
Acknowledgments
Conflicts of Interest
References
- Jaiswal, K.; Wald, J.D. Estimating economic losses from earthquakes using an empirical approach. Earthq. Spectra 2013, 29, 309–324. [Google Scholar] [CrossRef]
- Stepinac, M.; Kisicek, T.; Renić, T.; Hafner, I.; Bedon, C. Methods for the assessment of critical properties in existing masonry structures under seismic loads-the ARES project. Appl. Sci. (Switzerland) 2020, 10, 1576. [Google Scholar] [CrossRef] [Green Version]
- Silva, L.C.; Mendes, N.; Lourenço, P.B.; Ingham, J. Seismic Structural Assessment of the Christchurch Catholic Basilica, New Zealand. Structures 2018, 15, 115–130. [Google Scholar] [CrossRef] [Green Version]
- Fortunato, G.; Funari, M.F.; Lonetti, P. Survey and seismic vulnerability assessment of the Baptistery of San Giovanni in Tumba (Italy). J. Cult. Herit. 2017, 26, 64–78. [Google Scholar] [CrossRef]
- Cascardi, A.; Micelli, F.; Aiello, M.A.; Funari, M. Structural analysis of a masonry church with variable cross-section dome. In Brick and Block Masonry-From Historical to Sustainable Masonry, Proceedings of the 17th International Brick/Block Masonry Conference (17thIB2MaC 2020), Kraków, Poland, 5–8 July 2020; CRC Press: Boca Raton, FL, USA, 2020. [Google Scholar]
- Lemos, J.V. Discrete element modeling of masonry structures. Int. J. Archit. Herit. 2007, 1, 190–213. [Google Scholar] [CrossRef]
- Lourenço, P.B. Computations on historic masonry structures. Prog. Struct. Eng. Mater. 2002, 4, 301–319. [Google Scholar] [CrossRef]
- De Felice, G.; De Santis, S.; Lourenço, P.B.; Mendes, N. Methods and challenges for the seismic assessment of historic masonry structures. Int. J. Archit. Herit. 2017, 11, 143–160. [Google Scholar] [CrossRef] [Green Version]
- Heyman, J. The stone skeleton. Int. J. Solids Struct. 1966, 2, 249–279. [Google Scholar] [CrossRef]
- D’Altri, A.M.; Sarhosis, V.; Milani, G.; Rots, J.; Cattari, S.; Lagomarsino, S.; Sacco, E.; de Miranda, S.; Tralli, A.; Castellazzi, G. A review of numerical models for masonry structures. In Numerical Modeling of Masonry and Historical Structures: From Theory to Application; Woodhead Publishing: Cambrdige, UK, 2019; Volume 1. [Google Scholar]
- Chiozzi, A.; Milani, G.; Grillanda, N.; Tralli, A. A fast and general upper-bound limit analysis approach for out-of-plane loaded masonry walls. Meccanica 2018, 53, 1875–1898. [Google Scholar] [CrossRef]
- Casapulla, C.; Portioli, F.; Maione, A.; Landolfo, R. A macro-block model for in-plane loaded masonry walls with non-associative Coulomb friction. Meccanica 2013, 48, 2107–2126. [Google Scholar] [CrossRef]
- Casapulla, C.; Cascini, L.; Portioli, F.; Landolfo, R. 3D macro and micro-block models for limit analysis of out-of-plane loaded masonry walls with non-associative Coulomb friction. Meccanica 2014, 49, 1653–1678. [Google Scholar] [CrossRef]
- Funari, M.F.; Spadea, S.; Lonetti, P.; Fabbrocino, F.; Luciano, R. Visual programming for structural assessment of out-of-plane mechanisms in historic masonry structures. J. Build. Eng. 2020, 31, 101425. [Google Scholar] [CrossRef]
- Circolare n. 7 del 21 Gennaio 2019. Istruzioni per l’applicazione dell’«Aggiornamento delle “Norme tecniche per le costruzioni”» di cui al DM 17 gennaio 2018. CS LL. PP. 2019, Volume 2019. Available online: https://www.gazzettaufficiale.it/eli/id/2019/02/11/19A00855/sg (accessed on 20 December 2017).
- Aggiornamento Delle Norme Tecniche per le Costruzioni. Gazzetta Ufficiale Serie Generale. 2018. Available online: https://www.gazzettaufficiale.it/eli/id/2018/02/20/18A00716/sg (accessed on 20 December 2017).
- Shawa, O.A.; de Felice, G.; Mauro, A.; Sorrentino, L. Out-of-plane seismic behaviour of rocking masonry walls. Earthq. Eng. Struct. Dyn. 2012, 41, 949–968. [Google Scholar] [CrossRef]
- Housner, G.W. The behavior of inverted pendulum structures during earthquakes. Bull. Seismol. Soc. Am. 1963, 53, 403–417. [Google Scholar]
- DeJong, M.J. Seismic response of stone masonry spires: Analytical modeling. Eng. Struct. 2012, 40, 556–565. [Google Scholar] [CrossRef]
- Mauro, A.; de Felice, G.; DeJong, M.J. The relative dynamic resilience of masonry collapse mechanisms. Eng. Struct. 2015, 85, 182–194. [Google Scholar] [CrossRef]
- Doherty, K.; Griffith, M.C.; Lam, N.; Wilson, J. Displacement-based seismic analysis for out-of-plane bending of unreinforced masonry walls. Earthq. Eng. Struct. Dyn. 2002, 31, 833–850. [Google Scholar] [CrossRef]
- De Lorenzis, L.; DeJong, M.; Ochsendorf, J. Failure of masonry arches under impulse base motion. Earthq. Eng. Struct. Dyn. 2007, 36, 2119–2136. [Google Scholar] [CrossRef]
- Allen, R.; Oppenheim, I.; Parker, A.; Bielak, J. On the dynamic response of rigid body assemblies. Earthq. Eng. Struct. Dyn. 1986, 14, 861–876. [Google Scholar] [CrossRef]
- Makris, N.; Vassiliou, M.F. Planar rocking response and stability analysis of an array of free-standing columns capped with a freely supported rigid beam. Earthq. Eng. Struct. Dyn. 2013, 42, 431–449. [Google Scholar] [CrossRef]
- DeJong, M.J.; Dimitrakopoulos, E.G. Dynamically equivalent rocking structures. Earthq. Eng. Struct. Dyn. 2014, 43, 1543–1563. [Google Scholar] [CrossRef]
- Mehrotra, A.; DeJong, M.J. A CAD-interfaced dynamics-based tool for analysis of masonry collapse mechanisms. Eng. Struct. 2018, 172, 833–849. [Google Scholar] [CrossRef]
- Porter, D.W.; Mehrotra, A.; Dejong, M.J.; Bass, A.; Guebard, M.; Ochsendorf, J. Material and seismic assessment of the great house at casa grande ruins national monument, Arizona. J. Archit. Eng. 2020, 26, 05019007. [Google Scholar] [CrossRef]
- Turco, C.; Funari, M.F.; Spadea, S.; Ciantia, M.; Lourenço, P.B. A digital tool based on Genetic Algorithms and Limit Analysis for the seismic assessment of historic masonry buildings. Procedia Struct. Integr. 2020, 28, 1511–1519. [Google Scholar] [CrossRef]
- Lagarias, J.C.; Reeds, J.A.; Wright, M.H.; Wright, P.E. Convergence properties of the Nelder-Mead simplex method in low dimensions. SIAM J. Optim. 1998, 9, 112–147. [Google Scholar] [CrossRef] [Green Version]
- McNeel, R. Grasshopper. Algorithmic Modeling for Rhino. Available online: https://www.grasshopper3d.com/ (accessed on 20 December 2017).
- Casapulla, C.; Argiento, L.U. In-plane frictional resistances in dry block masonry walls and rocking-sliding failure modes revisited and experimentally validated. Compos. Part B Eng. 2018, 132, 197–213. [Google Scholar] [CrossRef]
- Casapulla, C.; Maione, A.; Argiento, L.U.; Speranza, E. Corner failure in masonry buildings: An updated macro-modeling approach with frictional resistances. Eur. J. Mech. A/Solids 2018, 70, 213–225. [Google Scholar] [CrossRef]
- Luersen, M.A.; Le Riche, R. Globalized Nelder–Mead method for engineering optimization. Comput. Struct. 2004, 82, 2251–2260. [Google Scholar] [CrossRef]
- Harris, C.R.; Millman, K.J.; van der Walt, S.J.; Gommers, R.; Virtanen, P.; Cournapeau, D.; Wieser, E.; Taylor, J.; Berg, S.; Smith, N.J.; et al. Array programming with NumPy. Nature 2020, 585, 357–362. [Google Scholar] [CrossRef]
- Virtanen, P.; Gommers, R.; Oliphant, T.E.; Haberland, M.; Reddy, T.; Cournapeau, D.; Burovski, E.; Peterson, P.; Weckesser, W.; Bright, J.; et al. SciPy 1.0: Fundamental algorithms for scientific computing in Python. Nat. Methods 2020, 17, 261–272. [Google Scholar] [CrossRef] [Green Version]
- Digital Structures. GH Python Remote. Available online: https://github.com/pilcru/ghpythonremote (accessed on 9 October 2020).
- Gregson, S. Nelder-Mead Optimisation (EOC). 2018. Available online: https://www.eocengineers.com/en/news/digital-design-group-tackles-classic-engineering-problem (accessed on 20 December 2017).
- Orduña, A. Seismic Assessment of Ancient Masonry Structures by Rigid Blocks Limit Analysis. Ph.D. Thesis, University of Minho, Guimaraes, Portugal, 2003. [Google Scholar]
- Portioli, F.; Casapulla, C.; Gilbert, M.; Cascini, L. Limit analysis of 3D masonry block structures with non-associative frictional joints using cone programming. Comput. Struct. 2014, 143, 108–121. [Google Scholar] [CrossRef]
- Casapulla, C.; D’Ayala, D. In-plane collapse behaviour of masonry walls with frictional resistances and openings. In Structural Analysis of Historical Constructions. Possibilities of Numerical and Experimental Techniques, Proceedings of the 5th International Conference, New Delhi, India, 6–8 November 2006; Macmillan India Ltd.: New Delhi, India, 2006. [Google Scholar]
- Malena, M.; Portioli, F.; Gagliardo, R.; Tomaselli, G.; Cascini, L.; de Felice, G. Collapse mechanism analysis of historic masonry structures subjected to lateral loads: A comparison between continuous and discrete models. Comput. Struct. 2019, 220, 14–31. [Google Scholar] [CrossRef]
- European Committee for Standardization. Eurocode 8: Design of Structures for Earthquake Resistance-Part 1: General Rules, Seismic Actions and Rules for Buildings; European Committee for Standardization: Brussels, Belgium, 2005. [Google Scholar]
- SIMQKE_GR. Available online: http://gelfi.unibs.it/software/simqke/simqke_gr.htm (accessed on 9 December 2020).
- Gasparini, D.A.; Vanmarcke, E.H. SIMQKE: A Program for Artificial Motion Generation. User’s Manual and Documentation; Department of Civil Engineering, Massachusetts Institute of Technology: Cambridge, MA, USA, 1976. [Google Scholar]
- PEER. PEER Ground Motion Database; University of California: Berkeley, CA, USA, 2014. [Google Scholar]


| Parameter | S | TB (s) | TC (s) | TD (s) | η |
|---|---|---|---|---|---|
| Value | 1.2 | 0.15 | 0.5 | 2.0 | 1.0 |
| Mechanism | ag,FB (g) | ag,DB (g) |
|---|---|---|
| Masonry wall with openings | 0.33 | 0.35 |
| Church | 0.27 | 0.48 |
| SF | ag,FB (g) | ag,DB (g) |
|---|---|---|
| 1 | 0.27 | 0.48 |
| 1/2 | 0.24 | |
| 1/3 | 0.17 |
| peq (s−1) | (rad) | ηCOR |
|---|---|---|
| 1.55 | 0.20 | −0.61 |
| peq (s−1) | (rad) | ηCOR |
|---|---|---|
| 1.19 | 0.16 | −0.46 |
Publisher’s Note: MDPI stays neutral with regard to jurisdictional claims in published maps and institutional affiliations. |
© 2021 by the authors. Licensee MDPI, Basel, Switzerland. This article is an open access article distributed under the terms and conditions of the Creative Commons Attribution (CC BY) license (http://creativecommons.org/licenses/by/4.0/).
Share and Cite
Funari, M.F.; Mehrotra, A.; Lourenço, P.B. A Tool for the Rapid Seismic Assessment of Historic Masonry Structures Based on Limit Analysis Optimisation and Rocking Dynamics. Appl. Sci. 2021, 11, 942. https://0-doi-org.brum.beds.ac.uk/10.3390/app11030942
Funari MF, Mehrotra A, Lourenço PB. A Tool for the Rapid Seismic Assessment of Historic Masonry Structures Based on Limit Analysis Optimisation and Rocking Dynamics. Applied Sciences. 2021; 11(3):942. https://0-doi-org.brum.beds.ac.uk/10.3390/app11030942
Chicago/Turabian StyleFunari, Marco Francesco, Anjali Mehrotra, and Paulo B. Lourenço. 2021. "A Tool for the Rapid Seismic Assessment of Historic Masonry Structures Based on Limit Analysis Optimisation and Rocking Dynamics" Applied Sciences 11, no. 3: 942. https://0-doi-org.brum.beds.ac.uk/10.3390/app11030942