
Category-Theoretic Formulation of the Model-Based Systems Architecting Cognitive-Computational Cycle


1
Engineering Systems Laboratory, Aeronautics and Astronautics Department, Massachusetts Institute of Technology, Cambridge, MA 02139, USA
2
Department of Computer & Information Science and Engineering, University of Florida, Gainesville, FL 32611, USA
*
Author to whom correspondence should be addressed.
Appl. Sci. 2021, 11(4), 1945; https://0-doi-org.brum.beds.ac.uk/10.3390/app11041945
Submission received: 12 December 2020
/
Revised: 17 February 2021
/
Accepted: 19 February 2021
/
Published: 23 February 2021
(This article belongs to the Special Issue Model-Based Systems Engineering: Rigorous Foundations for Digital Transformations in Science and Engineering)
Abstract
:Simple Summary
This paper introduces a holistic framework, underpinned by Category Theory, for the process of conceptual modeling of complex engineered systems, generically representing the models as graph data structures, rendering stakeholder-informing views like matrices and visual graphs from the graph data structure, and reasoning about the visualized information in order to refine and enhance the concept of the system. This iterative process—a composition of a cognitive segment with a computational segment—proves to be an important formulation of the model-based systems architecting cycle.
Abstract
We introduce the Concept→Model→Graph→View Cycle (CMGVC). The CMGVC facilitates coherent architecture analysis, reasoning, insight, and decision making based on conceptual models that are transformed into a generic, robust graph data structure (GDS). The GDS is then transformed into multiple views of the model, which inform stakeholders in various ways. This GDS-based approach decouples the view from the model and constitutes a powerful enhancement of model-based systems engineering (MBSE). The CMGVC applies the rigorous foundations of Category Theory, a mathematical framework of representations and transformations. We show that modeling languages are categories, drawing an analogy to programming languages. The CMGVC architecture is superior to direct transformations and language-coupled common representations. We demonstrate the CMGVC to transform a conceptual system architecture model built with the Object Process Modeling Language (OPM) into dual graphs and a stakeholder-informing matrix that stimulates system architecture insight.
1. Introduction
Models represent concepts by capturing the ideas, observations, notions, theories, insights, and intents that people conceive of and wish to express and communicate to others [1]. A Conceptual model uses the syntax and semantics of a modeling language to describe concepts. A popular example for concept modeling depicts Isaac Newton’s observation and conception of gravity in the falling of an apple from a tree, and the ensuing formulation of Newton’s Theory of Gravity. Models represent scientific concepts, as projections of theories on phenomena; they describe and abstract phenomena, while relying on theories that may be hypothetical or partially validated [2]. Likewise, models represent engineered, man-made systems in their current or future state [3].
Models also inform concepts: we can enrich our concept, perception, and subject matter understanding by capturing, manipulating, contextualizing, composing, and analyzing modeled concepts and aspects. Conceptual models play a central and growingly more critical role in complex systems engineering, development and operation. Models are supposed to capture and represent various relations and interactions, which are fundamental for comprehending solutions, designs, or operational processes. Models are also important for facilitating stakeholder communication and discussion. The concept–model duo is therefore a binary self-enhancing system.
Model-Based systems engineering (MBSE) is the formalized application of models in systems engineering [4]. MBSE facilitates the digital transformation of systems engineering: generating and communicating digitally-encoded and interchangeable systems engineering deliverables up and down the value chain [5]. Digital systems engineering (DSE) increases the dependency on MBSE, which gradually evolves from a model-focused practice to a value-focused approach and to a critical asset for systems engineering in digital enterprises [6,7,8,9].
Generating stakeholder value out of model-based platforms is a primary expected outcome of DSE. Transforming system models into analyzable and reusable artifacts, decision-supporting information, and machine-generated insight is therefore a critical contribution to enterprise-wide DSE. A DSE ecosystem architecture defined in [10] specifies modeling, infrastructure, data services, simulation, testing, analysis, and repositories (MIDSTAR1) as primary DSE services. Management tools, interoperability services, digital representations, systems, things, auditing, and reporting services (MIDSTAR2) are regarded as primary interfaces. We shall refer collectively to such results or artifacts following model processing or analysis as views of those models.
Model-based views abstract, highlight, or pivot specific aspects, and become increasingly more important as models grow bigger and more complicated. Observing, reasoning about, processing, analyzing, and deciding according to such views results in ongoing concept revisions [11]. The self-enhancing concept–model–view triangular cycle extends the concept–model duo. However, the potential combination of modeling languages (MLs), models, and views explodes: if every model were to be represented by every necessary view, the number of mappings would be a product of the number of models by the number of views , i.e., .
In the absence of dynamic and robust model-to-view transforms, concept understanding is shaped by ML-bound views. A generic representation (GR) across a wide variety of models that MLs could map into, and views could map out of, can make a difference. Graph data structures (GDS) can serve as GRs [12,13,14,15]. A GDS is simple, robust, scalable, and amenable to both relational and graph-theoretic algorithms. Graph and GDS are not completely interchangeable concepts: A graph is a visual representation of a subset of the GDS, and a GDS is a logical data structure that represents relations, which can be illustrated in graphs. Nevertheless, the term graph is used for brevity and intuition for the GDS. A graph rendition of any portion of a GDS, whether raw or processed, is indeed a view of the model. A robust transformation of models into GDS, and generation of views from GDS, shall make models and views interoperable and interchangeable, and extend the collection of views that support model analysis. A concept–model–graph–view quadratic cycle is potentially a more effective, extensive, and efficient cognitive–computational concept modeling and analysis process than the concept–model–view trio. The evolution from the concept–model duo through concept–model–view trio to concept–model–graph–view cycle (CMVGVC) is illustrated in Figure 1.
Matrices are useful views of models. Matrices facilitate analyzing quantitative and qualitative relations. A matrix is a bidimensional discrete data structure that lends itself to various mathematical or logical analyses. Matrices are common, intuitive, and easy to work with for scientists, engineers, and analysts. As graphic MLs evolved, matrices had not found a place as formal representation modalities, although matrix-like structures or layouts remained present to some extent in modeling frameworks. The IDEF0 notation advocates a diagonal layout of blocks that resembles the N2 matrix of inter-component dependencies [16]. UML Activity Diagrams assume a “swimlane” layout that helps divide complex multi-participant activities with columns. Sequence Diagrams apply a similar idea, using vertically-aligned lifelines as anchors for input and output exchange steps [17].
Simple matrices are two-dimensional and non-hierarchical. This construct is insufficient for describing complex architectures. Requirements or structural elements are leaves in an asymmetric hierarchy, which may differ in depth and detail level. Therefore, the matrix kernel must be integrated with hierarchical representations of row and column entities. Advanced matrix representations for systems engineering include the Verification Cross-Reference Matrix (VCRM), Design Structure Matrix (DSM), and System Architecture Matrix (SAM). The Department of Defense Architecture Framework (DoDAF) advocates the use of matrices in some of its views [18].
We collectively refer to advanced purpose-driven matrices as described above as Stakeholder-Informing Matrices (SIMs). A SIM is any matrix, matrix-like, or matrix-based data representation, whose purpose is to inform stakeholders, decision-makers, analysts, and other readers, to help them reason, make better decisions, and take informed action. SIMs organize, summarize, and contextualize information that may be scattered across multiple models or sections of models.
Various attempts to represent models with SIMs were mostly model-, aspect-, language-, or visualization-specific (see Section 2.3). A mathematically sound and robust framework for transforming models to views is needed. In fact, since models are instantiations of MLs, and modeling consists of instantiations of ML patterns, we ought to transform the ML’s set of patterns into a superset of representable data structures, rather than a specific model into a specific view.
This paper defines the CMGVC and introduces the cognitive and computational transforms it includes. Our framework relies on Category Theory [19]. A mathematical category consists of objects and morphisms. An object represents a type, and a morphism is a mapping between types. The Curry–Howard–Lambek Correspondence states that categories, theories, and programming languages are equivalent, and that writing a software program is like defining a category and like proving a theory [20,21]. The observation that software programming is like theory-building and the importance of explicit encoding of the underlying knowledge and concept as part of the software program, rather than as implicit in the designer’s mind was discussed by Naur [22].
The categorical equivalence of programs, concepts, and theories has inspired us to assert that modeling languages are categories, and that mappings within and between modeling categories are powerful means of robust model transformations for various applications. This assertion substantiates a formal, holistic approach for perceiving and implementing concept transformations, particularly in complex systems. Such an approach is instrumental for reasoning about complex concepts using the reasoning mechanisms of people’s choice, rather than the representation mechanisms originally used for capturing those concepts. In complex systems, this idea of concept representation interchangeability is critical for a paradigm shift, cohesion of modeling and reasoning practices, and enabling digital systems engineering [10].
This paper advances the state of the art in several ways: (a) asserting and proving that modeling languages are categories; (b) augmenting the emerging model-based systems engineering paradigm with robust foundations using Category Theory, rather than supplanting such system representation and analysis approaches with categorical or otherwise-algebraic representations; (c) offering a holistic systems perspective over the entire life cycle, metamorphosis, and evolution of the concept, from its inception, through modeling, generic representation, and informative rendering; (d) providing mathematical evidence that this approach is superior to both direct and language-bound mappings, (e) synergistically integrating and fusing category theory, graph theory, modeling theory, systems theory, and informatics to facilitate a multi-faceted pipeline of representations, transformations, and visualizations, which is a critical building-block for the digital engineering paradigm; and (f) providing a concrete example for a concept transformation cycle that renders conceptual models built with Object–process Methodology (OPM) as graph data structures, and graph data structures as stakeholder-informing matrices, in a significantly more structured and robust manner, which allows for both additional visualization of OPM models and matrix visualization of graphs of other MLs.
The rest of this paper is organized as follows: we review related work, relevant MLs, Graph Theory, and Category Theory in Section 2. We describe the methods to conduct the CMGVC in Section 3. We briefly describe the software implementation of the framework in Section 4. We assess the framework in Section 5. We demonstrate our method in Section 6, and discuss the results in Section 7. Conclusions, and potential, ongoing, and future research appear in Section 8.
2. Related Work
We review the methods, theories, and concepts that are necessary for constructing a robust CMGVC. We introduce Object–Process Methodology (OPM), the ML used in this study, in Section 2.1. We briefly review basic concepts in Graph Theory and graph data representation in Section 2.2. We discuss stakeholder-informing matrices for systems engineering applications in Section 2.3. We review Category Theory and specifically its applications and derivatives for systems engineering and MBSE in Section 2.4. We discuss model transformation to graph in Section 2.5.
2.1. Object–Process Methodology (OPM)
OPM is a leading ML and MBSE framework [4], standardized as ISO 19450 [23], applied in thousands of studies in research and industry. OPM relies on a minimal universal ontology, comprising objects (things that exist), states (which characterize objects), processes (things that occur), and relations among them. OPM has a visual modality and a textual modality. The visual representation is a set of hierarchically organized Object–Process Diagrams (OPDs). All OPDs use the same notation, which means that OPM has only one kind of diagram, which accommodates structural, procedural, and functional aspects. OPM’s visual modality uses rectangles to represent objects, ovals to represent processes, rountangles to represent states, and few more shapes and symbols for relations.
OPM’s textual representation consists of sentences in Object–Process Language, OPL—a quasi-natural language. Each sentence corresponds to an OPD construct—a set of linked entities—and vice versa. OPL is formal, machine-readable, and color-coded. A comprehensive model-level OPL Specification (OPS) includes a set of distinct OPL sentences, such that each sentence appears in the OPS only once regardless of the number of appearances in different model diagrams. Accordingly, every statement made only once anywhere in the model holds for the entire model. Thus, modelers cannot specify two syntactically contradicting statements in two different places in the same model. The model’s logical data representation captures all entities and relations in a graphics-agnostic manner, while the graphic engine renders the visual representation according to the graphical conventions.
OPM has been broadly applied for system architecting and design, stakeholder engagement and communication, and concept validation [3,24,25,26,27]. OPM models can be easily built using OPCloud, a cloud-based modeling studio [28]. OPCloud has been applied in medicine [29], industry [30], aerospace [31], and digital transformation [10]. We used OPCloud to build models and generate specifications that we later analyzed separarely.
2.2. Graph Data Structures (GDS)
A graph is as a set of nodes (vertices), with arcs (edges) connecting pairs of nodes. In a directed graph (digraph) edges have directions (hence the common synonym “arrows”), such that a tuple <N1, R, N2> reads: “N1 R N2”, “R connects N1 to N2”, or “the direction of R is from N1 to N2”. Arrows can have types, values, and additional attributes. Figure 3i shows a simple directed graph with one type of arrow and a value index. Graphs lend themselves to various representations and visualizations, including matrices. Figure 3ii presents the graph in (i) as an adjacency matrix. The rows and columns of the adjacency matrix are the nodes of the graph, and the cells represent the values or labels of the edges.
Graphs can also be represented as flat sets of tuples <S,T,V> with S as the source node, T as the target node, and V as the value, as shown in Figure 3iii, or <R,S,T> tuples where R is a relation. A graph data structure (GDS) is a set of tuples <R,S,T>, potentially with additional tuple attributes like identity and value.
2.3. Stakeholder-Informing Matrices (SIM)
We review several examples for the theory and application of SIMs, including design structure matrices, multi-domain matrices, system architecting matrices, and pivot tables.
The Department of Defense Architecture Framework (DoDAF) encourages the use of matrices in some viewpoints [18]. However, there are no formal requirements for the structure or layout of the matrices. In some cases, the term matrix is used to describe other tabular structures that are not matrixial in essence. For instance, a table of inputs with some attributes is not a matrix. The Unified Architecture Framework (UAF), a profile of UML, is a model-based extension of DoDAF [33]. UAF advocates that aspects of the architecture specification’s traceability to operational specifications, services, resources, standards, activities, etc., are represented as matrices; however, there are no data structures or illustrations to demonstrate how matrices should be extracted from the profiles.
Design Structure Matrices/Dependency Structure Matrices (DSMs) are powerful tools for analyzing interrelated aspects, comprehension, and decision making [34]. Transforming models into DSMs is studied in [35,36,37]. DSMs require explicit definition of row and column ontologies. This is not trivial for sematic ontology, which reflects the modeled system or domain.
Multi-Domain Matrices (MDMs) extend DSMs by including multiple sets on each dimension and composing multiple matrices [38,39]. MDMs are difficult to construct and visualize due to their size. MDMs require an underlying definition of (a) a single super-set of concept terms, (b) a set-to-set mapping for all set pairs, and (c) a member–member mapping for each pair of set members.
System Architecture Matrices (SAMs) are special MDMs for system architecture analysis, e.g., a two-domain SAM that maps {Systems, Processes} to {Systems, Processes} [37]. The mapping relations can be determined per sub-SAM according to the desired analysis. An example is illustrated in Table 1a. The mappings Instrument, Effect, Generation, and Consumption are drawn from the set of OPM relations. Additionally, the mappings Attribute, Input, Output, and ID are defined as indirect yet more intuitive relations. For example, Attribute(S) is the set of model entities Ei that participate in an Exhibition–Characterization relation to S: Exhibition(S,Ei) or Characterization(Ei,S). Input(Pcolumn) is the set of entities Ei with an Instrument(Ei,Pcolumn) or Consumption(Ei,Pcolumn) relation to Pcolumn. A 3x3 SAM, consisting of Processes, Operands (inputs, resources, and outputs), and Components, is illustrated in Table 1b, based on [24]. Each sub-SAM has a relation with which the row item relates to the column item, which can be static or dynamic. A row–cell–column tuple in the matrix would read: <row item (iRow)> <cell item (iRow, iCol)> <column item(iCol)>. For example: [Process P2] requires [Operand O2]; [Component C3] exhibits [Process P2].
Classifying model entities as set members (Process, Operand, Component) is a challenge. An ML that defines syntactic types simplifies identification of type-corresponding set members. However, the problem domain or solution domain may include types that exceed the ML’s syntax. Even common terms such as Stakeholder and Operand are not included in syntactically-rich MLs like SysML [40]. Defining relations in semantic terms (e.g., referring to whole-part relations as organization structures, activity breakdowns, or product breakdown) is challenging yet critical for SIM renditions.
Generating SIMs automatically is another challenge. Transforming model data into analyzable matrixial representations is not trivial. It mandates transforming any model into a uniform, common, language-agnostic representation that is robust enough to accommodate any domain-specific syntax and semantics, and powerful enough to facilitate any sort of analysis [35,38].
Pivot tables are powerful data analysis tools, typically used to aggregate, summarize, cluster, slice, and dice relational data. They are massively used in Business Intelligence applications, typically over operational datasets classified by time, geography, identity, organizational unit, etc. Pivot tables are embedded in common spreadsheet tools like Microsoft Excel and Google Sheets. Pivot tables are powerful because they allow the analyst to dynamically manipulate perspectives on the original dataset, experiment with perspectives, and reach informative configurations. Pivot tables are scarce in systems engineering [41,42,43], perhaps due to systems engineers’ insufficient data analysis background.
2.4. Category Theory in Systems Engineering
2.4.1. What Is a Category?
Category Theory is an abstract mathematical formalism of representations and transformations that describes and deals with the structure of mathematical or mathematically-specifiable concepts. A mathematical category is an abstract structure that consists of objects and morphisms. Objects are types of entities and morphisms map objects to each other. We shall use the common term type instead of object, because object semantics in programming and engineering relates to instances rather than classes. A morphism has a domain and codomain which are types, and maps each to a . Morphisms can be composed if the former’s codomain is the latter’s domain:
A category with three types, two explicit morphisms and one composed morphism, is illustrated in Figure 4.
A morphism denotes a mapping of a cartesian product of two types to a third type. It maps each combination of and to . can be any structure including a multi-dimensional tuple, or tensor. A functor is a structure-preserving mapping between the types and the morphisms from one category to another category. Functors are the categorical equivalents of functions in algebra. A functor transfers the types and morphisms in to types and morphisms in . Defining functors from one category to another is important for establishing categorical foundations for scientific and engineering theories, as it maps the concepts in a theory domain to concepts in a codomain that is more suitable to work with.
2.4.2. How Are Systems, Models, and Categories Related?
The Curry–Howard–Lambek Correspondence [20,21] asserts that programming languages and type systems are categories, in which the morphisms are rules or patterns that map types to each other. A software program is an instance of a programming language that reflects or represents some real-world system. Several software programs may represent the same real-world system and even solve the same real-world problem in different ways or using different programming languages. Programs can also work together to solve higher-level problems and represent higher-level systems.
Wymore defines a system as a morphism of input to output (IO), composed of a morphism of input to state (IS) and state to output (SO) [44]. A system homomorphism is a functional equivalence of two system designs (or models) in terms of their state-sets, their input-sets, and output-sets. A system , with a state-set , an input set IZ1 and an output set OZ1, is a homomorphic image of a system (with respective sets , , and ) if and only if it maps the states of to those of , the inputs of to those of , the outputs of to those of , the input-state transforms in to input-state transformations of pairs to states in , and the transformations of state to outputs in to transformations of states to outputs in . Accordingly, in a category of system models, the objects are system models, and the morphisms are Wymore’s homomorphisms.
2.4.3. Applications of Category Theory in Systems Engineering, Analysis, and Design
Category Theory is gaining attention in recent years as a potential underlying formalism for systems engineering, as an important pillar in systems science, and as the basis for an open information modeling and analysis platform [45], with semantic roots in design theory [46]. The envisioned platform’s robustness would allow for domain-agnostic cherry-picking and assembling of constructs and transforms. A roadmap for bridging the gap between theory and practice, including particular applications for systems engineering, was published by the US National Institute of Standards and Technology (NIST) [47]. State-of-the-art applications of Category Theory in systems analysis, engineering, and design are summarized in Table 2.
As MBSE is becoming a common and preferred way of conducting systems engineering, it is essential to harness any applicable formalism to MBSE and to leverage MBSE through a holistic federation of such formalisms. This paper focuses on the appropriate representation and analysis of system models that already use formal modeling languages, without replacing the existing languages with a mathematical formalism. Instead, the existing models are referred to as given artifacts, and the focus is on model analysis, visualization, and delivery to various stakeholders.
A C-set is a functor from some category into , the category of sets and functions [48]. A C-set maps every object to a set and every morphism , to a function . If is a theory or concept, then its C-set is an instance or model of that theory. If C is a programming language or ML, its C-set is a projection of programs or models into . One such set can be a set of tuples that represents a graph or hypergraph (with relations between more than two nodes).
Hypergraph categories are general mathematical models of hierarchy. They are applicable to various computational constructs including matrices, graphs, Markov chains, and Petri nets [48]. Hypergraph models can represent system structure, behavior, function, and interaction. Graphs of models are representable in the broader hypergraph category, which enables of model analysis, composition, comparison, and utilization [15].
2.5. Transforming Models to Graphs
Graph-centric model representation is not new [73]. MLs are inherently graphic; however, graph-theoretic model analysis has not evolved alongside MLs. Recent interest can be attributed to the revival and maturation of graph technology, graph databases, and graph analytics, e.g., [74,75,76].
Mapping conceptual models to graphs remains a challenging task. Models are stored as logical data-structures, not straightforwardly as graphs. Graphs cannot directly capture advanced conceptual model notions, such as classification, nesting, logical relations, and overlaps. Transformation rules that apply directly for the data structure used by the ML can help. For instance, UML has a uniform interchange structure, XMI, an XML structure that facilitates UML and SysML model conversions among various modeling tools. SysML model XMI representations can be transformed into graphs, compared against pattern graphs, and searched for design patterns [14].
The Resource Description Framework (RDF) protocol for web ontology specification consists of a set of triplets and resembles GDS. GDS can be viewed as a set of RDF triplets, and vice versa. OPM models can be represented via RDF [77,78,79].
OPM’s machine-generated textual OPL specification is readable and comprehensible for both humans and computers [23]. The OPL covers the OPM model’s logical structure. Inferring the system architecture from the model’s exported report is possible, but it is not possible to reconstruct the schematic layout of the diagrams. However, filtering out graphical layout bias can be beneficial, because the layout may affect decision-makers (for instance, due to depicting entities as central or peripheral).
Transforming a systemigram—graph-like model representing a complex system—into a flat graph data structure has been used for assigning quantitative metrics to qualitative relations and applied for threat assessment in strategic warfare capability analysis [80].
3. Methods
We describe a category-theoretic framework and methods for architecting and executing the CMGVC, which consists of four processes: (a) Conceptual Modeling: the transformation of concepts to models; (b) Model Transforming: converting models into generic, language-agnostic artifacts; (c) Stakeholder-Informing View Rendering: transforming generic representations into visualizations or representations; and (d) Reasoning, the cognitive process of rationalizing, understanding, perceiving, deciding, and revising the concept. This process is specified using an OPM model and illustrated in Figure 5.
The framework defines mappings between the conceptual and computational phases of the CMGVC: the concept phase (Section 3.1), the model phase (Section 3.2), the generic representation phase (Section 3.3), the view phase (Section 3.4), and the iteration (Section 3.5). While the CMGVC is universal, we focus on conceptual system architectures as an instance of C, on the OPM modeling language (M), on graph data structures as a global representation (G), and on stakeholder-informing matrices as views (V). This specialization is also shown in Figure 5.
We present a series of propositions regarding the possibility, validity, and superiority of creating views from models through a robust mechanism. Our main assertion in Proposition 1 is that a transform from any model M to any view V through an intermediate GDS representation G is superior to a set of direct transformations from all models M1, …, MM, to all views V1, …, VV.
Proposition 1:
GDS-based transform is superior to direct transforms. A graph-mediated transform M→G→V is superior to direct model-to-view transforms M→V:.
Proposition 2 asserts that a transform from any model M to any view V through an intermediate GDS representation G is also superior to a transform from all models through an ML-bound generic representation GR to all views .
Proposition 2:
GDS-based transform is superior to language-specific transform. A graph-mediated transformation M→G→V is superior to an ML-bound mediating representation-based transformation MRV:.
MGV is a composition of M→G and G→V. Proposition 3 asserts that a transform M→G exists. Proposition 4 asserts that a transform G→V exists.
Proposition 3:
A model-to-GDS transform exists. Let ML be a modeling language and M a model in ML. There exists a formal, valid, and feasible model-to-graph transform MG:ML→GDS.
Proposition 4:
A GDS-to-view transform exists. Let V be a view and G a set of GDS tuples. There exists a formal, valid, and feasible graph-to-view transform GV: GDS→V.
Specifically focusing on SIMs, Proposition 5 asserts that SIMs are valid views of GDS.
Proposition 5.
A GDS-to-SIM transform exists. Let SIM be a stakeholder-informing view and G a set of GDS tuples. There exists a formal, valid, and feasible graph-to-SIM transform GV: GDS→SIM.
3.1. The Conceptual System Architecture as a Category
Wymore’s definition of systems [44], in conjunction with the conventional representation of system architecture as a combination of structure and behavior [3], gives rise to a System category, , with the following types: Structure, Input–Output (or interchangeably, Onput [81]), Resource, and State. Onputs and Resources can be referred to as Operands. The morphisms include Behaviors (which transform Operands) and Relations (which map types to themselves and to each other). A morphism is a behavior of the system at any level, which transforms a combination (denoted as a Cartesian product) of operands () and the system’s state () to another combination of operands and state. The morphism is a composition of input→state and state→output:
A system is an instantiation of the category . Wymore’s system morphism is a functor that maps a category to itself, or endofunctor, denoted as .
Cyber-physical systems (CPS) reside concurrently in the physical and cybernetic spaces, and constitute a primary concern of systems engineering. In our categorization, CPS behaviors/functions are morphisms, and system components (sensors, processors, actuators, etc.) and operands (Currency, Data, Energy, and Matter—CDEM) are types. CPS components carry out functions that convert input operands to output operands. Some examples are shown in Table 3. CPS functions can be composed to create higher-level functionalities, for example, sensing, then actuating: . We can also define functions as Cartesian products, e.g., a plant’s function is:
Input data (e.g., commands), matter (e.g., raw material), and energy (e.g., electrical power) are converted to output data (statuses, reports), matter (finished goods, byproducts), and energy (heat). Some sequences may not be valid within particular system domains. For instance, in logistics, manufacturing a device (an actuator or sensor) is possible, but in an operational system such as an aircraft or autonomous vehicles, manufacturing a new part may not make sense. On the other hand, sensor “manufacturing” of images from signals may be valid.
Our categorical formulation views systems as behavior-enabling structures, which affect operands. Operands are also types. In fact, a system can be an operand, and an operand can be a system. Imagine a vehicle exiting the production line as an operand, and emerging as a system, or software delivered as a file, i.e., as an operand, and emerging as an executable, i.e., a system.
Conceptual architecting usually specifies the function before the form, while physical architecting typically does the opposite. Attributing a functional–behavioral morphism to a structural entity implies or entails a relational morphism that assigns a function to a function-performing system component, and a dual that allocates a component to perform a function. This mapping of morphism to type and type to morphism implies a type–morphism duality of system behavior.
3.2. The Modeling Language as a Category
Modeling languages are categories, since they are essentially programming languages [82], and programming languages are categories [20,21]. Moreover, programs are equivalent to theories [22], and likewise, models are equivalent to system concepts, which can be thought of as ‘theories’ about how a system works or might work. System models are instantiations of MLs, much like software programs are instantiations of programming languages. Similarly, representation languages for creating graphs, matrices, trees, or animations may also be thought of as categories. Transitions across representations are essential for gaining system understanding, and for implementing the system or parts of the system. For example, transforming functional models into visual animations, hardware and software designs, text specifications, etc. may further explain the system.
The assertion that MLs are categories must be backed up by valid categorical representation. MLs like OPM and SysML [83] capture structural, behavioral, and relational entities syntactically. The concept set constitutes a syntactic domain-agnostic ontology that accommodates a wide range of instantiations. The Block, for instance, is a fundamental SysML concept. SysML Blocks are modeled in Block Definition Diagrams (BDDs) and Internal Block Diagrams (IBDs). BDDs capture relations among blocks, while IBDs capture interactions among blocks and their internal structure. A block may be both structural and functional, which is both useful and confusing. For example, a block can specify both the sensor and its sensing function, .
In SysML and its predecessor, the Unified Modeling Language (UML) [84], capturing a component’s behavior, rather than its structure or function, requires behavioral notation such as Activity Diagram or State Chart. In the Activity Diagram notation, activities and actions are ‘boxes’ (types), while control or data flows are ‘arrows’ (morphisms). In the State Chart notation states are ‘boxes’ and state-transitions are ‘arrows’. The different semantics applied to ‘boxes’ and ‘arrows’ in SysML diagrams can be confusing, although experienced analysts know which notation to use to interpret various diagrams to make sense. Transforming SysML models through categorical specifications into a unified notation requires tremendous effort. We defer this endeavor to future research.
Conversely, OPM models use a minimal ontology of objects, processes, and relations, in which semantic ambiguity and redundancy are eliminated or minimized. Since OPM’s fundamental building blocks are objects that represent structure and processes that represent behavior, with a relatively small set of relations among them, a category of the OPM language is likely to be small and handy. The challenge is in correctly representing the language domain. One apparent categorical specification could define an OPM category with objects as types and processes as morphisms.
Types in one category can be morphisms in another category. OPM makes no syntactic distinction between component-representing objects and operand-representing objects. In fact, the same object can be both an operand of one system and the operator in another. Therefore, objects can be morphisms if they perform processes, and operands if they feed into or out of processes. Processes and relations represent system morphisms but are captured as graphical shapes, which may be puzzling. Processes and relations also have attributes of their own (durations, cardinalities, etc.).
Any model element is a type, including those that might appear to have operational semantics, such as processes, functions, transitions, etc. This also makes sense from a visual perspective: each shape on the canvas must be explicitly defined, regardless of its geometry or semantics. Both the ‘boxes’ and ‘arrows’ of the modeled system must be captured in MLs as types.
If operational entities are types, rather than morphisms—then what are the morphisms? Every model has a logical layer that underlies the visual layer. Therefore, every model element must be captured logically, otherwise it is no more than a meaningless sketch. It follows that there exists a hidden type, Specification (Spec), that captures the logical representation of the visual model. Thus, specifying—mapping visual elements to Spec—is a morphism.
There is another kind of morphism: modeling, which leads us through model creation or transformation. As modelers, we can take various modeling steps based on the state of our mode: (a) start with a blank diagram; (b) add an object, or process—transforming our diagram into a diagram with an object or a process; (c) create a new diagram to specify the details of an object or process; (d) add a state to an object; (e) add a relation between an entity (object, process, or state) and another entity—and so on. Hence, a set of modeling morphisms emerges: Diagram→Object, Diagram→Process, Object→Diagram, Process→Diagram, Object→State, Entity→Relation, and Relation→Entity—modeling morphisms. OPM does not permit creating a Diagram from a State or Relation—although such an extension can be theoretically valid and possible. Challenging the existence or absence of a modeling morphism may help enhance the ML.
Computational commands implement manual on-screen modeling operations and programmatic modeling commands. This allows for automated modeling and for creating models based on other formal representations. To the best of our knowledge OPM does not have a programming interface, but if provided in the future, it can adhere to our categorical formulation.
Reconstructing a model from its specifications gives rise to a third morphism to transform Spec statements into visual geometries or textual/logical reports: rendering. The pair specifying—rendering is isomorphic if a Spec allows complete model reconstruction (rendering). OPML also renders part of the Spec as its textual modality: the OPL specification.
The notion that modeling, specifying, and rendering are morphisms in an ML category is illustrated in Figure 6 for the OPM ML Category, OPML. The Spec is a critical type as it enables reconstructing, composing, transforming, and comparing models. Rendering the Spec as a processable mediating Report artifact that represents the model substantiates mapping to another representation—a functor that maps the ML to another category. OPCloud’s Exported Report is a mediating artifact. Both Specs and Reports are C-Sets.
Model entities are its interfaces to the System category, SYS. Model, Diagram, and Spec are not real System concepts—they merely help us manage system complexity. This System-to-Model mapping constitutes the C→M portion of the CMGVC. The OPML→GDS functor maps all the types in OPML to GDS tuples. This C→M→G segment of the CMGVC is illustrated in Table 4.
3.3. Transforming Models to Graphs
The MGV transform is a composition of a transform from a model into a uniform GDS representation (M→G), with a second transform from GDS into view (G→V). Transforms into GDS require mapping each ML construct to type in the GDS category. Graphs have only two elements: nodes and edges. GDS has only one element: tuple (an abstraction and extension of a node–edge–node triplet). A graph is merely a view on GDS. Such transforms are possible on graphic MLs, although graphics do not always map to simple graphs—for instance, when shapes are contained inside other shapes or overlap with other shapes (as in Venn diagrams). OPCloud’s Exported Report includes the textual OPL specification and lists of the objects, processes, and relations in the model. This helps in mapping all model entities and relations and translating them to GDS tuples. The final product G is a set of tuples, which includes a relation R, a source node S, a target node T, a unique identifier U, and a valuator V, denoted as the RSTUV tuple. V is useful for various applications such as quantification, verification, validation, versioning, and configuration control. Let us revisit the lane keeping system model in Figure 2 and transform it into a GDS. The graph of the model is shown in Figure 7.
RSTUV is sufficient for representing model data. It also captures aspects that are not specifically illustrated in the model. For example, it specifies the model’s inclusion of the diagrams, as well as each diagram’s inclusion of visualized objects and processes. The set of RSTUV tuples is obtained by executing the following functorial rules from to (also summarized in Table 5):
- 0.
- ML types are defined as RSTUV identity tuples. This step is only done once per ML.
- 1.
- Entities are mapped to their OPM entity type (model, diagram, object, process, etc.) using a Classification relation.
- 2.
- Relations, such that Ei and Ej are entities connected by relation R, are mapped as is.
- 3.
- Each entity Ej is mapped to any diagram Di that includes it by an Inclusion relation.
- 4.
- Relations are mapped to any diagram that includes them by an Inclusion relation.
- 5.
- Affiliations of entities (systemic/environmental) are mapped as Affiliation relations.
- 6.
- Essences of entities (physical/informatical) are mapped as Essence relations [4].
According to Category Theory, each object must be connected to itself through an identity morphism [51]. Thus two more mappings are required:
- 7.
- Entities are mapped to universally-unique identification numbers (UUIDs) as an Identity relation that constitutes the identity morphism of each entity onto itself.
- 8.
- Relations are mapped to UUIDs through an Identity relation that constitutes the identity morphism of each relation onto itself.
The OPML→GDS C-Set functor that executes the above mappings is illustrated in Figure 8. The functor extracts the OPM elements from the report generated by OPCloud (OPM.ExportedReport). ExportedReport provides most of the information needed for analyzing an OPM model (It does not include shape positions in the diagrams, and therefore, it is not possible to reconstruct the diagrams with the shapes’ exact positioning, but only up to the participation of elements in each diagram).
From ExportedReport, we generate two interim categories: ElementDictionary and OPLSpec. We refer to both objects as sets, but due to the complicated and heterogenous structure of set members, we need further decomposition and transformation of set members to their appropriate data structures. For example, we need to find the OPDs in which each Object and Process appear (ObjectOPDs and ProcessOPDs).
ElementDictionary does not specify appearance of relations in OPDs, but the statements referring to the relations are specified in the OPL text accompanying each OPD. To extract this information, we need to analyze OPLSpec, identify the sentence that specifies each relation under the diagrams in which it is shown, and match the OPD→OPLStatement relation to the right Relation.
A generic transformation function, OntologyMapping, converts or extends ontological terms and executes all parts of the OPML→GDS functor. OntologyMapping starts from the raw input representing external models and other sources of information (e.g., OPM.ExportedReport). It continues recursively to either create new items or extend existing ones. The ExportedReport→ElementDictionary transform and the following three transforms ElementDictionary→{ObjectElement, ProcessElement, RelationSet} create new items sets. RelationSet is further transformed into a new set of Relation items. This step is due to OPCloud’s exported report clustering of all relations of the same type in groups. OntologyMapping extends ObjectElement with attributes such as IsObject, ObjectName, and ObjectStates. It similarly extends ProcessElement with the attributes IsProcess, ProcessOPDs etc., and RelationSet with the attributes RelationBlock, RelationSource, and RelationTarget.
The strength and robustness of OntologyMapping allows it to recursively search for additional mappings needed due to the creation of new items, but it would first make sure all the extended attributes are computed, because those attributes might be needed for creating new items. For instance, to create RSTUVCandidates that cover all the relevant relations pertaining to the Process item, we need to know which OPDs the process is in, and create a separate RSTUVCandidate with R = ‘Inclusion’, S = ProcessElement(p).ProcessOPD, and T = ProcessElement(p).Process, where p is a member of the ProcessElement set, p = 1…,|ProcessElement|.
OntologyMapping also supports mapping and classifying items as Identity Attributes—attributes whose values are converted to Identity and Classification relations.
- The Identity relation maps each entry to a universally unique ID (UUID).
- The Classification relation maps each entry to its type, which is the attribute name. For example, each item in the Diagram column is mapped to an RSTUVTuple with R = ’Classification’, S = ‘OPM.Diagram’, and T = Item.UUID.
For pairs of Source and Target attributes with a specified relation, each pair of attribute values is transformed into an RST tuple with a specified relation. For example, the OPM.Object and OPM.ObjectState attributes are mapped to a set of RST tuples with R = StateSpecification, S = {item in OPM.Object: the ObjectElement}, and T = {items in OPM.ObjectState—one or more names of states}. For triplets of Source, Target, and Relation attributes, each triplet of attributes values maps directly into an RSTUVTuple. For example: under the OPM.Relation block, R = Relation, S = {one object, process, or state}, T = {one object, process, or state}.
The mapping combinatorically searches for all valid pair and triplet permutations and creates a set of unique RSTUV candidates. An RSTUVCandidate referring to the same relation, source, and target entities might be created from multiple blocks. For example, identity tuples for OPM.Diagram can be generated for both ObjectElement and ProcessElement. OPDs may have two RSTUVCandidates: one due to including an object, and one due to including a process. This is because diagram names are not defined separately in ElementDictionary, only indirectly through the listing of OPDs in which each object and process are visualized. Only one copy of each RST must be kept.
3.4. Transforming Graphs to Views and SIMs
The next step in the process is to define informative views on the model’s GDS (set of RSTUV tuples), such as the SIMs discussed in Section 2.3. As shown in Figure 2, the essential graph, adjacency matrix, and RST tuple set are equivalent representations. Therefore, any relational pattern in the model, captured in the GDS, can be represented in a matrix. Furthermore, mappings via selected relations or subsets of relations that make sense or helps in reasoning about a problem, support this reasoning process as a stakeholder-informing view, such as a matrix based on the GDS and thus on the model.
A SIM captures a mapping of row items to column items. We can specify a subset of relations and get a mapping of row items to column items according to the selected relations. We can also reconstruct or compose threads and spans of relations over the GDS. Additional analysis can include tallies, sums, minima, maxima, subtotals on indications, or associated/converted matrix cells values. For example, if the number of allowed relations in each intersection must be positive, we can quickly find the discrepancies (both visually and computationally).
3.5. Transforming Views into Concepts, and Concepts back into Models
The CMGVC’s cognitive segment, V→C→M consists of reasoning, decision-making, and action-taking. During this process, we study the views, mentally fuse, challenge, or corroberate the information with knowledge and beliefs, and create or revise a mental model, or concept. Based on the concepts we have in mind, we make decisions that alter the concept, or alter reality to match the revised concept. These cognitive view-to-concept and concept-to-model mappings close the loop by returning to the category of conceptual systems, . A model of an existing system explains hypotheses, theories, or facts about the system. A model of a future system serves to inform stakeholders about a system that will suit their concept. Stakeholders may later take action to execute decisions and inform model developers about the system’s expected structure and behavior to fulfill the concept that the system was meant to realize. The conceptual transformation is a cognitive process that closes the loop and allows us to re-iterate through conceptual models of described or prescribed systems. Rigorous formulation of these transforms requires substantial grounding in cognitive psychology, and is suggested as an extension of this research.
4. Implementation
This section focuses on a CMGVC software platform prototype, which automates parts of the described process. A high-level prototype architecture is illustrated in Figure 9. The prototype consists of three main modules: the model transformation model, the storage module, and the visualization module. Several software development tools were used for implementing this architecture.
Model transformation functionality is implemented in MATLAB, using settings and input definitions, as well ontology mapping rules defined in MS Excel files. The Project Analyzer reads a set of projects with one or more model per project, from the Projects file, where each model is uniquely identified, and the ML for each model is defined. A project can support models in multiple MLs as well as folders with multiple model files. Raw model representations are provided as files or file directories. The paths to the models are stored in the Projects file. The Project Analyzer reads the raw model representing files and feeds them into the Model-to-Graph functionality.
The Model-to-Graph Transformation implements the OntologyMapping functionality. It first reads and transforms the raw data from the model files, which can be MS Excel, PDF, XML, or JSON. The Rules file defines a set of ontology mapping rules. The program reads these mapping rules for the ML of the processed model, and applies them to the raw model. Accordingly, intermediate representations are formed, and may be subject to additional mapping. Therefore, the processing is recursive and returns until no additional mapping rules are applicable to the resulting data set.
Some mapping rules can be defined as JavaScript Object Notation (JSON) data structure that defines required conversions for any item. An example of a JSON configuration for mapping ProcessElement to RSTUVCandidate is shown in Figure 10. The JSON object can define identity attributes (identityVars); Source-Target attribute pairs with a specified relation (sourceTargetPairs); and Relation-Source-Target triplets (relationSourceTargetTriplets). The mapping function combinatorically searches for all valid pair and triplet permutations and creates a set of unique RSTUV candidates. The mechanism only keeps the first appearance of similar RSTUV candidates with the same RST. Finally, a set of GDS tuples is created.
The platform stores the set of GDS tuples in either Microsoft SQL Server or Microsoft Excel files (as defined in the Projects file). Visualization and rendering of views on the GDS can be obtained through SQL views within the SQL Server database, or on the Excel output. Sequential SQL join queries make up functors from the raw GDS to matrix or tensor datasets [86], which visualization and analysis tools can render as matrices. Microsoft Excel can import the query results from the database, construct a pivot table on top of the raw data, and render the appropriate visualization. Pivot tables have a flexible structure that allows the analyst to adjust, transpose, and organize the matrix hierarchically for various visualization needs. Readily-available data analysis tools like pivot tables simplify the analysis and minimize tool dependency. Additional modes of analysis and visualization are available via MATLAB, as well as via graph visualization tools like CSAcademy’s Graph Editor (https://csacademy.com/app/graph_editor/), used throughout this paper.
5. Assessment
The CMGVC offers a significant departure from direct generation of views on models, and a more robust alternative to indirect generation of views based on DSML-specific representations. In Section 3.1 we have defined five propositions for this research:
- M→G→V (a GDS-mediated transformation from model to view) is superior to M→V (a direct transformation from model to view)
- M→G→V is superior to M→R→V (a transformation mediated by a language-bound representation, LBR)
- M→G is a feasible and valid transformation.
- G→V is a feasible and valid transformation.
- G→SIM is a feasible and valid transformation.
We have presented a categorical framework for converting conceptual system models from one ML, OPM, into a GDS, and deriving SIM views from the GDS. We have thus managed to validate Propositions 3, 4, and 5 regarding the existence of the building blocks of a composed transform M→G→V based on , where , .
To prove Propositions 1 and 2, we must compare the benefits and limitations of the CMGVC approach vis-à-vis the two alternative approaches:
- MV: Direct generation of views from a model, that we denote V(M) or MV
- MRV: Indirect generation of views from a model via a common DSML-specific representation, that we would demote V(RDSML(MDSML)) or MRV
We define four lower-is-better (LIB) criteria for comparison, which reflect stakeholders needs for efficiency (C1), flexibility (C2), robustness (C3), and resilience (C4):
- C1—Efficiency is measured by the number of required transformations of M models to V views. For MGV, MRV: sum of model-to-graph transformations (M) and graph-to-view transformations (V); for MV: product of models by views ().
- C2—Flexibility is measured by the effort of creating new views for existing models. For MGV, MRV: one effort unit per view (graph-to-view or LBR-to-view); for M: M effort units (models-to-view).
- C3—Robustness is measured by the effort of creating existing views for new models: For MGV: a single effort unit (model-to-graph); for MV: V effort units (model-to-views); for MRV: V+1 effort units (model-to- LBR and LBR-to-views).
- C4—Resilience is measured by the dependency on DSML updates: for MGV, MRV: a single effort unit for updates (model-to-graph or model-to-LBR); for MV: V effort units (model-to-views).
Since all criteria are LIB, the total score is also LIB. Table 6 defines metrics for each criterion. Total scores for MGV, MV, and MRV are defined in Equations (1)–(3).
is superior to (Proposition B) if :
Cancelling equal terms, we obtain: .
Homogenizing, we obtain: .
This inequality always holds, and therefore , and MGV is superior to any MRV with a DSML-specific representation:
Conditions for superiority to :
Homogenizing, we obtain the following:
We try Equation (5) with combinations of V = 1, V = 2, V > 2 with M = 1, M = 2, M > 2, as summarized in Table 7. For all practical purposes, multiple MLs , and at least two views (we already have three),
With this analysis, we have managed to corroborate Proposition 1 and Proposition 2.
6. Application
6.1. Representation and Analysis of Process-to-Process Input–Output Exchange
Table 1 (Section 2.3) illustrates two examples of SAMs that map various system architecture aspects to each other. Both SAMs include a mapping of processes to each other. Table 1a includes explicit mapping of process to process via operands. The operands serve as indirect process mediators: the output of one process is the input of another. However, there is no explicit mapping in the model in the form <P,O,P>. Therefore, this mapping must be composed. This composition is defined in the following manner, using SQL queries to retrieve and cross the data from the raw set of RSTUV tuples:
- Find all the processes, i.e., targets in tuples with S = ‘OPM.Process’ and R = ‘Classification’.
- Find all outputs, i.e., targets in tuples where R = ‘Result’, and retrieve the source process item.
- Find all tuples in which the above outputs are sources in a Consumption relation (i.e., inputs), and retrieve the target process items.
- Cross the process–output set with the input–process set such that output = input.
- Cross process set (1) with output-generating process set (2). Keep all processes including those that are generating no output.
- Cross process set (1) with input-receiving process set (3). Keep all processes including those that are receiving no input.
- Layout a matrix with output-generating processes as rows, input-receiving processes as columns, and identity of matching output-input (onput [81]) item as cells.
Figure 11 illustrates the MGV transform for an arbitrary OPM model into three views.
6.2. The Lane Keeping System Revisited
Our lane keeping system (LKS) running example can now be analyzed according to the CMGVC. An in-zoomed diagram of the LKS, specifying functions performed by the system and their interactions, is illustrated in Figure 12. This is an intentionally partial diagram, with some critical gaps. As we study this diagram we should notice, for instance, that the Lane Crossing object has no source, and that the Road is consumed by the Imaging Road process, rather than remain an instrument as it was specified in the topmost diagram. It is difficult to ensure continuity and consistency this way, and the problem intensifies as the model grows bigger with more objects, processes, and diagrams.
Analyzing this model with a POP matrix could help detect some discrepancies in the model. Table 8 is a POP matrix that was derived from the model through the same SQL query defined in Section 6.1 for the POP matrix-supporting records, and rendered as a matrix using a MS Excel pivot table on the query results. The LKS model utilizes additional procedural relations besides the Result and Consumption: the Instrument relation is used for non-consumable resources, and the Invocation relation is used for specifying process activation by another process, implying an unspecified interface object. Additional metrics were added to the POP matrix, including the number of inputs and number of outputs per process (calculated on the columns and rows, respectively).
The POP matrix highlights several issues in the model, which could be helpful for reviews by various stakeholders—customers, system architects, process or function owners, etc. We summarize proposed corrections by entity and issue in Table 9. It would be easy to apply these to the model and reiterate to obtain the revised POP matrix. As details are added to the model, the POP matrix is likely to grow and detect new issues, in a continuous concept revision and improvement cycle.
7. Discussion
This paper has several results and outcomes to discuss at the methodological and empirical levels. The primary result of this study is the formulation of the CMGVC using robust category-theoretical foundations. In addition to the emerging overarching framework, we have results for each cycle phase at varying specification levels.
The emergence of the CMGVC is a promising direction for MBSE, as also indicated by both colleagues and the anonymous referees. Systems engineering is undergoing a digital transformation, compounded with the constant growth of systems complexity and interconnectedness. Conceptual modeling is becoming more common for representing complex systems, and more critical for generating deliverables that impact the digital value chain [10]. Considering the challenge and opportunity associated with these trends, robust foundations for interoperability and collaboration across digital enterprises are likely to be significant enablers of digital systems engineering.
The assertion and demonstration that modeling languages are categories is an important contribution to the body of knowledge, as it extends the Curry–Howard–Lambek Correspondence from programing languages to modeling languages. We have used categorical structures to map system concepts to formal models, models to robust graph data structures (GDS), and GDS to stakeholder-informing views—graphs and matrices. With these representations defined as categories, a new category-theory-driven MBSE paradigm can emerge. Many more extensions of this paradigm are possible, including the definition of additional modeling languages as categories, and the definition of additional functorial mappings of GDS to views, including model-to-model translation.
Stakeholder-informing visualizations, particularly matrices, are enhanced by this study with rigorous and robust foundations for generating, processing, and analyzing model-based data. The two graph renditions we generated are in fact duals: a process-on-node/onput-on-edge graph and an onput-on-node/process-on-edge graph. Both dual graph renditions have uses and advantages. Being able to generate both graphs from the same data structure is an important benefit, which also ensures consistency and complementarity. The SysML Internal Block Diagram (IBD) uses object-on-node semantics. The Activity Diagram is a process-on-node graph. State Charts use a state-on-node semantics. These three aspects can be generated from the same GDS of an OPM model. Therefore, GDS facilitates modeling language translation, a promising direction for future research.
The process–operand–process exchange matrix is an important architectural analysis tool. It captures a non-trivial mapping relation that we could build by composing relation segments in the GDS through robust data retrieval and integration queries. Obtaining and maintaining such a matrix manually is a significant cognitive effort. Dynamically visualizing the matrix using a pivot table is another strong benefit, due to its accessibility and ability to accommodate evolving needs. We have also shown how detected relation anomalies drive concept and model revisions. While such analyses can be based on manually constructed or otherwise-generated matrices, our approach provides additional confidence, since the data comes from the model and lends itself to any necessary composition or aggregation that can yield beneficial visualization. Our approach also sets the stage for a broad range of visual and digital representations. The latter can inform digital actors and greatly enhance interoperability and coordination across and among enterprises.
8. Conclusions
In this paper, we have explored the potential of Category Theory to serve as an underlying formalism for systems engineering, particularly in the context of MBSE. Category Theory is an appropriate holistic paradigm, a state of mind, and a formal foundation for the model transformation and reasoning pipeline, which is essential for a smooth, rational, and reliable MBSE cycle that constantly improves, corrects, and refines system architecture specifications.
The Concept–Model–Graph–View cycle (CMGVC) facilitates the transformation of conceptual models to stakeholder-informing and decision-supporting views. We have shown that it would be imperative to include an intermediate generic representation in the form of a GDS, which serves as a common outlet to all MLs, and a common basis for all views, visualizations, and reports. We have proven the superiority of our approach to direct and ML-bound mappings.
The CMGVC has several advantages:
- Using the CMGVC, stakeholders and decision-makers will be able to derive critical information and insight regarding system development and operation from the system model, rather than through a disparate information gathering and presentation channel, which is the common practice today.
- The preferential dominance that we have proven in Section 5 facilitates efficiency in model analytics, and thus encourages further adoption.
- The transition through GDS enhances system understanding by adding another modality: graphs, which map concepts and relations through one common substantial representation.
- The simple-yet-robust GDS can be a prime facilitator of MBSE interoperability and collaboration across digital value chains.
- Subject matter experts will be able to leverage the CMGVC via semantic and ontological frameworks to better represent emerging patterns and concepts.
We have demonstrated how a model can be represented in multiple ways—two visual graph renditions and a process-to-process operand exchange matrix—that are all based on its single GDS.
We plan to demonstrate that the CMGVC can be robustly suited for various other MLs and views. Particularly, we plan to explore the transformation of SysML and Simulink models via the CMGVC pipeline and to create meaningful source-agnostic views, including SIMs, sub-graphs, state spaces, and specifications in other MLs. Isomorphic mapping out of and back into the same ML to support round-trip engineering also pose a major challenge [87].
Reconciling MBSE and Discrete Event Simulation (DEVS) paradigms is a recently trending effort [88]. Ongoing collaboration between the MBSE and DEVS communities has been institutionalized in a joint workgroup of the International Council on Systems Engineering (INCOSE) and International Association for Engineering Modeling and Simulation (NAFEMS) [89]. Our framework can facilitate interoperability across MBSE and DEVS platforms, tools, and models. It alleviates efforts to find and apply an interoperability standard that would appeal to both MBSE and DEVS. The reason is that graph-theoretic DEVS algorithms are abundant, and graph-representable problems have been studied with DEVS technology and methodology for decades, e.g., as part of the Agent-Based Modeling and Simulation (ABMS) paradigm [90,91].
One limitation in our approach is its scalability. We plan to build a service-oriented software platform that will provide robust transformation capabilities as web services to MBSE practitioners and researchers, who will be able to upload or plug-in live models and generate useful visualizations. MBSE experts would be able to define and manage mappings and sets of views to run on specific models. These will provide continuous visualization or integration with external systems across the digital enterprise. We plan to employ state-of-the-art graph database and information visualization techniques to provide stakeholders with flexible, dynamic, and elegant decision-supporting views.
Author Contributions
Conceptualization: Y.M., E.F.C. and J.P.F.; methodology: Y.M., J.P.F. and E.F.C.; software: Y.M.; validation: Y.M. and J.P.F.; formal analysis: Y.M.; writing: Y.M. and J.P.F.; visualization: Y.M. and J.P.F.; supervision: E.F.C.; funding acquisition: Y.M., J.P.F. and E.F.C. All authors have read and agreed to the published version of the manuscript.
Funding
Y.M.’s research was conducted as part of a research fellowship, funded by the MIT-Technion Post-Doctoral Research Fellowship Program. J.P.F.’s research was funded by DARPA under agreements HR00112090067 and W911NF2010292.
Data Availability Statement
Raw and analyzed datasets can be provided to interested readers by the corresponding author. The datasets are not publicly available on-line at the moment.
Acknowledgments
We thank David Spivak from MIT’s Department of Mathematics for planting the seeds for the collaboration that resulted in this research, for inspiring it, and for very useful comments. We thank Dov Dori from Technion and Yoram Reich from Tel-Aviv University for their useful comments. Finally, we thank the anonymous referees who helped improve this paper with constructive suggestions.
Conflicts of Interest
The authors declare no conflict of interest. The funders had no role in designing the study; collecting, analyzing, or interpreting data; writing the manuscript; or in deciding to publish the results.
Acronyms and Glossary Terms
| Acronym | Full Term |
| CMGVC | Concept→Model→Graph→View Cycle |
| DSM | Design Structure Matrix |
| GDS | Graph Data Structure |
| GR | Generic Representation |
| MBSE | Model-Based Systems Engineering |
| MGV | Model→Graph→View |
| ML | Modeling Language |
| OPM | Object–process Methodology |
| OPML | Object–process Modeling Language |
| SAM | System Architecture Matrix |
| SIM | Stakeholder-Informing Matrix |
| UUID | Universal Unique ID |
References
- Partridge, C.; Gonzalez-Perez, C.; Henderson-Sellers, B. Are conceptual models concept models? Lect. Notes Comput. Sci. Incl. Subser. Lect. Notes Artif. Intell. Lect. Notes Bioinform. 2013, 8217 LNCS, 96–105. [Google Scholar] [CrossRef]
- Bailer-Jones, D.M. Scientific Models in Philosophy of Science; University of Pittsburgh Pre: Pittsburgh, PA, USA, 2009. [Google Scholar] [CrossRef]
- Soderborg, N.R.; Crawley, E.F.; Dori, D. System Function and Architecture: OPM-Based Definitions and Operational Templates. Commun. ACM 2003, 46, 67–72. [Google Scholar] [CrossRef]
- Dori, D. Model-Based Systems Engineering with OPM and SysML; Springer: New York, NY, USA, 2016. [Google Scholar] [CrossRef]
- McDermott, T.A.; Hutchinson, N.; Clifford, M.; Van Aken, E.; Slado, A.; Henderson, K. Benchmarking the Benefits and Current Maturity of Model-Based Systems Engineering across the Enterprise; Systems Engineering Research Center (SERC): Hoboken, NJ, USA, 2020. [Google Scholar]
- Bondar, S.; Hsu, J.C.; Pfouga, A.; Stjepandić, J. Agile digital transformation of System-of-Systems architecture models using Zachman framework. J. Ind. Inf. Integr. 2017, 7, 33–43. [Google Scholar] [CrossRef]
- Hale, J.P.; Zimmerman, P.; Kukkala, G.; Guerrero, J.; Kobryn, P.; Puchek, B.; Bisconti, M.; Baldwin, C.; Mulpuri, M. Digital Model-Based Engineering: Expectations, Prerequisites, and Challenges of Infusion; NASA: Washington, DC, USA, 2017. [Google Scholar]
- Bone, M.; Blackburn, M.; Kruse, B.; Dzielski, J.; Hagedorn, T.; Grosse, I. Toward an Interoperability and Integration Framework to Enable Digital Thread. Systems 2018, 6, 46. [Google Scholar] [CrossRef] [Green Version]
- Hagedorn, T.; Bone, M.; Kruse, B.; Grosse, I.; Blackburn, M. Knowledge Representation with Ontologies and Semantic Web Technologies to Promote Augmented and Artificial Intelligence in Systems Engineering. Insight 2020, 23, 15–20. [Google Scholar] [CrossRef]
- Mordecai, Y.; de Weck, O.L.; Crawley, E.F. Towards an Enterprise Architecture for a Digital Systems Engineering Ecosystem. In Proceedings of the Conference on Systems Engineering Research (CSER), Virtual, Redondo Beach, CA, USA, 8–10 October 2020. [Google Scholar]
- Subrahmanian, E.; Levy, S.N.; Westerberg, A.W.; Monarch, I.; Konda, S.L.; Reich, Y. Equations aren’t enough: Informal modeling in design. Artif. Intell. Eng. Des. Anal. Manuf. 1993, 7, 257–274. [Google Scholar] [CrossRef] [Green Version]
- Sharpe, J.E.E.; Bracewell, R.H. Application of bond graph methodology to concurrent conceptual design of interdisciplinary systems. In Proceedings of the IEEE Systems Man and Cybernetics Conference—SMC, Le Touquet, France, 17–20 October 1993. [Google Scholar] [CrossRef]
- Ernadote, D. An ontology mindset for system engineering. In Proceedings of the 2015 IEEE International Symposium on Systems Engineering (ISSE), Rome, Italy, 28–30 September 2015; pp. 454–460. [Google Scholar] [CrossRef]
- Cotter, M.; Hadjimichael, M.; Markina-khusid, A.; York, B. Automated Detection of Architecture Patterns in MBSE Models. In Proceedings of the Conference on Systems Engineering Research (CSER), Redondo Beach, CA, USA, 8–10 October 2020. [Google Scholar]
- Reich, Y.; Konda, S.; Subrahmanian, E.; Cunningham, D.; Dutoit, A.; Patrick, R.; Thomas, M.; Westerberg, A.W. Building agility for developing agile design information systems. Res. Eng. Des. Theory Appl. Concurr. Eng. 1999, 11, 67–83. [Google Scholar] [CrossRef]
- Dennis, A.R.; Hayes, G.S.; Daniels, R.M., Jr. Re-engineering business process modeling. In Proceedings of the 1994 Proceedings of the Twenty-Seventh Hawaii International Conference on System Sciences, Maui, HI, USA, 4–7 January 1994; pp. 244–253. [Google Scholar]
- Object Management Group (OMG). OMG Unified Modeling Language (OMG UML); OMG: Needham, MA, USA, 2015. [Google Scholar] [CrossRef]
- United States Department of Defense (DoD). The DoDAF Architecture Framework Version 2. Available online: https://dodcio.defense.gov/Library/DoD-Architecture-Framework/ (accessed on 3 December 2020).
- Fong, B.; Spivak, D.I. Seven Sketches in Compositionality: An Invitation to Applied Category Theory. arXiv 2018, arXiv:1803.05316. [Google Scholar]
- Chakraborty, S. Curry-Howard-Lambek Correspondence; University of Calgary: Calgary, AB, Canada, 2011; Available online: http://pages.cpsc.ucalgary.ca/~robin/class/617/projects-10/Subashis.pdf (accessed on 3 December 2020).
- Hamilton, M. Category Theory and the Curry-Howard-Lambek Correspondence; Senior Seminar in Mathematics Lecture Notes; Yale University: New Haven, CT, USA, 2016; Available online: https://mhamilton.net/files/chl.pdf2016 (accessed on 3 December 2020).
- Naur, P. Programming as theory building. Microprocess. Microprogr. 1985, 15, 253–261. [Google Scholar] [CrossRef]
- ISO/TC 184: ISO 19450 Automation Systems and Integration—Object-Process Methodology; International Organization for Standardization (ISO): Geneva, Switzerland, 2015.
- Crawley, E.; Cameron, B.; Selva, D. Systems Architecture: Strategy and Product Development for Complex Systems; Pearson Higher Education: Hoboken, NJ, USA, 2016. [Google Scholar]
- Mordecai, Y.; Dori, D. Model-Based Operational-Functional Unified Specification for Mission Systems. In Proceedings of the 10th Annual IEEE International Systems Conference (SysCon), Orlando, FL, USA, 18–21 April 2016. [Google Scholar] [CrossRef]
- Mordecai, Y.; Dori, D. Model-based requirements engineering: Architecting for system requirements with stakeholders in mind. In Proceedings of the IEEE International Symposium on Systems Engineering, ISSE, Vienna, Austria, 11–13 October 2017. [Google Scholar] [CrossRef]
- Osorio, C.A.; Dori, D.; Sussman, J. COIM: An Object-Process Based Method for Analyzing Architectures of Complex, Interconnected, Large-Scale Socio-Technical Systems. Syst. Eng. 2011, 14. [Google Scholar] [CrossRef] [Green Version]
- Dori, D.; Jbara, A.; Levi, N.; Wengrowicz, N. Object-Process Methodology, OPM ISO 19450—OPCloud and the Evolution of OPM Modeling Tools. Systems Engineering Newsletter (PPI SyEn), 61, 30 January 2018. Available online: https://www.ppi-int.com/wp-content/uploads/2021/01/SyEN-061.pdf (accessed on 3 December 2020).
- Levi-Soskin, N.; Shaoul, R.; Kohen, H.; Jbara, A.; Dori, D. Model-Based Diagnosis with FTTell: Assessing the Potential for Pediatric Failure to Thrive (FTT) During the Perinatal Stage. In SIGSAND/PLAIS, LNBIP 359; Wrycza, S., Maślankowski, J., Eds.; Springer Nature: Cham, Switzerland, 2019; pp. 37–47. [Google Scholar] [CrossRef]
- Dori, D.; Kohen, H.; Jbara, A.; Wengrowicz, N.; Lavi, R.; Levi-Soskin, N.; Bernstein, K.; Shani, U. OPCloud: An OPM Integrated Conceptual-Executable Modeling Environment for Industry 4. In Systems Engineering in the Fourth Industrial Revolution: Big Data, Novel Technologies, and Modern Systems Engineering; Kenett, R.S., Swarz, R.S., Zonnenshain, A., Eds.; Wiley: Hoboken, NJ, USA, 2020. [Google Scholar]
- Mordecai, Y.; James, N.K.; Crawley, E.F. Object-Process Model-Based Operational Viewpoint Specification for Aerospace Architectures. In Proceedings of the IEEE Aerospace Conference, Big Sky, MT, USA, 7–14 March 2020. [Google Scholar] [CrossRef]
- Ford Motor Company. Lane-Keeping System. Available online: https://www.youtube.com/watch?v=8O3u20MBmsE (accessed on 20 November 2020).
- Object Management Group. Unified Architecture Framework Profile (UAFP); Object Management Group: Needham, MA, USA, 2019. [Google Scholar]
- Browning, T.R. Design Structure Matrix Extensions and Innovations: A Survey and New Opportunities. IEEE Trans. Eng. Manag. 2016, 63, 27–52. [Google Scholar] [CrossRef]
- Sharon, A.; Dori, D.; de Weck, O. Model-Based Design Structure Matrix: Deriving a DSM from an Object-Process Model. In Proceedings of the Second International Symposium on Engineering Systems, Cambridge, MA, USA, 15–17 June 2009. [Google Scholar]
- Sharon, A.; Dori, D. A Project–Product Model–Based Approach to Planning Work Breakdown Structures of Complex System Projects. IEEE Syst. J. 2014, 9, 366–376. [Google Scholar] [CrossRef]
- Do, S.; Weck, O. De: A Grammar for Encoding and Synthesizing Life Support. In Proceedings of the 44th International Conference on Environmental Systems, Tucson, AZ, USA, 13–17 July 2014. [Google Scholar]
- Wilschut, T.; Etman, L.F.P.; Rooda, J.E.; Vogel, J.A. Generation of a function-component-parameter multi-domain matrix from structured textual function specifications. Res. Eng. Des. 2018, 29, 531–546. [Google Scholar] [CrossRef] [Green Version]
- Knippenberg, S.C.M.; Etman, L.F.P.; Wilschut, T.; van de Mortel-Fronczak, J.A. Specifying Process Activities for Multi-Domain Matrix Analysis Using a Structured Textual Format. Proc. Des. Soc. Int. Conf. Eng. Des. 2019, 1, 1613–1622. [Google Scholar] [CrossRef] [Green Version]
- Object Management Group. OMG Systems Modeling Language (OMG SysMLTM); Version 1.4; Object Management Group (OMG): Needham, MA, USA, 2015. [Google Scholar] [CrossRef]
- Au-Yong-Oliveira, M.; Moutinho, R.; Ferreira, J.J.P.; Ramos, A.L. Present and future languages—How innovation has changed us. J. Technol. Manag. Innov. 2015, 10, 166–182. [Google Scholar] [CrossRef] [Green Version]
- Johnson, J.M. Analysis of Mission Effectiveness: Modern System Architectures Tools for Project Developers; Naval Postgraduate School: Monterey, CA, USA, 2017. [Google Scholar]
- Kong, P.O. Spreadsheet-Based Graphical User Interface for Modeling of Products Using the Systems Engineering Process. US Patent 8,626,477, 7 January 2014. [Google Scholar]
- Wymore, W.A. Model-Based Systems Engineering; CRC Press: Boca Raton, FL, USA, 1993. [Google Scholar]
- Breiner, S.; Subrahmanian, E.; Jones, A. Categorical foundations for system engineering. Discip. Converg. Syst. Eng. Res. 2017, 449–463. [Google Scholar] [CrossRef]
- Subrahmanian, E.; Reich, Y.; Krishnan, S. The Story of n-Dim. In We Are Not Users: Dialogues, Diversity, and Design; MIT Press: Cambridge, MA, USA, 2020; pp. 181–196. [Google Scholar] [CrossRef]
- Breiner, S.; Pollard, B.; Subrahmanian, E. Workshop on Applied Category Theory: Bridging Theory and Practice; NIST: Gaithersburg, MD, USA, 2020. [Google Scholar] [CrossRef]
- Patterson, E. Hausdorff and Wasserstein metrics on graphs and other structured data. Inf. Inference A J. IMA. 2020, iaaa025. [Google Scholar] [CrossRef]
- Koo, H.-Y.B. A Meta-Language for Systems Architecting; Massachusetts Institute of Technology: Cambridge, MA, USA, 2005. [Google Scholar]
- Koo, B.; Hurd, A.; Loda, D.; Dori, D.; Crawley, E.F. Architecting Systems Under Uncertainty with Object-Process Networks. In Proceedings of the International Conference on Complex Systems (ICCS’04), Boston, MA, USA, 16–24 May 2004. [Google Scholar]
- Spivak, D.I.; Kent, R.E. Ologs: A categorical framework for knowledge representation. PLoS ONE 2012, 7, e24274. [Google Scholar] [CrossRef] [PubMed]
- Mabrok, M.A.; Ryan, M.J. Category theory as a formal mathematical foundation for model-based systems engineering. Appl. Math. Inf. Sci. 2017, 11, 43–51. [Google Scholar] [CrossRef]
- Censi, A. Uncertainty in Monotone Codesign Problems. IEEE Robot. Autom. Lett. 2017, 2, 1556–1563. [Google Scholar] [CrossRef]
- Censi, A. A Class of Co-Design Problems with Cyclic Constraints and Their Solution. IEEE Robot. Autom. Lett. 2017, 2, 96–103. [Google Scholar] [CrossRef]
- Legatiuk, D.; Dragos, K.; Smarsly, K. Modeling and evaluation of cyber-physical systems in civil engineering. Proc. Appl. Math. Mech. 2017, 17. [Google Scholar] [CrossRef] [Green Version]
- Bakirtzis, G.; Vasilakopoulou, C.; Fleming, C.H. Compositional Cyber-Physical Systems Modeling. Proc. ACT 2020, 333, 125–138. [Google Scholar] [CrossRef]
- Kibret, N.; Edmonson, W.; Gebreyohannes, S. Category theoretic based formalization of the verifiable design process. In Proceedings of the 2019 IEEE International Systems Conference (SysCon), Orlando, FL, USA, 8–11 April 2019. [Google Scholar] [CrossRef]
- Gebreyohannes, S.; Edmonson, W.; Esterline, A. Formal behavioral requirements management. IEEE Syst. J. 2018, 12, 3006–3017. [Google Scholar] [CrossRef]
- Breiner, S.; Sriram, R.D.; Subrahmanian, E. Compositional Models for Complex Systems. In Artificial Intelligence for the Internet of Everything; Academic Press: London, UK, 2019. [Google Scholar] [CrossRef]
- Kovalyov, S.P. Leveraging category theory in model based enterprise. Adv. Syst. Sci. Appl. 2020, 20, 50–65. [Google Scholar] [CrossRef]
- Foley, J.D.; Breiner, S.; Subrahmanian, E.; Dusel, J.M. Operads for complex system design specification, analysis and synthesis. arXiv 2021, arXiv:2101.11115. [Google Scholar]
- Breiner, S.; Pollard, B.; Subrahmanian, E.; Marie-Rose, O. Modeling hierarchical system with operads. Proc. ACT 2020. [Google Scholar] [CrossRef]
- Diskin, Z.; Maibaum, T. Category theory and model-driven engineering: From formal semantics to design patterns and beyond. Proc. Seventh ACCAT Work. Appl. Comput. Categ. Theory 2012. [Google Scholar] [CrossRef] [Green Version]
- Diskin, Z.; Gómez, A.; Cabot, J. Traceability mappings as a fundamental instrument in model transformations. In Lecture Notes in Computer Science, Proceedings of the International Conference on Fundamental Approaches to Software Engineering, Uppsala, Sweden, 22–29 April 2017; Springer: Berlin/Heidelberg, Germany, 2017. [Google Scholar] [CrossRef]
- Korobeynikov, A.G.; Fedosovsky, M.E.; Gurjanov, A.V.; Zharinov, I.O.; Shukalov, A.V. Development of conceptual modeling method to solve the tasks of computer-aided design of difficult technical complexes on the basis of category theory. Int. J. Appl. Eng. Res. 2017, 12, 1114–1122. [Google Scholar] [CrossRef] [Green Version]
- Cafezeiro, I.; Haeusler, E.H. Semantic interoperability via category theory. In Proceedings of the 26th International Conference on Conceptual Modeling, Auckland, New Zealand, 5–9 November 2007. [Google Scholar]
- Luzeaux, D. A Formal Foundation of Systems Engineering. In Complex Systems Design & Management; Boulanger, F., Krob, D., Morel, G., Roussel, J.C., Eds.; Springer International Publishing: Cham, Switzerland, 2015. [Google Scholar] [CrossRef]
- Libkind, S. An Algebra of Resource Sharing Machines. arXiv 2020, arXiv:2007.14442. [Google Scholar]
- Baez, J.C.; Fong, B.; Pollard, B.S. A compositional framework for Markov processes. J. Math. Phys. 2016, 57. [Google Scholar] [CrossRef] [Green Version]
- Halter, M.; Herlihy, C.; Fairbanks, J. A Compositional Framework for Scientific Model Augmentation. arXiv 2019, arXiv:1907.03536. [Google Scholar] [CrossRef]
- Herlihy, C.; Cao, K.; Reparti, S.; Briscoe, E.; Fairbanks, J. Semantic Program Analysis for Scientific Model Augmentation. In Modeling the World’s Systems; Georgia Tech Research Institute: Washington, DC, USA, 2019. [Google Scholar]
- Halter, M.; Patterson, E.; Baas, A.; Fairbanks, J.P. Compositional Scientific Computing with Catlab and SemanticModels. arXiv 2020, arXiv:2005.04831. [Google Scholar]
- Reich, Y.; Konda, S.L.; Levy, S.N.; Monarch, I.A.; Subrahmanian, E. New roles for machine learning in design. Artif. Intell. Eng. 1993, 8, 165–181. [Google Scholar] [CrossRef]
- Needham, M.; Hodler, A.E. Graph Algorithms—Practical Examples in Apache Spark & Neo4j; O’Reilly Media, Inc.: Sebastopol, CA, USA, 2019. [Google Scholar]
- Webber, J.; Van Bruggen, R. Graph Databases; John Wiley & Sons, Inc.: Hoboken, NJ, USA, 2020. [Google Scholar]
- Medvedev, D.; Shani, U.; Dori, D. Gaining Insights into Conceptual Models: A Graph-Theoretic Querying Approach. Appl. Sci. 2021, 11, 765. [Google Scholar] [CrossRef]
- Dori, D. ViSWeb—The Visual Semantic Web: Unifying human and machine knowledge representations with Object-Process Methodology. VLDB J. 2004, 13, 120–147. [Google Scholar] [CrossRef]
- Shani, U.; Jacobs, S.; Wengrowicz, N.; Dori, D. Engaging ontologies to break MBSE tools boundaries through Semantic Mediation. In Proceedings of the Conference on Systems Engineering Research, Huntsville, AL, USA, 22–24 March 2016. [Google Scholar]
- Zhu, Y.; Wan, J.; Zhou, Z.; Chen, L.; Qiu, L.; Zhang, W.; Jiang, X.; Yu, Y. Triple-to-text: Converting RDF triples into high-quality natural languages via optimizing an inverse KL divergence. In Proceedings of the 42nd International ACM SIGIR Conference on Research and Development in Information Retrieval, Paris, France, 21–25 July 2019; Volume 1, pp. 455–464. [Google Scholar] [CrossRef] [Green Version]
- Nadolski, M.; Fairbanks, J. Complex systems analysis of hybrid warfare. Procedia Comput. Sci. 2019, 153, 210–217. [Google Scholar] [CrossRef]
- Mordecai, Y.; Orhof, O.; Dori, D. Model-Based Interoperability Engineering in Systems-of-Systems and Civil Aviation. IEEE Trans. Syst. Man Cybern. Syst. 2018, 48, 637–648. [Google Scholar] [CrossRef]
- Thalheim, B. The Theory of Conceptual Models, the Theory of Conceptual Modelling and Foundations of Conceptual Modelling. In Handbook of Conceptual Modeling; Embley, D.W., Thalheim, B., Eds.; Springer: Berlin/Heidelberg, Germany, 2011; pp. 543–577. [Google Scholar] [CrossRef]
- Object Management Group. OMG Systems Modeling Language; Version 1.6; Object Management Group: Needham, MA, USA, 2019. [Google Scholar]
- Booch, G.; Rumbaugh, J.; Jacobson, I. The Unified Modeling Language User Guide; Addison Wesley: Reading, MA, USA, 1998. [Google Scholar]
- MathWorks: Graph with Directed Edges—MATLAB. Available online: https://www.mathworks.com/help/matlab/ref/digraph.html (accessed on 26 November 2020).
- Spivak, D.I. Databases are Categories. Galois Connections; Massachusetts Institute of Technology: Cambridge, MA, USA, 2010. [Google Scholar]
- Bucchiarone, A.; Cabot, J.; Paige, R.F.; Pierantonio, A. Grand challenges in model-driven engineering: An analysis of the state of the research. Softw. Syst. Model. 2020, 19, 5–13. [Google Scholar] [CrossRef] [Green Version]
- Zeigler, B.; Mittal, S.; Traore, M. MBSE with/out Simulation: State of the Art and Way Forward. Systems 2018, 6, 40. [Google Scholar] [CrossRef] [Green Version]
- NAFEMS; INCOSE. What Is Systems Modeling and Simulation? NAFEMS: Glasgow, UK, 2019; Available online: https://www.nafems.org/community/working-groups/systems-modeling-simulation/ (accessed on 22 February 2021).
- Mittal, S.; Zeigler, B.P.; Martin, J. Implementation of formal standard for interoperability in M&S/systems of systems integration with DEVS/SOA. Int. Command Control C2 J. Spec. Issue Model. Simul. Support Netw. Cent. Approaches Capab. 2009, 3, 1. [Google Scholar]
- Abar, S.; Theodoropoulos, G.K.; Lemarinier, P.; O’Hare, G.M.P. Agent Based Modelling and Simulation tools: A review of the state-of-art software. Comput. Sci. Rev. 2017, 24, 13–33. [Google Scholar] [CrossRef]
Figure 1.
(a) The Model⇔Concept duo extended to (b) Model→View→Concept trio extended as a (c) Concept→Model→Graph→View Cycle (CMGVC).
Figure 1.
(a) The Model⇔Concept duo extended to (b) Model→View→Concept trio extended as a (c) Concept→Model→Graph→View Cycle (CMGVC).

Figure 2.
OPM model (OPD on the left, OPL on the right) of a Lane Keeping System, loosely based on [32]. The system handles a Lane Keeping function that provides Improved Safety. Lane Keeping generates Alerts that inform the Driving process, and Steering Commands that affect the Vehicle’s Propelling function. The Road constitutes an instrument for both Propelling and Lane Keeping. Driving and Propelling affect each other regardless of the Lane Keeping System.

Figure 3.
Equivalent representations of relations between pairs of objects as: (i) a digraph, (ii) an adjacency matrix (cell (r,c) holds the arrow value of row object (r) to column object (c), and (iii) a set of tuples (triplets of source object (S), target object (T), and value (V), relating S to T.

Figure 4.
A category with three types: Type1, Type2, and Type3. The morphisms and are specified. The morphism is a composition of after —it transforms Type1 to Type3 by transforming Type1 to Type2, then Type2 to Type3.
Figure 4.
A category with three types: Type1, Type2, and Type3. The morphisms and are specified. The morphism is a composition of after —it transforms Type1 to Type3 by transforming Type1 to Type2, then Type2 to Type3.

Figure 5.
The CMGVC, as a cognitive–computational cycle of Conceptual Modeling, Model Transforming, Stakeholder-informing View Rendering, and Reasoning. The System, OPM Model, GDS, and SIM are specializations of the respective generic artifacts: Concept, Model, Generic Representation, and View.
Figure 5.
The CMGVC, as a cognitive–computational cycle of Conceptual Modeling, Model Transforming, Stakeholder-informing View Rendering, and Reasoning. The System, OPM Model, GDS, and SIM are specializations of the respective generic artifacts: Concept, Model, Generic Representation, and View.

Figure 6.
The OPM modeling language, OPML, as a category. Modeling (the morphism m) is like hopping through the instantiation of category types based on existing artifacts. For example: (a) creating a new Diagram D1 in a Model M, (b) creating an Object Ob1 in D1, (c) creating a Process P1 in D1, (d) creating a RelationRr1(Ob1,P1) from Ob1 to P1, (e) creating a new Diagram D2 from P1, (f) adding States St11 and St12 to Ob1 in D2, and so on. Every instantiation of a type also affects the Spec, and therefore all graphical elements have a mapping into Spec (the morphism s). Spec also feeds into the Rendering morphism r, which renders a Report from the Spec, currently in the form of a PDF file. Diagram created using MATLAB 2019b digraph plotting capabilities [85].

Figure 7.
A graph rendition of a subset of the Lane Keeping System (LKS) model in Figure 2. The graph maps the OPM-specifiable terms “$Object”, and “$Process” to Domain entities: Object classifies Vehicle, Driver, and LKS; Process classifies Driving, Propelling, and Lane_Keeping. Domain-internal relations include the mutual invocation between Driving and Propelling, output of Alert and Steering_Command to Driving and Propelling, respectively, and exhibition of Lane_Keeping by LKS. This graph visualizes a subset of the GDS that represents the model. It is clearly difficult to comprehend, and is illustrated for intuition about the possible mapping of a model to a graph.

Figure 8.
A C-Set mapping functor schema from OPML to GDS (RSTUV tuple set) extracts ElementDictionary from the model’s ExportedReport and transforms ElementDictionary into three sets: ObjectElement, ProcessElement, and RelationSet. RelationSet is decomposed into a set of Relations. The functor computes attributes for each entity type from the report. For example, it lists the ObjectOPDs in which each Object is defined, and extracts the Source object/process and the Target object/process for each Relation. Each entity is then transformed into a set of RSTUVCandidates. Duplicate candidates are removed before the set of RSTUVTuple is compiled. Illustration created using the www.NomnoML.com.

Figure 9.
Model Analyzer Framework V0.1—Prototype Architecture Description

Figure 10.
A JSON structure defining the required transformations of ProcessElement attributes to RSTUVCandidate items. This example does not include relationSourceTargetTriplets.
Figure 10.
A JSON structure defining the required transformations of ProcessElement attributes to RSTUVCandidate items. This example does not include relationSourceTargetTriplets.

Figure 11.
OPM model with processes and onputs (a), shown in three additional renditions: (b) an onput-on-node/process-on-edge graph, (c) a process-on-node/onput-on-edge graph, and (d) a process-to-process onput exchange matrix. NULL processes and onputs (in all renditions) serve as placeholders for missing or partial relations, like an input without a source process (Ob12), a process without an input (P3) or without an output (P7), and an output without a target process (Ob11). Both graph visualizations were rendered using https://csacademy.com/app/graph_editor/ (accessed on 3 December 2020).

Figure 12.
Lane Keeping System zooms into Alert Mode, Steer-back Mode, Road Image, Alert Mode, Lane Crossing, and Steer-back Mode, in that vertical sequence, as well as Alerting, Analyzing Road, Imaging Road, Selecting Operational Mode, and Steering (This caption is formal OPL).
Figure 12.
Lane Keeping System zooms into Alert Mode, Steer-back Mode, Road Image, Alert Mode, Lane Crossing, and Steer-back Mode, in that vertical sequence, as well as Alerting, Analyzing Road, Imaging Road, Selecting Operational Mode, and Steering (This caption is formal OPL).


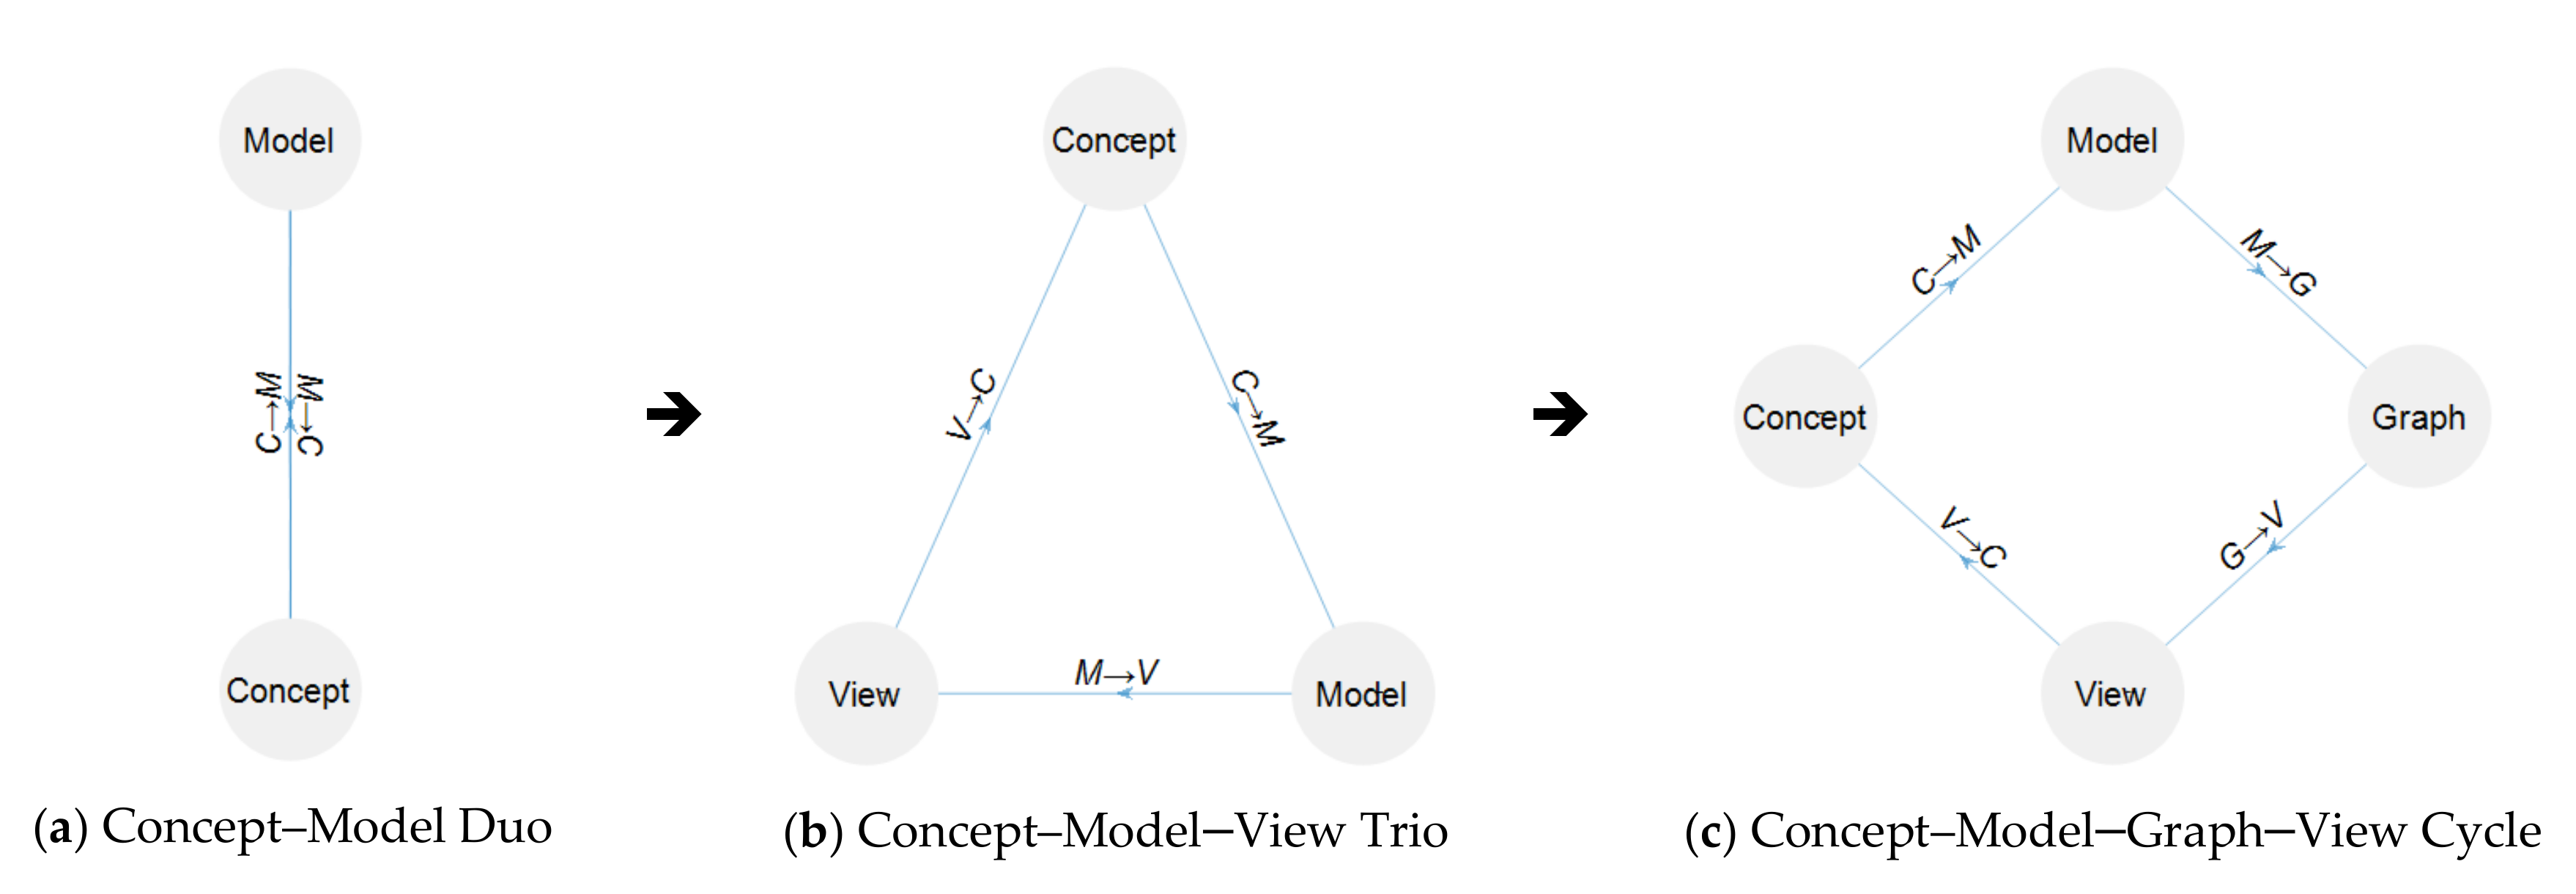
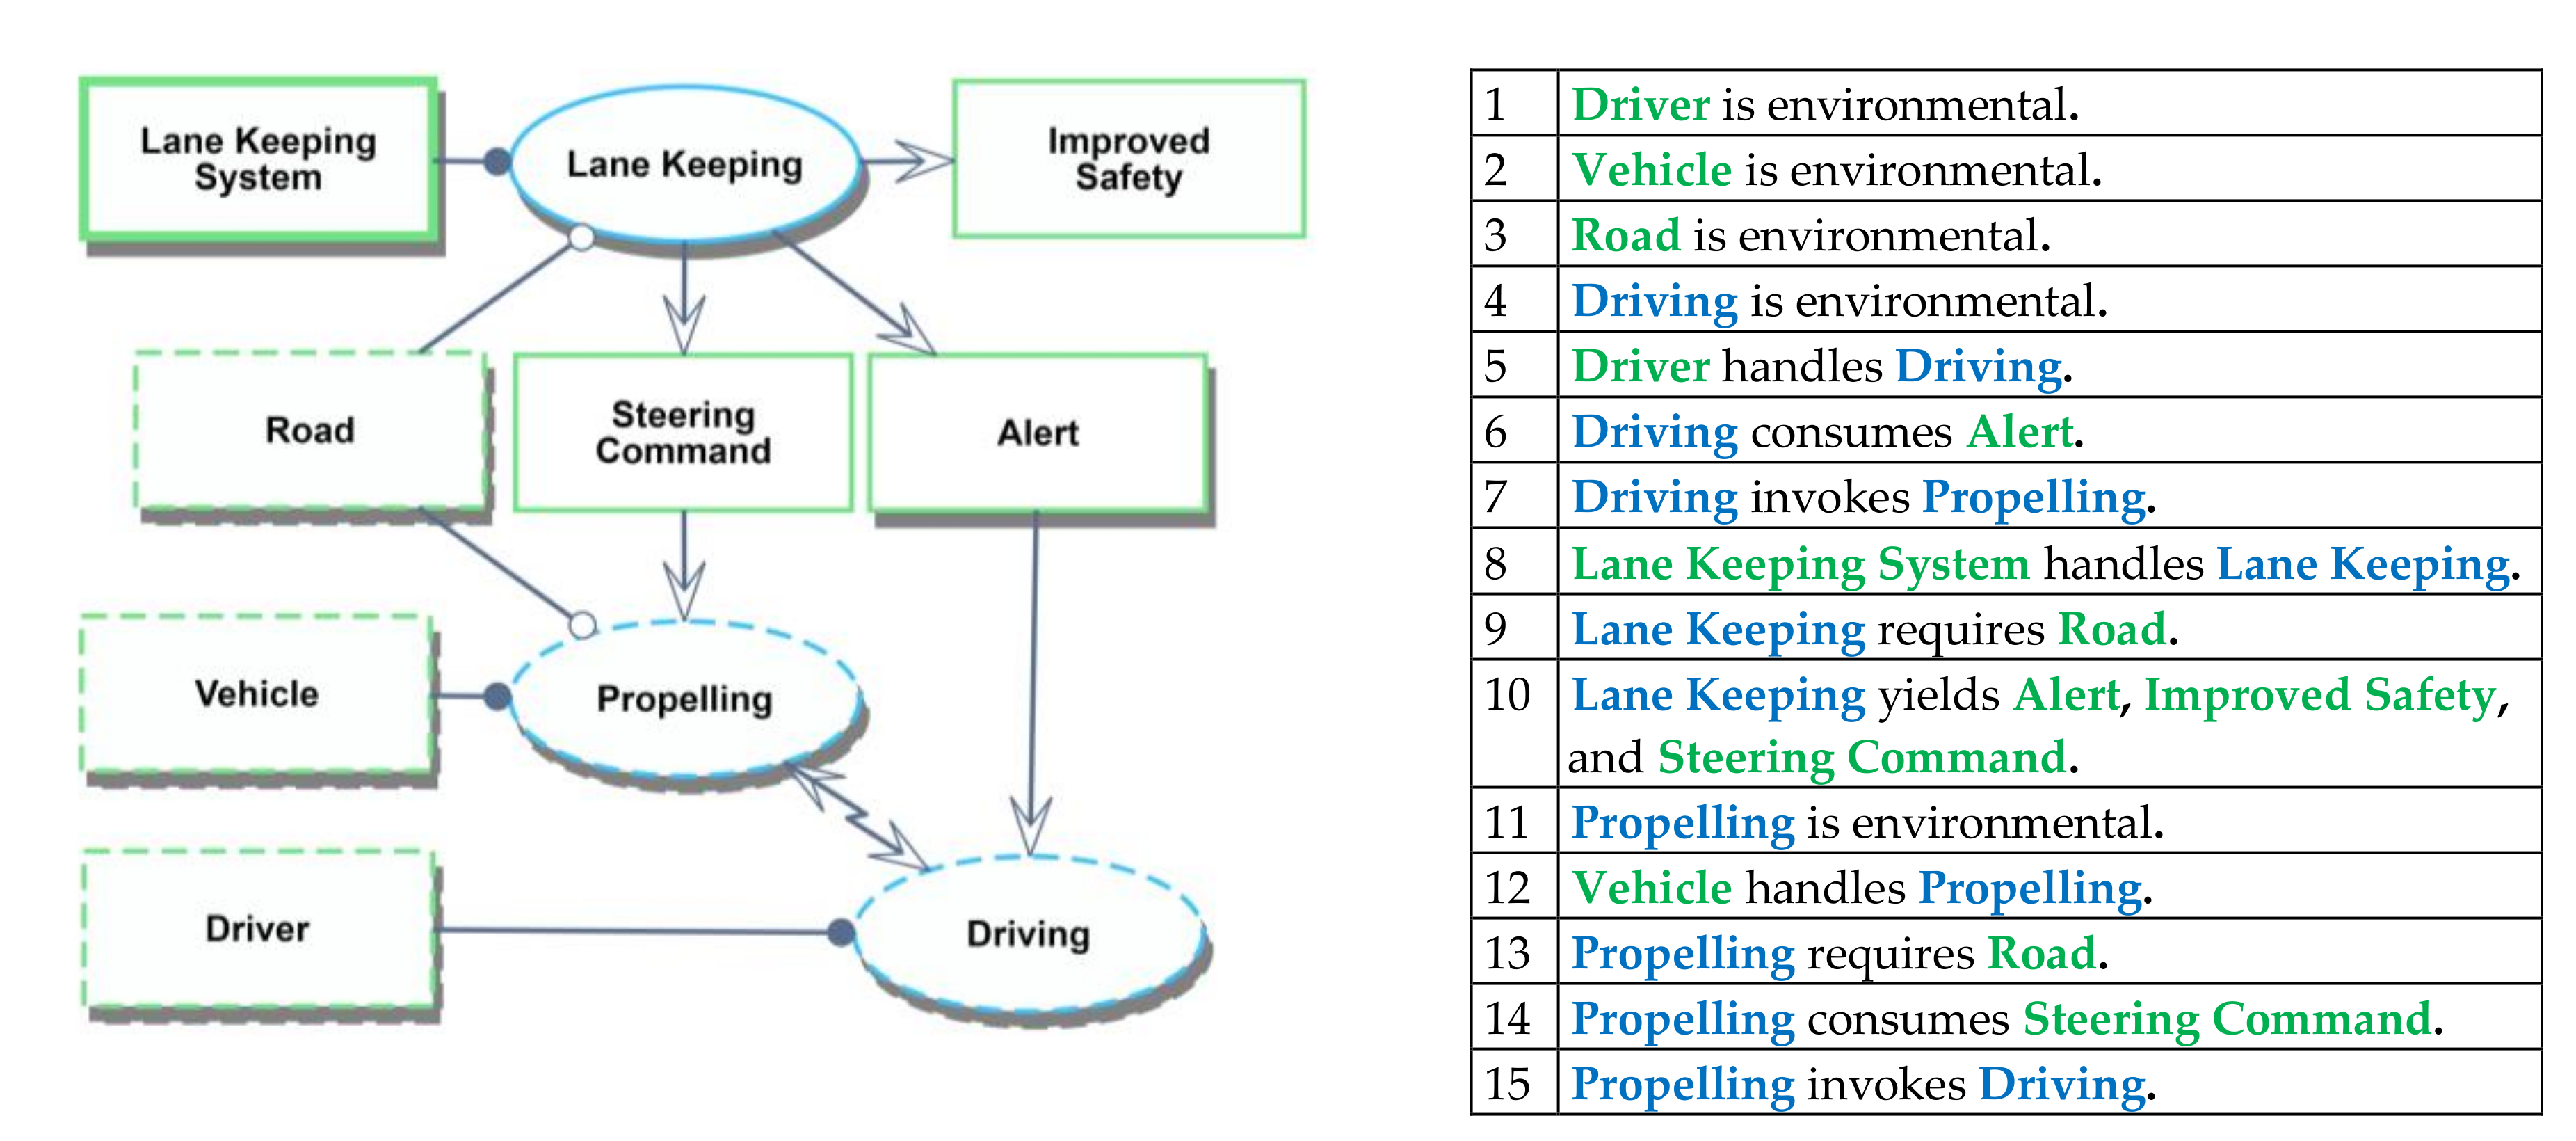
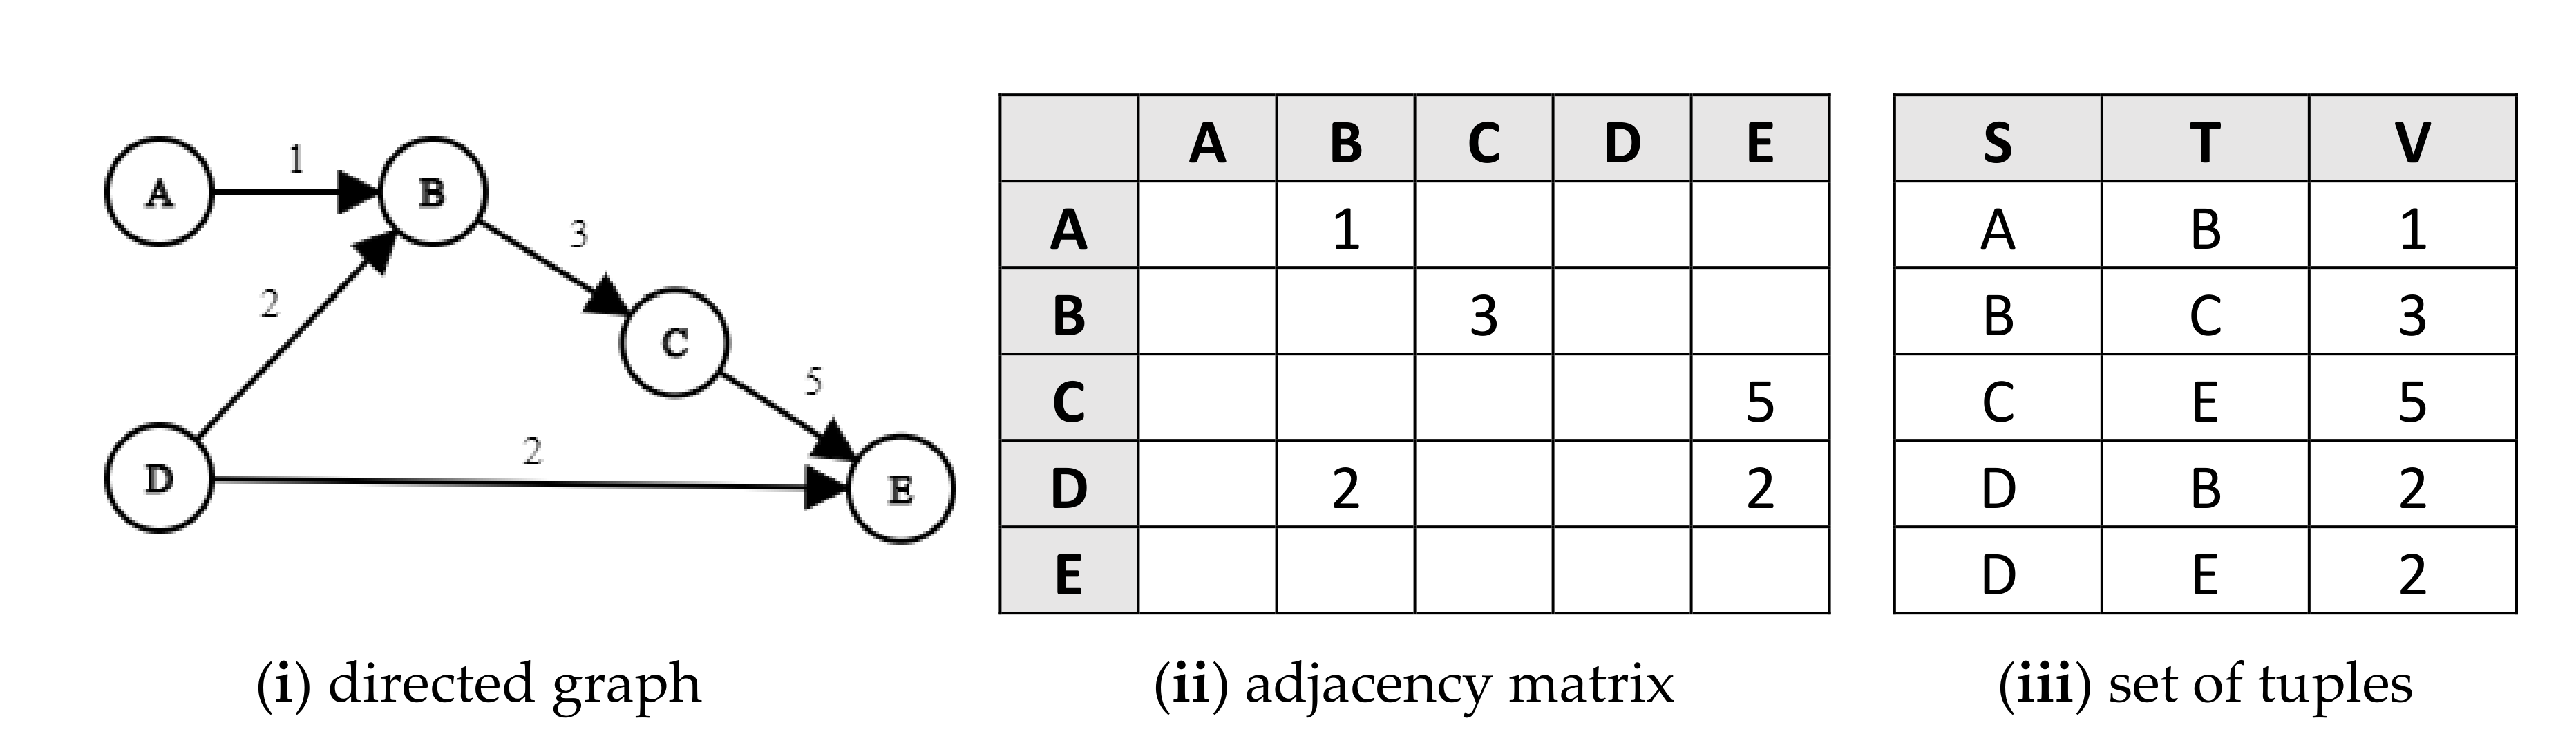
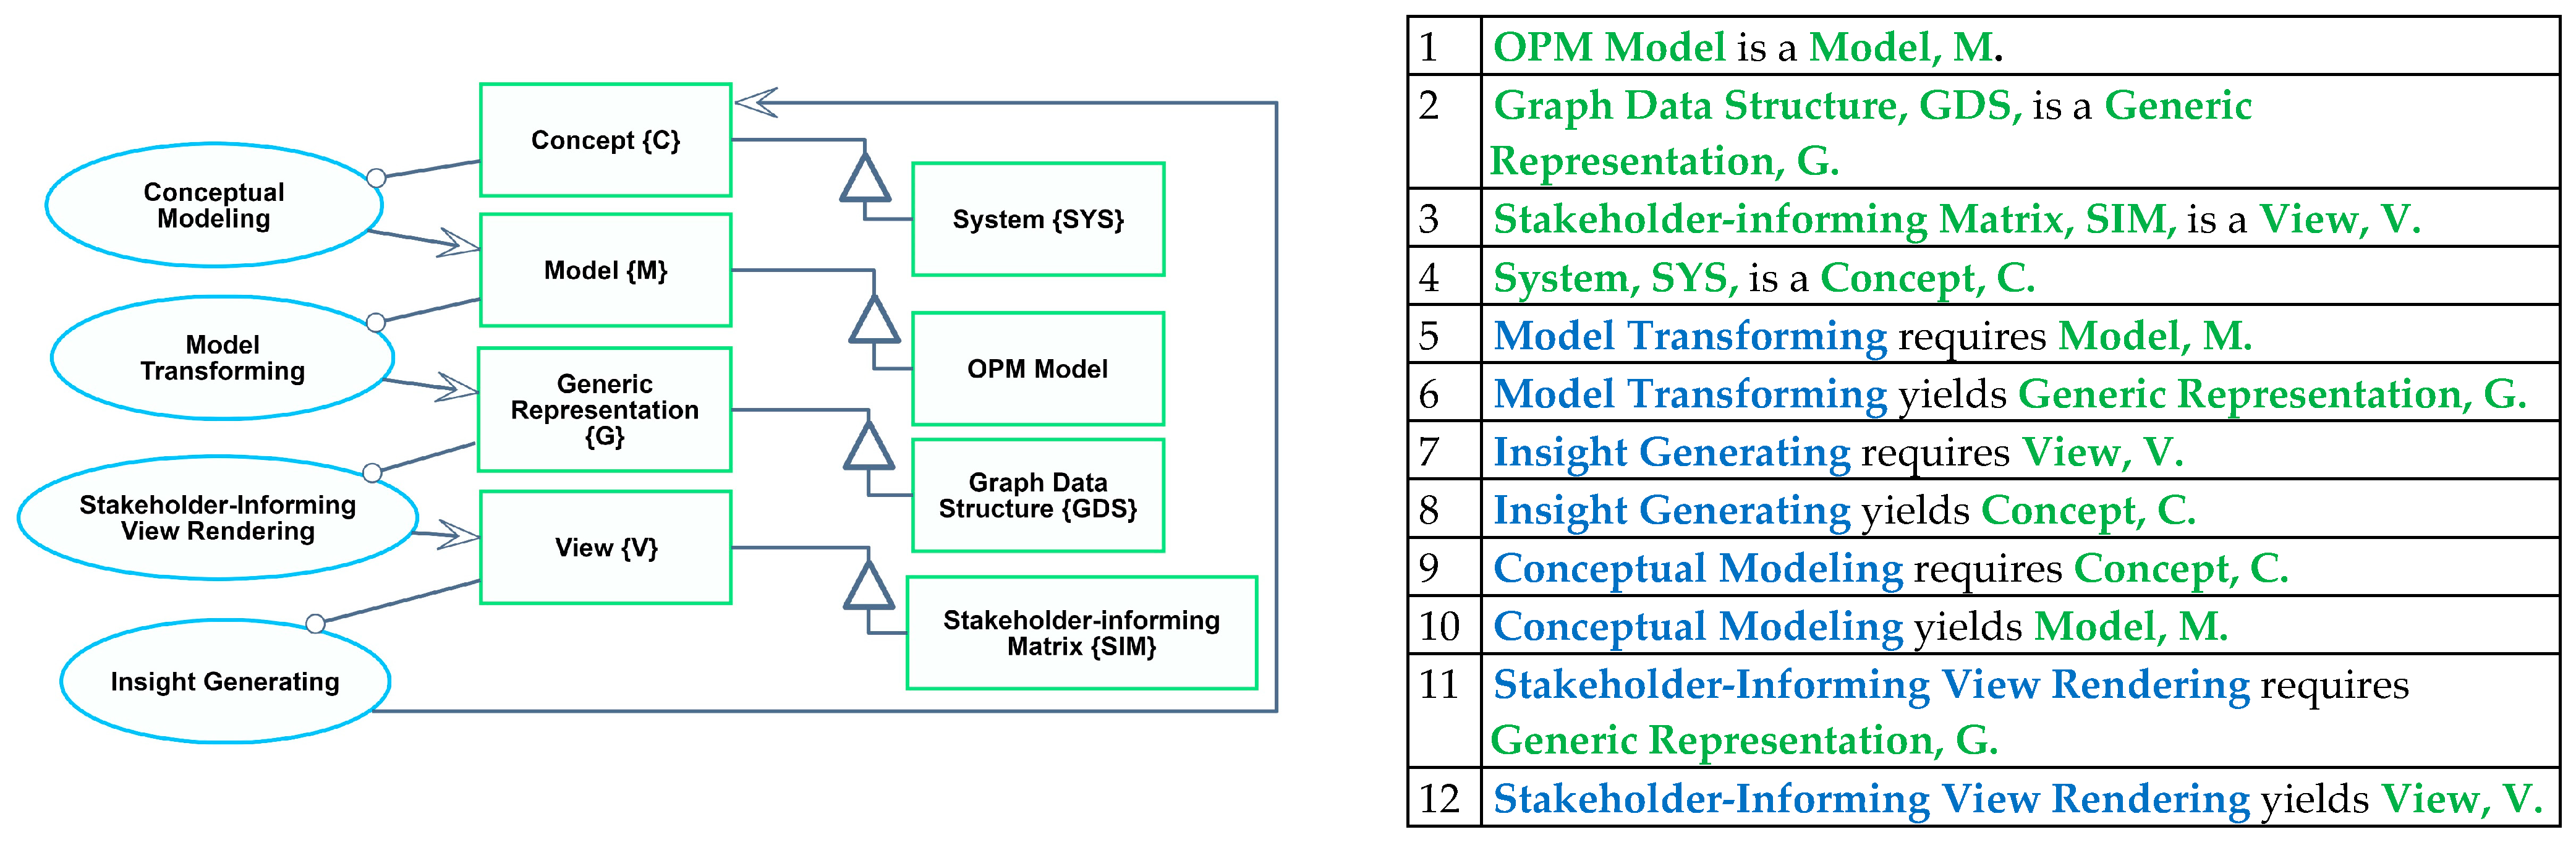
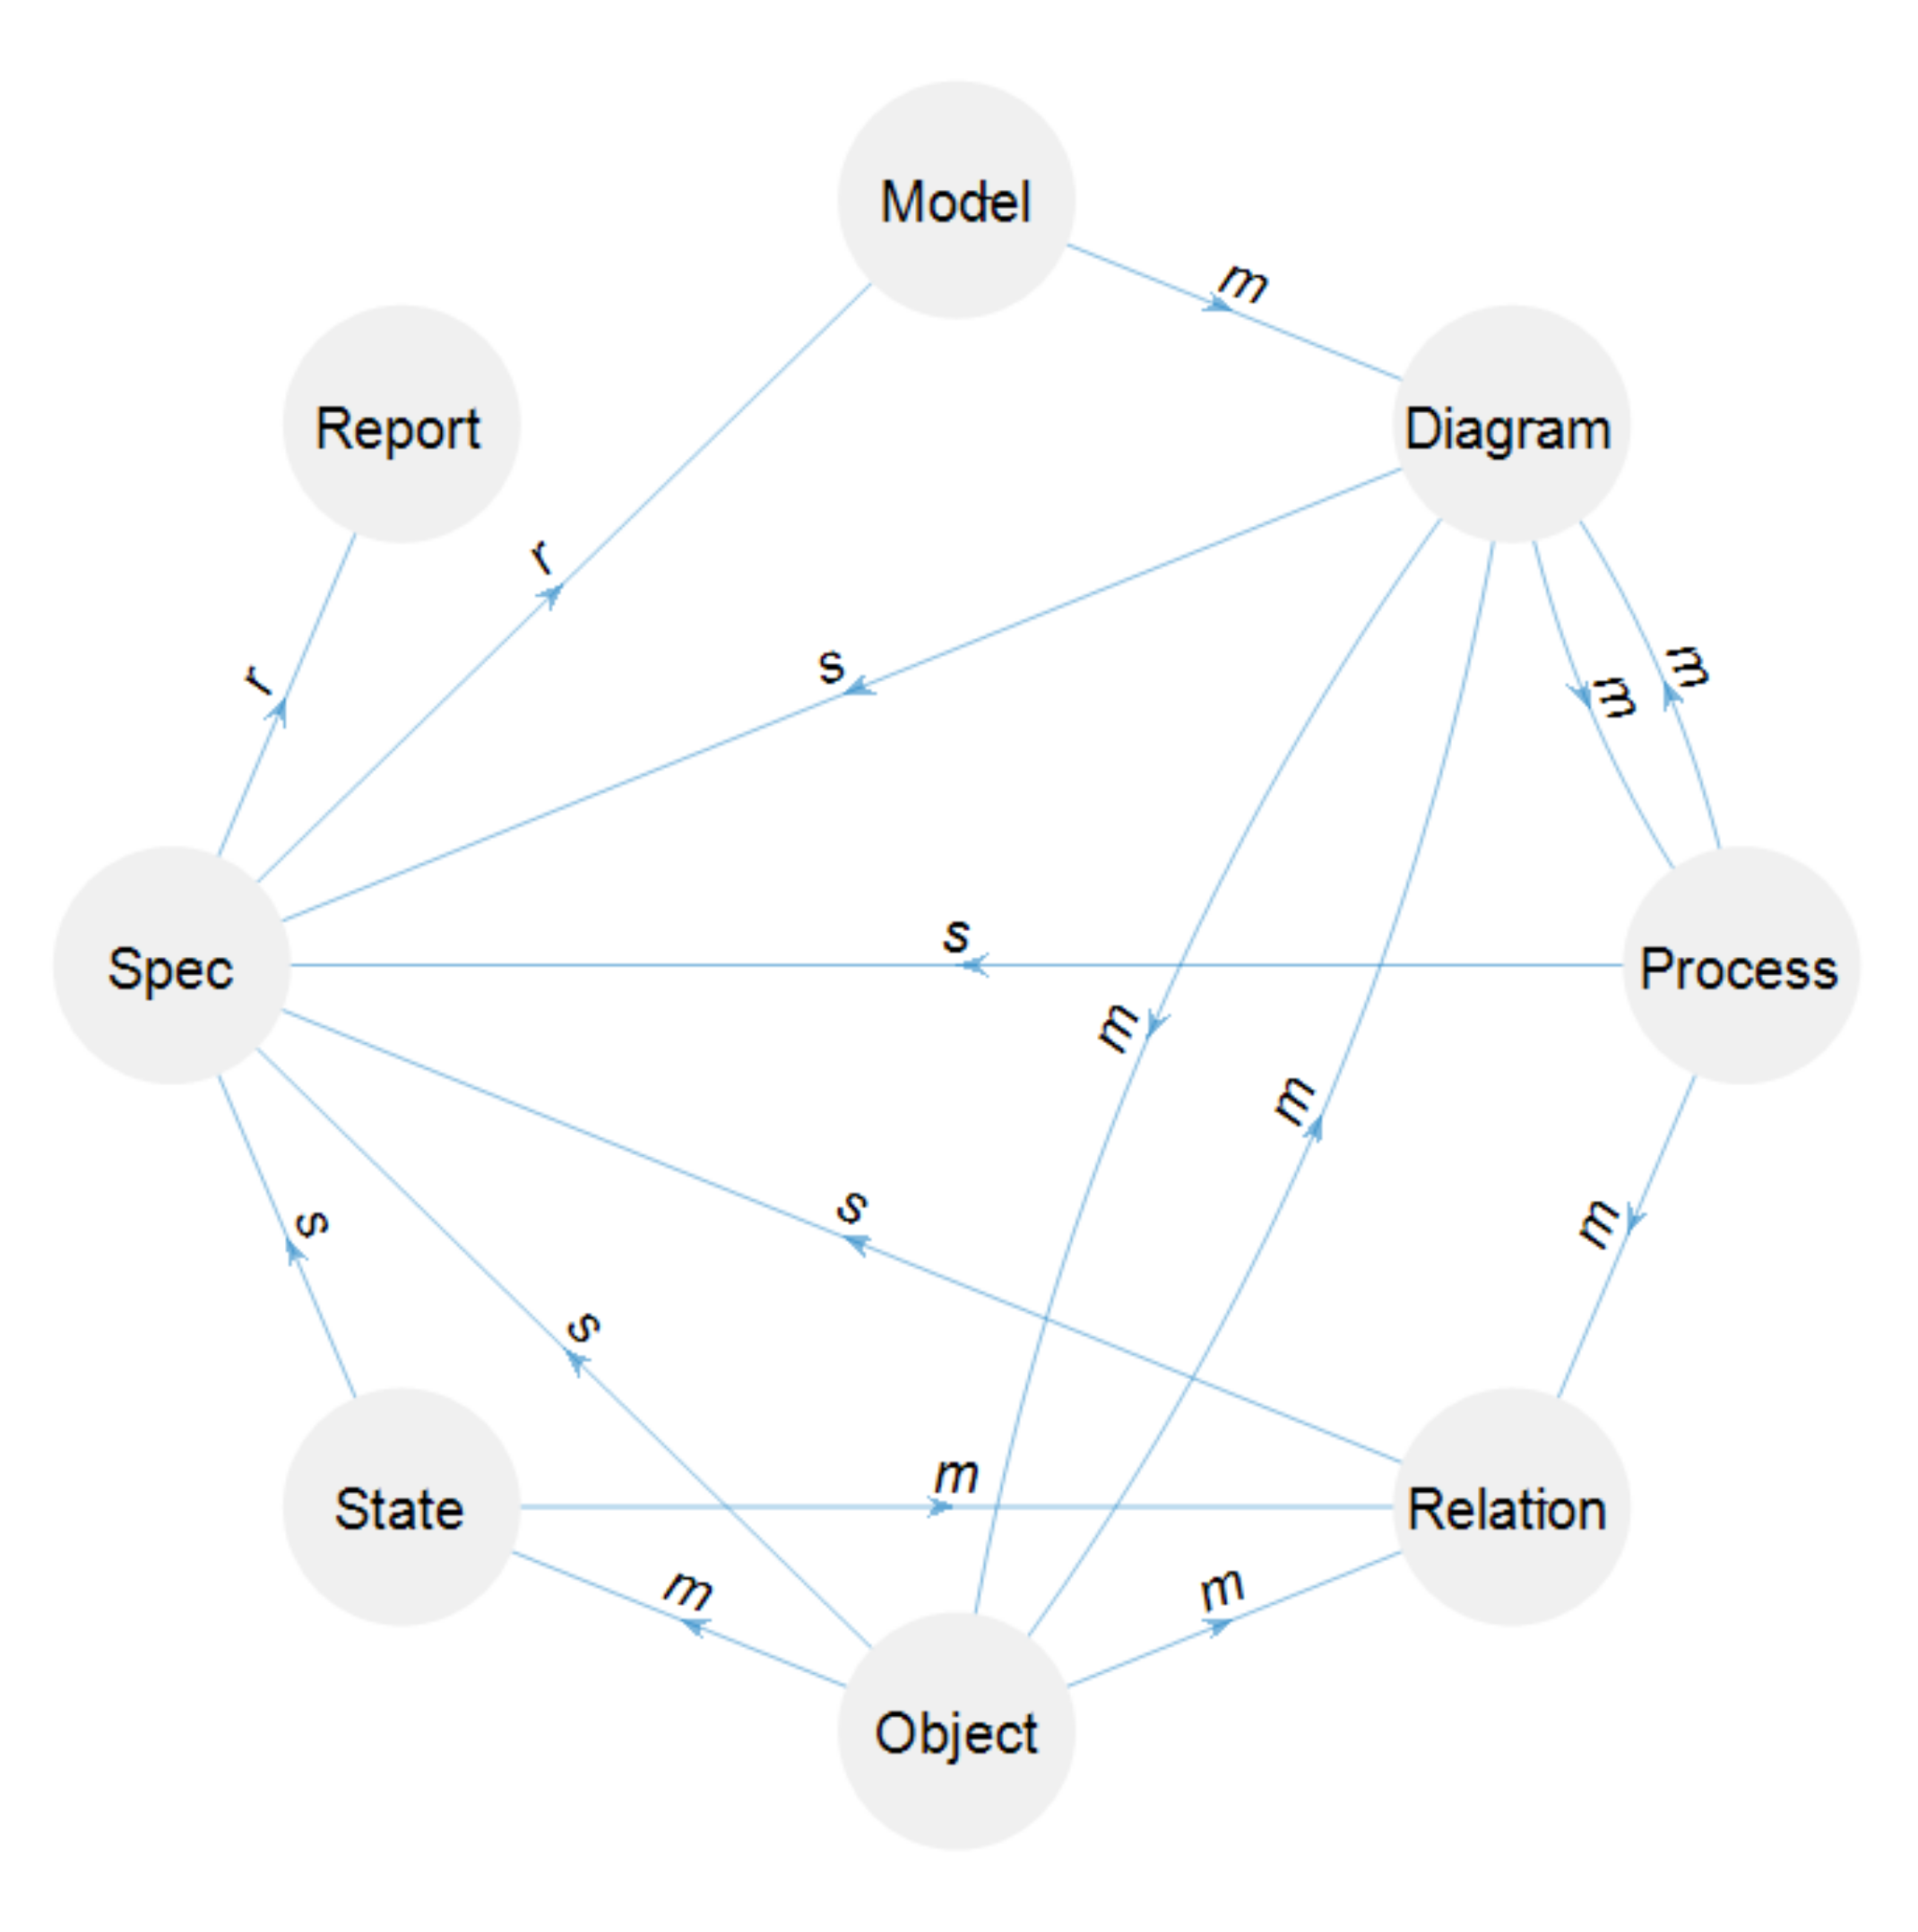
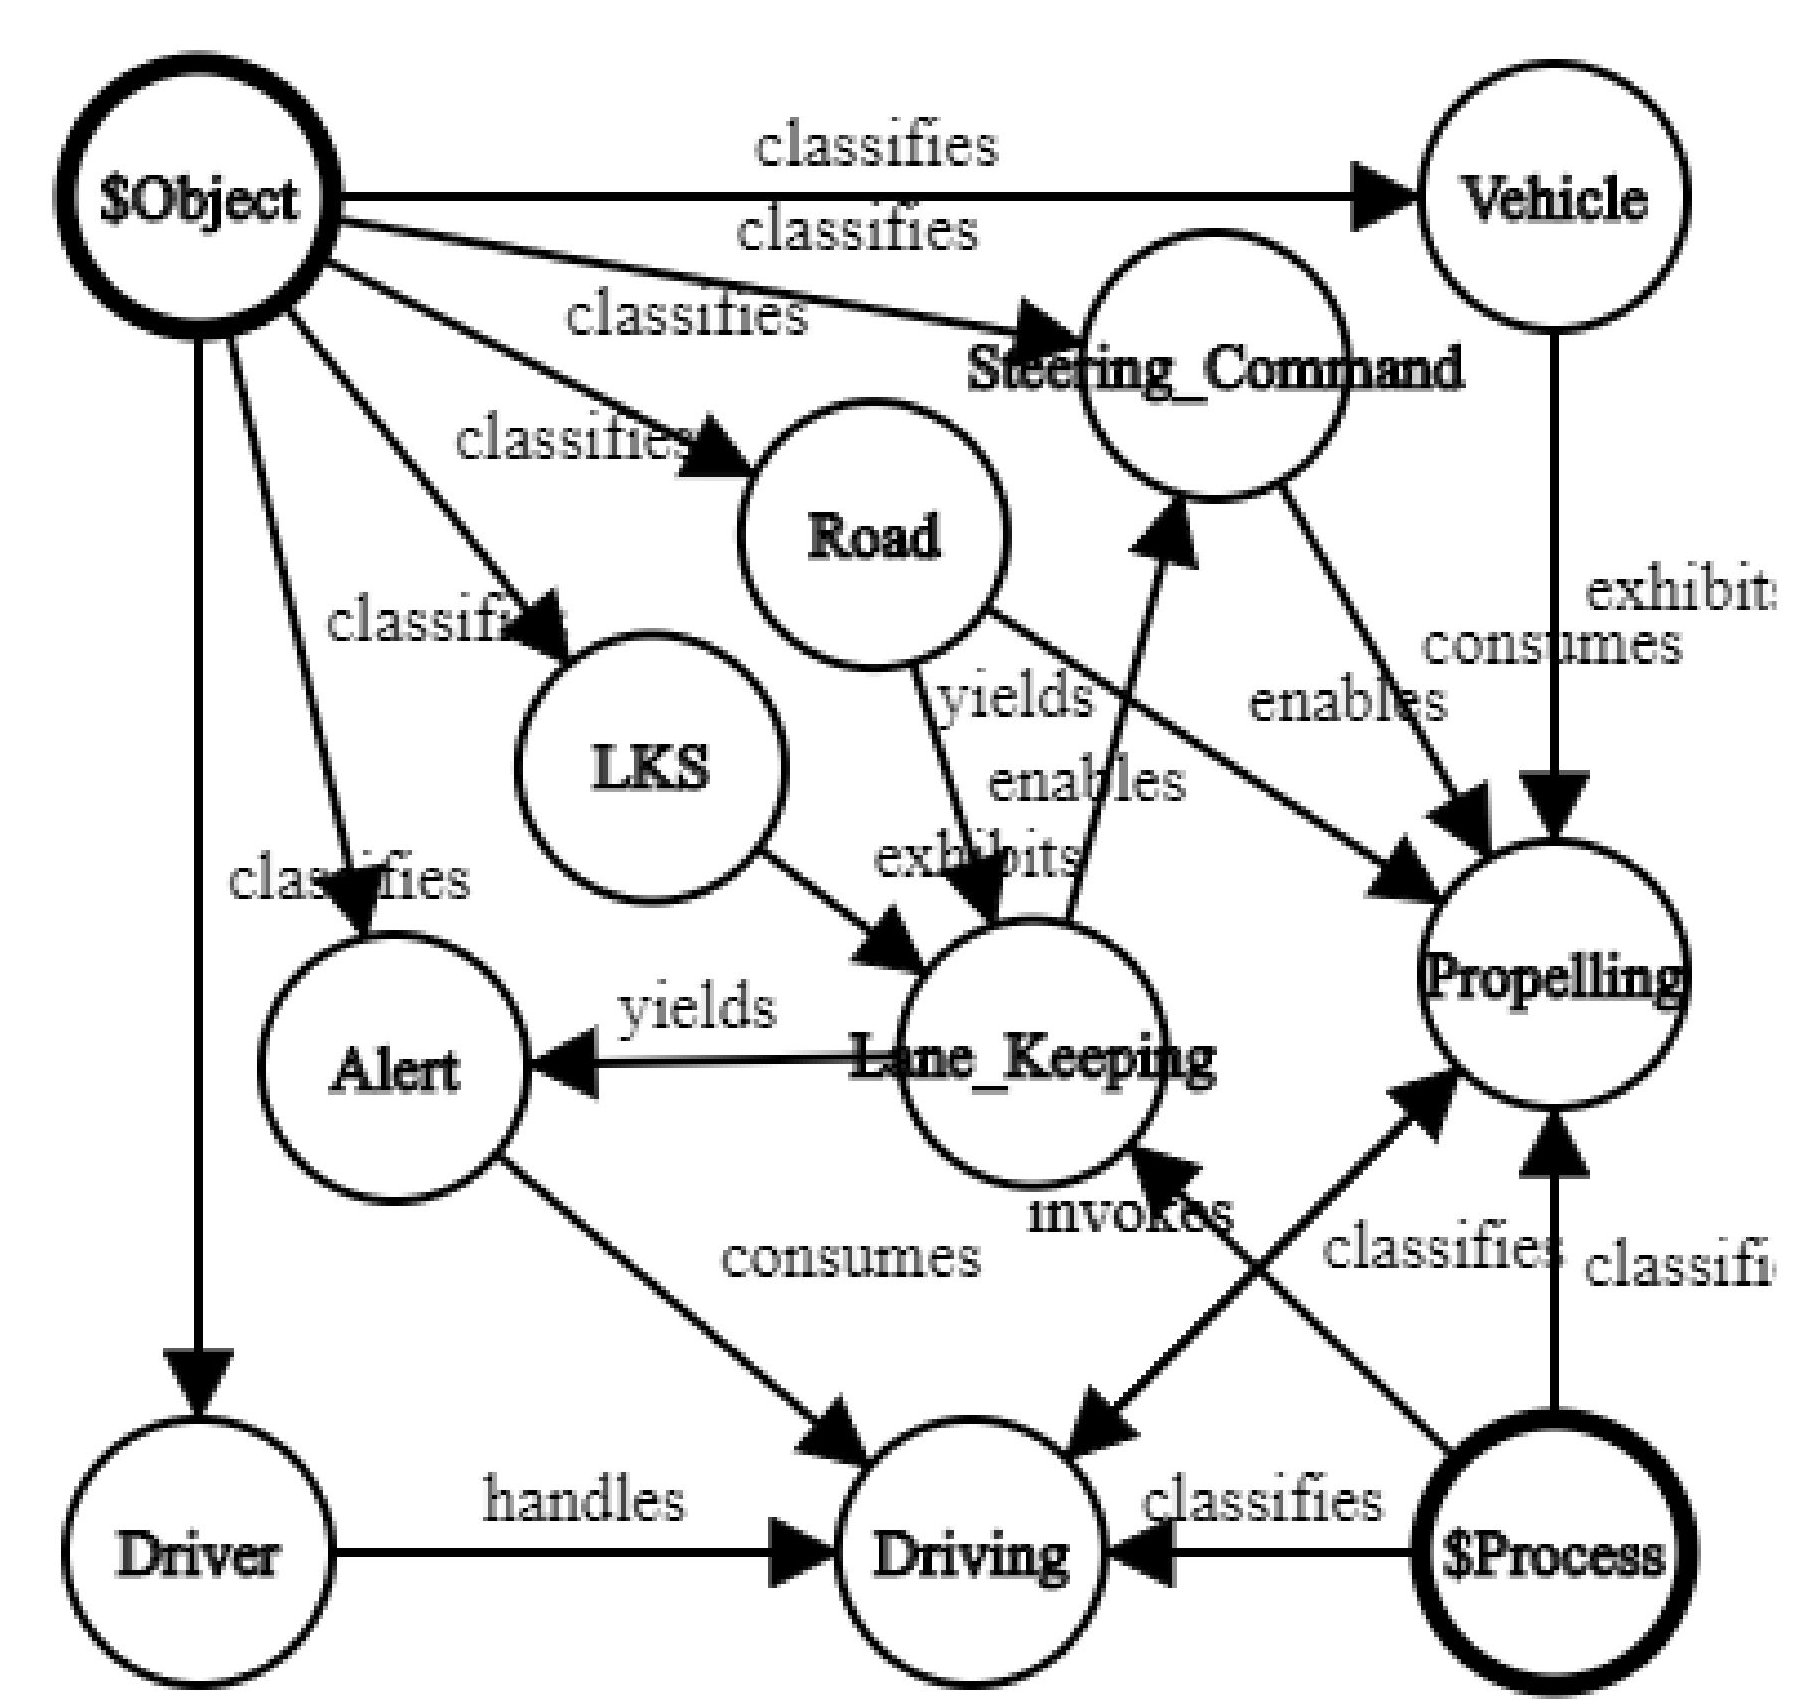
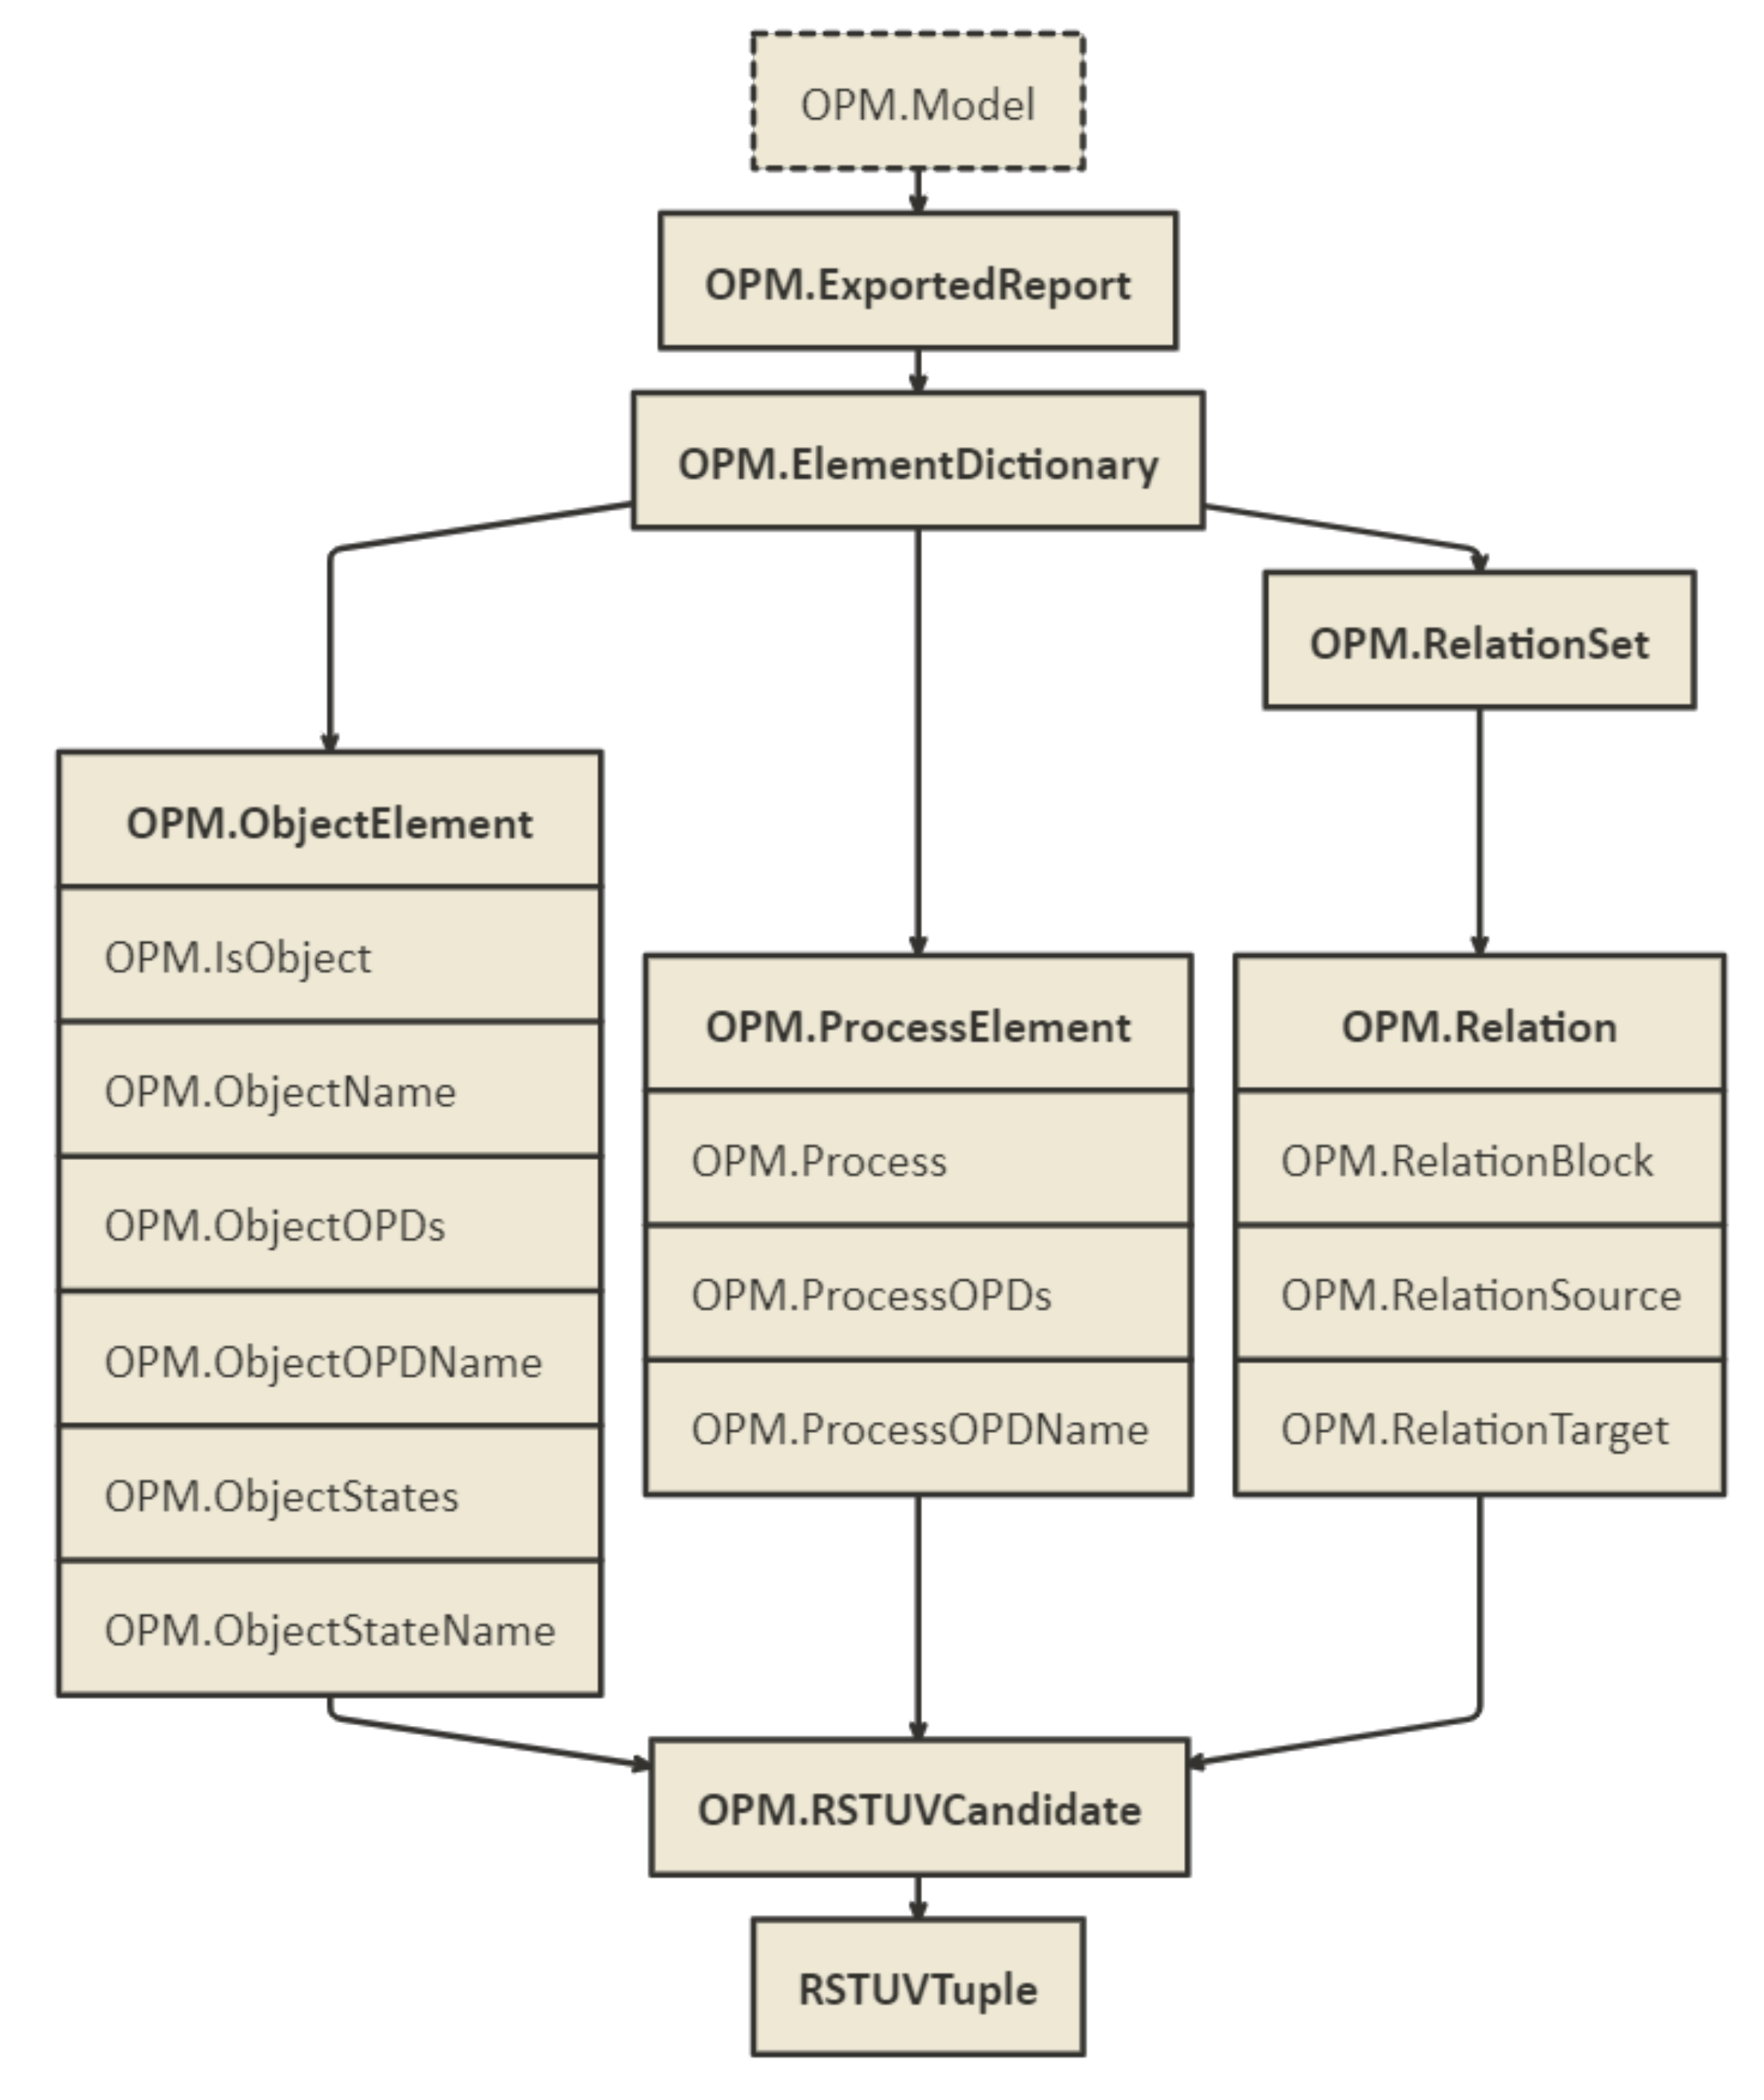
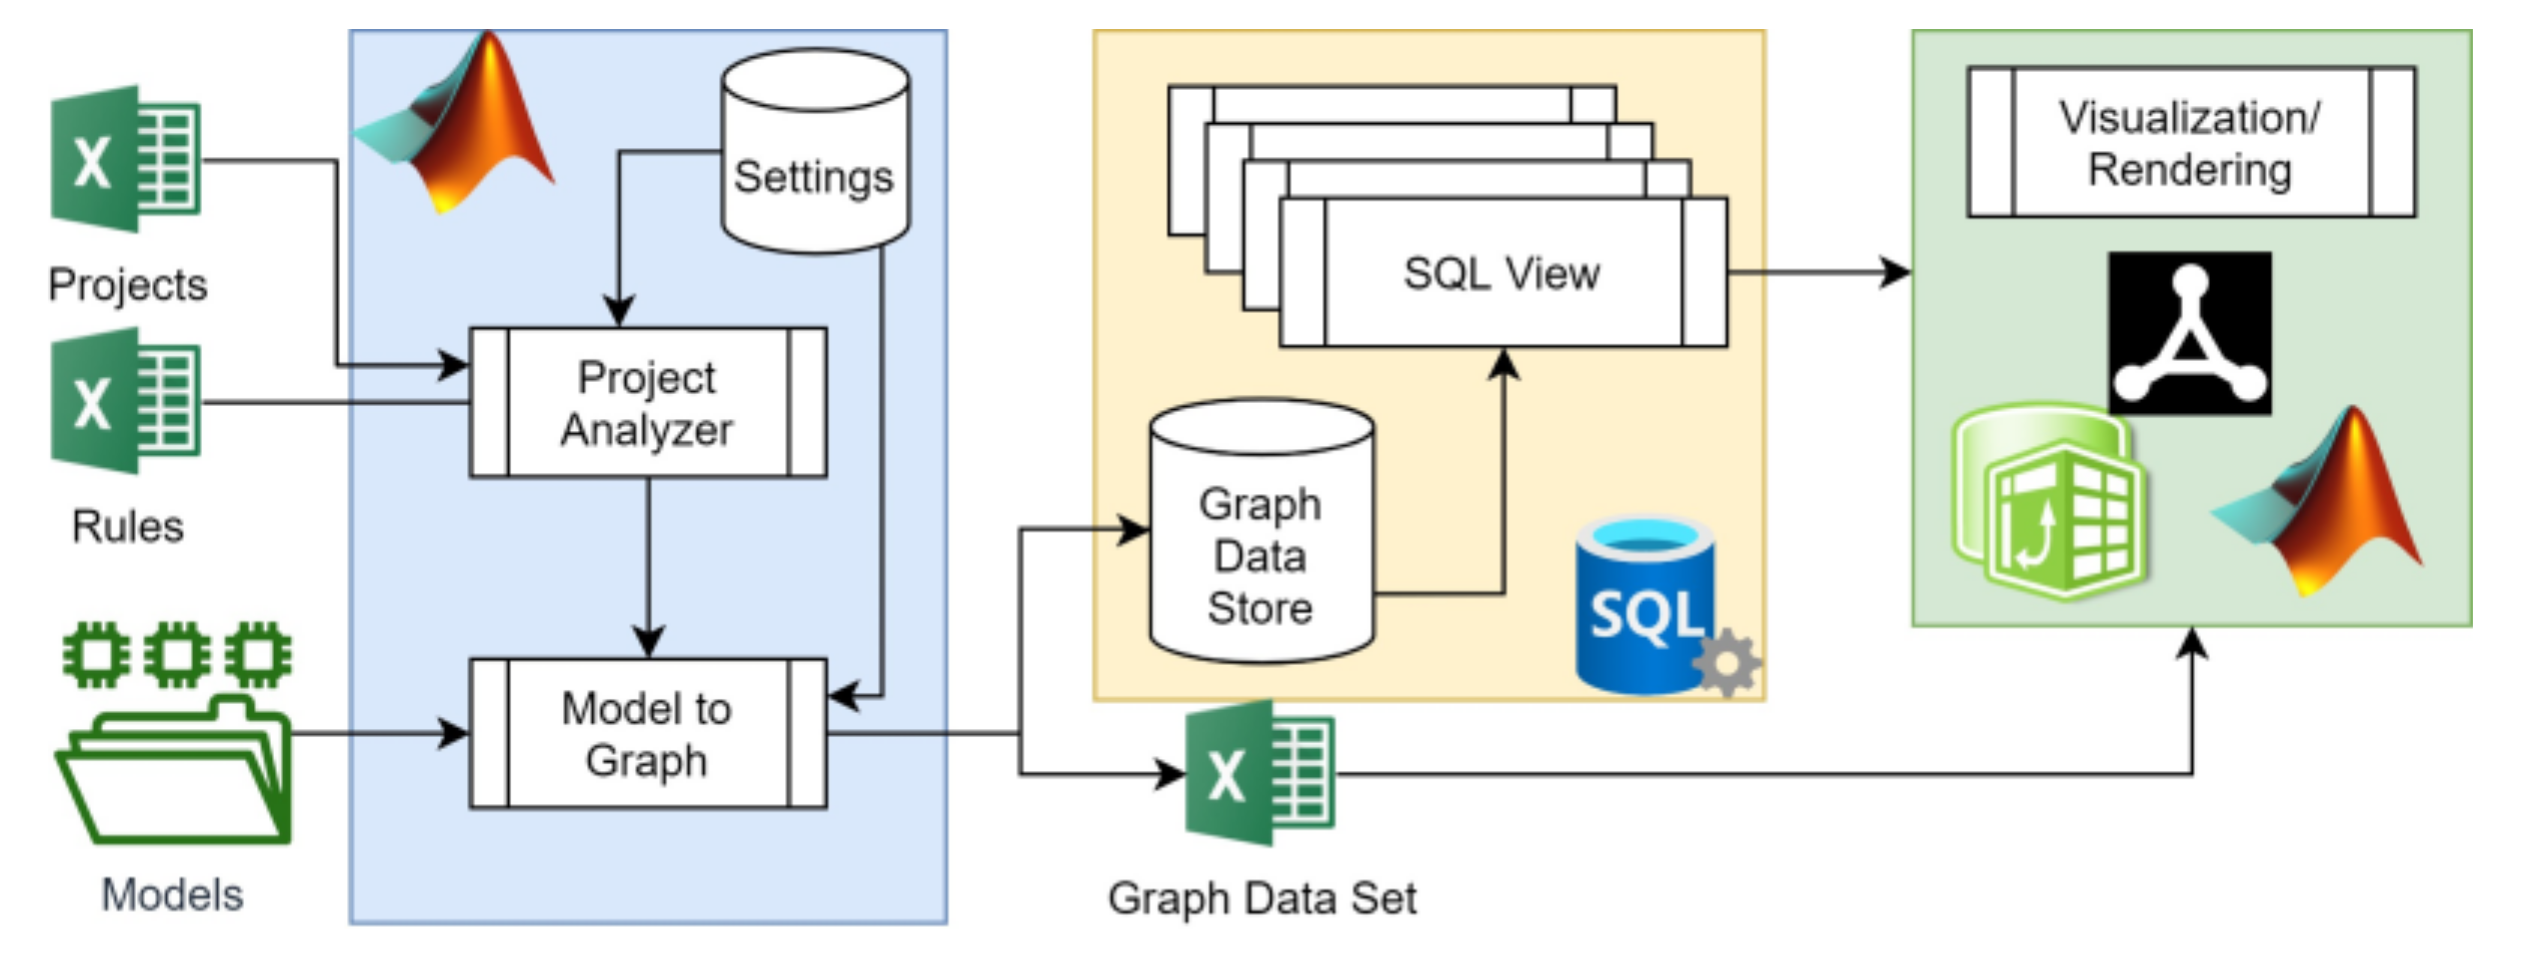
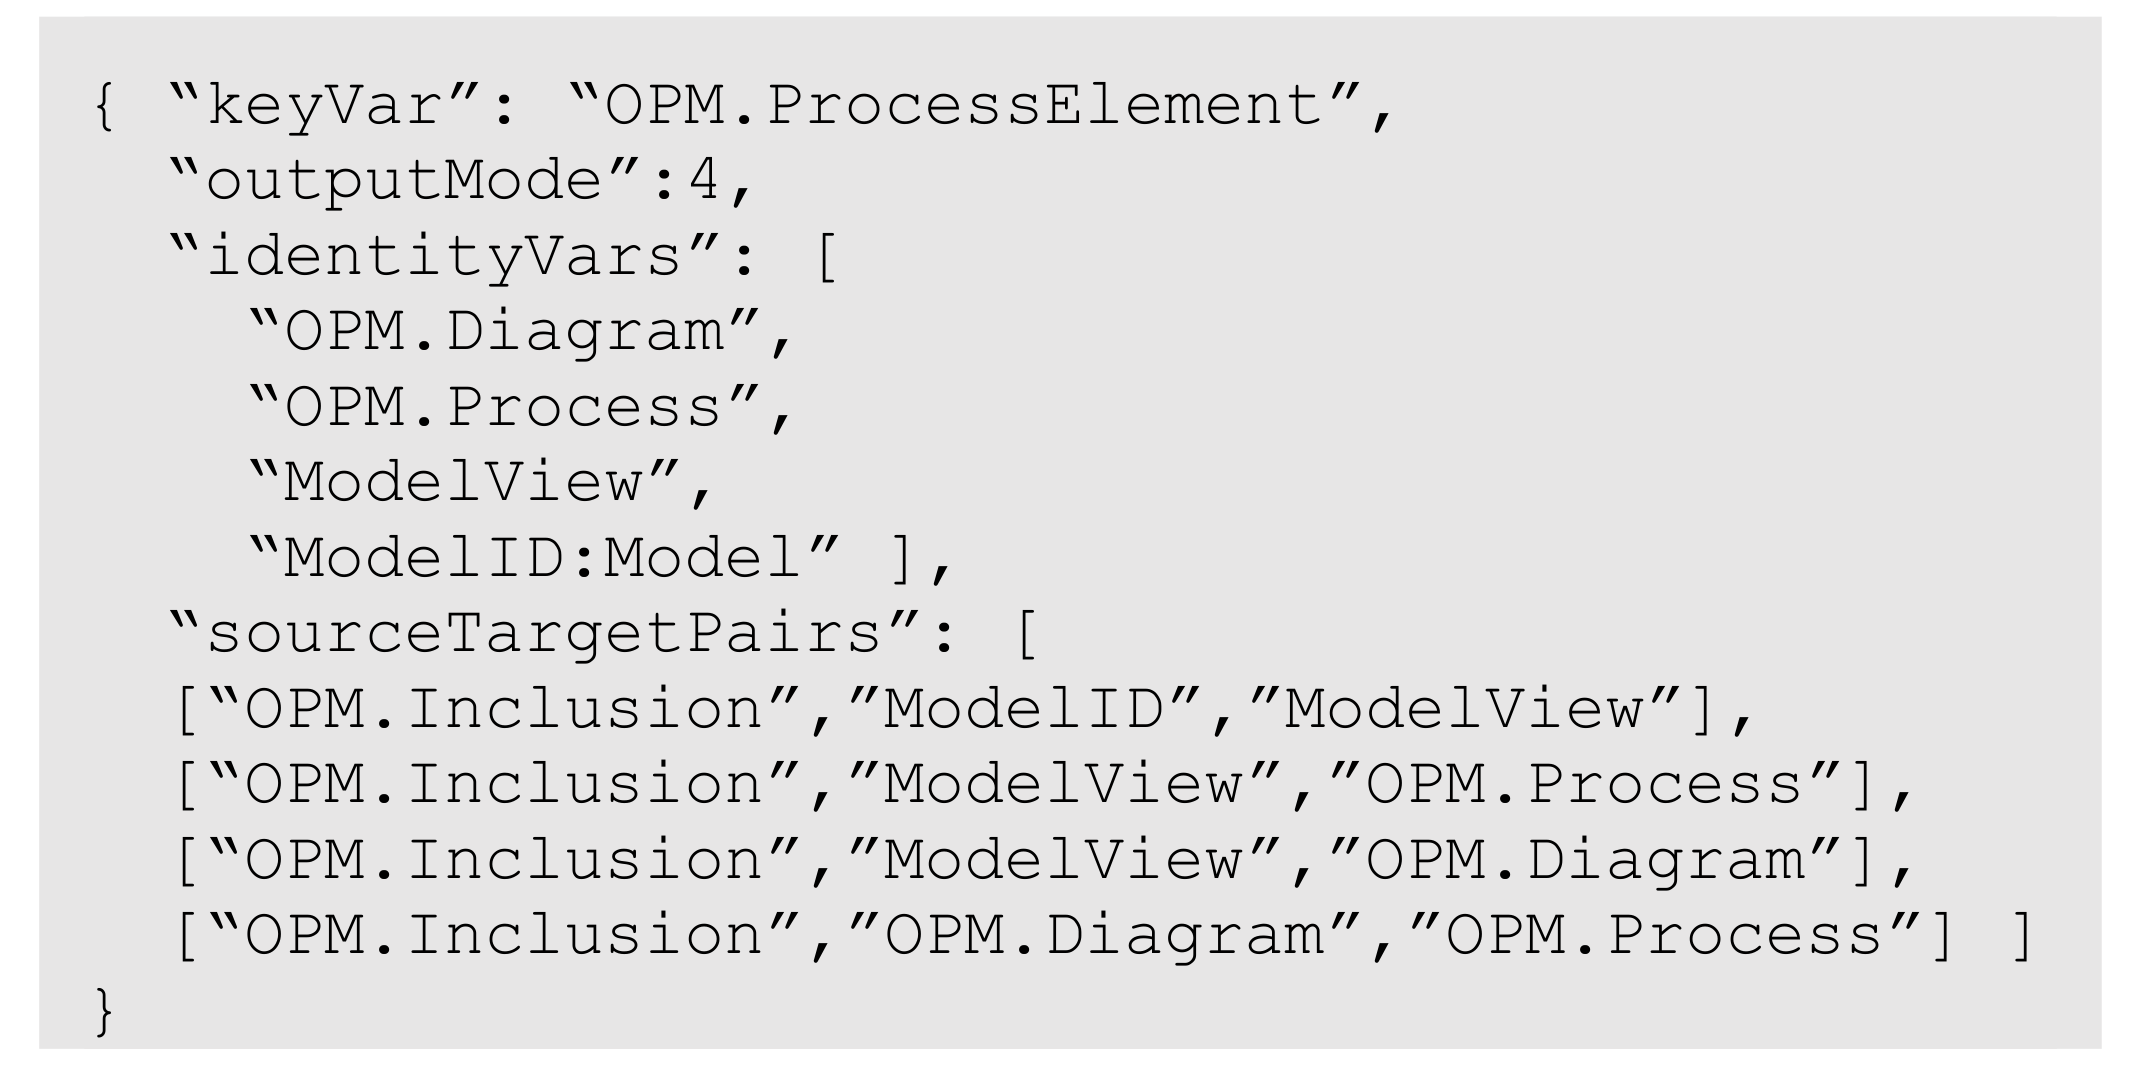
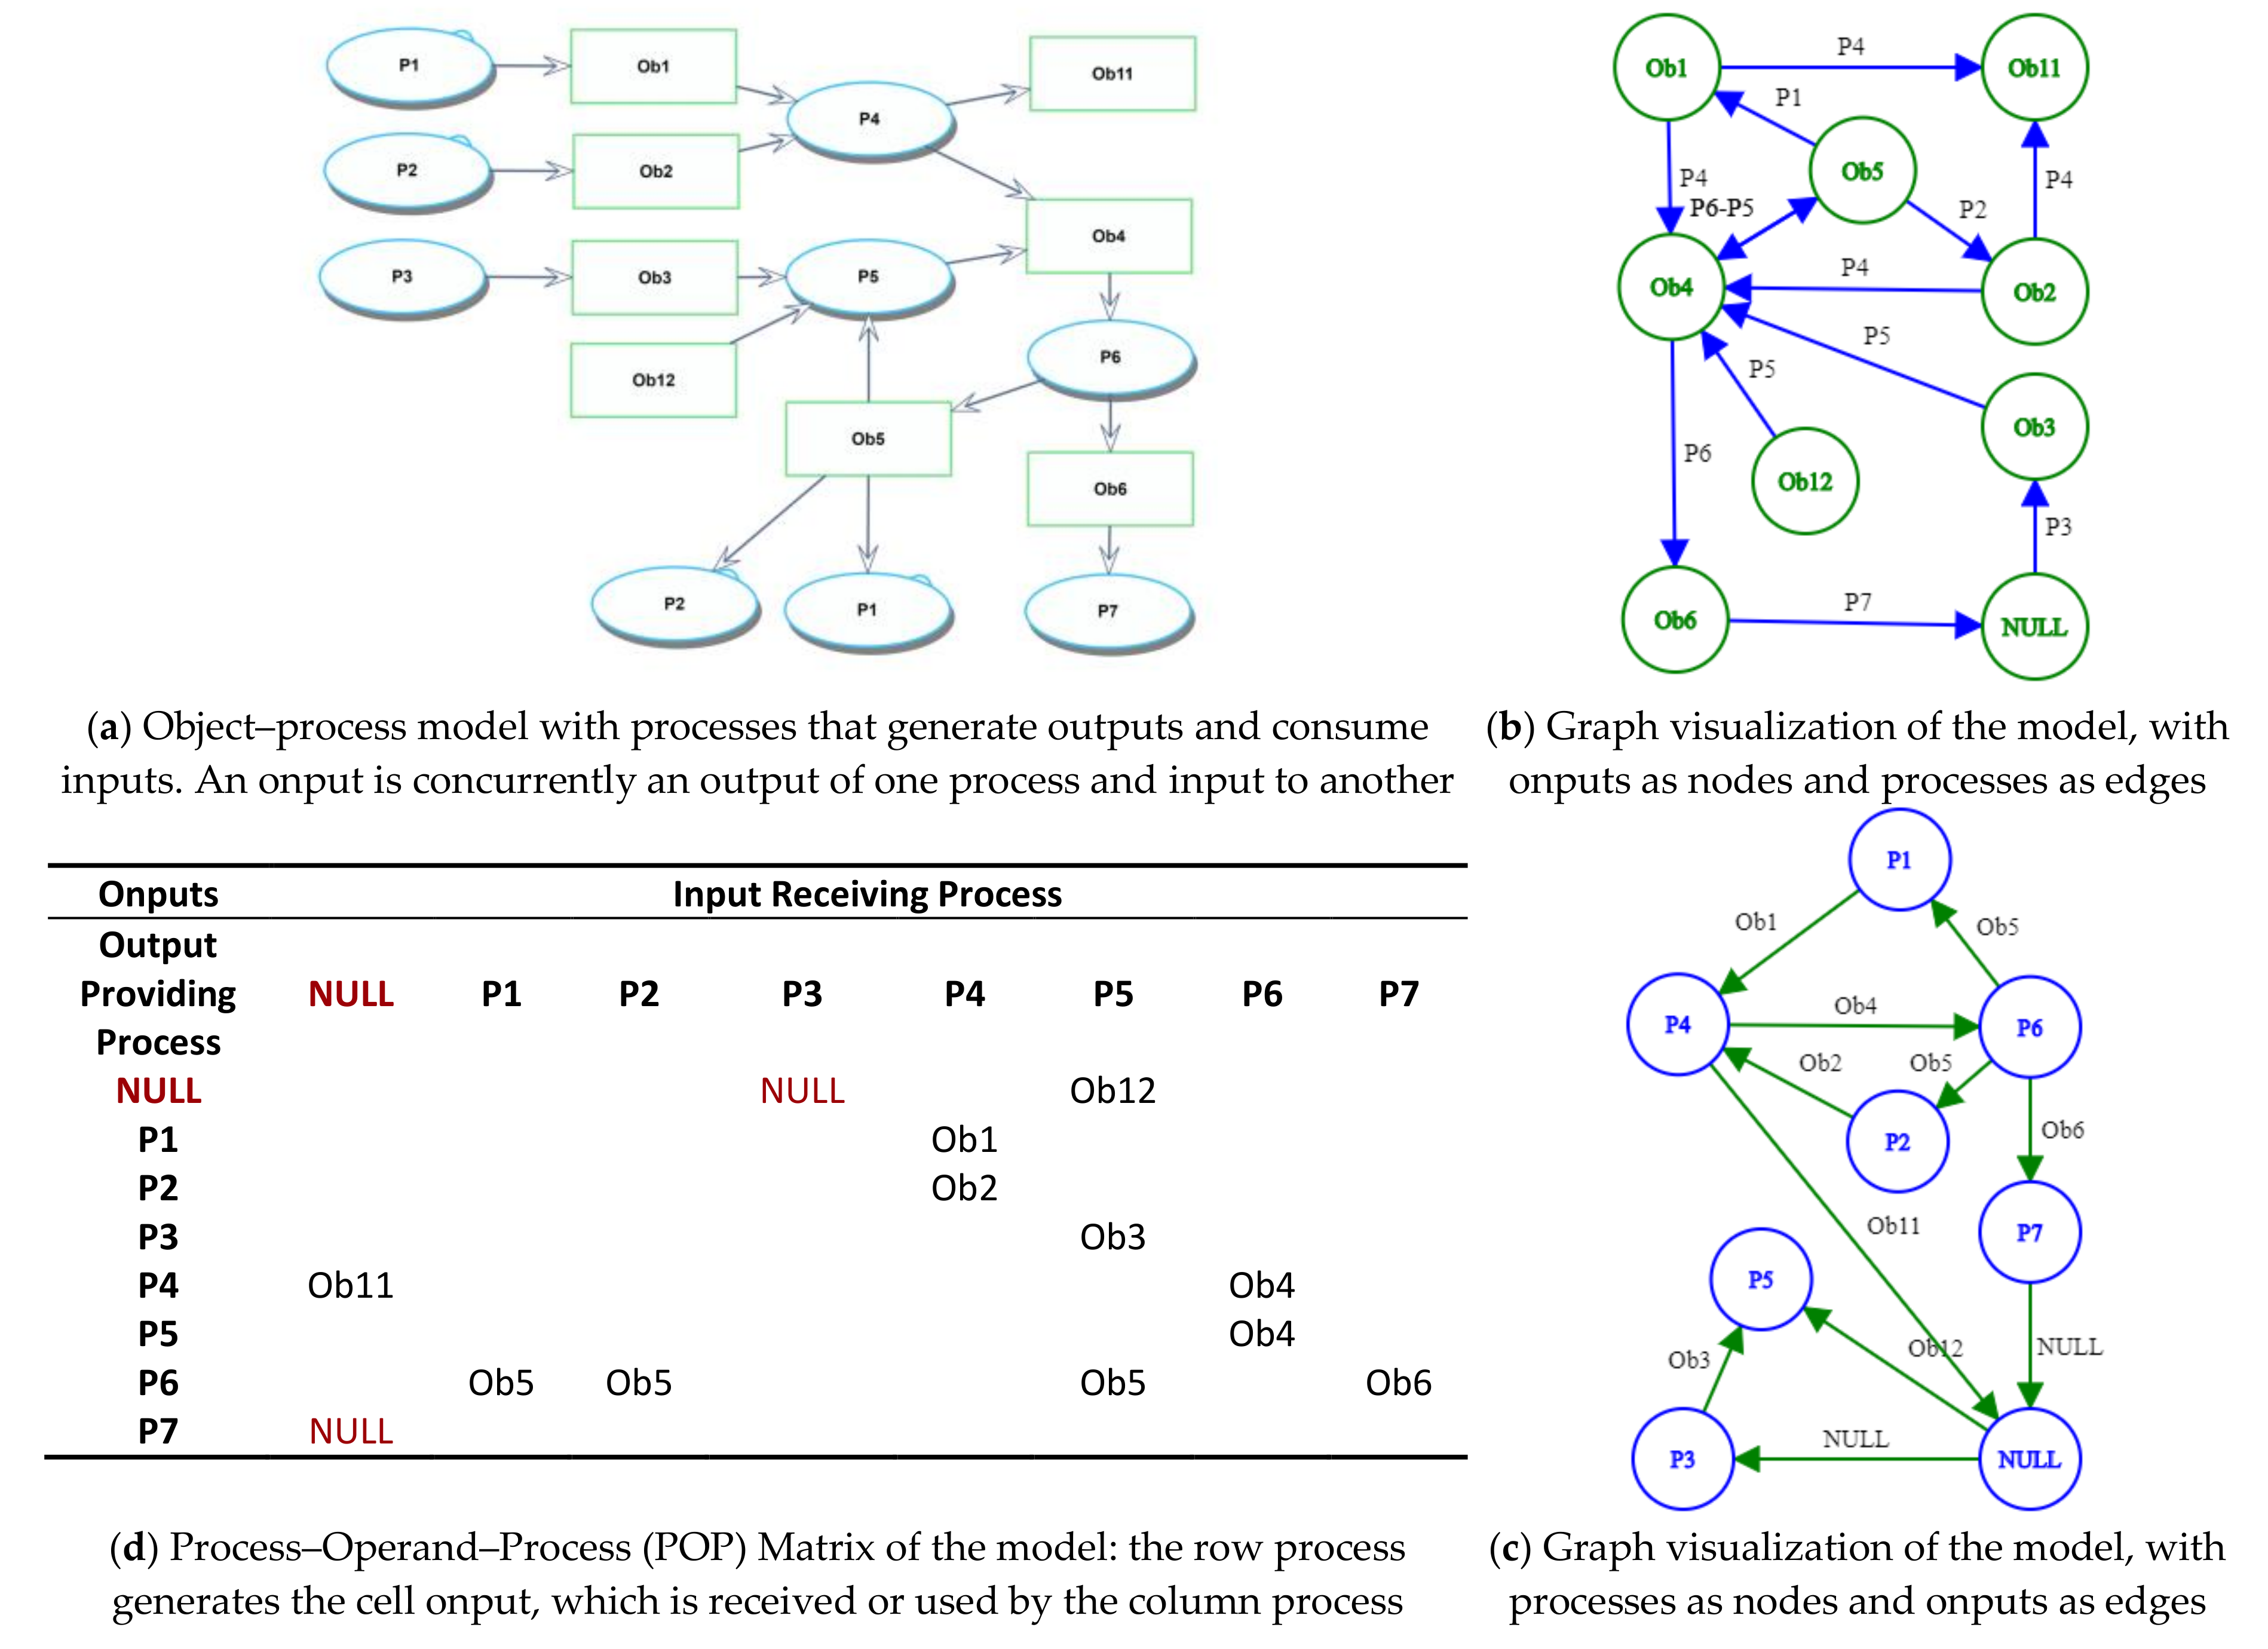
Table 1.
System Architecture Matrices.
| (a) 2-2 SAM Mapping of Systems and Processes [37] | ||||
| System (S) | Process (P) | |||
| System | ID(Srow) | Instrument(S,P) | ||
| Process | Effect(P,Attribute(S)) | Result(Prow, Input(Pcolumn)) Consumption(Output(Prow),Pcolumn) | ||
| (b) 3-3 SAM of Processes, Operands, and System Components [24] | ||||
| [P] | [O] | [C] | ||
| Process [P] | [PP] | [PO] | [PC] | |
| Operand [O] | [OP] | [OO] | [OC] | |
| Component [C] | [CP] | [CO] | [CC] | |
Table 2.
Category Theory Applications in Systems Engineering, Analysis, and Design.
| Topic/Title/Application | Description | References |
|---|---|---|
| Complex/Cyber-Physical Systems Architecture and Design | Object–Process Networks, a language for System Architecting | [49,50] |
| Representing a system as a category with component types and inter-component relations as morphisms, with Ologs (knowledge representation structures that capture non-mathematical, freely-defined relations among objects as morphisms) to specify design constructs, current-state situations, constraints, and requirements | [51,52] | |
| Iterative co-design of electro-mechanical functions in a cyber-physical system architecture | [53,54,55,56] | |
| hierarchical requirements engineering, gradually evolving a system architecture; formal and verifiable system design | [57,58,59] | |
| Structural and functional composition of system models | [60] | |
| Using operads—categorical structures that map multi-object compositions to a single object—for hierarchical decomposition, design synthesis, separation of syntax from semantics, and semantic reasoning about complex systems | [61,62] | |
| Model-Driven Software Engineering | Building mathematical foundations for model-driven software engineering (MDE), model management, model merging, bidirectional model updates, design patterns, and model transformations | [63,64] |
| Computer-Aided Design | Representing, integrating, and coordinating computer-aided design (CAD) languages, models and simulations for the design of a difficult technical complex (DTC) | [65] |
| Categorical Formulations of Systems | Ontological analysis based on a category ONT with ontologies as types and ontology mappings as morphisms | [13,66] |
| Representing a system as a symmetric monoidal, compact closed category with block types and input–output morphisms | [67] | |
| Algebraic formulation of open dynamical systems that can be characterized as resource sharers as a category of resource-sharing machines | [68] | |
| Stochastic Models | Domain-specific reasoning in stochastic systems, mapping causal probabilistic models the category , whose types are measurable spaces, and whose morphisms are Markov kernels between spaces | [69] |
| Scientific Models | Semantic modeling for extracting information from, reasoning about, augmenting, and composing computational models of complex systems and natural phenomena | [70,71,72] |
Table 3.
Examples of cyber-physical system morphisms.
| CPS Component | CPS Morphism | Input | Output | Formulation |
|---|---|---|---|---|
| Engine | Energy Generating | Matter | Energy | |
| Sensor | Sensing | Energy | Data | |
| Actuator | Actuating | Data | Energy |
Table 4.
Mapping the category of Systems, to a category of OPM models,, and to a category of Graph Data Structures, .
Table 4.
Mapping the category of Systems, to a category of OPM models,, and to a category of Graph Data Structures, .
| Category | Systems, | C→M | Object–Process Modeling Language, | M→G | Graph Data Structure, |
|---|---|---|---|---|---|
| Types | Model, Diagram, Spec | ||||
| Structure | → | Object | |||
| Relation | → | Process, Relation | |||
| State | → | State | |||
| Operand | → | Object | |||
| Report | → | Tuple set | |||
| Morphisms | Behavior | → | Process | ||
| N/A | modeling, specifying, rendering | tuple operation |
Table 5.
Mapping rules from OPML to GDS.
| Rule | R | S | T |
|---|---|---|---|
| 0. | Identity | Typet | UUID(Typet) |
| 1. | Classification | Ei | OPM.Classification(Ei) |
| 2. | OPM.Relation(Ei, Ej) | Ei | Ej |
| 3. | OPM.Inclusion(Di, Ej) | Di | Ej |
| 4. | OPM.Inclusion(Di, Relation(Ej, Ek) | Di | UUID(Relation(Ej, Ek)) |
| 5. | OPM.Affiliation | Ei | OPM.Affiliation(Ei) |
| 6. | OPM.Essence | Ei | OPM.Essence(Ei) |
| 7. | Identity | Ei | UUID(Ei) |
| 8. | Identity | Rk | UUID(Rk) |
Table 6.
Metrics for comparing approaches to generate views from models.
| Criterion | Weight | MGV | MV | MRV |
|---|---|---|---|---|
| C1—Efficiency | W1 | M+V | MV | M+V |
| C2—Flexibility | W2 | 1 | M | 1 |
| C3—Robustness | W3 | 1 | V | V+1 |
| C4—Resilience | W4 | 1 | V | 1 |
| Total | 1 | Equation (1) | Equation (2) | Equation (3) |
Table 7.
Preference Relations of MGV over MV depending on the number of MLs (M) and views (V). MV is preferred when M = V = 1; MGV is preferred when . When or preference rotates based on weighting. MGV is preferable when weights are equal. The cases of MGV superiority are shaded.
Table 7.
Preference Relations of MGV over MV depending on the number of MLs (M) and views (V). MV is preferred when M = V = 1; MGV is preferred when . When or preference rotates based on weighting. MGV is preferable when weights are equal. The cases of MGV superiority are shaded.
| V = 1 | V = 2 | V > 2 | |
|---|---|---|---|
| M = 1 | |||
| M = 2 | |||
| M > 2 | |||
Table 8.
POP matrix of LKS model maps processes to each other via onput exchange, instrument providing, and invocation. Color coding highlights discrepancies and potential issues: Red cells with a value of 0 indicate processes without inputs or outputs. Lightly-colored cells need further attention.
Table 8.
POP matrix of LKS model maps processes to each other via onput exchange, instrument providing, and invocation. Color coding highlights discrepancies and potential issues: Red cells with a value of 0 indicate processes without inputs or outputs. Lightly-colored cells need further attention.
| Target Process | (Null) | Alerting | Analyzing Road | Imaging Road | Lane Keeping | Selecting Operational Mode | Steering | Driving | Propelling | Outputs per Process | |
|---|---|---|---|---|---|---|---|---|---|---|---|
| Source Process | |||||||||||
| (Null) | Lane Crossing | Road Image | Road | Road | Lane Crossing | Road | 6 | ||||
| Lane Keeping | Improved Safety | Alert | Steering Command | 3 | |||||||
| Selecting Operational Mode | Alert Mode | Steer-back Mode | 2 | ||||||||
| Imaging Road | 0 | ||||||||||
| Analyzing Road | 0 | ||||||||||
| Alerting | Alert | 1 | |||||||||
| Driving | Invocation | 1 | |||||||||
| Steering | Steering Command | 1 | |||||||||
| Propelling | Invocation | 1 | |||||||||
| Inputs per Process | 1 | 2 | 1 | 1 | 1 | 0 | 2 | 3 | 4 | ||
Table 9.
Issues identified in the LKS model POP matrix and suggested corrections. Critical issues are marked in red.
Table 9.
Issues identified in the LKS model POP matrix and suggested corrections. Critical issues are marked in red.
| Entity | Issue | Correction |
|---|---|---|
| Lane Keeping | no functional decomposition | Unfold Lane Keeping in a separate diagram and link it to the internal functions in Lane Keeping System to create functional decomposition of top level system function to lower-level functions |
| Selecting Operational Mode | no input | Add input from Driver |
| Imaging Road | no output | Link through a Result relation to Road Image |
| Analyzing Road | no output | Link through a Result relation to Lane Crossing |
| Improved Safety | no receiver | Specify as attribute of Lane Keeping System. Since this object represents emergent value, it is not recommended to associate it with a specific function |
| Road Image | no provider | Link Imaging Road through a Result relation |
| Lane Crossing | no provider | Link Analyzing Road through a Result relation |
| Road | no provider | Add Effect Link from Propelling, indicating that vehicle movement affects the immediate portion of interest of the road with which the vehicle interacts |
| Driving invokes Propelling | no explicit onput | Consider replacing invocation by driver command gestures (turning, signaling, braking, etc.) |
| Propelling invokes Driving | no explicit onput | Consider replacing invocation by vehicle response to driver action |
Publisher’s Note: MDPI stays neutral with regard to jurisdictional claims in published maps and institutional affiliations. |
© 2021 by the authors. Licensee MDPI, Basel, Switzerland. This article is an open access article distributed under the terms and conditions of the Creative Commons Attribution (CC BY) license (http://creativecommons.org/licenses/by/4.0/).
Share and Cite
MDPI and ACS Style
Mordecai, Y.; Fairbanks, J.P.; Crawley, E.F. Category-Theoretic Formulation of the Model-Based Systems Architecting Cognitive-Computational Cycle. Appl. Sci. 2021, 11, 1945. https://0-doi-org.brum.beds.ac.uk/10.3390/app11041945
AMA Style
Mordecai Y, Fairbanks JP, Crawley EF. Category-Theoretic Formulation of the Model-Based Systems Architecting Cognitive-Computational Cycle. Applied Sciences. 2021; 11(4):1945. https://0-doi-org.brum.beds.ac.uk/10.3390/app11041945
Chicago/Turabian StyleMordecai, Yaniv, James P. Fairbanks, and Edward F. Crawley. 2021. "Category-Theoretic Formulation of the Model-Based Systems Architecting Cognitive-Computational Cycle" Applied Sciences 11, no. 4: 1945. https://0-doi-org.brum.beds.ac.uk/10.3390/app11041945
Note that from the first issue of 2016, this journal uses article numbers instead of page numbers. See further details here.