
Online Intelligent Perception of Pantograph and Catenary System Status Based on Parameter Adaptation


Ministry of Education Key Laboratory of Precision Opto-Mechatronics Technology, Beihang University, Beijing 100083, China
*
Author to whom correspondence should be addressed.
Appl. Sci. 2021, 11(4), 1948; https://0-doi-org.brum.beds.ac.uk/10.3390/app11041948
Submission received: 1 January 2021
/
Revised: 18 February 2021
/
Accepted: 19 February 2021
/
Published: 23 February 2021
(This article belongs to the Collection Machine Learning in Computer Engineering Applications)
Abstract
:Online autonomous perception of pantograph catenary system status is of great significance for railway autonomous operation and maintenance (RIOM). Image sensors combined with an image processing algorithm can realize the automatic acquisition of the pantograph catenary condition; however, it is difficult to meet the demand of long-term stable condition acquisition, which restricts the implementation of online contact state feedback and the realization of railway automation. This paper proposes an online intelligent perception of the pantograph and catenary system (PCS) status based on parameter adaptation to realize fast and stable state analysis when the train is in long-term operation outdoors. First, according to the feature of the contact point, we used histogram of gradient (HoG) features and one-dimensional signal combined with a KCF tracker as the baseline method. Then, a result discriminator located by L1 and hash similarity constraints was used to construct a closed-loop parameter adaptive localization framework, which retrieves and updates parameters when tracking failure occurs. After that, a pruned RefineDet method was used to detect pantograph horns and sparks, which, together with the contact points localization method, ensure the long-term stability of feature localization in PCS images. Then, based on the stereo cameras model, the three-dimensional trajectory of the whole pantograph body can be reconstructed by the image features, and we obtained pantograph catenary contact parameters including the pantograph slide posture, contact line offset, arc detection, separation detection, etc. Our method has been tested on more than 16,000 collected image pairs and the results show that the proposed method has a better positioning effect than the state-of-art method, and realizes the online acquisition of pantograph catenary contact state, representing a significant contribution to RIOM.
1. Introduction
Over recent years, electrified railways have developed from traditional industrial upgrades to those encompassing improvements to the system’s speed, automation, safety, and comfort. Among them, the pantograph and catenary system (PCS) determines the safe operation of high-speed trains. The online autonomous perception of PCS status is the main challenge to overcome and ensure a stable and smooth pantograph and catenary relationship. Previous research of PCS [1,2,3,4] shows that traditional offline detection methods and online methods that combine video shooting and manual analysis cannot meet the current needs for online contact status. During long-term outdoor train operation, there are problems associated with the diversification of the core components of PCS, complicated light conditions, and complex backgrounds caused by phenomena such as arcing and line change, which make it difficult to obtain long-term and reliable PCS state parameters such as pantograph pose, center line offset, PCS detachment, and arcing detection. Therefore, realizing fast and long-term robust PCS state analysis is of great significance.
For the offline measurement of slide wear, center line offset, contact line topography detection, and others, methods have gradually moved from manual measurement toward contact and non-contact automatic measurement [5,6]. The contact method effectively eliminates signal interference and reduces technical difficulties. It also has some applications in the measurement of center line offset but has inherent disadvantages related to environmental adaptability and convenience of placement. With the rise of computer vision technology, the non-contact method has been widely used in practical fault detection. Led by traditional railway companies such as Mermec, SelectraVision, Camlin, etc., the non-contact method has been developed into products in the fields of pantograph slide wear detection and contact wire morphology detection, which has brought technical innovations to the field of pantograph catenary fault detection. However, an actual PCS fault is mainly caused by the rapid movement of the train, which is hard for offline detection methods to solve. Offline methods cannot provide timely feedback before or after an actual PCS fault occurs, only playing a role in prevention or checking after a fault, so there is a strong demand for online detection.
With regard to online detection, current research is mainly based on contact detect and non-contact detect. The contact detect generally analyzes the vibration signals, optical fiber signals, and detect pantograph conditions. For example, Yao et al. [7] focus on the influence of car body bumping on pantograph and catenary system. Huang et al. [8] give the attribution analysis of vibration and carbon slide wear, and Ning et al. [9] give the pantograph catenary monitoring system combined with optical fiber sensors and image sensors, which can identify common pantograph catenary faults. The non-contact detect is realized by observing and analyzing the image of the pantograph and catenary through the image sensor on the roof of the train, which can give a more intuitive analysis of the interaction of the pantograph and catenary, but it requires a higher reliability of the algorithm. The main application is based on non-visible light for arc detection [10,11,12], and research using visible light data mostly focuses on the acquisition of online video sequences, combined with manual observation or offline processing. The online feature localization method under the vehicle platform is affected by image complexity, which leads to key problems given the robustness required by the online operation of PCS contact analysis, and has attracted research attention.
A. Facchinetti et al. [13] proposed a closed-loop method to analyze the contact status through s-transform according to the curve in the contact model. However, the analysis can only realize the contact judgment on the pantograph, and cannot judge and analyze the actual operation of PCS. Wei et al. [14] proposed a pantograph slide detection framework based on a deep learning network, which could accurately judge the type of pantograph slide fault but could only detect the wear of the pantograph at fixed places; it is unable to carry out the online analysis of the contact state. Aydin et al. [15] developed tracking by mean-shift and, combined with the foreground detection, it can be as an online detection method; however, its performance was insufficient in real-time. Aydin et al. [16] used the kernel tracking method to achieve real-time contact wire tracking, but the detection of actual contact failures did not meet requirements.
Karakose et al. [17] combined the threshold segmentation and line extraction method with the tracking method and proposed a contact points localization method. However, this 2D-based analysis has problems accurately determining a fault without precision measurements. Hul et al. [18] proposed an accurate positioning method for contact points based on SVM classification under vehicle tilt conditions. This method has good performance in the face of illumination and rotation change but does not meet the actual online positioning requirements. Cho et al. proposed an interesting scheme which corrects the image tilt of pantograph and uses the gradient and SIFT features to locate the upper surface of the pantograph slide plate by an SVM classifier. However, there was no reasonable solution for the contact state of PCS using this method. Shen et al. [19] proposed an online contact point trajectory tracking method based on the 3D trajectory to analyze the PCS contact state, achieving real-time high-precision measurement and analysis, which effectively solves the current problem in the fault detection of PCS. However, the proposed algorithm does not show reliable spatial accuracy, and during long-term tracking the performance under changing illumination may not meet practical requirements.
In this paper, we focus on the difficulties of online pantograph catenary image feature localization and propose an online intelligent perception of the PCS state based on parameter adaption. This paper mainly deals with the DSA-200 pantograph, which is the mainstream in China Railway Highspeed (CRH). We expect to realize the evaluation of the PCS state by analysis of the trajectory of contact points and pantograph slides, and online detection of arcing and pantograph catenary separation, which are the common PCS operation faults. Therefore, it is necessary to accurately locate the contact points, pantograph horns, and other characteristic points and robustly obtain them for a long time along with the train operation. For pantograph and catenary contact points, an adaptive tracking positioning method is proposed. We propose the addition of a result discriminator to the closed-loop tracking method so that the corresponding parameter adjustment can be carried out independently through positioning result feedback. This ensures that tracking and positioning can be achieved under a variety of light conditions under long-term train operation. Furthermore, we enable the detection of pantograph horns, sparks, and other features through the pruned RefineDet method [20], reconstructing the three-dimensional trajectory of the pantograph slide to acquire the pantograph catenary contact parameters, which include pantograph pose, center line offset, PCS detachment, and arcing detection.
Finally, we construct a dataset with more than 16,000 frames including both left and right images. Within the dataset there are arcs, occlusions, and a variety of illumination conditions. The results using the dataset show that our method has obvious positioning advantages in positioning accuracy and stability under long-time operation compared with the other state-of-the-art tracking methods, and the output multiple contact positioning indicators also meet the expectations of actual railway operation.
The main contributions of this study are as follows.
- Based on the parameter adaptive perception, a reliable analysis framework of the PCS contact state that satisfies the safety supervision of train outdoor operation is proposed.
- By constructing closed-loop tracking, ensuring that the tracking parameters can be updated according to the feedback of collected image, long-term stable, high-speed, and high-precision contact point positioning is achieved.
- Through the use of a pruned RefineDet [20]—an optimized deep learning object detection method, we achieved robust real-time positioning of pantograph horns and sparks.
- The method we proposed can effectively obtain the PCS contact parameters and contact state analysis during the long-term outdoor operation of trains, supporting the safe and stable operation of railways.
The rest of this paper is organized as follows. An overview of the feature tracking method and contact analysis is given in Section 2, Section 3 describes the implementation of the image feature localization method, and Section 4 describes the contact state analysis formula through the obtained image feature. Section 5 provides the operation effect of the integrated system on the actual data set and we report the findings of targeted analysis. Finally, the summary of the full text is given.
2. Overview
The train pantograph is an arched device erected on the train roof. When the train is running, the device lifts and transmits the current between the carbon slide and the overhead contact line with high voltage, which is the core component of the power system in train operation.
In this paper, the proposed method is mainly based on the on-board PCS contact detection platform, and the hardware mainly includes two subsystems: the data acquisition system erected on the roof of the train, which uses high-speed stereo cameras assisted with light-emitting diode (LED) lighting equipment to collect clear pantograph catenary component images when the train is running, and the data processing system inside the train body, which processes images in real-time, and gives various kinds of contact parameters after processing as an output, which is transmitted to the cab for driving assistance and fault warnings.
As the main target of PCS contact analysis, determining the location of the contact points is difficult in real-time, especially when the train is running all day. Complex outdoor illumination situations and background conditions further increase the difficulty of its stable detection and positioning. In this paper, a parameter adaptive localization method is proposed to solve these issues. First, a basic positioning framework is built by combining simple gray features and hog features, and using template matching and KCF tracking method [21] to obtain the position. On this basis, a fusion verification method based on hash similarity analysis [22] and L1-loss constraints is added, so that the tracking detection parameters can be adaptively updated according to the input image. The closed-loop control is used to realize the long-time robust positioning of the train under outdoor operation.
For horn detection and sparks, we used a deep learning method for object detection, which can effectively solve issues related to occlusion and illumination changes. Using RefineDet [20], we constructed a horn and spark training set with existing data and carried out data expansion. To ensure the detection rate was sufficient for the network’s framework, we further optimized the parameter structure and pruned the feature map prediction branch, which balanced the real-time performance and positioning precision.
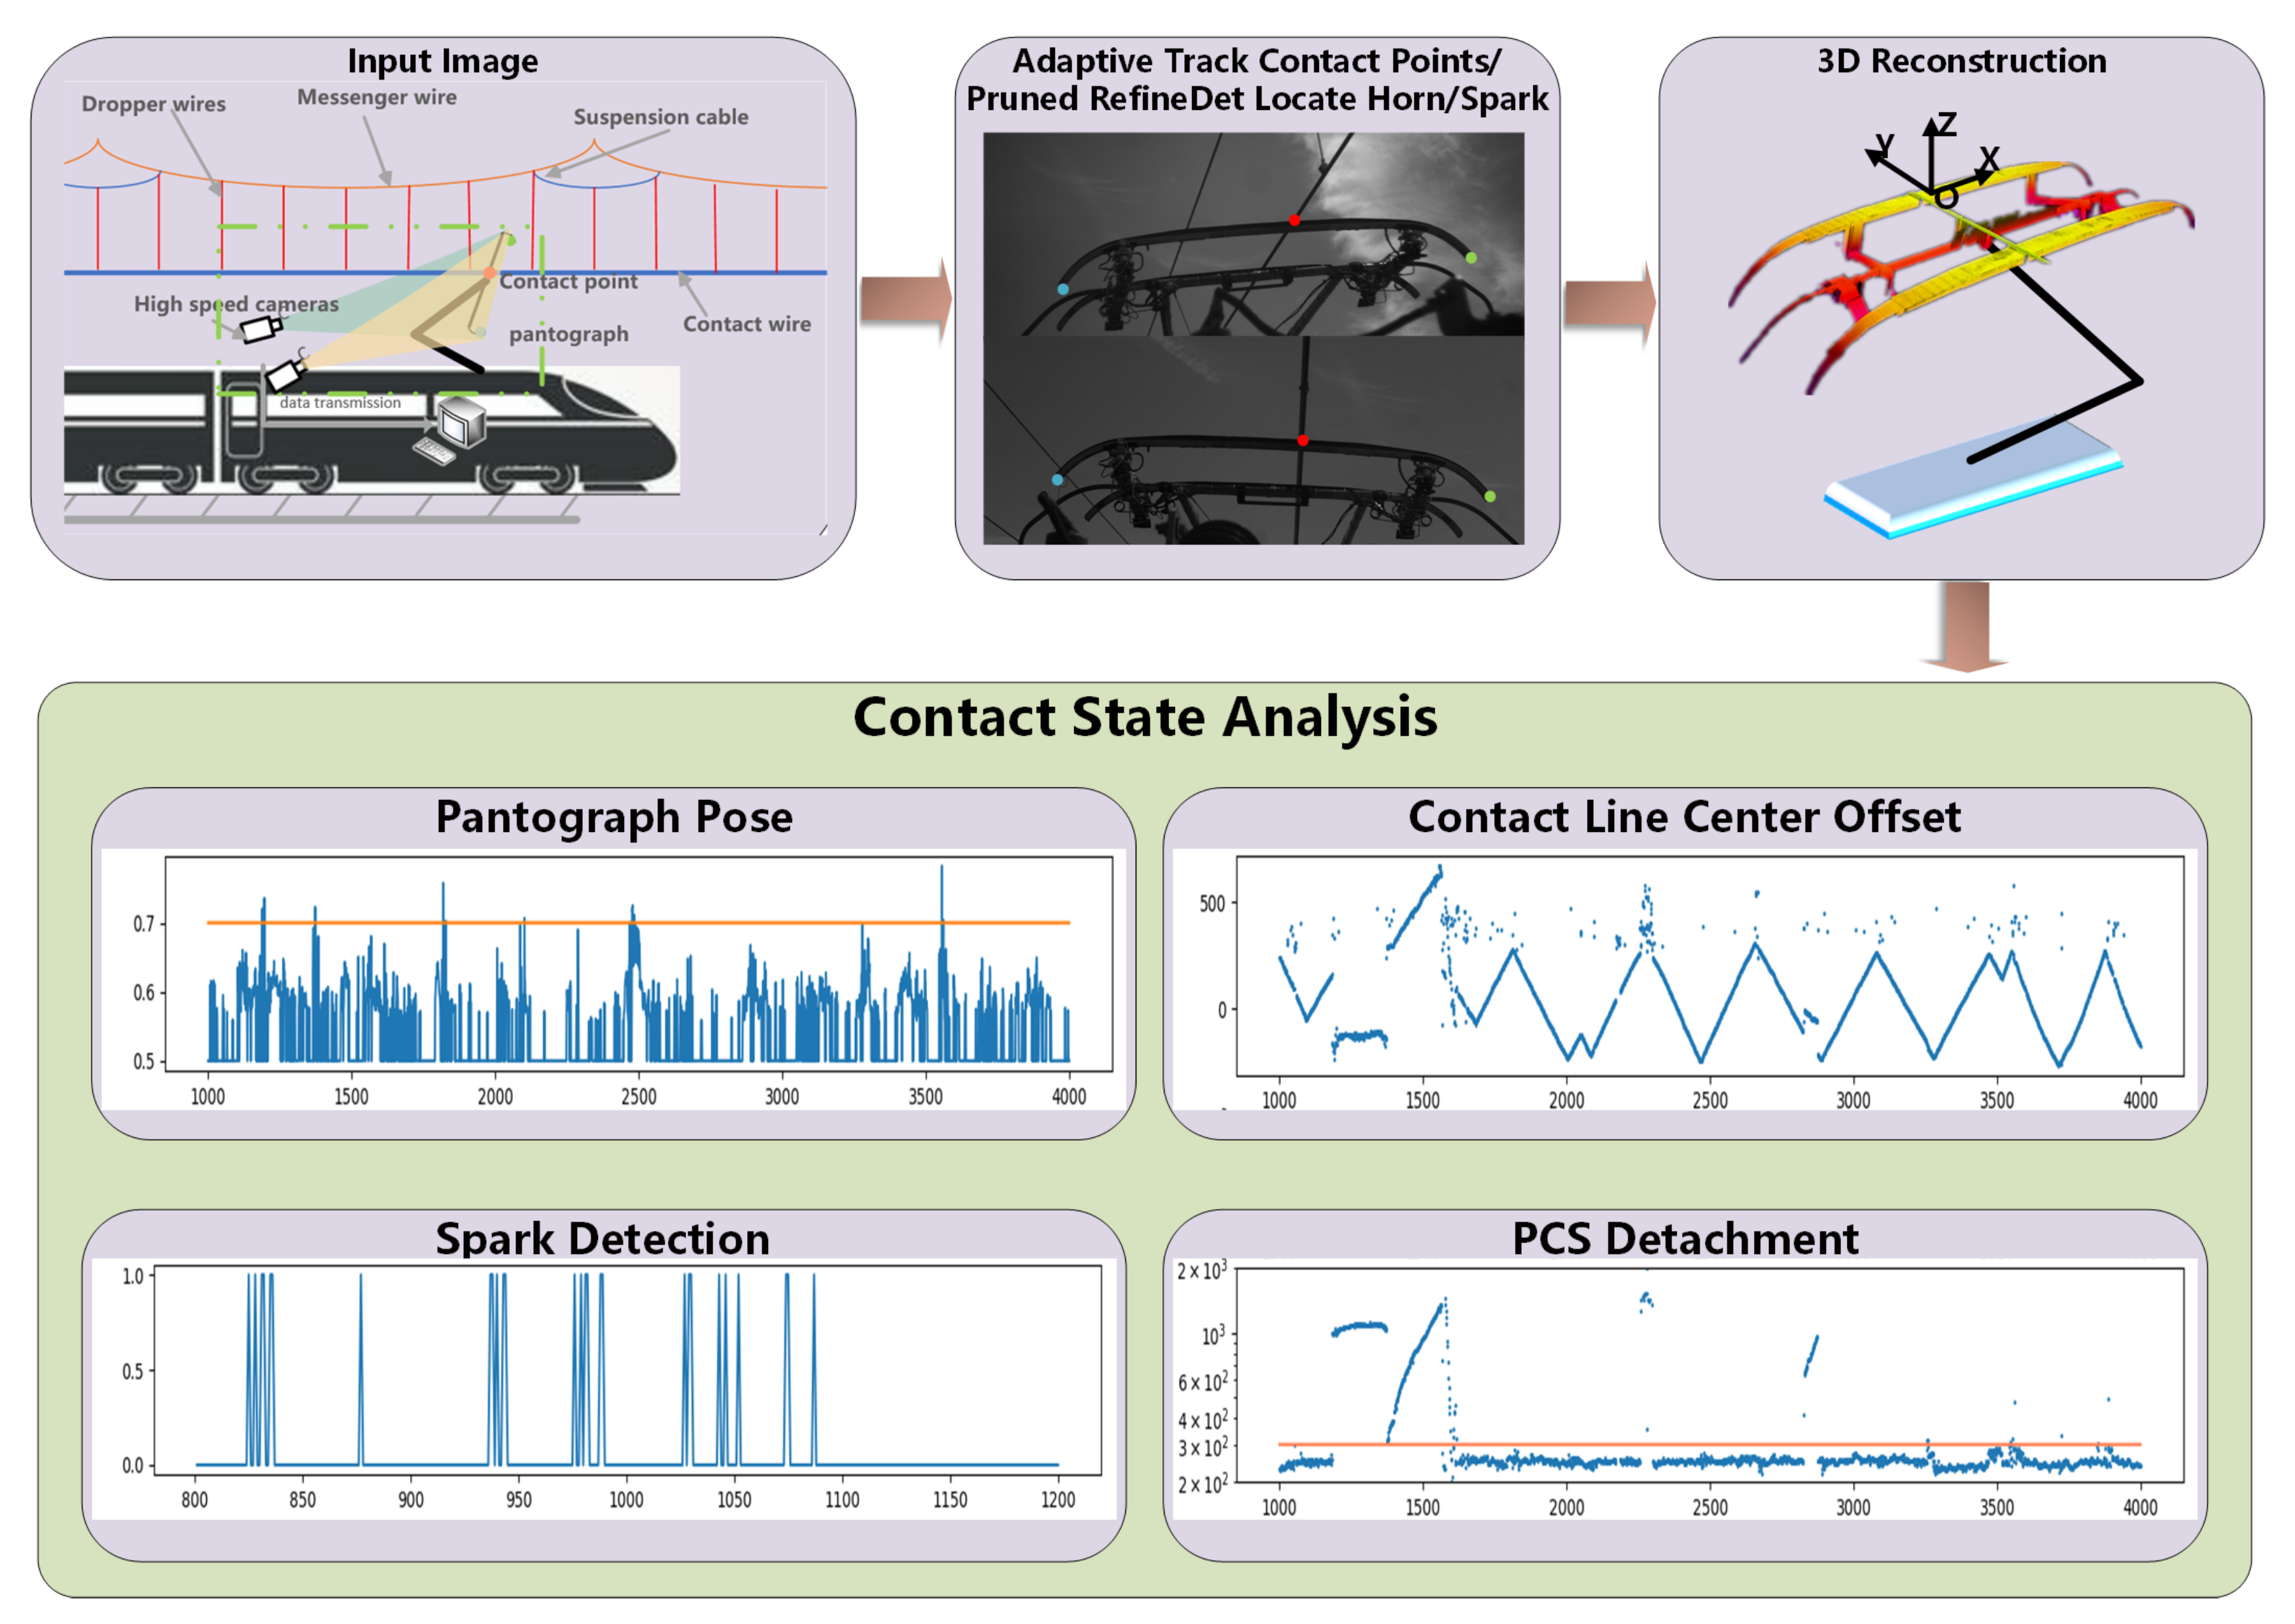
Finally, using the obtained image features, we reconstructed a 3D shape of the pantograph slide online, and measured the pantograph slide posture, contact line offset, and two abnormal detections of arcs and PCS separation. Compared with simply evaluating the position of the contact points, the contact line offset can provide feedback on the real position more intuitively and can be used for more effective analysis and prediction of carbon slide wear in the later stage. Meanwhile, the abnormal detection of pantograph pose, arcing, and PCS separation can provide early warnings in an extreme contact situation, the overview processing is shown in Figure 1. The implementation details of the method are shown in Section 3.
3. Long-Term Feature Points Localization
The safe operation of the PCS is achieved using online pantograph and catenary images. Determining the position of the contact point and pantograph horn is the main difficulty faced by this system. The positioning of the pantograph horn and the contact points which are on the pantograph slide can be used to estimate the position of the rigid structure of the pantograph, so as to evaluate the posture of the pantograph body; the positioning of contact points can more intuitively evaluate the contact position between the pantograph and the catenary, and is also an effective factor to further analyze PCS contact state. For the above two positioning process, high precision, high speed, and high robustness are needed.
High speed processing is a necessary condition to realize continuous observation in train operation, which can meet the demand of providing real-time PCS state; high-precision positioning ensures the accuracy of 3D reconstruction and the effectiveness of state judgment. As the feature points are distributed in the PCS, long-term stable positioning during train operation will be interfered with by various outdoor illumination conditions and similar targets, such as other lines in catenary, which have higher requirements for the robustness of the localization algorithm in the long-term changeable image.
In this paper, an adaptive method is used to track the contact points, which can keep the continuous robust positioning by adaptive tracking parameters according to the tracking state. In addition, for pantograph catenary horn and arcs, the deep learning method is selected to achieve a simple and robust target detection framework. Thus, it can realize fast, accurate, long-time robust positioning of PCS features, and provide guarantee for subsequent analysis.
3.1. Adaptive Contact Points Tracking
As the corner of the pantograph and contact line in the image coordinate system, the contact point is defined as the projection of the pantograph catenary contact position in space, which is the contact position at which the pantograph and catenary maintain sliding contact under train operation. As a result, it will move rapidly with the train running in the image sequence, because the contact wire will move quickly on the pantograph slide between one side and another. At the same time, the complex structure of the catenary produces a number of similar interference targets in the image. Additionally, the line-changing stage requires the tracking target to switch automatically, which produces a serious image occlusion when two contact wires in images. The appearance of the supporting structure of the catenary on both sides and above the rail means that the image not only needs to deal with illumination changes caused by outdoor operation, but also has to overcome the challenge of the complex image itself.
To solve these problems, we propose an parameter adaption tracking method, which not only ensures high real-time precision measurements, but transforms the contact point positioning problem into an area tracking problem. In view of whether there is an initial position or not, we have chosen two baseline methods to develop: CF tracker combined with histogram of gradient (HoG) features, and pseudo-two-dimensional template matching by combined one-dimensional templates.
Baseline: Given the image I, as well as the one-dimensional template list for template matching, the left and right edge point sets of contact wire are obtained by taking an example using to do template matching. The formula is
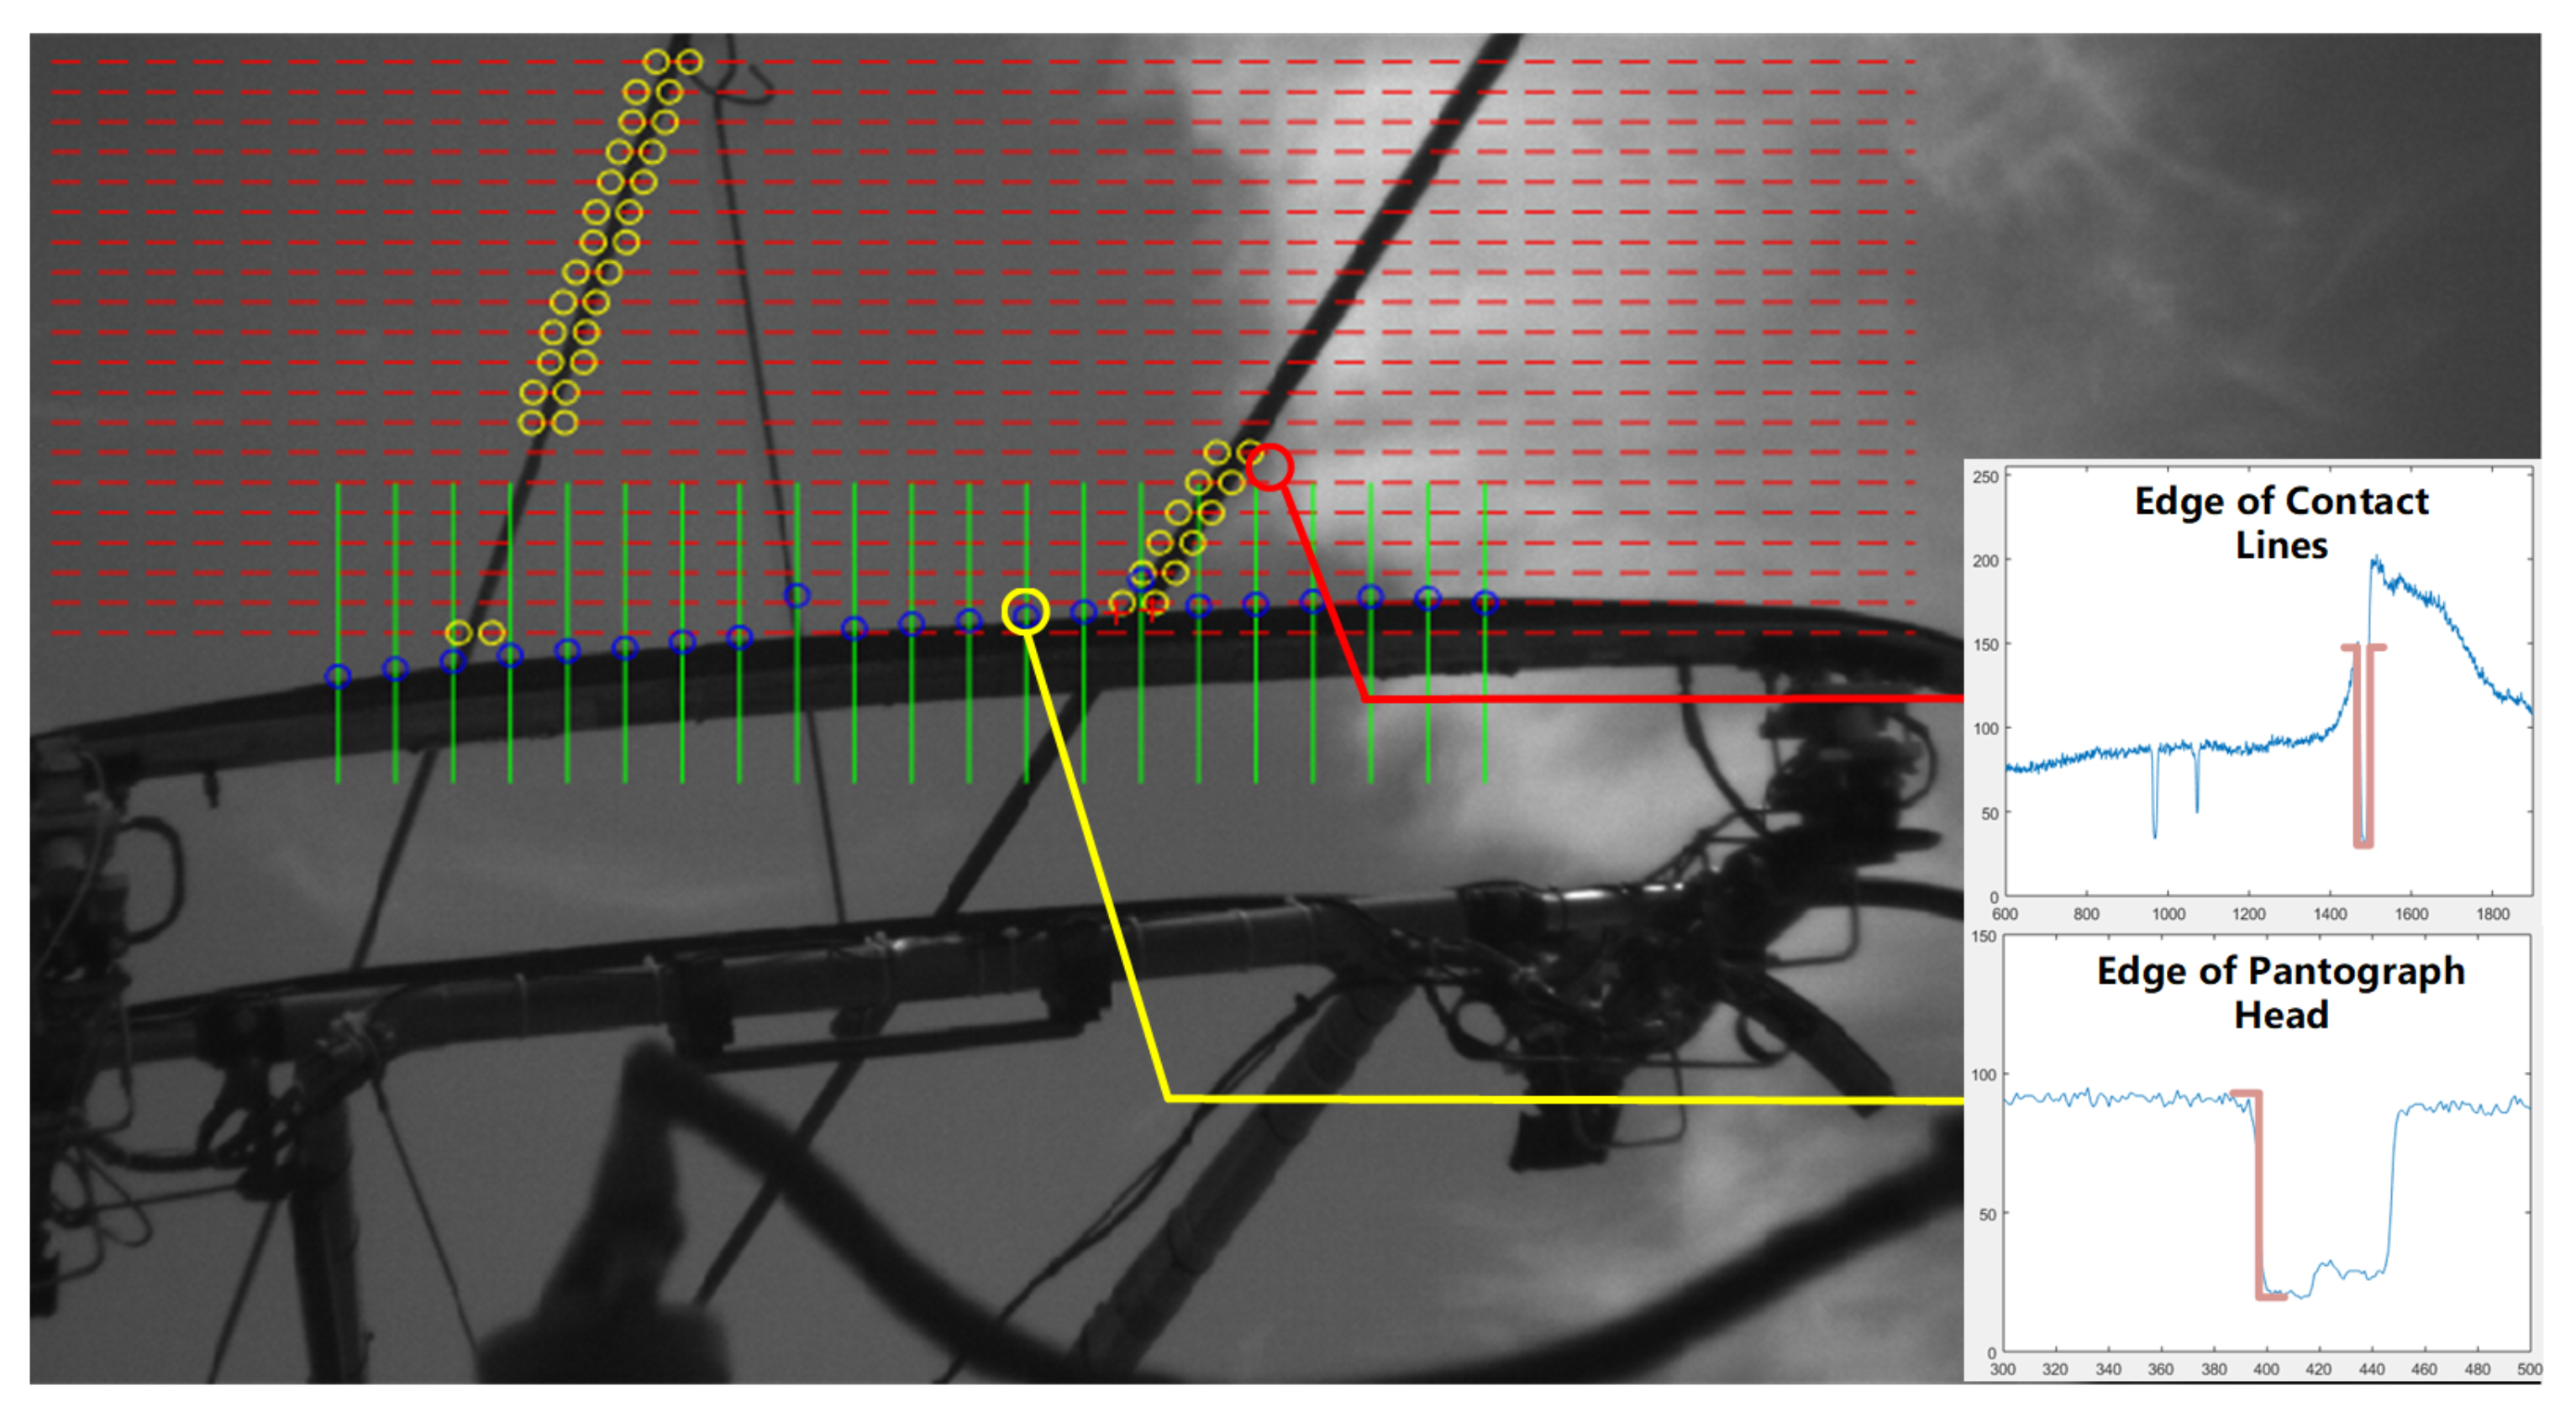
Figure 2 shows the i-th one-dimensional vector slices with N equal spacing selected in the horizontal direction of the image . is the function to optimal left and right edge positions obtained after template matching. We can also obtain the point set distributed on the upper surface of the pantograph slide through the template . Furthermore, the accuracy of positioning determines the accuracy of the subsequent stereo reconstruction and the effectiveness of condition analysis. However, positioning through the intersection of the fitted lines can only determine a rough localization area. This paper uses the prior knowledge that the contact point is the corner to carry out sub-pixel positioning to ensure the effectiveness of the positioning results. Therefore, we determine the point set through the line interleaving and further using sub-pixel corner refinement for sub-pixel approximation, which is the true location of the contact points in the frame. The equation is
For the straight-line fitting process, we used the RANSAC method to filter possible outliers and ensure the stability of initialization. We obtained the initial region of tracking through the detected contact points and performed KCF tracking to obtain the target area of the subsequent frames. The formula is shown below,
where is the tracking area obtained in the i-th frame according to the contact points , ; are the adjacent image frames; and is the region proposal (RP) process, which is used to generate the target patches. These methods facilitate stable tracking and positioning of the contact points when the image is simple and there are no obvious illumination changes. However, under continuous outdoor operation, the baseline method faces two main problems: It is difficult to ensure stable positioning under complicated light conditions based on grayscale matching positioning; (A near-infrared spectrum sensor can assist to locate the target in a robust manner according to the contact heat. However, this kind of sensor is difficult to become a conventional solution in terms of resolution, frame rate, and price.) the judgment of the tracking effect is delayed, resulting in slow abnormality tracking, and the similar target produced by the line change will cause the tracking judgment to become inaccurate.
Parameter adaptive localization: In response to this phenomenon, we propose a parameter adaptive tracking method based on the baseline method. Compared with the tracking effect judgment that depends solely on the tracker itself, we define a tracking effect verification module based on the topology information of the contact points, so that the tracker will provide the tracking position and tracking effect simultaneously, and this effect will be used to feedback and optimize the tracking parameters, which then constructs a closed-loop tracking framework.
The tracking effect mainly comes from two discrimination models. L1 discrimination is based on location and hash similarity discrimination in the patch. L1 discrimination is generally used to verify tracking failures originating from similar targets. We can take the positioning results in the image from the left camera as an example, in which the energy of L1 is as follows:
where are the two image contact points; are the corresponding polar lines obtained from the corresponding points in the right image in the processing of epipolar rectification; L is used to calculate the norm of two points, or the distance from the point to the polar line, and then calculate the loss according to the distribution interval of the output value; and is used in the interlaced verification of stereo camera images and is set to zero when only verifying one image.
In terms of judgment after continuous tracking, it is not robust to rely solely on the tracker itself. We used hash similarity to improve the discrimination accuracy. As the contact line changes, the tracker cannot achieve autonomous switching, and after the corner approach is also used. First, as the relative position of the target remains approximately constant between consecutive frames, the contact point coordinates after tracking can be obtained by the following formula:
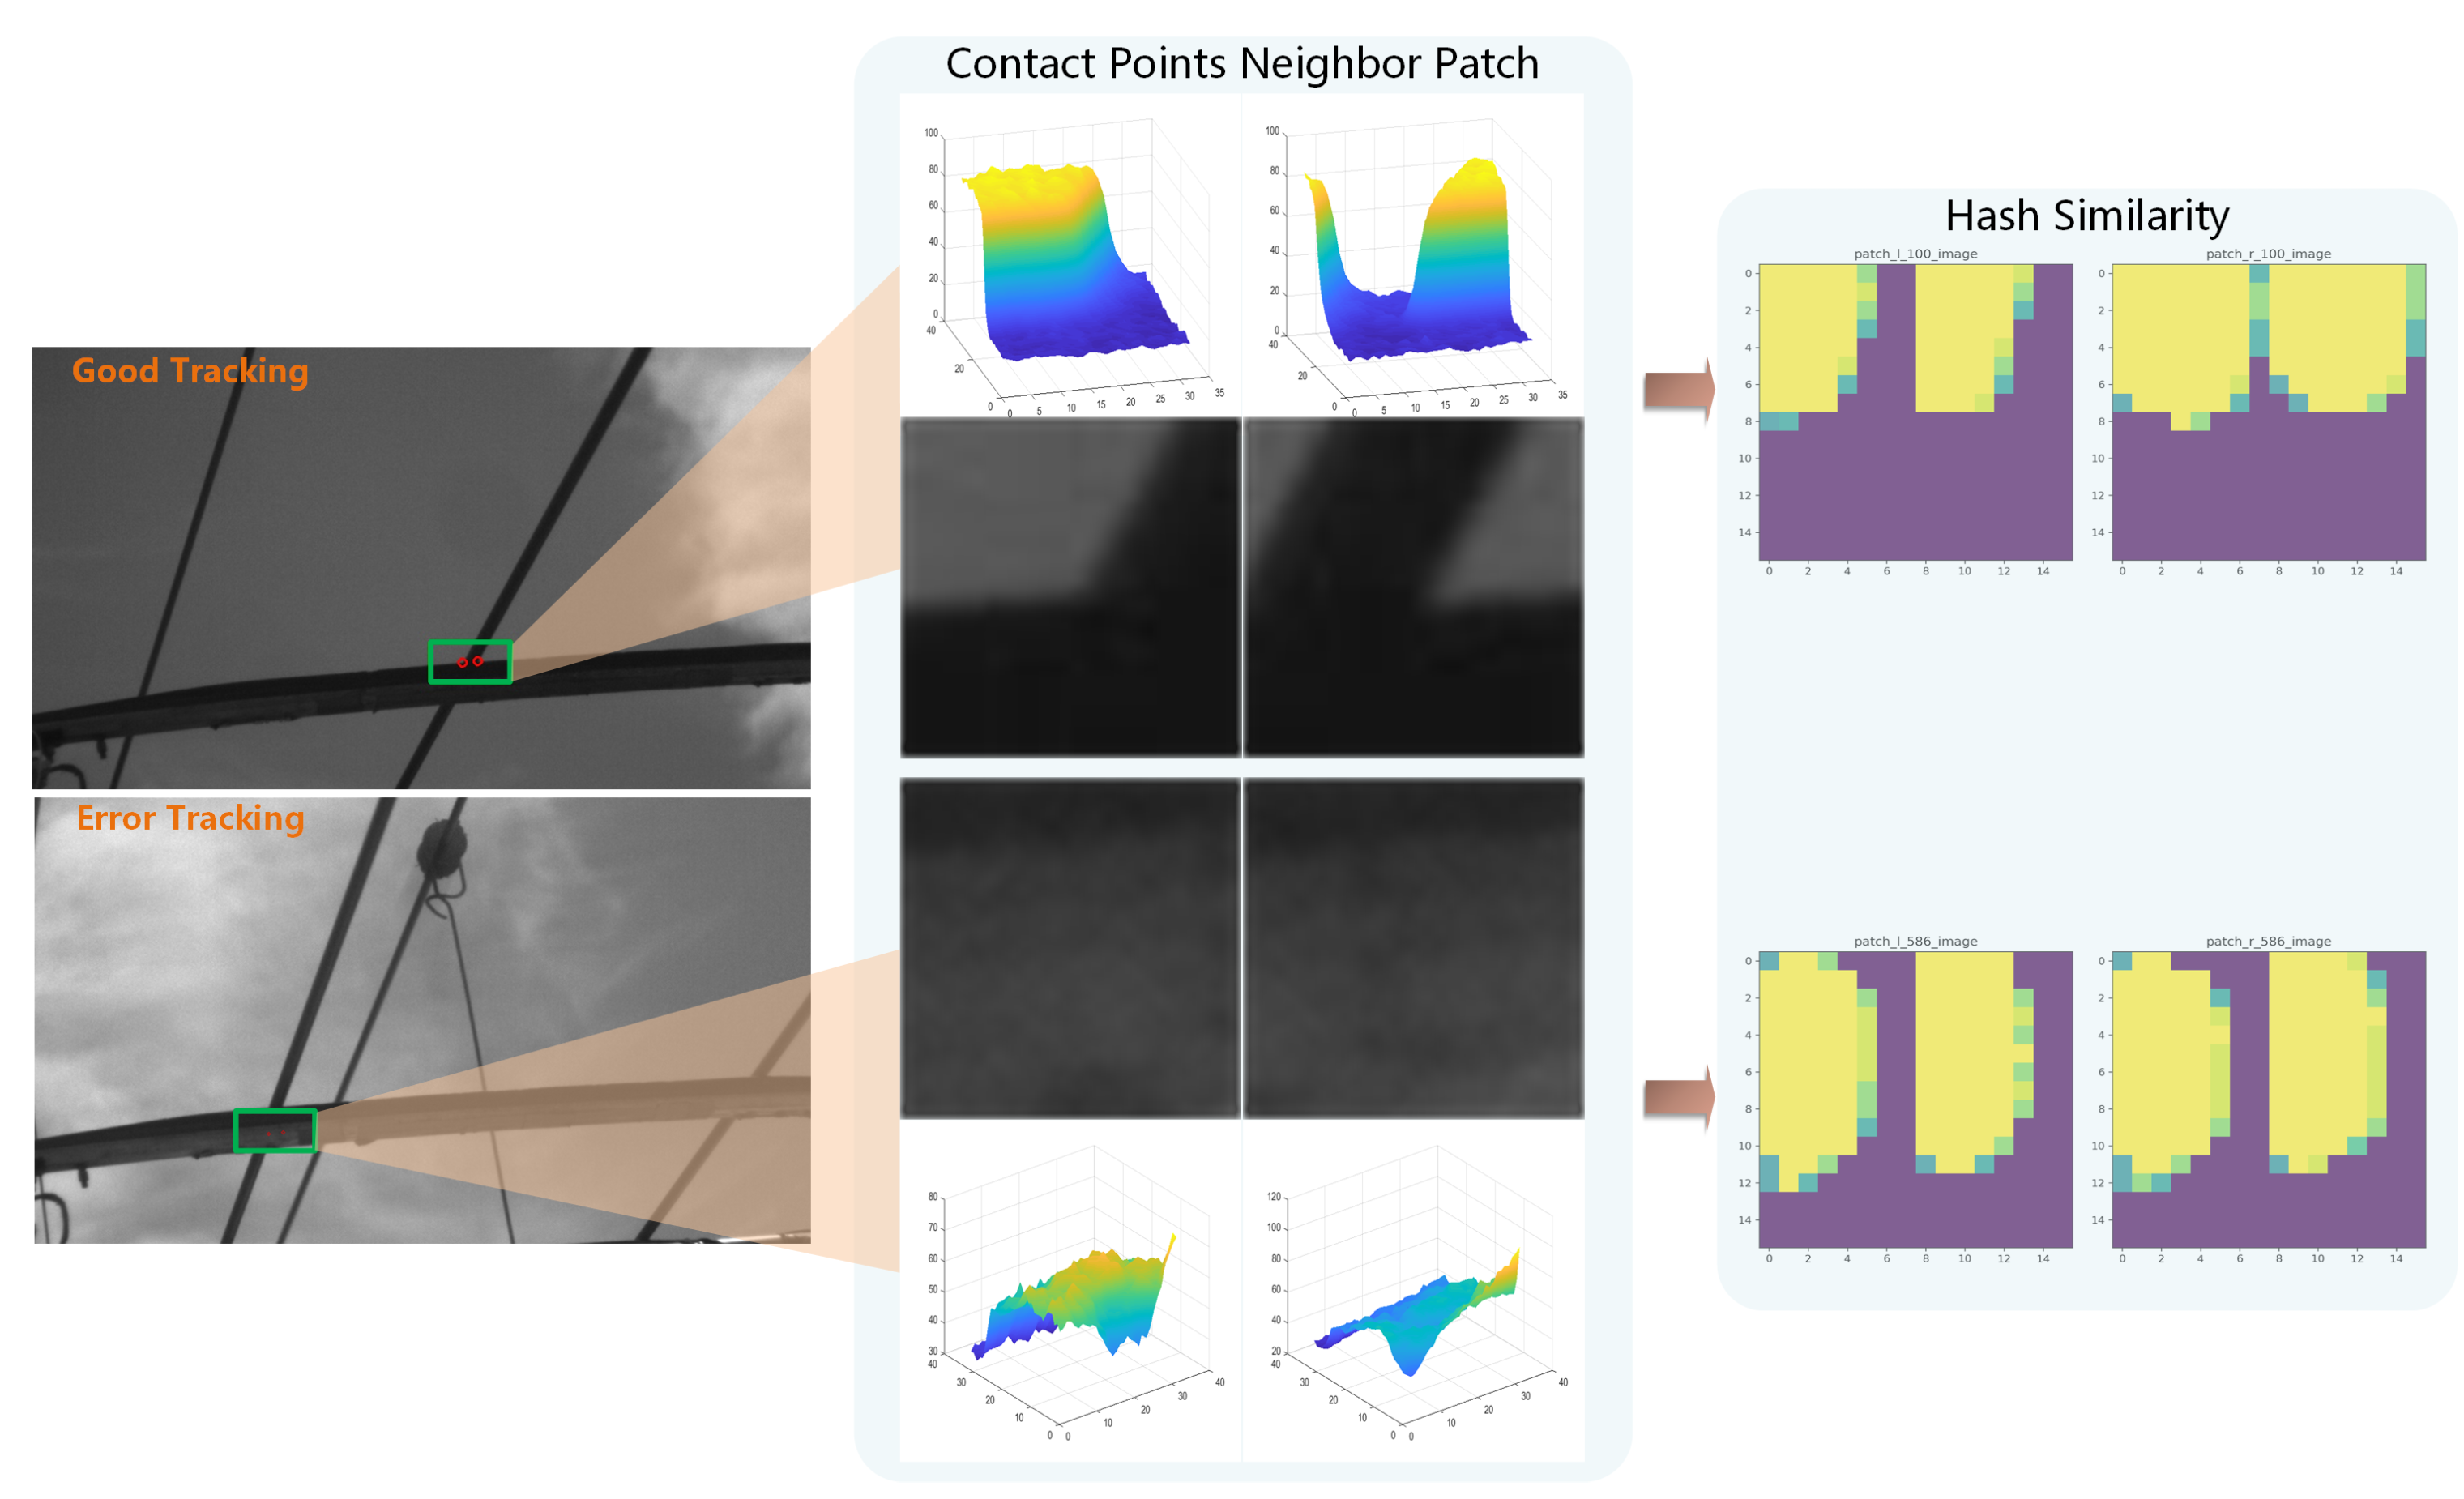
where is the tracking area under the current frame and is the relative displacement saved in the previous RP. Then, the real contact position is obtained by corner approximation. After that, as shown in Figure 3, the image blocks corresponding to the left and right contact points are compared by p-hash and the similarity is calculated as follows:
where is the corresponding image block generated by the left and right contact points in the i-th frame image, respectively, and is the image block generation mode. In practice, a 32 × 32 image slice is selected with the contact point as the center to obtain the similarity of the input images after hash coding. As the left and right contact points are estimated from the previous tracking, it is difficult for to filter the tracking results effectively. The energy equation of the final discriminator is as follows:
where is the state quantity of the current tracking/initialization frame, and is used to control the proportion of the influence of on tracking. After that, the parametric adaptive contact point tracking method is established.
Parameter update: Based on the tracking status parameters, the tracker will automatically update the track parameters to ensure track stability during long-term tracking. According to the status parameters , there are two main strategies used to change the parameters: One is based on the gray information of the tracking area—the internal parameters are changed based on the grayscale information. Through the parameter update, it can effectively cope with the train operation, especially for the continuous change of outdoor illumination over a long period of operation. The other method is to judge the tracking status, that is, to recognize the continuous loss of tracking in time, thereby adjusting the search range of the tracking from local to global, avoiding the tracker’s continuous failure caused by similar targets or blank areas. The strategies are described as follows:
where is the threshold that defines the tracking status. This is set to 20 empirically, which means that the track area can be used to extract grayscale information and update parameters. Reliable positioning of the contact points is achieved using these methods. However, it is difficult to analyze multiple contact states by relying on the contact points alone. Therefore, we go on to propose a robust positioning method for the pantograph horn and spark below.
According to the above, a reliable positioning of the contact points is achieved. However, it is difficult to analyze multiple contact states only by relying on the contact points. Therefore, we propose a robust positioning method for the Pantograph Horn and Spark.
3.2. Pantograph Horn and Spark Localization
In the analysis of PCS, arcing detection is a general target. Arcing occurs due to poor contact, causing a high-voltage current that breaks through the air and produces ultraviolet rays. It appears as bright spots with varied sizes in the contact position in the image. Improved arc detection enables fast inspection of arcing and ultimately helps to adjust the running of the train. The pantograph slide is generally an inverted sheep angle shape, which ensures the contact stability of the PCS. Through the determination of the two ends of the carbon slide and the positioning of the contact points, the pantograph pose can be effectively estimated. This determines the state of the pantograph and allows further analysis of the PCS contact state. Thus, we used a pruned RefineDet [20] to detect these image features, as shown in Figure 4.
RefineDet: This is an improved method of SSD [23]. By using a structure similar to two-stage detection, the detection speed is not lower than SSD and the positioning accuracy is increased. In this paper, there were two detection targets: the horn, which we need to detect to ensure positioning accuracy, and the spark that produces frequent scale changes due to the strength of the arc. Thus, RefineDet was selected as the base method for its fast and accurate locate effort. In light of the relatively concentrated areas of horns and sparks, the network is further pruned to improve detection efficiency.
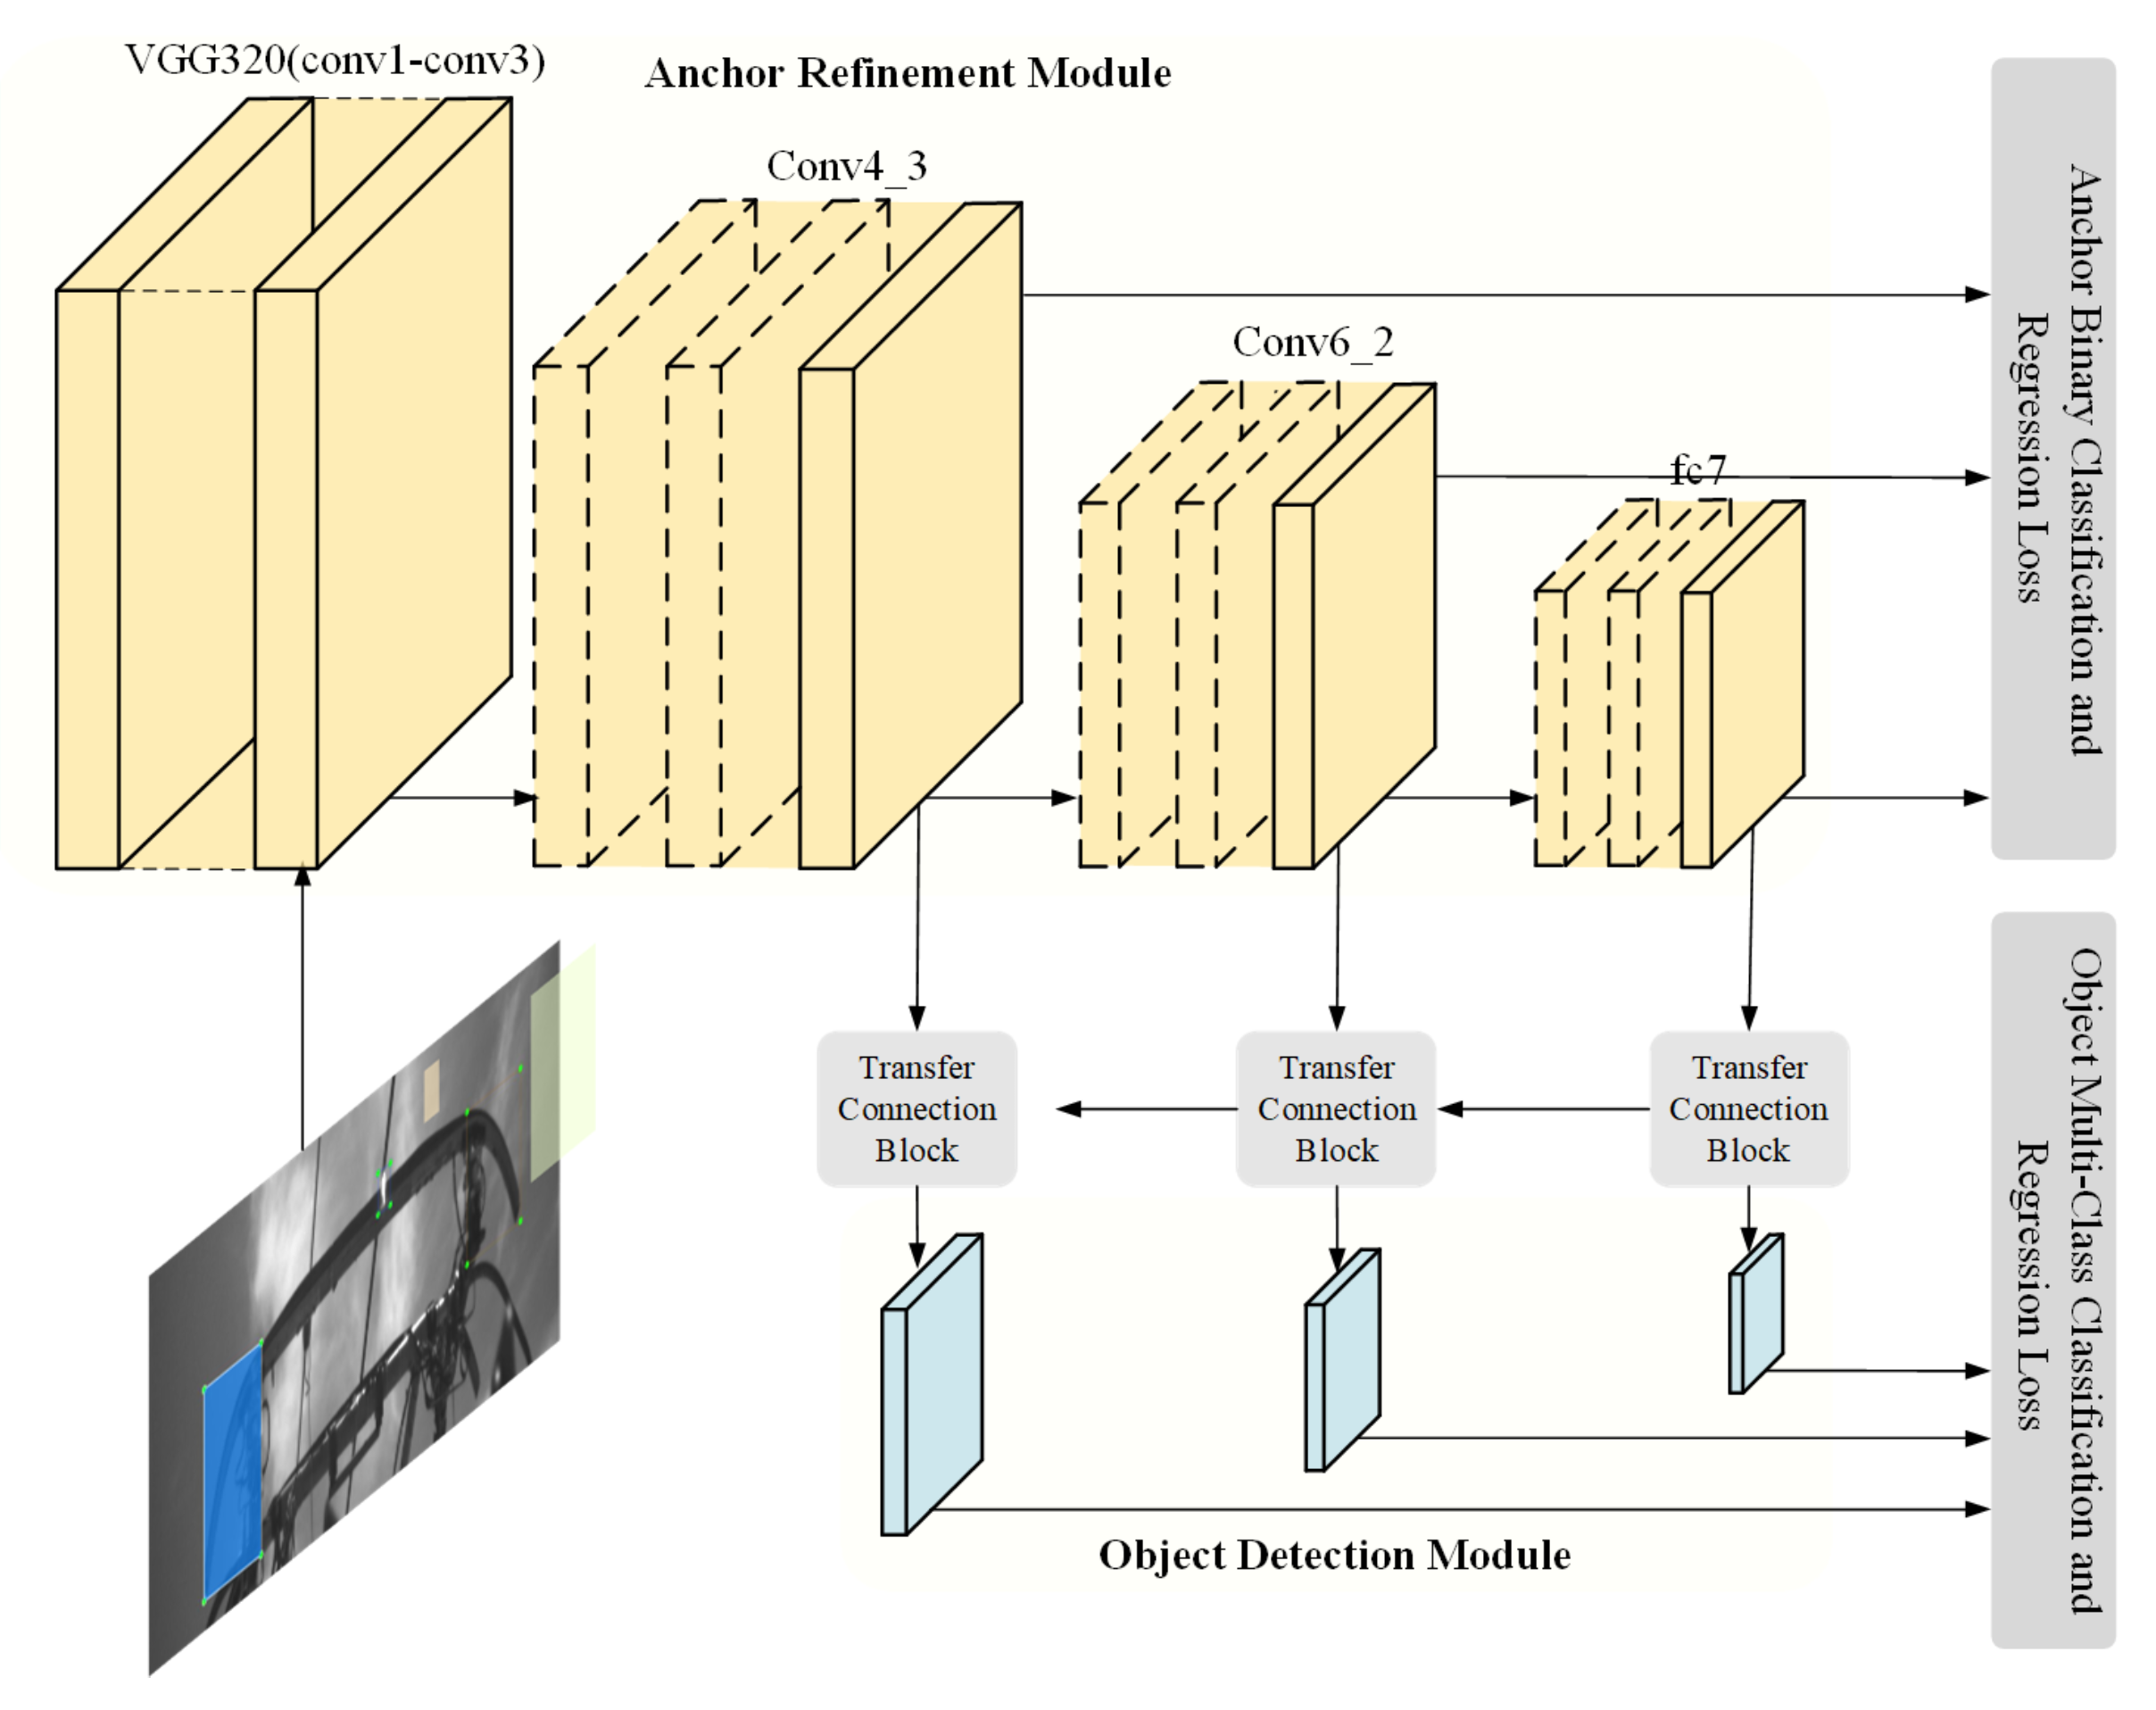
Modeling Structure: The RefineDet model includes three main branches: an anchor refinement module (ARM), transfer connection block (TCB), and object detection module (ODM). The pruning we used had a similar structure. In the ARM, we constructed a multi-scale feature output network similar to SSD based on vgg16, which was used to segment the positive and negative samples of the target frame and predict the location position. The feature map of conv4_3, fc6 and conv6_2 is then fused and used for predictions. On this basis, after filtering a large number of negative samples by ARM, it constructed a network structure similar to a two-stage model. The filtered anchor feature graph was input to the TCB synchronously for processing, and the processed results are then transferred to the ODM for fine adjustment of the detection box regression and object classification tasks. Through this method, RefineDet can achieve more accurate predictions on the basis of a smaller-scale feature map than SSD and with a low-speed extra cost. As the pantograph horn and sparks detected in this paper have clear texture features and non-extreme scale change targets, the demand for a multi-scale prediction box is further reduced. Thus, we pruned the network model and compared the feature map of conv5_3 with conv4_3, which has a similar scale. In conclusion, the number of input anchor boxes can be reduced by nearly 20%, which can improve the performance of the algorithm in the subsequent ODM calculation, as well as in the confidence prediction and location regression stage by ARM and ODM.
Loss: In the training stage, as per the equation in [20], the loss output of the network is obtained by fusing the classification prediction loss and position regression loss in both ARM and ODM, and network learning is achieved through backpropagation of the loss. The loss equation is as follows:
where i is the serial number corresponding to anchor in batch. and are, respectively, the classification and position ground-truth corresponding to anchor i; are the confidence and location obtained in ARM, respectively; and are the values predicted in ODM. is a binary classification loss equation, which can obtain the binary classification loss of positive and negative samples through cross-entropy loss. is a multi-category classification loss equation based on softmax loss, which can output the confidence level of multi-class synchronously. is an L1-loss for position regression. is the confidence level used to filter positive samples, and the loss calculation is only performed for positive samples. are the number of positive samples in each module.
Training Datasets: Based on the given network model, in the pantograph catenary image three objects are set: left horn, right horn, and sparks. The double side of the pantograph horns are selected and distinguish the left and right horns so that a horn missing fault can be detected. This method can effectively solve the accurate identification of the target under the shelter of one side of the horn during train operation and can easily locate the endpoint of the pantograph head by obtaining the vertex of the detected box. The possible arcing phenomenon is also trained synchronously to conduct multiple class detection. After training, it is possible to determine the positioning of the endpoint of the pantograph and detect possible arcing.
On the one hand, through the results of the arc detection, the continuous arcing contact problems that may occur during train operation can be detected and analyzed. At the same time, the arc position itself can be used to verify the contact points in the neighbor frames. Based on the detected image features, an analysis scheme of the actual contact state is next proposed.
4. PCS State Analysis Module
Once the features in the image can be effectively located, a real-time analysis of the PCS contact status can be performed, generally during train operation contact states that are mainly used for consideration include arc detection, pantograph detachment detection, center line offset detection, and pantograph pose detection. The first two are used for timely detection of existing faults, while the latter two can be used to evaluate the real-time PCS status and provide an early warning of a possible fault occurrence. Here, solutions to the analysis will be presented.
Pantograph pose: According to the contact points and pantograph horn corner points, and based on the rigid structure of the slide, the pose parameters of the pantograph can be solved.
First, three image points were used to reconstruct their spatial position based on stereo vision, where is the center point of the contact points and are the two horn points, as follows:
where are the corresponding points in the left and right images, respectively, and are the internal parameters of the left and right cameras and the extrinsic parameters between the two cameras after calibration through high-precision targets. To obtain a clearer association between the reconstructed 3D result and the real position, a conversion matrix between the roof-based coordinate and camera coordinate was solved through an electronic total station, whose function is similar to that of an optical theodolite.
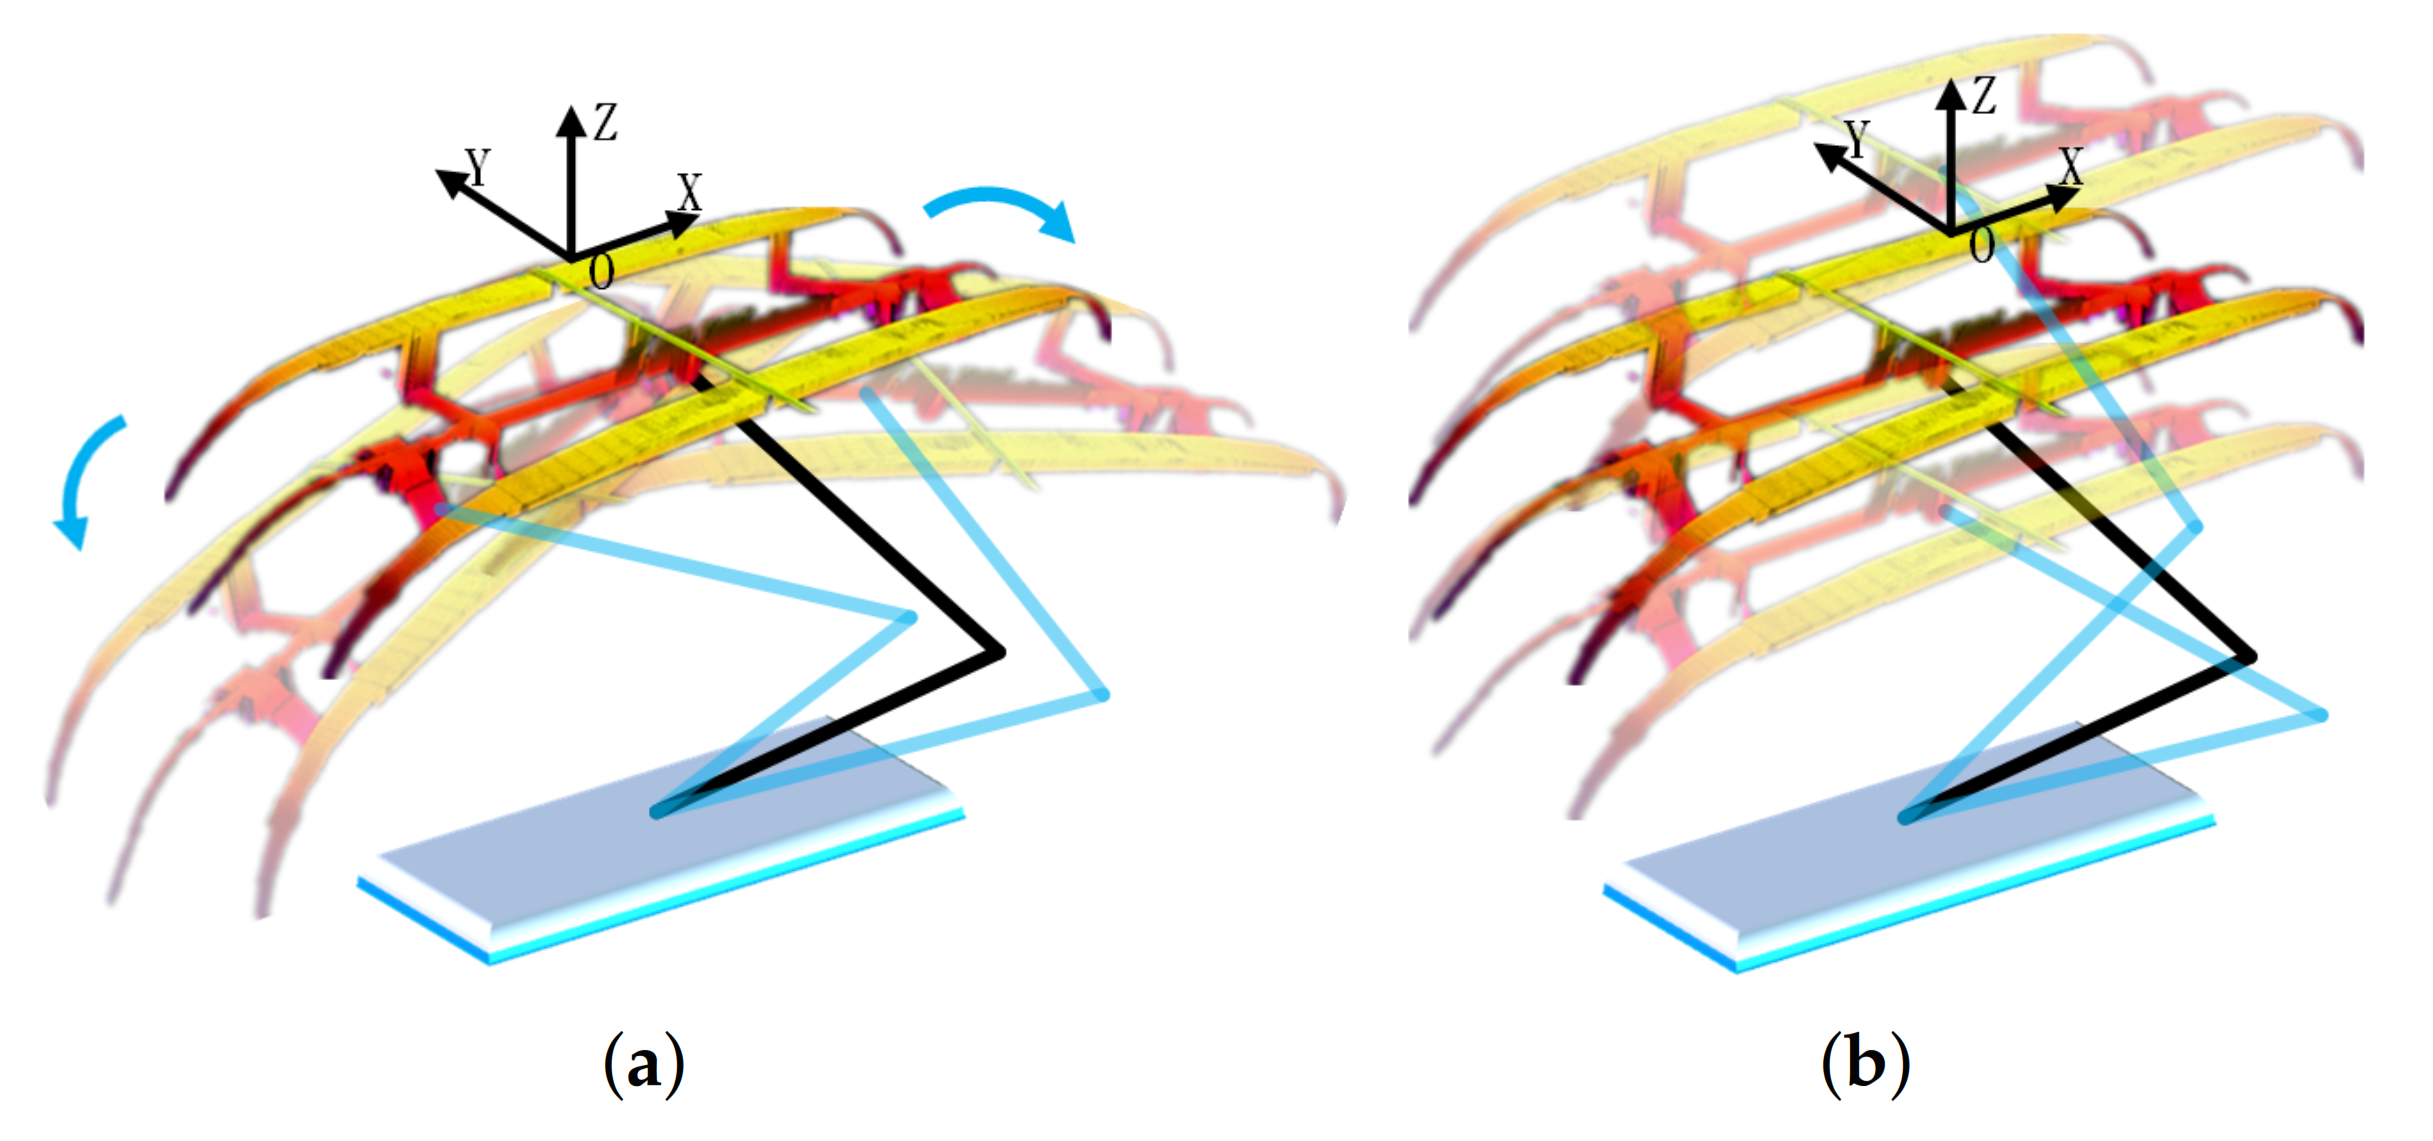
The cross section plane of the pantograph slide in space was then determined. In this plane, according to the standard pantograph 3D data, the whole pantograph point cloud can be registered, and the 3D structure of the pantograph slide is simulated. Based on the reconstructed pantograph, two main attitude parameters were obtained: the tangential tilt angle and the lift relative to the train body. As shown in Figure 5, under the coordinate system of y-axis for train direction, z-axis for ground, and x-axis for tangential direction, the pantograph usually only lifts and descends on the z-axis to ensure constant contact pressure between the pantograph and catenary. However, due to the influence of trains running in curves and crosswinds, there will be a slight suspension in the X-O-Z plane relative to a geodetic coordinate system, so the above two parameters can be used and can effectively represent the track change of a sliding plate in train operation.
Center line offset: Compared with the usual pull-out value detection in railways, the center line offset detection is defined as the offset of the contact line relative to the center position of the pantograph slide, which not only needs to accurately locate the contact line, but also needs to be synchronized to measure the pantograph pose. The center line offset has a strong early warning effect for phenomena such as hanging lines in actual train operation. In the aforementioned attitude solution, the pantograph pose and position of the contact point are known. Thus, according to the pantograph slide vector and the spatial position of the contact point (Figure 1), the offset values can be directly obtained. Note that the premise of the above two detection methods is that PCS detachment does not occur, that is, the contact points in the image will be mismatched when detachment occurs. Correspondingly, the measurement results of the pose and center line offset will be affected.
PCS detachment: As a slight PCS detachment will produce obvious sparks, our method mainly focuses on complete detachment, rather than an unsmooth contact. In this case, because of the mismatch of contact points illustrated in Figure 1, the distance between the spatial contact point and line constructed by the horns will be abnormal. Therefore, PCS detachment can be detected and this is used to assist the internal current detection and determine the confidence of the first two measurement results.
Arcing detection: Through the detection of sparks in each image frame, the frequency of arcing (numbers/minute) can be obtained, and if continuous arcing occurs, the duration of arcing can be measured.
Combining the above four important contact parameters, the feedback of the PCS operating conditions has been proposed, which is a PCS smoothness prediction model, calculated as
where and are based on the Gaussian distribution probability of pantograph pose and center line offset in their distribution range, respectively, combined with their weights to enable the early warning of PCS smoothness. and are binary quantities used to alarm the contact fault. Algorithm 1 presents the bulk of the method’s functionality.
| Algorithm 1 PCS State Analysis Algorithm Pseudopod. |
|
5. Experiment
For the physical experiment, we acquired images of the pantograph slide and the catenary area above the train through binocular cameras installed on the roof and the assistant illumination equipment. We used a Mikrotron EoSens 4CXP sensor camera with a resolution of 2336 × 1728. The cameras were installed on the EMU train running on the LanXin line in China. High-speed data acquisition of 200 fps was carried out through the CoaXPress interface. The collected data contained a complex background, illumination changes, and other complex features that are challenging and typical of actual train operation. The algorithm runs on an i5 7300 2.6 GHz CPU server platform. Meanwhile, the deep learning network runs on two Titan XP GPUs and the code is compiled and run using Python. The results of actual data operation show that our method has a stable effort on tracking and positioning PCS image features and can achieve a reliable analysis of various contact state parameters under long-term outdoor train operation.
Dataset: In this study, the original large amount of data were reprocessed. From each batch dataset we cut out a large number of repeated scenes during train operation and integrated them with different light conditions and complex backgrounds, so that in more than 16,000 binoculars frames there are more than 10 line change stages, 200 arcs, and 20 different illumination situations.
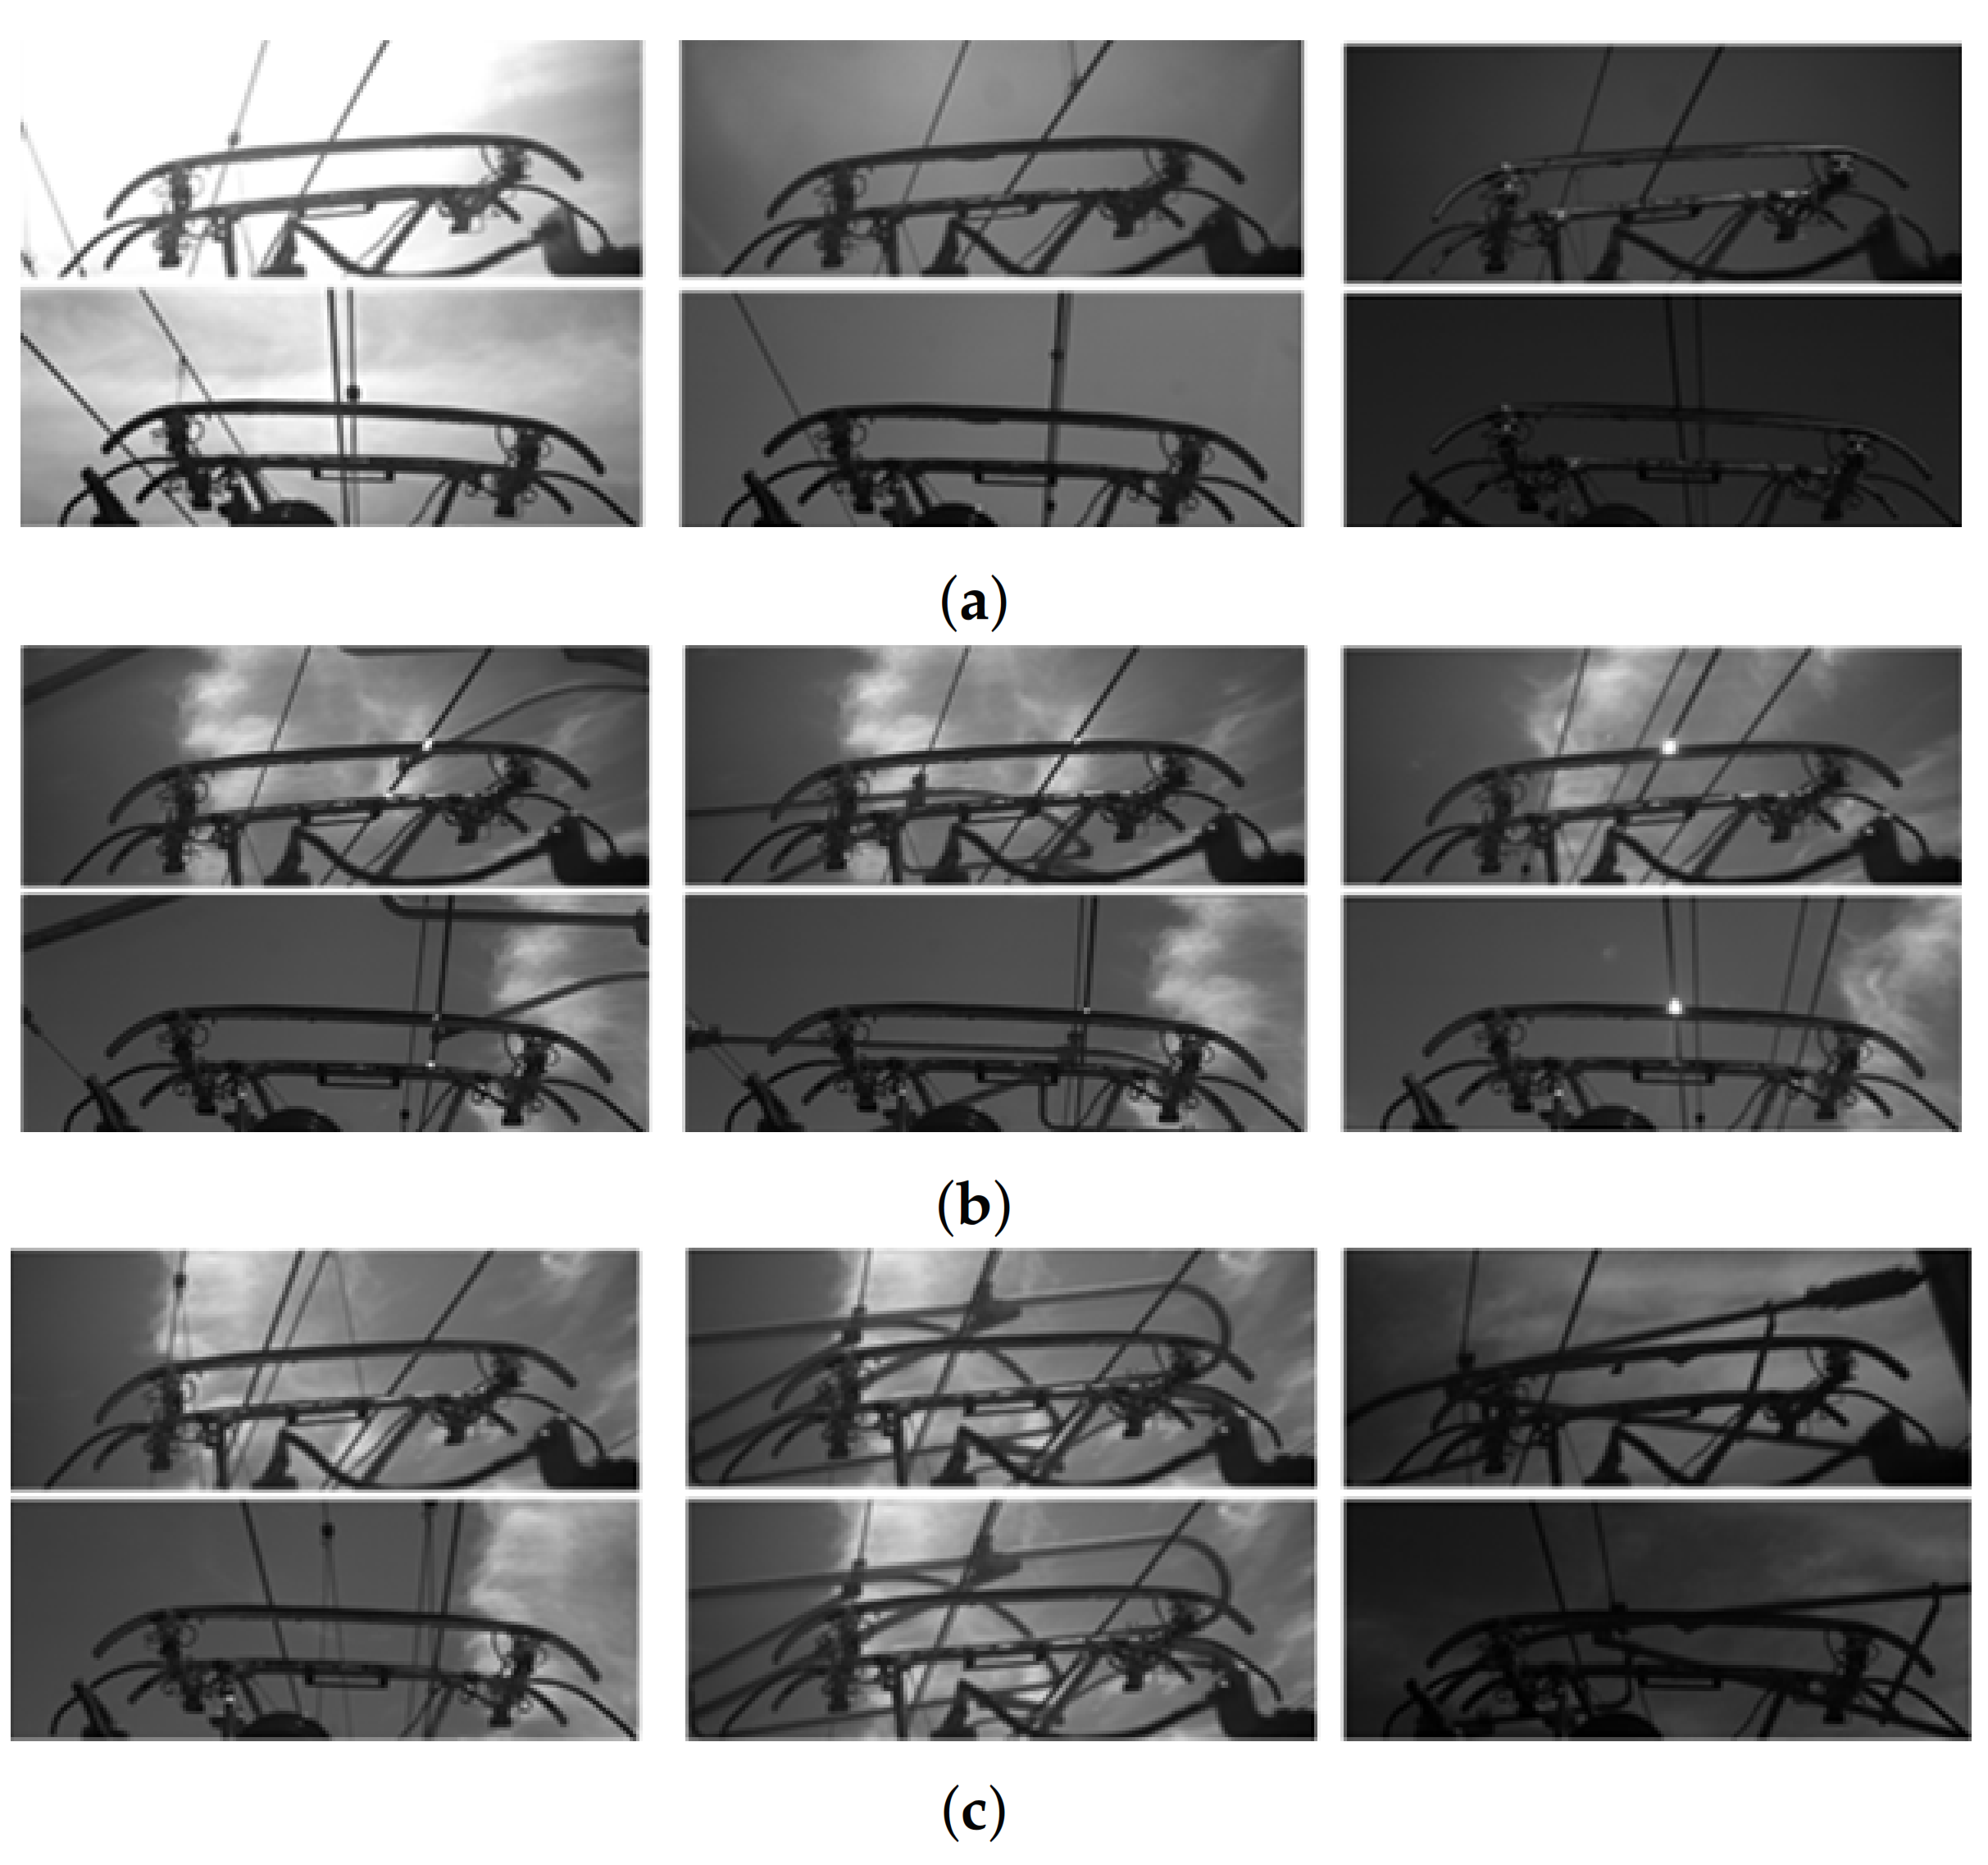
As shown in Figure 6, the frequency of light changes and the proportion of complex scenes in the data set are amplified compared with actual operation conditions. In addition to the change of continuous illumination, the data set also includes challenging samples such as continuous arcing, line switching, a large number of similar interferences, and severe occlusion of targets. Through the construction of the dataset, the verification performance for the algorithm is ensured. Compared with actual outdoor data, our dataset poses a more challenging environment, which ensures the effectiveness of the algorithm for the actual outdoor operation of a train.
5.1. Results of the Tracking of Contact Points
5.1.1. Ablation Study
In this paper, a parameter adaptive contact point tracking and positioning method has been proposed, and the results are shown in Figure 7. Through the positioning module, discriminator, and parameter feedback update, the closed-loop control of the train under long-term outdoor operation is ensured, and fast and stable contact point positioning is achieved. For the selection of the L1 discriminator, the discrimination range was set to 12–30 according to the datasets, and the slope of the contact line was made following judgments to improve the operation effect of the L1 discriminator. The hash discriminator was determined according to the 50 × 100 tracking area, and a corner patch using the 32 × 32 area around the contact point was used as the hash comparison patch. Through both discriminators, the effective feedback update of the algorithm was achieved, which greatly improved the algorithm’s performance and stability under long-term train operation. In the following ablation experiments, the advantage of the contact point closed-loop frame is demonstrated.
The proposed method is compared with the global positioning method that simply relies on template matching (global method), the global method combined with the l1 discriminator (global+l1), and the method that integrates local tracking (local+global+l1). As can be seen from Table 1, taking the image sequence collected by the left camera as an example, the parameters compared were operating efficiency, success rate, arrow error rate, and loss rate, with the threshold of precise positioning and the positioning accuracy of successful positioning set at five. Further, a detection rate with a threshold of 50 was also adopted. It can be seen that the global method can effectively improve the detection rate of the algorithm after adding the discriminator of l1. However, compared with the addition of local tracking, its operating efficiency does not meet the real-time requirements of high-speed trains. Compared with the method that integrates local tracking, our method is slightly slower than using only the l1 discriminator without an update, but the speed of 175 frame per second (FPS) still meets the requirements of most usage scenarios and can achieve a higher positioning success rate and accuracy. The cover accuracy with a threshold of 50 is even better than the effect of global positioning, which provides the dual advantages of positioning stability and efficiency.
5.1.2. Tracking Result Compared with State-of-the-Art Tracking Method
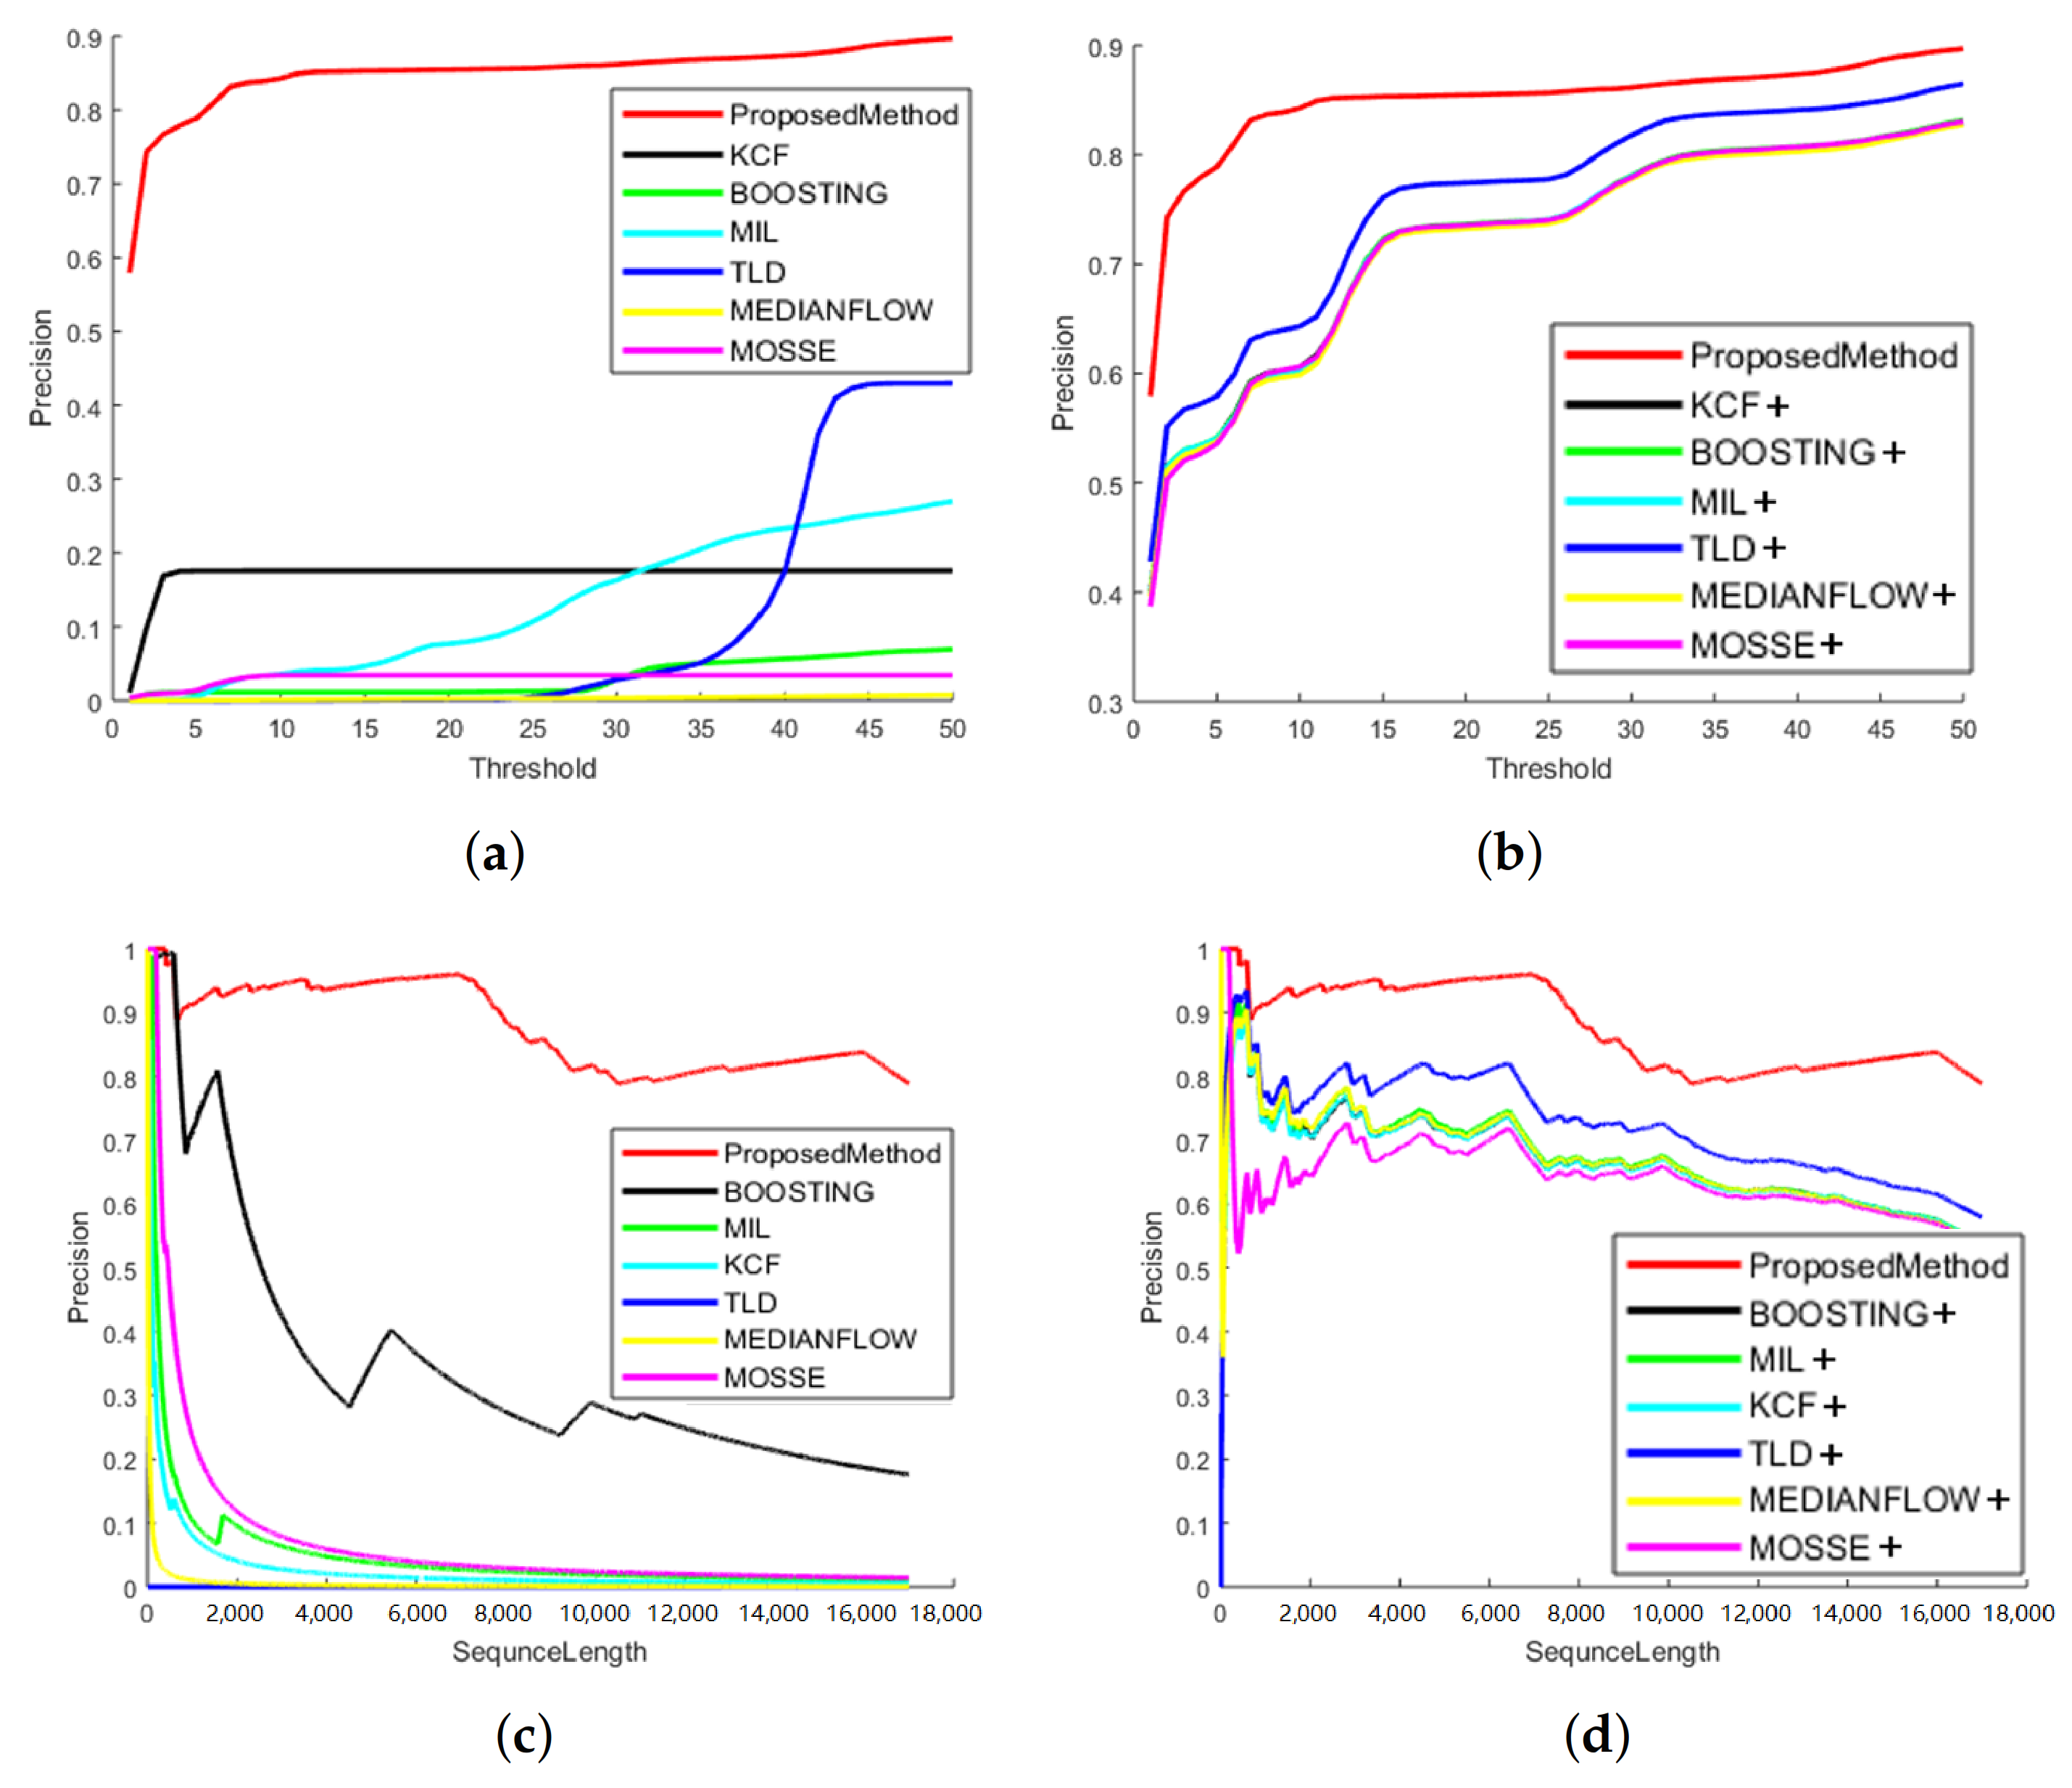
We compared our tracking and positioning method with several state-of-the-art methods, including the positioning results of a single tracker and the results of combining the tracker with our closed-loop positioning framework. Through the following figure and the table, we can see that the positioning accuracy of the proposed method is significantly better than other methods, with 90% to 95% accuracy. In terms of the actual positioning, because of the existence of sub-pixel corner approximation, more than 90% of the successful positioning results can achieve a sub-pixel level feature point location. Accordingly, for the algorithm, even if there was a significant failure in the performance of TLD [24] or MOSSE [25] alone, combined with the closed-loop tracking framework provided by us this would represent a significant improvement in positioning accuracy. This shows that the closed-loop parameter adaptive algorithm proposed in this paper has universality in the selection of tracking methods for contact point tracking, which improves the accuracy greatly and achieves the optimum positioning method. Compared with ground-truthed high-precision positioning and the balance of positioning accuracy of diversified data testing, the effectiveness of our method for contact point positioning of trains running outdoors over a long time frame is verified.
In Figure 8c,d, the stability of our method in dealing with changes in the external environment is more obvious. It can be seen that with an increased length of the dataset sequence, especially when illumination changes occur, many methods have different degrees of decline, and for some methods continuous tracking failure for the later frame sequence occurs. Even if we integrate those methods with the closed-loop model proposed by this paper, those tracking results also reduce the follow-up accuracy to a certain extent. However, it is obvious that our method can directly realize continuous tracking in most scenes, and a small number of tracking failures will reinitialize the tracker in a short time and adjust the template parameters accordingly to adapt to the current image. Thus, stable tracking and positioning for the whole data set is ensured. At the same time, it can be seen from the image that multiple trackers can maintain stable tracking when there is no obvious change in the external environment and light conditions. Therefore, the test effect with our dataset can show that with the original data set, the algorithm can achieve effective positioning over a much longer time when there is a large number of repeated scenes under long-term train operation, and the various light conditions in the test dataset used here, as well as the complexity of most images of train operation, show that our method has obvious advantages compared with other algorithms under the conditions of all-weather train operation. The proposed method proposed can meet the requirements of pantograph catenary contact state analysis in practical use.
5.2. Results of the Pantograph Horn and Spark Localization
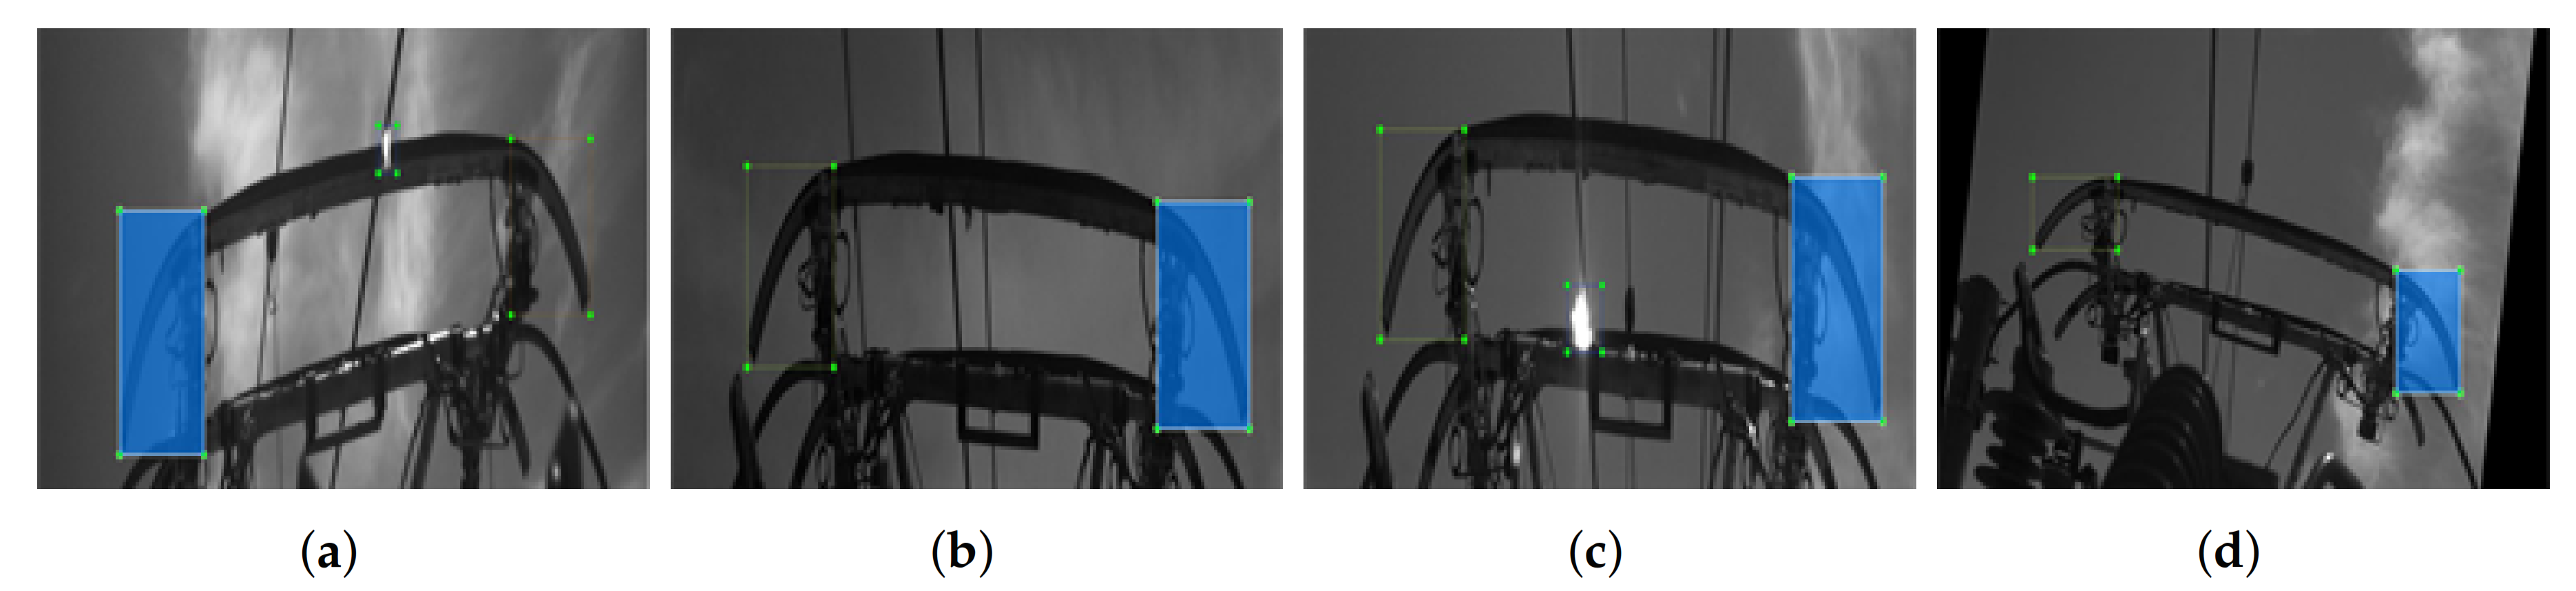
Figure 9 shows how we built the detection target of the pantograph horn and sparks. The labeled data set included 968 frames, of which 920 contain only horns, and 48 contain both horns and sparks, and then the dataset was augmented. The number of datapoints in the final training data set was 8712. Through the training data, we effectively detected the horns and sparks. Further, for arcing phenomena that are difficult to detect, a further comparison of its effects when using augmented data or pruning the network can be seen in Table 2. The result shows that our pruned RefinfDet network maintains the accuracy of detection by effectively using the relationship between results detected by frames obtained from the left and right cameras and, at the same time, reducing the network parameters by nearly 20%. We thus achieved a balance of accuracy and efficiency. It can be seen that the detection framework we used can achieve accurate positioning of horn and robust detection of arcing occurrence under a variety of complex conditions.
5.3. PCS Contact State Analysis
We have shown that the PCS contact point can be robustly tracked, combined with the pantograph horn points obtained through deep learning and the internal and external parameters calibrated in advance (Table 3). The aforementioned PCS contact state parameters can be calculated and provide safety assurances in the automated operation of railways based on real-time processing. For example, in terms of the pantograph pose, Figure 10 shows the posture trajectory changes with the image frame sequence. Frames 10,000–12,000 provide an example and are shown in Figure 10. On the right side of Figure 10, the line graph below from top to bottom shows the angle change, height change, and the evaluation according to the posture. Empirically, the abnormal posture threshold value is set to 0.7, which can give real-time quantitative indicators for the pantograph pose fault of the train, guiding safe driving more intuitively and preventing the occurrence of abnormal situations. Therefore, the proposed method can achieve rapid and robust positioning of the PCS image features under long-term train operation and can guide the real-time calculation of multiple contact state parameters, which play an important role in the autonomous operation and maintenance of railways.
6. Conclusions
In this paper, an online intelligent perception of PCS status based on parameter adaption was proposed. This paper solved problems of online PCS contact analysis such as robust positioning of the PCS image contact point under long-term outdoor operation of the train, as well as the detection of pantograph horns and sparks. We successfully analyzed various PCS contact state parameters such as pantograph pose, center line offset, PCS detachment, and arcing detection. In the adaptive positioning of the PCS contact point, a fusion discriminator combined with an L1-norm and hash similarity judgment was added to the tracking detection framework to achieve closed-loop control of the PCS contact point positioning method. The positioning parameters of the method can be adaptively adjusted based on the current positioning state and current image data to ensure that the algorithm achieves robust real-time positioning in the face of complex environmental issues under train operation such as illumination changes. For the detection of the pantograph horn and sparks, robust target detection in multiple scenes was achieved using the pruned RefineDet method. We tested the algorithm on the high bitrate video stream of a train running on the LanXin line in China, which showed that our method can effectively deal with interferences, line changes, and other complex image situations under operating conditions of a train.
The results of the ablation and comparison experiments show that the proposed tracking method can effectively improve the accuracy of contact point positioning, ensuring the real-time and stable positioning of image features during increased train operation times and with gradual changes in the external environment. After combining the pantograph horn and arc detection, this paper achieved a practical PCS contact state analysis, which shows that the algorithm ensures real-time and stable positioning of image features. This method may be of practical significance in the automation of train safety and is a significant contribution to research on RIOM.
In a future study, more types of sensors could be fused to assist the rapid separation of the foreground and background for the global reconstruction of the PCS contact area.
Author Contributions
Conceptualization, Y.S.; Investigation, Y.S. and L.C.; Methodology, Y.S.; Software, Y.S.; Supervision, X.P.; Validation, Y.S. and L.C.; Writing—original draft, Y.S.; Writing—review and editing, X.P. All authors have read and agreed to the published version of the manuscript.
Funding
This research received no external funding.
Institutional Review Board Statement
Not applicable.
Informed Consent Statement
Not applicable.
Data Availability Statement
Data available on request due to restrictions eg privacy or ethical.
Acknowledgments
This research was supported by a grant from Major Achievements Transformation Project of Center University in Beijing of the Ministry of Education Key Laboratory of Precision Opto-Mechatronics Technology, Beihang University.
Conflicts of Interest
The authors declare no conflict of interest.
Abbreviations
The following abbreviations are used in this manuscript:
| PCS | Pantograph and Catenary System |
| RIOM | Intelligent Operation and Maintenance of Railways |
References
- Yaman, O.; Karakose, M.; Aydin, I.; Akin, E. Image processing and model based arc detection in pantograph catenary systems. In Proceedings of the Signal Processing and Communications Applications Conference, Trabzon, Turkey, 23–25 April 2014; pp. 1934–1937. [Google Scholar]
- Gao, S.; Wang, Y.; Liu, Z.; Mu, X.; Huang, K.; Song, X. Thermal Distribution Modeling and Experimental Verification of Contact Wire Considering the Lifting or Dropping Pantograph in Electrified Railway. IEEE Trans. Transp. Electrif. 2016, 2, 256–265. [Google Scholar] [CrossRef]
- Fukai, H.; Watabe, Y.; Niwakawa, M.; Tabayashi, S. Automatic correction of measurement position using robust matching in contact wire inspection system. In Proceedings of the 2016 11th France-Japan & 9th Europe-Asia Congress on Mechatronics (MECATRONICS)/17th International Conference on Research and Education in Mechatronics (REM), Compiegne, France, 15–17 June 2016; pp. 193–196. [Google Scholar]
- Yuan, F.Q.; Lu, J.M. Data-driven model development using Support Vector Machine for railway Overhead Contact Wire maintenance. In Proceedings of the IEEE International Conference on Industrial Engineering and Engineering Management, Singapore, 6–9 December 2016; pp. 78–82. [Google Scholar]
- Na, K.M.; Lee, K.; Shin, S.K.; Kim, H. Detecting Deformation on Pantograph Contact Strip of Railway Vehicle on Image Processing and Deep Learning. Appl. Sci. 2020, 10, 8509. [Google Scholar] [CrossRef]
- Luo, Y.; Yang, Q.; Liu, S. Novel Vision-Based Abnormal Behavior Localization of Pantograph-Catenary for High-Speed Trains. IEEE Access 2019, 7, 180935–180946. [Google Scholar] [CrossRef]
- Yao, Y.; Zou, D.; Zhou, N.; Mei, G.; Wang, J.; Zhang, W. A study on the mechanism of vehicle body vibration affecting the dynamic interaction in the pantograph–catenary system. Veh. Syst. Dyn. 2020, 1–20. [Google Scholar] [CrossRef]
- Huang, C.; Wang, A.; Gu, X.; Gao, X.; He, Y.; Liu, L.; Gao, F. High-Frequency Vibration Analysis and Optimization of Irregular Wear of Pantograph Carbon Strips. Shock Vib. 2020, 2020, 8850079. [Google Scholar] [CrossRef]
- Zhou, N.; Yang, W.; Liu, J.; Zhang, W.; Wang, D. Investigation on monitoring system for pantograph and catenary based on condition-based recognition of pantograph. Shock Vib. 2019, 2019, 3839191. [Google Scholar] [CrossRef]
- Yu, X.; Su, H. Pantograph Arc Detection of Urban Rail Based on Photoelectric Conversion Mechanism. IEEE Access 2020, 8, 14489–14499. [Google Scholar] [CrossRef]
- Huang, S.; Zhai, Y.; Zhang, M.; Hou, X. Arc Detection and Recognition in Pantograph-Catenary System based on Convolutional Neural Network. Inf. Sci. 2019, 501, 363–376. [Google Scholar] [CrossRef]
- Lu, P.; Huo, C.; Duan, W.; Ai, J.; Jin, H.; Jin, L. Information fusion and image processing based arc detection and localization in pantograph-catenary systems. In Proceedings of the 2019 22th International Conference on Information Fusion (FUSION), Ottawa, ON, Canada, 2–5 July 2019; IEEE: Piscataway, NJ, USA, 2019; pp. 1–8. [Google Scholar]
- Facchinetti, A.; Mauri, M. Hardware-in-the-Loop Overhead Line Emulator for Active Pantograph Testing. IEEE Trans. Ind. Electron. 2009, 56, 4071–4078. [Google Scholar] [CrossRef]
- Wei, X.; Jiang, S.; Li, Y.; Li, C.; Jia, L.; Li, Y. Defect Detection of Pantograph Slide Based on Deep Learning and Image Processing Technology. IEEE Trans. Intell. Transp. Syst. 2019, 21, 947–958. [Google Scholar] [CrossRef]
- Aydin, I.; Karakose, M.; Akin, E. A Robust Anomaly Detection in Pantograph-Catenary System Based on Mean-Shift Tracking and Foreground Detection. In Proceedings of the IEEE International Conference on Systems, Man, and Cybernetics, Manchester, UK, 13–16 October 2014; pp. 4444–4449. [Google Scholar]
- Aydin, I.; Karakose, M.; Akin, E. A New Contactless Fault Diagnosis Approach for Pantograph-Catenary System Using Pattern Recognition and Image Processing Methods. Adv. Electr. Comput. Eng. 2014, 14, 79–88. [Google Scholar] [CrossRef]
- Karakose, E.; Gencoglu, M.T.; Karakose, M.; Aydin, I.; Akin, E. A New Experimental Approach Using Image Processing Based Tracking for an Efficient Fault Diagnosis in Pantograph-Catenary Systems. IEEE Trans. Ind. Inform. 2016, 13, 635–643. [Google Scholar] [CrossRef]
- Cho, C.J.; Ko, H. Video-Based Dynamic Stagger Measurement of Railway Overhead Power Lines Using Rotation-Invariant Feature Matching. IEEE Trans. Intell. Transp. Syst. 2015, 16, 1294–1304. [Google Scholar] [CrossRef]
- Shen, Y.; Liu, Z.; Zhang, G. PAC Interaction Inspection Using Real-Time Contact Point Tracking. IEEE Trans. Instrum. Meas. 2019, 68, 4051–4064. [Google Scholar] [CrossRef]
- Zhang, S.; Wen, L.; Bian, X.; Lei, Z.; Li, S.Z. Single-Shot Refinement Neural Network for Object Detection. In Proceedings of the IEEE Conference on Computer Vision and Pattern Recognition, Salt Lake City, UT, USA, 18–22 June 2018; pp. 4203–4212. [Google Scholar]
- Henriques, J.F.; Rui, C.; Martins, P.; Batista, J. High-Speed Tracking with Kernelized Correlation Filters. IEEE Trans. Pattern Anal. Mach. Intell. 2015, 37, 583–596. [Google Scholar] [CrossRef] [PubMed] [Green Version]
- Lv, X.; Wang, Z.J. Perceptual Image Hashing Based on Shape Contexts and Local Feature Points. IEEE Trans. Inf. Forensics Secur. 2012, 7, 1081–1093. [Google Scholar] [CrossRef]
- Liu, W.; Anguelov, D.; Erhan, D.; Szegedy, C.; Reed, S.; Fu, C.Y.; Berg, A.C. Ssd: Single shot multibox detector. In European Conference on Computer Vision; Springer: Berlin/Heidelberg, Germany, 2016; pp. 21–37. [Google Scholar]
- Kalal, Z.; Matas, J.; Mikolajczyk, K. P-N learning: Bootstrapping binary classifiers by structural constraints. In Proceedings of the 2010 IEEE Computer Society Conference on Computer Vision and Pattern Recognition, San Francisco, CA, USA, 13–18 June 2010; IEEE: Piscataway, NJ, USA, 2010; pp. 49–56. [Google Scholar]
- Bolme, D.S.; Beveridge, J.R.; Draper, B.A.; Lui, Y.M. Visual object tracking using adaptive correlation filters. In Proceedings of the 2010 IEEE Computer Society Conference on Computer Vision and Pattern Recognition, San Francisco, CA, USA, 13–18 June 2010; IEEE: Piscataway, NJ, USA, 2010; pp. 2544–2550. [Google Scholar] [CrossRef]
Figure 1.
Overview of the online pantograph and catenary system (PCS) intelligent perception analysis system and illustration of the four modules: data collection, feature localization, reconstruction, and data analysis.
Figure 1.
Overview of the online pantograph and catenary system (PCS) intelligent perception analysis system and illustration of the four modules: data collection, feature localization, reconstruction, and data analysis.

Figure 2.
Contact points localization by template matching. Two template signals are shown in the bottom-right corner in bright pink.
Figure 2.
Contact points localization by template matching. Two template signals are shown in the bottom-right corner in bright pink.

Figure 3.
Hash similarity for fault tracking.

Figure 4.
The pruned RefineDet network framework.

Figure 5.
Example of pantograph pose change: (a) change in X-O-Z coordinates and (b) change in Z coordinate.
Figure 5.
Example of pantograph pose change: (a) change in X-O-Z coordinates and (b) change in Z coordinate.

Figure 6.
The tested datasets which contains various complex situation. (a) Image in different illumination, (b) illustration of sparks in PCS images, and (c) an example of complex background.
Figure 6.
The tested datasets which contains various complex situation. (a) Image in different illumination, (b) illustration of sparks in PCS images, and (c) an example of complex background.

Figure 7.
Illustration of tracking results in long-term datasets.

Figure 8.
Precision of the tracking results. (a,b) The precision with region of interest(ROI) threshold, and (c,d) the precision along with the dataset length. (a,c) A comparison our method compared to other tracking methods. (b,d) A comparison of our method with other tracking method in our adaptive tracking framework.

Figure 9.
Train dataset of pruned RefineDet: (a–c) illustration emphasizing the horns in double side and sparks, respectively, and (d) illustration of the augmented frames.
Figure 9.
Train dataset of pruned RefineDet: (a–c) illustration emphasizing the horns in double side and sparks, respectively, and (d) illustration of the augmented frames.

Figure 10.
Pantograph pose in frame sequence, in which the left part is the pantograph moving trajectory and the right part shows the details in 10,000–12,000 frames. The top is the lateral view and the bottle, and in below is the theta and height value of the pantograph, respectively.
Figure 10.
Pantograph pose in frame sequence, in which the left part is the pantograph moving trajectory and the right part shows the details in 10,000–12,000 frames. The top is the lateral view and the bottle, and in below is the theta and height value of the pantograph, respectively.


Table 1.
The speed (frames per second) and accuracy of each tracking method.
| Method | Speed (FPS) | Success Rate | Missing Rate | Error Rate | Accuracy (pixel) | Success_50 Rate |
|---|---|---|---|---|---|---|
| global method | 67.62 | 31.96% | 3.26% | 64.77% | 3.083 | 87.30% |
| global+l1 | 88.48 | 89.63% | 0.40% | 9.97% | 0.212 | 94.58% |
| local+global+l1 | 247.50 | 69.55% | 0.81% | 29.64% | 1.616 | 94.08% |
| our method | 175.80 | 87.91% | 3.31% | 11.75% | 0.399 | 95.89% |
Table 2.
Detection results for sparks.
| Detect Mode | Detect | Pruning-Detect | Detect-Aug | Detect-Prun-Aug |
|---|---|---|---|---|
| left | 0.62 | 0.62 | 0.78 | 0.74 |
| right | 0.61 | 0.56 | 0.80 | 0.80 |
| both | 0.70 | 0.65 | 0.87 | 0.90 |
Table 3.
Calibration results in physical experiment.
| Internal Parameters | External Parameters | |||||||||
|---|---|---|---|---|---|---|---|---|---|---|
| Parameters | ||||||||||
| 4226.17 | 4270.22 | 0.955 | −0.111 | 0.273 | −973.25 | 0.939 | 0.052 | 0.340 | −770.96 | |
| 4226.39 | 4278.11 | |||||||||
| 1177.99 | 1156.43 | 0.111 | 0.994 | 0.016 | −34.92 | −0.047 | 0.999 | −0.022 | 4328.53 | |
| 932.03 | 943.39 | |||||||||
| 0.384 | 0.323 | −0.274 | 0.014 | 0.962 | 95.22 | −0.341 | 0.004 | 0.940 | 0.01 | |
| 0 | 0 | |||||||||
Publisher’s Note: MDPI stays neutral with regard to jurisdictional claims in published maps and institutional affiliations. |
© 2021 by the authors. Licensee MDPI, Basel, Switzerland. This article is an open access article distributed under the terms and conditions of the Creative Commons Attribution (CC BY) license (http://creativecommons.org/licenses/by/4.0/).
Share and Cite
MDPI and ACS Style
Shen, Y.; Pan, X.; Chang, L. Online Intelligent Perception of Pantograph and Catenary System Status Based on Parameter Adaptation. Appl. Sci. 2021, 11, 1948. https://0-doi-org.brum.beds.ac.uk/10.3390/app11041948
AMA Style
Shen Y, Pan X, Chang L. Online Intelligent Perception of Pantograph and Catenary System Status Based on Parameter Adaptation. Applied Sciences. 2021; 11(4):1948. https://0-doi-org.brum.beds.ac.uk/10.3390/app11041948
Chicago/Turabian StyleShen, Yuan, Xiao Pan, and Luonan Chang. 2021. "Online Intelligent Perception of Pantograph and Catenary System Status Based on Parameter Adaptation" Applied Sciences 11, no. 4: 1948. https://0-doi-org.brum.beds.ac.uk/10.3390/app11041948
Note that from the first issue of 2016, this journal uses article numbers instead of page numbers. See further details here.