Article

Sea Bass Side Streams Valorization Assisted by Ultrasound. LC-MS/MS-IT Determination of Mycotoxins and Evaluation of Protein Yield, Molecular Size Distribution and Antioxidant Recovery

by
Fadila Al Khawli
,
Noelia Pallarés
,
Francisco J. Martí-Quijal
,
Emilia Ferrer
* and
Francisco J. Barba
*
Department of Preventive Medicine and Public Health, Food Science, Toxicology and Forensic Medicine, Faculty of Pharmacy, Universitat de València, Avda. Vicent Andrés Estellés, 46100 València, Spain
*
Authors to whom correspondence should be addressed.
Submission received: 6 February 2021 / Revised: 24 February 2021 / Accepted: 24 February 2021 / Published: 1 March 2021
(This article belongs to the Collection Ultrasound in Extraction Processing)

Abstract

:
Sea bass side streams obtained from the fish industry can be a good source of nutrients such as high-quality protein, lipids, and antioxidants. In this context, it is interesting to develop innovative approaches to extract the added-value compounds from fish side streams. In this study, a strategy to obtain valuable compounds and to minimize the presence of toxins from fish side streams assisted by ultrasound technology is presented. For this purpose, ultrasound-assisted extraction (UAE) conditions have been optimized based on a response surface methodology (RSM) with the dependent variables: time (0.5–30 min), pH (5.5–8.5), and temperature (20–50 °C). After the treatment, protein extraction and antioxidant activity were evaluated in the extracts obtained from sea bass side streams using some spectrophotometric and fluorometric methods. Furthermore, mycotoxin presence was evaluated by LC-MS/MS-QTRAP. The results obtained revealed a high recovery percentage of proteins and antioxidant activity in the UAE extracts, especially those obtained from viscera, when the time and temperature increased to 30 min and 50 °C. Furthermore, none of the analyzed mycotoxins were detected in the sea bass side streams extracts under the studied variables. The experimental values obtained were close to the expected values, confirming the validity of the model employed to establish the optimal UAE conditions.

1. Introduction

According to the Food and Agriculture Organization (FAO), total fish production reached up to 171 million tonnes in 2016 [1]. It has been estimated that ≈20–80% of fish weight are side streams (i.e., head, skin, bones, viscera, scales, and tails), which have been traditionally considered as a waste with low added-value, thus representing a potential negative environmental impact [2]. However, they are a great source of nutrients such as high quality protein, fat, and antioxidants, which can protect the human body from free radicals, thus delaying the development of many noncommunicable diseases [3].
For instance, some previous studies have evaluated the use of fish side streams from sardine [4], tuna [5,6], salmon [7], mackerel [8], seabass [9,10], among others, as a source of protein hydrolysates and antioxidant peptides using conventional recovery strategies. However, there is a lack of information regarding the use of innovative approaches to recover proteins from sea bass side streams, and about their impact on protein molecular size distribution and the antioxidant yield.
Ultrasound-assisted extraction (UAE) is a nonconventional technology that has emerged over the last few decades. UAE utilizes acoustic cavitation that promotes molecular movement of solvent and sample, showing some advantages such as efficiency, reduced extraction time, low solvent consumption, and high level of automation. UAE has been reported as an interesting tool for the extraction of protein from the whole fish [11]. It has also been shown as a useful strategy to extract collagen and gelatin from different fish side streams (i.e., skin and scales) [12]. In this line, UAE has been used with different methods, including the green, environmentally friendly solvents, such as the deep eutectic solvents (DES) and their natural equivalents, the natural deep eutectic solvents (NADES) to improve the efficiency of the extraction process, and the tailored recovery of target compounds [13].
Moreover, UAE combined with other techniques can be an efficient tool for mycotoxin extraction from fish [14]. Mycotoxins are toxic chemical compounds resulting from the secondary metabolism of fungi, which can occur on different substrates under certain environmental conditions. They are natural micropollutants present in food and can affect consumers and animals health at subtoxic doses, due to their simultaneous presence in food and their continued ingestion throughout life. Mycotoxins are related with adverse effects such as hepatotoxicity, nephrotoxicity, estrogenicity, immunotoxicity, mutagenicity, teratogenicity, carcinogenicity, and diabetic action [15]. The toxigenic fungal species most frequently found in food belong to the genera Aspergillus, Fusarium, and Penicillium. Aflatoxins (AFs) are produced by Aspergillus species, and Ochratoxin A (OTA) and Patulin (PAT) by both Aspergillus and Penicillium. Fusarium species produce trichothecenes (HT2, T2, Deoxynivalenol (DON), and Nivalenol (NIV)), Zearalenone (ZEA), Fumonisins (FB1 and FB2) and emerging mycotoxins (Fusaproliferin (FUS), Moniliformin (MON), Beauvericin (BEA) and Enniatins (ENNs)) [16].
Maximum concentrations have been established for some mycotoxins in different raw materials and processed foods based on their toxicity and consumption habits [17], however in fish products maximum levels have not been legislated yet.
Mycotoxin carryover from feed to edible fish tissue has been previously reported in bibliography. Huang et al. [18] and Nomura et al. [19] reported AFB1 contents in muscle and hepatopancreas of gibel carp and in edible muscle of rainbow trout. Moreover, they also found higher contents of AFB1 metabolites (aflatoxicol (AFL) and aflatoxin M1 (AFM1)) after dietary exposure. On the other hand, ENNs were reported in fish species and FUS-X and ENN B in gula substitute samples [20,21].
Due to the low mycotoxin contents in food and the complexity of food matrices, there is a need for sensitive and specific analytical methods in order to determine mycotoxins. Furthermore, an appropriate sample preparation and an exhaustive preconcentration method are also required to efficiently extract the mycotoxins from tested samples prior to their analysis [22]. In this line, the use of UAE has shown promising results for this purpose [23]. For instance, Jayasinghe et al. [14] successfully applied UAE in the extraction of aflatoxins trace amounts from fish. Taking into account that aquaculture fish is frequently exposed to feed-borne mycotoxins and that several studies have estimated the presence of mycotoxins residues in fish organs and tissues [24], it is necessary to verify if mycotoxins are present in the extracts obtained after UAE extraction [25].
In this work, a strategy to obtain valuable compounds and minimize the presence of mycotoxins from sea bass side streams is presented. For this purpose, UAE conditions were optimized using a response surface methodology (RSM), a statistical multifactorial analysis of experimental variables and response for protein and antioxidant recovery. Moreover, the effect of ultrasound treatment on the protein quality was evaluated through the determination of protein molecular size distribution using SDS–PAGE (sodium dodecyl sulfate–polyacrylamide gel electrophoresis). Furthermore, mycotoxins presence has been evaluated in the extracts obtained after the treatment. For that purpose, some spectrophotometric, fluorometric, and LC-MS/MS-QTRAP assays have been carried out.

2. Materials and Methods

2.1. Chemicals and Reagents
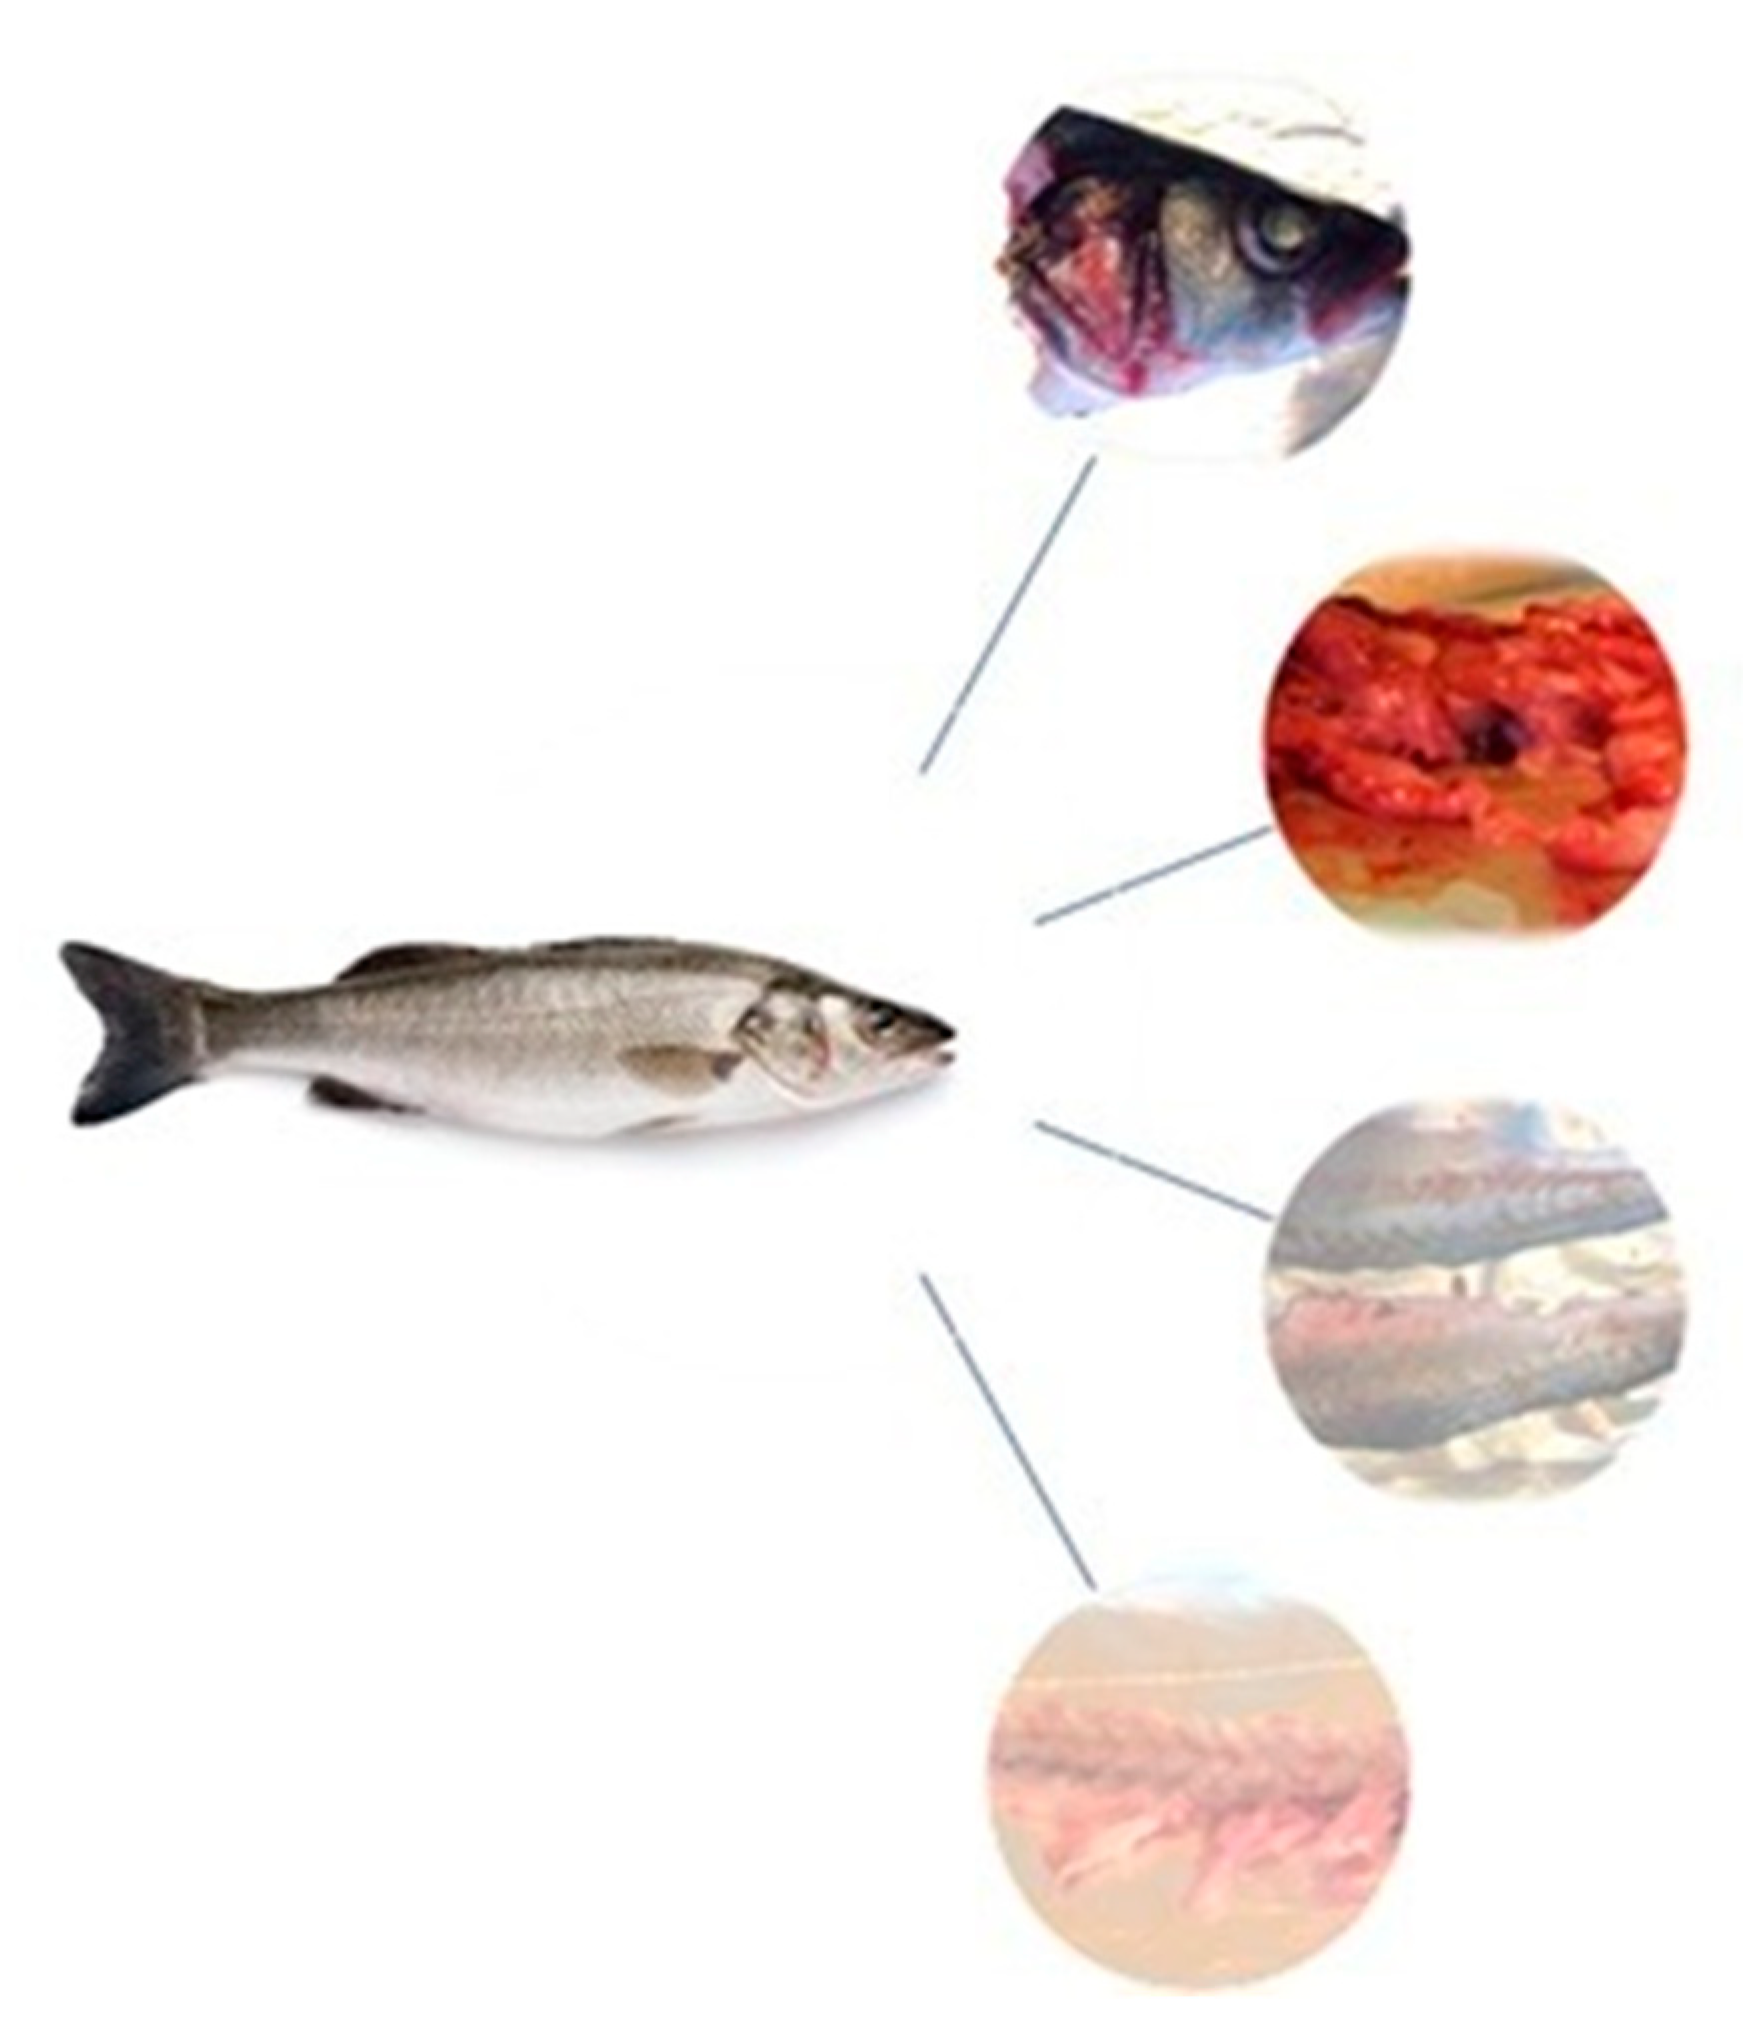
Glacial acetic acid and ethanol (99.8%) were obtained from Panreac (Castellar del Vallés, Barcelona, Spain). High-performance liquid chromatography (HPLC) grade acetonitrile (ACN), methanol (MeOH), and chloroform (CHCl3) (99%) were purchased from Merck (Darmstadt, Germany). Ethyl acetate (EtOAc) (HPLC-grade, >99.5%) was obtained from Alfa Aesar (Karlsruhe, Germany). Sodium carbonate (Na2CO3), sodium hydroxide (NaOH), and dimethyl sulfoxide (DMSO) were acquired from VWR (Saint-Prix, France). Sulfuric acid (96%) and hydrochloric acid (HCl) were obtained from Merck (Whitehouse Station, NJ, USA). Deionized water (resistivity >18 MΩ cm−1) was prepared in the laboratory using a Milli-Q SP Reagent Water System (Millipore Corporation, Bedford, MA, USA). ABTS (2,2′-Azino-Bis-3-Ethylbenzothiazoline-6-Sulfonic acid), Trolox (6-hydroxy-2,5,7,8-tetramethylchroman-2-carboxylic acid), AAPH (2,2′-azobis-(2-amidinopropane) dihydrochloride), and potassium persulfate (K2S2O8) were purchased from Sigma–Aldrich (Steinheim, Baden-Württemberg, Germany). Tris(hydroxymethyl) aminomethane, potassium phosphate monobasic (K2HPO4), potassium phosphate dibasic (K2HPO4), and sodium phosphate dibasic (Na2HPO4) were purchased from Merck (Darmstadt, Germany). Sodium fluorescein was obtained from Fluka Chemie AG (Bunds, Switzerland); 8–16% Mini-PROTEAN® TGX™ Precast gels, molecular weight marker Precision Plus Protein™ 5–250 kDa, and Coomassie brilliant blue R-250 were purchased to BioRad (Hercules, CA, USA). Dithiothreitol (DTT) was obtained from VWR (Leuven, Belgium).
Mycotoxins standards of AFB1 (≥98% purity), AFB2 (≥98%), AFG1 (≥98%), AFG2 (≥98%), ZEA (≥99%), OTA (≥98%), BEA (≥97%), ENA (≥95%), ENA1 (≥95%), ENB (≥95%), and ENB1 (≥95%) were supplied by Sigma (St. Louis, MO, USA). Individual stock solutions were prepared at 100 mg/L in methanol. All solutions were stored in the dark at −20 °C until LC-MS/MS-IT analysis.

2.2. Samples

Sea bass fresh fish samples were collected from a local supermarket and transported on ice. Side streams (heads, skin, bones, and viscera) were manually obtained from the sea bass fish samples (see Figure 1). Each side stream was homogenized using a grinder and then packaged and stored at −20 °C until analysis.

2.3. Ultrasound-Assisted Extraction

The ultrasound-assisted extractions were carried out using a Branson 5200 ultrasonic bath (Branson Ultrasonic Corp., CT, USA) under 20 KHz frequency and power of 100 W. For the extraction, two grams of each fish side stream sample were placed in a 100 mL beaker containing 30 mL of distilled water. Temperature and pH were adjusted in the parameters set. The beaker was then sealed with paraffin and placed in the ultrasonic bath. The extracts were placed in 15 mL tubes and preserved at −20 °C for further tests.

2.4. Determination of Total Protein and Molecular Size Distribution using SDS-PAGE Electrophoresis

The total protein content of the extracts obtained was determined using the Kjeldahl assay (AOAC) with some modifications [26]. Briefly, 2 g of sample, 3 g of potassium sulfate and 4–5 drops of copper sulfate were digested with 10 mL of sulfuric acid. Then, the digested sample was distillated with sodium hydroxide (40%) and distilled ammonia was collected in an Erlenmeyer flask with boric acid (4%). Finally, it was valorated with hydrochloric acid 0.1 N. Total protein content was calculated by multiplying by the conversion factor of 6.25.
SDS-PAGE electrophoresis was performed based on the method previously described by Marti-Quijal et al. [27]. After the precipitation of proteins with acetone (in a relation 1:4 (v/v) for sample:acetone) and subsequent centrifugation, the pellet was resuspended in distilled water. This suspension was mixed with the same volume of sample buffer and denaturalized at 95 °C for 5 min. Then, 10 µL were loaded on an 8–16% Mini-PROTEAN® TGX™ Precast gel and the electrophoresis was run at 120 V for the first 30 min and then at 80 V. In order to estimate the molecular weight, Precision Plus Protein™ 5–250 kDa was used. When electrophoresis finished, the gel was stained using 0.125% Coomassie brilliant blue R–250 and afterwards it was destained using a mixture of methanol (20%) and acetic acid (10%). For the analysis of the gel, the ImageJ software® was used. Sample buffer was prepared by mixing 62.5 mM Tris-HCl (pH 6.8), 20% glycerol, 2% SDS, 50 mM dithiothreitol, and 0.01% bromophenol blue. Running buffer was prepared by mixing glycine (192 mM), Trizma® base (25 mM), and SDS (0.1%).

2.5. Determination of Total Antioxidant Capacity

The ABTS assay was performed following the method described by Marti-Quijal et al. [27]. ABTS radical cation was generated by reacting 25 mL of ABTS (7 mM) with 440 µL of potassium persulfate (140 mM). The mixture was incubated in dark conditions for 12–16 h at room temperature. Prior to assay, ABTS radical cation was diluted with ethanol 1:100 to obtain an absorbance of 0.70 (±0.02) at 734 nm. The standard curve of prepared Trolox (5 mM) was constructed at different concentrations (0, 50, 100, 150, 200, 250, 300 µM) employing ethanol. The assay was performed with 2 mL of ABTS+ working solution as the initial point of reaction (A0). Then, 0.1 mL of diluted sample extracts or Trolox standards were added and the absorbance was determined as (Af). The initial absorbance (A0) and the final absorbance (Af) (after 3 min) were read using spectrophotometry at 734 nm in a Perkin-Elmer UV/Vis Lambda 2 spectrophotometer (Perkin-Elmer, Rodgau-Jügesheim, Germany). The percentage of inhibition was calculated as:
% inhibition = (1 − (Af/A0)) × 100
The antioxidant activity was determined using the Trolox standard curve and expressed as µM trolox equivalents (TE).
Oxygen radical absorbance capacity (ORAC) was determined according to the method previously detailed by De la Fuente et al. [28], with some modifications. The reaction was carried out in 75 mM phosphate buffer (pH 7), for a final reaction volume of 125 µL. Fifty microliters of sample, loaded onto a 96-well microplate, were mixed with 50 µL of fluorescein, and the mixture was preincubated at 37 °C for 10 min. Then, 25 µL of AAPH solution was added rapidly, using micropipette multimode. The plates were immediately placed in the reader Multilabel Plate Counter VICTOR3 1420 (Perkin-Elmer, Turku, Finland) and the fluorescence recorded every minute for 60 min with an excitation wavelength of 485 nm and emission wavelength of 528 nm. The phosphate buffer (as blank) and the Trolox (as standard) were used in this assay. Each extract was analyzed in five replicates, and the differences in areas under the fluorescein decay curve (AUC) between the blank and the sample were used to calculate the antioxidant activity.

2.6. Determination of Mycotoxins

Selective methods are required for quantitative mycotoxins extraction from the original food matrix. The mycotoxins extraction from the sample is a critical step and some important parameters can be optimized, such as the nature of the extraction solvent, temperature, time, and purification steps. For multiple mycotoxin analysis, good recoveries are obtained with different solvents such as acetonitrile (AcN), or a mixture of AcN/methanol (MeOH), usually using acidic conditions. There is not to be expected an important extraction of mycotoxins with only water, due to their low solubility in this solvent. For instance, in this work, our purpose for using water was to extract the high-added-value compounds (protein and antioxidants) from sea bass side streams, but not the mycotoxins.
In a previous work carried out in our laboratory, UAE resulted to be a good procedure for mycotoxins extraction, being an effective tool for emerging mycotoxins extraction after applying ultrasound (20 kHz, 100 W, 30 min, 30 °C) using AcN as an extraction solvent, obtaining mycotoxin recoveries ranging from 78 to 91% [21]. In the present work, water was tested as a solvent to extract mycotoxins from the sea bass side streams, in the same conditions of time and temperature detailed above. For this, recovery experiments were performed for 11 mycotoxins (AFB1, AFB2, AFG1, AFG2, OTA, ZEA, ENNA, ENNA1, ENNB, ENNB1, and BEA) comparing absolute peak areas of each analyte in a viscera blank sample spiked before the extraction and absolute peak areas of each analyte spiked after the procedure. However, in this case, the recovery percentages obtained after UAE treatment were lower than 25%, showing the low affinity of water to extract mycotoxins from the sea bass side streams.
After UAE extraction, dispersive liquid–liquid microextraction (DLLME) was used to preconcentrate and purify mycotoxins in the sea bass side streams extracts before the determination.

2.6.1. Dispersive Liquid–Liquid Microextraction Method (DLLME)

Mycotoxins were extracted from fish side streams aqueous extracts obtained after UAE treatment by employing the DLLME procedure according to Pallarés et al. [29]. The method was readjusted to the sample volume available, 1 mL in this case. For this, 1 mL of the extract was placed with 0.2 g of NaCl in a 15 mL conical tube and shaken for 1 min. Next, 523 μL of the combination of dispersant and extractant solvents AcN/EtOAc prepared in the proportion (9.50 mL/6.20 mL) were added. After shaking for 1 min, a cloudy solution of the three components was formed. The mixture was centrifuged for 5 min at 4000× rpm to allow the separation of the phases; the organic phase separated at the top of the tube was recovered and placed in another tube. Then, in a second step, 523 μL of the dispersant and extractant solvents mixture MeOH/CHCL3 (prepared with 9.50 mL/6.20 mL, respectively) were added to the remaining residue. Next, the mixture was shaken and centrifuged. After centrifugation, the organic phase, located in this case at the bottom of the tube, was separated and placed with the organic phase separated before. Finally, both recovered organic phases were evaporated together to near dryness under a nitrogen stream using a Turvovap LV Evaporator (Zymark, Hoptikinton, MA, USA). The dried residue obtained was reconstituted with 500 µL of 20 mM ammonium formate (MeOH/AcN) (50/50 v/v) and filtered through a 13 mm/0.22 μm nylon filter prior to the determination by LC-MS/MS-IT.

2.6.2. LC-MS/MS-IT Identification and Determination of Mycotoxins

Mycotoxins determination was carried out using an Agilent 1200 chromatograph (Agilent Technologies, Palo Alto, CA, USA) equipped with 3200 QTRAP® (Applied Biosystems, AB Sciex, Foster City, CA, USA) with Turbo Ion Spray (ESI) electrospray ionization. The QTRAP analyzer combines a fully functional triple quadrupole and a linear ion trap mass spectrometer. A Gemini-NX column C18 (Phenomenex, 150 mm × 4.6 mm, 5 particle size) preceded by a guard column was employed. The injection volume was fixed at 20 µL, the flow rate at 0.25 mL/min, and the oven temperature was 40 °C.
Mobile phases consisted of 5 mM ammonium formate and 0.1% formic acid water (mobile phase A) and 5 mM ammonium formate and 0.1% formic acid methanol (mobile phase B). The chromatographic gradient started with a proportion of 0% for mobile phase B, increasing to 100% in 10 min, then decreased to 80% in 5 min, and finally decreased to 70% in 2 min. Then, in 6 min, the column was cleaned and readjusted to the initial conditions and equilibrated for 7 min. Turbo Ion Spray operated in a positive ionization mode (ESI+). Nitrogen served as nebulizer and collision gas. To perform the analysis, the following parameters were set: ion spray voltage at 5500 V; curtain gas, 20 arbitrary units; GS1 and GS2, 50 and 50 psi, respectively; probe temperature (TEM) at 450 °C. The spectrometric parameters (collision energy, cell exit potential, and declustering potential) and the fragments monitored (quantification and confirmation ions) are shown in Table 1.

2.6.3. Method Validation

The DLLME method was characterized for the analysis of AFs, OTA, ZEA, ENNs, and BEA in sea bass side streams according to the Commission Decision [30] (Table 2). The analytical parameters determined for method validation were recoveries, repeatability (intraday precision), reproducibility (interday precision), matrix effects, linearity, limit of detection (LOD), and limit of quantification (LOQ). For recoveries at level of 10×LOQ, the intraday and interday precision were between 68 and 120%. Matrix effects revealed that there was no significant signal suppression/enhancement (SSE) for the analyzed mycotoxins with SSE values ranging from 65 to 105%. The LODs and LOQs were obtained using the criterion for both transitions predetermined per each analyzed mycotoxin of S/N ≥ 3 for calculating LOD and S/N ≥ 10 for LOQ. LODs values ranged from 0.05 to 5 µg/L and LOQs from 0.2 to 17 µg/L. Regarding the linearity and regression coefficients obtained, all were higher than 0.990.

2.7. Response Surface Methodology Design and Statistical Analysis

The UAE conditions were optimized using the response surface methodology: Box–Behnken design with two central points. Treatment time (X1: 0.5–30 min), pH (X2: 5.5–8.5), and temperature (X3: 20–50 °C) parameters were optimized. The responses studied were total protein content and antioxidant capacity (ORAC and ABTS assays). Fifteen different experiments were established by using the minimum, central, and maximum value for each parameter. Moreover, the central point was duplicated in order to check the variability and reproducibility. The different combinations are shown in Table 3.
In order to obtain the significant differences (p < 0.05) between the results, an analysis of variance (ANOVA) followed by least significant differences (LSD) test was performed. All the statistical analysis were performed using Statgraphics Centurion XVI® (Statpoint Technologies, Inc., The Plains, VA, USA). A p < 0.05 was considered significative.

3. Results and Discussion

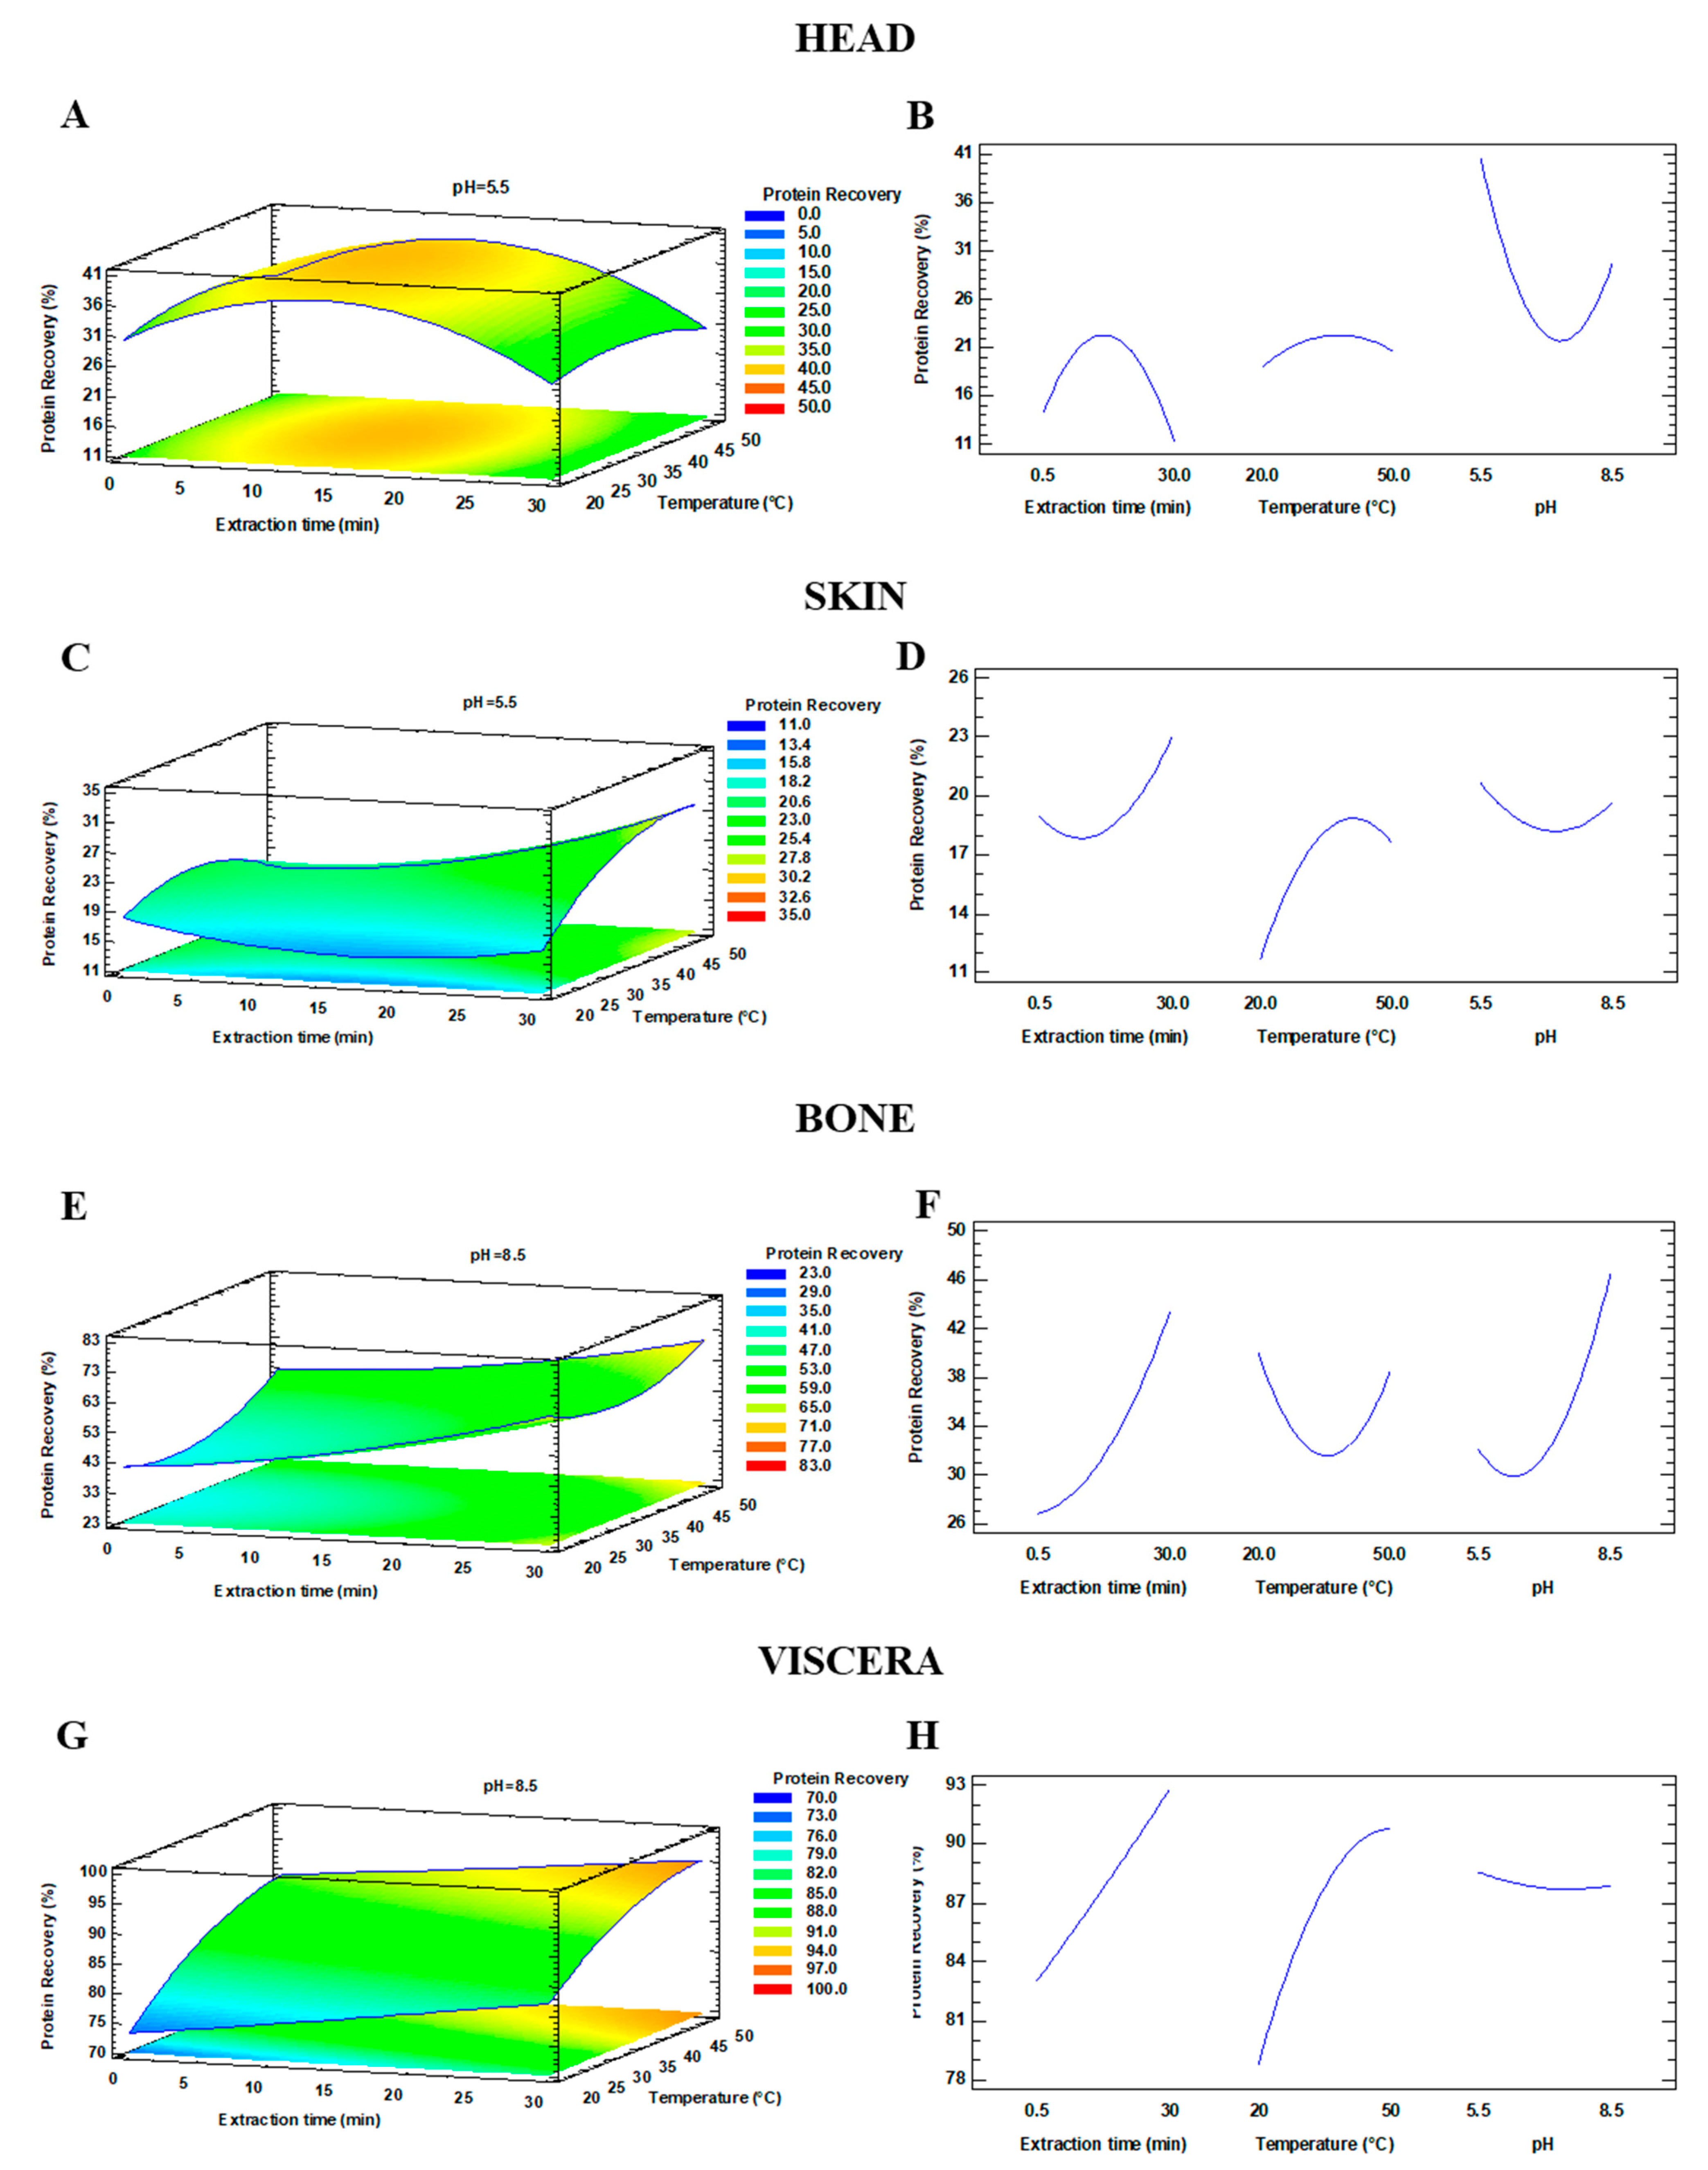
3.1. Protein Extraction

In order to determine the percentage of recovered proteins from the different sea bass side streams after applying UAE extraction, the Kjeldahl method was used. The results are shown in Table 4. It was found that the highest percentage of proteins recovered from head extracts (39.89%), which was observed after 15.25 min of extraction at 35 °C and 5.5 pH, while 31.68% of proteins were recovered from skin extracts after 30 min of extraction at 35 °C and pH 7. Additionally, the bone extracts yielded 75.07% of proteins after 30 min of UAE at 50 °C and pH of 8.5. Lastly, 30 min of ultrasound at 50 °C and a pH 5.5, allowed the extraction of 99.37% of proteins from the viscera extracts.
Similar protein recoveries were obtained by Tian et al. [31]. These authors observed protein yields that reached 62.60% when they evaluated protein recovery from tilapia fillets assisted by UAE combined with alkaline conditions. Moreover, higher protein yields were obtained by Álvarez et al. [11] under UAE + alkaline conditions, with a recovery ≈95% of total protein from mackerel byproducts. In our study, a similar percentage of protein recovery was observed in viscera extracts (99.37%). In general, protein recovery reported in the literature by other authors varies in a range between 42% and 90%. Moreover, data available in the literature revealed that alkaline solubilization usually results in higher protein recoveries than acidic conditions [32]. In our work, proteins recovery optimal pH differed according to the side stream studied.
Figure 2A,C,E,G represents the estimated response surface by plotting the protein recoveries from sea bass head, skin, bone, and viscera versus the extraction time, temperature, and a fixed pH, for each side stream, while Figure 2B,D,F,H represents the influence of the studied parameters on the protein recovery. As can be observed in Figure 2A,B, under the tested treatment conditions, the protein recovery from head extracts increased with the elapse of extraction time from 0.5 to 15.25 min and increased temperature (from 20 to 35 °C), respectively. However, when both extraction time and temperature increased up to 30 min and 50 °C, the protein recovery reached a plateau and slowly decreased. Nevertheless, the effects of these parameters are not statistically significant (p > 0.05). On the other hand, the pH significantly (p < 0.05) affected the recovery of proteins, where a lower pH lead to a higher recovery (p = 0.0091). According to RSM, the optimal conditions for the recovery of proteins (40.65%) from head extracts are 15 min of UAE at 35 °C and 5.5 pH.
As shown in Figure 2C,D, increasing extraction times from 15 to 30 min with simultaneous increase of temperature up to 35 °C, progressively increased the recovery of proteins from skin. However, none of the studied parameters had a statistically significant impact (p > 0.05) on the recovery of proteins from skin extracts. The optimal conditions generated by RSM were extraction time 30 min, temperature 37 °C, pH 5.5 with a 28.13% protein recovery.
For the bone and viscera (Figure 2E–H), the percentage of protein recovery significantly increased as the extraction time increased (p ≤ 0.01). Higher pHs had a positive effect on the recovery of protein from bone (p = 0.0125). On the other hand, higher temperatures strongly affected the recovery from the viscera extracts (p = 0.0072). Consequently, under the optimal conditions of UAE (30 min, 50 °C, and 8.5 pH), 70.25% of proteins were recovered from bone extracts. Likewise, 96.07% of proteins from viscera extracts were recovered under optimal UAE (30 min, 50 °C, pH 5.5).

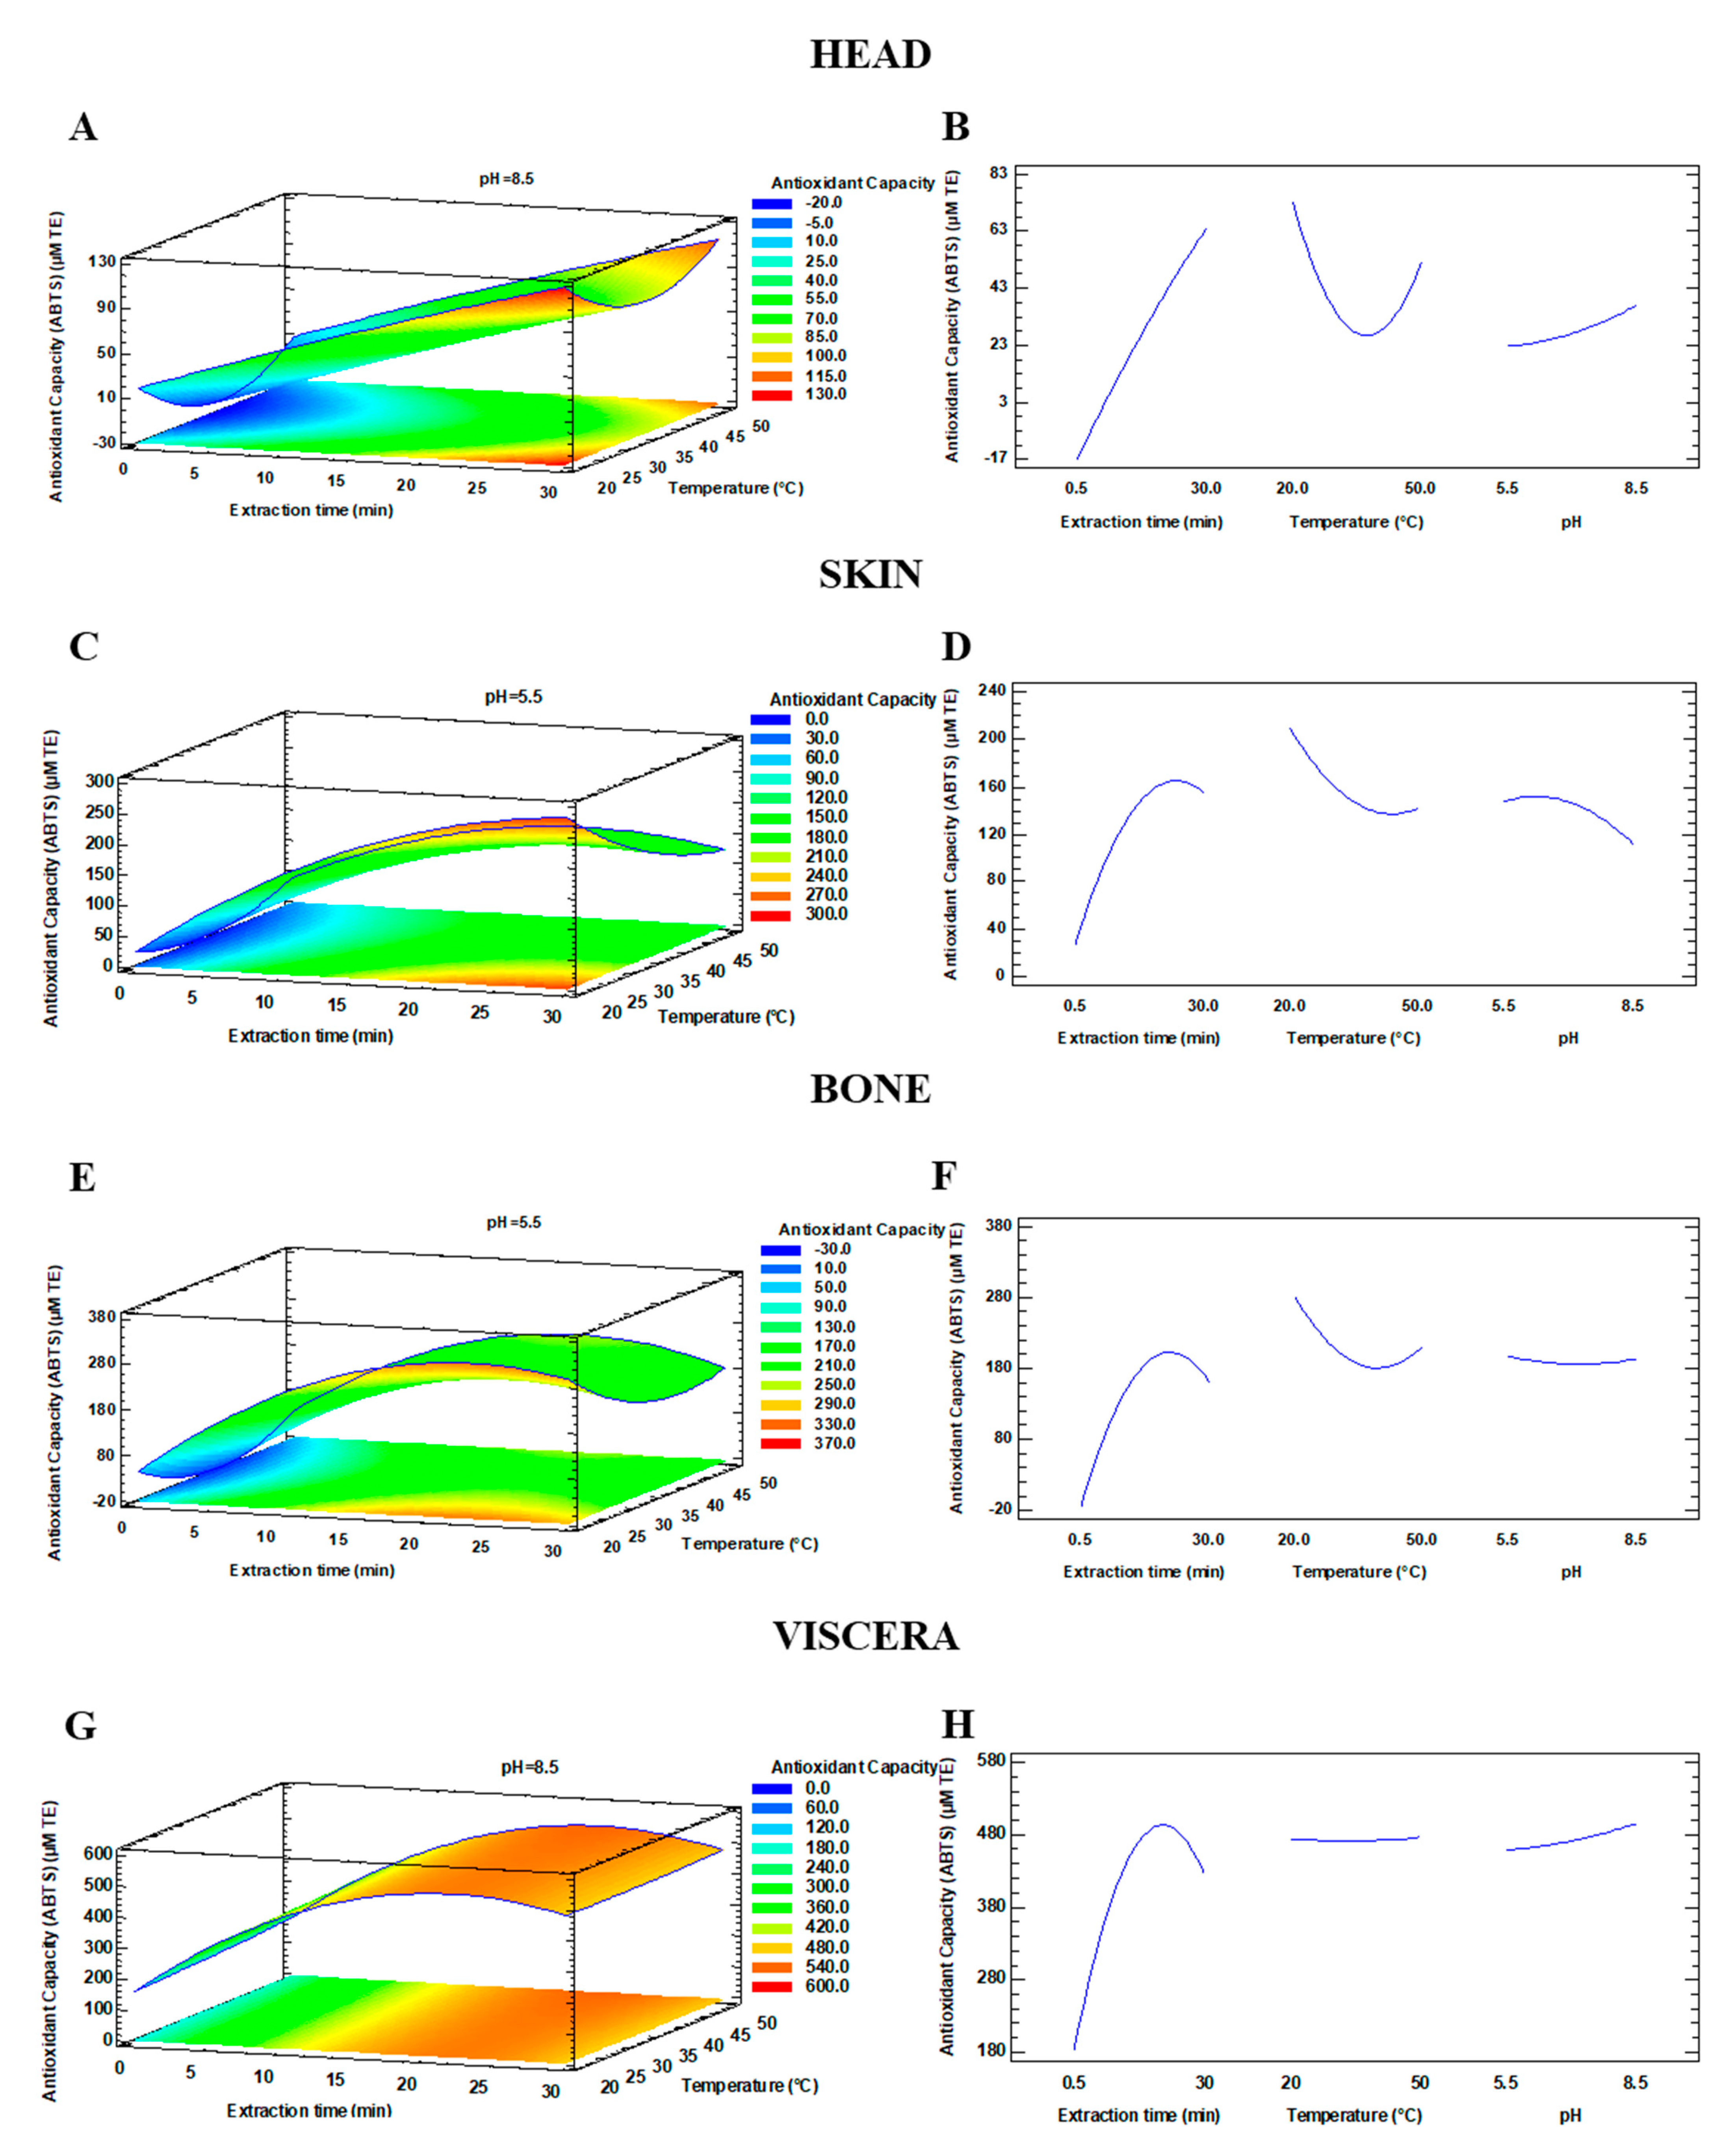
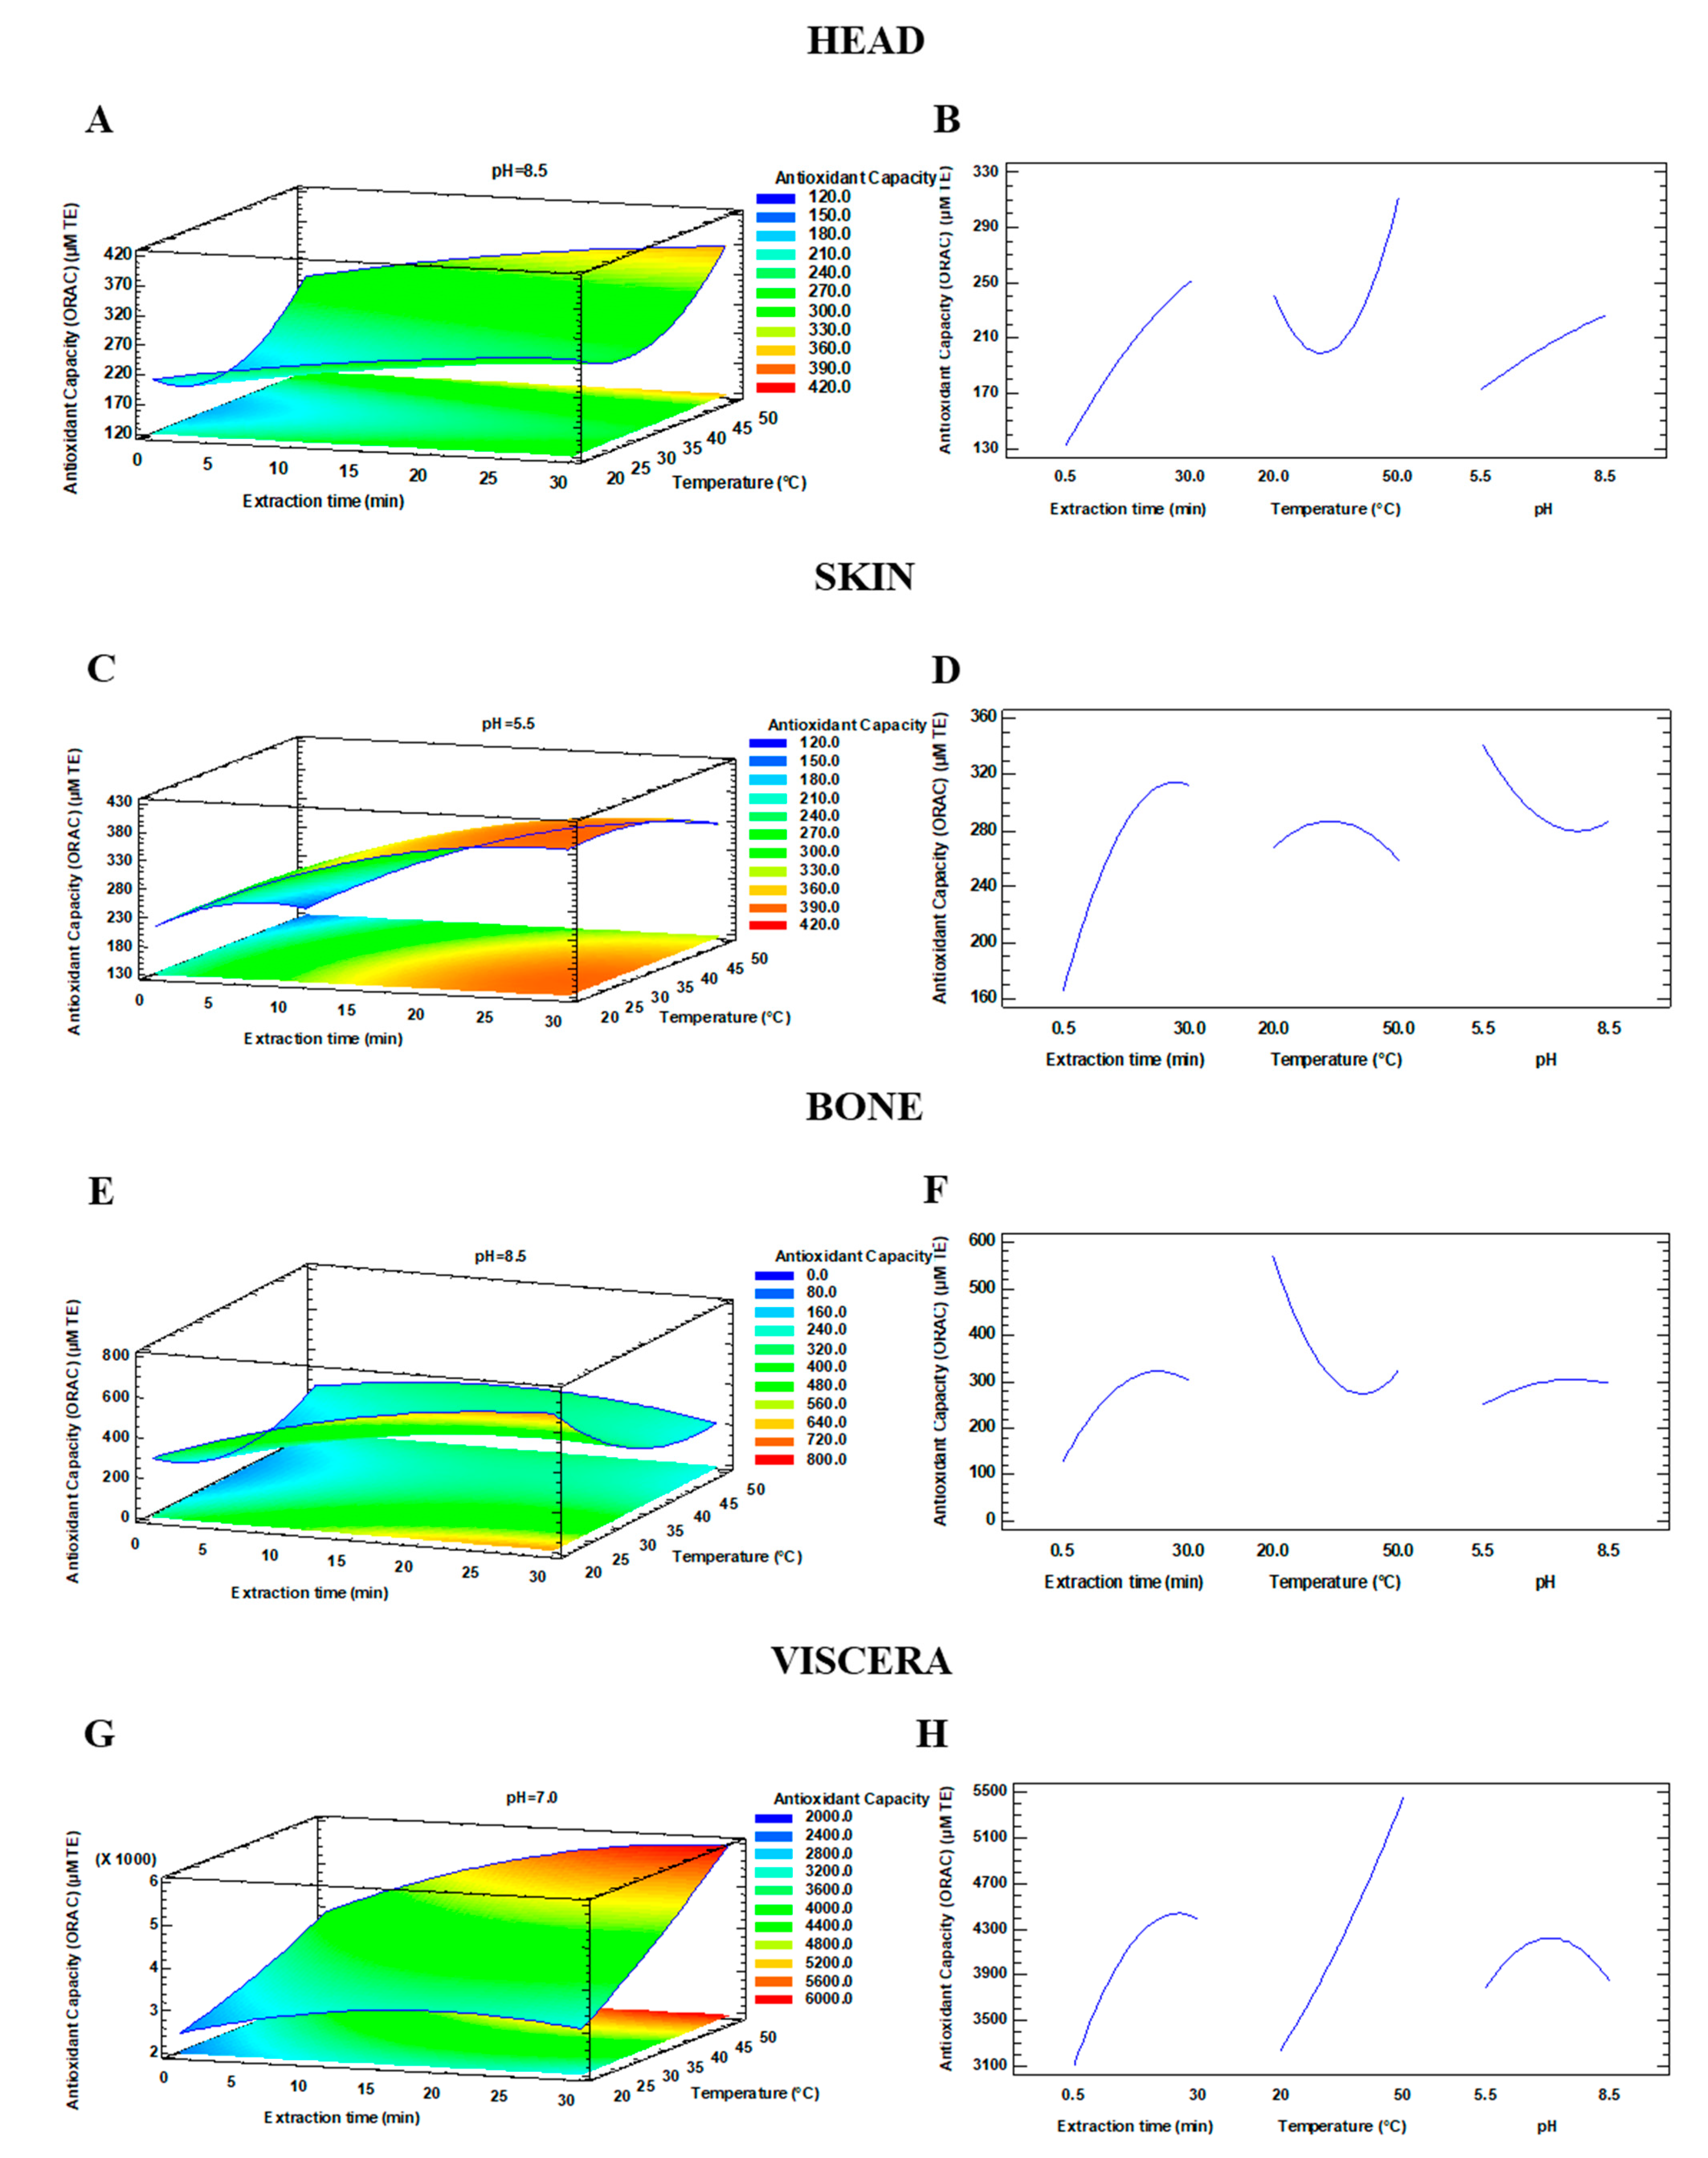
3.2. Determination of Antioxidant Capacity

The ABTS values for each extraction are shown in Table 5. The antioxidant activity from the head extracts ranged from 9.37 to 129.38 µM TE, obtaining the highest values after 30 min of UAE extraction at 20 °C and pH 8.5. The highest activity observed from the skin extracts was found after UAE at 30 min, 20 °C, and pH 5.5, whereas for the bone extracts, the values ranged from 28.94 to 276.23 µM TE, achieving the maximum value at 30 min, 20 °C, and pH 5.5. Lastly, the uppermost activity (516.02 µM TE) from the viscera extracts was obtained after applying UAE 30 min, at 50 °C, and pH 8.5.
Figure 3A,B shows the main effects observed for the antioxidant capacity of the extracts obtained from head at different temperatures and extraction times at a constant pH of 8.5. It is clearly observed how increased extraction times significantly increased the antioxidant capacity of the extracts (p = 0.0006). Besides, neither the pH nor the temperature affected antioxidant capacity (p = 0.2855 and p = 0.1469, respectively). Regarding the skin (Figure 3C,D), all the studied parameters affected the antioxidant capacity of the extracts with different degrees, obtaining p values of 0.0001, 0.0034, and 0.0045 for extraction time, temperature, and pH, respectively. As shown in Figure 3E–H for both bone and viscera, a significant increase in the antioxidant activity was observed with augmented extraction times (p < 0.001). On the other hand, as in the case of head, no significant effect was observed regarding the temperature and pH. Accordingly, the optimal conditions for the antioxidant activity of the extracts obtained from the studied side streams measured with ABTS assay are shown in Table 6.
The effects of the extraction conditions on the antioxidant activity determined by ORAC assay are shown in Table 7. As can be expected, the highest ORAC values were found after 30 min of UAE in the four studied side streams, 20 °C for skin and bone, and 50 °C for head and viscera, obtaining the maximum ORAC values at pH = 5.5 for head and skin and pH = 8.5 for bone and viscera.
Three-dimensional response surface plots and the graphs of influence of the studied parameters are presented in Figure 4. As shown in Figure 4A,B, the extraction time is the only parameter that significantly increased the antioxidant activity (p = 0.157) for head. Similar trends were also observed for skin, where only the extraction time had a significant positive impact on the antioxidant activity (p = 0.0012). On the other hand, concerning the bone and viscera side streams, the pH did not have any significant impact (p > 0.05). For the bone, the antioxidant activity was enhanced as extraction time increased and temperature decreased (p = 0.008 and p = 0.0016, respectively). As for the viscera, the antioxidant activity was strongly affected by the temperature. The increase of temperature and extraction time resulted in higher antioxidant activity (p = 0.0000 and p = 0.0008, respectively). The optimal conditions for ORAC assay and their theoretical response are shown in Table 8.
The results obtained showed that sea bass side streams extracts are a great source of compounds with antioxidant potential. Regarding the information in the available literature about the antioxidant capacity of fish side streams, Franco et al. [33] studied the application of aqueous and hydroethanolic mixtures assisted by pulsed electric fields (PEF) to recover antioxidants of sea bream and sea bass residues (gills, bones, and head). These authors found the highest antioxidant values after PEF-assisted extraction in aqueous media. They also observed that among the different side streams studied, gill extracts showed the highest antioxidant capacity, obtaining DPPH values in sea bass gills ranging from 105.93 to 313.87 µg Trolox/g sample. In the present study, viscera was the side stream with the highest antioxidant capacity, with values of ABTS and ORAC up to 516.02 µM TE and 5794.64 µM TE, respectively. Moreover, our results are in close agreement to those obtained by Franco et al. [33], who reported an antioxidant activity after using aqueous media, thus suggesting that substances with higher polarity can have more antioxidant capacity.
In other study, Nasyiruddin et al. [34] investigated the effect of low-frequency ultrasound treatment at different times (6–14 min) on the properties of silver carp myofibrillar protein and observed a significant effect on antioxidant activity (DPPH inhibition from 16.07 to 36.51% and ABTS inhibition from 14.17 to 22.58%), obtaining the highest antioxidant activity after the UAE treatment at 12 min.
On the other hand, other treatments such as mechanical separation resulted in lower antioxidant capacity (<50 µg Trolox/g sample) in sea bass, gilthead sea bream, and rainbow trout samples [35].
For instance, ultrasound could improve the extraction of antioxidant compounds by two mechanisms: i) the release of antioxidant compounds from inside of cells and ii) the induction of proteolysis, producing antioxidant peptides [33,36].
The higher antioxidant activity observed in the present study for sea bass viscera compared with the other side streams (head, bone, and skin) could be due to its high content of peptides with low molecular weight. In this sense, the antioxidant activity of peptides increases as their molecular weight decreases [37].

3.3. Optimization and Verification of Predictive Responses

Based on the interaction of the three critical parameters (extraction time, temperature, and pH), the UAE process was optimized in order to obtain the highest yield of protein recovery and antioxidant activity (ABTS and ORAC values). The optimal UAE conditions obtained are presented in Table 9. Furthermore, in order to confirm the accuracy and the reliability of the optimal conditions and to validate the adequacy of the model, additional experiments were carried out under the optimal conditions. The predicted and the experimental values for the different responses are shown in Table 9. As it can be seen, the experimental values were close to the expected values, confirming the validity of the model. Thus, this model has high accuracy in predicting the experimental optimal conditions, and it can be greatly applicable and operable.

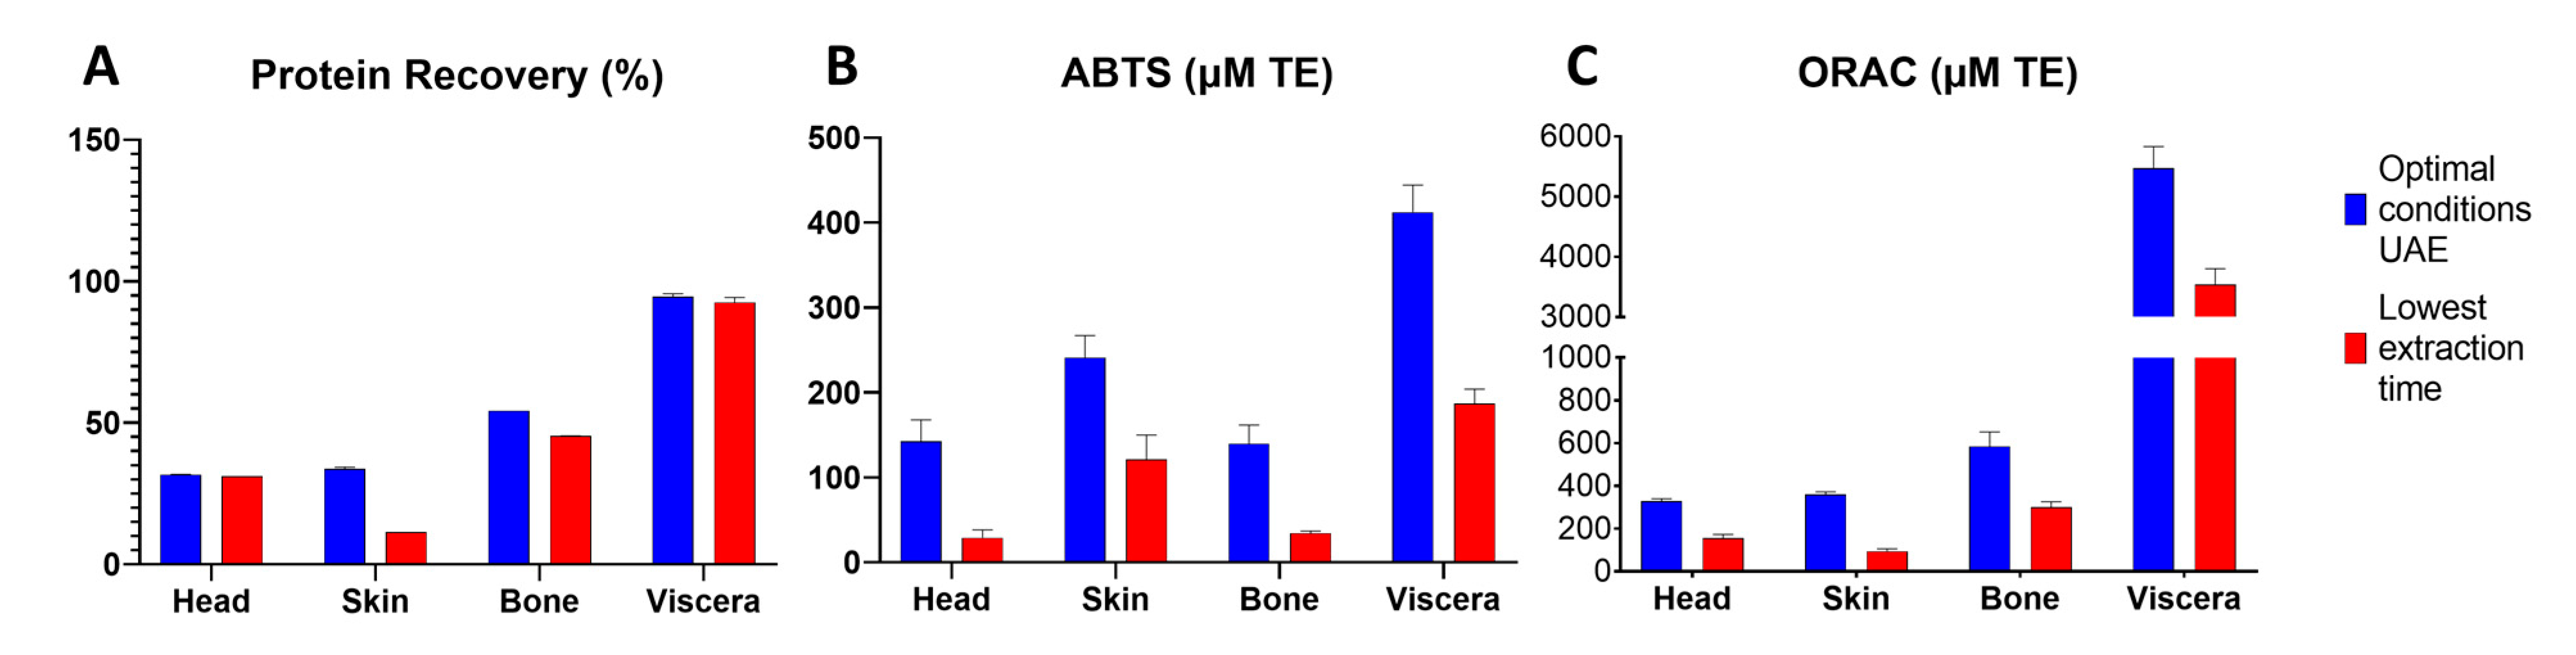
3.4. Comparison of Optimal Extraction Conditions with the Lowest UAE Treatment

In addition, the optimal results obtained in this study were compared to those obtained with the lowest extraction time (0.5 min) of UAE at the optimal temperature and pH of each side stream (Figure 5). As can be seen in the table, the percentage of protein recovered was very similar for head and viscera side streams, compared to the optimal condition for time of extraction with the lowest one (0.5 min). However, a higher protein recovery was obtained for skin and bone, reaching 33.7 and 54.2%, respectively, under the optimal condition. The antioxidant activity obtained (measured with ABTS and ORAC values) was higher for all side streams under the optimal condition. Moreover, in general, better results were observed by increasing the treatment time.

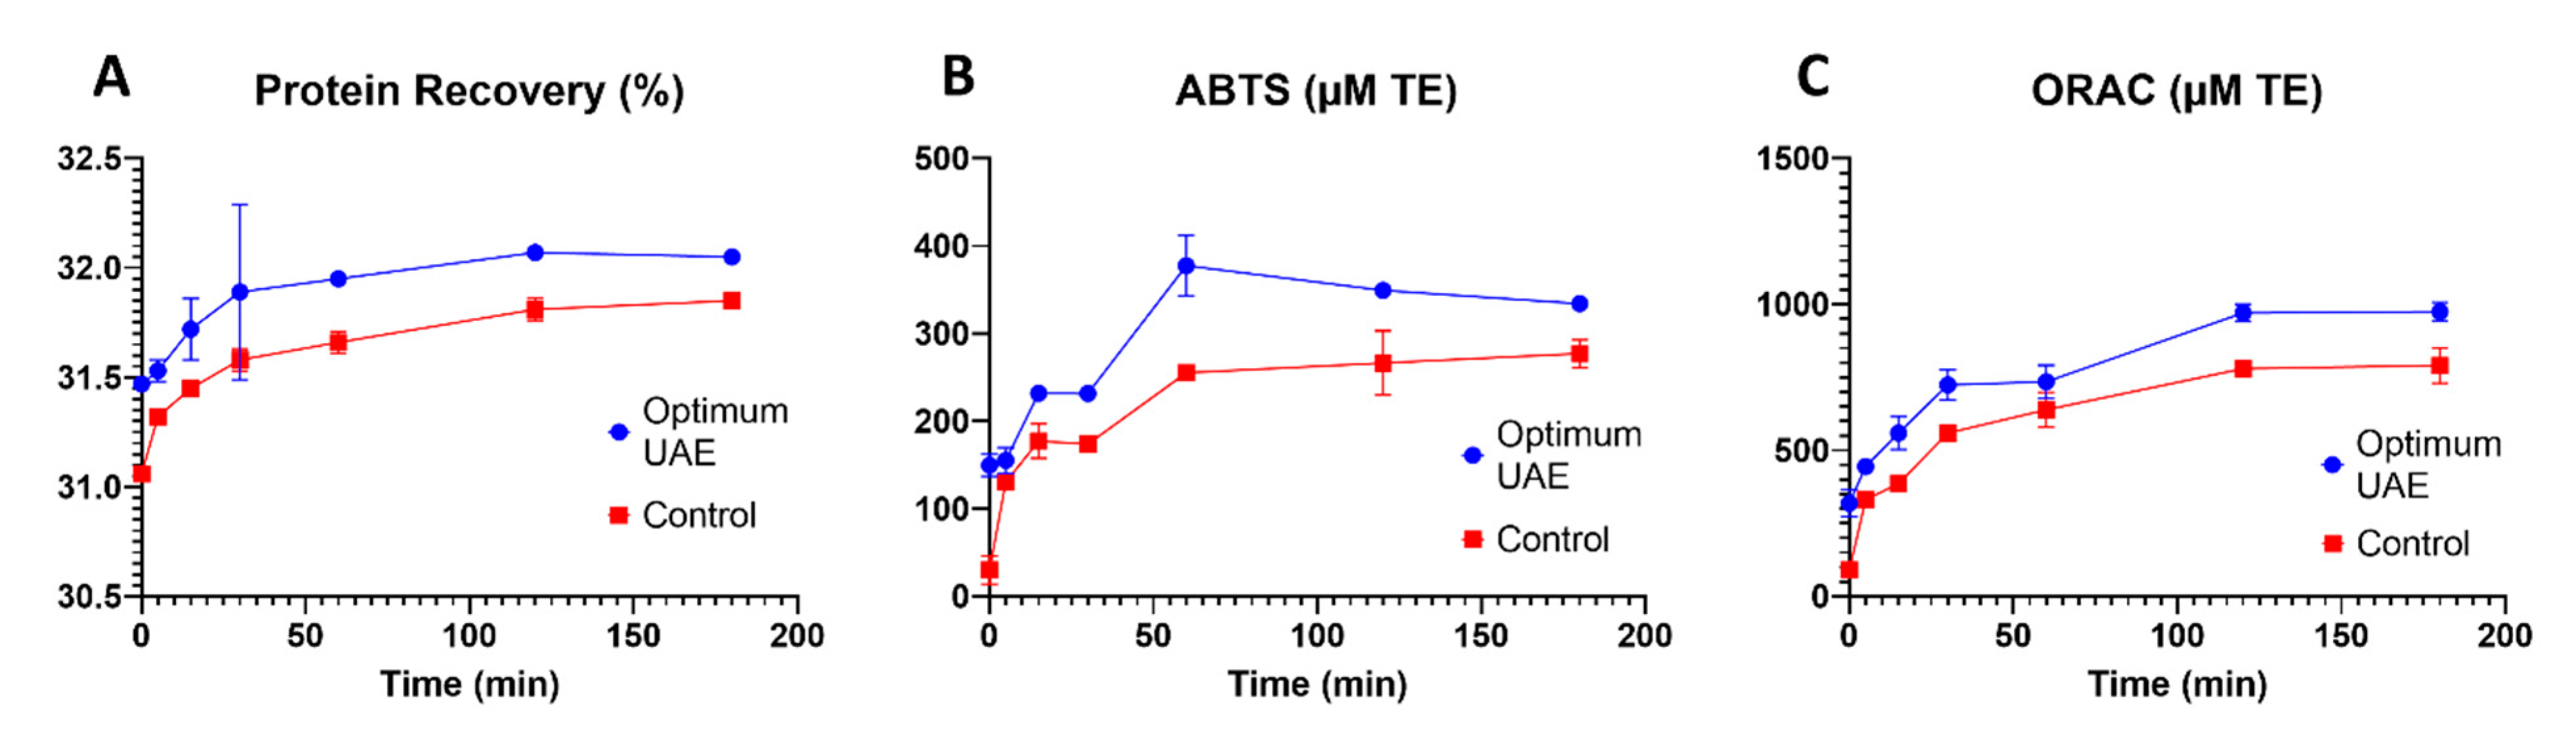
3.5. Comparison of Optimal Conditions with Conventional Extraction

Moreover, the results obtained after applying the optimal conditions were also compared to those obtained after using a conventional treatment (stirring from 0 to 180 min) in head side streams extracts (as a model matrix). As can be observed in Figure 6, the protein recovery was very similar after employing both treatments, around 32%. However, higher values of ABTS and ORAC were reached under UAE optimal conditions, with levels ranging from 149.64 to 377.54 µM TE and from 319.29 to 974.52 µM TE, respectively. In this sense, UAE treatment could improve the extraction of antioxidant compounds.

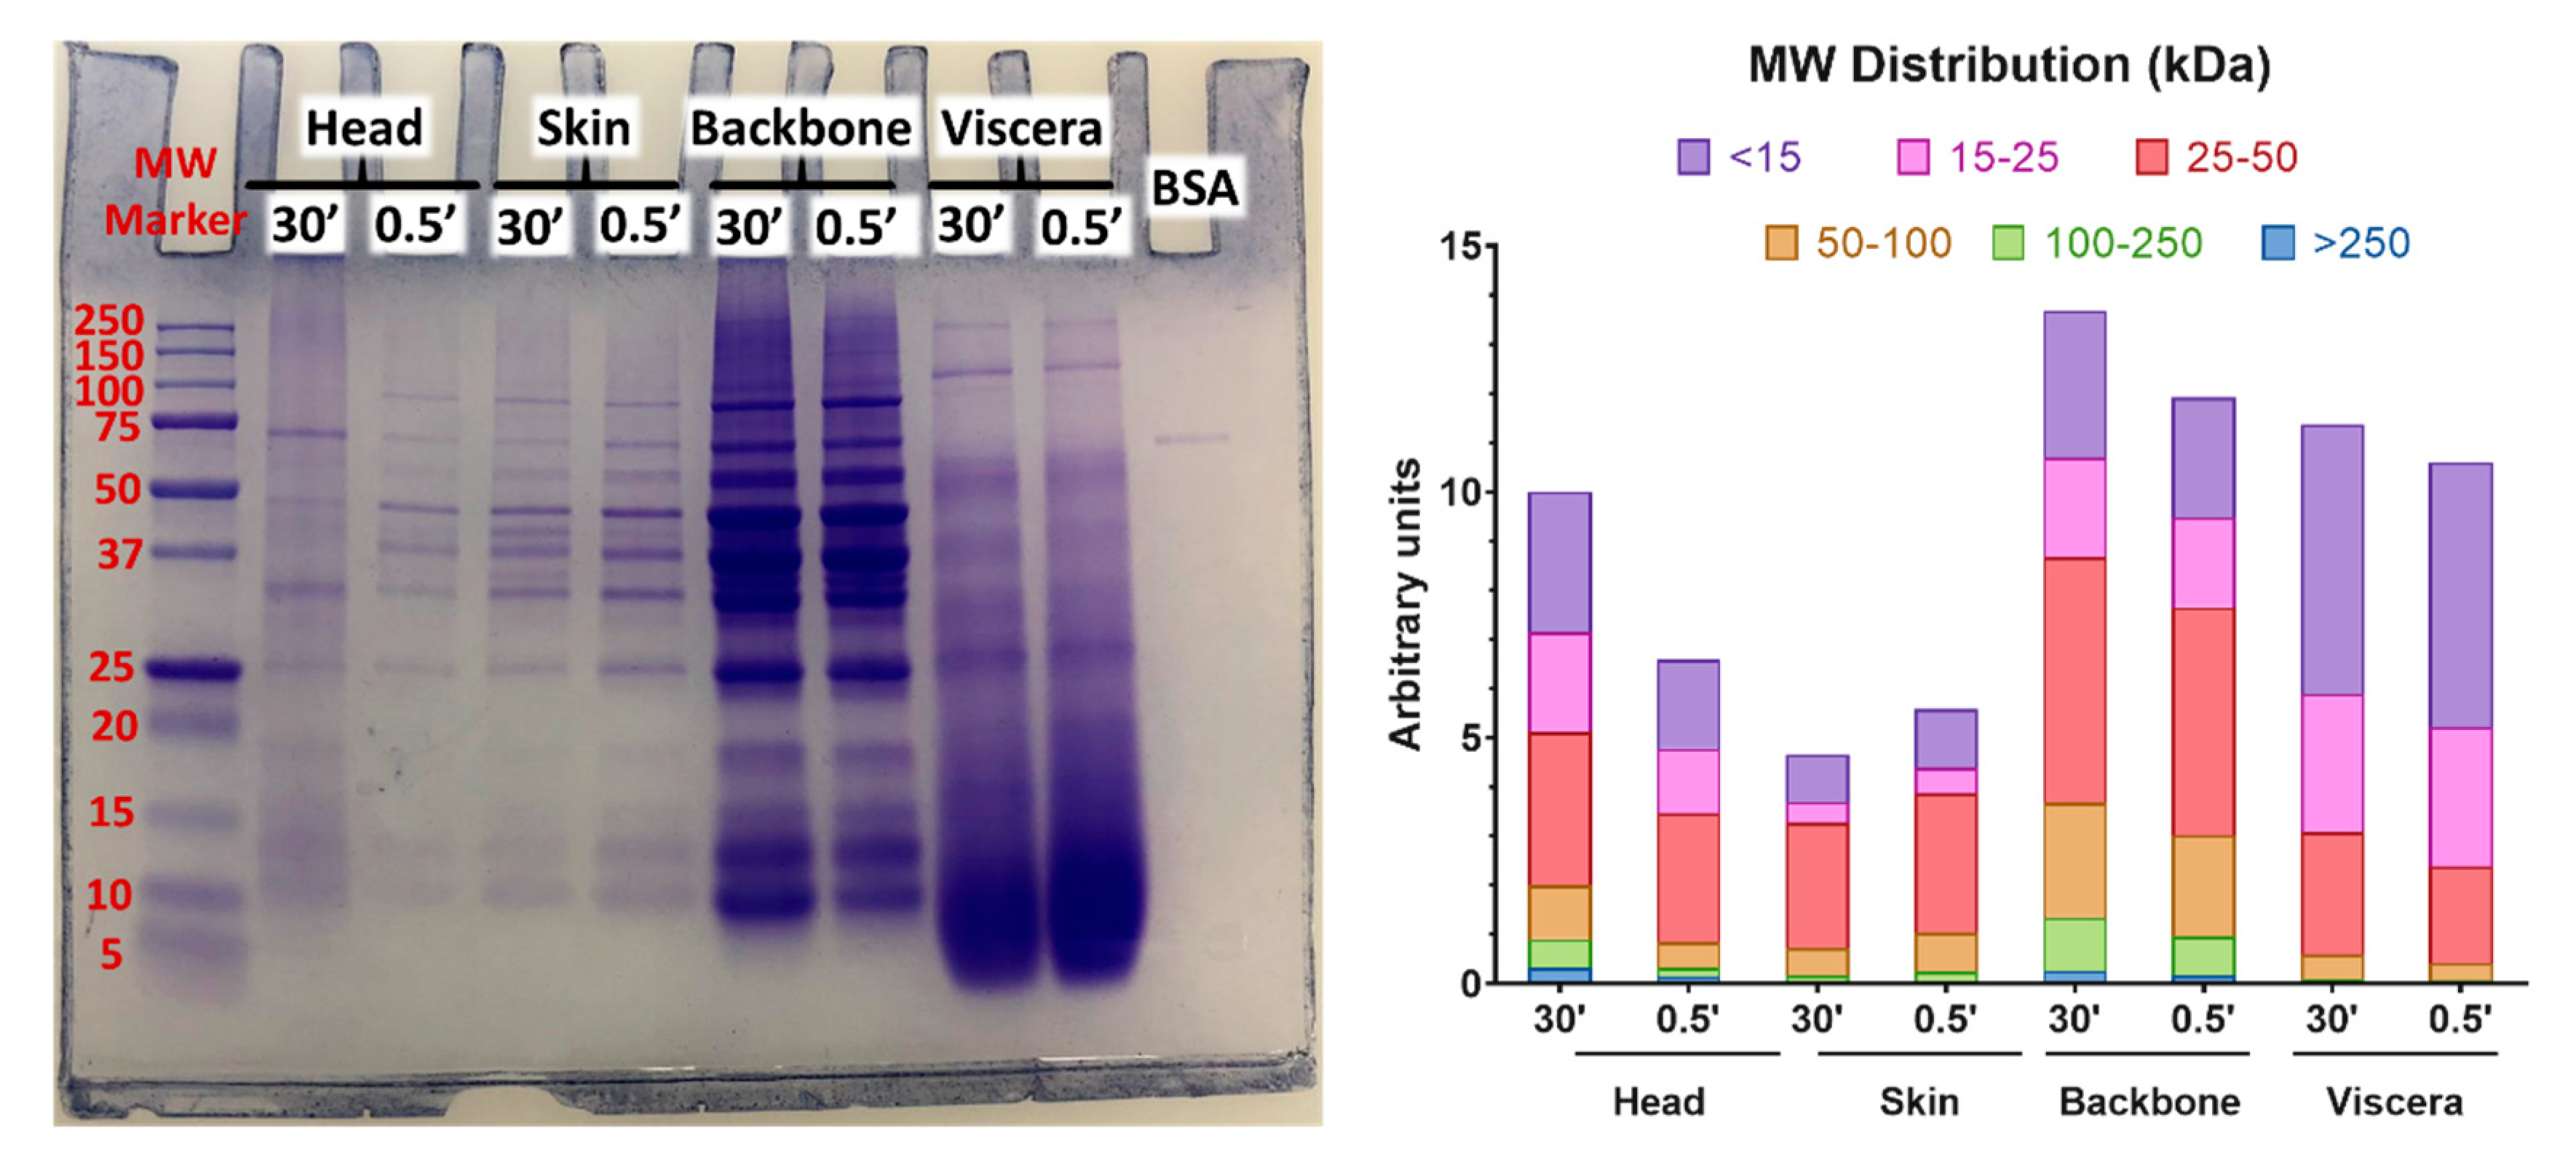
3.6. SDS-PAGE Electrophoresis

The results obtained after performing the electrophoresis assays revealed a higher abundance of proteins in the extract obtained under the optimal UAE conditions (30 min) compared to lowest UAE (0.5 min), except for skin side streams, which presented a higher abundance in the lowest treatment (Figure 7).
Moreover, different protein profiles were observed between the different side streams (head, skin, backbone, and viscera). The higher protein concentrations were detected in backbone and viscera extracts. In general, for all side streams the main part of proteins extracted had a low molecular weight, ranging from <15 to 50 kDa, with most presenting in the molecular weight band of 25–50 kDa. However, the size of the main part of proteins was <15 kDa in viscera. This fact can be attributed to a higher protein hydrolysis in this specific side stream. It should be highlighted that in head and backbone extracts, proteins of high molecular weight (100–250 kDa) were also identified.
Similar results were also reported by Álvarez et al. [11]. These authors analyzed the protein size from mackerel side streams extracts obtained after ultrasound-alkaline-assisted extraction. They observed a low content of large proteins (100–500 kDa) and a high content of proteins ranging from 10 to 40 kDa. This fact could suggest that some hydrolytic process of large proteins is taking place during UAE. In this line, Kim et al. [38] also reported changes in the collagen fiber structure and its breakdown after ultrasound treatment. As it is known, proteins or hydrolysates of low molecular weight are more digestible [39].

3.7. Mycotoxin Presence in Sea Bass Side Streams

The analyzed mycotoxins (AFB1, AFB2, AFG1, AFG2, OTA, ZEA, ENNA, ENNA1, ENNB, ENNB1, and BEA) were detected below the LODs in sea bass side stream (head, skin, bones, and viscera) extracts obtained after applying UAE conditions under the studied variables. This confirmed that the use of aqueous media combined with UAE did not facilitate the recovery of mycotoxins from the sea bass side streams extracts evaluated in this study.
Contrary to our results, Deng et al. [40] observed the presence of AFB1, T-2, and OTA at levels of 0.58–0.89, 0.55–1.34, and 0.36–1.51 µg/kg, respectively, in dried seafood after ultrasound treatment for 60 min at 20 °C. However, these authors employed an acetonitrile/water mixture (85/15, v/v) as an extraction solvent. It is important to point out the importance of the solvent employed in mycotoxins recovery.

4. Conclusions

UAE technology is presented here as a good strategy to obtain high-added-value compounds and to avoid the presence of mycotoxins from sea bass side streams extracts. The study for the optimization of the UAE treatment based on the interaction of time, temperature, and pH parameters by response surface methodology proved that this technology was suitable to obtain a high yield of proteins and antioxidants from all sea bass side streams studied. Concretely, the highest protein recovery and the highest antioxidant capacity (ABTS and ORAC) values were observed in viscera extracts. In general, increased values were obtained with the elapse of extraction time. On the other hand, no mycotoxins were detected in the extracts obtained after the UAE treatments. Compared to conventional treatment, better results were obtained for head side streams under UAE technology, observing higher values for ABTS and ORAC, up to 377.54 µM TE and to 974.52 µM TE, respectively. Finally, it was seen that ultrasound treatment could reduce the molecular weight of the extracted proteins, making these proteins more digestible. These results highlight that fish side streams and innovative extraction tools such as UAE are a good combination. It should be evaluated as a potential tool to obtain high-added-value compounds, with potential applications in the food and pharmaceutical industry, and valorizing fish side streams.

Author Contributions

Conceptualization, E.F. and F.J.B.; methodology, F.A.K. and N.P.; formal analysis, F.A.K., F.J.M.-Q. and N.P.; software, F.J.M.-Q. and N.P.; resources, F.J.B. and E.F.; writing—original draft preparation, F.A.K., N.P., F.J.M.-Q., and F.J.B.; writing—review and editing, E.F. and F.J.B.; supervision, E.F. and F.J.B.; funding acquisition, F.J.B. and E.F. All authors have read and agreed to the published version of the manuscript.

Funding

This research was funded by the EU Commission and BBI-JU Horizon H2020, through the AQUABIOPRO-FIT project (Aquaculture and agriculture biomass side stream proteins and bioactives for feed, fitness and health promoting nutritional supplements) grant number 790956.

Institutional Review Board Statement

Not applicable.

Informed Consent Statement

Not applicable.

Data Availability Statement

Not applicable.

Acknowledgments

F.J.M.-Q. would like to thank the pre-PhD scholarship program of University of Valencia “Atracció de Talent”.

Conflicts of Interest

The authors declare no conflict of interest.

References

  1. Anonymous. The State of World Fisheries and Aquaculture 2018-Meeting the Sustainable Development Goals; FAO: Rome, Italy, 2018; Volume 367, ISBN 9789251305621. [Google Scholar]
  2. Caldeira, M.; Barreto, C.; Pestana, P.; Cardoso, M.A.T.; Franca, Z.; Plataforma, I.; Módulo, P.I.K. Fish residue valorisation by the production of value- added compounds towards a sustainable zero waste industry: A critical review. J. Sci. Eng. Res. 2018, 5, 418–447. [Google Scholar]
  3. Chi, R.; Cheung, F.; Ng, T.B.; Wong, J.H. Marine peptides: Bioactivities and applications. Mar. Drugs. 2019, 13, 4006–4043. [Google Scholar] [CrossRef]
  4. Souissi, N.; Bougatef, A.; Triki-Ellouz, Y.; Nasri, M. Biochemical and functional properties of sardinella (Sardinetta aurita) by-product hydrolysates. Food Technol. Biotechnol. 2007, 45, 187–194. [Google Scholar]
  5. Je, J.Y.; Qian, Z.J.; Byun, H.G.; Kim, S.K. Purification and characterization of an antioxidant peptide obtained from tuna backbone protein by enzymatic hydrolysis. Process Biochem. 2007, 42, 840–846. [Google Scholar] [CrossRef]
  6. Bougatef, A.; Balti, R.; Haddar, A.; Jellouli, K.; Souissi, N.; Nasri, M. Protein hydrolysates from bluefin tuna (Thunnus thynnus) heads as influenced by the extent of enzymatic hydrolysis. Biotechnol. Bioprocess Eng. 2012, 17, 841–852. [Google Scholar] [CrossRef]
  7. Pei, X.; Yang, R.; Zhang, Z.; Gao, L.; Wang, J.; Xu, Y.; Zhao, M.; Han, X.; Liu, Z.; Li, Y. Marine collagen peptide isolated from Chum Salmon (Oncorhynchus keta) skin facilitates learning and memory in aged C57BL/6J mice. Food Chem. 2010, 118, 333–340. [Google Scholar] [CrossRef]
  8. Chi, C.F.; Cao, Z.H.; Wang, B.; Hu, F.Y.; Li, Z.R.; Zhang, B. Antioxidant and functional properties of collagen hydrolysates from Spanish mackerel skin as influenced by average molecular weight. Molecules 2014, 19, 11211–11230. [Google Scholar] [CrossRef] [PubMed] [Green Version]
  9. Sae-leaw, T.; O’Callaghan, Y.C.; Benjakul, S.; O’Brien, N.M. Antioxidant, immunomodulatory and antiproliferative effects of gelatin hydrolysates from seabass (Lates calcarifer) skins. Int. J. Food Sci. Technol. 2016, 51, 1545–1551. [Google Scholar] [CrossRef]
  10. Supatra, T.S.; Yvonne, K.; Kee, M.B.O.; Fitzgerald, R.J.; Brien, N.M.O.; Benjakul, S. Purification and identification of antioxidant peptides from gelatin hydrolysate of seabass skin. J. Food Biochem. 2017, 1–11. [Google Scholar] [CrossRef]
  11. Álvarez, C.; Lélu, P.; Lynch, S.A.; Tiwari, B.K. Optimised protein recovery from mackerel whole fish by using sequential acid/alkaline isoelectric solubilization precipitation (ISP) extraction assisted by ultrasound. LWT Food Sci. Technol. 2018, 88, 210–216. [Google Scholar] [CrossRef] [Green Version]
  12. Al Khawli, F.; Pateiro, M.; Domínguez, R.; Lorenzo, J.M.; Gullón, P.; Kousoulaki, K.; Ferrer, E.; Berrada, H.; Barba, F.J. Innovative green technologies of intensification for valorization of seafood and their by-products. Mar. Drugs 2019, 17, 689. [Google Scholar] [CrossRef] [Green Version]
  13. Ivanović, M.I.; Islamčević Razboršek, M.; Kolar, M. Innovative Extraction techniques using deep eutectic solvents and analytical methods for the isolation and characterization of natural bioactive compounds from plant material. Plants 2020, 9, 1428. [Google Scholar] [CrossRef] [PubMed]
  14. Jayasinghe, G.D.T.M.; Domínguez-González, R.; Bermejo-Barrera, P.; Moreda-Piñeiro, A. Combining ultrasound-assisted extraction and vortex-assisted liquid–liquid microextraction for the sensitive assessment of aflatoxins in aquaculture fish species. J. Sep. Sci. 2020, 43. [Google Scholar] [CrossRef]
  15. Hathout, A.S.; Aly, S.E. Biological detoxification of mycotoxins: A review. Ann. Microbiol. 2014, 64, 905–919. [Google Scholar] [CrossRef]
  16. Marin, S.; Ramos, A.J.; Cano-Sancho, G.; Sanchis, V. Mycotoxins: Occurrence, toxicology, and exposure assessment. Food Chem. Toxicol. 2013, 60, 218–237. [Google Scholar] [CrossRef]
  17. Anonymous. The Commission of the European Communities Commission Regulation (EC) No 1881/2006 of 19 December 2006 setting maximum levels for certain contaminants in foodstuffs. Off. J. Eur. Union 2006, L 364/5, 5–24. [Google Scholar]
  18. Huang, Y.; Han, D.; Zhu, X.; Yang, Y.; Jin, J.; Chen, Y.; Xie, S. Response and recovery of gibel carp from subchronic oral administration of aflatoxin B1. Aquaculture 2011, 319. [Google Scholar] [CrossRef]
  19. Nomura, H.; Ogiso, M.; Yamashita, M.; Takaku, H.; Kimura, A.; Chikasou, M.; Nakamura, Y.; Fujii, S.; Watai, M.; Yamada, H. Uptake by dietary exposure and elimination of aflatoxins in muscle and liver of rainbow trout (Oncorhynchus mykiss). J. Agric. Food Chem. 2011, 59. [Google Scholar] [CrossRef]
  20. Tolosa, J.; Barba, F.J.; Font, G.; Ferrer, E. Mycotoxin incidence in some fish products: QuEChERS methodology and liquid chromatography linear ion trap tandem mass spectrometry approach. Molecules 2019, 24, 527. [Google Scholar] [CrossRef] [PubMed] [Green Version]
  21. Tolosa, J.; Font, G.; Mañes, J.; Ferrer, E. Natural occurrence of emerging Fusarium mycotoxins in feed and fish from aquaculture. J. Agric. Food Chem. 2014, 62. [Google Scholar] [CrossRef] [PubMed]
  22. Cigić, I.K.; Prosen, H. An overview of conventional and emerging analytical methods for the determination of mycotoxins. Int. J. Mol. Sci. 2009, 10, 62–115. [Google Scholar] [CrossRef]
  23. Kong, W.J.; Liu, S.Y.; Qiu, F.; Xiao, X.H.; Yang, M.H. Simultaneous multi-mycotoxin determination in nutmeg by ultrasound-assisted solid-liquid extraction and immunoaffinity column clean-up coupled with liquid chromatography and on-line post-column photochemical derivatization-fluorescence detection. Analyst 2013, 138. [Google Scholar] [CrossRef] [PubMed]
  24. Anater, A.; Manyes, L.; Meca, G.; Ferrer, E.; Luciano, F.B.; Pimpão, C.T.; Font, G. Mycotoxins and their consequences in aquaculture: A review. Aquaculture 2016, 451, 1–10. [Google Scholar] [CrossRef]
  25. Tolosa, J.; Font, G.; Mañes, J.; Ferrer, E. Natural occurrence of fusarium mycotoxins in aquaculture fish food. Rev. Toxicol. 2013, 30, 193–197. [Google Scholar]
  26. Munekata, P.E.S.; Pateiro, M.; Domínguez, R.; Zhou, J.; Barba, F.J.; Lorenzo, J.M. Nutritional characterization of sea bass processing by-products. Biomolecules 2020, 10, 232. [Google Scholar] [CrossRef] [PubMed] [Green Version]
  27. Martí-Quijal, F.J.; Tornos, A.; Príncep, A.; Luz, C.; Meca, G.; Tedeschi, P.; Ruiz, M.-J.; Barba, F.J. Impact of fermentation on the recovery of antioxidant bioactive compounds from sea bass byproducts. Antioxidants 2020, 9, 239. [Google Scholar] [CrossRef] [Green Version]
  28. De la Fuente, B.; López-García, G.; Máñez, V.; Alegría, A.; Barberá, R.; Cilla, A. Evaluation of the bioaccessibility of antioxidant bioactive compounds and minerals of four genotypes of Brassicaceae microgreens. Foods 2019, 8, 250. [Google Scholar] [CrossRef] [Green Version]
  29. Pallarés, N.; Font, G.; Mañes, J.; Ferrer, E. Multimycotoxin LC-MS/MS Analysis in tea beverages after dispersive liquid-liquid microextraction (DLLME). J. Agric. Food Chem. 2017, 65, 10282–10289. [Google Scholar] [CrossRef]
  30. Anonymous. European Commission Decision 2002/657/EC. Off. J. Eur. Communities 2002, L 221/8, 8–36. [Google Scholar]
  31. Tian, J.; Wang, Y.; Zhu, Z.; Zeng, Q.; Xin, M. Recovery of tilapia (Oreochromis niloticus) protein isolate by high-intensity ultrasound-aided alkaline isoelectric solubilization/precipitation process. Food Biproc. Tech. 2015, 8, 758–769. [Google Scholar] [CrossRef]
  32. Gehring, C.K.; Gigliotti, J.C.; Moritz, J.S.; Tou, J.C.; Jaczynski, J. Functional and nutritional characteristics of proteins and lipids recovered by isoelectric processing of fish by-products and low-value fish: A review. Food Chem. 2011, 124, 422–431. [Google Scholar] [CrossRef]
  33. Franco, D.; Munekata, P.E.S.; Agregán, R.; Bermúdez, R.; López-Pedrouso, M.; Pateiro, M.; Lorenzo, J.M. Application of pulsed electric fields for obtaining antioxidant extracts from fish residues. Antioxidants 2020, 9, 90. [Google Scholar] [CrossRef] [PubMed] [Green Version]
  34. Liuhartana Nasyiruddin, R.; Noman, A.; Ahmed, M.I.; Ali Mahdi, A.; Al-Maqtari, A.; Jiang, Q.; Xu, Y.; Xia, W. Effect of time of low-frequency ultrasound treatment on antioxidant activity and physicochemical properties of silver carp myofibrillar protein. Int. J. Res. Agric. Sci. 2019, 6, 2348–3997. [Google Scholar]
  35. Secci, G.; Borgogno, M.; Lupi, P.; Rossi, S.; Paci, G.; Mancini, S.; Bonelli, A.; Parisi, G. Effect of mechanical separation process on lipid oxidation in European aquacultured sea bass, gilthead sea bream, and rainbow trout products. Food Control 2016, 67, 75–81. [Google Scholar] [CrossRef]
  36. Wen, C.; Zhang, J.; Zhang, H.; Dzah, C.S.; Zandile, M.; Duan, Y.; Ma, H.; Luo, X. Advances in ultrasound assisted extraction of bioactive compounds from cash crops—A review. Ultrason. Sonochem. 2018, 48, 538–549. [Google Scholar] [CrossRef]
  37. Lin, J.; Hong, H.; Zhang, L.; Zhang, C.; Luo, Y. Antioxidant and cryoprotective effects of hydrolysate from gill protein of bighead carp (Hypophthalmichthys nobilis) in preventing denaturation of frozen surimi. Food Chem. 2019, 298, 124868. [Google Scholar] [CrossRef]
  38. Kim, H.K.; Ho-Kim, Y.; Yun, K.; Kim, Y.-J.; Park, J.H.; Lee, N.H. Effects of ultrasonic treatment on collagen extraction from skins of the sea bass Lateolabrax japonicus. Fish. Sci. 2012, 78. [Google Scholar] [CrossRef]
  39. Egerton, S.; Culloty, S.; Whooley, J.; Stanton, C.; Ross, R.P. Characterization of protein hydrolysates from blue whiting (Micromesistius poutassou) and their application in beverage fortification. Food Chem. 2018, 245, 698–706. [Google Scholar] [CrossRef]
  40. Deng, Y.; Wang, Y.; Deng, Q.; Sun, L.; Wang, R.; Wang, X.; Liao, J.; Gooneratne, R. Simultaneous quantification of aflatoxin B1, T-2 toxin, ochratoxin A and deoxynivalenol in dried seafood products by LC-MS/MS. Toxins 2020, 12, 488. [Google Scholar] [CrossRef]
Figure 1. Sea bass side streams (head, viscera, skin, and bones).
Applsci 11 02160 g001
Figure 2. Plots shown in (A,C,E,G) indicate the response surface plot for the percentage of recovered protein as a function of the extraction time (min) and temperature (°C) at fixed pH. The plots in (B,D,F,H) show the influence of the different parameters (extraction time, temperature, and pH) on the recovery of protein (%) from sea bass side streams.
Applsci 11 02160 g002
Figure 3. Plots shown in (A,C,E,G) indicate the response surface plot for the percentage of antioxidant capacity as a function of the extraction time (min) and temperature (°C) at a fixed pH. The plots in (B,D,F,H) show the influence of the different parameters (extraction time, temperature, and pH) on the antioxidant capacity determined as µM trolox equivalent using ABTS assay.
Applsci 11 02160 g003
Figure 4. Plots shown in (A,C,E,G) indicate the response surface plots for the percentage of antioxidant capacity as a function of the extraction time (min) and temperature (°C) at a constant pH. The plots in (B,D,F,H) represent the plot of the influence of the different studied parameters on the antioxidant capacity values determined as µM TE (Trolox equivalent) using the ORAC assay.
Applsci 11 02160 g004
Figure 5. Comparison of the optimal condition with the lowest treatment of UAE (0.5 min): (A) protein recovery (%), (B) ABTS values (µM TE), and (C) ORAC values (µM TE).
Applsci 11 02160 g005
Figure 6. Optimal condition of UAE vs. conventional extraction (Control) for sea bass head: (A) protein recovery (%), (B) ABTS values (µM TE), and (C) ORAC values (µM TE).
Applsci 11 02160 g006
Figure 7. SDS-PAGE analysis of extracts obtained by UAE from sea bass byproducts (head, skin, bone, and viscera) (MW, molecular weight).
Applsci 11 02160 g007
Table 1. Spectrometric parameters of liquid chromatography ion trap tandem mass spectrometry (LC-MS/MS-IT).
MycotoxinRetention Time (min)DP aPrecursor IonQuantification Ion QConfirmation Ion q
CE bProduct IonCXP cCEProduct IonCXP
AFB19.1346313.139284.9441241.04
AFB29.0381315.133286.9639259.06
AFG18.8676329.039243.1629311.16
AFG29.3761331.127313.1639245.14
ZEA10.4026319.015301.01019282.94
OTA10.2755404.397102.1627239.06
ENNA12.6276699.435210.11459228.216
ENNA112.2266685.437210.2859214.210
ENNB11.6051657.339196.1859214.010
ENNB111.8966671.261214.11057228.112
BEA12.00116801.227784.11039244.16
a DP: declustering potential (volts). b CE: collision energy (volts). c CXP: cell exit potential (volts).
Table 2. Analytical parameters for method validation.
MycotoxinRecovery c ± RSD d (%)SSE (%) bLOD aLOQ a
Intraday PrecisionInterday Precision
AFB178 ± 668 ± 8750.72.3
AFB296 ± 7114 ± 91042.48.0
AFG190 ± 5120 ± 10930.72.3
AFG2106 ± 873 ± 12860.51.7
ZEA80 ± 677 ± 7650.20.7
OTA115 ± 9120 ± 1072517
ENA100 ± 795 ± 8850.41.3
ENA199 ± 2100 ± 6890.20.7
ENB115 ± 5105 ± 71050.05 0.2
ENB198 ± 793 ± 8750.10.3
BEA94 ± 889 ± 11990.41.3
a LOD and LOQ are limits of detection and quantification. b SSE: signal suppression/enhancement. c Recoveries: analysis performed at concentrations of 10 × LOQ. d RSD: relative standard deviation.
Table 3. Dependent variable conditions for the ultrasound-assisted extraction studied.
RunTime (min)Temperature (°C)pH
130508.5
20.5208.5
30.5357
430357
530205.5
615.25357
730208.5
815.25358.5
915.25507
100.5508.5
110.5505.5
1215.25357
1315.25207
1430505.5
1515.25355.5
160.5205.5
Table 4. Percentage of protein recovered from sea bass side streams extracted using UAE at different extraction times (min), temperature (°C), and pH.
Extraction Time (min)Temperature
(°C)
pHProtein Recovery %
HeadSkinBoneViscera
130508.517.4525.0775.0793.21
20.5208.512.5119.1545.3670.10
30.535715.7813.6423.6380.48
43035712.8331.6844.2693.66
530205.524.1514.1156.5085.35
615.2535717.8512.5431.8785.93
730208.514.9612.4963.9182.26
815.25358.533.4618.9537.9490.03
915.2550717.4720.2633.5286.42
100.5508.521.8719.2354.7592.50
110.5505.531.1217.1235.0984.81
1215.2535720.3217.1936.0493.01
1315.2520725.3212.4142.5681.38
1430505.528.1024.9538.6699.37
1515.25355.539.8924.7838.2884.73
160.5205.531.1118.7936.6877.22
Table 5. Antioxidant capacity values obtained by ABTS assay (µM TE) from sea bass side streams extracts using UAE at different extraction times (min), temperature (°C), and pH.
Extraction Time (min)Temperature
(°C)
pHAntioxidant Capacity
(ABTS, µM TE)
HeadSkinBoneViscera
130508.5126.5174.84161.99516.02
20.5208.511.0131.6234.46213.51
30.53579.9143.5928.94137.87
43035743.91125.86134.31450.35
530205.598.22285.96276.23432.54
615.2535721.78164.85173.23492.30
730208.5129.38207.65291.99427.19
815.25358.536.5190.85210.89487.78
915.2550737.86124.63160.61439.34
100.5508.59.7642.0457.83186.63
110.5505.59.3748.7545.61253.96
1215.2535719.81154.81164.39496.85
1315.2520793.63214.01349.63487.57
1430505.574.17124.78217.88347.36
1515.25355.529.63156.27197.19442.86
160.5205.528.9313.4642.25171.50
Table 6. Optimal conditions for ABTS optimal values.
Side StreamExtraction Time (min)Temperature (°C)pHAntioxidant Capacity
(ABTS, µM TE)
Head30208.5128.13
Skin30205.5278.37
Bone23205.5318.65
Viscera21508.5535.70
Table 7. Antioxidant capacity values obtained by oxygen radical absorbance capacity (ORAC) assay (µM TE) from fish side streams extracts at different UAE (ultrasound-assisted extraction) times (min), temperatures (°C), and pH.
Extraction Time (min)Temperature
(°C)
pHAntioxidant Capacity
(ORAC, µM TE)
HeadSkinBoneViscera
130508.5350.97287.72241.435794.64
20.5208.5173.65139.78299.972124.46
30.5357123.73140.18218.422813.98
430357215.63302.99263.674684.92
530205.5248.82401.45617.382611.02
615.25357262.12339.24264.314042.80
730208.5316.29248.48698.982410.56
815.25358.5209.32303.58265.133991.56
915.25507259.20264.72366.775206.57
100.5508.5325.43168.56223.923538.50
110.5505.5158.86156.91167.653914.67
1215.25357234.45303.83228.424394.47
1315.25207247.48226.70581.283493.03
1430505.5399.12331.85173.955355.38
1515.25355.5145.52289.52334.223648.70
160.5205.5155.49239.81208.392082.74
Table 8. Optimal conditions for ORAC optimal values.
Side StreamExtraction Time (min)Temperature (°C)pHAntioxidant Capacity
(µM TE) (ORAC)
Head30508.5369
Skin28255.5389
Bone20207.8679
Viscera30507.05996
Table 9. Optimal conditions, predicted values, and experimental responses of protein recovery and antioxidant activities (ABTS and ORAC) for different fish side streams.
Optimal Conditions for UAEProtein Recovery (%)ABTS (µM TE)ORAC (µM TE)
Time (min)Temperature
(°C)
pHPredicted
Values
Experimental
Values
Predicted
Values
Experimental
Values
Predicted
Values
Experimental
Values
Head25205.532.1931.7 ± 0.190.91142.6 ± 25260.60327.71 ± 12.15
Skin30325.524.6333.7 ± 0.7189.73240.9 ± 26384.48359.08 ± 13.01
Bone30208.566.0054.2 ± 0.0292.92139.5 ± 22673.43584.68 ± 67.09
Viscera26508.594.5294.6 ± 1.0516.02412.3 ± 325705.615475.65 ± 357.50
Publisher’s Note: MDPI stays neutral with regard to jurisdictional claims in published maps and institutional affiliations.

