Article

An Optimization Study to Evaluate the Impact of the Supercritical CO2 Brayton Cycle’s Components on Its Overall Performance

1
Department of Automotive and Marine Engineering Technology, College of Technological Studies, The Public Authority for Applied Education and Training, Shuwaikh, Kuwait City 70654, Kuwait
2
Automotive Department, Industrial Institute at Sabah Alsalem, The Public Authority for Applied Education and Training, Sabah Alsalem, Kuwait City 70654, Kuwait
*
Author to whom correspondence should be addressed.
Submission received: 17 January 2021 / Revised: 12 February 2021 / Accepted: 19 February 2021 / Published: 8 March 2021
(This article belongs to the Special Issue Recent Advances in Sustainable Process Design and Optimization)

Abstract

:
The rising environmental problems due to fossil fuels’ consumption have pushed researchers and technologists to develop sustainable power systems. Due to properties such as abundance and nontoxicity of the working fluid, the supercritical carbon ( sCO 2 ) dioxide Brayton cycle is considered one of the most promising technologies among the various sustainable power systems. In the current study, a mathematical model has been developed and coded in Matlab for the recompression of the supercritical carbon dioxide Brayton cycle sCO2-BC. The real gas properties of supercritical carbon dioxide ( sCO 2 ) were incorporated into the program by pairing the NIST’s Refporp with Matlab© through a subroutine. The impacts of the various designs of the cycle’s individual components have been investigated on the performance of sCO 2 BC . The impact of various sedative cycle parameters, i.e., compressor’s inlet temperature ( T 1 ) , and pressure ( P 1 ), cycle pressure ratio ( P r ), and split mass fraction ( x ), on the cycle’s performance ( η c y c ) were studied and highlighted. Moreover, an optimization study using the genetic algorithm was carried out to find the abovementioned cycle’s optimized values that maximize the cycle’s per-formance under provided design constraints and boundaries.

1. Introduction

The concept of conversion of heat to mechanical energy is well-known using both internal and external combustion gas cycles. The external combustion gas cycles such as the Rankin cycle have an advantage in their compliance with a wide range of heat sources and many fuels. However, the component design and cycle layouts of the Rankine cycle are quite complicated due to its small molar mass and high critical temperatures that limit the operation of the cycle from low to moderate temperature sources. Closed Brayton cycles that utilize ideal gases as working fluids [1] and can be linked with high-temperature sources, up to 800   ° C , have recently been proposed as an alternate to Rankin cycles.
The novel supercritical carbon dioxide Brayton cycle sCO2-BC has acquired much interest lately due to its higher conversion efficiency, the compact size of its components, and its more straightforward layouts. It is anticipated that, due to the considerably higher conversion efficiencies linked with the cycle and its smaller layout, it will generate new markets that are expected to be more cost-effective and greener [2,3]. Formally renowned cycles are the steam Rankine cycle and air Brayton cycle. The former is cable of operating at a higher turbine inlet temperature while the latter is known to operate with a requirement of substantially smaller pumping powers. Despite the fact that the former can operate at much higher turbine inlet temperatures, its work ratio is exceedingly small due to huge compressor power requirements [4]. In contrast, the compressor of the sCO2-BC operates close to the critical point where compressibility of the supercritical CO 2 is comparable with the compressibility of liquids [2]. This is the reason why, unlike the air Brayton cycle, the compression work requirements of sCO2-BC are substantially smaller than those of the former. Furthermore, sCO2-BC is capable of operating at very high turbine inlet temperatures to achieve a significantly high conversion efficiency by blending the benefits of both air and steam cycles. Moreover, operation of sCO2-BC above the critical point eliminates the necessity of condensing the system, leading to a comparatively basic cycle layout. Lastly, the sCO2-BC operates at very extremely high pressures due to which the cycle’s components are much more compact compared with the air Brayton and steam Rankine cycle. It has been frequently reported in the literature that the turbine, compressors, and printed circuit heat exchanger (PCHE) sizes become at least tenfold more compact compared with the steam Rankine cycle [5,6].
The sCO2-BC is regarded as one of the most promising approaches to meet with tight emission standards. In this regard, integration of the sCO2-BC with concentrated solar power plants (CSPs) is highly pertinent as it is cost-effective for the next-generation CSP plants operating at temperatures above 600   ° C [7,8,9]. Along with this, sCO2-BC accounts for an ideal power block of the next-generation nuclear reactor [10] and waste heat recovery [5,11] based on its excellent integration capabilities with low-temperature heat sources [5,12,13,14]. A list of potential applications of sCO2-BC along with their sizes and motivations is listed in Table 1.
Several combinations of sCO2-BC were analyzed in the literature [3,4,15,16,17,18] to furth improve its efficiency [3,4,15,16,17,18]. Among various cycle configurations, the most naïve sCO2-BC layout is known as a recuperated/regenerative cycle. It comprises three heat exchangers (a regenrative, an intermediate heat exchanger, and a precooler), an expander, and a compressor. The cycle was initially suggested by Feher [16]. Other variants of the regenerative sCO2-BC involve a reheated compression cycle (with an additional heat exchanger between stages of the turbine) and intercooled compression (an intercooler between two stages of the compressor) [15,19].
The single recuperator in the cycle was replaced with two smaller recuperators in series to overcome the pinch-point issues linked with the regenerative cycle. The subsequent cycle is known as the recompression cycle and involves two compressors, i.e., main-compressor and re-compressor. Recompressioned sCO2-BC has been referred to as the most efficient layout amount other available layouts of the supercritical cycle [8,20,21]. Numerous studies have been performed to optimize the boundary conditions of sCO2-BC. Sarkar and Bhattacharyya [22] performed an optimization analysis for sCO2-BC by adding a reheater between the two stages of the turbine. They assessed the effects of various cycles, including the pressure ratio ( P r ), compressor’s inlet temperature, effectiveness of the high-temperature recuperator (HTR) ( ϵ H T R ) and effectiveness of low-temperature recuperator (LTR) ( ϵ H T R ). Both reported that the cycle’s efficiency can be enhanced considerably by utilizing the reheating technology. Similarly, Reyes et al. [20] and Sharma et al. [23] attempted to optimize the recompression cycle utilizing a central receiver solar plant (CSP) as a heat source and for marine gas-turbine systems. Sarkar et al. [24] investigated the impact of heat exchange and pressure losses on the performance of sCO2-BC. Saeed et al. [3] evaluated the recompression cycle using mean line design models of the individual components and also evaluated impacts of different channel geometries of PCHEs on the performance of the cycle [25,26]. Saad et al. [27] conducted an exergy destruction assessment to explore the effects of different ambient and water temperatures on the performance of sCO2-BC Saeed and Kim developed an optimization study for the sCO2-BC’s expander system.
From the studies mentioned above, it can be seen that even though numerous investigations have been conducted to analyze sCO2-BC, there is no optimization study available in the literature based on a genetic algorithm. Until now, only search algorithms have been employed. In this context, the current study provides a detailed analysis of sCO2-BC. A mathematical model for sCO2-BC has been developed and coded in Matlab©. Properties of sCO 2 have been integrated into the code by linking the NIST’s Refprop to Matlab using an in-house code. The effects of the various components on the overall performance of sCO2-BC have been investigated, which has never been reported in previous studies to the authors’ knowledge. Moreover, the genetic algorithm was employed to optimize the cycle parameters to maximize their efficiency.

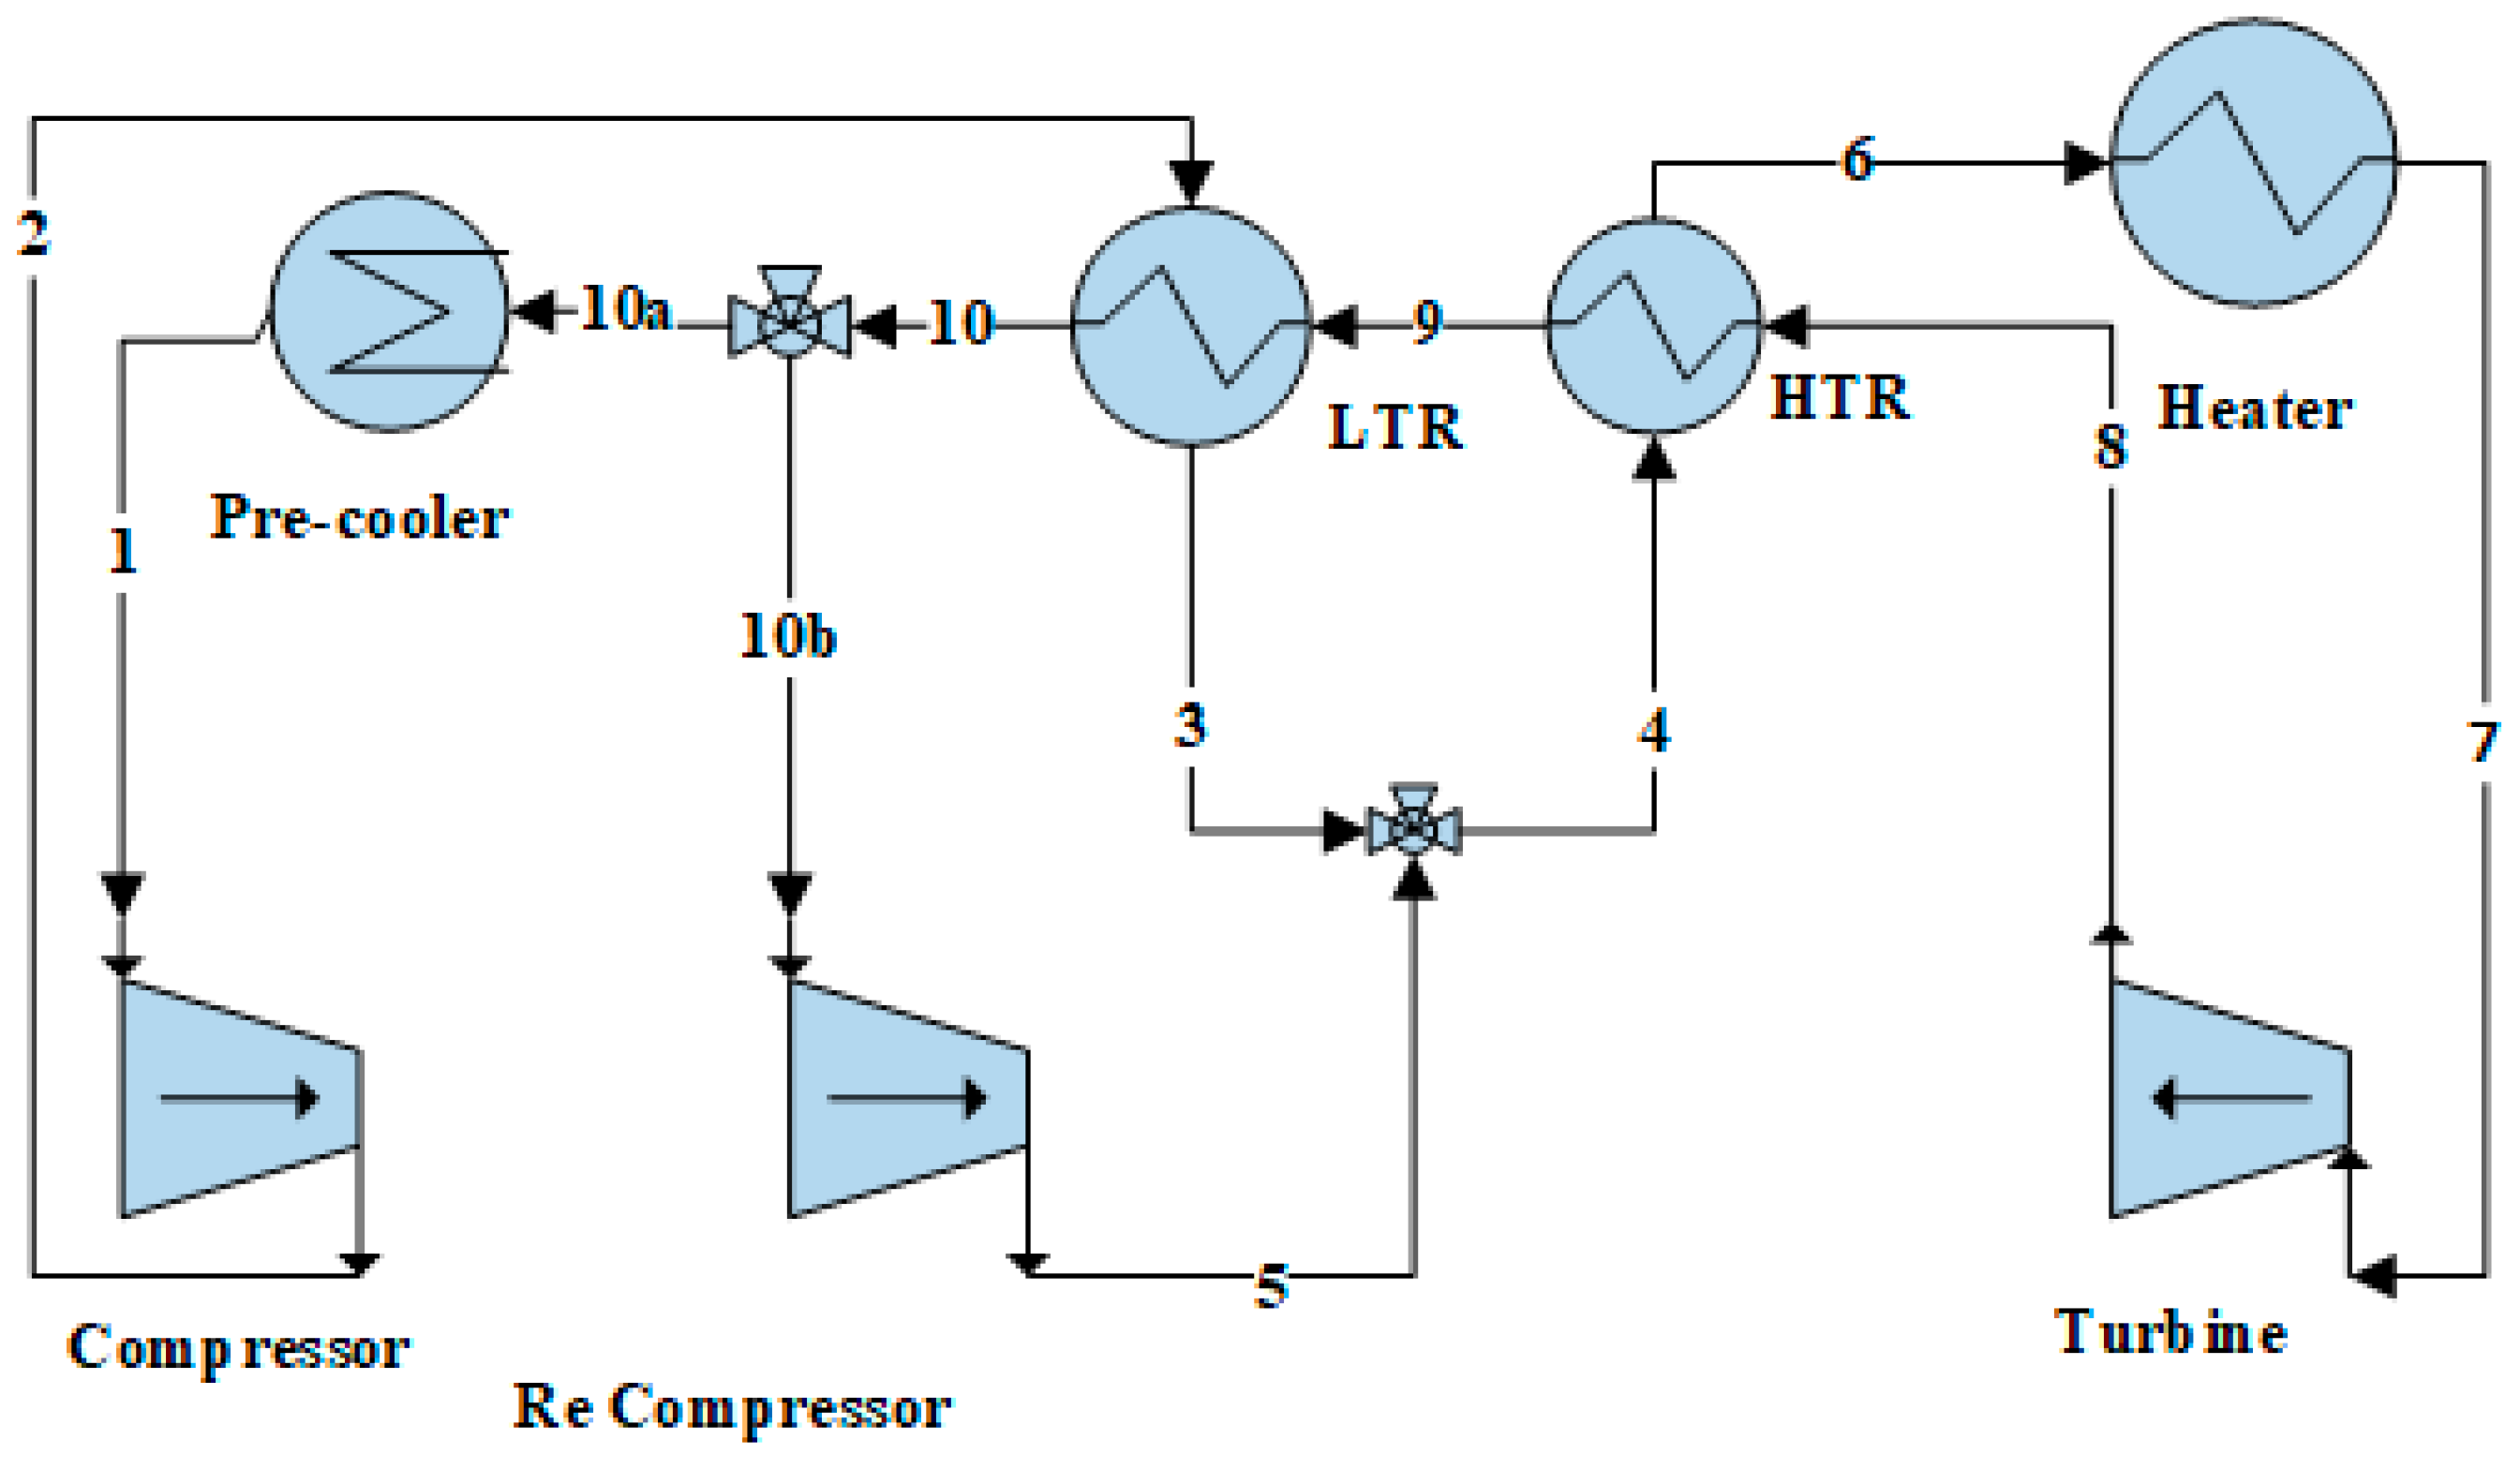
2. Power Cycle Modeling

Copious arrangements of sCO2-BC have been suggested and analyzed [15,16,17,28]. Feher proposed the most straightforward version of the cycle known as the recuperated or regenerative cycle. Dostal [28] proposed and investigated simple recuperated and recompression cycles, while Angelino [17] proposed a partial cooling cycle. Other layouts include intercooled sCO2-BC, and partial recompression. For the current work, recompression sCO2-BC was chosen on the basis of its excellent performance [8,20,21] and more straightforward layout [28].
As explained earlier and shown in Figure 1, the cycles consist of an additional recuperator and compressor compared with the regenerative cycle. The recompression sCO2-BC consists of four heat exchanges (two recuperators, i.e., HTR and LTR (for heat recuperation), an external heat exchanger (to exchange heat from the source to the working fluid), and a precooler (for additional heat rejection to complete the cycle) [8,29,30].
The cycle boundary conditions were chosen carefully through an extensive review of the literature. The selected cycle’s boundary conditions are provided in Table 2, as a function of on which all simulations were evaluated through an in-house code written in the Matlab environment.

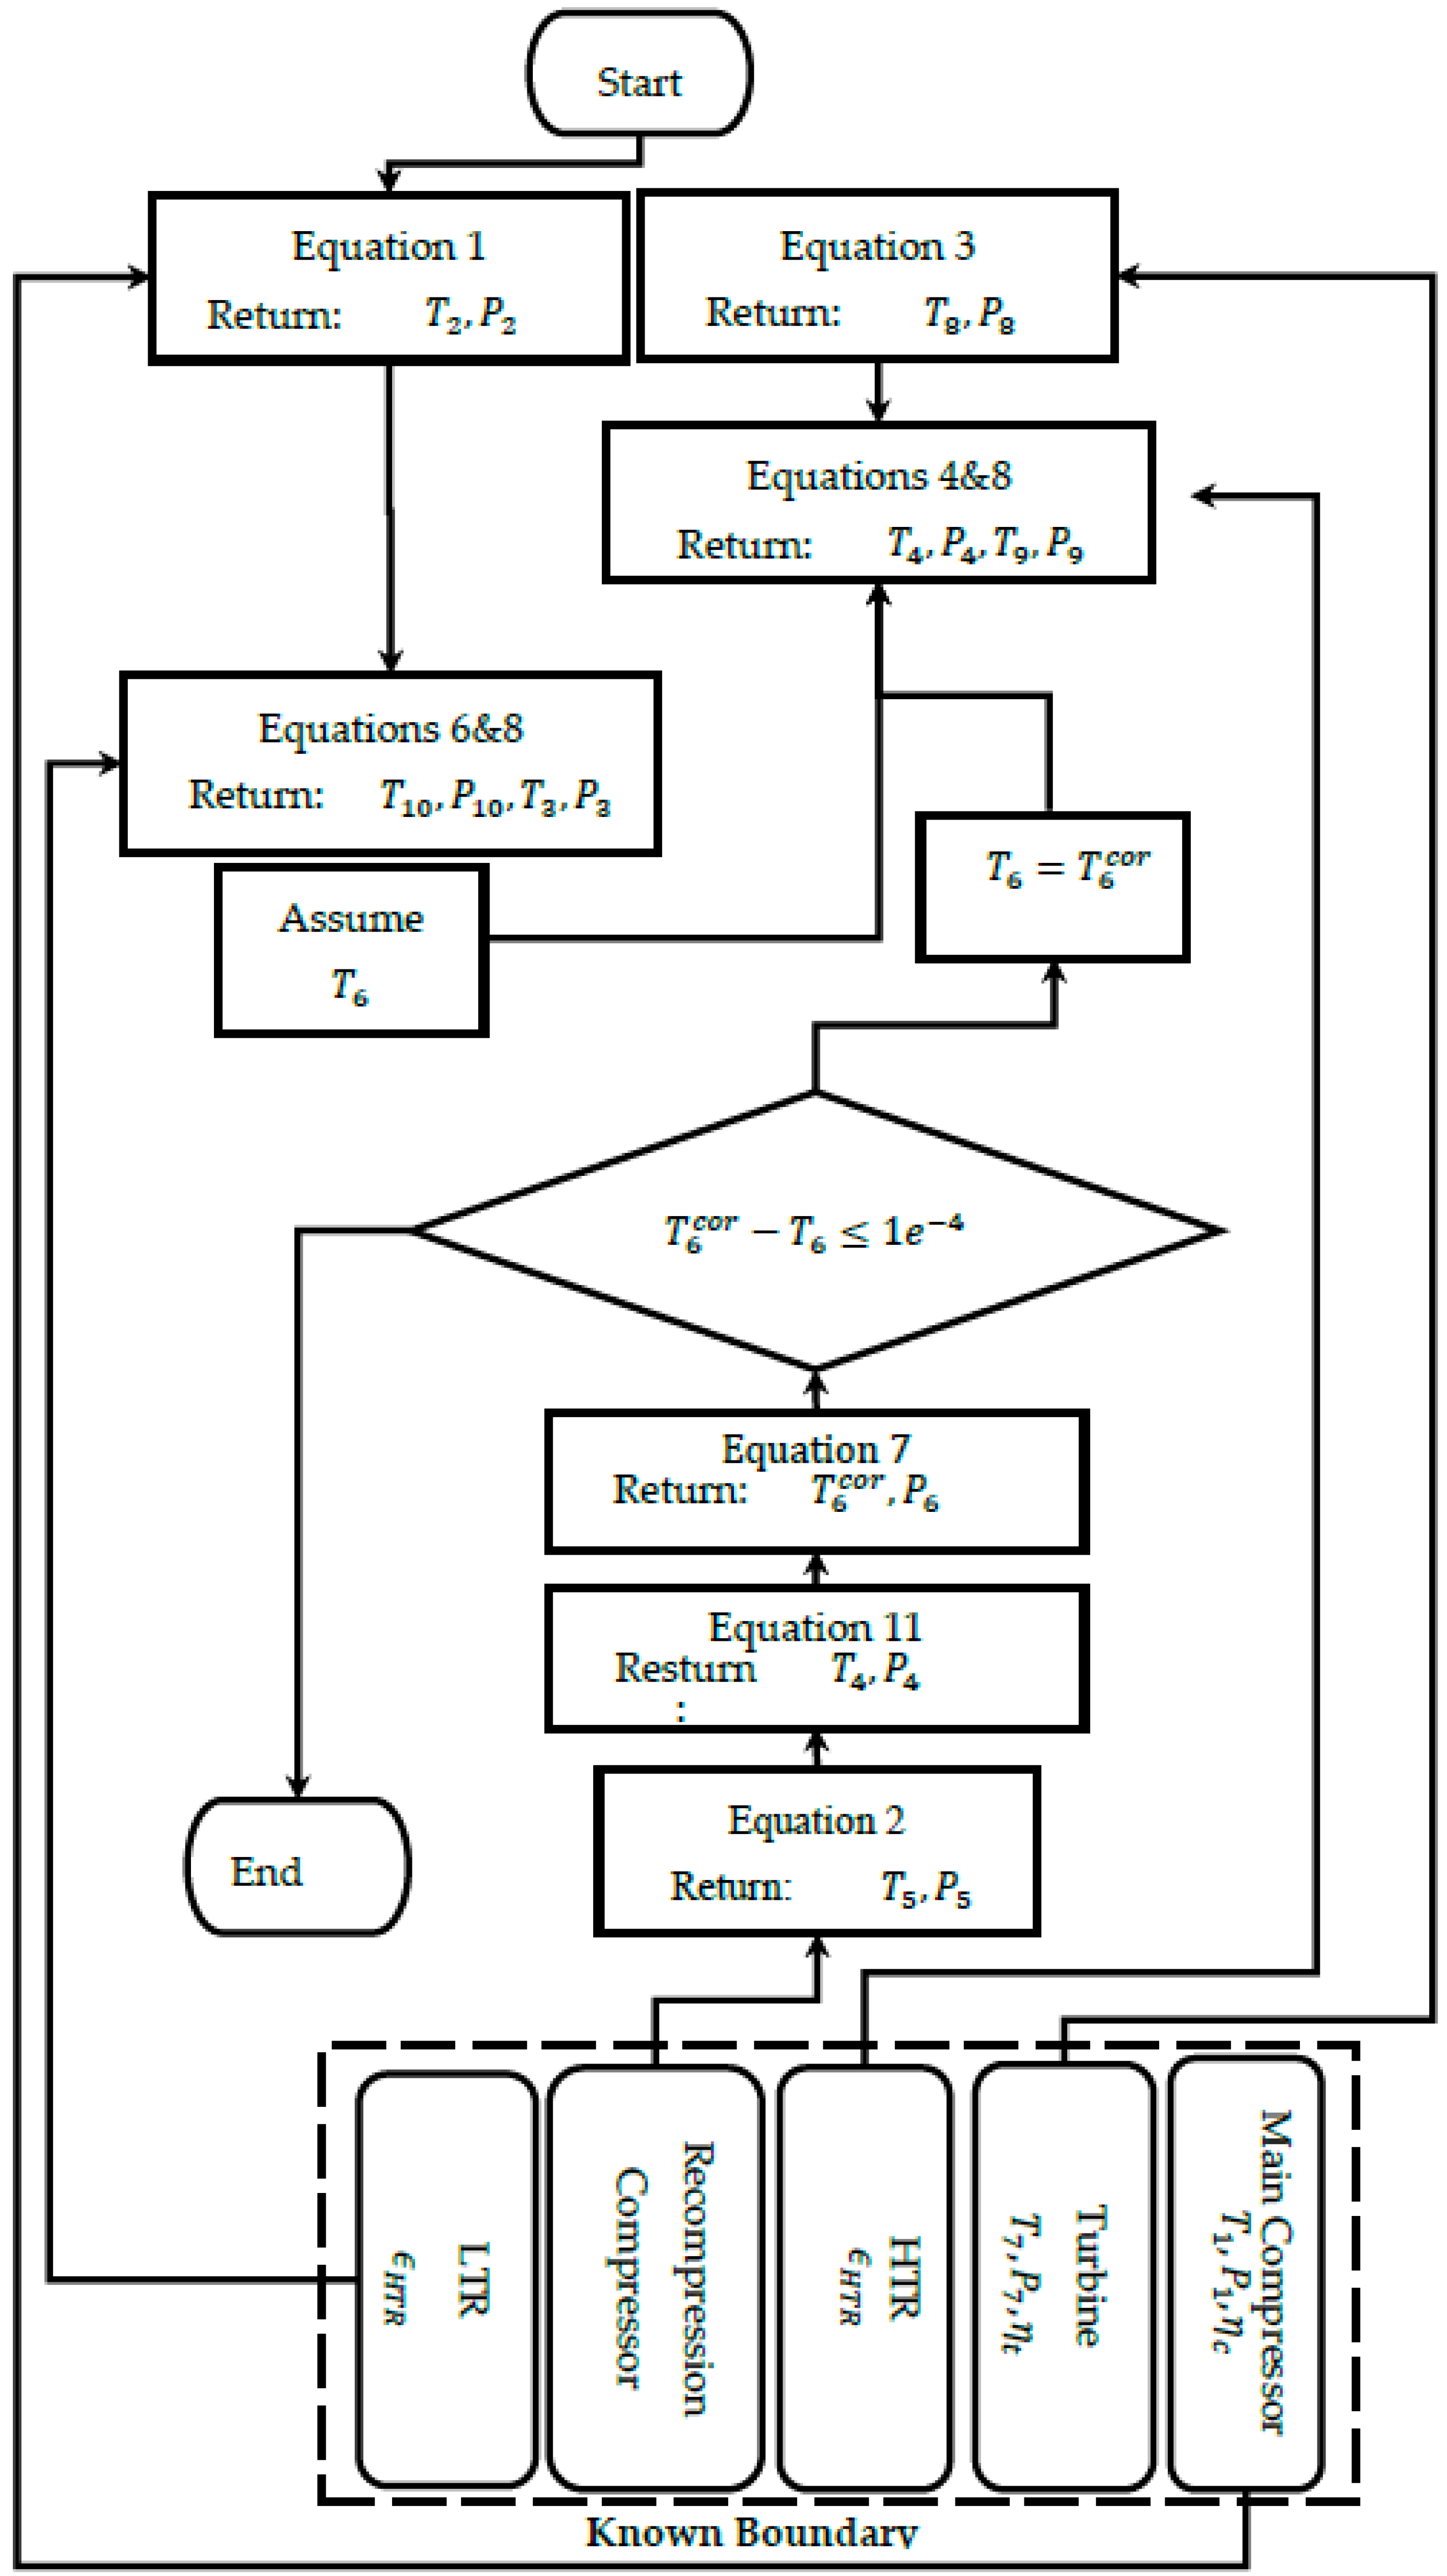
2.1. Mathematical Model

2.1.1. Turbomachinery Models

As presented in [18], turbomachinery modeling is based on a single equation model of the turbine and compressor utilizing isentropic efficiencies and pressure ratio information, whereby isentropic efficiencies are approximated using the Balje chart [31].
h 2 = h 2 s h 1 η c + h 1
h 5 = h 5 s h 10 η r c + h 10
h 8 = h 7 η T ( h 7 h 8 s ) .

2.1.2. Recuperator Model

There have been different approaches adopted in the literature to model the heat exchangers and recuperators. Most common methodologies are based on either U.A. values or effectiveness values ϵ . Recuperator [27,32] modeling techniques based on the effectiveness of the heat exchanger are computationally less costly. Thus, the NTU method that utilizes the heat exchanger’s effectiveness was adopted for the current study, as given by the following equations.
ε H T R = C h , H T R ( T 8 T 9 ) C m i n , H T R ( T 8 T 4 )
The definitions of C m i n , L T R and C m i n , H T R are given by Equations (7) and (8).
C m i n , H T R = min ( C p h , H T R , C p c , H T R )
C m i n , L T R = min ( C p h , H T R , x C p c , H T R )
It was assumed that both recuperators, i.e., the high-temperature recuperator (HTR) and low-temperature recuperator (LTR), are entirely insulated. Therefore, the resulting energy balance equations can be presented in the form provided below.
h 9 = h 8 ( h 6 h 4 ) ,
h 10 = h 9 x ( h 3 h 2 ) ,
where x is the fraction of mass flowing toward the recompressor, termed the split mass fraction. It can be calculated using the following relationship:
x = m ˙ c m ˙ , where m ˙ = m ˙ c + m ˙ r c .
Considering ideal mixing, the mixing value was modeled using Equation (10).
h 4 = x   h 3 + ( 1 x ) h 5 .
To estimate the pressure losses, Equation (12) was considered. The definition of the cycle efficiency used in the current work was provided by Equation (13).
p o u t = p i n ( 1 f ) .
η t h e r m a l = w T η m ( w c + w R r c ) / η m q i n
Definitions of w t , w c ,   a n d   w r c are given by the following equations:
w t = ( h 7 h 8 ) ,
w c = x ( h 2 h 1 ) ,
w r c = ( 1 x ) ( h 5 h 10 ) .
The cycle’s selected conditions listed in Table 2 are from the literature [8]. Cycle calculations under selected boundaries (Table 2) were computed using a Matlab code for various values of x. The values in Table 2 were approximated from the literature [4,7,33]. Thermophysical properties were obtained by linking Matlab code with Refprop. Results of the cycle simulations are plotted in Figure 2.
As shown in Figure 2, the code initializes with known boundary conditions (Table 2). The turbine and main compressor were solved first using Equation (1) and Equation (3), respectively, and later HTR was solved based on an assumed value of T 6 based on which T 4 was computed. Finally, T 4 was used to solve recompressor and LTR. The above-mentioned process keeps iterating in a loop until T 6 is converged.

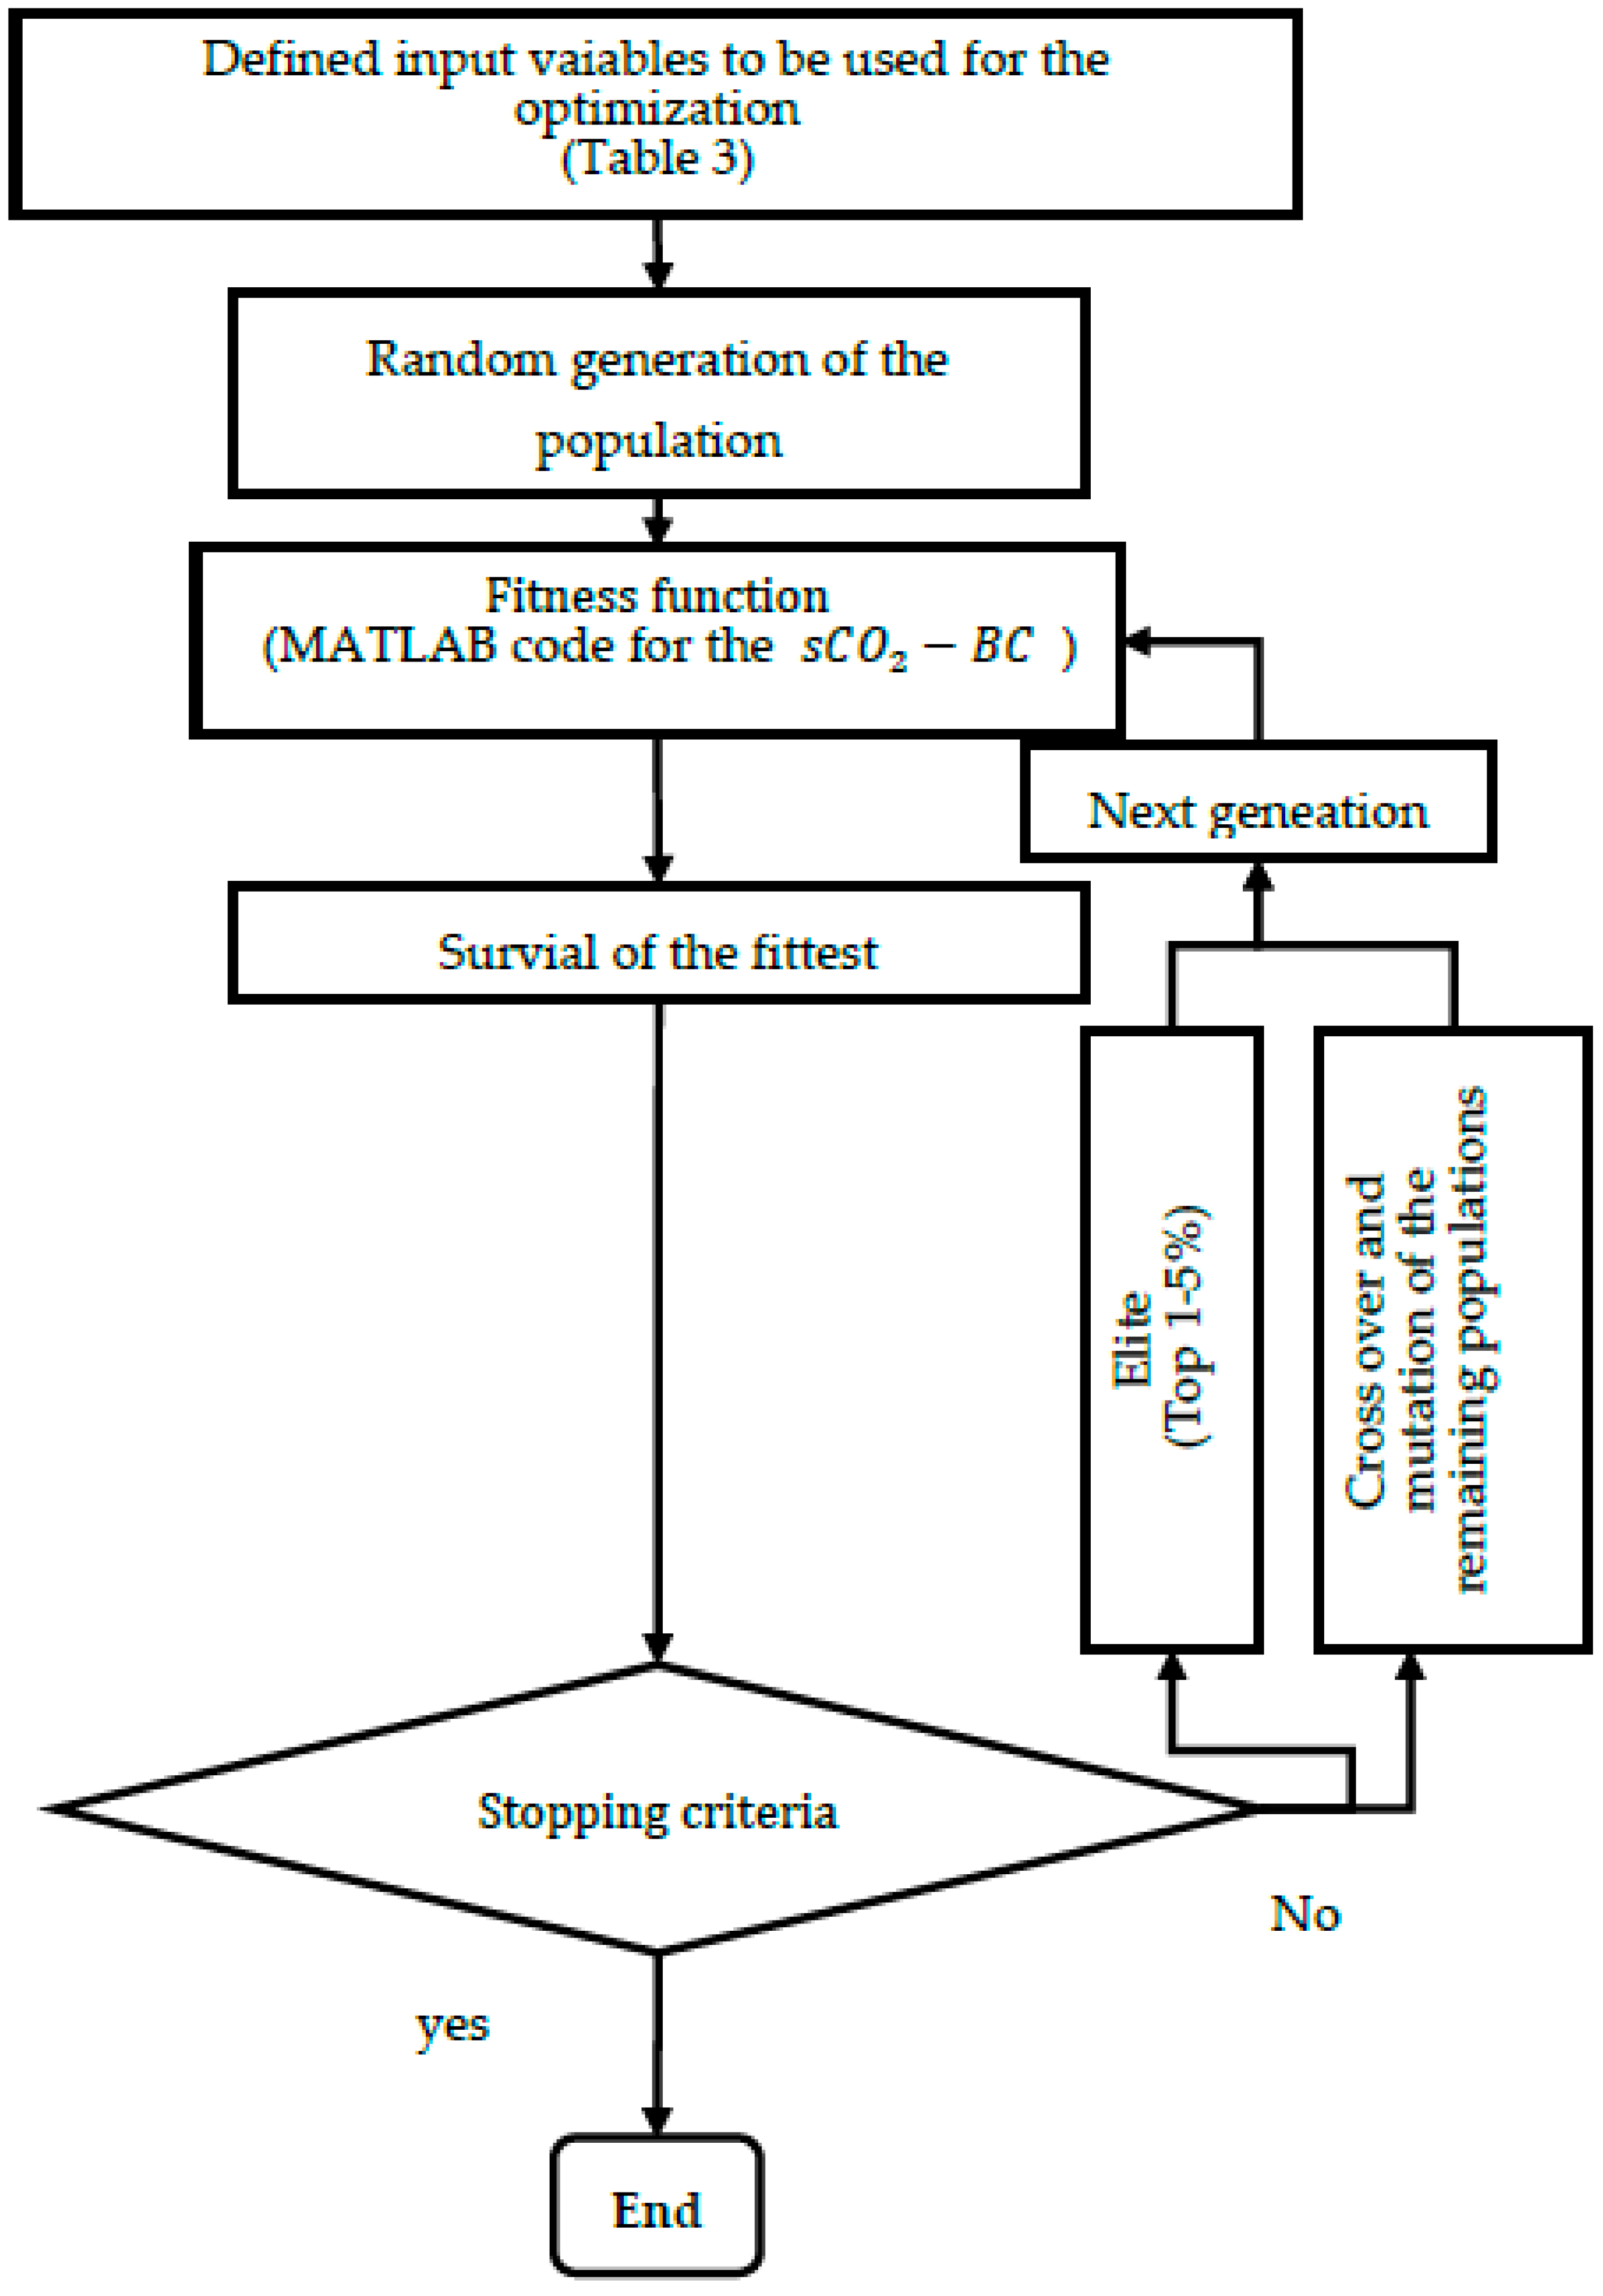
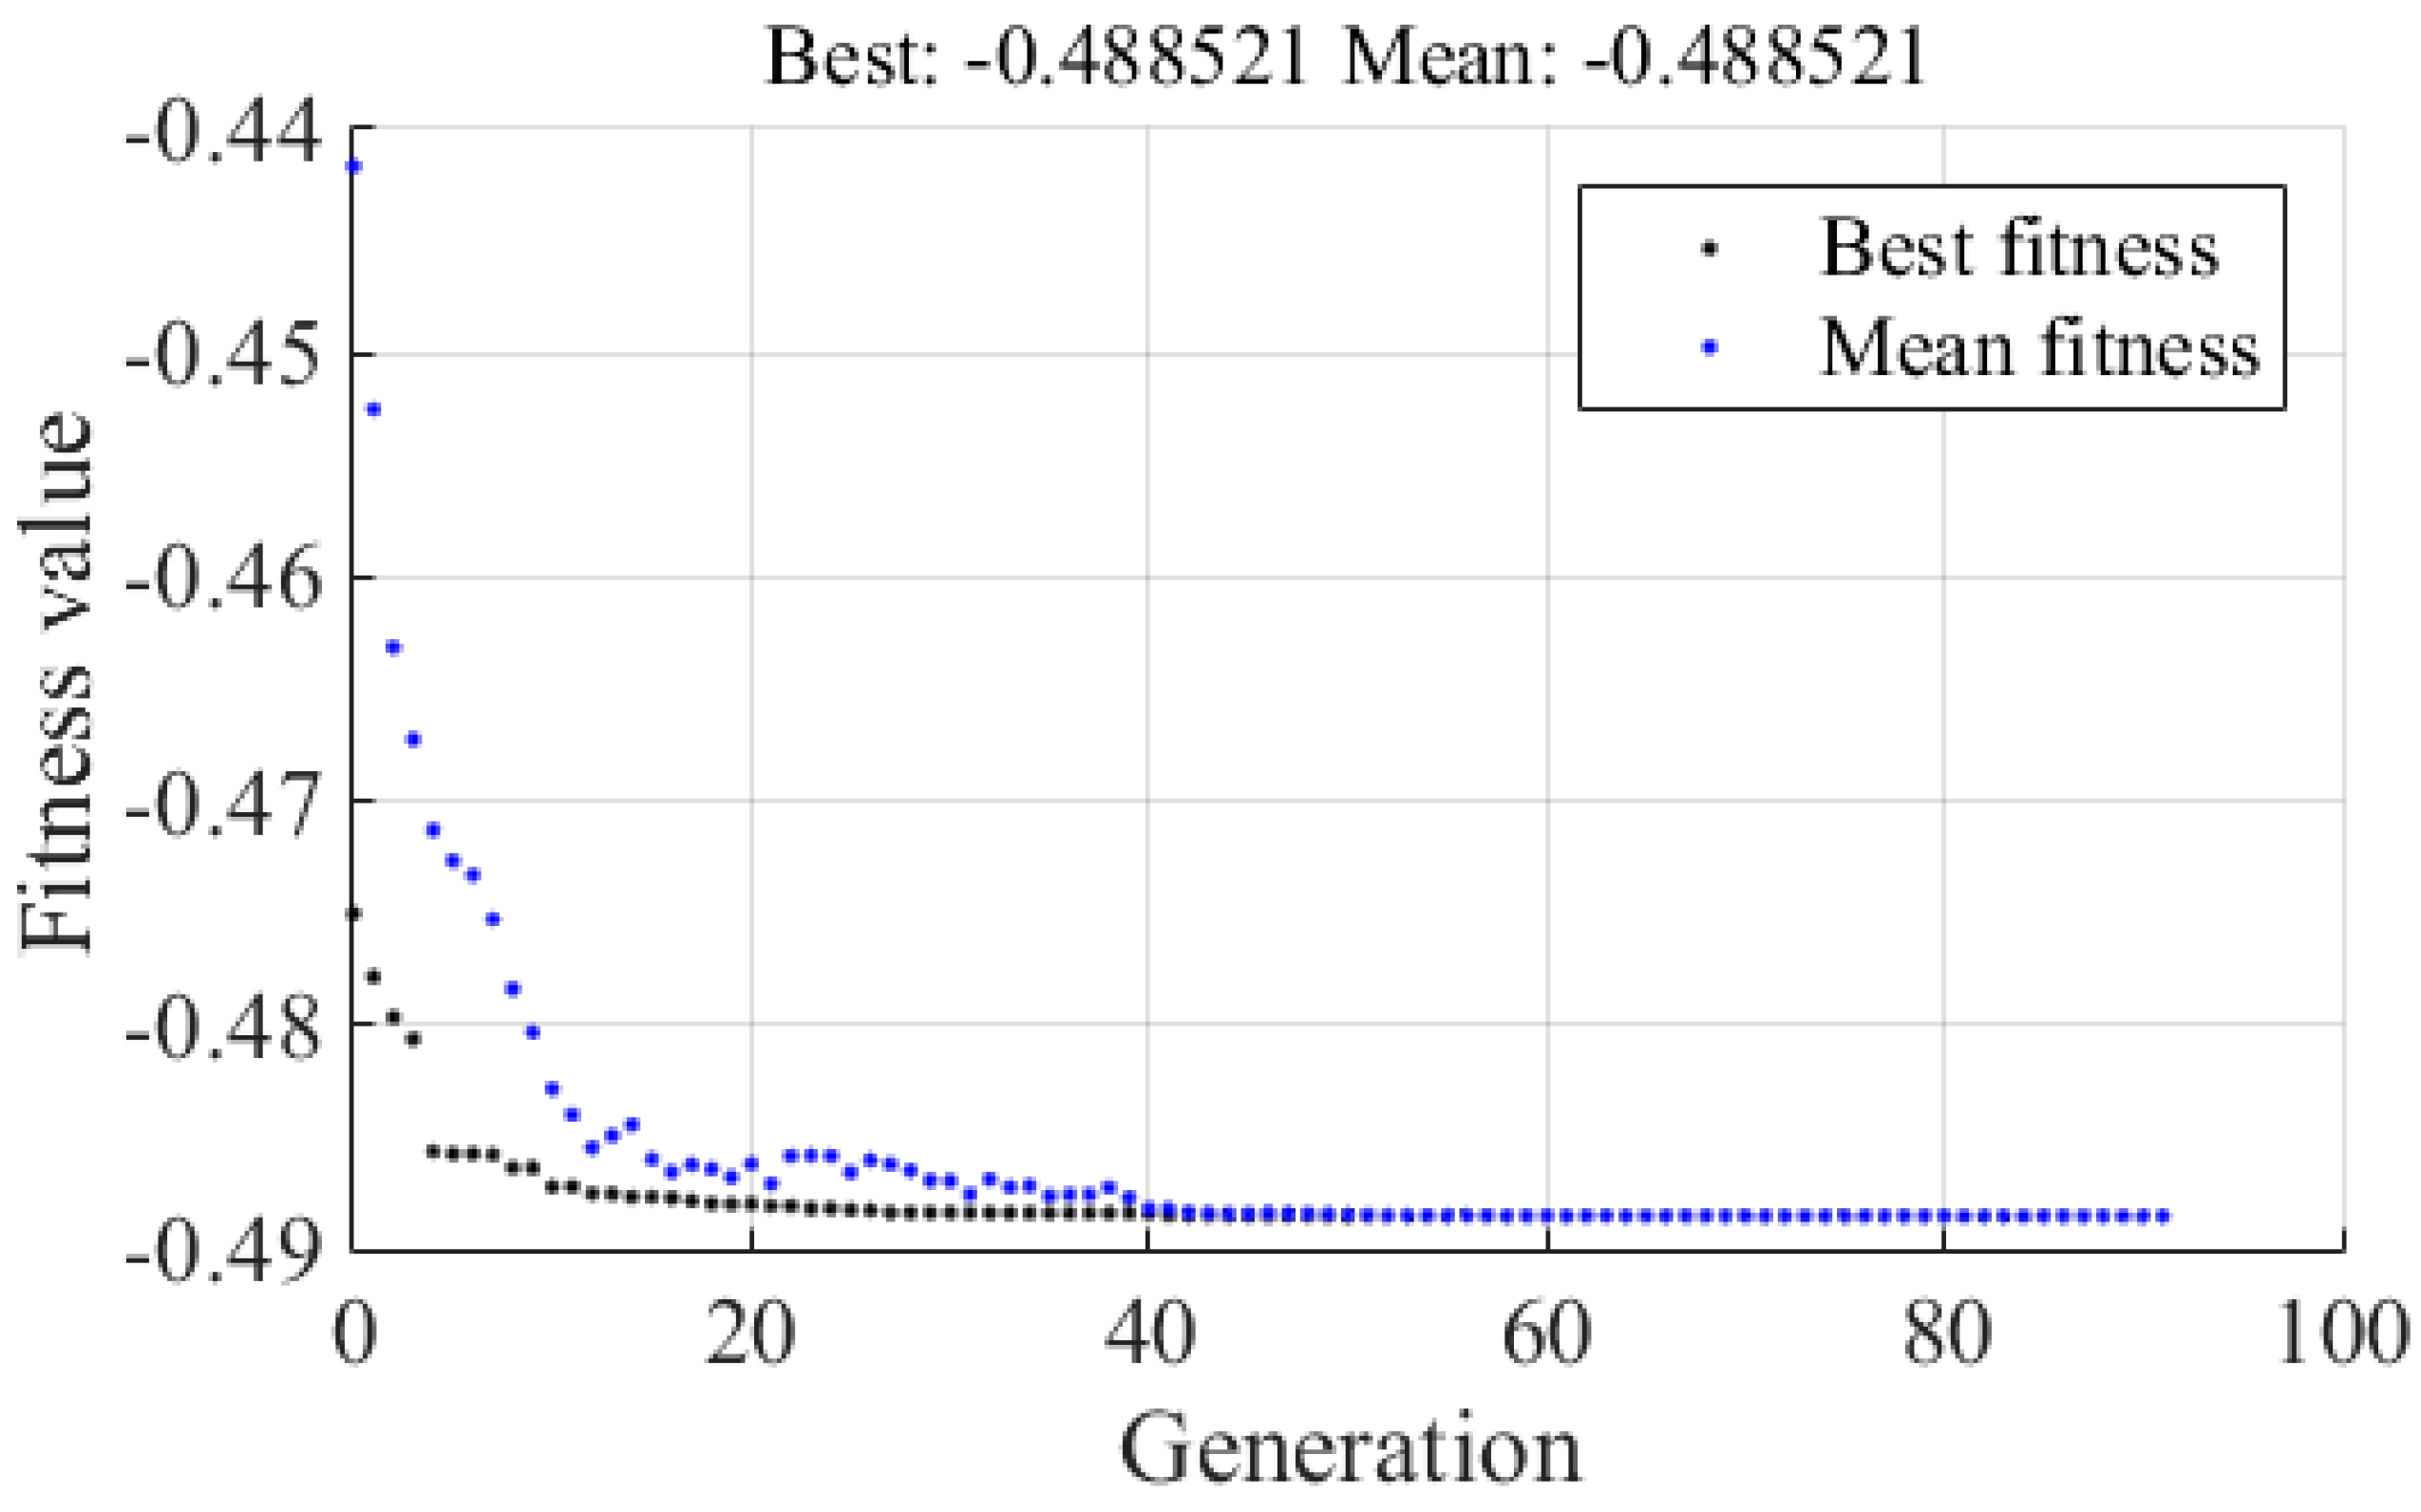
3. Cycle Optimization Using a Genetic Algorithm

For the current study, four parameters were considered for the optimization process, i.e., T 1 , P 1 , Pr, and x . The most frequently adopted optimization algorithm in the literature are genetic algorithms [34,35,36,37,38,39,40] and particle swarm optimizations [41,42,43]. Both genetic algorithms (G.A.s) and particle swarm optimization (PSO) are iteration-based and start with a pool of initial values and heuristic algorithms; however, the former uses discrete data and the latter uses continuous data. It is reported in the literature that both algorithms are extremely accurate, but PSO offers a relatively higher efficiency. On the other hand, G.A.s are more useful for constraint satisfaction problems. Therefore, the method opted for optimizing the present problem is a multiobjective genetic algorithm (MOGA). The design variables mentioned above with their high and low limits are displayed in Table 3. The well-known genetic algorithm has frequently been adopted in the literature [34,35,36,37,38,39,40] to work out global maximization and minimization problems. MOGA works on the principle known as survival of the fittest. Usually, MOGA is provided by several combinations of the design variables (Table 3) that are generated randomly, known as populations. The population size can be decided on the basis of the best practices found in the literature [41]. The MOGA tested each individual from the populations through a fitness function table. Usually, the top 1–5% individuals in the population are moved to the next generation unchanged, while the remaining population is generated through mutations and crossovers as displayed in the Figure 3. The process continues unless stopping criteria are met. The Matlab environment and a population size of 50 were used for the current optimization problem, as recommended in the literature [18,29] for five or fewer design variables. The rank and stochastic uniform of built functions were used for the scaling and selection. Elite size, crossover, and mutation fractions were used as 5%, 80%, and 15%, respectively. A forward migration factor of 0.2 was used and augmented. The Lagrangian function was used as a nonlinear constraint algorithm. All simulations were computed on a system with a Xeon processor and 128GB Ram. Computation time consumed by an optimization iteration was found to be around 7 hours.

4. Results and Discussions

The current study was conducted to analyze and optimize the recompression of the supercritical carbon dioxide cycle (sCO2-BC). A mathematical model was based on abrupt variations in the thermophysical properties of the sCO2 The cycle was developed by coupling NIST’s Refprop with the main cycle simulation code. Initially, the effects of the various cycle components such as the recuperator, compressor, and turbine performance were investigated on the overall performance of the sCO2-BC. Later, the effects of critical operating parameters on the cycle’s performance were analyzed, i.e., T 1 , P 1 , Pr, and x . Lastly, these parameters were optimized using a genetic algorithm to maximize the overall performance of the sCO2-BC.
For the validation of the code, current work was compared with the available data in the literature, as listed in the Table 4. This showed the computed results using the employed model are in close agreement with the published data.
It can be seen from Figure 1 that the main flow stream after the high-temperature recuperator (HTR) divided into two creeks, i.e., 10a and 10b. The flow toward 10a with a split mass fraction “x” was directed to the central compressor after passing through the cooler, while fraction “1 − x” of the flow passed through the recompression compressor. This was done to avoid early pinching within the low-temperature recuperator. Split streams, which were 3 (after gaining heat from the LTR) and 5 (from the re-compressor) combined again, forming stream 4. There is an optimized value of “x” for any set of operating conditions for maximum cycle efficacy. Figure 4 shows how split mass fractions affect the cycle’s performance and its components. It can be visualized that cycle efficiency increased at first with the rise in the value of split mass fraction “x”, reaching a maximum value and then decreasing. Thus, only a single value of “x” exists for which the cycle’s efficiency is maximum. The split mass fraction’s optimized value corresponds to the minimum temperature difference between streams 3 and 5, as shown in Figure 5. Moreover, Figure 5 shows a variation in the values of T 3 , T 5 , and cycle efficiency with split mass fraction. Cycle efficiency was maximum for the split mass fraction value of 0.82, corresponding to a minimum difference, as shown by the dotted line. The effects of the split mass fraction on the component’s power can also be seen in Figure 4. It can be seen here that the primary compressor’s power increased with the surge in the value of split mass fraction, while that of the recompression compressor and turbine decreased.

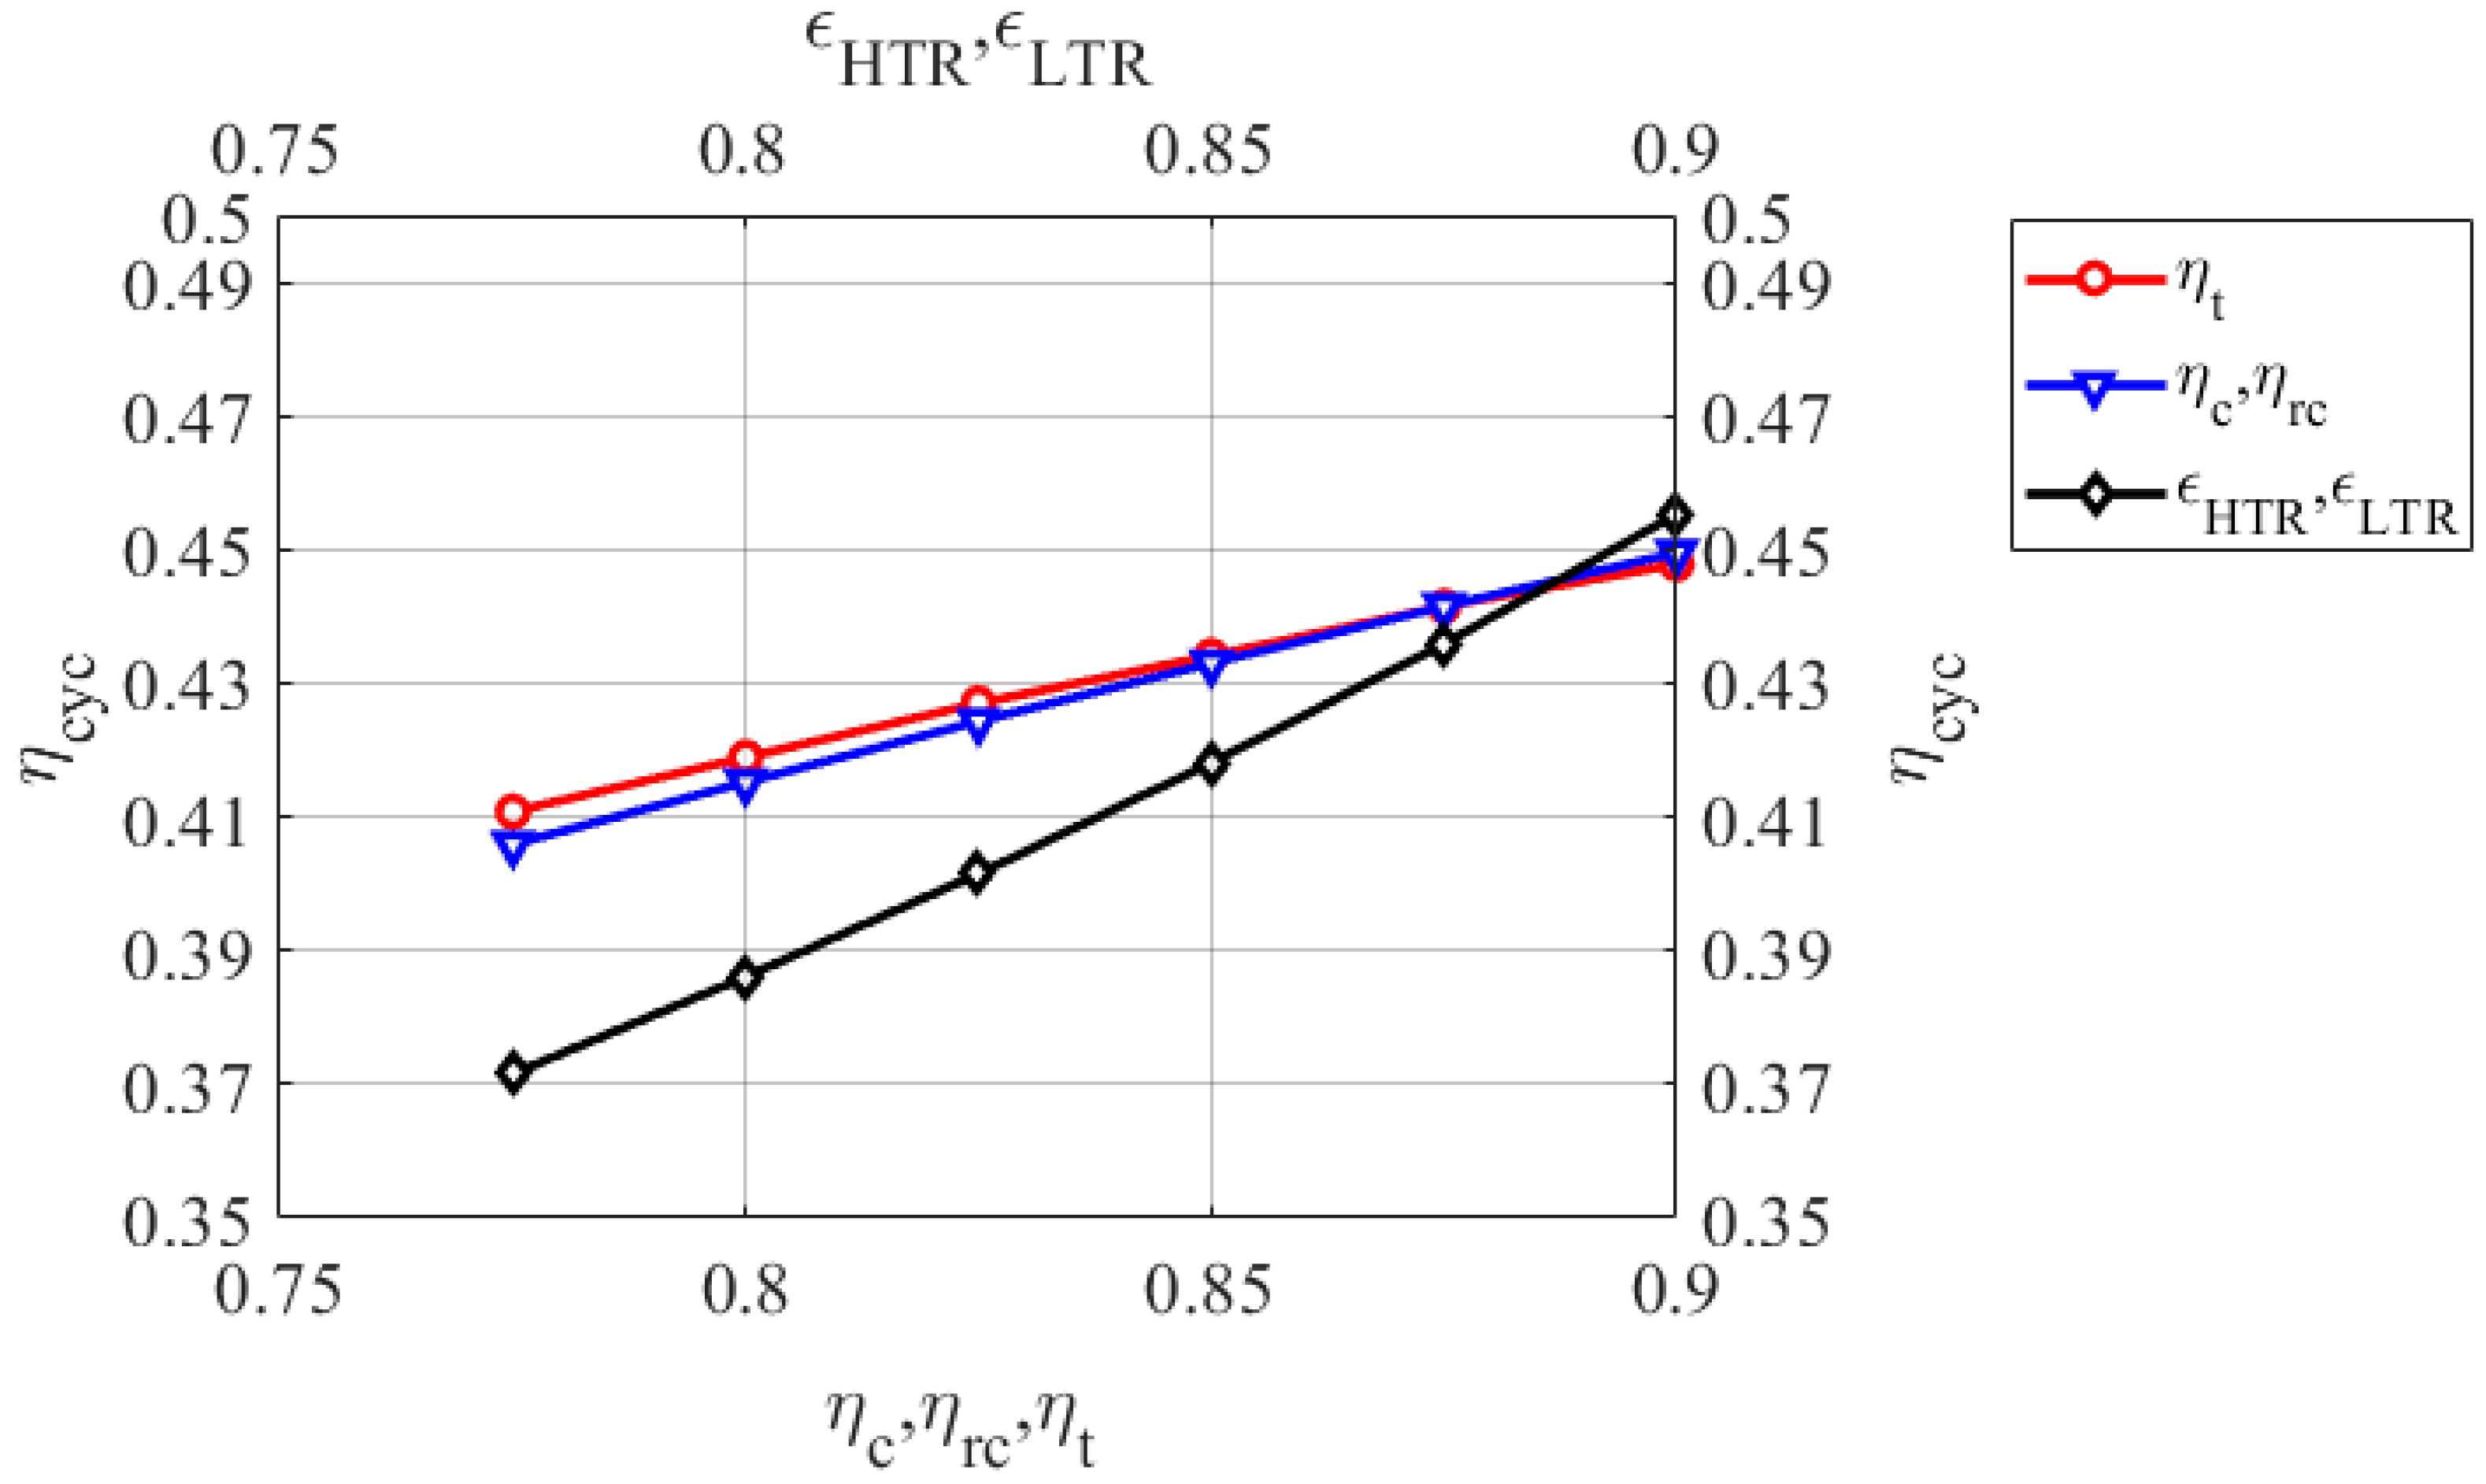
4.1. Effect of Cycle’s Components’ Performance on the Cycle’s Overall Performance

Figure 6, Figure 7, Figure 8 and Figure 9 reveal the impact of the components’ performances on the performance of sCO2-BC. Figure 6 shows the variations in the cycle’s efficiency ( η c y c ) with a split mass fraction for numerous combinations of effectiveness of the high-temperature recuperator and low-temperature recuperator. A significant increase in the cycle’s efficiency was observed, with an increase in value effectiveness for both recuperators. Specifically, an increase in the effectiveness from 0.9 to 0.98 increases the cycle’s efficiency by 22.5%. Moreover, it can be seen that an increase in the recuperator’s performance affected the split mass fraction’s optimal value. The value x decreased marginally with a rise in the effectiveness values of the recuperator. Figure 7 shows a modification of the cycle’s efficiency with a split mass fraction for various turbine efficiency values. It was observed that turbine performance significantly affects the cycle’s performance; a 2% increase in the turbine’s performance increased the cycle’s performance by 1%. A slight decrease in the values of optimized split mass fraction can also be seen in Figure 7, with an increase in the turbine’s efficiency. This reflects that load on the main compressor will decrease with an increase in the value of the turbine’s efficiency. It should also be noted that the sensitivity of the cycle’s performance to the effectiveness of the recuperator increases with an increase in the value of the split mass fraction as the η c y c curve diverges along with the increasing value of x . Additionally, the sensitivity of η c y c to η t decreases with the growth in x. Figure 8 shows the variation in η c y c with the disparity in the evaluation of x for various values of η c and η r c . Results suggest that η c y c curves exist with various η c = η r c values. Similar trends are displayed by η c y c curves in Figure 7 for different values of η t . Cycle efficiency significantly increased with an upsurge in the compressor’s efficiency. The value of the optimal split mass fraction shifted toward lower values of the split mass fraction with an upsurge in the value of η t . Moreover, the sensitivity of η c y c with η c deceased with an increase in the value of the split mass fraction. Figure 9 shows a comparison of how performance parameters associated with the cycle components affected the overall cycle’s performance. It can be seen that the cycle’s performance was most vulnerable to the recuperator’s performance, followed by the performance of the turbomachinery.

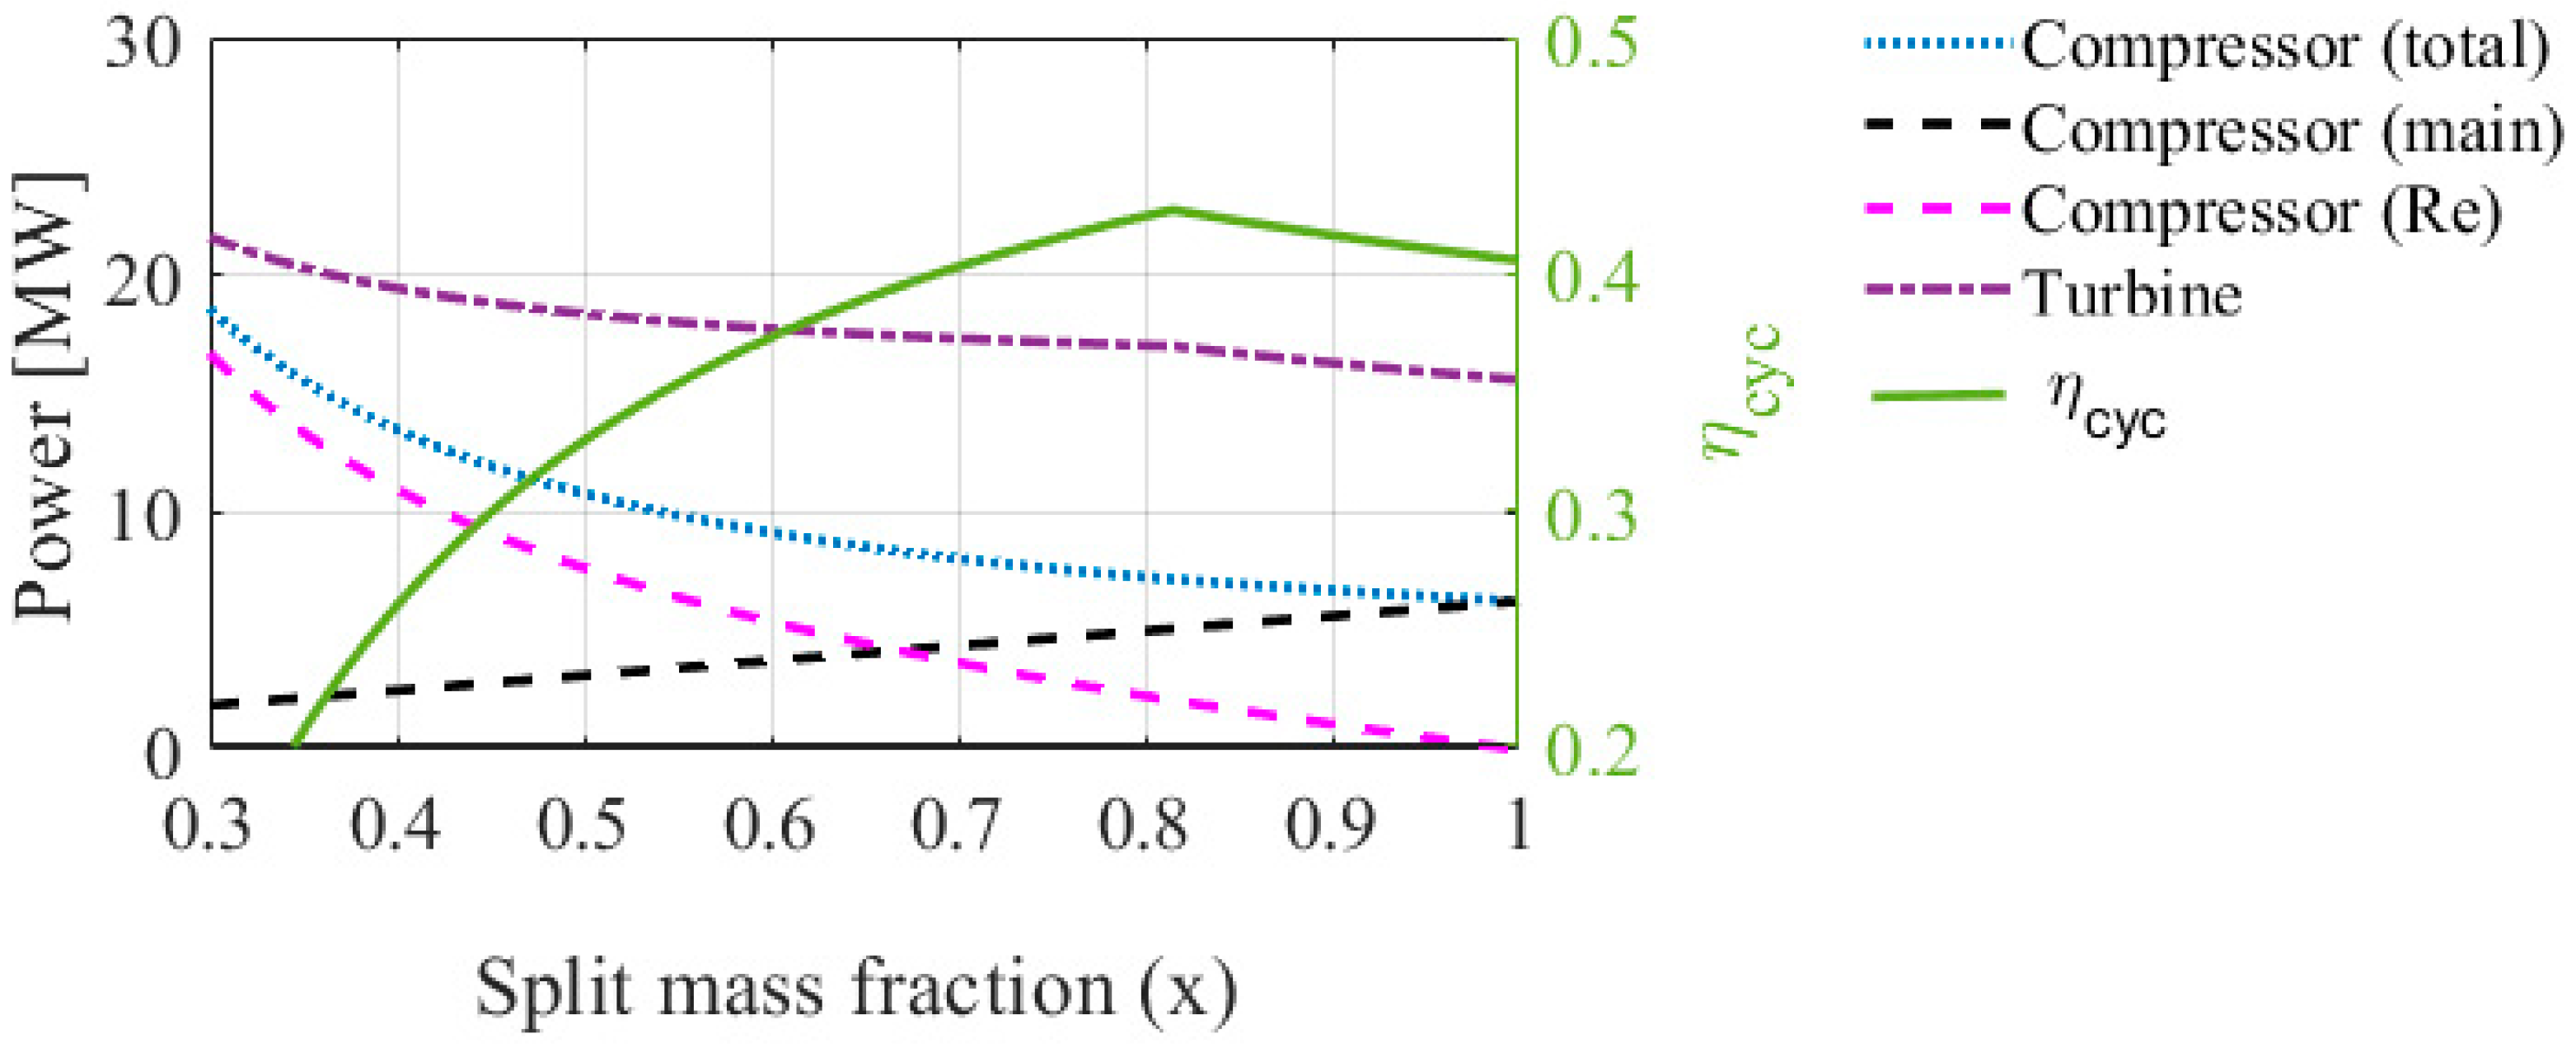
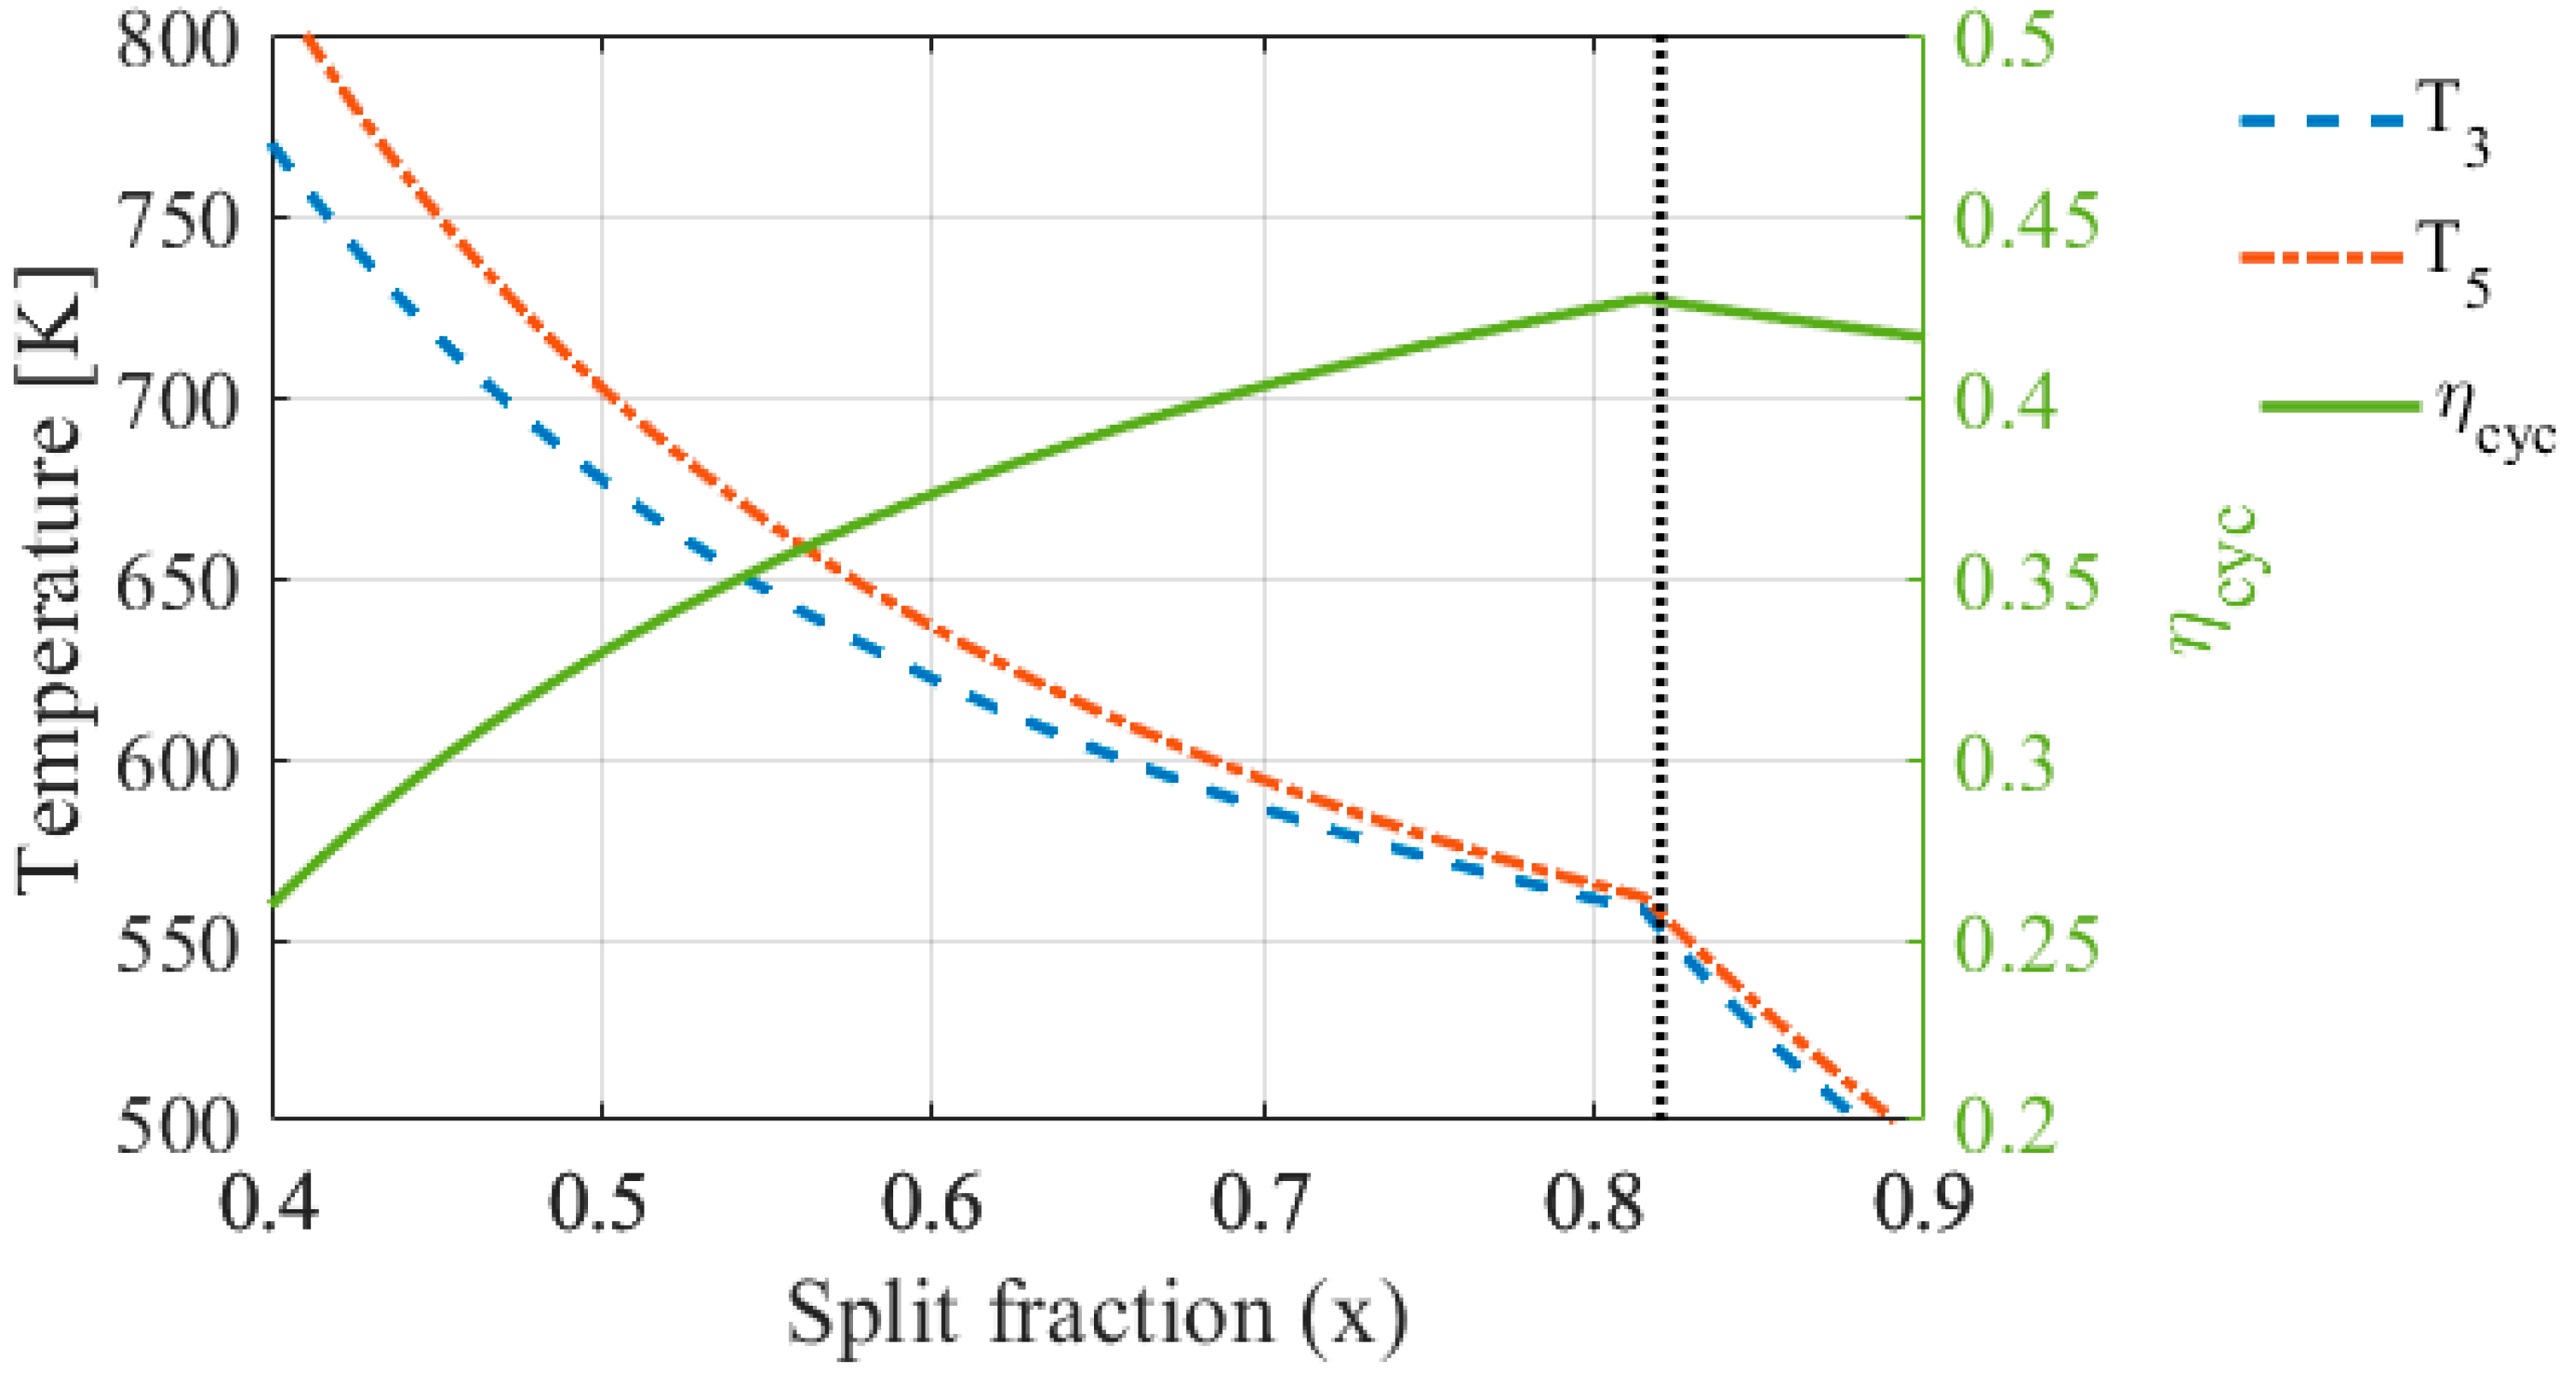
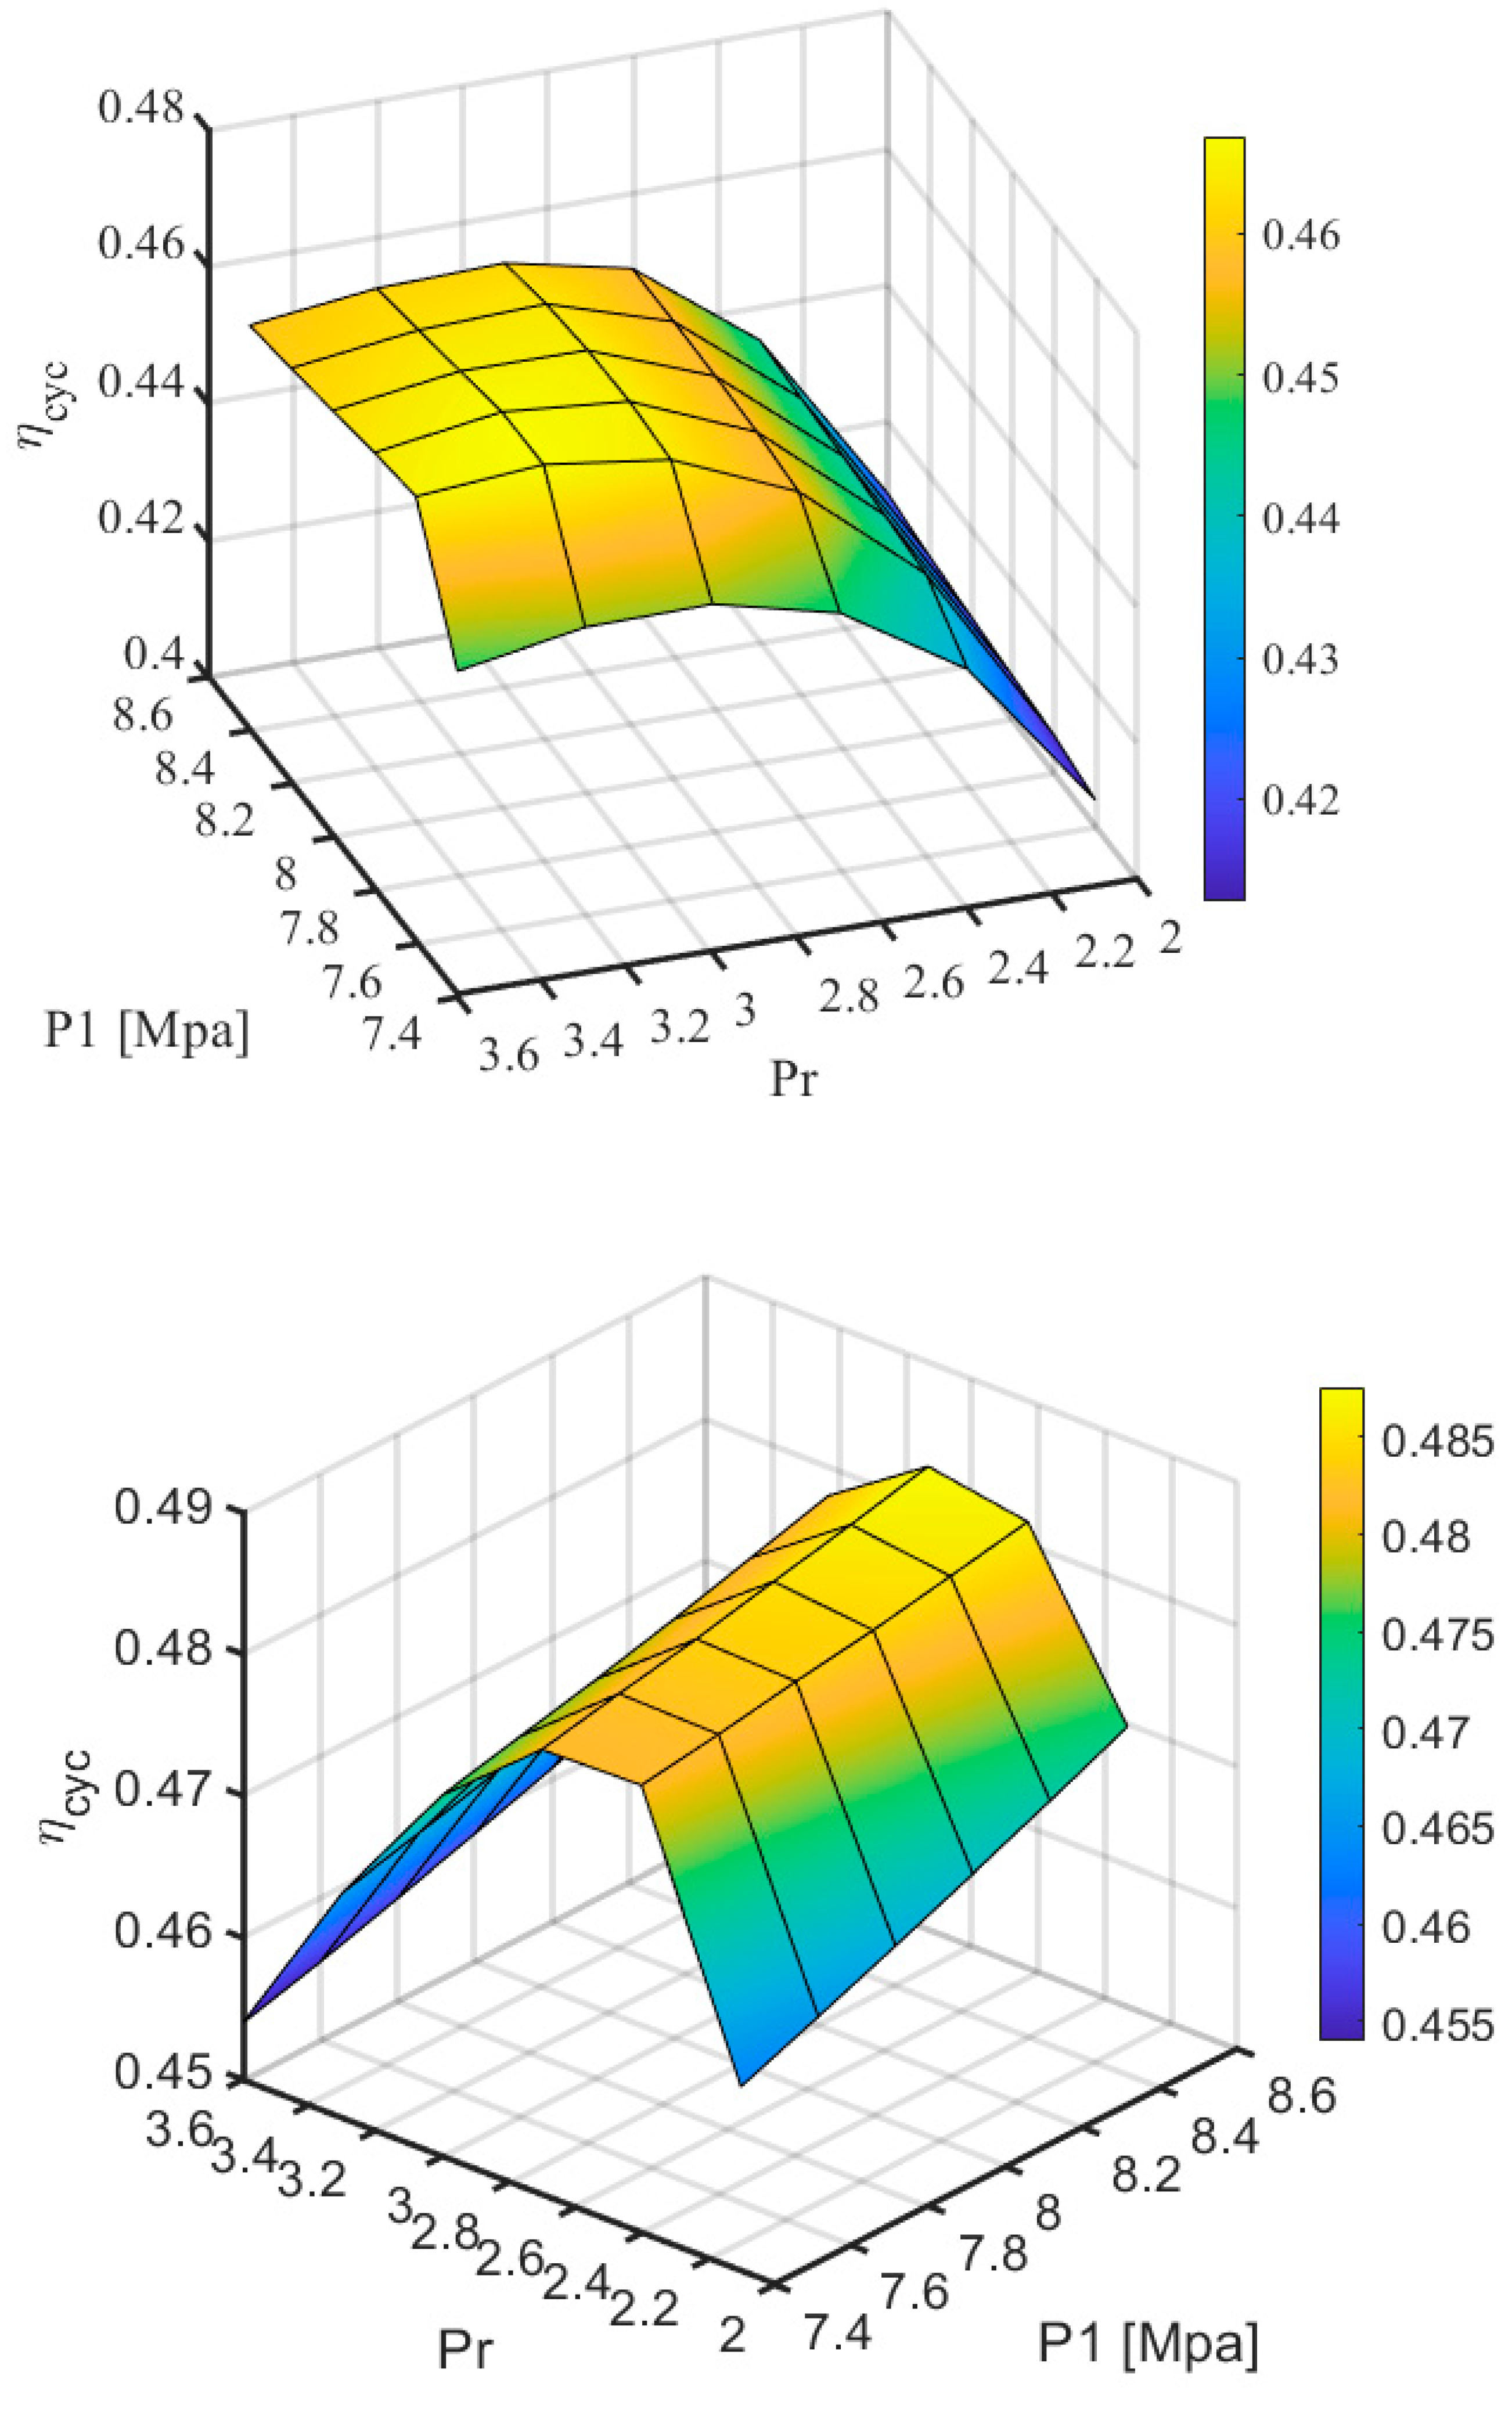
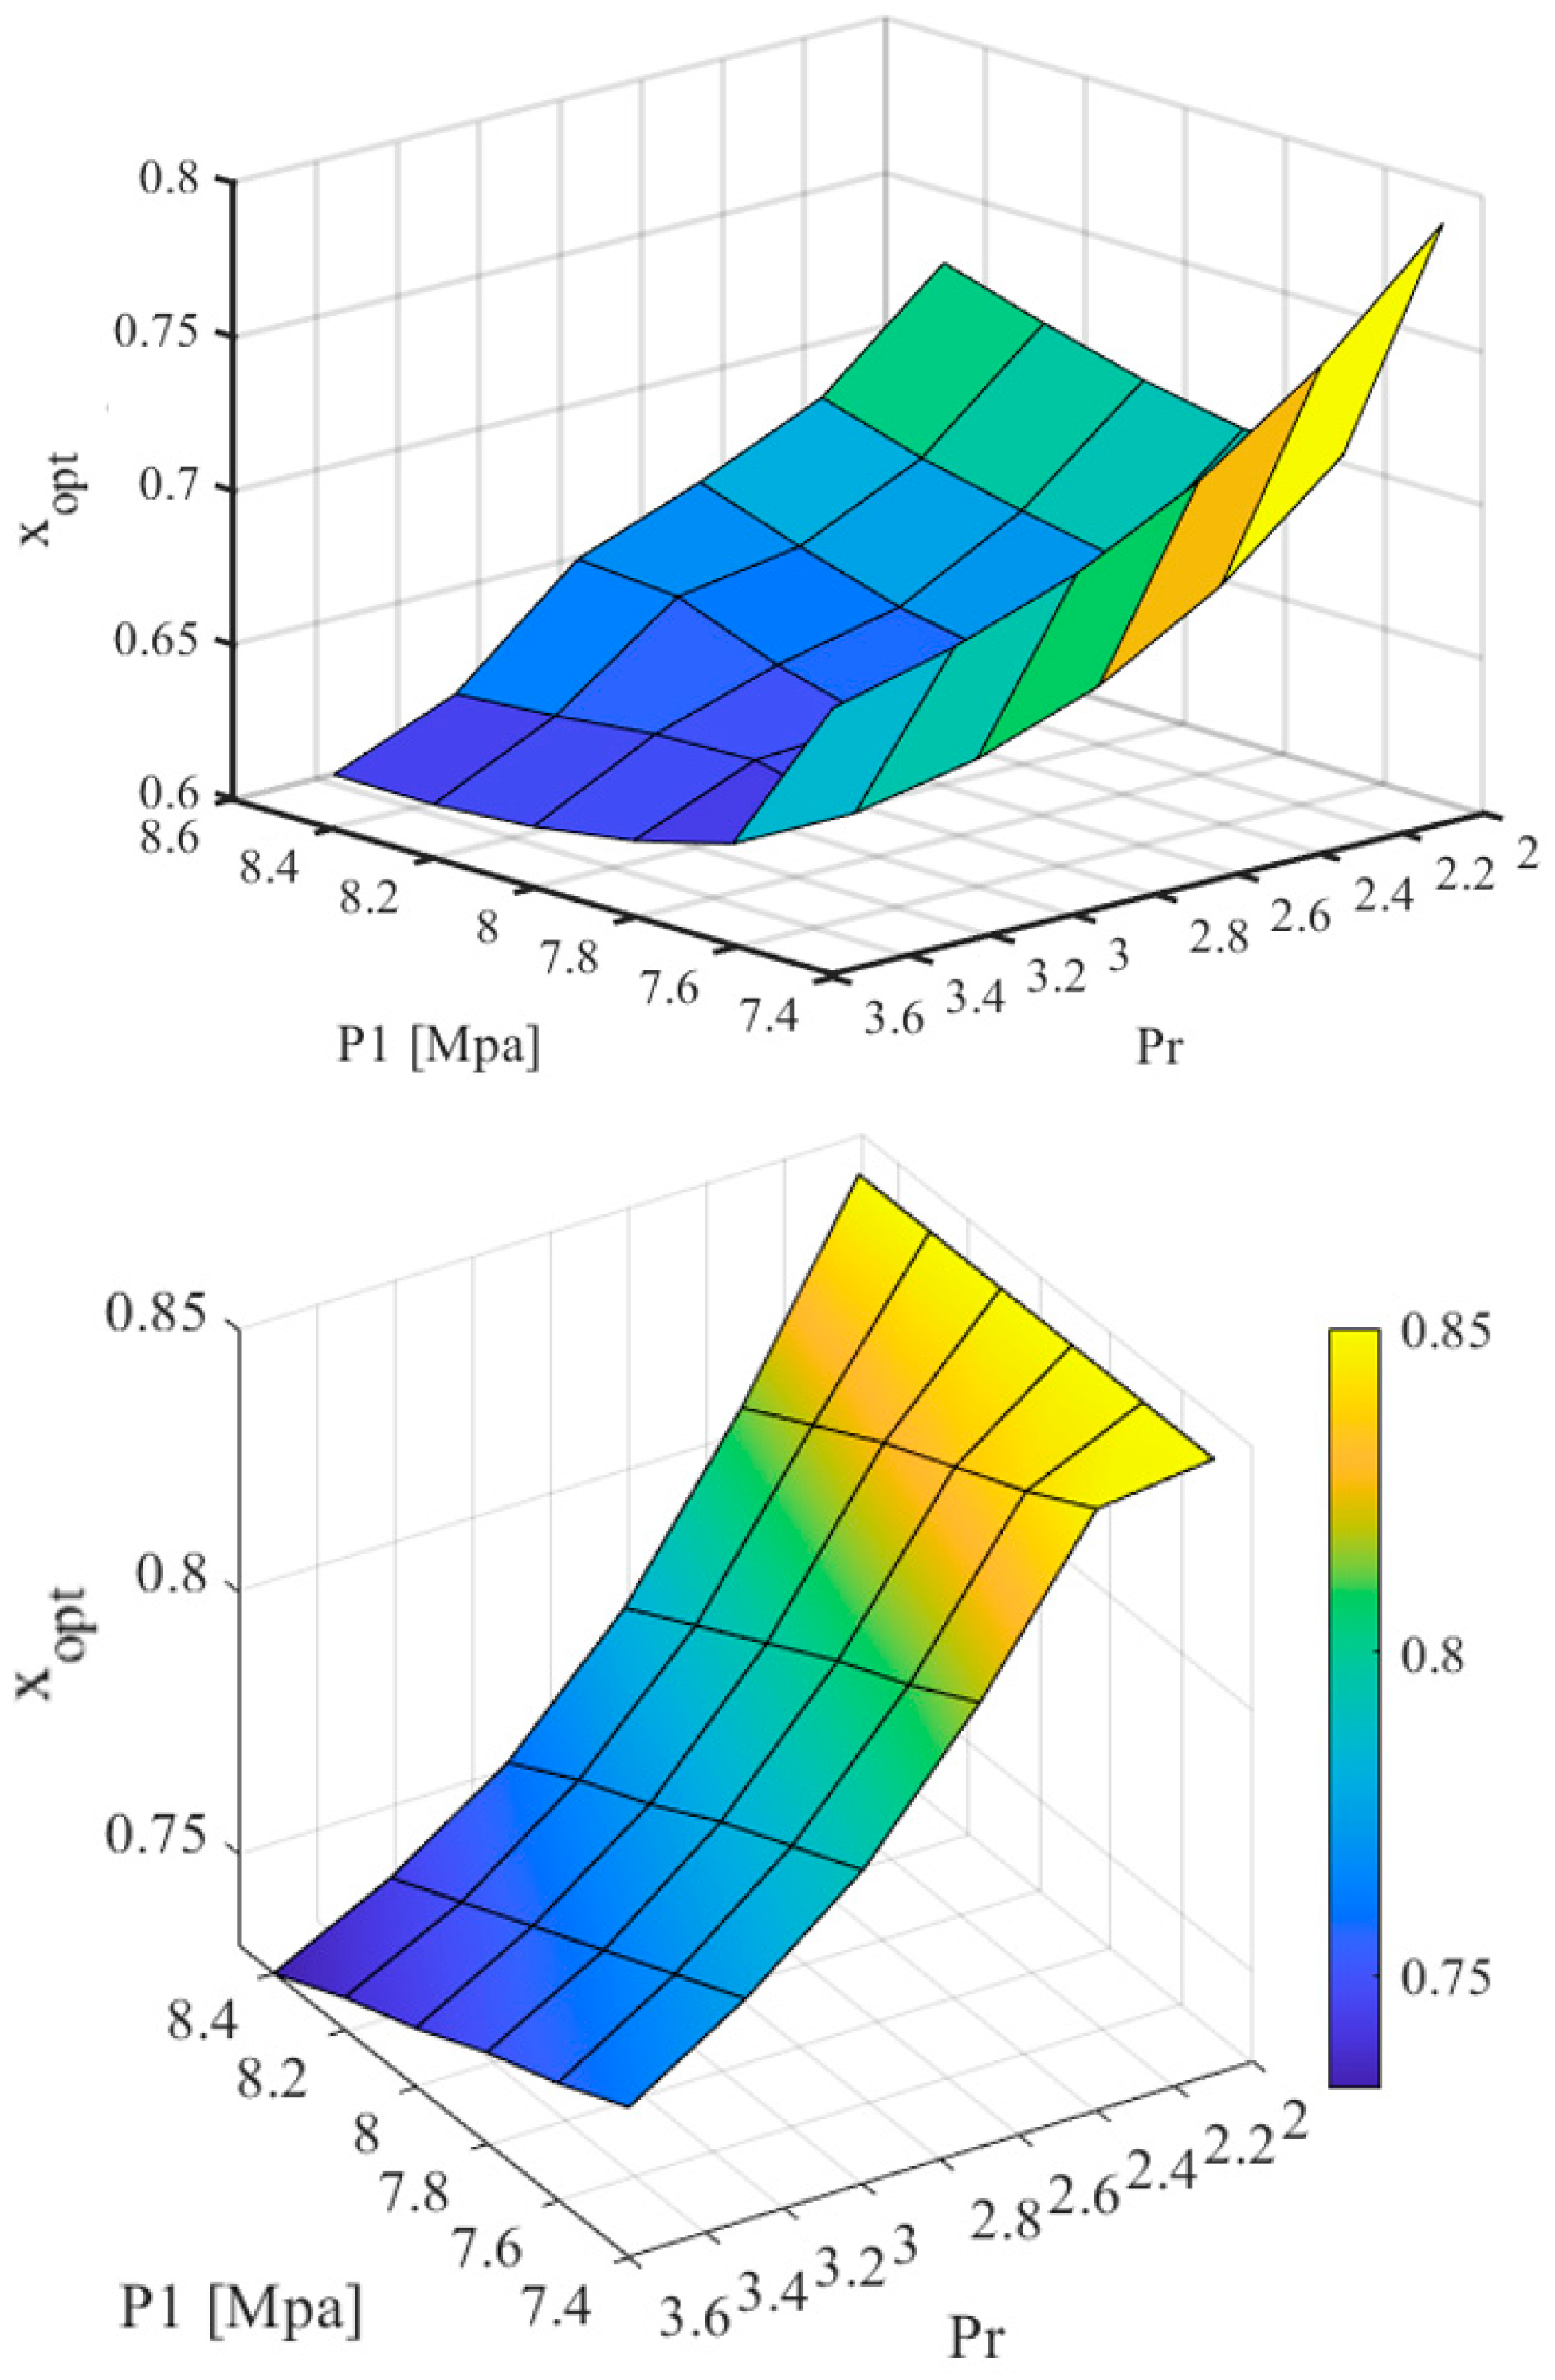
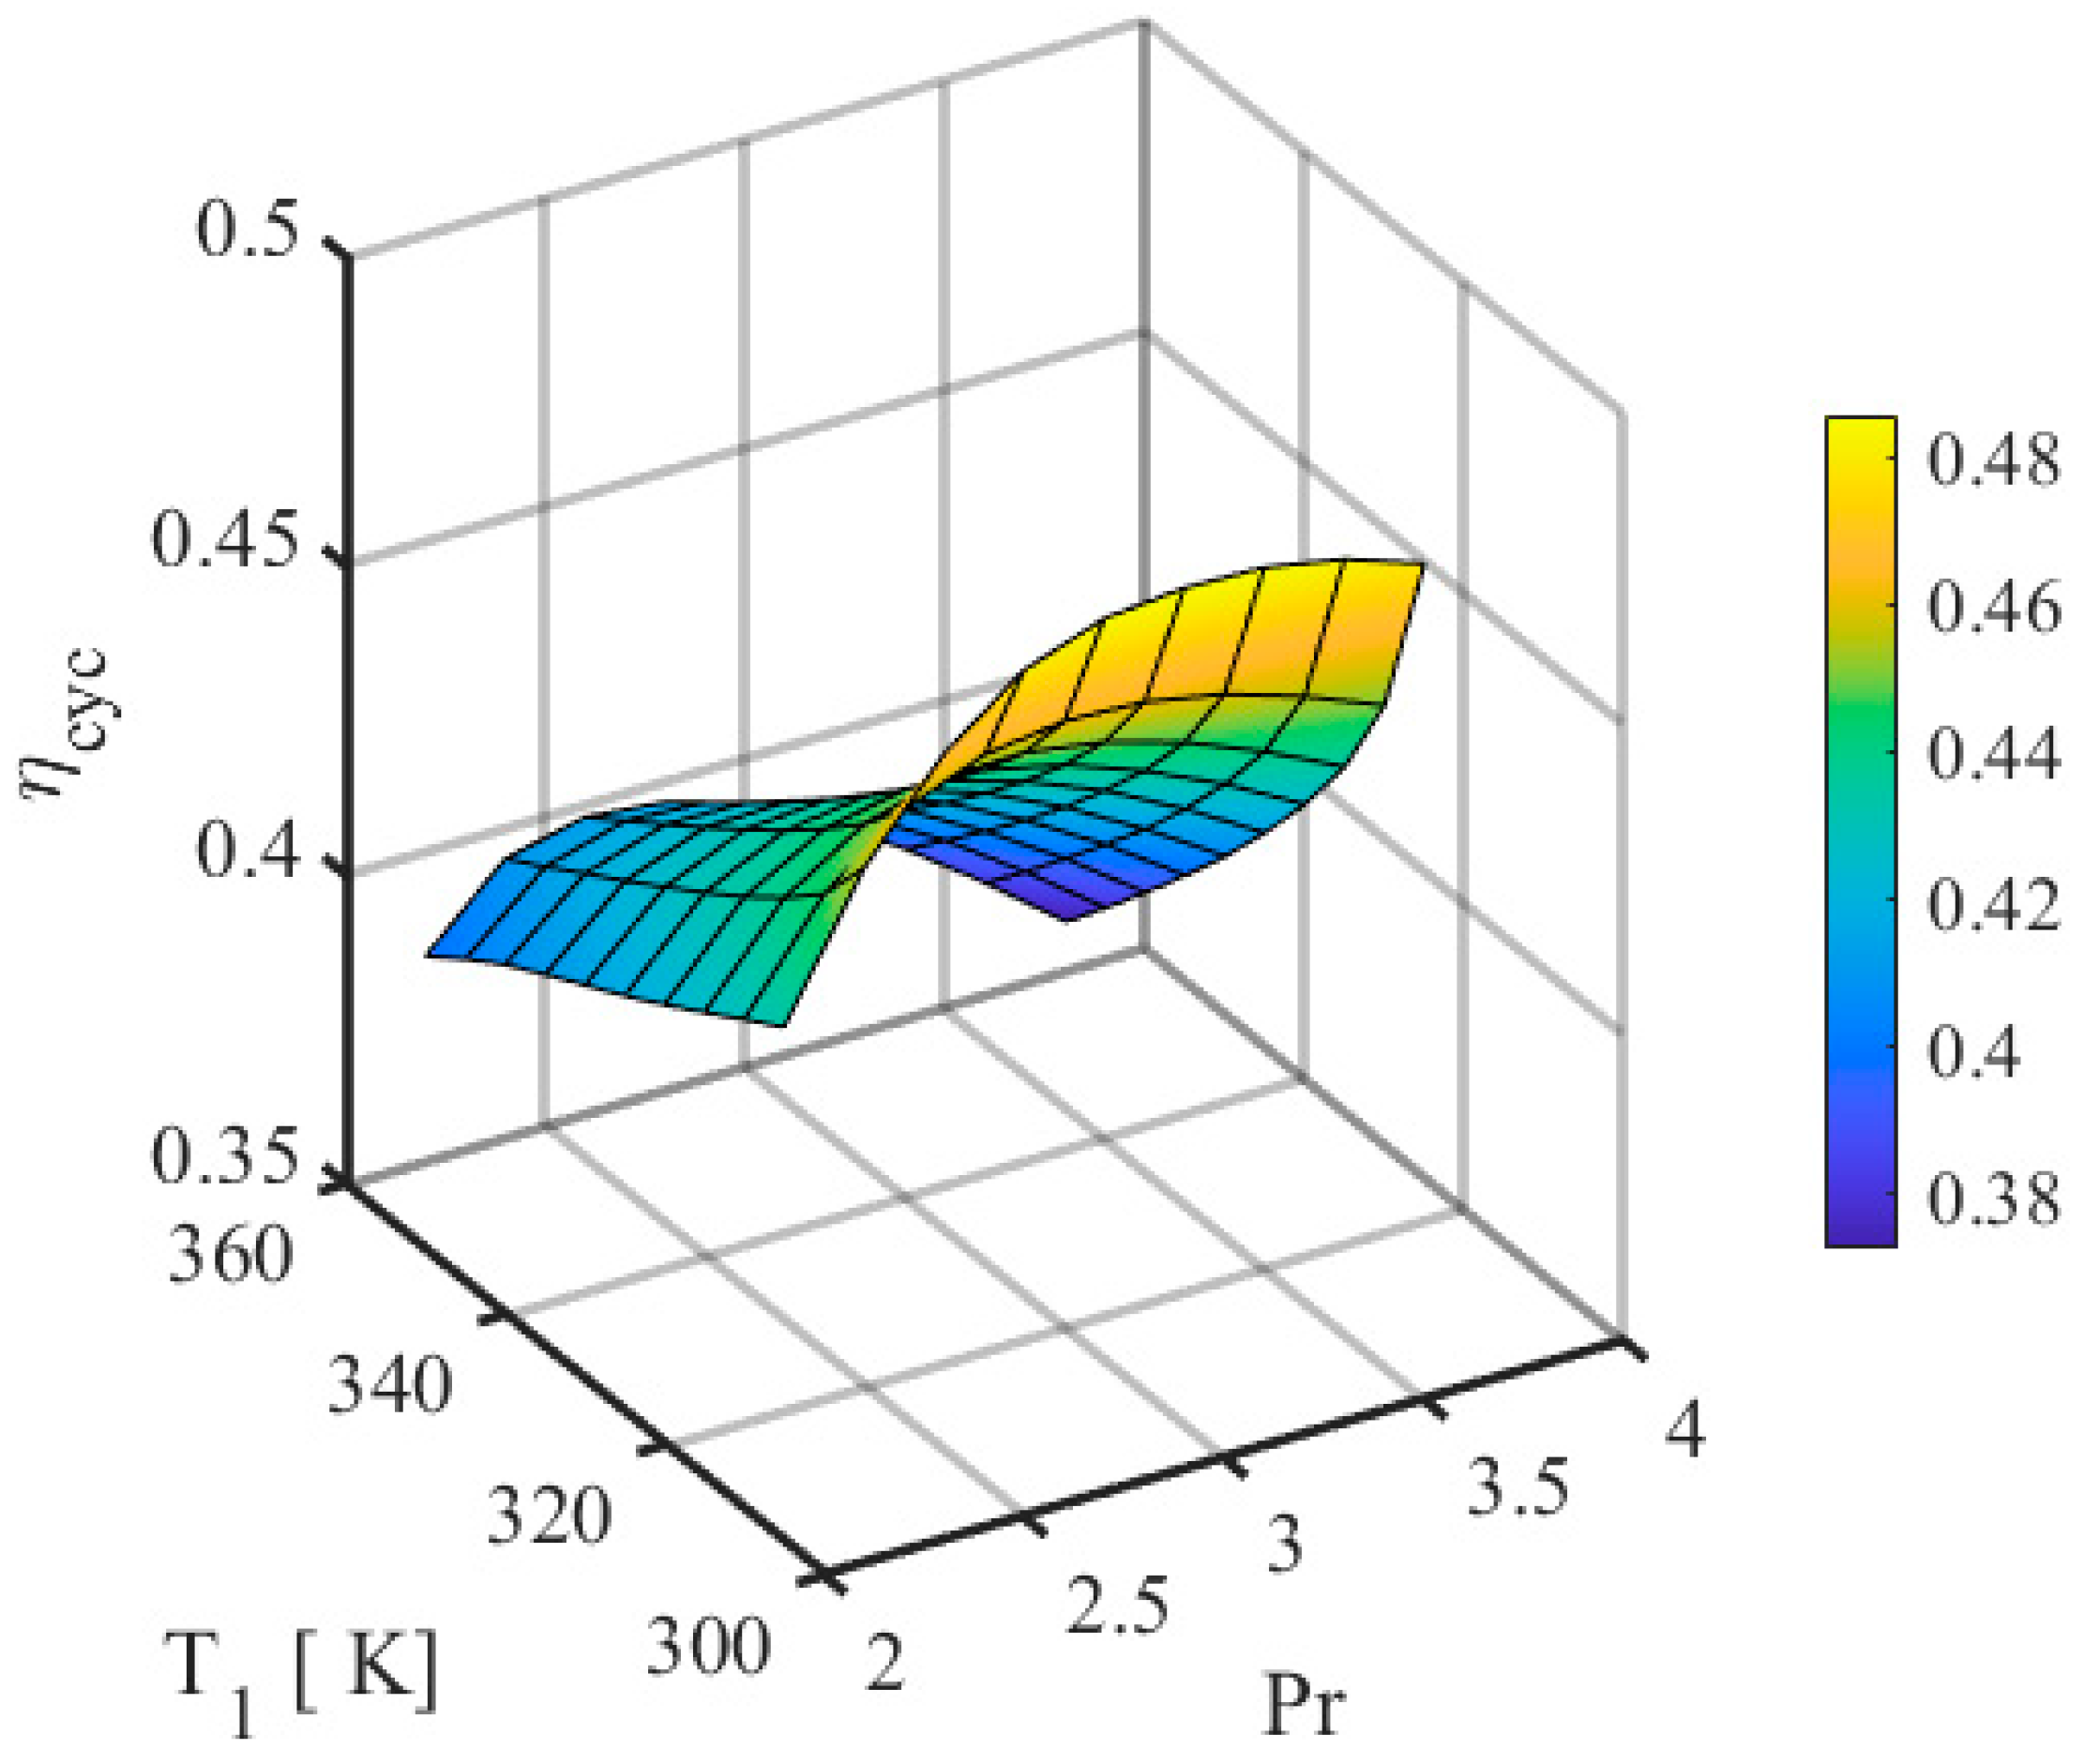
4.2. Effect of the Cycle’s Parameters on Its Performance

The cycle’s performance is highly dependent on its selected value parameters. Cycle components are designed on the basis of these parameters. Nevertheless, the selection of cycle parameters under required conditions is tricky and requires extensive cycle simulations. The most sensitive parameters for the recompression sCO2-BC are compressor inlet temperature ( T 1 ) compressor inlet pressure ( P 1 ), split mass fraction ( x ) , and cycle pressure ratio. The influence of the abovementioned cycle parameters on the cycle’s performance was analyzed in the current study, followed by its optimization using the genetic algorithm. Figure 10, Figure 11, Figure 12 and Figure 13 show the dependence of the cycle’s split mass fraction and the cycle’s efficiency on the parameters of the cycle—i.e., inlet temperature ( T 1 ) compressor inlet pressure ( P 1 ) and cycle’s pressure ratio. Figure 10 displays a response of the surface bounded by the two-cycle operating parameters, compressor inlet pressure, and cycle’s pressure ratio. Response surface shows that the cycle’s efficiency is more sensitive to the pressure ratio than the compressor inlet pressure. The cycle efficiency, which is dependent on the pressure ratio, is relatively prominent at higher values of pressure ratio when the compressor’s inlet pressure is close to the critical value of the pressure for sCO2—i.e., 7.34 MPa. On the other hand, the cycle’s efficiency is equally sensitive to the cycle’s pressure ratio for all values of compressor inlet pressure. The cycle’s efficiency increases initially when the rise in the value of the P r reaches a maximum value and then drops with further increase in the value of the cycle’s pressure ratio. Thus, there exists an optimal value of the pressure ratio corresponding to each value of the compressor’s inlet pressure ( P 1 ). This value shifts towards a lower value of the cycle’s pressure ratio with an increase in the value of the compressor’s inlet pressure ( P 1 ). Figure 11 shows variations of the optimized split mass fraction with the compressor’s inlet pressure ( P 1 ) and cycle’s overall pressure ratio. The graph shows that the optimized split mass fraction is overly sensitive to the compressor’s inlet pressure for all the pressure ratio values. The split mass fraction decreases initially with an increase in the value of ( P 1 ) then it starts increasing with further increase in the value of ( P 1 ). However, x o p t was also significantly affected by P r . Initially, x o p t decreased rapidly with an increase in the value of P r although this variation leveled off at higher values of P r .
Figure 12 shows the variation in η c y c with compressor inlet temperature ( T 1 ) and cycle overall pressure ratio ( P r ) . It dictates that the cycle’s efficiency was quite sensitive to the pressure ratio for all values of the compressor’s inlet temperature ( T 1 ) . However, its sensitivity to the pressure ratio was more prominent when the compressor’s inlet temperature was close to the critical temperature value of C O 2 . For all values of T 1 , η c y c increased initially and reached a maximum value before dropping with a further increase in the value of P r . Thus, there exists an optimized value of the P r corresponding to each value of T 1 that shifted toward the lower value of P r at higher values of T 1 . On the other hand, η c y c was significantly affected by the value of T 1 . At any fixed value of r , η c y c declined with the growth in the value of T 1 . It can be seen that η c y c was sensitive to compressor inlet temperature escalations with a rise in P r . Moreover, the cycle’s efficiency was significantly higher when the compressor’s inlet temperature was close to the critical temperature T c that decreased rapidly as T 1 moved away from T c Figure 13 represents a response surface bounded by T 1 and P r . It shows that x o p t was influenced by both the compressor inlet temperature and the cycle pressure ratio. The value of x o p t decreased initially and then, after a certain pressure ratio for which its value was minimum, it started increasing. On the other hand, the value of x o p t increased rapidly as the compressor inlet temperature moved away from T c ; however, at higher values of T 1 , the rate of increase in the value of x o p t became smaller. Thus, it can be depicted from here that selection of T 1 is crucial for the main and re-compressor sizes.

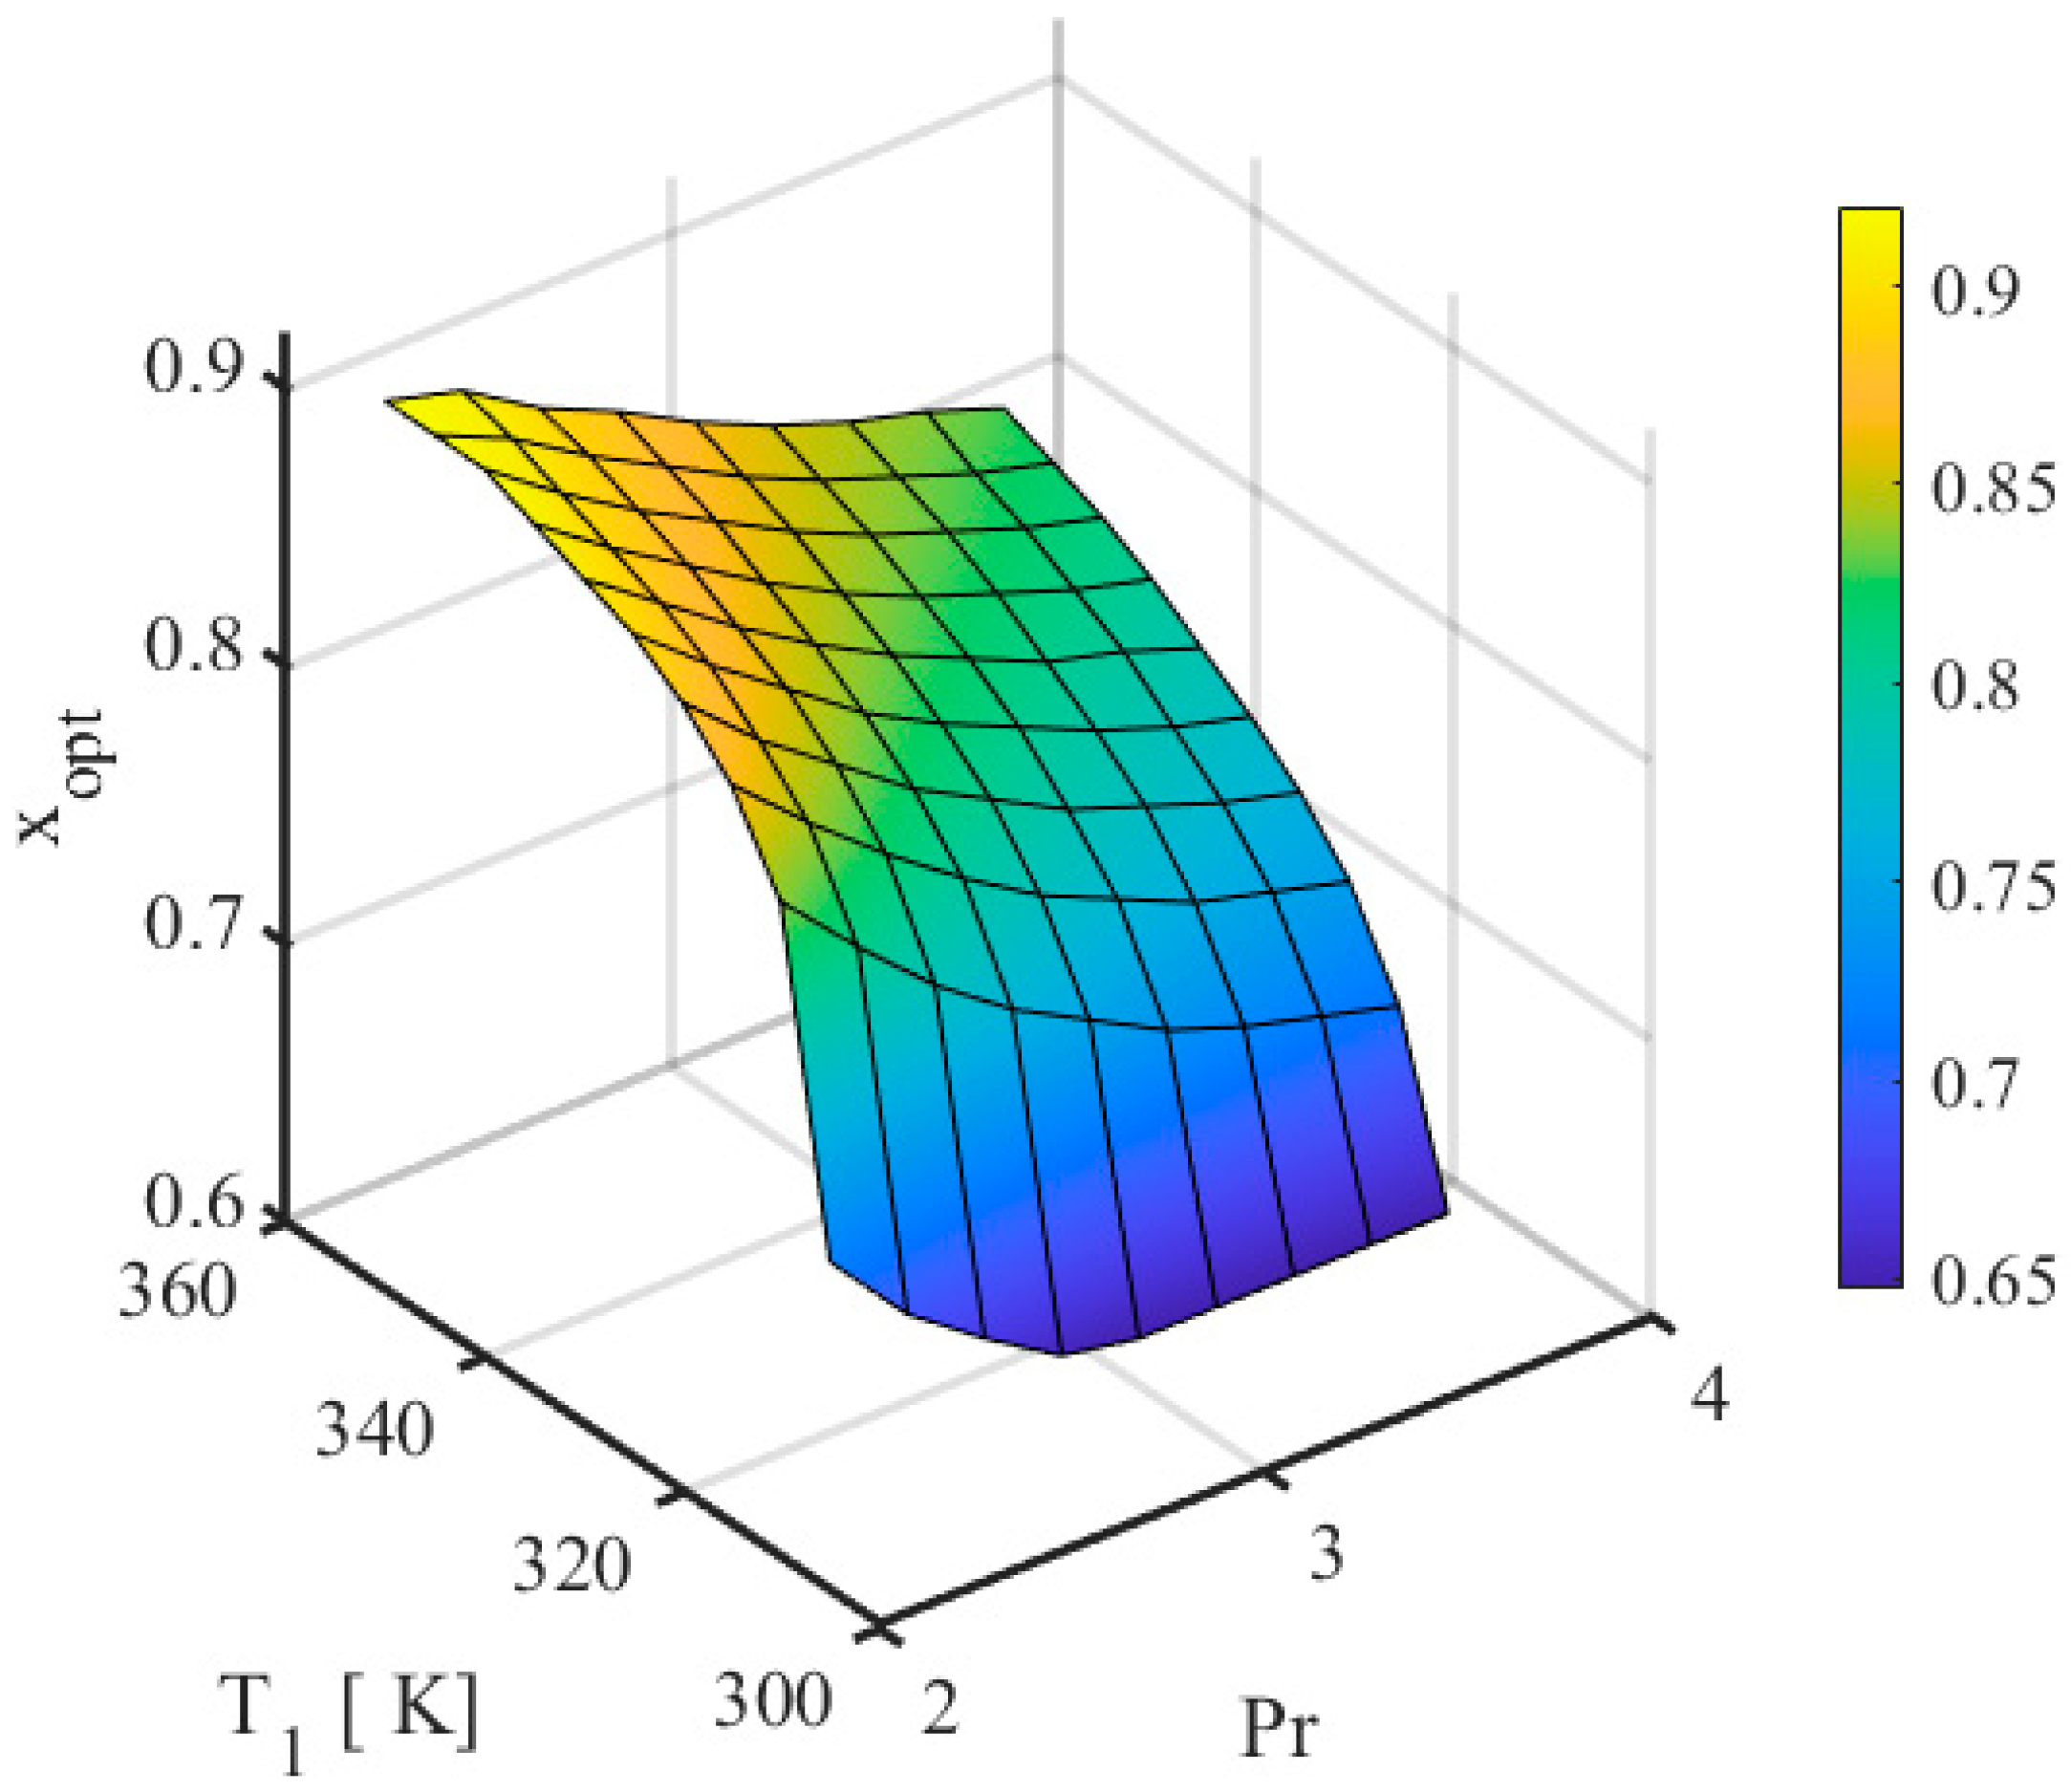
4.3. Optimization of sCO2-BC Parameter

The above-discussed results reveal that the cycle’s performance was susceptible to the operating parameters associated with sCO2-BC, i.e., compressor inlet temperature ( T 1 ) , compressor inlet pressure ( P 1 ), cycle pressure ratio P r , and split mass fraction. An optimization procedure was required to compute the optimal values of the operating conditions under which cycle components would be designed in later stages. For the current study, the design variables selected for the optimization study are listed in Table 3. A genetic algorithm was adopted for the optimization study, the details of which are available in Section 3. The cycle simulation code explained in Section 2 of the manuscript was used as a fitness function for the optimization procedure. The convergence of the genetic algorithm is shown in Figure 14. The genetic algorithm was converged in 90 iterations, as shown in Figure 14. For the current optimization procedure, two cases have been studied. Case I has been defined and optimized with no constraints, while for case II one constraint has been defined—i.e., T 1 > 310 . This constraint has been defined due to abrupt variations in the properties of CO2 near the critical point that can lead the system to instability during off-design conditions. Results of both cases have been listed in Table 5.

5. Conclusions

In the current study, a mathematical model for sCO2-BC was developed and coded in Matlab©. An in-house code was used to couple NIST’s Refprop with Matlab© to evaluate the properties of sCO2. The effects of various cycle components were evaluated on the cycle’s overall performance. Moreover, the sensitivity of its operating conditions was studied with respect to its performance. Lastly, an optimization study using a genetic algorithm was carried out to optimize the cycle’s operating conditions and maximize the cycle efficiency. The following deductions were made from the study:
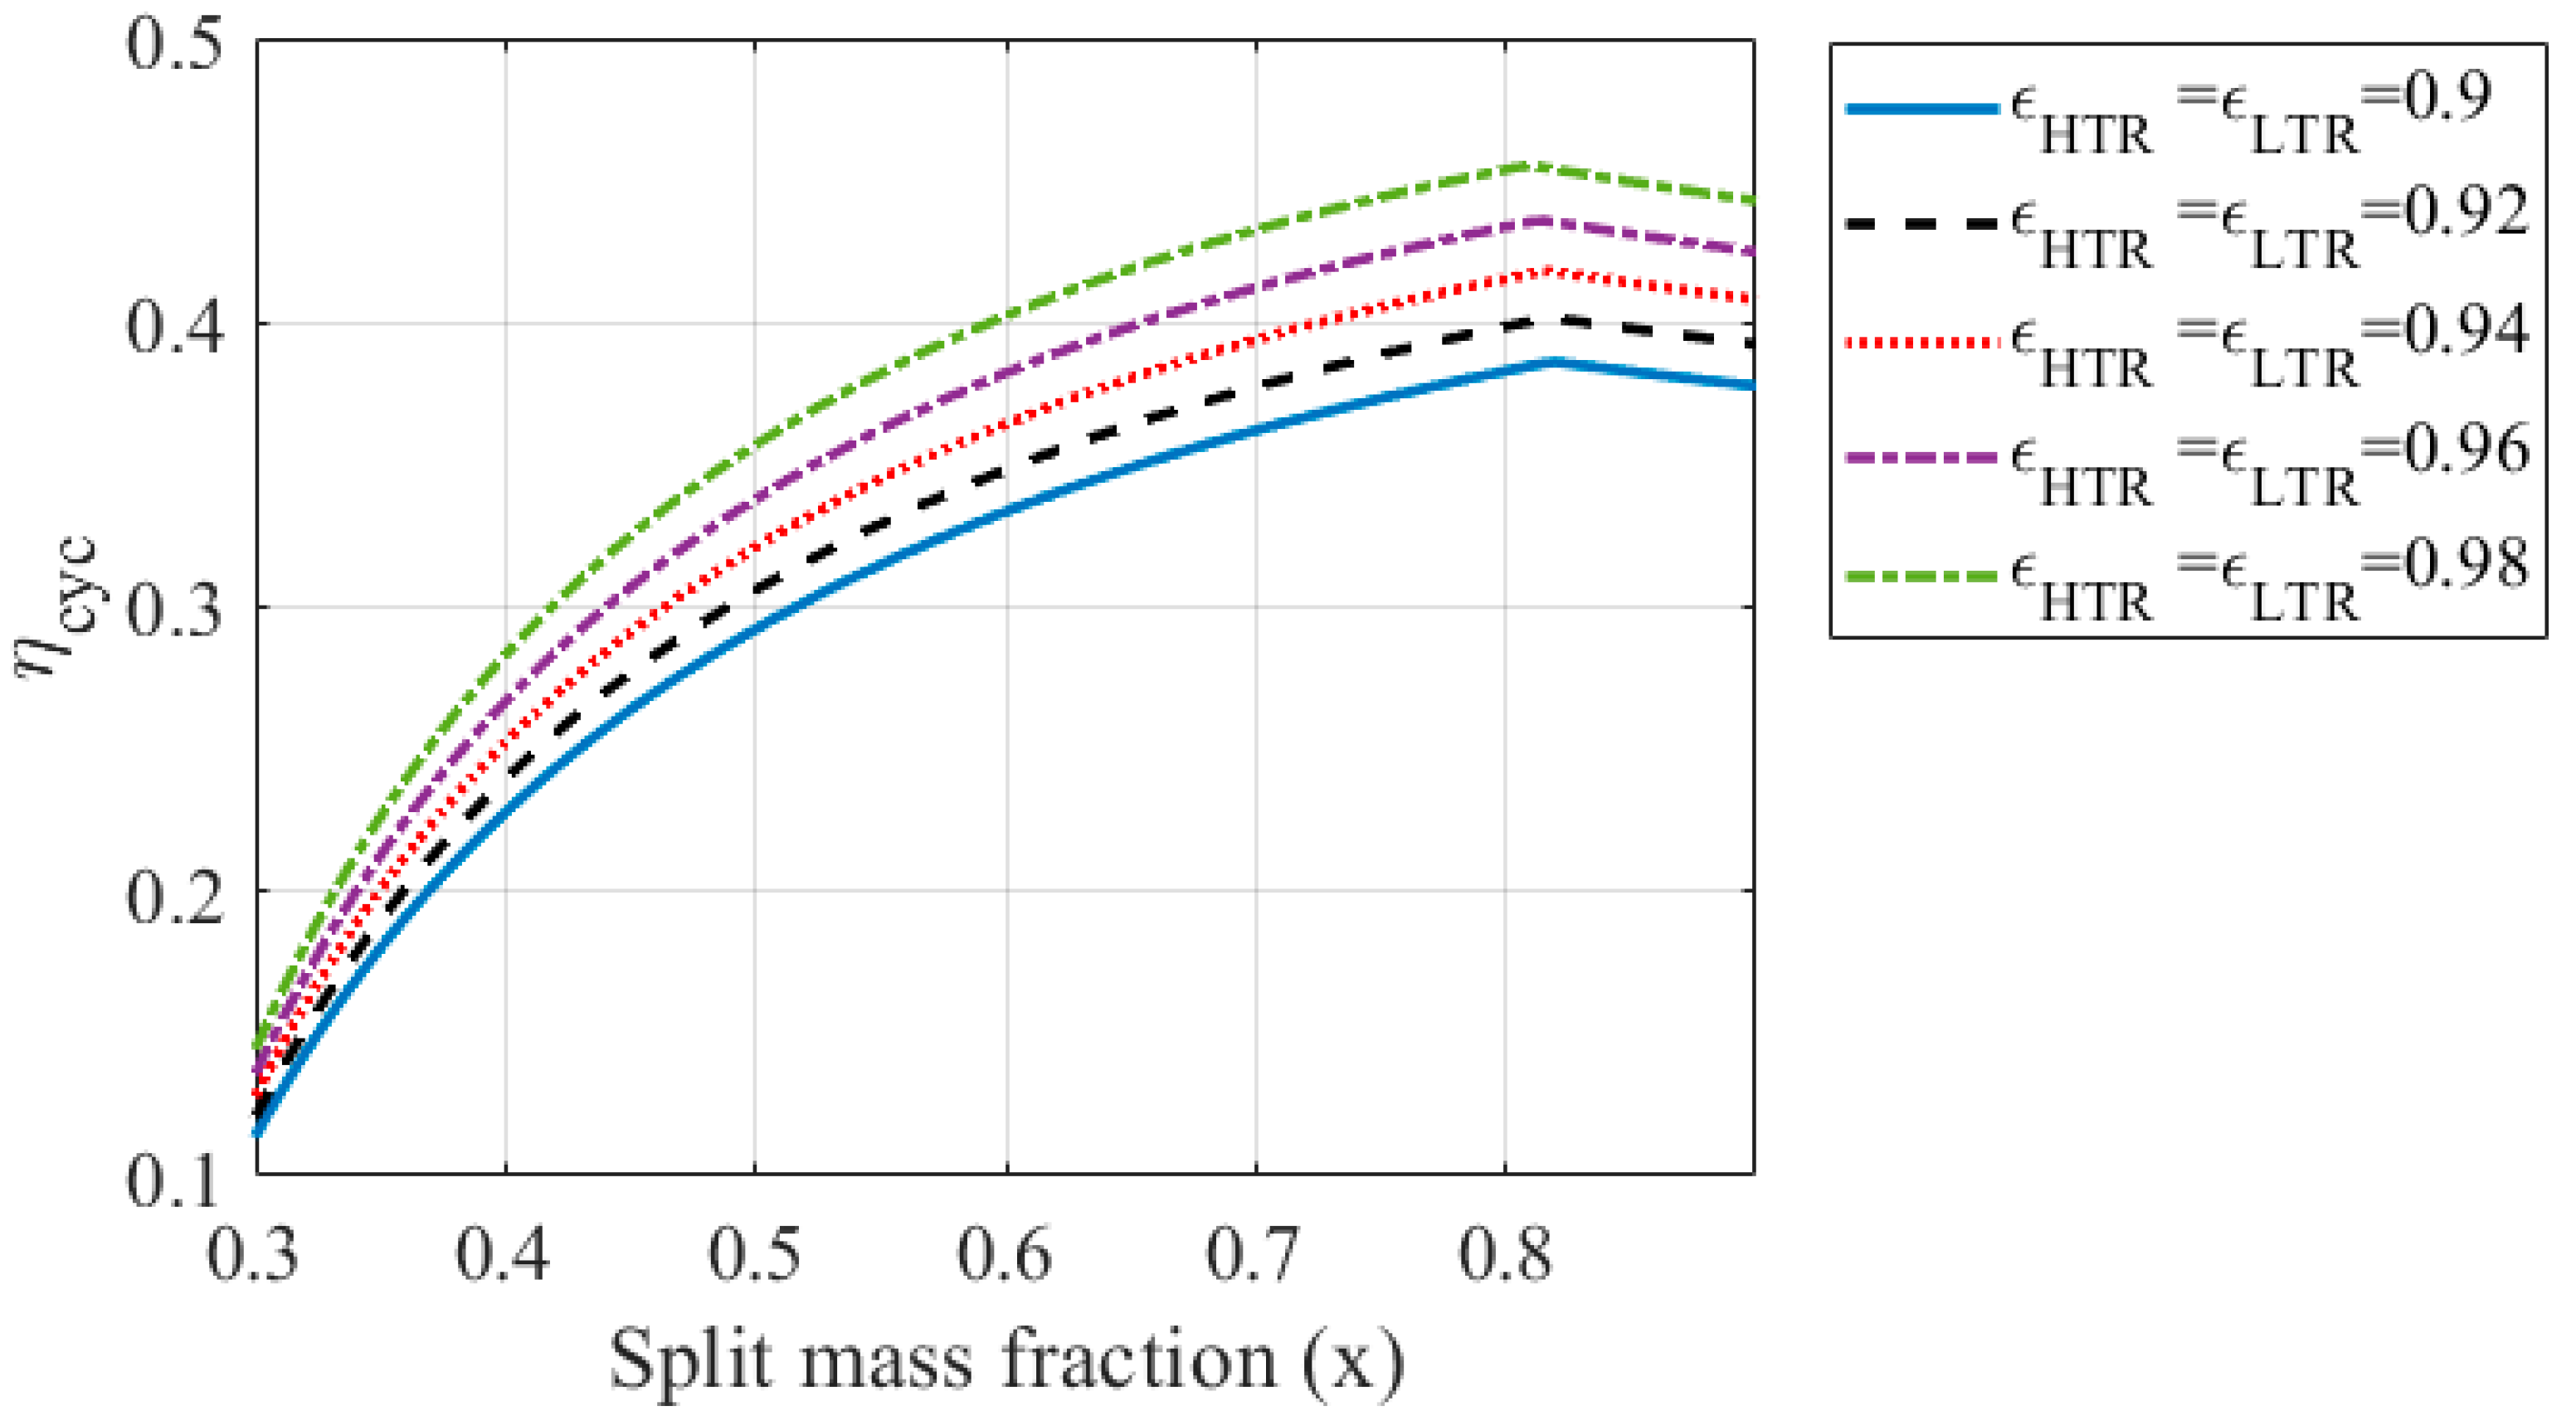
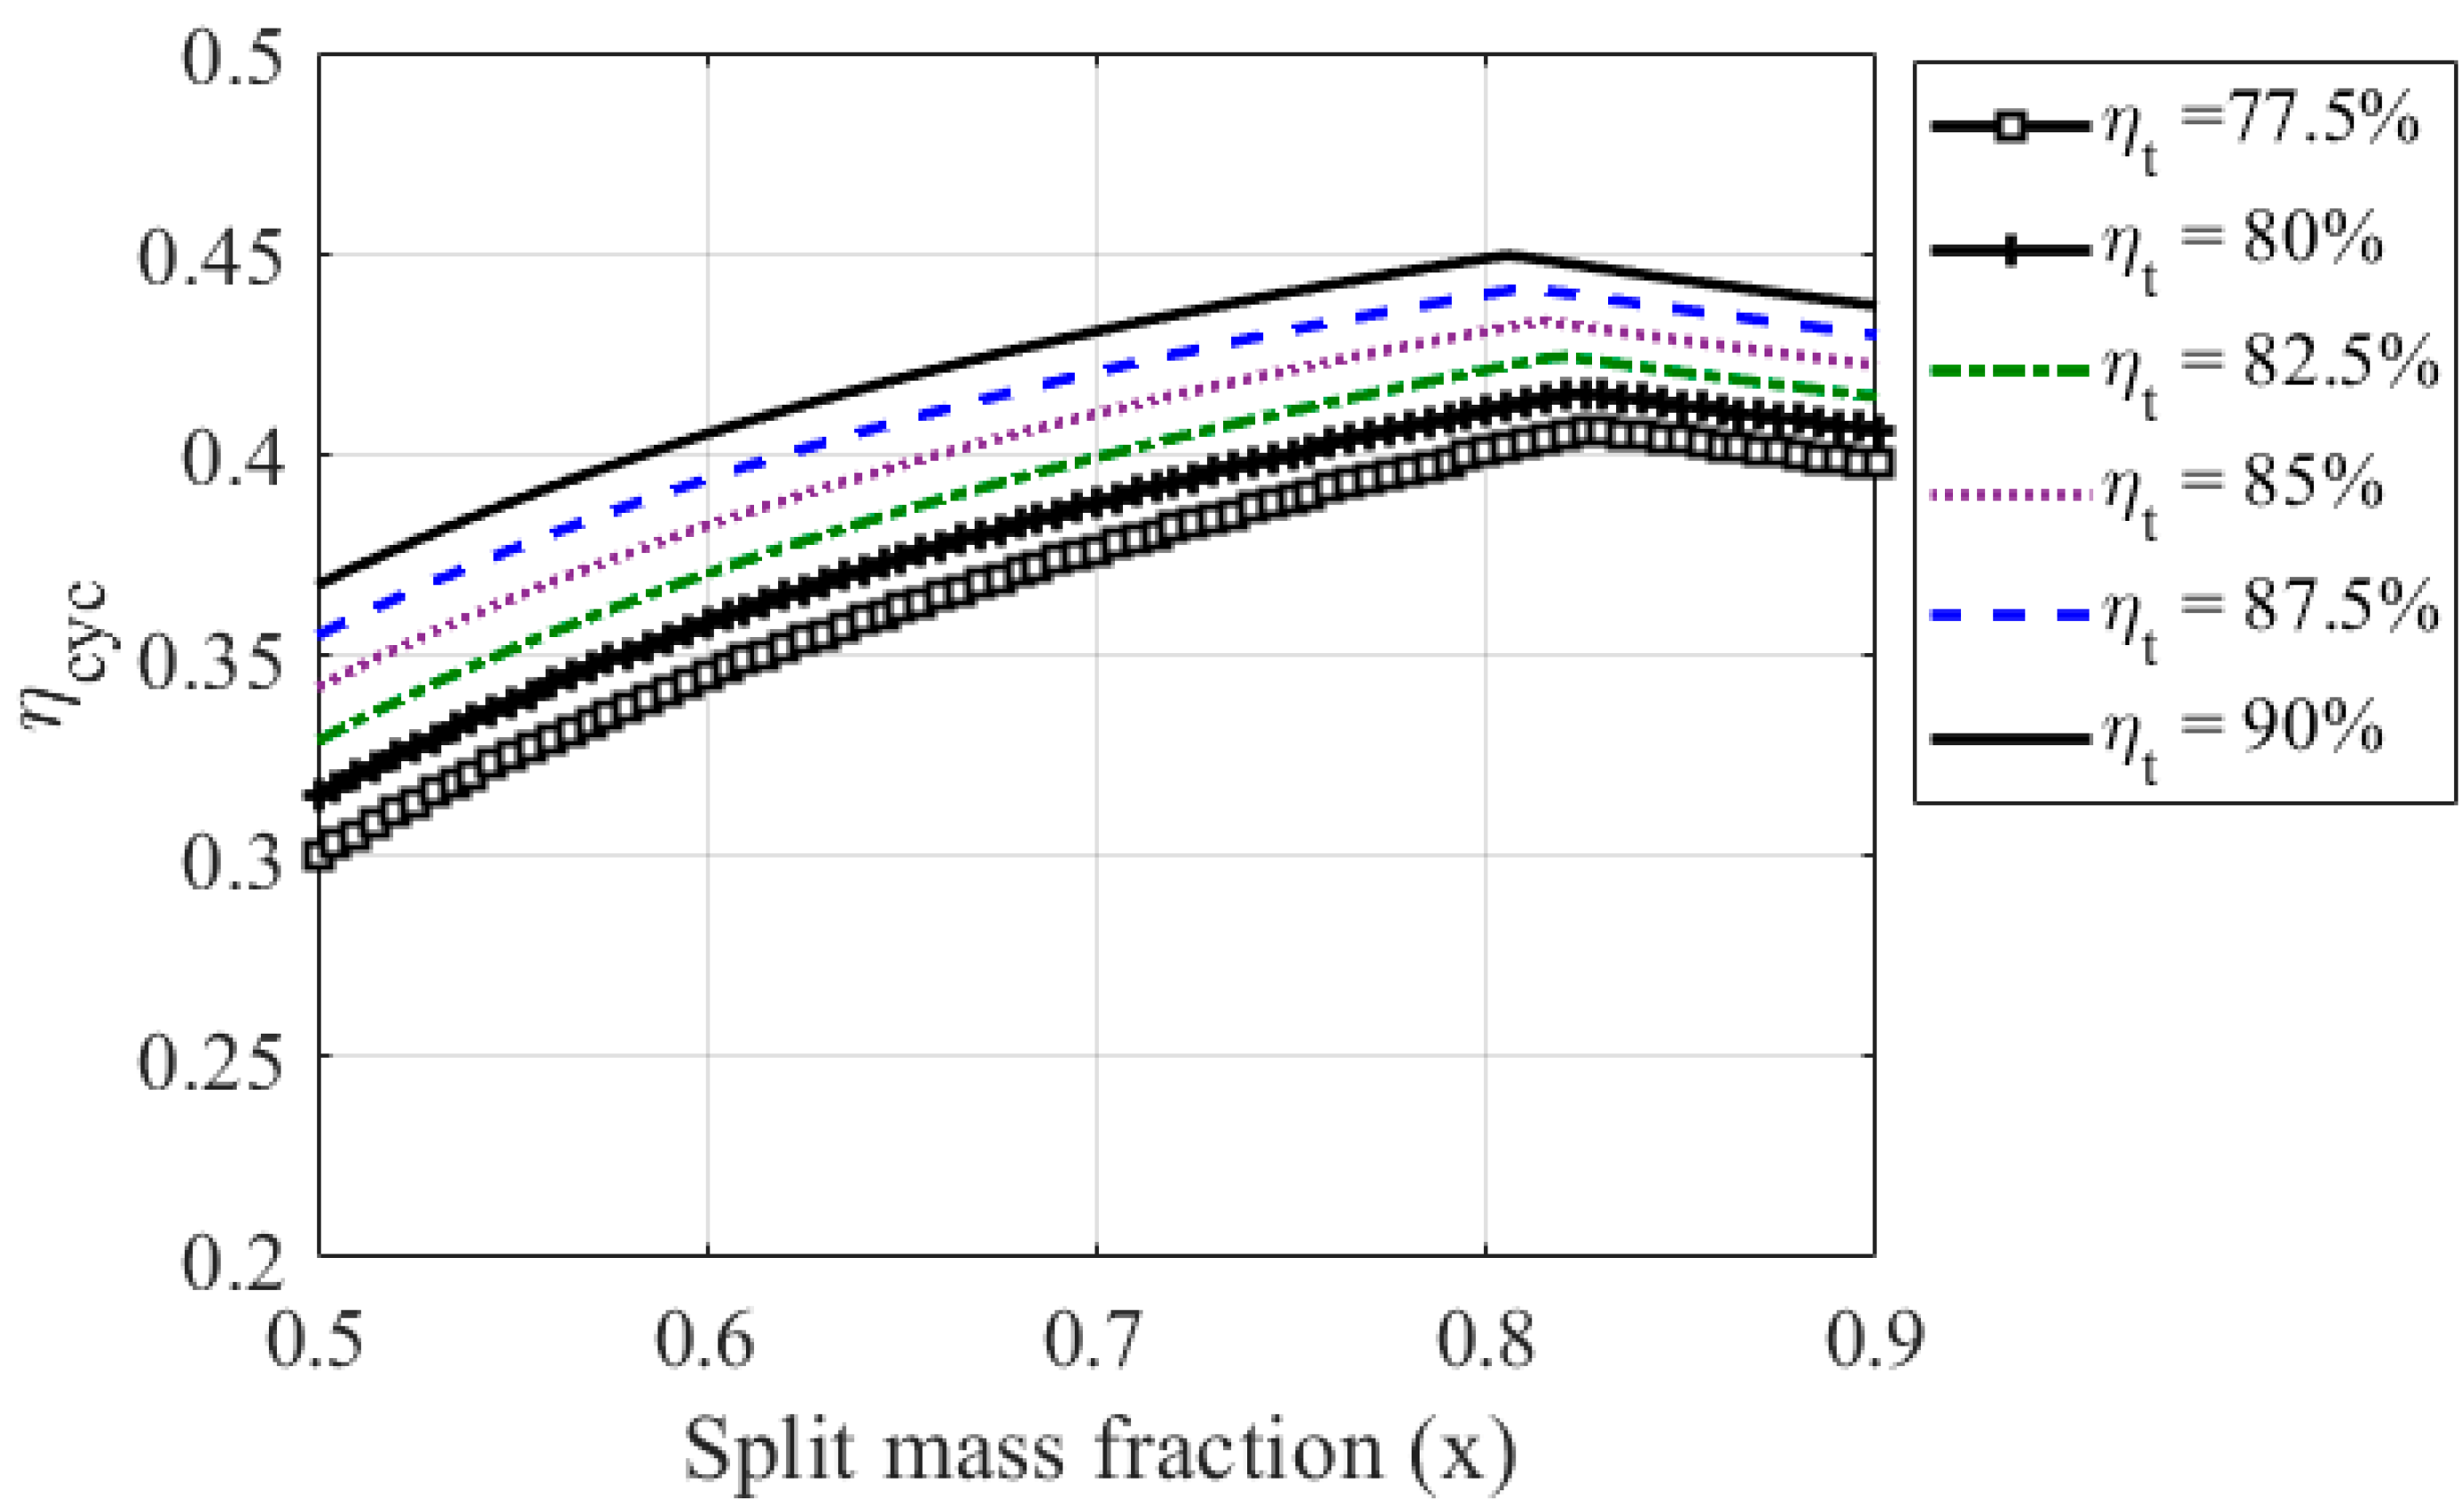
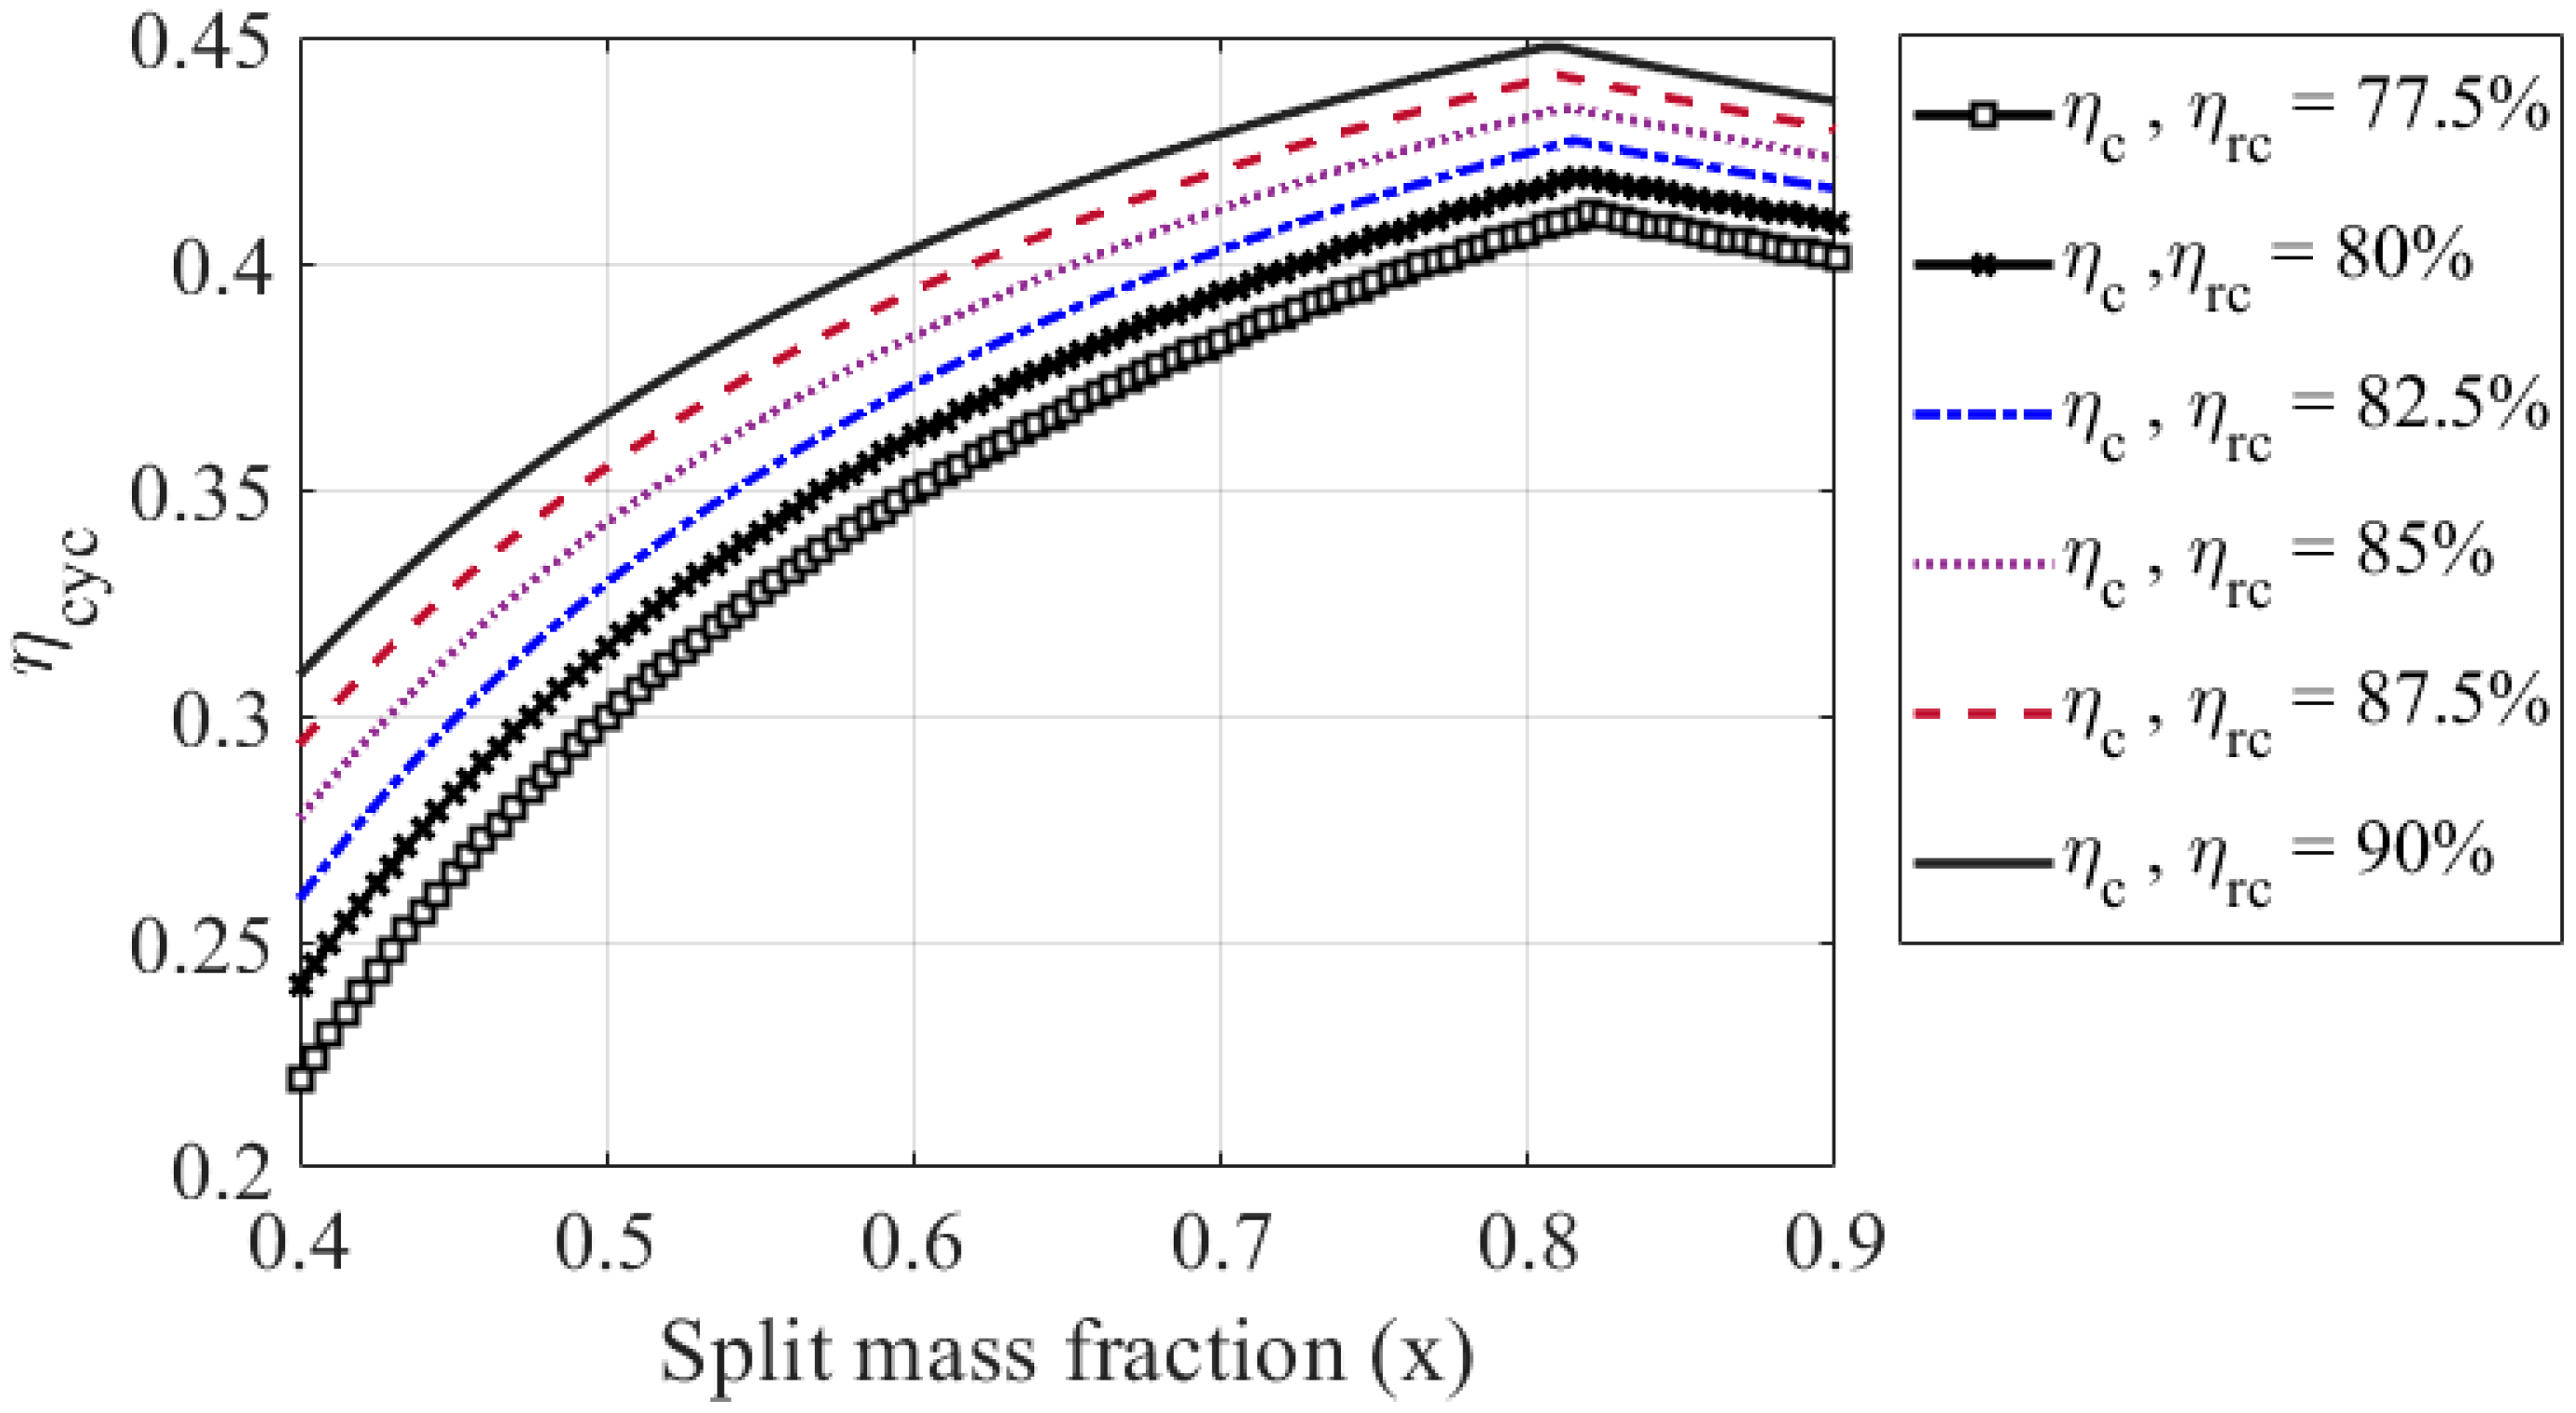
  • The performance of the cycle modules significantly affected the overall performance of the cycle. A 2% variation in the efficiency of turbines or compressors changed the cycle’s performance by 1%. Simultaneously, a 2% variation in the effectiveness of both recuperators affected the cycle’s performance by 3%. Thus, the cycle’s efficiency was most sensitive to the performance of the recuperator.
  • The sensitivity of the cycle’s performance to the recuperator’s effectiveness increased with a rise in x . Simultaneously, it decreased with an escalation in the values of the isentropic efficiencies of the turbomachinery components.
  • The value of η c y c was susceptible to the cycle’s operating parameters if the compressors’ inlet conditions were close to carbon dioxide’s critical point. Consequently, the optimization results suggested placing the compressor away from the critical point to ensure better off-design performance.

Author Contributions

Conceptualization, K.A.; Data curation, A.A.; Formal analysis, B.B.; Investigation, K.A.; Methodology, Y.A., A.M.; Resources, K.A., Y.A.; Software, A.M., B.B.; Writing—original draft, K.A.; Writing—review & editing, K.A., A.A. All authors have read and agreed to the published version of the manuscript.

Funding

This research received no external funding.

Institutional Review Board Statement

Not applicable.

Informed Consent Statement

Informed consent was obtained from all subjects involved in the study.

Data Availability Statement

The data presented in this study are available on request from the corresponding author. The data are not publicly available due to the privacy policy of the organization.

Conflicts of Interest

The authors declare no conflict of interest.

Nomenclature

f Relative pressure loss
h Enthalpy [J/kg]
m ˙ Mass flow rate
P Pressure [MPa]
S Entropy [J/kg]
T Temperature [K]
x Split mass fraction
Symbols
ε Effectiveness
η Efficiency
ρ Density [kg/m3]
Subscripts
0 , 1 , 2 10 State points
cycCycle
m c Main compressor
minMinimum value
r c Recompression compressor
t Turbine
i d Ideal
Abbreviations
H T R High-temperature recuperator
LTRLow-temperature recupeator
MOGAMultiobjective genetic algorithm
sCO2-BCSupercritical carbon dioxide cycle

References

  1. Frutshi, H.U. Closed-Cycles Gas Turbines; Three Park Avenue: NewYork, NY, USA, 2005. [Google Scholar]
  2. Binotti, M.; Astolfi, M.; Campanari, S.; Manzolini, G.; Silva, P. Preliminary assessment of sCO2 cycles for power generation in CSP solar tower plants. Appl. Energy 2017, 204, 1007–1017. [Google Scholar] [CrossRef]
  3. Javanshir, A.; Sarunac, N.; Razzaghpanah, Z. Thermodynamic analysis of simple and regenerative Brayton cycles for the concentrated solar power applications. Energy Convers. Manag. 2018, 163, 428–443. [Google Scholar] [CrossRef]
  4. Dostal, V.; Driscoll, M.J.; Hejzlar, P. A Supercritical Carbon Dioxide Cycle for Next Generation Nuclear Reactors; MIT-ANP-TR-100, Advanced Nuclear Power Technology Program Report; Massachusetts Institute of Technology: Cambridge, MA, USA, 2004. [Google Scholar]
  5. Crespi, F.; Gavagnin, G.; Sánchez, D.; Martínez, G.S. Supercritical carbon dioxide cycles for power generation: A review. Appl. Energy 2017, 195, 152–183. [Google Scholar] [CrossRef]
  6. Ahn, Y.; Bae, S.J.; Kim, M.; Cho, S.K.; Baik, S.; Lee, J.I.; Cha, J.E. Review of supercritical CO2 power cycle technology and current status of research and development. Nucl. Eng. Technol. 2015, 47, 647–661. [Google Scholar] [CrossRef] [Green Version]
  7. Saeed, M.; Khatoon, S.; Kim, M.-H. Design optimization and performance analysis of a supercritical carbon dioxide recompression Brayton cycle based on the detailed models of the cycle components. Energy Convers. Manag. 2019, 196, 242–260. [Google Scholar] [CrossRef]
  8. Brun, K.; Friedman, P.; Dennis, R. Fundamentals and Applications of Supercritical Carbon Dioxide (sCO2) Based Power Cycles; Woodhead Publishing: Waltham, MA, USA, 2017; ISBN 9781845697693. [Google Scholar]
  9. Hakkarainen, E.; Sihvonen, T.; Lappalainen, J. Dynamic Modelling and Simulation of CSP Plant Based on Supercritical Carbon Dioxide Closed Brayton Cycle. In Proceedings of the International Conference on Concentrating Solar Power and Chemical Energy Systems, Santiago, Chile, 26–29 September 2017; AlObaidli, A., Calvet, N., Richter, C., Eds.; American Institute of Physics: Melville, NY, USA, 2017. [Google Scholar]
  10. Marchionni, M.; Bianchi, G.; Tassou, S.A. Review of supercritical carbon dioxide (sCO2) technologies for high-grade waste heat to power conversion. SN Appl. Sci. 2020, 2, 611. [Google Scholar] [CrossRef] [Green Version]
  11. Zhu, Q. Innovative power generation systems using supercritical CO2 cycles. Clean Energy 2017, 1, 68–79. [Google Scholar] [CrossRef] [Green Version]
  12. Kim, Y.M.; Kim, C.G.; Favrat, D. Transcritical or supercritical CO2 cycles using both low- and high-temperature heat sources. Energy 2012, 43, 402–415. [Google Scholar] [CrossRef]
  13. Tuo, H.M. Analysis of a Reheat Carbon Dioxide Transcritical Power Cycle Using a Low Temperature Heat Source. Int. Mech. Eng. Congress Exp. 2011, 4, 219–225. [Google Scholar]
  14. Cayer, E.; Galanis, N.; Desilets, M.; Nesreddine, H.; Roy, P. Analysis of a carbon dioxide transcritical power cycle using a low temperature source. Appl. Energy 2009, 86, 1055–1063. [Google Scholar] [CrossRef]
  15. Pham, H.S.; Alpy, N.; Ferrasse, J.H.; Boutin, O.; Quenaut, J.; Tothill, M.; Haubensack, D.; Saez, M. Mapping of the thermodynamic performance of the supercritical CO2 cycle and optimisation for a small modular reactor and a sodium-cooled fast reactor. Energy 2015, 87, 412–424. [Google Scholar] [CrossRef]
  16. Feher, E.G. The supercritical thermodynamic power cycle. Energy Convers. 1968, 8, 85–90. [Google Scholar] [CrossRef]
  17. Angelino, G. Carbon dioxide condensation cycles for power production. J. Eng. Gas. Turbines Power 1968, 90, 287–295. [Google Scholar] [CrossRef]
  18. Saeed, M.; Kim, M. Analysis of a recompression supercritical carbon dioxide power cycle with an integrated turbine design/optimization algorithm. Energy 2018, 165, 93–111. [Google Scholar] [CrossRef]
  19. Turchi, C.S.; Ma, Z.; Neises, T.W.; Wagner, M.J. Thermodynamic study of advanced supercritical carbon dioxide power cycles for concentrating solar power systems. J. Sol. Energy Eng. 2013, 135, 375–383. [Google Scholar] [CrossRef]
  20. Reyes-Belmonte, M.A.; Sebastián, A.; Romero, M.; González-Aguilar, J. Optimization of a recompression supercritical carbon dioxide cycle for an innovative central receiver solar power plant. Energy 2016, 112, 17–27. [Google Scholar] [CrossRef]
  21. Al-Sulaiman, F.A.; Atif, M. Performance comparison of different supercritical carbon dioxide Brayton cycles integrated with a solar power tower. Energy 2015, 82, 61–71. [Google Scholar] [CrossRef]
  22. Sarkar, J.; Bhattacharyya, S. Optimization of recompression S-CO2 power cycle with reheating. Energy Convers. Manag. 2009, 50, 1939–1945. [Google Scholar] [CrossRef]
  23. Sharma, O.P.; Kaushik, S.C.; Manjunath, K. Thermodynamic analysis and optimization of a supercritical CO2 regenerative recompression Brayton cycle coupled with a marine gas turbine for shipboard waste heat recovery. Therm. Sci. Eng. Prog. 2017, 3, 62–74. [Google Scholar] [CrossRef]
  24. Sarkar, J. Second law analysis of supercritical CO2 recompression Brayton cycle. Energy 2009, 34, 1172–1178. [Google Scholar] [CrossRef]
  25. Saeed, M.; Berrouk, A.S.; Siddiqui, M.S.; Awais, A.A. Effect of Printed Circuit Heat Exchanger’s Different Designs on the Performance of Supercritical Carbon Dioxide Brayton Cycle—Science Direct. Appl. Therm. Eng. 2020, 179, 115758. [Google Scholar] [CrossRef]
  26. Saeed, M.; Alawadi, K.; Kim, S.C. Performance of supercritical CO2 power cycle and its turbomachinery with the printed circuit heat exchanger with straight and zigzag channels. Energies 2021, 14, 62. [Google Scholar] [CrossRef]
  27. Salim, M.S.; Saeed, M.; Kim, M.-H. Performance Analysis of the Supercritical Carbon Dioxide Re-compression Brayton Cycle. Appl. Sci. 2020, 10, 1129. [Google Scholar] [CrossRef] [Green Version]
  28. Liu, Z.; Luo, W.; Zhao, Q.; Zhao, W.; Xu, J. Preliminary Design and Model Assessment of a Supercritical CO2 Compressor. Appl. Sci. 2018, 8, 595. [Google Scholar] [CrossRef] [Green Version]
  29. Saeed, M.; Kim, M.-H. Numerical study on thermal hydraulic performance of water cooled mini-channel heat sinks. Int. J. Refrig. 2016, 69, 147–164. [Google Scholar] [CrossRef]
  30. Saeed, M.; Berrouk, A.S.; Salman Siddiqui, M.; Ali Awais, A. Numerical investigation of thermal and hydraulic characteristics of sCO2-water printed circuit heat exchangers with zigzag channels. Energy Convers. Manag. 2020, 224, 113375. [Google Scholar] [CrossRef]
  31. Lee, J.; Lee, J.I.; Ahn, Y.; Yoon, H. Design Methodology of Supercritical CO2 Brayton Cycle Turbomachineries. In Proceedings of the ASME Turbo Expo 2012: Turbine Technical Conference and Exposition, Volume 5: Manufacturing Materials and Metallurgy; Marine; Microturbines and Small Turbomachinery, Supercritical CO2 Power Cycles. Copenhagen, Denmark, 11–15 June 2012; pp. 975–983. [Google Scholar]
  32. Saeed, M.; Kim, M.-H. Thermal and hydraulic performance of SCO2 PCHE with different fin configurations. Appl. Therm. Eng. 2017, 127, 975–985. [Google Scholar] [CrossRef]
  33. Capata, R.; Hernandez, G. Preliminary design and simulation of a turbo expander for small rated power Organic Rankine Cycle (ORC). Energies 2014, 7, 7067–7093. [Google Scholar] [CrossRef] [Green Version]
  34. Wang, K.; He, Y.-L. Thermodynamic analysis and optimization of a molten salt solar power tower integrated with a recompression supercritical CO2 Brayton cycle based on integrated modeling. Energy Convers. Manag. 2017, 135, 336–350. [Google Scholar] [CrossRef]
  35. Li, H.; Su, W.; Cao, L.; Chang, F.; Xia, W.; Dai, Y. Preliminary conceptual design and thermodynamic comparative study on vapor absorption refrigeration cycles integrated with a supercritical CO2 power cycle. Energy Convers. Manag. 2018, 161, 162–171. [Google Scholar] [CrossRef]
  36. Bahamonde Noriega, J.S. Design Method for s-CO2 Gas. Turbine Power Plants Integration of Thermodynamic Analysis and Components Design for Advanced Applications; Report: P&E-2530; Delft University of Technology: Delft, The Netherlands, 2012. [Google Scholar]
  37. Zhang, X.; Sun, X.; Christensen, R.N.; Anderson, M.; Carlson, M. Optimization of S-Shaped Fin Channels in a Printed Circuit Heat Exchanger for Supercritical CO2 Test Loop. In Proceedings of the 5th International Supercritical CO2 Power Cycles Symposium, San Antonio, TX, USA, 29–31 March 2016. [Google Scholar]
  38. Shen, X.; Yang, H.; Chen, J.; Zhu, X.; Du, Z. Aerodynamic shape optimization of non-straight small wind turbine blades. Energy Convers. Manag. 2016, 119, 266–278. [Google Scholar] [CrossRef] [Green Version]
  39. Ha, S.T.; Ngo, L.C.; Saeed, M.; Jeon, B.J.; Choi, H. A comparative study between partitioned and monolithic methods for the problems with 3D fluid-structure interaction of blood vessels. J. Mech. Sci. Technol. 2017, 31, 281–287. [Google Scholar] [CrossRef]
  40. Saeed, M.; Kim, M.-H. Thermal-hydraulic analysis of sinusoidal fin-based printed circuit heat exchangers for supercritical CO2 Brayton cycle. Energy Convers. Manag. 2019, 193, 124–139. [Google Scholar] [CrossRef]
  41. Venkata Rao, R.; Patel, V. Multi-objective optimization of combined Brayton and inverse Brayton cycles using advanced optimization algorithms. Eng. Optim. 2012, 44, 965–983. [Google Scholar] [CrossRef]
  42. Xiao, D.; do Prado, J.C.; Qiao, W. Optimal joint demand and virtual bidding for a strategic retailer in the short-term electricity market. Electr. Power Syst. Res. 2021, 190, 106855. [Google Scholar] [CrossRef]
  43. Zhang, H.; Liu, J.; Xiao, D.; Qiao, W. Security-Constrained Optimal Power Flow Solved with a Dynamic Multichain Particle Swarm Optimizer. In Proceedings of the 2019 North American Power Symposium (NAPS), Wichita, KS, USA, 13–15 October 2019. [Google Scholar] [CrossRef]
Figure 1. The layout of the sCO2-BC cycle.
Applsci 11 02389 g001
Figure 2. Flowchart of the Matlab code.
Applsci 11 02389 g002
Figure 3. Schematic genetic algorithm.
Applsci 11 02389 g003
Figure 4. Impacts of the split mass fraction on the cycle and its modules.
Applsci 11 02389 g004
Figure 5. Variations in the values of T 3 , T 5 , and cycle efficiency with the split mass fraction.
Applsci 11 02389 g005
Figure 6. Impact of recuperator’s effectiveness on the cycle’s efficiency.
Applsci 11 02389 g006
Figure 7. Impact of the turbine’s performance on the cycle’s efficiency.
Applsci 11 02389 g007
Figure 8. Impact of the compressor’s performance on the cycle’s efficiency.
Applsci 11 02389 g008
Figure 9. Effect of the compressor’s performance on the cycle’s efficiency.
Applsci 11 02389 g009
Figure 10. Deviation of η c y c with P 1 and P r .
Applsci 11 02389 g010
Figure 11. Variation of the optimized x with compressor inlet pressure and cycle overall pressure ratio.
Applsci 11 02389 g011
Figure 12. Deviation of η c y c with T 1 and P r .
Applsci 11 02389 g012
Figure 13. Deviation of x with T 1 and cycle overall pressure ratio ( P r ) .
Applsci 11 02389 g013
Figure 14. Convergence of the fitness function using the genetic algorithm.
Applsci 11 02389 g014
Table 1. Potential application of sCO2-BC [2].
ApplicationCycle Type MotivationSize (MWe)Temperature [℃]Pressure [MPa]
Nuclear Indirect sCO 2 Efficiency, size, water reduction 10–300350–70020–35
Fossil FuelIndirect sCO 2 Efficiency, water reduction300–600550–90015–30
Concentrated solar powerIndirect sCO 2 Efficiency, size, water reduction10–100500–100035
Shipboard propulsionIndirect sCO 2 Efficiency, size<10–10200–30015–25
Shipboard house powerIndirect sCO 2 Efficiency, size<1–10230–65015–35
Waste heat recoveryIndirect sCO 2 Efficiency, size, simple cycles 1–10<230–65015–35
Geothermal Efficiency1–50100–30015
Fossil fuel (Syn Gas)Direct sCO 2 Efficiency, simple cycles300–6001100–150035
Table 2. Component parameters used for the cycle simulation [20].
Effectiveness, HTR ε H T R 0.9
Effectiveness, LTR ε L T R 0.9
Efficiency, Turbine η T 0.90
Efficiency, Compressor η C 0.85
Relative Pressure loss f 0.01
Table 3. Design variables utilized for the present work.
Design Variable Lower BoundsUpper Bounds
Compressor inlet Temperature ( T 1 ) [ K ] 305 330
Compressor inlet pressure ( P 1 ) [kPa] 7400 9000
Cycle pressure ratio ( P r ) 2.0 3.6
Split mass fraction ( x ) 0.5 0.99
Table 4. Model validation.
Parameters V. Dostal [4]Saeed et al. [7]
Employed conditions T 1 305   K 308   K
P 1 7692   kPa 8190   kPa
T 7 823   K 753   K
P r 2.6 2.51
Efficiency, main compressor 89 % 88.3 %
Efficiency, recompressor 89 % 88.3 %
Efficiency, turbine 90 % 93.4 %
Effectivness, HTR 96.3 % 97.9 %
Effectivness, LTR 92.1 % 96.1 %
Cycle Efficiency (literature) 45.27 % 42.05 %
Cycle Efficiency (current work)46.37%43.83%
Table 5. Design variables employed for the current study with the upper and lower bounds.
Design Variable Optimized Values
Case I
Optimized Values
Case II
T 1 ( K ) 305313
P 1 (kPa)770.93845.52
P r 3.122.69
x 0.630.71
Publisher’s Note: MDPI stays neutral with regard to jurisdictional claims in published maps and institutional affiliations.

