Article

Protective Effects of Echinacea purpurea Ethanol Extract on Male Reproductive Dysfunction in Obese Rats

Department of Food Science, National Taiwan Ocean University, Keelung 20224, Taiwan
*
Author to whom correspondence should be addressed.
Submission received: 15 February 2021 / Revised: 2 March 2021 / Accepted: 4 March 2021 / Published: 8 March 2021
(This article belongs to the Section Food Science and Technology)

Abstract

:
Obesity is characterized by excessive fat accumulation and it may affect reproductive health by altering the sperm parameters, hormonal profiles, and gonadal functions. Echinacea purpurea is a medicinal herb and is well-known for its anti-inflammatory and antioxidant activities. The purpose of this study was to examine the beneficial effects of E. purpurea ethanol (EPE) extract on the high-fat diet (HFD)-induced reproductive damage. The obese condition in male Sprague–Dawley rats was induced by feeding with a high-fat diet (45%) and later three different doses of EPE (93, 186, 465 mg/kg per day) were tested for 5 weeks. The results showed that the level of antioxidant enzymes was increased, whereas lipid peroxidation, blood glucose level, nitric oxide production, IL-6 level, and TNF-α level were decreased in the presence of EPE extract. In addition to this, the sperm counts, motility, morphology, DNA damage, and mitochondrial membrane potential were also improved. Additionally, the protein expression of Peroxisome Proliferator-Activated Receptor Alpha (PPAR-α), and Phospho-Adenosine Monophosphate-Activated Protein Kinase Alpha ½ (AMPKα1/2) phosphorylation in liver tissue and Steroidogenic Acute Regulatory Protein (StAR) and 17β-Hydroxysteroid Dehydrogenase 3 (17β-HSD3) expressions in testes were increased. In conclusion, the administration of EPE extracts beneficially regulated the inflammation and reproductive damage in obese rats.

1. Introduction

Obesity is termed as excessive fat accumulation and subsequent weight gain of the body. It is expected that about 38% of the adult population become overweight and another 20% will become obese by 2030 [1]. It is known that both environmental and genetic factors are responsible for the progression of obesity. Previous articles mentioned that it increases the risk of certain diseases such as diabetes, disability, hypertension, cancers, osteoarthritis, cardiovascular disease, stroke, and depression [1,2]. Usually, obesity is determined based on a high body mass index (BMI) (≥30 kg/m2). BMI is known as the ratio of weight (kg) to the square of height (m2). Obesity is influenced by some risk factors including energy intake, low physical activity, genetics, certain diseases, specific drugs, and low education, etc. [1]. Previous literature mentioned that consumption of high-fat food products is the major reason behind the progression of obesity [3]. It was also noted that obesity is linked to oxidative stress via peroxisomal and mitochondrial oxidation of fatty acids and the production of reactive oxygen species (ROS) [4]. Additionally, the progression of obesity is dependent upon the energy imbalance arising from blood glucose level, neurotransmitters, adipokines, cytokines, inflammation, coagulation, blood pressure, leptin, and ghrelin [5]. Obesity is one of the reasons of reproductive damage and infertility. The literature mentions that obesity is developed by exposing animals to high-fat diets (HFDs) and this may result in decreased sperm concentration, increased deoxyribonucleic acid (DNA) fragmentation, poor semen quality, decreased number of motile sperm, and increased intracellular sperm ROS production [6,7].
It is known that the hypothalamus–pituitary–gonadal (HPG) axis plays a major role in maintaining reproductive health. A hypothalamic peptide, kisspeptin, triggers the release of gonadotropin-releasing hormone (GnRH). GnRH stimulates the secretion of follicle-stimulating hormone (FSH) and luteinizing hormone (LH) by the anterior pituitary. Both LH and FSH are responsible for sperm maturation and steroid hormone production. Leydig cells produce a hormone called testosterone which plays a crucial role in spermatogenesis [8]. It has been reported that secondary hypogonadism occurs due to the interference of obesity on the HPG axis. The presence of a higher amount of adipose tissue stimulates the aromatase activity and thereby reduces the levels of FSH and LH. Furthermore, it reduces KISS1 expression and testosterone levels [9]. It is noted that some antiobesity drugs are associated with nausea, headache, dry mouth, diarrhea, high blood pressure, constipation, heart attack, and insomnia [4,10]. Thus, new safe and effective therapeutic agents are required for reproductive dysfunction under the obesity condition.
The literature mentions that active components from the plants can reduce obesity by suppressing appetite, inhibiting digestive and metabolic lipases, increasing thermogenesis, and inhibiting proliferation and differentiation of preadipocytes [3]. Echinacea purpurea is a medicinal plant belonging to the Asteraceae family [11]. Commonly, this plant is used for the treatment of chronic arthritis, toothache, bronchitis, skin disorders, cancer, bowel pain, seizure, and snakebite [11]. Furthermore, it is well-known for its immunomodulatory, anti-inflammatory, psychoactive, antibacterial, mutagenicity, and anticancer activities [11,12]. The major constituents such as caffeic acid derivatives, alkamides, and polysaccharides are responsible for the pharmacological activities of Echinacea purpurea [11]. The anti-inflammatory properties of Echinacea purpurea have been reported in different papers. The literature mentions that inflammation plays a major role in obesity in terms of metabolism. Obesity is known as the excessive accumulation of fat and this fat may store in other organs in addition to adipose tissue. This condition accelerates the progression of other diseases including diabetes [13]. Echinacea is known as an immune booster and promotes phagocytic activity in macrophages. Additionally, it reduces the production of nitric oxide and cytokines [12].
This study aimed to examine the protective effects of Echinacea purpurea ethanolic extract on male reproductive dysfunction in obese rats. The current study focuses on the in vivo protective effect of E. purpurea ethanol (EPE) extract on obesity-induced reproductive dysfunction in Sprague–Dawley rats. Obesity was induced by HFDs and later different doses of EPE were given. The antioxidant enzyme levels were increased and nitric oxide and cytokines levels were decreased after treatments. Our results also showed that the EPE extract reduced oxidative stress and improved the sperm parameters.

2. Materials and Methods

2.1. Materials

Male Sprague–Dawley rats (4 weeks old, N = 25) were obtained from BioLASCO Taiwan Co., Ltd., Yilan, Taiwan. Echinacea purpurea ethanol extract (EPE) was obtained from Direct Biotechnology Corp. of Taiwan. Laboratory rodent diet 5001M was purchased from PMI Nutrients International Inc., USA. 1,1,3,3-Tetramethoxypropane, acridine orange, sodium chloride, sodium carbonate, dimethyl sulfoxide, phosphate buffered saline, ethanol, nitroblue tetrazolium, rhodamine 123, sodium dodecyl sulfate, and thiobarbituric acid, were purchased from Sigma-Aldrich, St. Louis, Missouri, USA. Catalase, glucose enzymatic kits, glutathione peroxidase, and superoxide dismutase were bought from Randox, Colorado, USA. IL-6 and TNF-α kits were purchased from eBioscience, California, USA. Potassium chloride was purchased from J. T. Baker, New Jersey, USA.

2.2. Methods

2.2.1. Preparation of Echinacea Purpurea Ethanol Extract (EPE)

Echinacea purpurea was provided by the Direct Biotechnology Corp. of Taiwan and the plants were identified by assessing morphology. The samples were dried and 70% of ethanol was added. The obtained solution was stirred for 24 h at 40 °C. After, the crude extract was filtered and freeze-dried. The extraction yield was 168.22 kg from 230 kg of Echinacea purpurea (flower: stalk and leaf: root = 2:7:1).

2.2.2. In Vivo Analysis

Twenty-five healthy adult Sprague–Dawley rats (4 weeks old) were brought from BioLASCO Taiwan Co, Ltd., Yilan, Taiwan. Rats were kept under normal laboratory conditions (light/dark cycles of 12 h/12 h, the humidity of 40–60%, and temperature of 24 ± 3 °C) and fed chow diets. Food and water were provided ad libitum. All procedures followed the standard of the Institutional Animal Care and Use Committee (IACUC Approval No. 103032) of National Taiwan Ocean University, Taiwan. After 1 week of acclimatization, the rats were randomly divided into five groups such as control group (normal diet), HFD group (high-fat diet group), EPE1 group (HFD+93 mg/kg EPE1), EPE2 group (HFD+186 mg/kg EPE2), and EPE5 (HFD+495 mg/kg EPE5). All groups except the control group were fed 45% high-fat diets for 35 days to induce the obese model. Control and HFD groups received ddH2O while other groups received EPE extracts orally for 35 days. The fatty acid used in this study was lard. The HFD contained 13.2% crude protein, 45% crude fat, 3.4% crude fiber, 4.6% ash, 1.4% minerals, and 32.3% carbohydrates. All animals were sacrificed after the experiment. Blood samples were collected and centrifuged at 3000× g at 4 °C for 15 min. The anticoagulant used in this study was heparin. The testes, epididymis, liver, and adipose tissue were also taken and all the samples were stored at −80 °C for further analysis.

2.2.3. Sperm and Testis Sample Collection

The swim-up method was used to collect sperm [14]. Small pieces of epididymis were transferred 8 mL of Roswell Park Memorial Institute (RPMI) medium. The solution was shaken for 10 min at 100 rpm and later centrifuged at 190× g for 5 min. Then, the samples were kept in an incubator (37 °C, 5% CO2) (Napco 5410, Taiwan) for 30 min and sperm were collected. The testes were washed with ice PBS and 0.1 g of the testes tissue was transferred to an Eppendorf containing 1 mL of 1.15% KCl. Samples were homogenized (Hitachi, SCR 20BA, Tokyo, Japan) and centrifuged at 10,000× g for 30 min at 4 °C. The supernatant was collected for further analysis [14].

2.2.4. Adipose Tissue Diameter and Morphology

In total, 250 mg of fat samples were transferred into an Eppendorf containing 0.1 mg collagenase. A total of 1 mL of (4-(2-hydroxyethyl)-1-piperazineethanesulfonic acid (HEPES) buffer was added to dissolve the fat. Later, the Eppendorf was kept in a water bath at 37 °C for 15 min. After centrifugation, 10 μL of adipocytes was dropped to a glass slide and covered with cover glass to observe under the microscope. The scale bar was adjusted to 200 μM under the microscope and the proportion of fat diameters were 25, 50, 100, 150, and 200 μM.

2.2.5. Determination of Glucose and Testosterone Level in Plasma

The level of glucose in plasma was evaluated by using a glucose enzymatic kit. In total, 20 μL of plasma was added to 1 mL reagent and kept in an incubator for 5 min at 37 ℃. After, the absorbance was measured at 500 nm. A testosterone ELISA kit was used to analyze the concentration of testosterone in the plasma. An equal volume (50 μL) of plasma was mixed with acetylcholinesterase (AChE) tracer. The supernatant was removed and washed with wash buffer 5 times. Then, Ellman’s reagent (substrate of AChE) was added and shaken for 80 min in the dark. The absorbance was measured at 412 nm (Dynatech MR5000, Embrach, Switzerland). The concentration of testosterone was calculated from the standard curve. Total glucose content was evaluated by the following formula:
Plasma   total   glucose   ( mg / dL ) = A   s a m p l e A   b l a n k A   s t a n d a r d A   b l a n k × 200

2.2.6. Determination of Superoxide Dismutase (SOD), Catalase, and Glutathione Peroxidase (GPx)

The antioxidant levels were determined by evaluating the level of SOD, catalase, and GPx. A RANSOD kit was used to analyze the SOD activity. In total, 0.05 mL of sample was mixed with 1.7 mL reaction solution containing 0.05 mM Xanthine and 0.025 mM 2-(4-iodophenyl)-3-(4-nitrophenol)-5-phenyltetrazolium chloride (INT). After, 0.25 mL xanthine oxidase (80 U/L) was added and kept at room temperature for 30 s and later the absorbance was measured at 505 nm. The Bio-Rad DC protein assay kit was used to determine the protein concentration in the testicular homogenate, and the specific activity (U/mg protein) was converted. GPx activity was analyzed by the RANSEL kit. A total of 0.05 mL of plasma was added to 2.5 mL of reaction solution (4 mM GSH, 0.5 U/L glutathione reductase, 0.34 mM NADPH, pH 7.2). Then, 0.1 mL cumene was added and the absorbance was measured at 340 nm.

2.2.7. Malondialdehyde (MDA) Analysis in Testes and Sperm

MDA analysis was conducted to evaluate the oxidative stress in the testes and sperm. MDA is known as a marker for lipid peroxidation. The sperm number in each group was adjusted to 1 × 10⁶ cells/mL. In total, 0.5 mL of samples was mixed with 1 mL of MDA reagent (15% w/v trichloroacetic acid in 0.25 N HCl and 0.375% w/v thiobarbituric acid in 0.25 N HCl). After mixing, the samples were kept in a water bath at 100 °C for 15 min. After cooling, 1 mL of n-butanol was added, shaken, and then centrifuged at 1500× g for 10 min. The supernatant was taken and the absorbance was measured at 532 nm. PBS and 1,1,3,3-tetramethoxypropane were taken as the blank and standard, respectively [15]. The MDA concentration was calculated by using the following formula:
MDA   concentration   ( nM / mL ) = A   sample A   blank A   standard A   blank × 5

2.2.8. Determination of Nitric Oxide (NO) Production

Nitric oxide production was analyzed by Griess reagent by measuring the concentration of nitrites in the sample [16]. In total, 50 µL of the sample was mixed with 50 µL of Griess reagent and allowed to react for 10 min in the dark condition. The absorbance was measured at 540 nm. Sodium nitrate was taken as the standard and the concentration was determined by plotting the standard curve.

2.2.9. Determination of ROS Production

ROS production in sperm was evaluated by nitroblue tetrazolium (NBT) assay. NBT is a pale-yellow colored substance and interacted with superoxide and generated tetrazoinyl radical. It was then dismutated to form formazan crystals [17]. The sperm concentration was 1 × 10⁶ cells/mL and 0.3 mL of NBT solution (0.1 mg/mL NBT, 5% FCS, 3% DMSO in 10 mL RPMI) was added and incubated at 37 °C for 60 min. After centrifugation (500× g, 10 min), the supernatant was removed and washed with PBS. After, 200 μL of dimethyl sulfoxide (DMSO) was added, and the absorbance was measured at 570 nm [15].

2.2.10. Determination of Tumor Necrosis Factor-α (TNF-α) and Interleukin (IL)-6 Levels

TNF-α and IL-6 ELISA kits were used to determine the IL-6 and TNF-α levels. These cytokines were produced during the inflammatory phase and promote cell death [18,19]. The capture antibody was diluted 200× with a 1× coating buffer in a 96-well plate (100 µL/mL) at 4°C overnight. Later, the supernatant was removed and washed 4 times with a washing buffer (400 µL/mL). Then, 1× assay buffer (400 µL/well) was added and incubated for 1 h at room temperature. After washing (4 times), standard solutions and test samples (100 µL/well) were added and incubated for 2 h. Later, 100 µL/well of the diluted detection antibody (200× with 1× assay buffer) was added after washing and incubated for 1 h at room temperature. The plates were washed with washing buffer 4 times and then diluted. Avidin-HRP enzyme (100 µL/mL) was added and incubated for 30 min. Later, 100 µL/mL substrate solution was added after washing (5 times) and incubated at room temperature for 20 min. Finally, stop solution (100 µL/mL) was added and the absorbance was measured at 450 nm [15].

2.2.11. Determination of Alanine Aminotransferase (ALT), Aspartate Aminotransferase (AST), Urea, and Creatinine Levels

ALT and AST kits were used to analyze the ALT and AST contents, respectively. They helped identify the liver problem. For ALT determination, 10 μL of plasma was mixed with 100 μL of reagent (15 mmol/mL α-ketoglutarate, 1.2 U/mL LD, 0.18 mmol/mL NADH). After mixing, the absorbance was measured at 340 nm at 1, 2, and 3 min. The AST content was analyzed by the AST kit. In total, 10 μL of plasma was mixed with 100 μL of reagent (12 mmol/mL α-ketoglutarate, 420 U/mL MDH, 600 U/mL LD, 0.18 mmol/mL NADH) and the absorbance was measured at 340 nm for 3 min. High levels of BUN and creatinine were observed under renal disease [20]. The urea kit was used to analyze the BUN content. A total of 1 μL of plasma was mixed with 100 μL enzyme reagent (10 U/mL urease, 2 U/mL GLDH, 0.26 mmol/mL NADH, 3 mmol/mL adenosine-5-diphosphate, 14 mmol/mL α-oxoglutarate) and the absorbance was measured at 340 nm for 1, 2, and 3 min. A creatinine kit was used to analyze the content of creatinine. Then, 20 μL of plasma was mixed with 100 μL picric acid (35 mmol/mL) and 100 μL sodium hydroxide (0.32 mol/mL). After mixing, the absorbance was determined at 492 nm for 1 and 2 min.
ALT   or   AST   acidity   ( U / mL ) = 1746 × A   s a m p l e A   b l a n k m i n
Urea or Creatinine concentration ( μ mol/mL) = ( Δ   A   sample Δ   A   standard ) × standard   concentration

2.2.12. Determination of Sperm Count, Motility, and Abnormal Sperm Count

A hemocytometer was used to analyze the sperm parameters. In total, 100 μL of sperm liquid was mixed with trypan blue. The total sperms, motile sperms, and abnormal sperms were counted by using a hematocytometer and microscope. The sperm dilution factor is the average of the total number of sperm [14].
Sperm concentration (sperms/mL) = cell number × 2 × 10⁴ × dilution factor
Proportion of active sperm (%) = (number of active sperm/total sperm) × 100
The proportion of abnormal sperm (%) = (number of sperm with the abnormal shape/total number of sperm) × 100

2.2.13. Sperm Mitochondrial Membrane Potential

The sperm number was adjusted to 1 × 10⁶ sperm/mL. Rhodamine 123 (final concentration is 10 μM) was added and mixed well. Then, it was incubated for 30 min at 37 ℃. Later, the solution was centrifuged (760× g, 5 min) and the supernatant was removed. The cells were washed with PBS and 1ml of PBS was added before subjecting them to flow cytometric analysis (Becton Dickinson, CA, USA).

2.2.14. Acridine Orange (AO) Assay

An AO assay was conducted to evaluate the live/dead cells. Sperm concentration was fixed to 1 × 10⁶ sperm/mL. Then, 95 μL of sperm solution was mixed with 5 μL of AO solution. After mixing for 10 min in the dark, 5 mL of PBS was added and centrifuged at 760× g for 5 min. The supernatant was removed and washed with PBS 2 times. After, resuspended the cells in 100 µL PBS. A drop of solution was transferred to a glass slide, covered with a coverslip, and observed under the microscope (536 nm).

2.2.15. Tissue Sectioning and Staining

The testicle was immersed in 10~15% formalin after sacrifice and later stored at 4 °C. The tissues were cut to microsizes and then fixed in a solution containing 95% methanol and 5% acetic acid. After, the slides were immersed in hematoxylin for 3 min and washed with running water for 5 min. The tissues were soaked in alcohol (50, 70, and 90%) for 1 min. After, the slides were stained with eosin for 10 s and soaked in 100% alcohol for one minute until it faded. The slides were soaked in xylene for 1 min. Later, the slides were air-dried and sealed. The mounting medium used in this study was micromount. The stained tube was placed in an inverted phase-contrast microscope (Inverted Phase Difference Microscope, Olympus CK-2, Tokyo, Japan) to observe the morphology [15].

2.2.16. Western Blot Analysis

Western blot analysis was used to evaluate AMP-activated protein kinase (AMPK), proliferator-activated receptors (PPARs), Kisspeptin 1-Derived Peptide Receptor (Kiss1R), 17β-HSD3, and steroidogenic acute regulatory protein (StAR) expression. AMPK and proliferator-activated receptors (PPARs) maintain cellular energy, Kiss1R controls the reproductive function, 17β-HSD3 involves in the formation of active sex steroids, and steroidogenic acute regulatory protein (StAR) regulate hyperlipidemia, nonalcoholic fatty liver disease, and endothelial inflammation [21,22,23,24,25]. A total of 0.1 g of testicular/liver/hypothalamus tissue was added to 500 μL Radioimmunoprecipitation assay buffer (RIPA buffer) and 20 μL of protease inhibitors (1 tablet dissolved in 2 mL 10X PBS) was then added. The solution was homogenized and centrifuged (15,000× g) at 4 °C for 15 min. The supernatant was collected for further analysis. Protein quantification was carried out by Bradford Protein Assay. A total of 10 μL of the standard or diluted cell solution was added to a 96-well microplate. Then, 100 μL of Bradford reagent was added and mixed for 15 min. The absorbance was measured at 595 nm. Bovine serum albumin (2.0 mg/mL) was taken as the standard. The protein concentration (mg/mL) was obtained by plotting the standard curve.
The SDS discontinuous polyacrylamide gel electrophoresis (SDS-PAGE) method was used for protein identification. Stock solutions selected for the analysis were solution A: 40% acrylamide-bisacrylamide solution, solution B: 1.5 M Tris buffer (pH 8.8), solution C: 0.5 M Tris buffer (pH 6.8), and solution D: 10% ammonium persulfate (APS). Various concentrations of the stock solution were added for gel formation.
Protein lysate was added to equal volume (v/v) of protein loading buffer (containing 2% SDS, 5.5% b-mercaptoethanol, 60 Mm Tris buffer (pH 6.8), 10% glycerol, and 2.5% bromophenol blue) and heated at 100 °C for 5 min. After cooling, the appropriate amount (30 µg of protein/well) of the sample was transferred into the film sample tank containing protein markers (MBP-β-galactosidase (175 kDa), MBP-paramyosin (83 kDa), glutamic dehydrogenase (62 kDa), aldolase (47.5 kDa), triosephosphate isomerase (32.5 kDa), β-Lactoglobulin (25 kDa), lysozyme (16.5 kDa), and aprotinin (6.5 kDa)) as standard products of various molecular weights. The 1× running buffer was injected into the electrophoresis tank. The first swim was fixed at 80 V for 20 min, then the voltage was adjusted to 120 V for 120 min. The film was taken for staining when bromophenol blue was about 1 cm from the bottom of the film. For, Western blot analysis, 3 mm paper, SDS-PAGE gel, PVDF membrane, and 3 mm paper were layered and air bubbles were removed. Transferred it to a tank with 400 mA current for about 100 min. Protein was transferred to the PVDF membrane. After, shaken slowly with blocking buffer (5% skim milk, 0.1% Tween-20 in PBS) for 1 h and washed (3 times) with buffer TBST (1X TBS/0.1% (v/v) Tween-20). The primary antibody was added and allowed to react at room temperature for about 2–3 h or overnight at 4 °C. Then, it washed three times with 0.1% TBST Buffer for 10 min and a secondary antibody was added. It was then shaken slowly at room temperature for 2 h and washed twice with 0.1% TBST Buffer. The images were taken in a dark atmosphere. Antibody dilutions: KiSS-1R (1:1000, rabbit; 1:10,000, goat antirabbit), StAR (1:1000, rabbit; 1:10,000, goat antirabbit), GPR54 (1:1000, rabbit; 1:10,000, goat antirabbit), 17β-HSD3 (1:500, rabbit; 1:10,000, goat antirabbit), Phospho-Adenosine Monophosphate-Activated Protein Kinase Alpha 1/2 (p-AMPKα1/2) (1:1000, rabbit; 1:10,000, goat antirabbit), PPARα (1:3000, rabbit; 1:10,000, goat antirabbit), PPARγ (1:3000, rabbit; 1:10,000, goat antirabbit), GAPDH (1:5000, rabbit; 1:10,000, goat antirabbit), and α-tubulin (1:3000, rabbit; 1:10,000, goat antirabbit).

2.3. Statistical Analysis

Statistical Product and Service Solutions (SPSS) 11.0 software was used to examine the statistical data. The results are expressed as the mean ± standard error of the mean (mean ± S.E.M.). Significant differences were analyzed by one-way analysis of variance (ANOVA). Multiple comparisons of different groups were analyzed by post hoc Duncan test with a significance level of p < 0.05.

3. Results

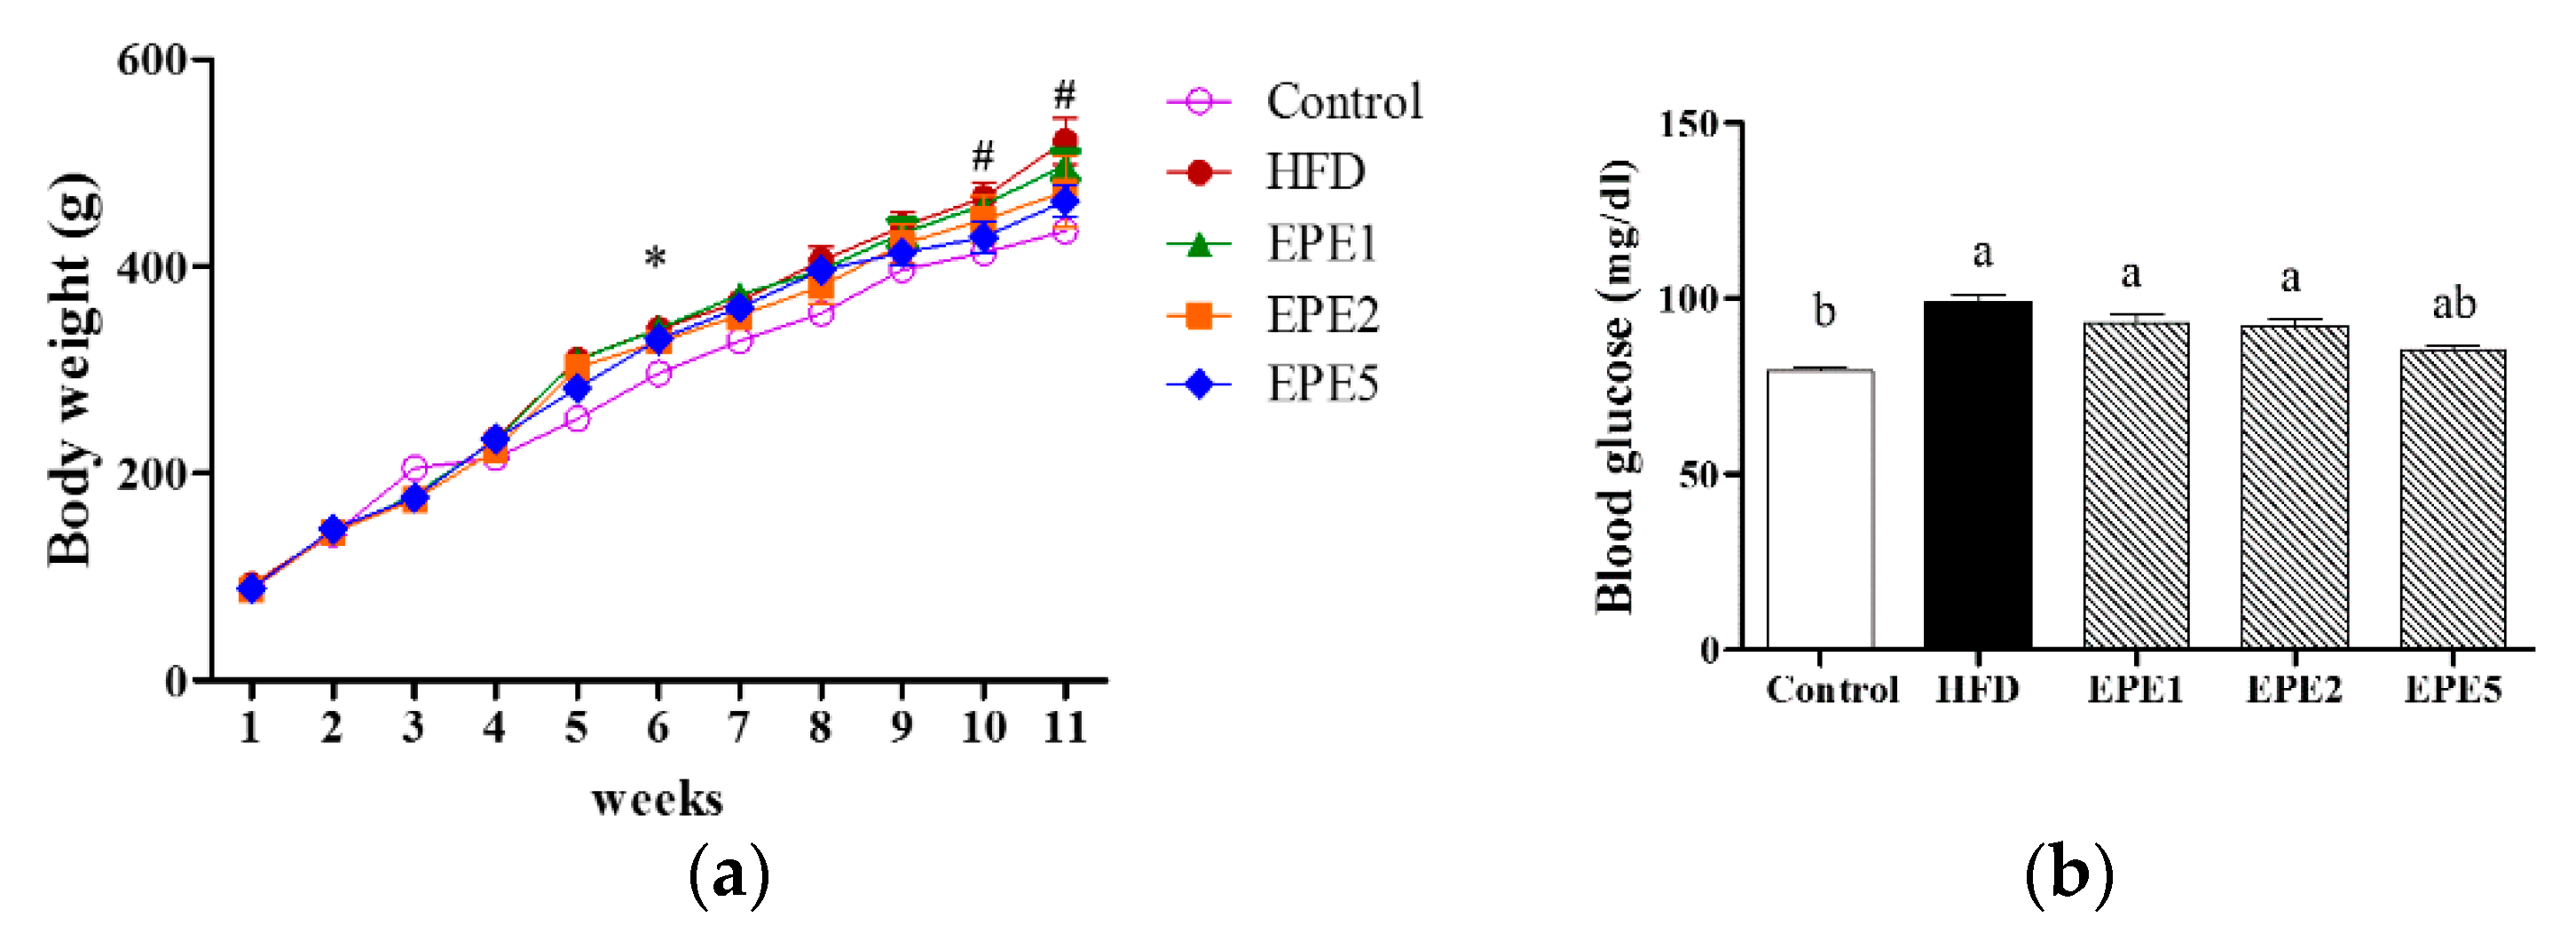
3.1. Body Weight Change and Blood Glucose Level

The body weights of rats were observed each week (Figure 1a). As compared to others, the HFD group had higher body weights and the changes were prominently visible from the 5th week. A significant increase in the body weights of other groups was observed when compared to the control group from the 6th week. At week 11, the HFD group had higher body weights followed by the EPE1 group, and lower body weights were observed in the control group. The blood glucose level was also evaluated in HFD-induced obese rats after 5 weeks (Figure 1b). Higher blood glucose levels were seen in HFD groups and lower levels were observed in the control group. The blood glucose level was slightly decreased with an increase in the concentration of EPE. Only EPE5 groups showed a significant reduction in blood glucose level when compared to the HFD group.

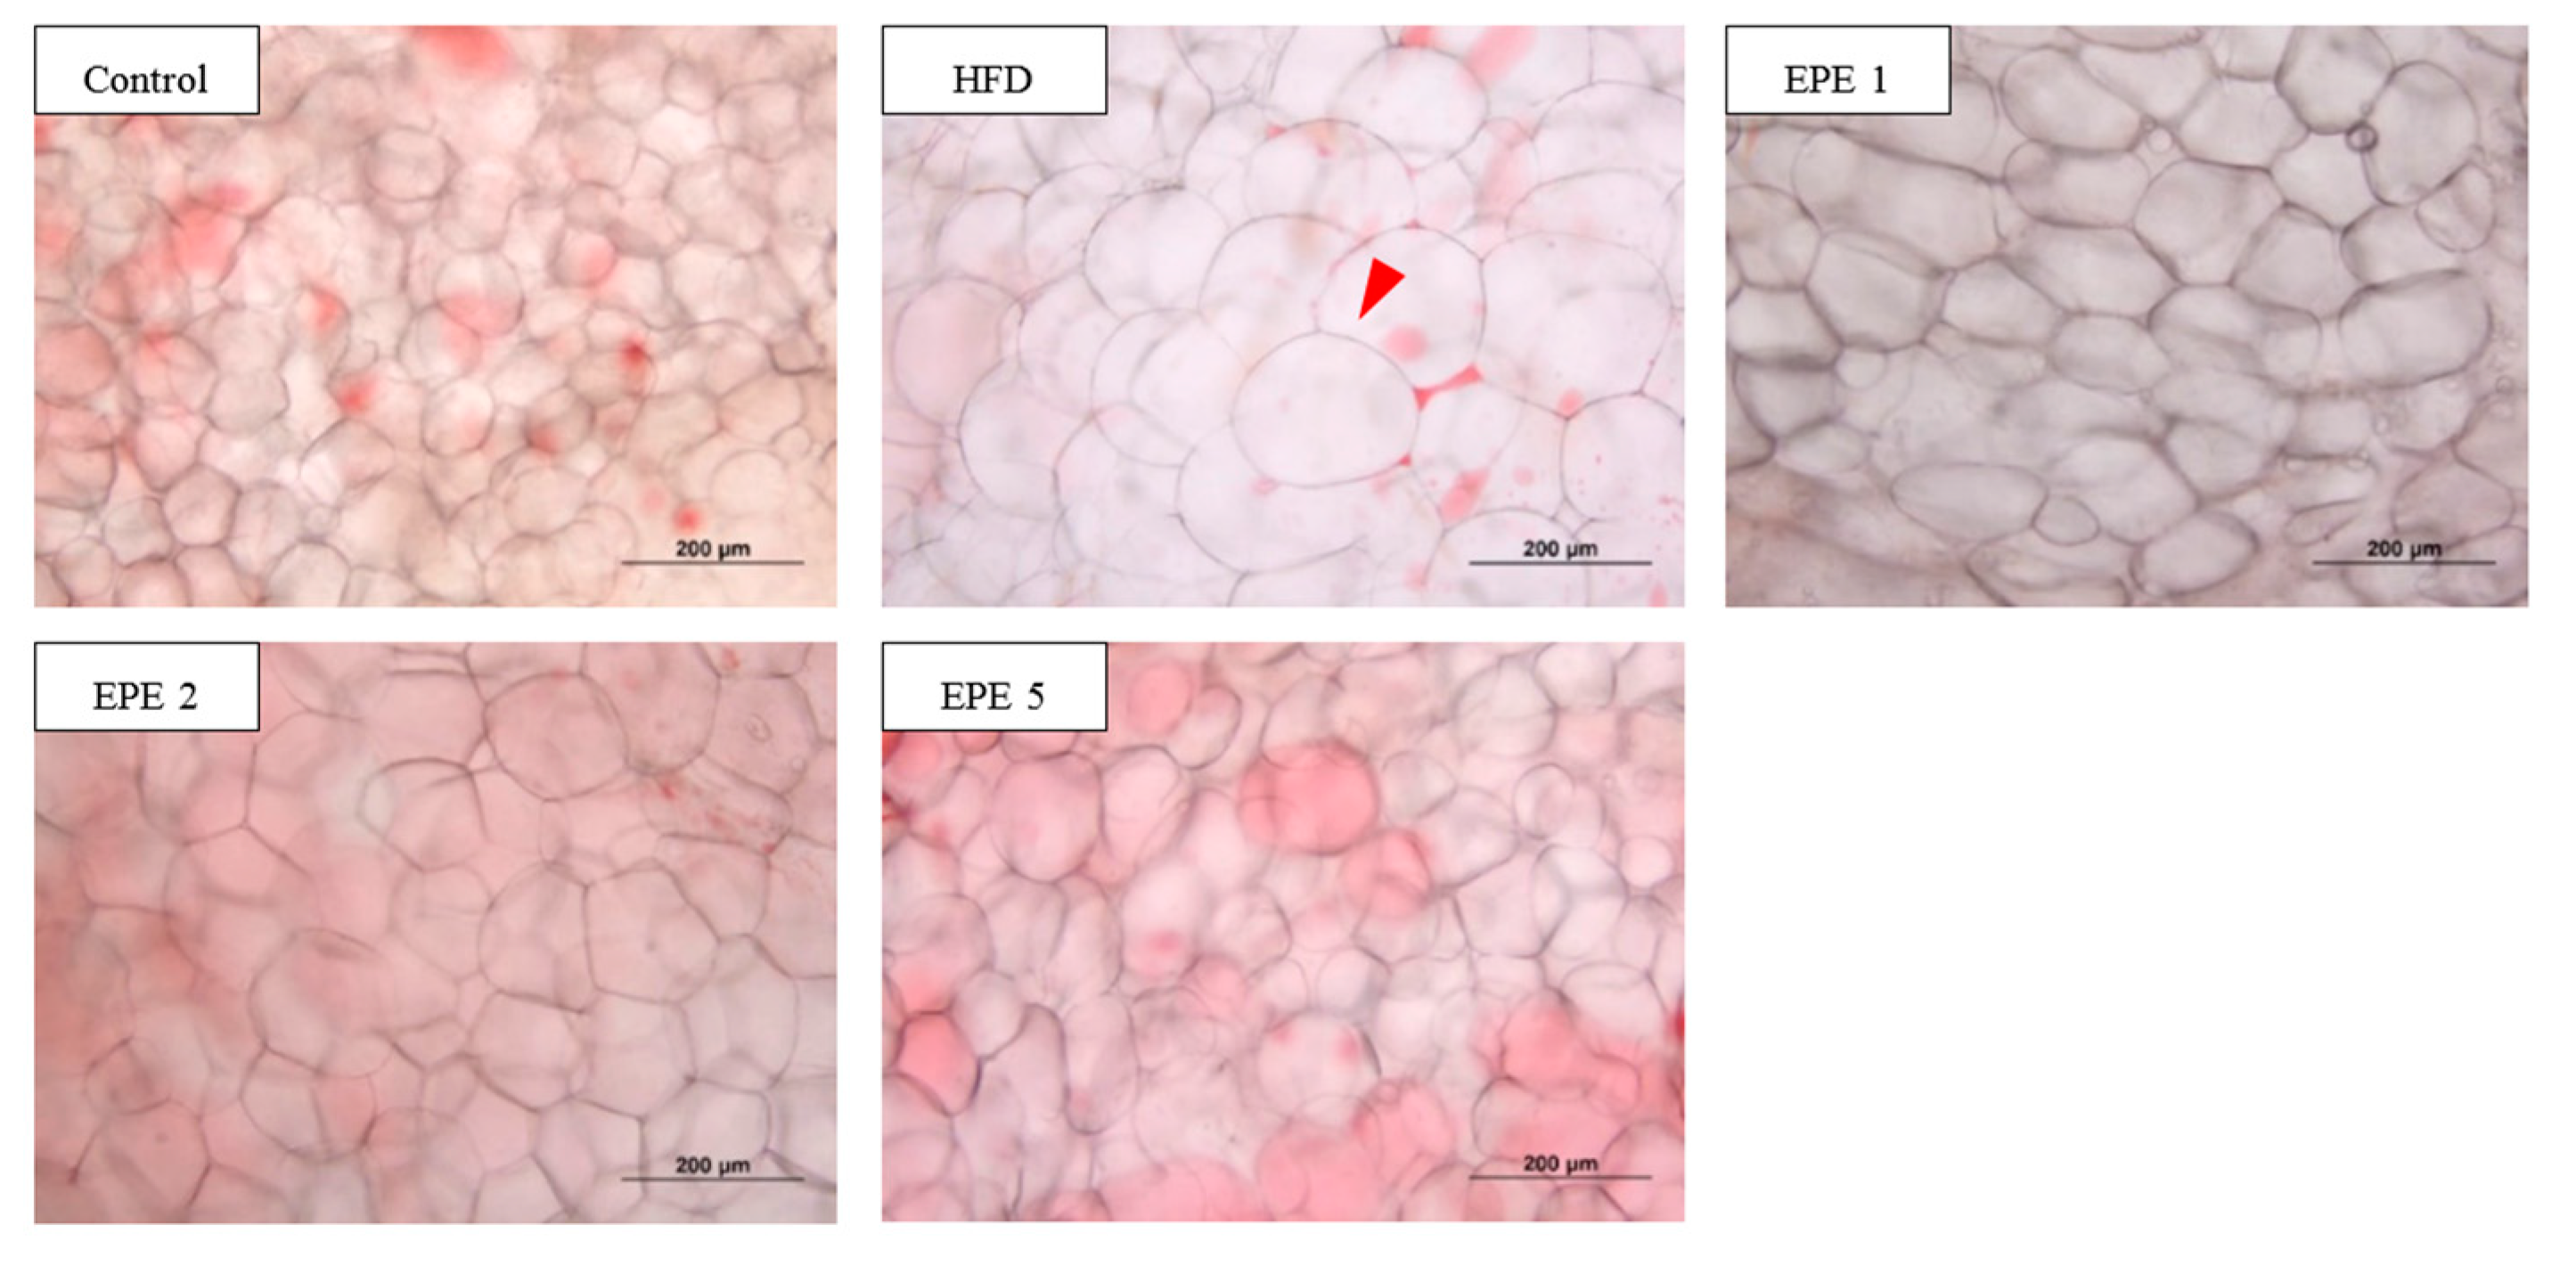
3.2. Adipocyte Morphology

Adipocyte morphology was analyzed based on number and size distribution. Adipocytes that are fewer in number and have large sizes. The fewer large sized cells are hypertrophic while those with more small cells are hyperplastic [26]. It was observed that large adipocyte tissues were formed in the HFD group, whereas EPE groups recovered the normal morphology of adipocytes, especially in EPE5 (Figure 2). This result was supported by Table 1, in which the adipocyte diameters are given. Our results showed that the HFD group had higher adipocyte diameters (161 µm) than others and the diameters decreased from the EPE 1 to EPE5 treated groups. The average diameters of EPE 1, EPE 2, and EPE5 were 136.25, 118.25, ad 101.75 µm, respectively. The lowest diameter was observed in the control group.

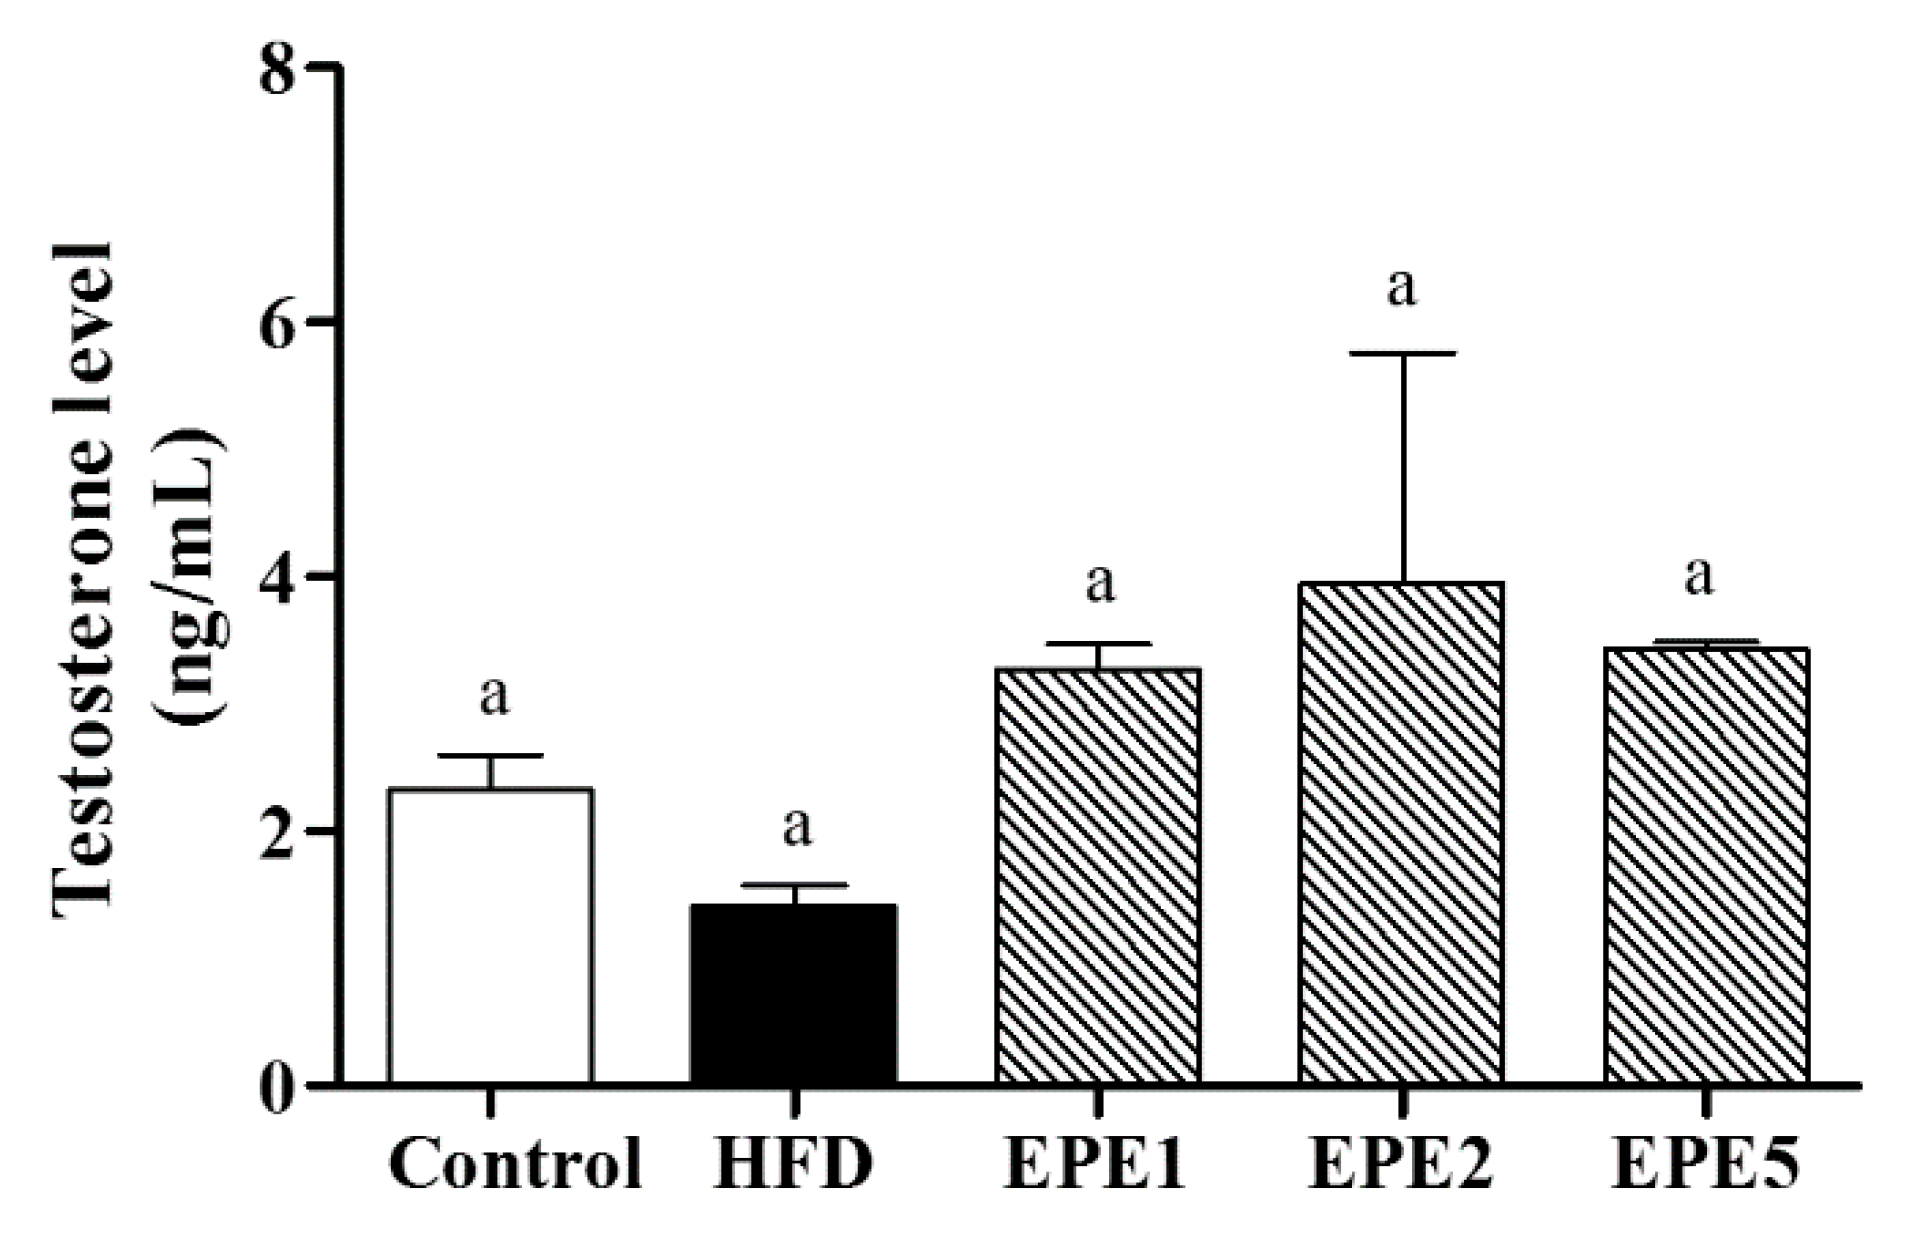
3.3. Plasma Testosterone Level

A previous study mentioned that a low level of testosterone in the blood is an indicator of obesity and abdominal fat accumulation [27]. Testosterone level in plasma was given in Figure 3. It was noted that testosterone level was lower in the HFD group and higher in EPE groups. As compared to the control group, the level of testosterone was also increased in EPE groups.

3.4. Weight of Testes and Epididymis

The weight, length, and weight to length ratio of testes were examined and are given in Table 2. The weight of the testes was higher in the control group and lower in the HFD group. There was no significant difference between EPE1, EPE2, and EPE5 groups. The length of the testes was higher in EPE1 and EPE2 groups followed by the EPE5 group. It was a little bit higher than the control group. However, there was no significant difference between the groups in terms of testes length. The weight to length ratio was increased from EPE1 to EPE5 groups. EPE5 has a larger ratio than the control group and the lower ratio was seen in the HFD group. In addition to the testes, the weight of the epididymis was also measured. The control group has a larger epididymis weight than other groups and it was significantly reduced in the HFD group. EPE groups have been improved the weight when compared to the HFD group.

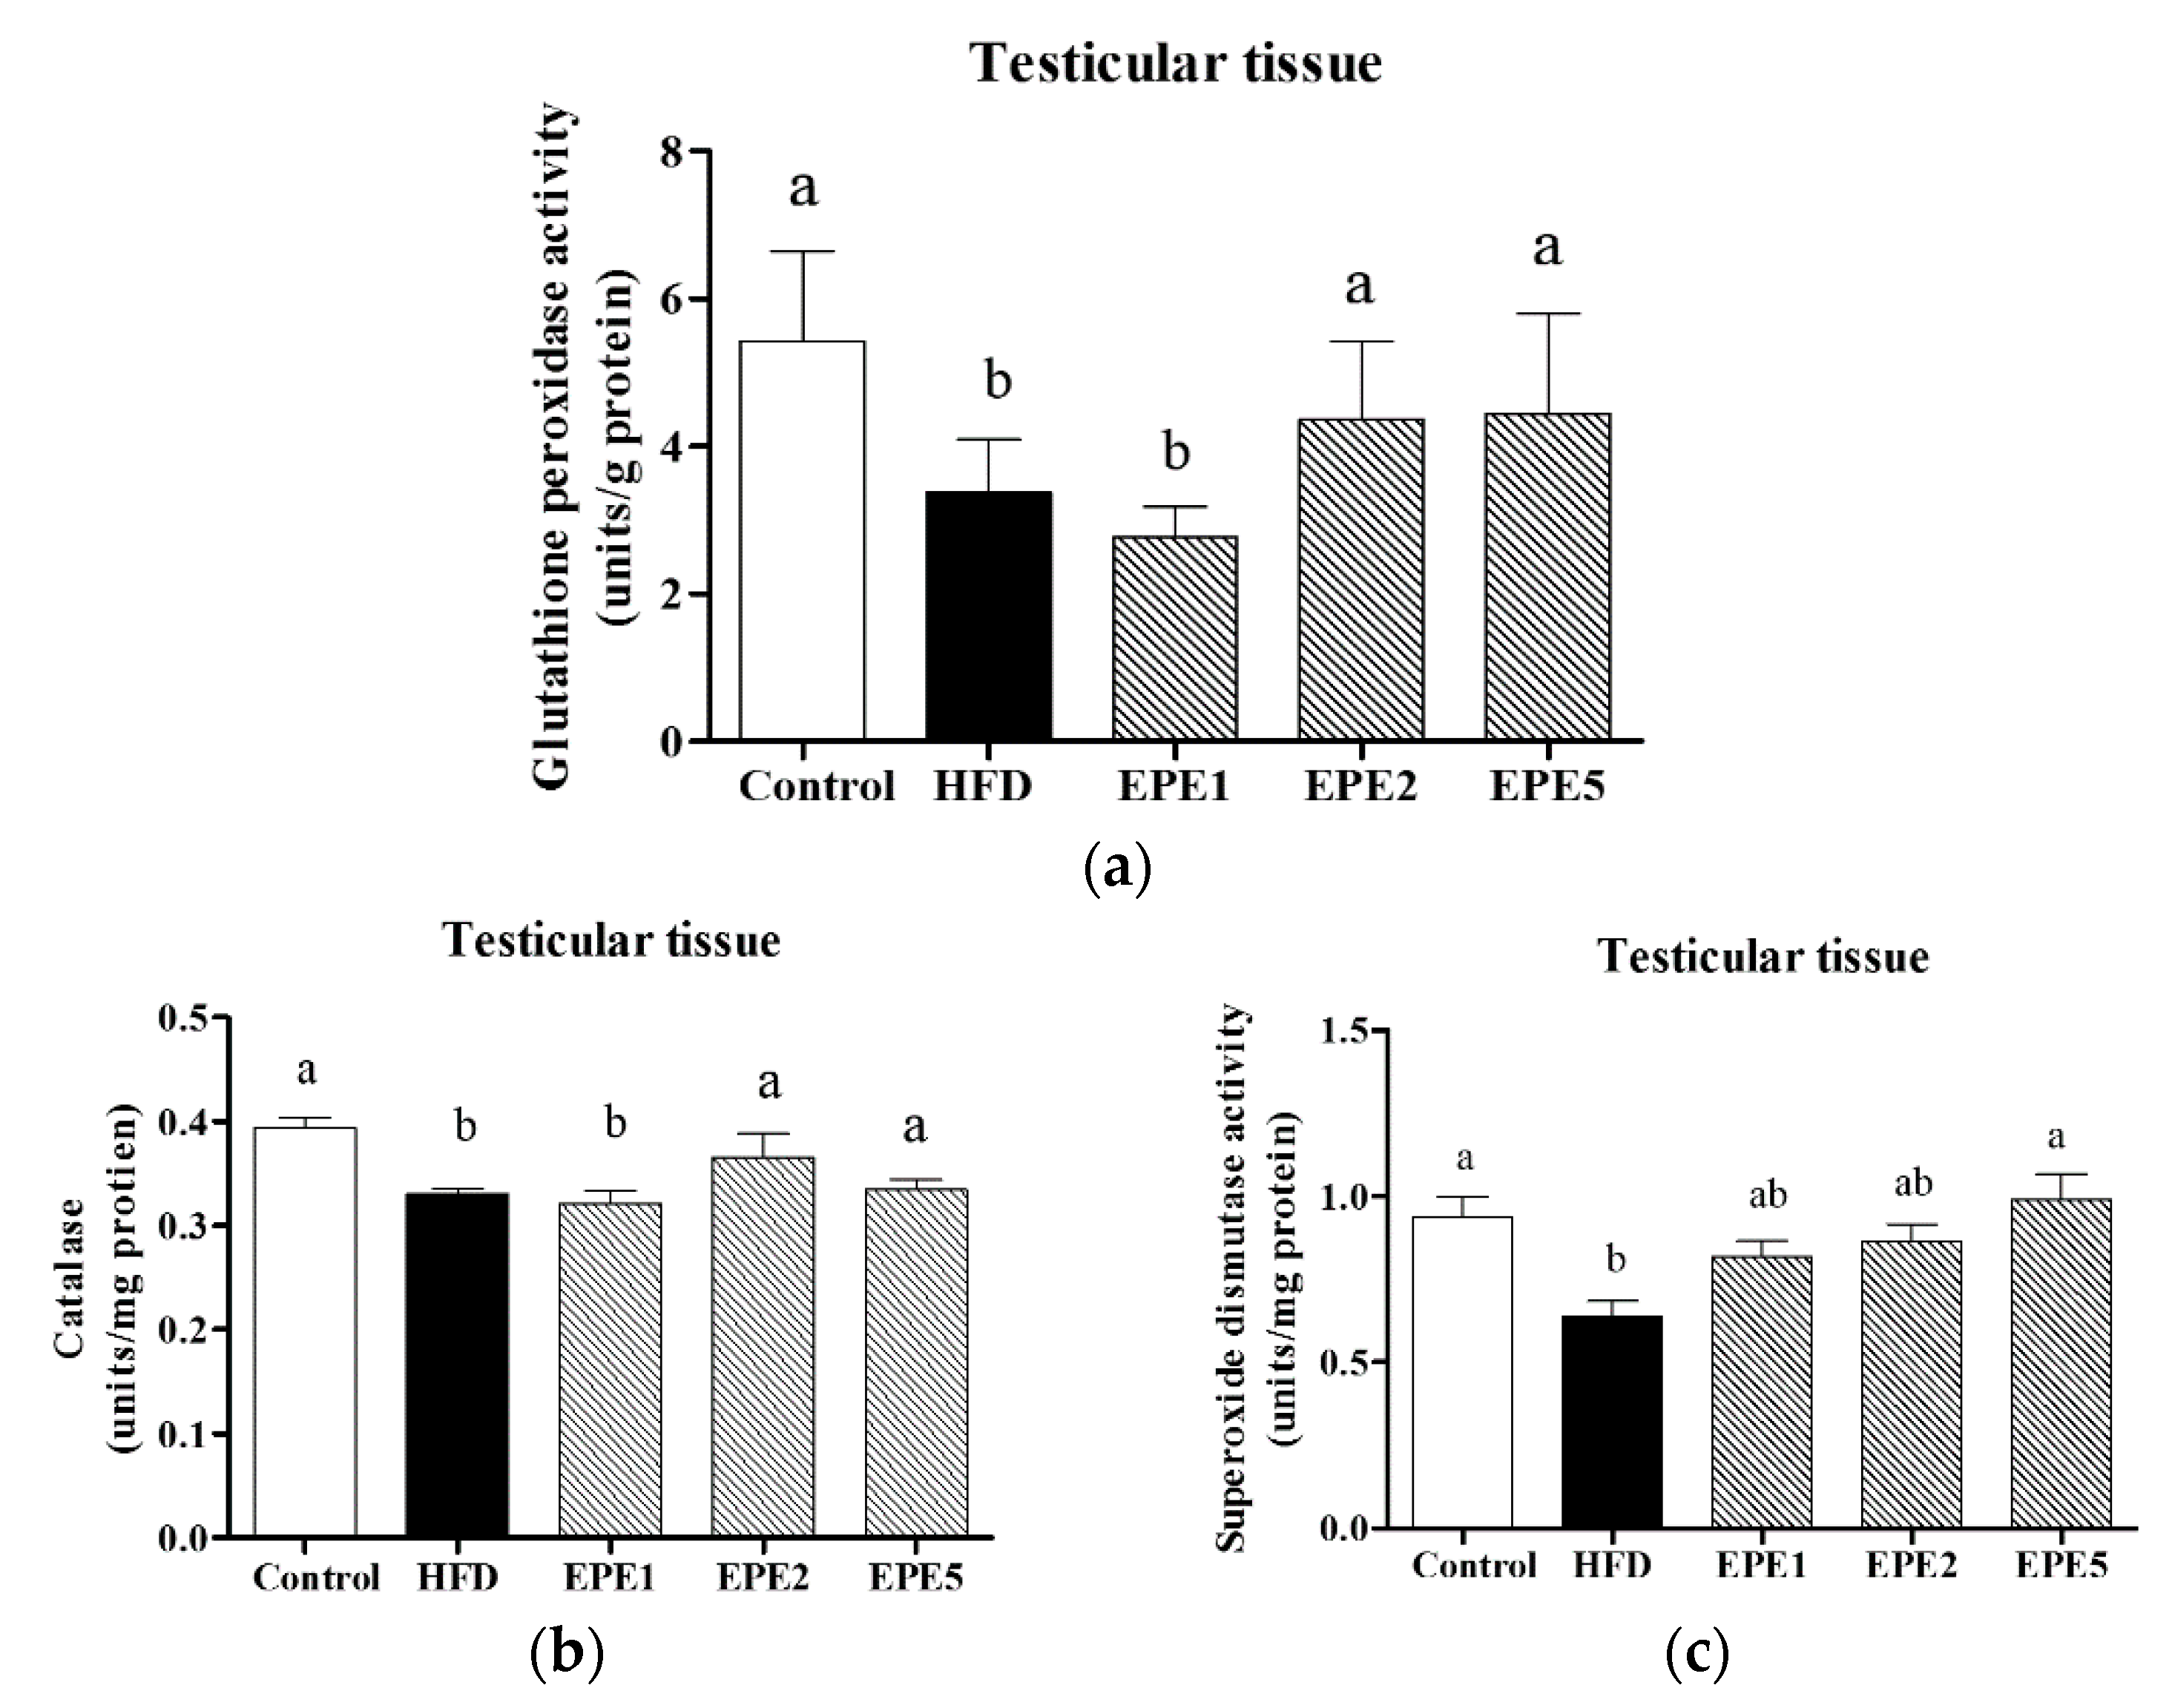
3.5. Determination of Antioxidant Level

The activity of glutathione peroxidase (GPx), catalase, and superoxide dismutase (SOD) is given in Figure 4. The GPx activity was increased in EPE groups when compared to the HFD group (Figure 4a). Higher activity was observed in the control group followed by the EPE5 group. A dramatic increase in GPx activity was seen in EPE groups and EPE1 has low activity and EPE5 has higher activity. Catalase activity was given in Figure 4b. It was observed that catalase activity was lower in the HFD and EPE1 groups when compared to others. The catalase activity was not significantly different among the control, EPE2, and EPE5 groups. The higher activity has seen the control group followed by the EPE2 group. In addition to GPx and catalase activity, SOD activity was also measured in testicular tissue (Figure 4c). The level of SOD was higher in the EPE and control groups than in the HFD group. It was noted that the activity of SOD was directly proportional to EPE concentration.

3.6. Malondialdehyde (MDA) Production

MDA production was measured in both sperm and testes (Figure 5). As shown in Figure 5a, the MDA production was higher in the HFD group and lower in the EPE5 group. MDA levels in control and EPE5 groups were not significantly differed. The MDA production was slightly increased in both EPE1 and EPE2 groups when compared to the EPE5 group. Like Figure 5a, the MDA level was also increased in the testes of the HFD group. A dramatic decrease in MDA production was observed from EPE1 to EPE5 groups but it was statistically higher than the control group.

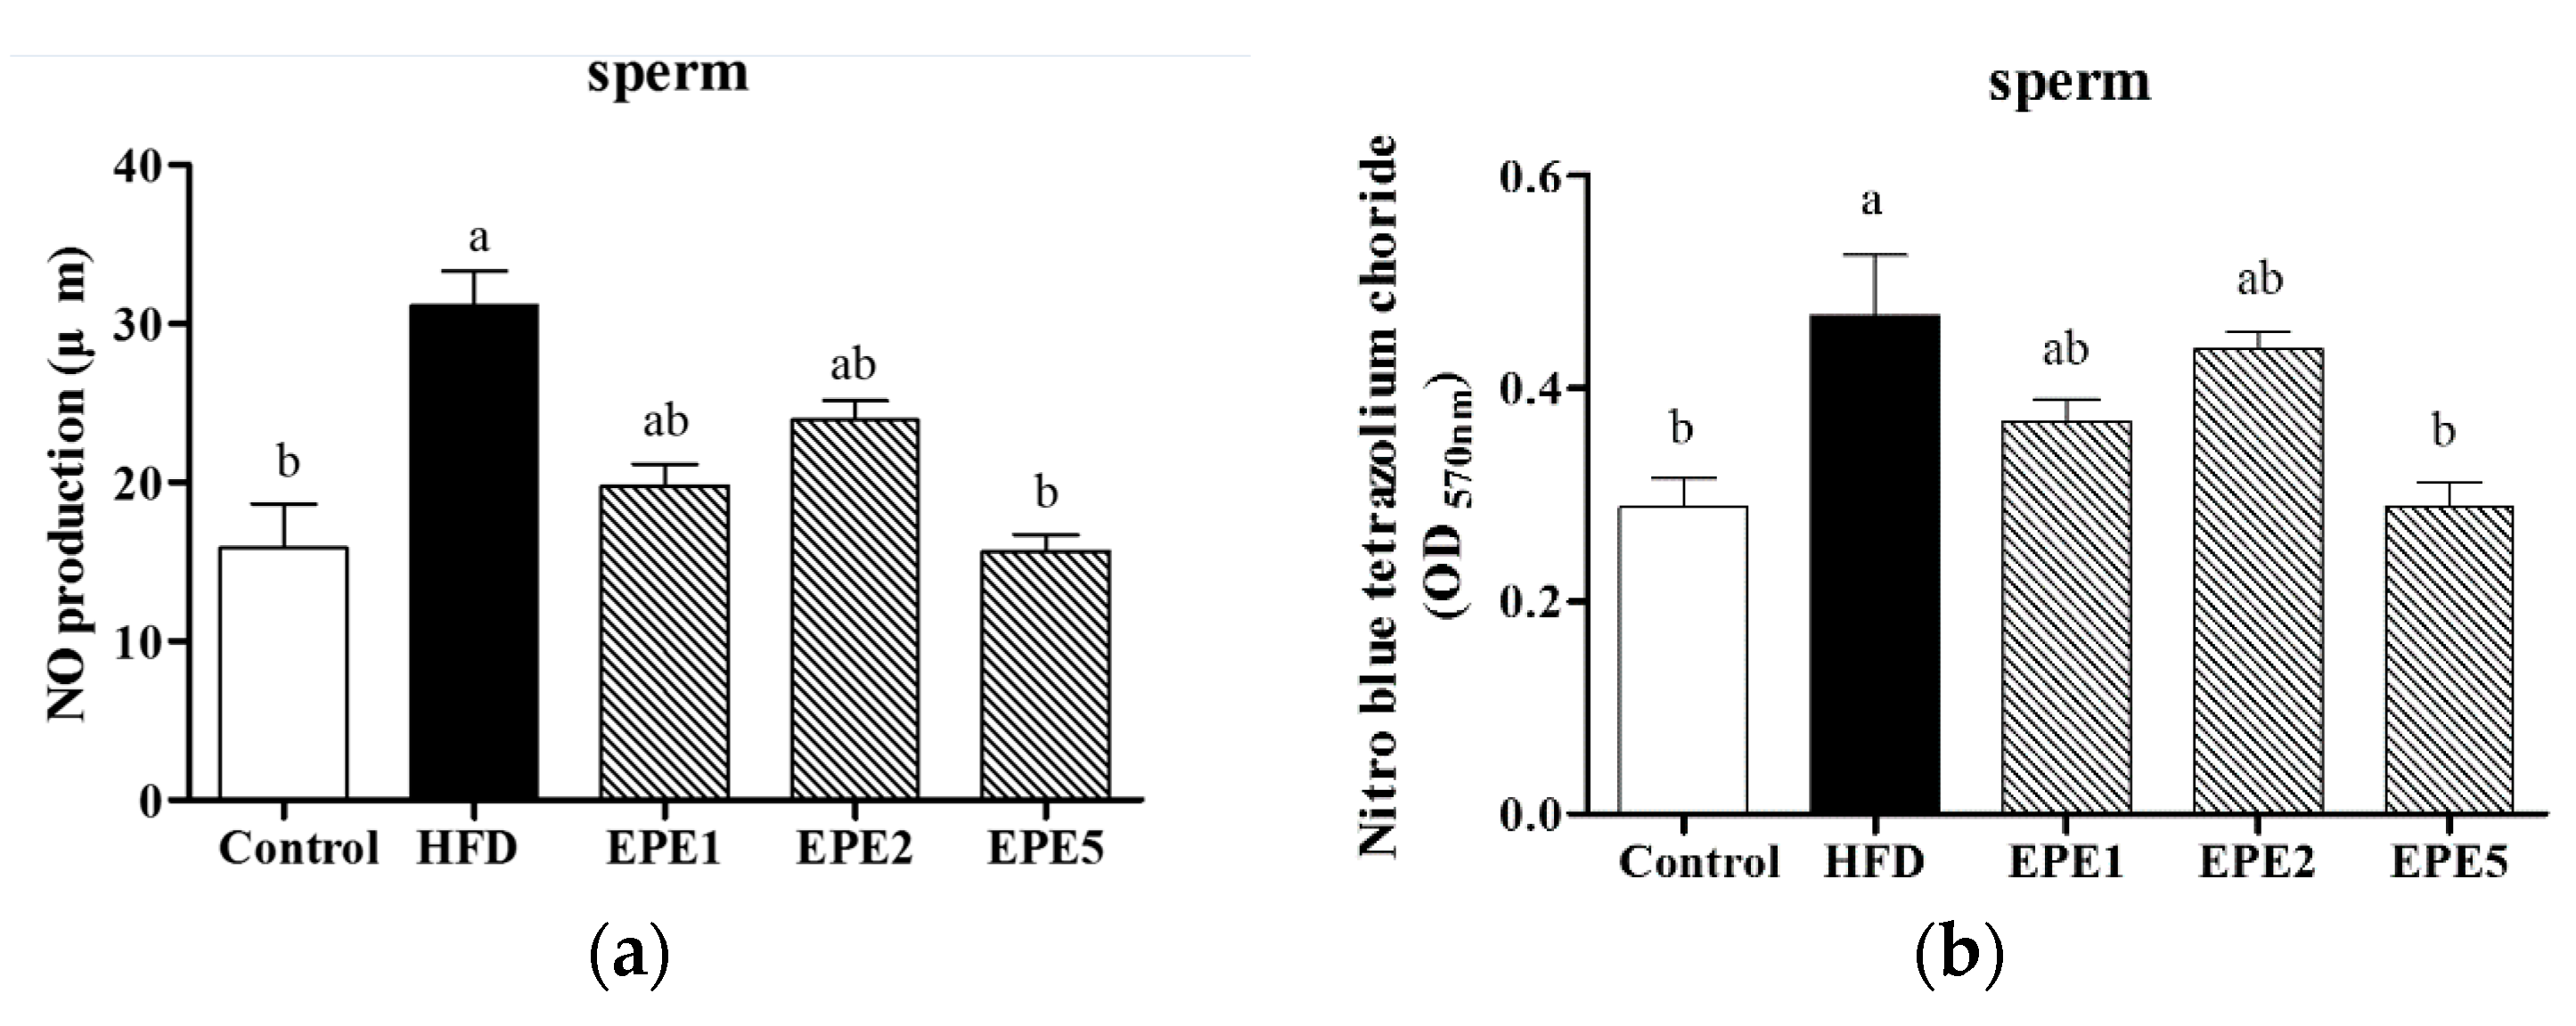
3.7. Nitric Oxide (NO) Production and Nitroblue Tetrazolium (NBT) Assay

NO production in sperm is given in Figure 6a. It was observed that NO production was increased in HFD and decreased in the control group. NO production in EPE groups was significantly lower than the HFD group and there was no significant difference between the control and EPE5 groups. The EPE1 group has a lower NO level than the EPE2 group. NBT reduction in sperm was also evaluated to understand the superoxide anion production (Figure 6b). A higher reduction in NBT was seen in the HFD group and a lower reduction was observed in the control and EPE5 groups. The EPE1 and EPE2 groups were not statistically different but the production of superoxide anions was lower in the EPE1 group.

3.8. Proinflammatory Cytokines Level

The level of interleukin-6 (IL-6) and tumor necrosis factor-alpha (TNF-α) were measured after 5-weeks of treatment (Table 3). TNF-α and IL-6 levels were significantly increased in the HFD group. The TNF-α level was inversely proportional to EPE concentration. Lower TNF-α was seen in both control and EPE5 groups. Furthermore, the level of IL-6 was almost similar in EPE1 and EPE2 groups. It was observed that the IL-6 level was not statistically different between the control and EPE5 groups. A higher level of IL-6 was seen in the HFD group.

3.9. Alanine Transaminase (ALT), Aspartate Aminotransferase (AST), Urea, and Creatinine Level

ALT, AST, urea, and creatinine levels were measured after 5 weeks (Table 4). The amount of ALT was increased in the EPE2 and EPE5 groups. The HFD group had a low level of ALT together with the EPE1 group. The amount of ALT of the control group was lies in between the EPE1 and EPE5 groups. AST was higher in both the HFD and EPE2 groups followed by the EPE1 group. The level was almost similar in the EPE5 and control groups. It was observed that the urea level and creatinine levels were higher in the HFD group. The levels of urea in EPE groups decreased in a concentration-dependent manner. The control and EPE5 groups have a smaller amount of urea. Akin to urea, creatinine levels were also decreased in the EPE groups, especially in the EPE5 group and the control group.

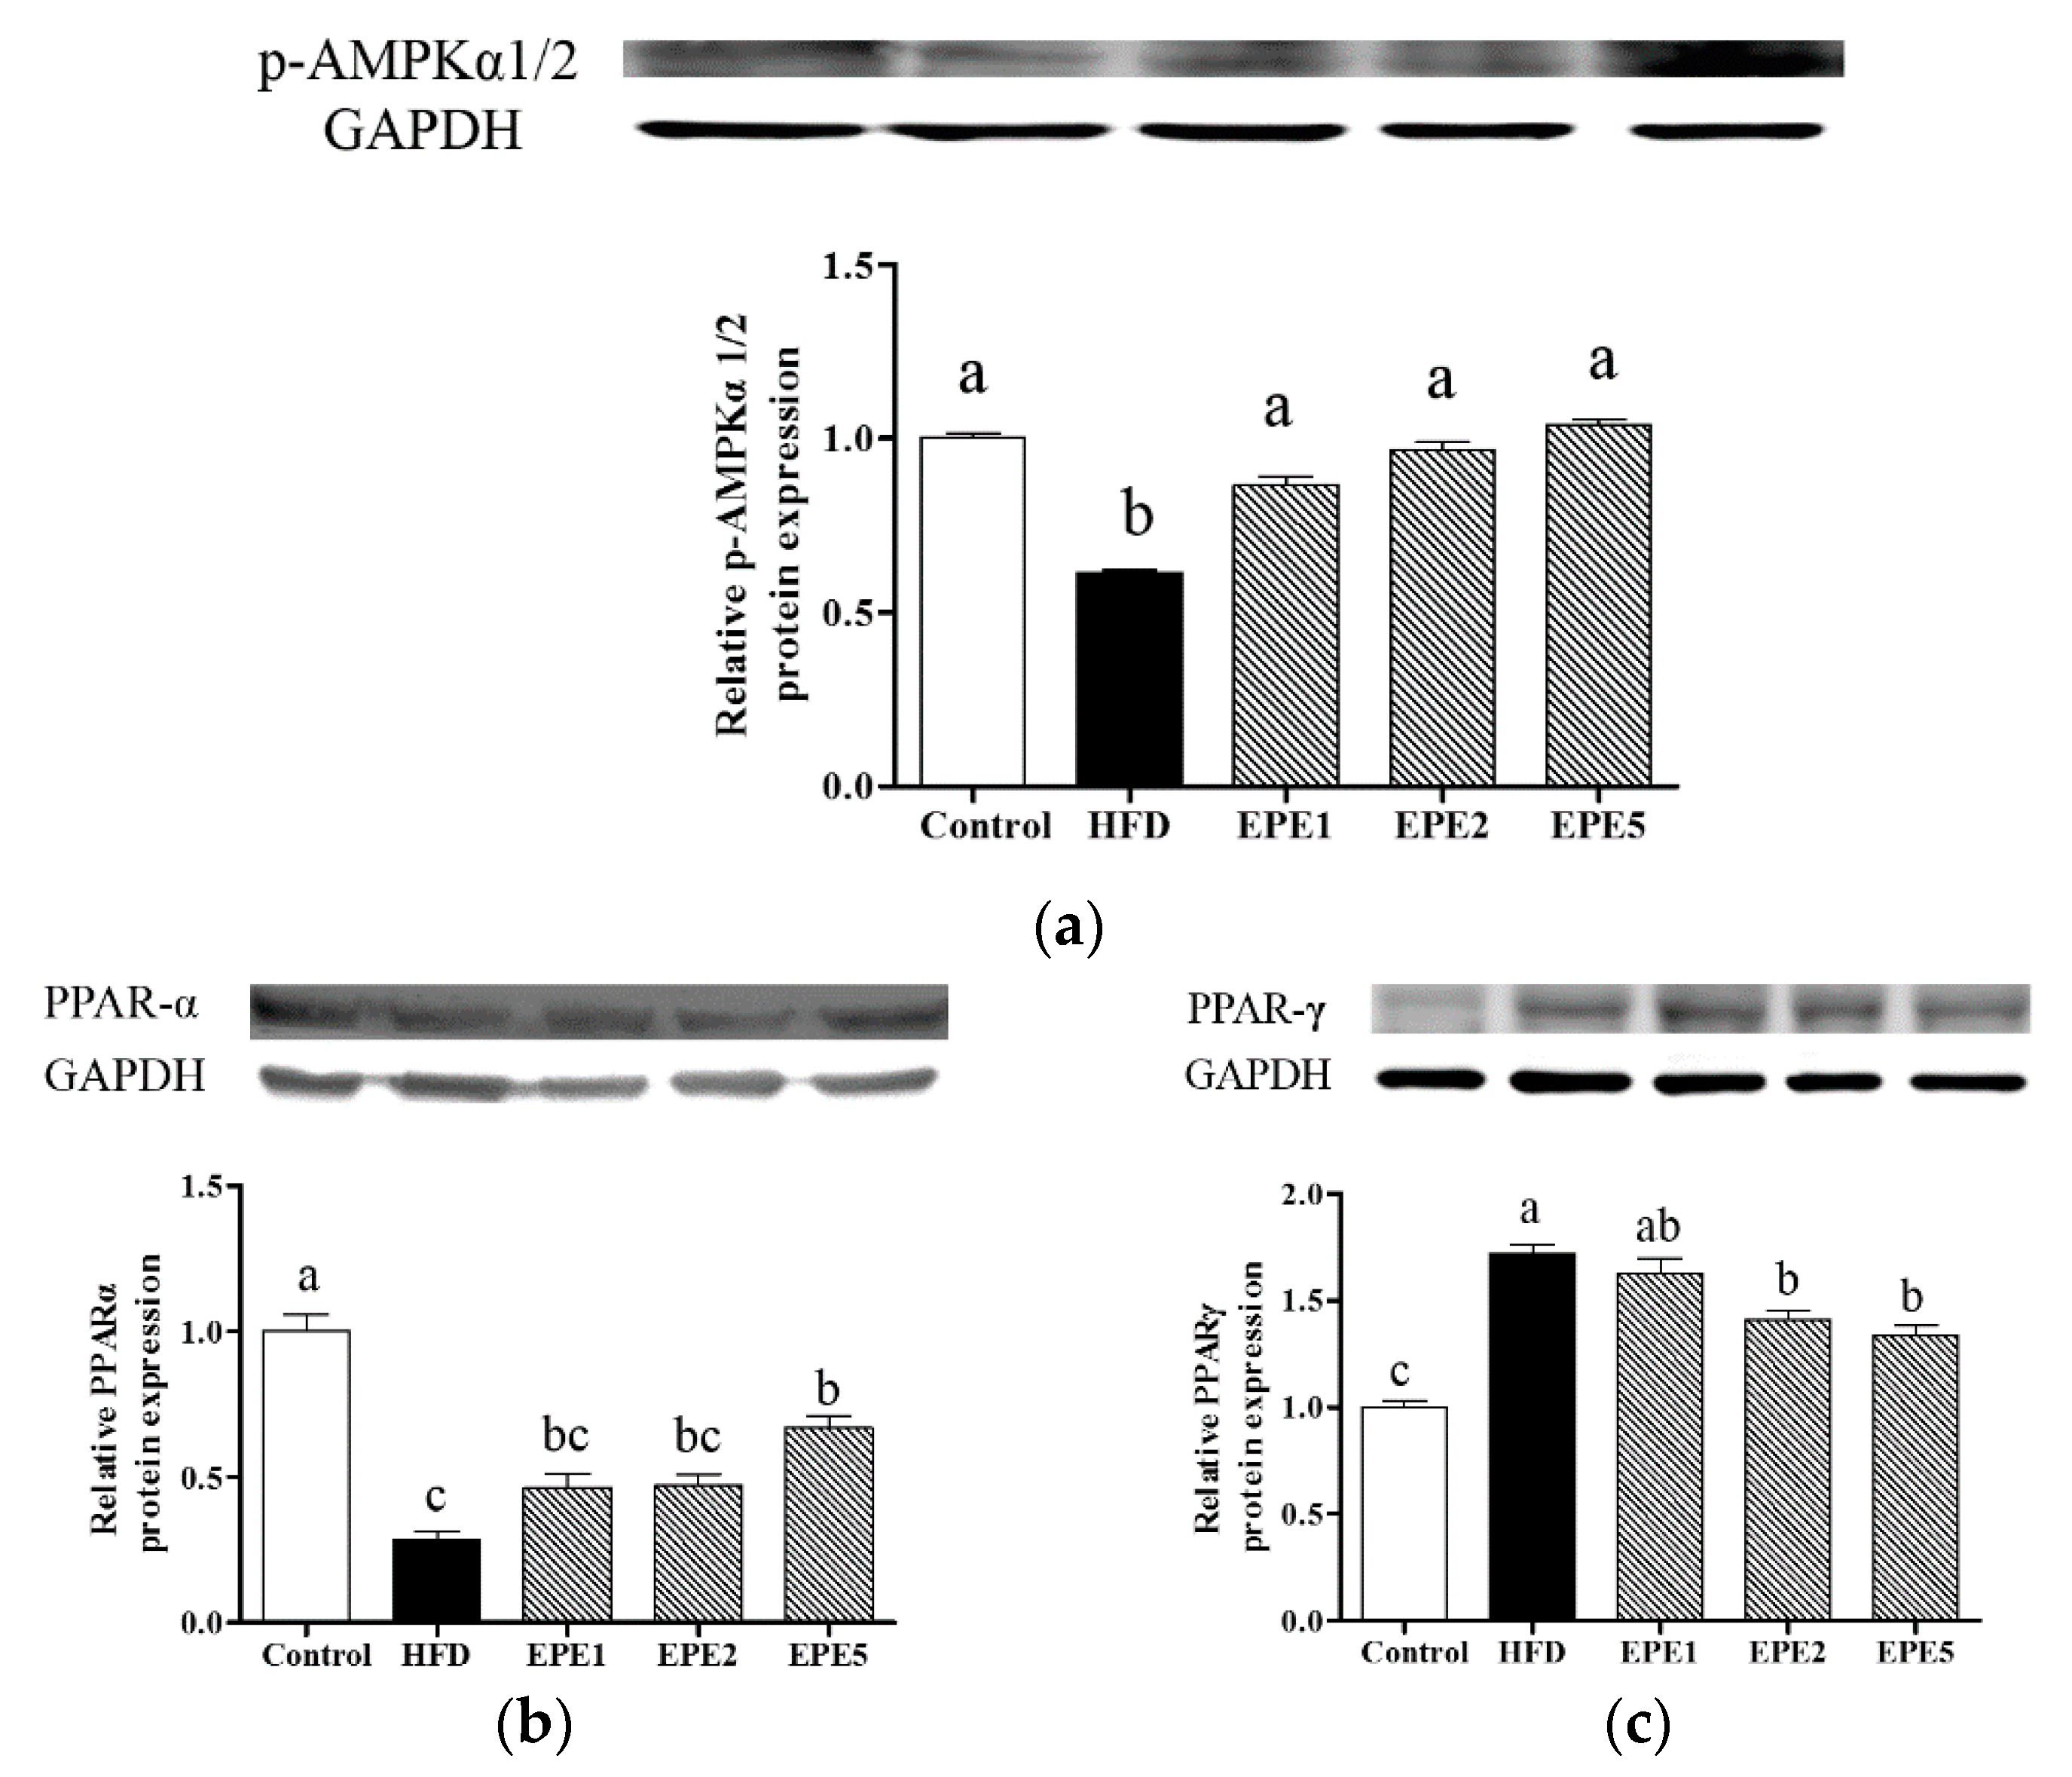
3.10. Liver Protein Expression of Phospho-Adenosine Monophosphate-Activated Protein Kinase Alpha 1/2 (p-AMPKα1/2), Peroxisome Proliferator-Activated Receptor Alpha (PPAR-α), and Peroxisome Proliferator-Activated Receptor Gamma (PPAR-γ)

The protein expressions of p-AMPKα1/2, PPAR-α, and PPAR-γ in the liver are given in Figure 7. It was found that relative p-AMPKα1/2 protein expression was increased in EPE groups in a concentration-dependent manner (Figure 7a). The expression was significantly lower in the HFD group. Higher expression of p-AMPKα1/2 was seen in both the control and EPE5 groups. Relative PPAR-α expression is elucidated in Figure 7b. The expression of PPAR-α was higher in both the control and EPE groups when compared to the HFD group. EPE5 showed higher PPAR-α protein expression than EPE1 and EPE2. As shown in Figure 7c, the PPAR-γ expression was higher in the HFD group and lower in the control group when compared to others. PPAR-γ expression slightly decreased from the EPE1 group to the EPE5 group. The expression was not statistically different between the EPE2 and EPE5 groups.

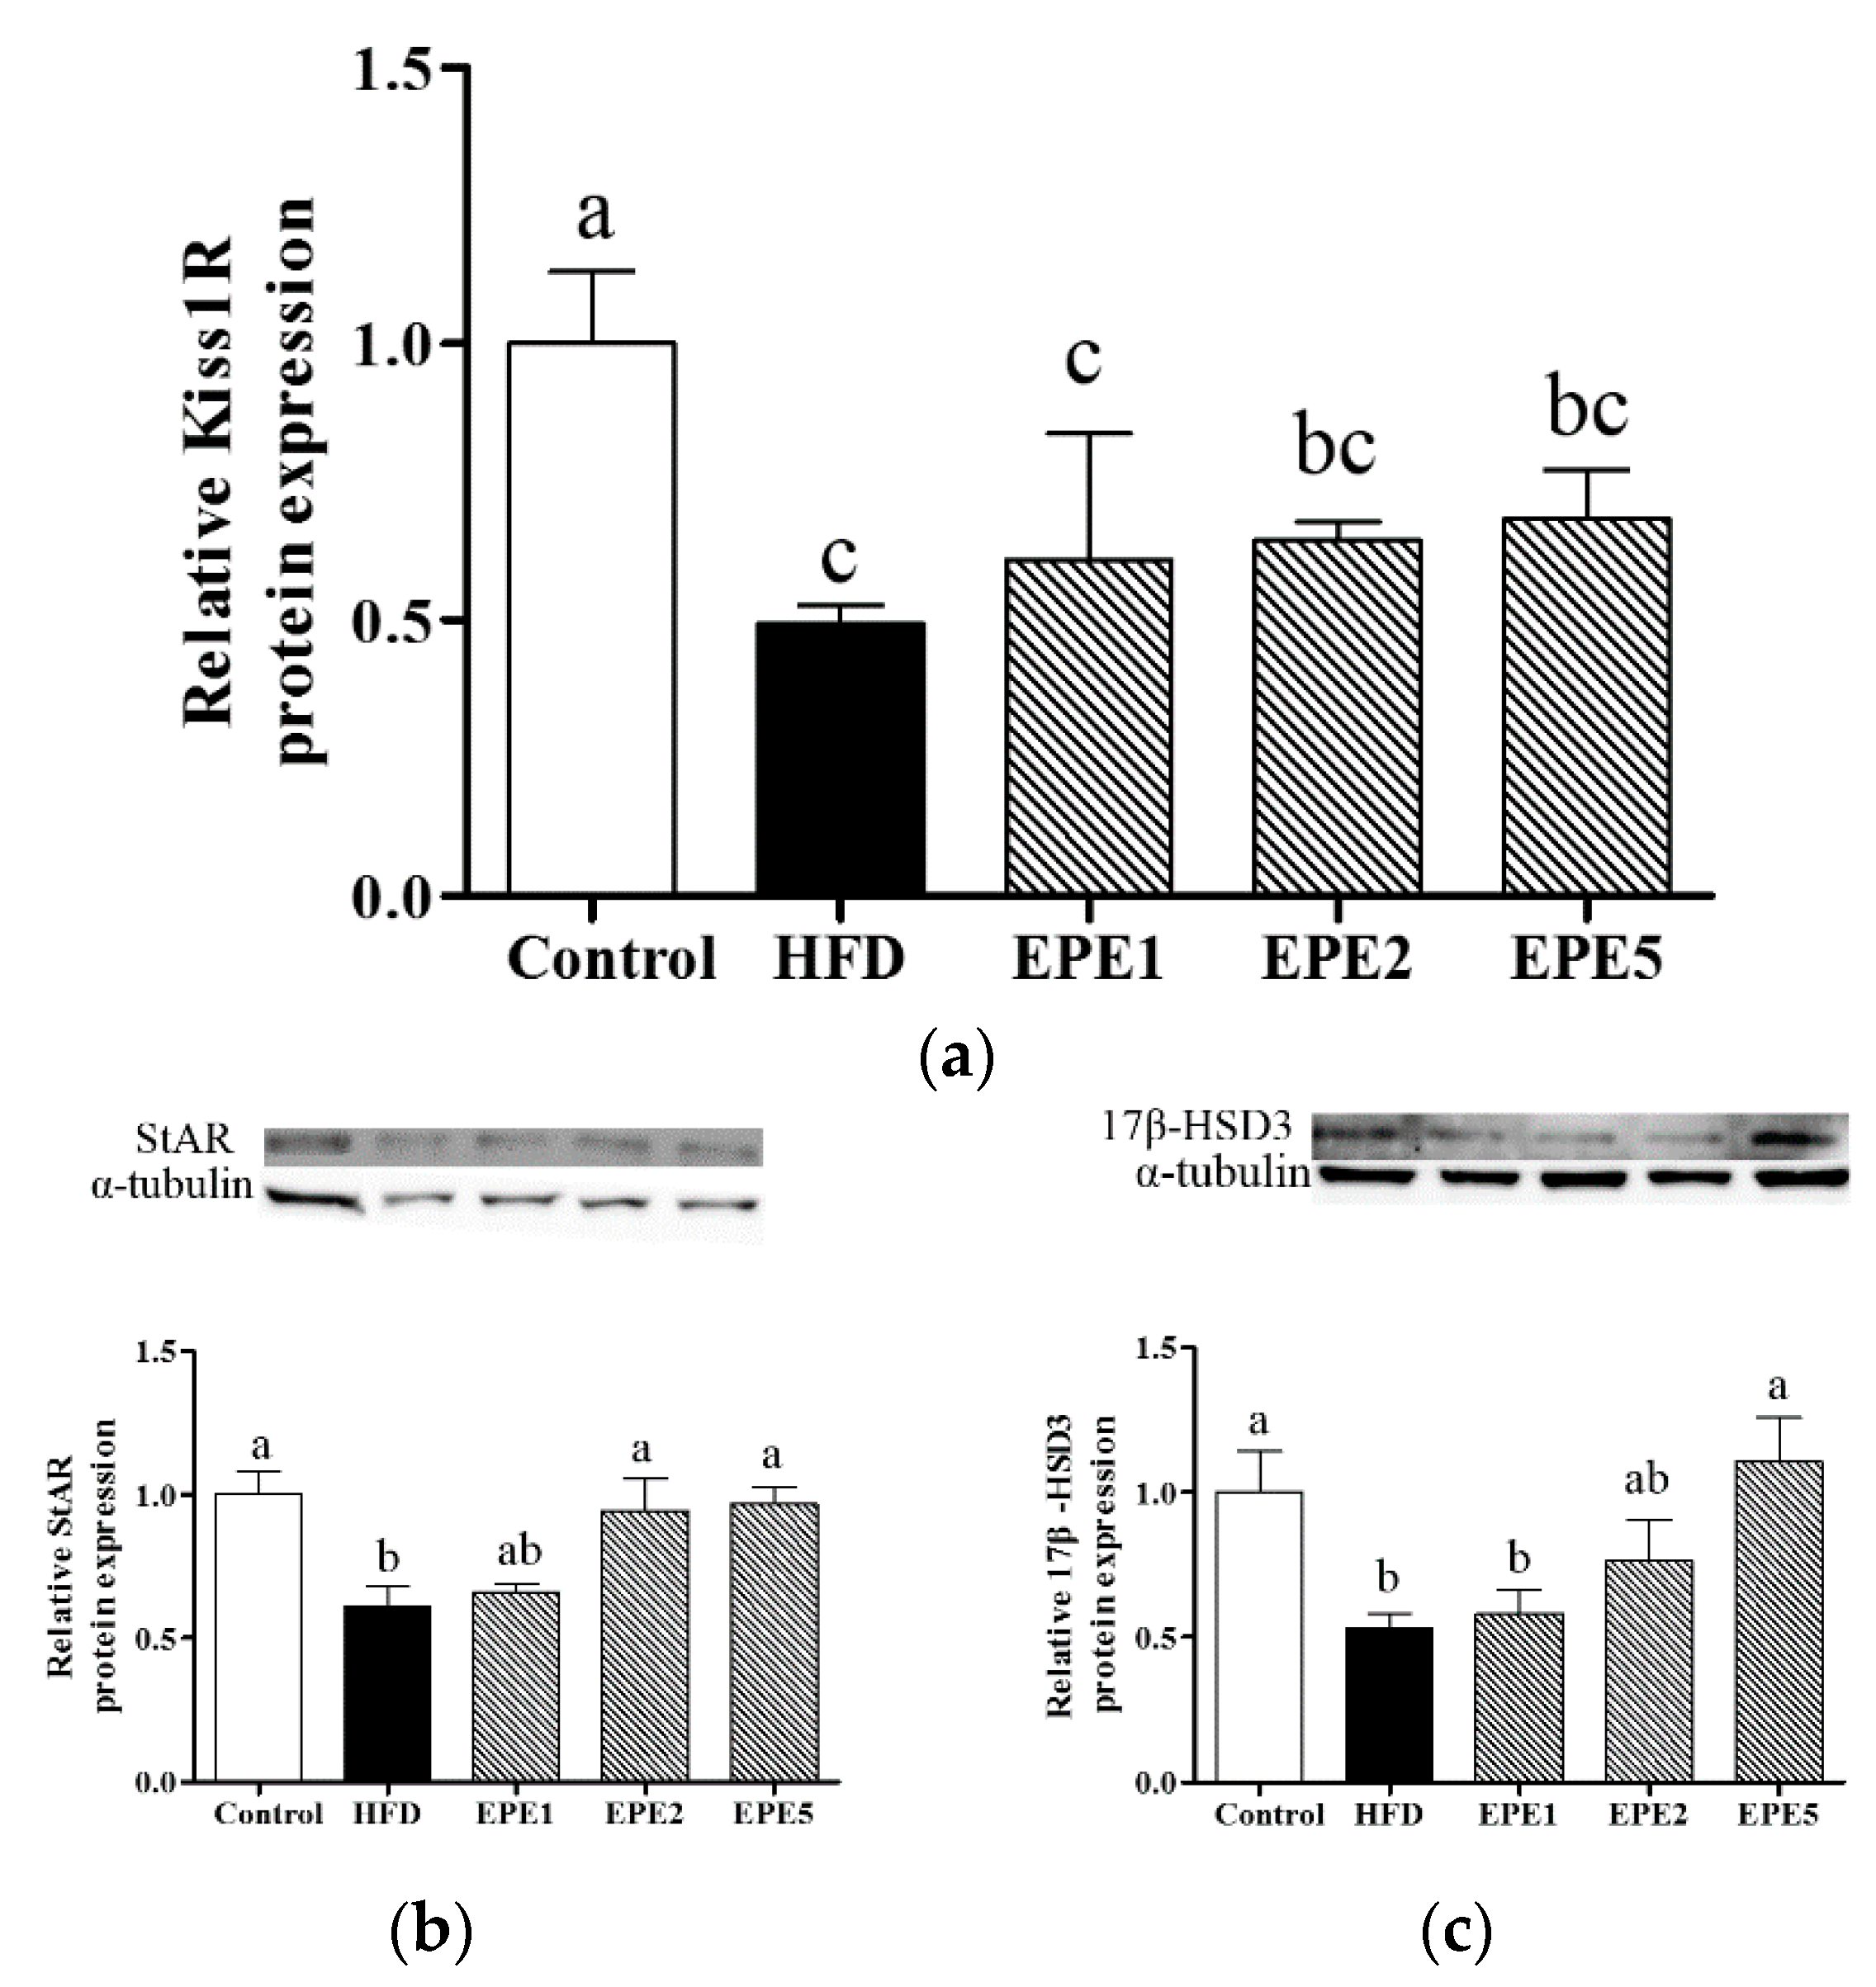
3.11. Kisspeptin 1-Derived Peptide Receptor (Kiss1R), Steroidogenic Acute Regulatory Protein (StAR), and 17β-Hydroxysteroid Dehydrogenase 3 (17β-HSD3) mRNA Expressions

Relative Kiss1R, StAR, and 17β-HSD3 mRNA expressions are given in Figure 8. Figure 8a shows that the Kiss1R mRNA expression was highly expressed in the control group. The expression was moderately increased in EPE groups when compared to the HFD group. There was no significant difference between EPE2 and EPE5 groups but both of them were statistically increased when compared to the EPE1 group. Relative StAR mRNA expression was highly increased in the control, EPE2, and EPE5 groups (Figure 8b). The expression was highly reduced in both the EPE1 and HFD groups. Akin to Figure 8b, relative 17β-HSD3 mRNA expression was highly decreased in both the EPE1 and HFD groups (Figure 8c). It was found that the expression of 17β-HSD3 mRNA was directly proportional to EPE concentration. It was also noted that the mRNA expressions in the control and EPE5 groups did not statistically differ.

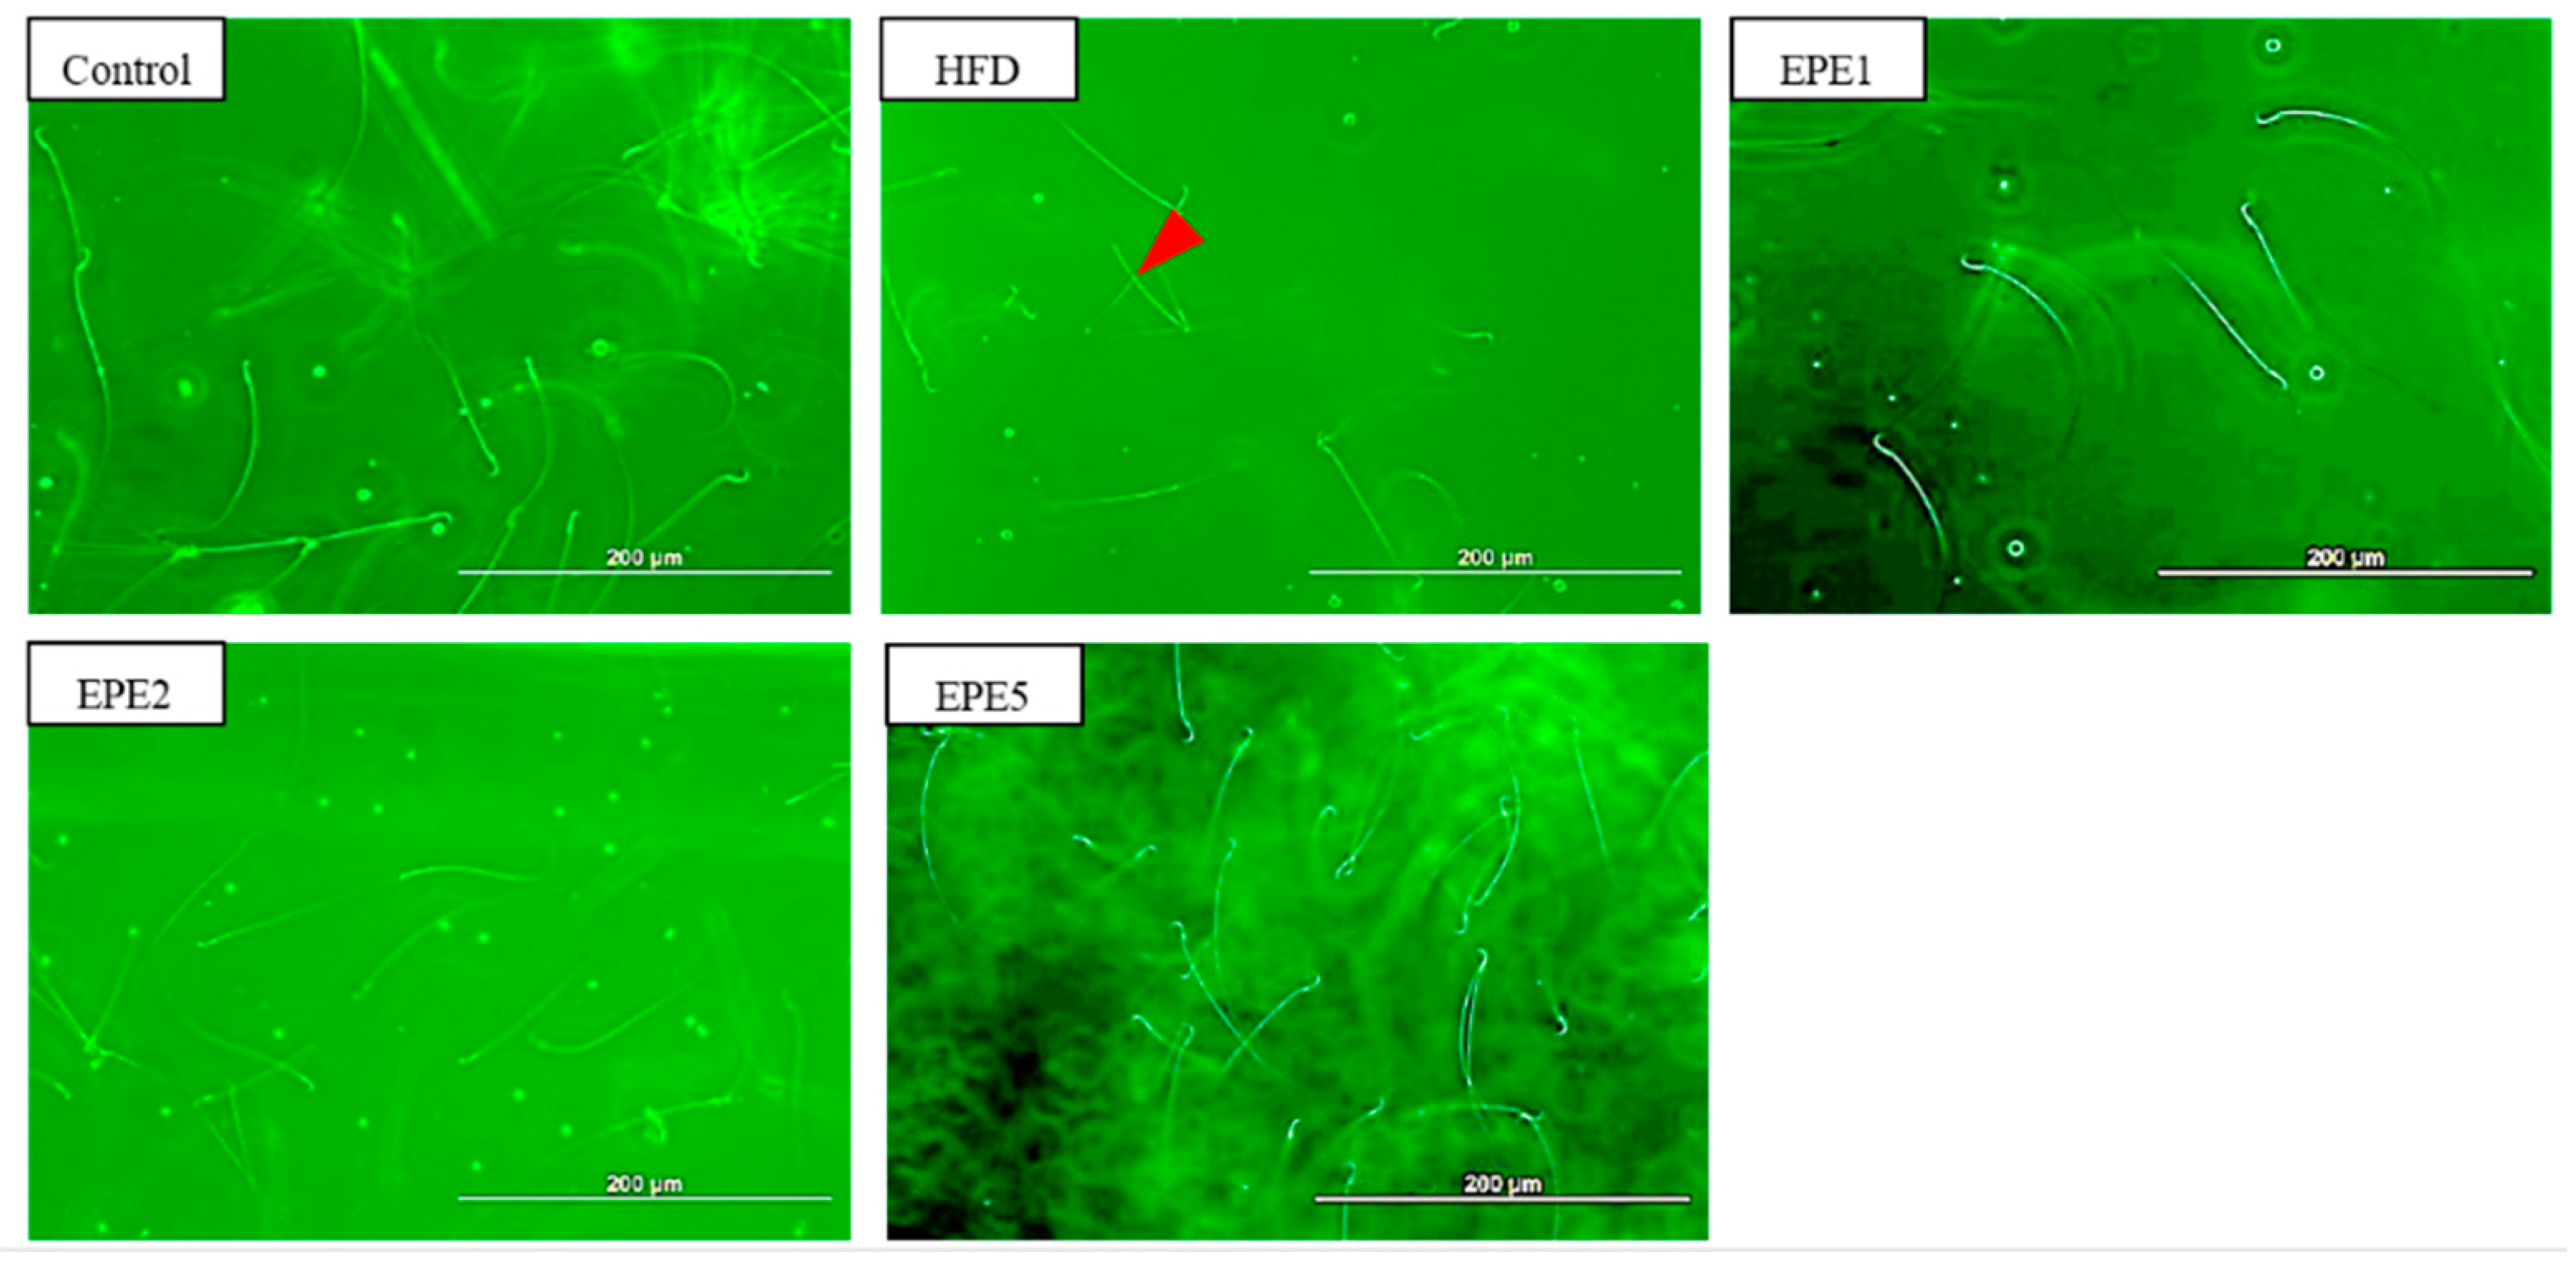
3.12. Sperm Morphology and Sperm Parameters

Both sperm morphology and sperm parameters were observed under the microscope. It was found that the sperm of the HFD group showed abnormal morphology of both heads and the sperm count was also reduced (Figure 9). The total sperm count, motility, and abnormal sperm count in each group are further compared in Table 5. The results showed that the total number of spermatozoa and motility in the HFD group decreased significantly. It was found that EPE extract improved the motility of sperm and reduced the number of abnormal sperms. The results showed that EPE can improve the total number of sperm and reduce the abnormal sperm caused by obesity.

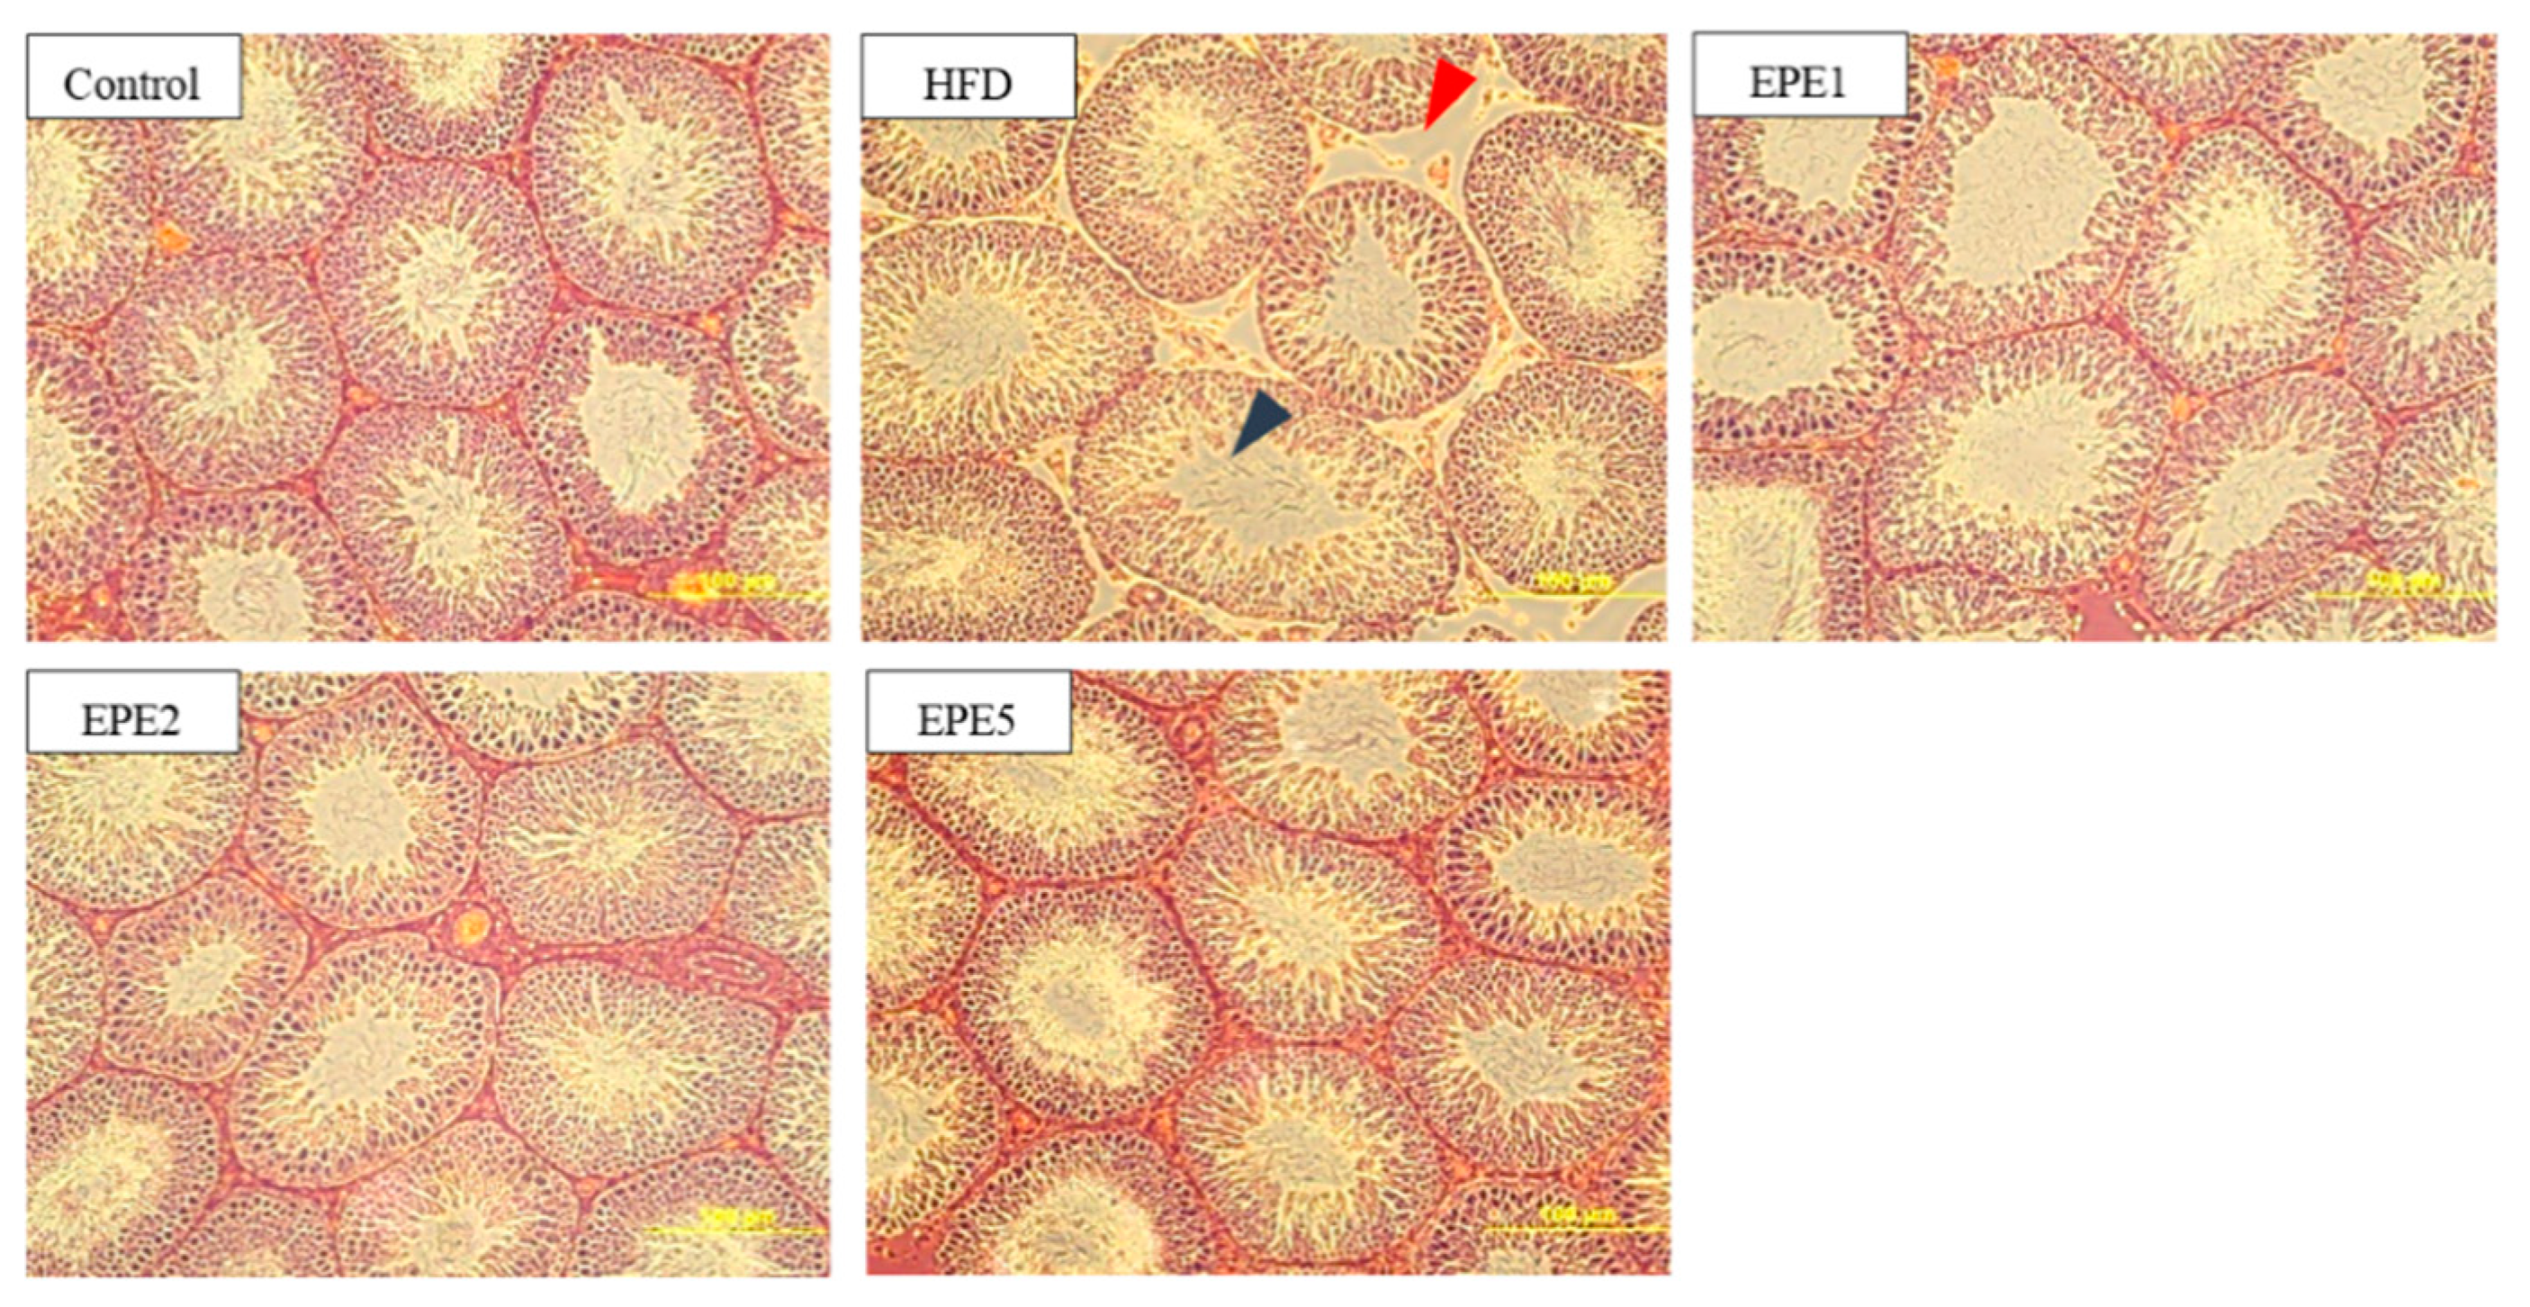
3.13. Histopathological Evaluation of Testes

The testes of the rats were sectioned and observed by H&E staining (Figure 10). The figure shows that the testicular tubules of the HFD group had vacuolization and the number of mature spermatozoa was relatively small (blue arrow). The structures of interstitial cells are loose and atrophic (red arrow), but after the administration of different doses of EPE, the testicular pattern significantly improved.

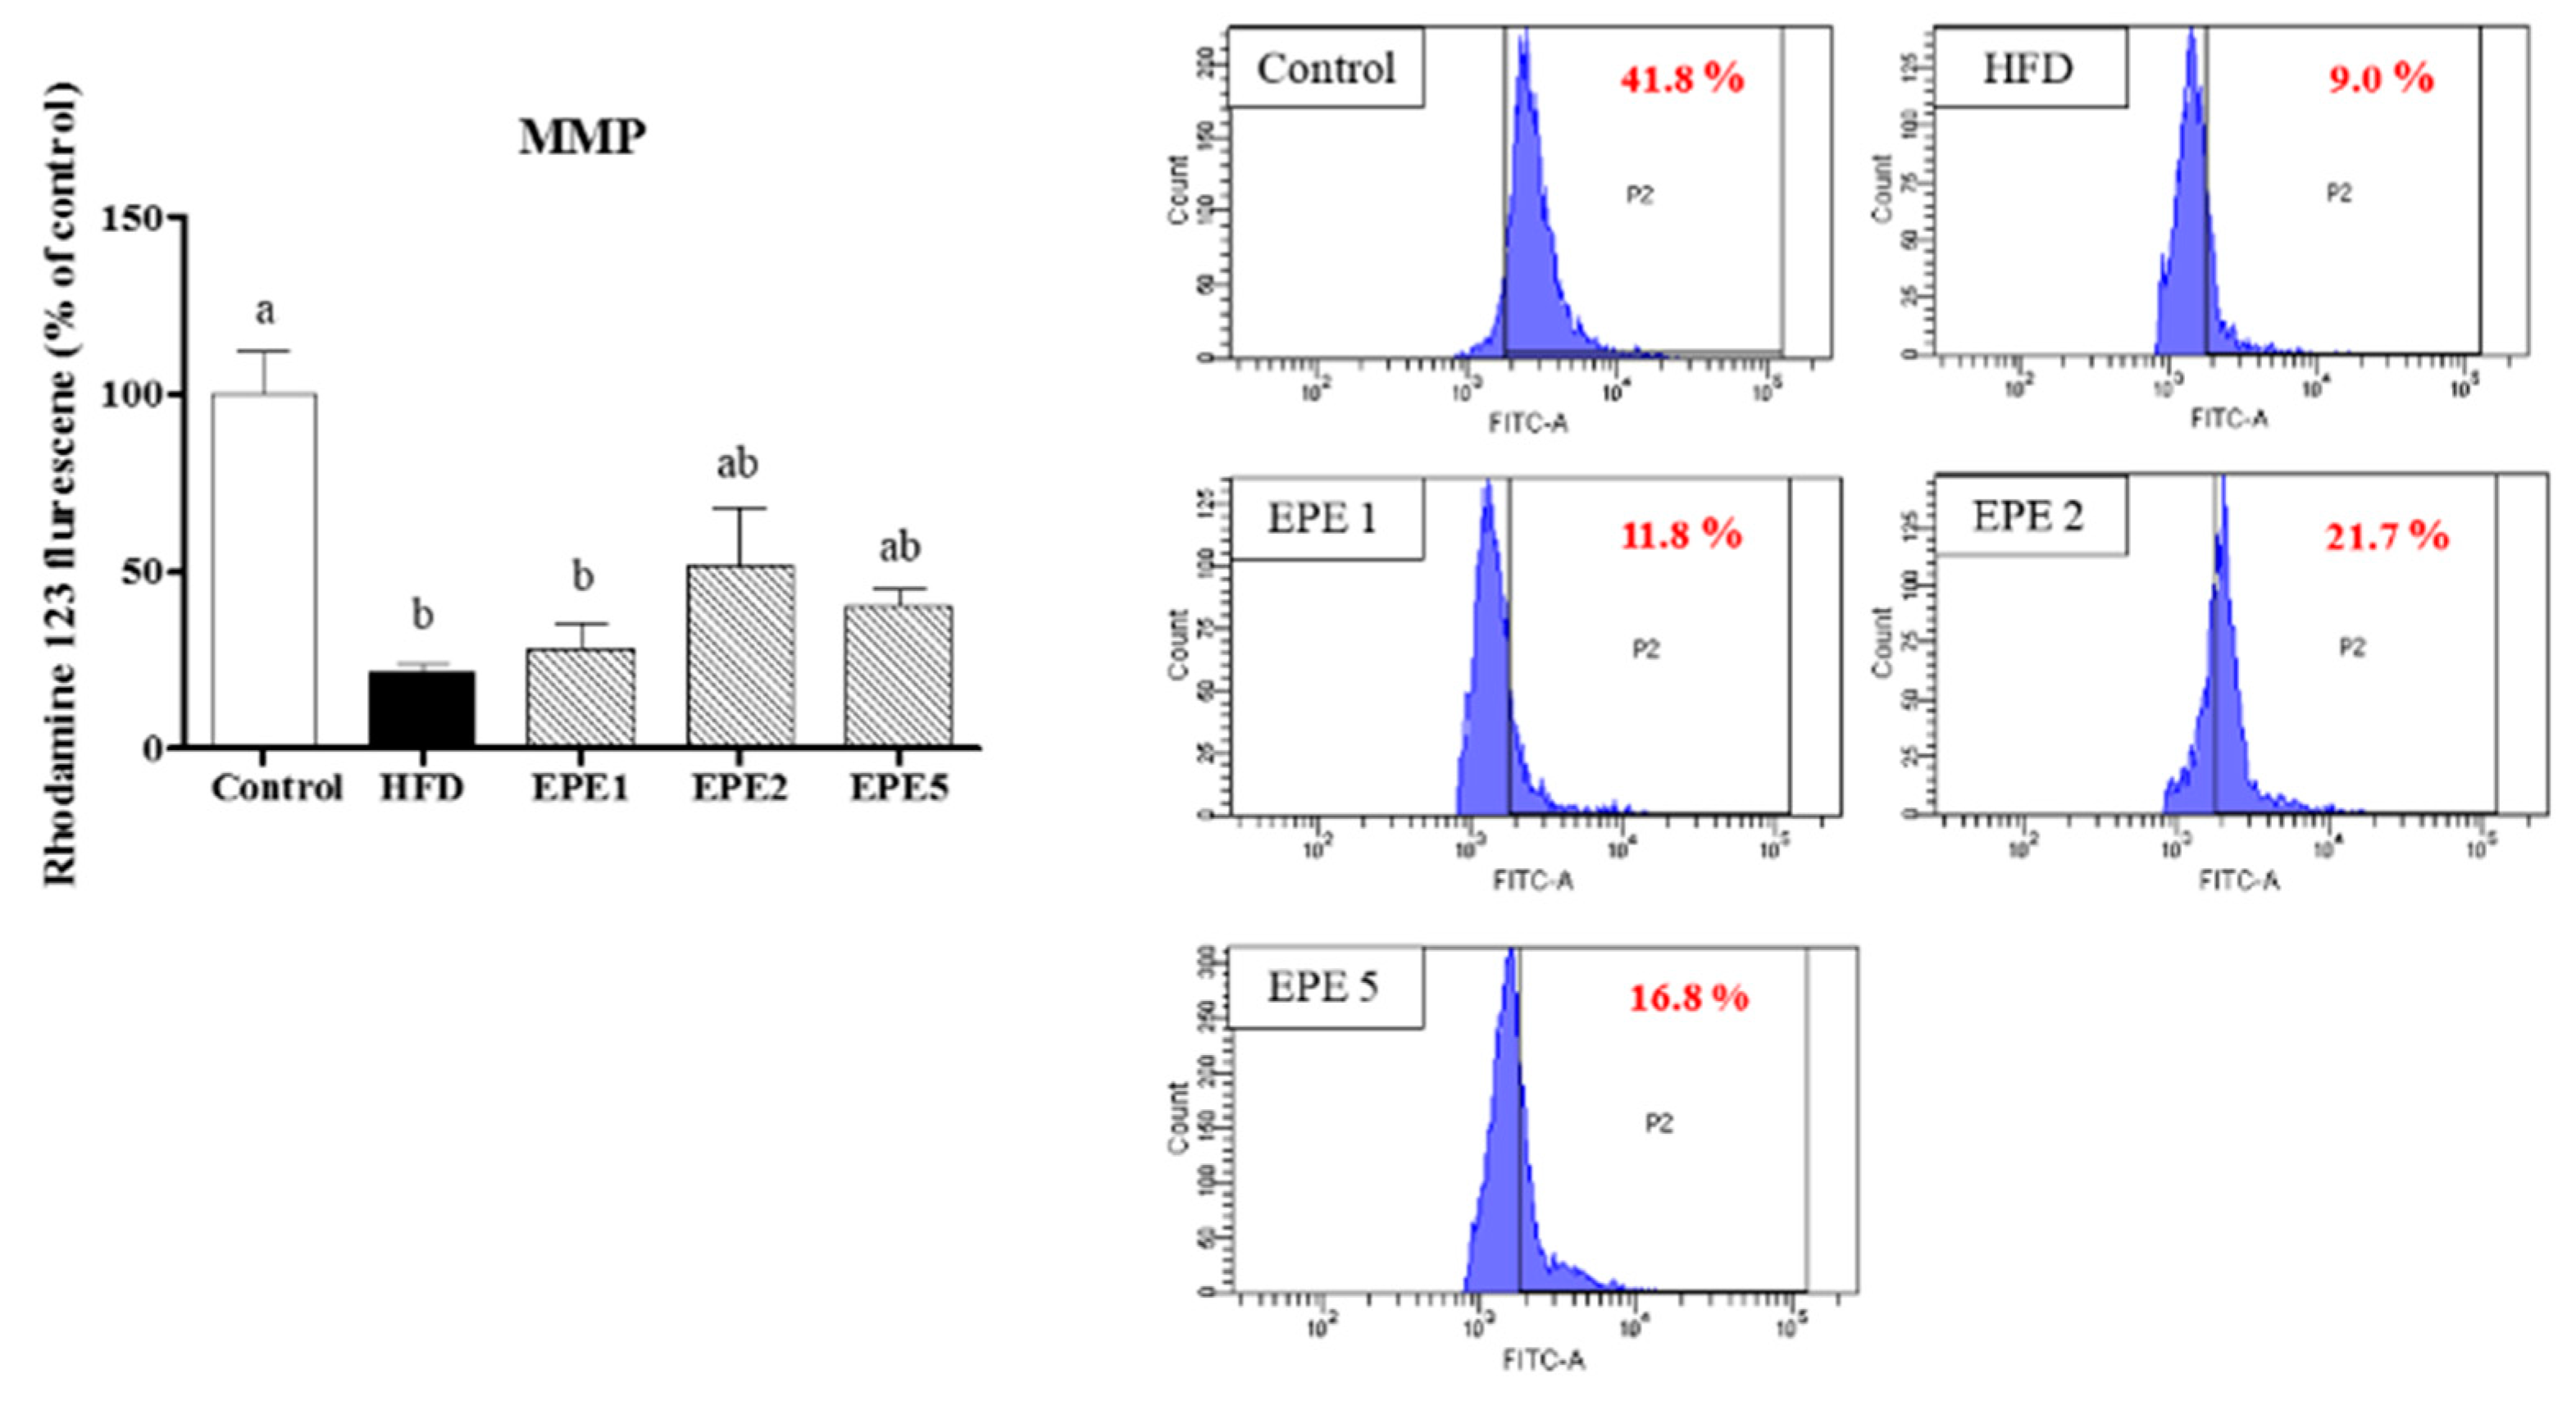
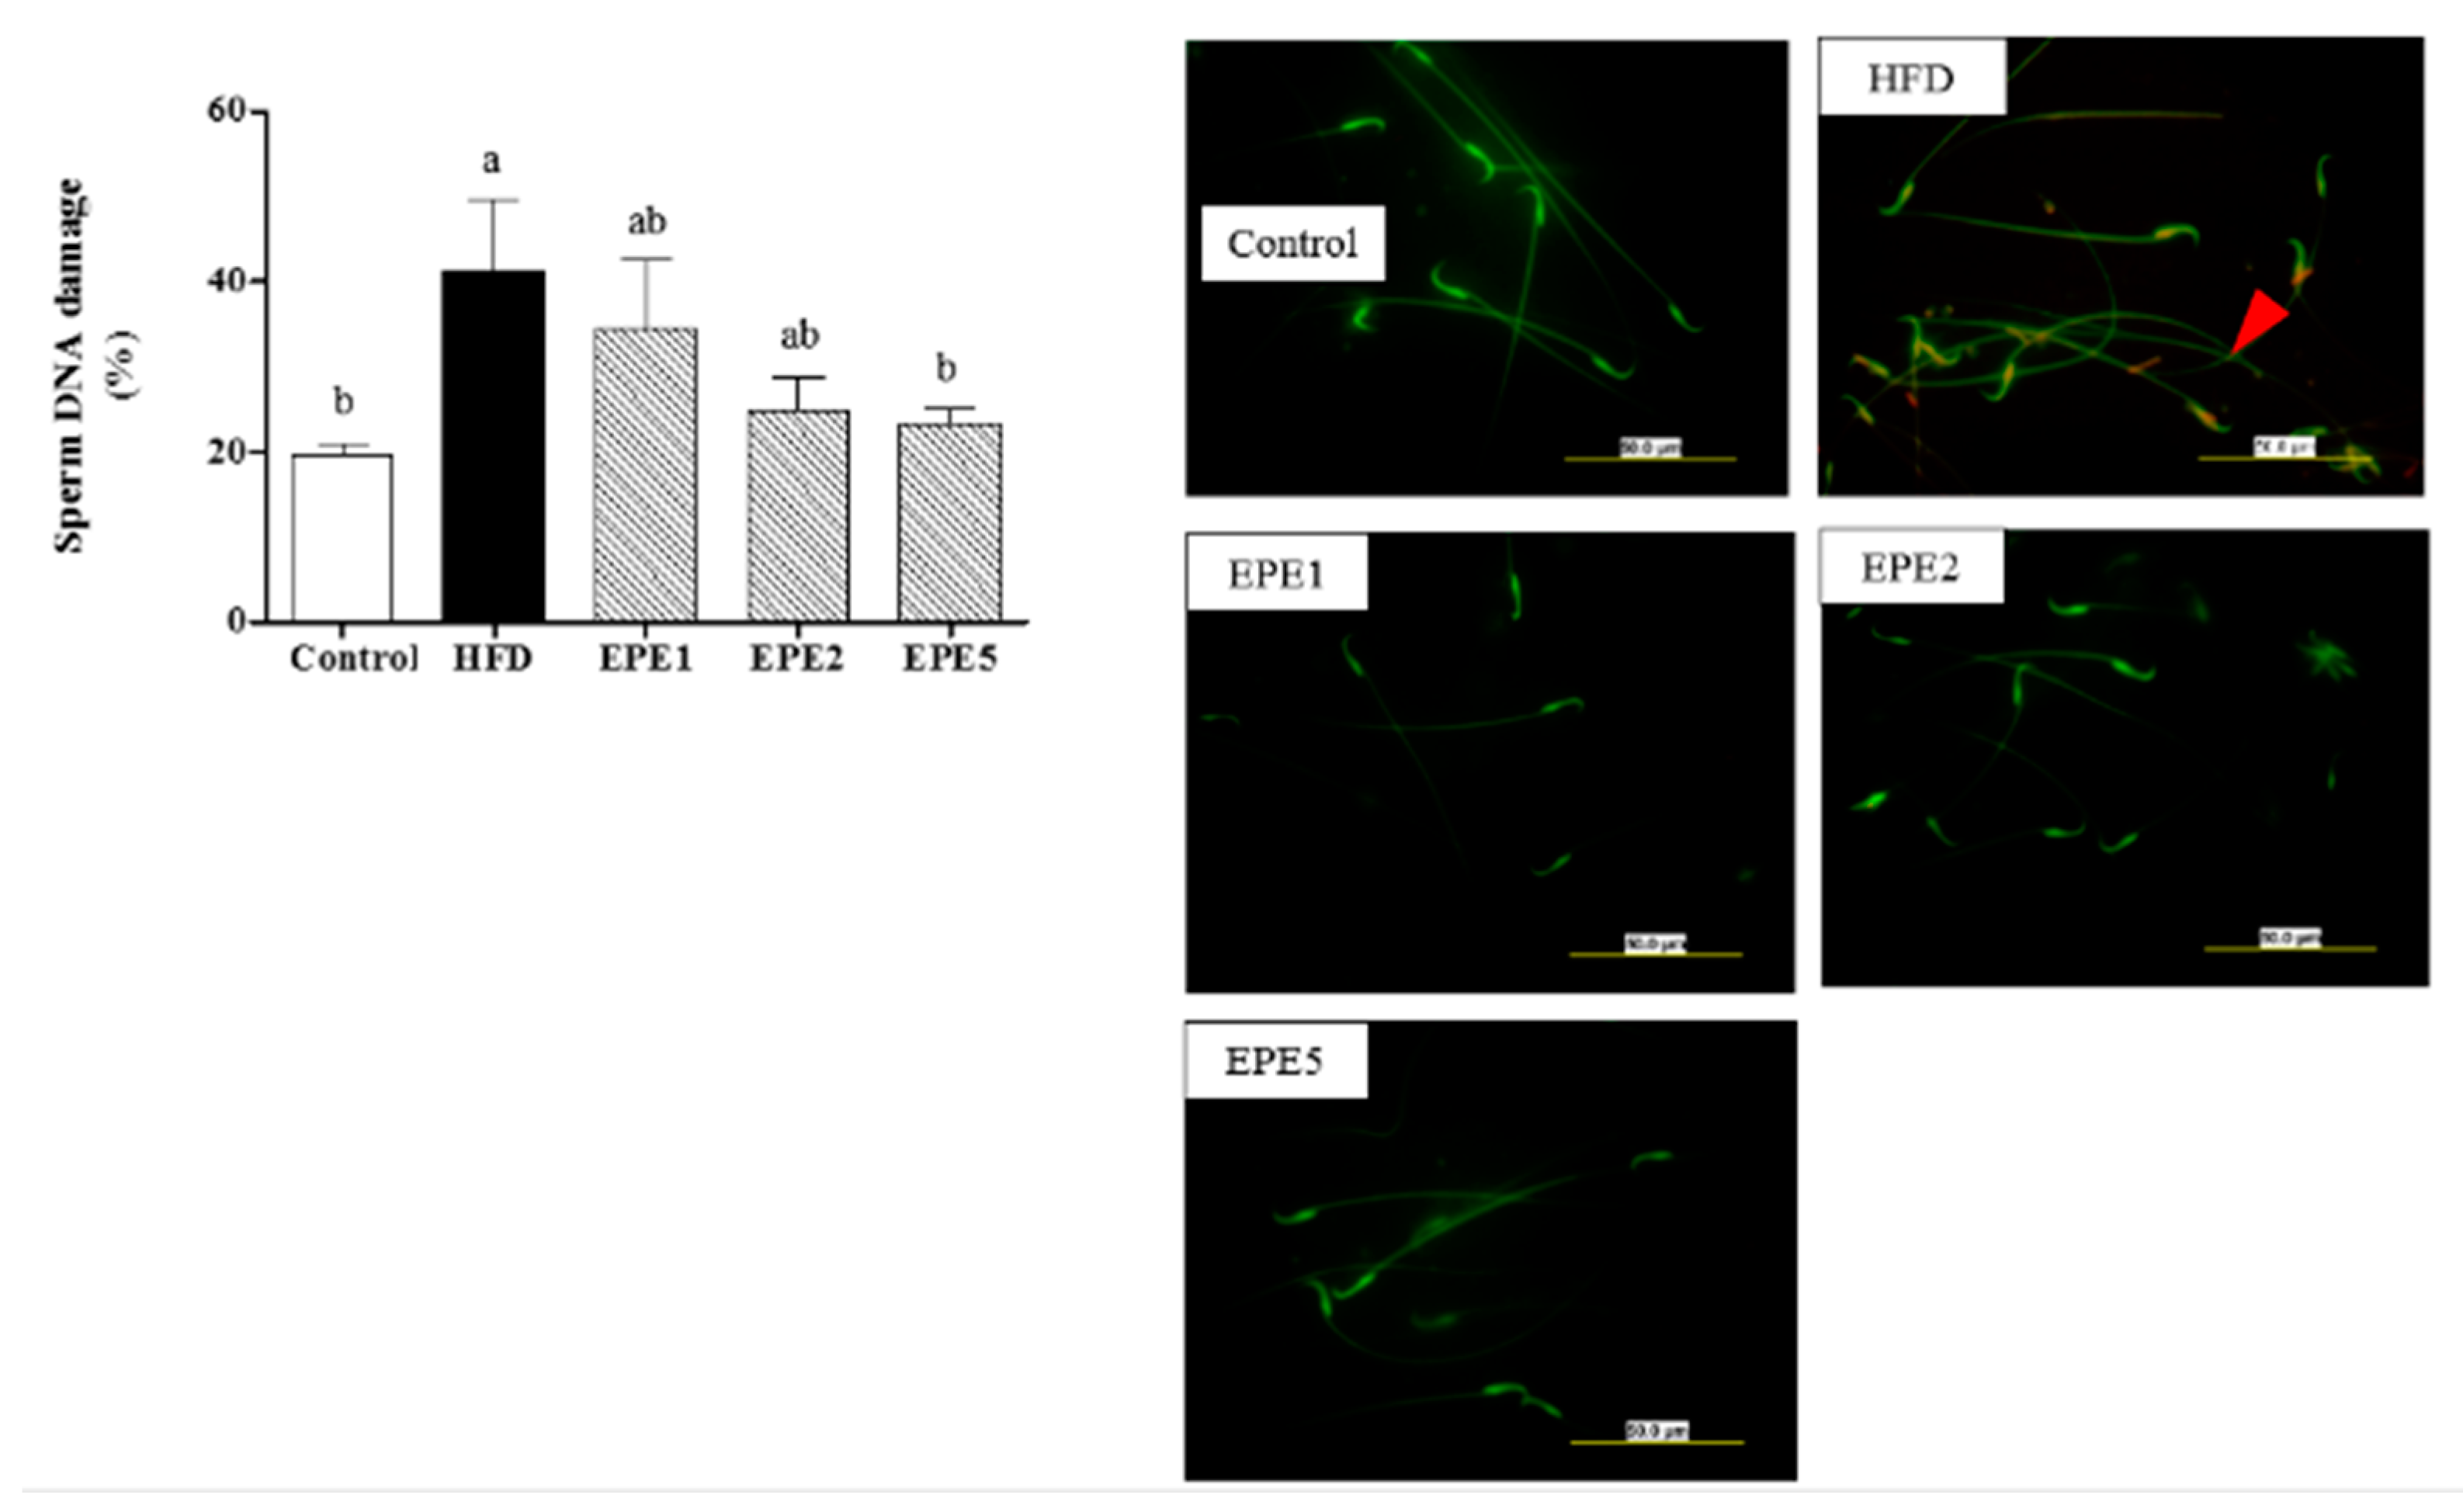
3.14. Sperm Mitochondrial Potential (MMP) and Sperm DNA Damage

Sperm mitochondrial potential and sperm DNA damage are given in Figure 11 and Figure 12, respectively. The MMP was significantly increased in the control group (41.8%) and lower potential was observed in the HFD group (9.0%) followed by the EPE1 group (11.8%). Both EPE2 (21.7%) and EPE5 (16.8%) were not significantly different but the MMP was higher in the EPE2 group. Figure 12 showed that sperm DNA damage was significantly higher in the HFD group. The EPE2 group has lower DNA damage than EPE1. The lowest damage was observed in the control group but it was not statistically different from the EPE5 group.

4. Discussion

Inflammation begins as a result of obesity and this may lead to insulin resistance and disruption of energy homeostasis. This obesity-induced inflammation involves different organs such as the pancreas, brain, adipose tissue, liver, heart, and skeletal muscles [28]. The level of cytokines is increased under the obesity condition due to the dramatic changes in macrophages. Additionally, chemokines are also produced due to the presence of free fatty acids [28]. Adipokine abnormalities are also evident under obese conditions. The literature states that a negative correlation exists between the abnormality of adipokines and reproductive damage. The failure of adipocytes to store fat may result in the production of ROS with mitochondrial dysfunction and endoplasmic reticulum stress [29]. In men, obesity is associated with low hormone levels and hypogonadism. It occurs from the conversion of testosterone into 17 β-estradiol by aromatase enzyme present in the adipose tissue [30]. Additionally, leptin produced from adipose tissue can alter the HPG axis and cause infertility [31]. The current study aimed to reduce the reproductive dysfunction under obese conditions by EPE extract. Echinacea purpurea is a medicinal plant highly used as a chemotherapeutic agent. The literature stated that the activation of the innate immune system is the key mechanism behind the immunomodulatory and anti-inflammatory effects of Echinacea purpurea. The antioxidant activity of this plant is due to the presence of phenolic compounds and cichoric acid [11]. A reduction in cytokine productions by essential oil in Echinacea Purpurea L was also reported [32]. In vitro antioxidant and anti-inflammatory activities of chitosan/silica nanoparticles encapsulated Echinacea purpurea ethanol extract (EE) have also been reported. This study reported that hyperglycemia, insulin resistance, and sperm quality were also improved in diabetes-induced Sprague–Dawley male rats [16].
Obesity can be increased by overconsumption and physical inactivity. Energy imbalance and several environmental, genetic, and behavioral factors are primarily responsible for obesity [33]. As a result, weight increased due to high energy intake and low energy expenditure. As shown in Figure 1, an increase in weight was observed in the group fed a high-fat diet and it was also noted that the EPE groups were able to reduce weight increase from a lower concentration (EPE1) to higher concentration (EPE5). The literature mentions that BMI has a strong relationship with diabetes. Because of the high production of proinflammatory cytokines and the activation of other biological components, insulin resistance was increased [34]. So, glycogen synthesis, glucose influx, and fat deposition in adipocytes are reduced, resulting in elevated blood glucose levels. Our study also supports the higher glucose level in the HFD group. The results showed that a higher concentration of EPE can significantly reduce blood glucose levels in the obese condition. Previous literature showed that the increase in cell size occurs due to energy imbalance. So, this sudden increase in the size leads to mechanical stress, adipocyte cell death, and hypoxia [35]. This results in fat accumulation and it is considered as the major sign of insulin resistance and dyslipidemia [36]. Our study showed a decrease in the adipocyte diameter at higher concentrations (Figure 2 and Table 1) of EPE extract.
Low hormone levels under obese conditions may depend upon certain factors such as secretion, metabolism, alterations in their transport, and/or action at target tissues [37]. Adipose tissue contains an enzyme called aromatase, which is responsible for the conversion of testosterone to estradiol. This may result in the inhibition of the HPG axis by hypothalamus estrogen receptors [27]. In Figure 3, it can be seen that EPE was efficient to increase the level of testosterone. In addition to this, the weights of testes and epididymis were also improved (Table 2).
The lower level of antioxidants in the body is the major sign of higher ROS content and oxidative stress. A previous study mentioned that mature adipocyte size, adipocyte differentiation, and preadipocyte proliferation can be accelerated by oxidative stress [38]. Superoxide anion radical, hydrogen peroxide (H2O2), singlet oxygen, hydroxyl radical, and nitric oxide radical, etc., are some of the free radicals that actively participate in the contribution of oxidative stress. These kinds of radicals actively attach biological molecules such as lipids, proteins, and nucleic acids and finally cause cell damage [39]. Antioxidants such as GPx, catalase, and SOD are capable of neutralizing free radicals. SOD catalyzes superoxide dismutase into H2O2 and oxygen, whereas catalase and GPx neutralize H2O2 [40]. From Figure 4, it can be seen that EPE can increase the production of antioxidants and thereby can decrease ROS generation. The reaction between ROS and lipids is called lipid peroxidation and MDA is known as the biomarker for lipid peroxidation. MDA is obtained from the peroxidation of polyunsaturated fatty acids (PUFAs) and arachidonic acid [41]. Our results have shown that the MDA level was decreased in both sperm and testicular tissue after treatment with EPE extract. The literature stated that under obese conditions, inducible NO synthase (iNOS) is stimulated and causes the overproduction of NO. This action depends upon the abdominal fat distribution and insulin resistance [42]. An NBT assay was used to quantify neutrophil function and cellular oxidative metabolism. The principle behind the NBT assay is the reduction in NBT into formazan crystals by the superoxide anion present in the biological sample [43]. From Figure 6, it can be seen that EPE was able to reduce NO and superoxide production.
TNF-α is a proinflammatory cytokine and is capable of affecting lipid metabolism and insulin signals [44]. It suppresses the storage and uptake of nonesterified fatty acids and glucose in addition to adipogenesis and lipogenesis. It also increases the expression of IL-6, monocyte chemoattractant protein (MCP)-1, plasminogen activator inhibitor-1 levels, and nerve growth factor [45]. The literature mentions that the levels of IL-6 can be observed in higher obese conditions. Our results also support this statement [46]. Both TNF-α and IL-6 are produced by the macrophages present in the adipose tissue and regulate the proliferation and proliferation and apoptosis of adipocytes promotes lipolysis, inhibits lipid synthesis, and decreases blood lipids [47].
The levels of AST and ALT, which are known markers of liver diseases, can be used to identify said diseases. Under obese conditions, triglycerides are accumulated in hepatocytes due to the imbalance between uptake, synthesis, export, and oxidation of free fatty acids [48]. AST is an enzyme responsible for catalyzing the transamination reaction [49]. The literature states that ALT to AST is important in the prediction of metabolic disease, insulin resistance, and fatty liver [50]. Urea is known as the biomarker of protein metabolism. Ammonia is produced as a result of the deamination of amino acids and this ammonia is converted into urea in the presence of liver enzymes. Creatinine is also a nonprotein nitrogenous (NPN) waste obtained from the breakdown of creatine and phosphocreatine [51]. As shown in Table 4, EPE extract reduced urea and creatinine levels and maintained AST and ALT levels.
AMP-activated protein kinase (AMPK) restores the energy balance and promotes ATP generation [52]. It has an alpha catalytic unit and two isoforms, α1 and α2 [53]. It was found that AMPK stimulates glucose uptake and thereby lowered the blood glucose level [52]. Phosphorylated AMPK can regulate lipogenesis [52]. The homeostasis of the adipose tissue is maintained by peroxisome proliferator-activated receptors (PPARs). They are a group of ligand-activated nuclear hormone receptors and have three forms of isomers called PPARα, PPARβ/δ, and PPARγ. PPARα increases ATP production from β-oxidative phosphorylation under energy-deprived conditions. The expression of PPARγ is usually found in adipose tissue and stimulates fat storage, adipogenesis, and thermogenesis [54]. Our results showed that the expressions of AMPKα1/2 and PPAR-α were increased and PPAR-γ expression was decreased after treated with EPE extract.
Kiss1R is the receptor of a neuropeptide called kisspeptin. It is associated with initiating puberty and maintaining the reproductive capacity of the adult [55]. The literature stated that the energy imbalance negatively affects the kisspeptin signaling pathway [55]. Hypothalamic hypogonadism is largely seen under diabetic or obese conditions. They are expressed in peripheral tissues controlling metabolism and the functioning of these tissues are altered under energy imbalanced conditions [56]. The decrease in Kiss1R mRNA expression under obese conditions was mentioned in a previous study [56]. StAR is a labile phosphoprotein known for the regulation of steroid hormones. The activity of StAR is highly enhanced in the adrenal and gonads under the acute steroidogenesis process. So, the inhibition of StAR affects steroid biosynthesis [57]. Testosterone synthesis is catalyzed by an enzyme called 17β-HSD3. This catalyzes the reduction of androstenedione to testosterone [58]. Our results indicated that EPE extracts, especially EPE5, were able to ameliorate the mRNA expression of Kiss1R, StAR, and 17β-HSD3.
Seminiferous tubules and interstitia are the functional compartments of the testes, in which spermatogenesis and androgen biosynthesis occur, respectively. Sertoli cells are found in the seminiferous tubules are responsible for nurturing the developing sperm cells. They control the passage of bloodborne nutrients, hormones, and exogenous substances into the tubules. The androgen-secreting Leydig cells find the interstitial space between the seminiferous tubules [59]. Figure 10 reveals that the normal morphology of testes was negatively changed in the HFD group and the administration of EPE significantly improved the morphology (Figure 10). Additionally, the sperm parameters were also improved (Figure 9 and Table 5). MMP is the energy status of mitochondria and it helps to identify the viability of sperm cells. The membrane potential of the sperm is directly proportional to its motility [60]. Sperm DNA was also altered under obese conditions due to oxidative stress [61]. Our results showed that EPE significantly improved sperm DNA damage and sperm MMP (Figure 11 and Figure 12).
In conclusion, our in vivo study revealed that the EPE extract can reduce the level of cytokines and further oxidative stress. In addition to this, the sperm parameters, testis structure, sperm DNA damage, and sperm mitochondrial membrane potential were also improved. Additionally, they increased lipid metabolism and testosterone synthesis. Therefore, our study suggested that the EPE extract can act as a protective therapeutic agent against obesity-associated reproductive dysfunction.

5. Conclusions

Obesity is the excessive accumulation of fat in the body and harms normal health. The current study examined the protective effect of EPE extract to prevent high-fat diet-induced reproductive damage. Our study showed that EPE extract can reduce cytokine levels and increase the level of antioxidant enzymes. Apart from this, it recovered the sperm parameters and testicular tissue morphology. Moreover, lipid metabolism and testosterone synthesis were increased after the administration of EPE extract. Thus, our study confirmed that EPE extract ameliorated the inflammation and reproductive dysfunction under the obesity condition.

Author Contributions

Conceptualization, Z.-L.K.; formal analysis, P.-J.C., T.-L.T. and C.-F.M.; writing—original draft preparation, A.J., P.-J.C., T.-L.T. and C.-F.M.; writing—review and editing, Z.-L.K. and A.J.; supervision, Z.-L.K. All authors have read and agreed to the published version of the manuscript.

Funding

This work was financially supported by the Center of Excellence of the Oceans, National Taiwan Ocean University from The Featured Areas Research Center Program within the framework of the Higher Education 525 Sprout Project by the Ministry of Education (MOE) in Taiwan and MOST 108-2320-B-019-005.

Institutional Review Board Statement

The study was conducted by following the standard of the Institutional Animal Care and Use Committee (IACUC Approval No. 103032) of National Taiwan Ocean University, Taiwan.

Informed Consent Statement

Not applicable.

Data Availability Statement

The data presented in this study are available on request from the corresponding author.

Acknowledgments

This work was financially supported by the Center of Excellence for the Oceans, National Taiwan Ocean University from The Featured Areas Research Center Program within the framework of the Higher Education 525 Sprout Project by the Ministry of Education (MOE) in Taiwan and MOST 108-2320-B-019-005.

Conflicts of Interest

The authors declare no conflict of interest.

References

  1. Hruby, A.; Hu, F.B. The epidemiology of obesity: A big picture. Pharmacoeconomics 2015, 33, 673–689. [Google Scholar] [CrossRef]
  2. Djalalinia, S.; Qorbani, M.; Peykari, N.; Kelishadi, R. Health impacts of obesity. Pak. J. Med. Sci. 2015, 31, 239–242. [Google Scholar]
  3. Jambocus, N.G.S.; Ismail, A.; Khatib, A.; Mahomoodally, F.; Saari, N.; Mumtaz, M.W.; Hamid, A.A. Morinda citrifolia L. leaf extract prevent weight gain in Sprague-Dawley rats fed a high fat diet. Food Nutr. Res. 2017, 61. [Google Scholar] [CrossRef]
  4. Kim, B.M.; Cho, B.O.; Jang, S.I. Anti-obesity effects of Diospyros lotus leaf extract in mice with high-fat diet-induced obesity. Int. J. Mol. Med. 2019, 43, 603–613. [Google Scholar] [CrossRef] [PubMed] [Green Version]
  5. Vasconcelos, L.H.C.; Souza, I.L.L.; Pinheiro, L.S.; Silva, B.A. Ion channels in obesity: Pathophysiology and potential therapeutic targets. Front Pharmacol. 2016, 7, 58. [Google Scholar] [CrossRef] [PubMed] [Green Version]
  6. Lutz, T.A.; Woods, S.C. Overview of animal models of obesity. Curr. Protoc. Pharmacol. 2012, 58, 5.61.1–5.61.18. [Google Scholar] [CrossRef] [Green Version]
  7. Fernandez, C.D.B.; Bellentani, F.F.; Fernandes, G.S.A.; Perobelli, J.E.; Favareto, A.P.A.; Nascimento, A.F.; Cicogna, A.C.; Kempinas, W.D.G. Diet-induced obesity in rats leads to a decrease in sperm motility. Reprod. Biol. Endocrinol. 2011, 9, 32. [Google Scholar] [CrossRef] [Green Version]
  8. Mihalca, R.; Fica, S. The impact of obesity on the male reproductive axis. J. Med. Life 2014, 7, 296–300. [Google Scholar]
  9. Suleiman, J.; Bahiyah, A.; Abu Bakar, A.; Mohamed, M. Review on effects of obesity on male reproductive system and the role of natural products. J. Appl. Pharm. Sci. 2019, 9, 131–141. [Google Scholar]
  10. Rahman, H.A.; Sahib, N.G.; Saari, N.; Abas, F.; Ismail, A.; Mumtaz, M.W.; Hamid, A.A. Anti-obesity effect of ethanolic extract from Cosmos caudatus Kunth leaf in lean rats fed a high fat diet. BMC Complement. Altern. Med. 2017, 17, 122. [Google Scholar] [CrossRef] [PubMed] [Green Version]
  11. Manayi, A.; Vazirian, M.; Saeidnia, S. Echinacea purpurea: Pharmacology, phytochemistry and analysis methods. Pharmacogn. Rev. 2015, 9, 63–72. [Google Scholar] [PubMed] [Green Version]
  12. Hudson, J.B. Applications of the phytomedicine Echinacea purpurea (Purple Coneflower) in infectious diseases. J. Biomed. Biotechnol. 2012, 2012. [Google Scholar] [CrossRef] [Green Version]
  13. Sears, B.; Ricordi, C. Anti-inflammatory nutrition as a pharmacological approach to treat obesity. J. Obes. 2011, 2011. [Google Scholar] [CrossRef] [PubMed]
  14. Johnson, A.; Cheng, S.C.; Tsou, D.; Kong, Z.L. Attenuation of reproductive dysfunction in diabetic male rats with timber cultured Antrodia cinnamomea ethanol extract. Biomed. Pharmacother. 2019, 112. [Google Scholar] [CrossRef]
  15. Kong, Z.-L.; Johnson, A.; Ko, F.-C.; He, J.-L.; Cheng, S.-C. Effect of Cistanche Tubulosa extracts on male reproductive function in streptozotocin-nicotinamide-induced diabetic rats. Nutrients 2018, 10, 1562. [Google Scholar] [CrossRef] [Green Version]
  16. Mao, C.-F.; Zhang, X.-R.; Johnson, A.; He, J.-L.; Kong, Z.-L. Modulation of diabetes mellitus-induced male rat reproductive dysfunction with micro-nanoencapsulated Echinacea purpurea Ethanol Extract. Biomed. Res. Int. 2018, 2018. [Google Scholar] [CrossRef] [PubMed] [Green Version]
  17. Javvaji, P.K.; Dhali, A.; Francis, J.R.; Kolte, A.P.; Mech, A.; Roy, S.C.; Mishra, A.; Bhatta, R. An efficient nitroblue tetrazolium staining and bright-field microscopy based method for detecting and quantifying intracellular reactive oxygen species in oocytes, cumulus cells and embryos. Front. Cell Dev. Biol. 2020, 8, 1–12. [Google Scholar] [CrossRef] [PubMed]
  18. Idriss, H.T.; Naismith, J.H. TNFα and the TNF receptor superfamily: Structure-function relationship(s). Microsc. Res. Tech. 2000, 50, 184–195. [Google Scholar] [CrossRef]
  19. Tanaka, T.; Narazaki, M.; Kishimoto, T. IL-6 in inflammation, immunity, and disease. Cold Spring Harb. Perspec.T Biol. 2014, 6, a016295. [Google Scholar] [CrossRef]
  20. Pandya, D.; Nagrajappa, A.K.; Ravi, K.S. Assessment and correlation of urea and creatinine levels in saliva and serum of patients with chronic kidney disease, diabetes and hypertension—A research study. J. Clin. Diagn. Res. 2016, 10, ZC58–ZC62. [Google Scholar] [CrossRef]
  21. Assefa, B.T.; Tafere, G.G.; Wondafrash, D.Z.; Gidey, M.T. The bewildering effect of AMPK activators in alzheimer’s disease: Review of the current evidence. Biomed Res. Int. 2020, 2020. [Google Scholar] [CrossRef] [PubMed]
  22. Cao, Y.; Li, Z.; Jiang, W.; Ling, Y.; Kuang, H. Reproductive functions of Kisspeptin/KISS1R Systems in the Periphery. Reprod. Biol. Endocrinol. 2019, 17, 65. [Google Scholar] [CrossRef] [PubMed]
  23. Liu, H.; Zheng, S.; Bellemare, V.; Pelletier, G.; Labrie, F.; Luu-The, V. Expression and localization of estrogenic type 12 17β-hydroxysteroid dehydrogenase in the cynomolgus monkey. BMC Biochem. 2007, 8, 2. [Google Scholar] [CrossRef] [PubMed] [Green Version]
  24. Tyagi, S.; Gupta, P.; Saini, A.S.; Kaushal, C.; Sharma, S. The peroxisome proliferator-activated receptor: A family of nuclear receptors role in various diseases. J. Adv. Pharm. Technol. Res. 2011, 2, 236–240. [Google Scholar] [CrossRef] [PubMed]
  25. Qiu, Y.; Sui, X.; Cao, S.; Li, X.; Ning, Y.; Wang, S.; Yin, L.; Zhi, X. Steroidogenic acute regulatory protein (StAR) overexpression reduces inflammation and insulin resistance in obese mice. J. Cell. Biochem. 2017, 118, 3932–3942. [Google Scholar]
  26. Tandon, P.; Wafer, R.; Minchin, J.E.N. Adipose morphology and metabolic disease. J. Exp. Biol. 2018, 221. [Google Scholar] [CrossRef] [PubMed] [Green Version]
  27. Wang, C.; Jackson, G.; Jones, T.H.; Matsumoto, A.M.; Nehra, A.; Perelman, M.A.; Swerdloff, R.S.; Traish, A.; Zitzmann, M.; Cunningham, G. Low testosterone associated with obesity and the metabolic syndrome contributes to sexual dysfunction and cardiovascular disease risk in men with type 2 diabetes. Diabetes Care 2011, 34, 1669–1675. [Google Scholar] [CrossRef] [PubMed] [Green Version]
  28. Saltiel, A.R.; Olefsky, J.M. Inflammatory mechanisms linking obesity and metabolic disease. J. Clin. Investig. 2017, 127, 1–4. [Google Scholar] [CrossRef] [PubMed]
  29. Jungheim, E.S.; Travieso, J.L.; Carson, K.R.; Moley, K.H. Obesity and reproductive function. Obstet. Gynecol. Clin. N. Am. 2012, 39, 479–493. [Google Scholar] [CrossRef] [Green Version]
  30. Di Vincenzo, A.; Busetto, L.; Vettor, R.; Rossato, M. Obesity, male reproductive function and bariatric surgery. Front. Endocrinol. 2018, 9, 769. [Google Scholar] [CrossRef] [PubMed] [Green Version]
  31. Martins, A.D.; Majzoub, A.; Agawal, A. Metabolic syndrome and male fertility. World J. Mens Health 2019, 37, 113–127. [Google Scholar] [CrossRef]
  32. Yu, D.; Yuan, Y.; Jiang, L.; Tai, Y.; Yang, X.; Hu, F.; Xie, Z. Anti-inflammatory effects of essential oil in Echinacea purpurea L. Pak. J. Pharm. Sci. 2013, 26, 403–408. [Google Scholar]
  33. Montan, P.D.; Sourlas, A.; Olivero, J.; Silverio, D.; Guzman, E.; Kosmas, C.E. Pharmacologic therapy of obesity: Mechanisms of action and cardiometabolic effects. Ann. Transl. Med. 2019, 7, 393. [Google Scholar] [CrossRef]
  34. Al-Goblan, A.S.; Al-Alfi, M.A.; Khan, M.Z. Mechanism linking diabetes mellitus and obesity. Diabetes Metab. Syndr. Obes. 2014, 7, 587–591. [Google Scholar] [CrossRef] [PubMed] [Green Version]
  35. Longo, M.; Zatterale, F.; Naderi, J.; Parrillo, L.; Formisano, P.; Raciti, G.A.; Beguinot, F.; Miele, C. Adipose tissue dysfunction as determinant of obesity-associated metabolic complications. Int. J. Mol. Sci. 2019, 20, 2358. [Google Scholar] [CrossRef] [Green Version]
  36. Lessard, J.; Tchernof, A. Depot- and obesity-related differences in adipogenesis. J. Clin. Lipidol. 2012, 7, 587–596. [Google Scholar] [CrossRef]
  37. Pelusi, C.; Pasquali, R. The significance of low testosterone levels in obese men. Curr. Obes. Rep. 2012, 1, 181–190. [Google Scholar] [CrossRef] [Green Version]
  38. Manna, P.; Jain, S.K. Obesity, oxidative stress, adipose tissue dysfunction, and the associated health risks: Causes and therapeutic strategies. Metab. Syndr. Relat. Disord. 2015, 13, 423–444. [Google Scholar] [CrossRef] [PubMed] [Green Version]
  39. Lobo, V.; Patil, A.; Phatak, A.; Chandra, N. Free radicals, antioxidants and functional foods: Impact on human health. Pharmacogn. Rev. 2010, 4, 118–126. [Google Scholar] [CrossRef] [PubMed] [Green Version]
  40. Susantiningsih, T.; Perdani, R.R.W.; Berawi, K.; Hadi, S. The Effect of treadmill treatment on oxidative stress markers and endogenous antioxidant status in obesity mice. Open Access Maced. J. Med. Sci. 2018, 6, 1803–1808. [Google Scholar] [CrossRef] [PubMed] [Green Version]
  41. Tsikas, D. Assessment of lipid peroxidation by measuring malondialdehyde (MDA) and relatives in biological samples: Analytical and biological challenges. Anal. Biochem. 2017, 524, 13–30. [Google Scholar] [CrossRef]
  42. Huang, C.-J.; McAllister, M.J.; Slusher, A.L.; Webb, H.E.; Mock, J.T.; Acevedo, E.O. Obesity-related oxidative stress: The impact of physical activity and diet manipulation. Sports Med. Open 2015, 1, 32. [Google Scholar] [CrossRef] [Green Version]
  43. Tunc, O.; Thompson, J.; Tremellen, K. Development of the NBT assay as a marker of sperm oxidative stress. Int. J. Androl. 2010, 33, 13–21. [Google Scholar] [CrossRef]
  44. Shi, C.; Zhu, L.; Chen, X.; Gu, N.; Chen, L.; Zhu, L.; Yang, L.; Pang, L.; Guo, X.; Ji, C.; et al. IL-6 and TNF-α induced obesity-related inflammatory response through transcriptional regulation of miR-146b. J. Interferon Cytokine Res. 2014, 34, 342–348. [Google Scholar] [CrossRef]
  45. Tzanavari, T.; Giannogonas, P.; Karalis, K.P. TNF-alpha and obesity. Curr. Dir. Autoimmun. 2010, 11, 145–156. [Google Scholar]
  46. Charles, B.A.; Doumatey, A.; Huang, H.; Zhou, J.; Chen, G.; Shriner, D.; Adeyemo, A.; Rotimi, C.N. The roles of IL-6, IL-10, and IL-1RA in obesity and insulin resistance in African-Americans. J. Clin. Endocrinol. Metab. 2011, 96, E2018–E2022. [Google Scholar] [CrossRef] [PubMed]
  47. Wang, T.; He, C. Pro-inflammatory cytokines: The link between obesity and osteoarthritis. Cytokine Growth Factor Rev. 2018, 44, 38–50. [Google Scholar] [CrossRef] [PubMed]
  48. Engelmann, G.; Hoffmann, G.F.; Grulich-Henn, J.; Teufel, U. Alanine aminotransferase elevation in obese infants and children: A marker of early onset non alcoholic Fatty liver disease. Hepat. Mon. 2014, 14, e14112. [Google Scholar] [CrossRef] [Green Version]
  49. Gowda, S.; Desai, P.B.; Hull, V.V.; Math, A.A.K.; Vernekar, S.N.; Kulkarni, S.S. A review on laboratory liver function tests. Pan. Afr. Med. J. 2009, 3, 17. [Google Scholar] [PubMed]
  50. Mirmiran, P.; Gaeini, Z.; Bahadoran, Z.; Azizi, F. Elevated serum levels of aminotransferases in relation to unhealthy foods intake: Tehran lipid and glucose study. BMC Endocr. Disord. 2019, 19, 100. [Google Scholar] [CrossRef] [Green Version]
  51. Salazar, J.H. Overview of urea and creatinine. J. Lab. Med. 2014, 45, e19–e20. [Google Scholar] [CrossRef] [Green Version]
  52. Garcia, D.; Hellberg, K.; Chaix, A.; Wallace, M.; Herzig, S.; Badur, M.G.; Lin, T.; Shokhirev, M.N.; Pinto, A.F.M.; Ross, D.S.; et al. Genetic liver-specific AMPK activation protects against diet-induced obesity and NAFLD. Cell Rep. 2019, 26, 192–208.e196. [Google Scholar] [CrossRef] [Green Version]
  53. Fu, X.; Zhu, M.; Zhang, S.; Foretz, M.; Viollet, B.; Du, M. Obesity impairs skeletal muscle regeneration through inhibition of AMPK. Diabetes 2016, 65, 188–200. [Google Scholar] [PubMed] [Green Version]
  54. Corrales, P.; Vidal-Puig, A.; Medina-Gómez, G. PPARs and metabolic disorders associated with challenged adipose tissue plasticity. Int. J. Mol. Sci. 2018, 19, 2124. [Google Scholar] [CrossRef] [Green Version]
  55. Wahab, F.; Atika, B.; Ullah, F.; Shahab, M.; Behr, R. Metabolic impact on the hypothalamic kisspeptin-Kiss1r signaling pathway. Front. Endocrinol. 2018, 9, 123. [Google Scholar] [CrossRef]
  56. Dudek, M.; Ziarniak, K.; Sliwowska, J.H. Kisspeptin and metabolism: The brain and beyond. Front. Endocrinol. 2018, 9, 145. [Google Scholar] [CrossRef] [PubMed]
  57. Manna, P.R.; Dyson, M.T.; Stocco, D.M. Regulation of the steroidogenic acute regulatory protein gene expression: Present and future perspectives. Mol. Hum. Reprod. 2009, 15, 321–333. [Google Scholar] [CrossRef] [PubMed] [Green Version]
  58. Mindnich, R.; Haller, F.; Halbach, F.; Moeller, G.; Angelis, M.H.d.; Adamski, J. Androgen metabolism via 17β-hydroxysteroid dehydrogenase type 3 in mammalian and non-mammalian vertebrates: Comparison of the human and the zebrafish enzyme. J. Mol. Endocrinol. 2005, 35, 305–316. [Google Scholar] [CrossRef] [PubMed] [Green Version]
  59. Petersen, P.M.; Seierøe, K.; Pakkenberg, B. The total number of Leydig and Sertoli cells in the testes of men across various age groups—A stereological study. J. Anat. 2015, 226, 175–179. [Google Scholar] [CrossRef] [Green Version]
  60. Agnihotri, S.K.; Agrawal, A.K.; Hakim, B.A.; Vishwakarma, A.L.; Narender, T.; Sachan, R.; Sachdev, M. Mitochondrial membrane potential (MMP) regulates sperm motility. Vitr. Cell Dev. Biol. Anim. 2016, 52, 953–960. [Google Scholar] [CrossRef] [PubMed]
  61. Dupont, C.; Faure, C.; Sermondade, N.; Boubaya, M.; Eustache, F.; Clément, P.; Briot, P.; Berthaut, I.; Levy, V.; Cedrin-Durnerin, I.; et al. Obesity leads to higher risk of sperm DNA damage in infertile patients. Asian J. Androl. 2013, 15, 622–625. [Google Scholar] [CrossRef] [Green Version]
Figure 1. Effects of Echinacea purpurea ethanol extract on (a) body weight change and (b) blood glucose level in high-fat diet (HFD)-induced obese rats. Data are shown as the mean ± standard error of the mean (S.E.M.) (n = 5). The values with different superscript letters (a,b) are significantly different (p < 0.05), as determined via one-way analysis of variance (ANOVA), and were analyzed by Duncan’s multiple range test. * p < 0.05 control versus HFD, EPE1, EPE2, and EPE5 and # p < 0.05 HFD versus EPE5.
Applsci 11 02392 g001
Figure 2. Effects of Echinacea purpurea extract on adipocyte morphology in HFD-induced obese rats after 5 weeks.
Applsci 11 02392 g002
Figure 3. Effects of Echinacea purpurea ethanol extract in the plasma testosterone level in HFD-induced obese rats after 5 weeks. Data are shown as the mean ± S.E.M. (n = 5). The values with different superscript letters (a) are significantly different (p < 0.05), as determined via one-way ANOVA, and were analyzed by Duncan’s multiple range test.
Applsci 11 02392 g003
Figure 4. Effects of Echinacea purpurea ethanol extract on (a) glutathione peroxidase activity, (b) catalase, and (c) superoxide dismutase activity in testicular tissue of HFD-induced obese rats after 5 weeks. Data are shown as the mean ± S.E.M. (n = 5). The values with different superscript letters (a,b) are significantly different (p < 0.05), as determined via one-way ANOVA, and were analyzed by Duncan’s multiple range test.
Applsci 11 02392 g004
Figure 5. Effects of Echinacea purpurea ethanol extract on Malondialdehyde (MDA) production in (a) sperm and (b) testicular tissues of HFD-induced obese rats after 5 weeks. Data are shown as the mean ± S.E.M. (n = 5). The values with different superscript letters (a,b) are significantly different (p < 0.05), determined via one-way ANOVA, and were analyzed by Duncan’s multiple range test.
Applsci 11 02392 g005
Figure 6. Effects of Echinacea purpurea ethanol extract on (a) nitric oxide production and (b) and nitroblue tetrazolium reduction in sperm of HFD-induced obese rats after 5 weeks. Data are shown as the mean ± S.E.M. (n = 5). The values with different superscript letters (a,b) are significantly different (p < 0.05), as determined via one-way ANOVA, and were analyzed by Duncan’s multiple range test.
Applsci 11 02392 g006
Figure 7. Effects of Echinacea purpurea ethanol extract on liver protein expression of (a) Phospho-Adenosine Monophosphate-Activated Protein Kinase Alpha 1/2 (p-AMPKα1/2), (b) Peroxisome Proliferator-Activated Receptor Alpha (PPAR-α), and (c) PPAR-γ in HFD-induced obese rats after 5 weeks. Data are shown as the mean ± S.E.M. (n = 5). The values with different superscript letters (ac) are significantly different (p < 0.05), as determined via one-way ANOVA, and were analyzed by Duncan’s multiple range test.
Applsci 11 02392 g007
Figure 8. Effects of Echinacea purpurea ethanol extract on hypothalamus mRNA protein of (a) Kiss1R and testes mRNA protein of (b) Steroidogenic Acute Regulatory Protein (StAR) and (c) 17β-HSD3 in HFD-induced obese rats after 5 weeks. Data shown as the mean ± S.E.M. (n = 5). The values with different superscript letters (a,b) are significantly different (p < 0.05), as determined via one-way ANOVA, and were analyzed by Duncan’s multiple range test.
Applsci 11 02392 g008
Figure 9. Effects of Echinacea purpurea ethanol extract on sperm morphology in HFD-induced obese rats after 5 weeks.
Applsci 11 02392 g009
Figure 10. Effects of Echinacea purpurea ethanol extract on seminiferous tubules in HFD-induced obese rats.
Applsci 11 02392 g010
Figure 11. Effects of Echinacea purpurea ethanol extract in the sperm mitochondrial membrane potential in HFD-induced obese rats after 5 weeks. Data are shown as the mean ± S.E.M. (n = 5). The values with different superscript letters (a,b) are significantly different (p < 0.05), as determined via one-way ANOVA, and were analyzed by Duncan’s multiple range test.
Applsci 11 02392 g011
Figure 12. Effects of Echinacea purpurea ethanol extract in sperm DNA damage in HFD-induced obese rats after 5 weeks. Data are shown as the mean ± S.E.M. (n = 5). The values with different superscript letters (a,b) are significantly different (p < 0.05), as determined via one-way ANOVA, and were analyzed by Duncan’s multiple range test.
Applsci 11 02392 g012
Table 1. Effects of Echinacea purpurea ethanol extract on adipocyte diameter in HFD-induced obese rats after 5 weeks.
Diameter μm (%)ControlHFDEPE1EPE2EPE5
2540111
503202524
1004611305348
1501756583925
200133922
Average (μm)90.5161136.25118.25101.75
Table 2. Effects of Echinacea purpurea ethanol extract on testes and epididymis weight in HFD-induced obese rats after 5 weeks.
ControlHFDEPE1EPE2EPE5
TestesWeight (g/100 g body weight)0.74 ± 0.01 a0.63 ± 0.04 b0.70 ± 0.04 ab0.69 ± 0.02 ab0.71 ± 0.03 ab
length (cm)2.18 ± 0.04 a2.08 ± 0.07 a2.24 ± 0.05 a2.24 ± 0.02 a2.22 ± 0.06 a
Weight/ length (g/cm)1.51 ± 0.03 a1.46 ± 0.04 a1.48 ± 0.03 a1.50 ± 0.02 a1.53 ± 0.03 a
EpididymisWeight (g/100 g body weight)0.29 ± 0.01 a0.24 ± 0.01 c0.26 ± 0.01 bc0.27 ± 0.01 ab0.27 ± 0.01 ab
Data are shown as the mean ± S.E.M. (n = 5). The values with different superscript letters (a–c) are significantly different (p < 0.05), determined via one-way ANOVA, and were analyzed by Duncan’s multiple range test.
Table 3. Effects of Echinacea purpurea ethanol extract in the testes production of proinflammatory cytokine levels in HFD-induced obese rats after 5 weeks.
ControlHFDEPE1EPE2EPE5
TNF-α (pg/mL)8.68 ± 1.25 b13.90 ± 1.55 a12.07 ± 1.87 ab10.75 ± 1.15 ab8.83 ± 0.56 b
IL-6 (pg/mL)10.74 ± 1.99 b22.09 ± 3.78 a16.47 ± 1.70 ab16.44 ± 1.14 ab14.40 ± 1.46 b
Data are shown as the mean ± S.E.M. (n = 5). The values with different superscript letters (a,b) are significantly different (p < 0.05), as determined via one-way ANOVA, and were analyzed by Duncan’s multiple range test.
Table 4. Effects of Echinacea purpurea ethanol extract in alanine transaminase (ALT), aspartate aminotransferase (AST), urea, and creatinine in HFD-induced obese rats after 5 weeks.
(mg/dl)ControlHFDEPE1EPE2EPE5
ALT31.43 ± 2.14 a27.59 ± 3.96 a27.94 ± 2.14 a35.97 ± 3.77 a34.22 ± 7.08 a
AST33.52 ± 0.86 a41.03 ± 2.42 a37.71 ± 2.11 a44.23 ± 2.25 a33.87 ± 8.80 a
Urea14.89 ± 3.78 b38.37 ± 16.60 a26.06 ± 19.61 ab18.64 ± 6.25 b12.43 ± 5.39 b
Creatinine0.29 ± 0.10 a0.38 ± 0.06 a0.31 ± 0.13 a0.28 ± 0.12 a0.27 ± 0.11 a
Data are shown as the mean ± S.E.M. (n = 5). The values with different superscript letters (a,b) are significantly different (p < 0.05), as determined by one-way ANOVA, and were analyzed by Duncan’s multiple range test.
Table 5. Effects of Echinacea purpurea ethanol extract on sperm parameters in HFD-induced obese rats after 5 weeks.
ControlHFDEPE1EPE2EPE5
Counts (106)30.68 ± 1.61 ab26.78 ± 8.27 b31.52 ± 1.43 a29.50 ± 8.95 ab30.78 ± 3.11 ab
Mobility (%)31.89 ± 2.38 a12.55 ± 1.37 b17.89 ± 1.85 b25.31 ± 3.03 ab24.95 ± 3.95 ab
Abnormality (%)9.11 ± 0.40 a18.70 ± 2.07 c14.31 ± 0.80 b12.70 ± 1.40 ab13.09 ± 0.71 ab
Data are shown as the mean ± S.E.M. (n = 5). The values with different superscript letters (a–c) are significantly different (p < 0.05), as determined via one-way ANOVA, and were analyzed by Duncan’s multiple range test.
Publisher’s Note: MDPI stays neutral with regard to jurisdictional claims in published maps and institutional affiliations.

