
Optimization of a Faraday Cup Collimator for Electric Propulsion Device Beam Study: Case of a Hall Thruster


1
ENPULSION GmbH, Viktor Kaplan Straße 2, 2700 Wiener Neustadt, Austria
2
CNRS-ICARE, 3 Avenue de la Recherche Scientifique, 45100 Orléans, France
*
Author to whom correspondence should be addressed.
Appl. Sci. 2021, 11(5), 2419; https://0-doi-org.brum.beds.ac.uk/10.3390/app11052419
Submission received: 10 February 2021
/
Revised: 1 March 2021
/
Accepted: 2 March 2021
/
Published: 9 March 2021
(This article belongs to the Special Issue Plasmas for Space Propulsion)
Abstract
:Featured Application
Over the last decade electric propulsion devices have evolved from laboratory units to qualified space hardware. Due to the diversity of concepts numerous electric thruster technologies are available on the new space market. Each technology has a specific working principle which implies a wide variety of plasma discharges and ion beams. Currently, it is still difficult to compare, without bias, these plasmas to each other with standard devices and procedures. This work aims at contributing to the effort towards standardization of a specific type of plasma diagnostic called a Faraday cup. This instrument is of great importance as it measures the ion current density in electric thruster plumes. This physical quantity provides information on key parameter for thruster development and production such as thrust, beam divergence, ionization degree and propellant use. In this contribution we describe and validate the optimization of a Faraday cup collimator in the case of Hall thrusters.
Abstract
A Faraday cup (FC) is an instrument dedicated to current measurement in beams, jets and plasmas. It consists of a set of polarized electrodes mounted in such a way plasma sheath effect can be neglected, yielding accurate and reliable results. A FC is composed of three main parts, namely a collector or cup, which collects the current, a collimator, which defines the collection area and can contribute to limit electrons from entering the cup and a housing which protects the instrument from perturbation caused by the surrounding medium. In this paper, we provide experimental results of the effect of the collimator upon the measured ion current within the beam of a low-power Hall thruster. Different collimator materials, aperture diameters and polarization voltages are studied to determine the optimum design. Minimum dimension as well as appropriate materials are given as a conclusion in the case of low-power Hall thruster beam investigation.
1. Introduction:
The space industry has now fully opened its doors to electric propulsion (EP) devices [1,2,3,4]. To provide space operators with an accurate map of electric thruster performance and behavior, EP manufacturers must study plasma and beam properties of the sold product. Electrostatic EP devices such as Hall thrusters (HT), gridded ion engines (GIE) and Field Emission Electric Propulsion (FEEP) thrusters, provide thrust by accelerating and ejecting ions at very high speed. To avoid any charge up effect of the device and the satellite during operation the ion beam must be neutralized with the help of an electron gun, also termed cathode [5,6]. Consequently, the beam of an EP device is composed of ions and electrons during operation. Many techniques exist to analyze EP ion beams [7,8,9,10,11,12,13,14,15,16,17,18]. Beam diagnostics by means of electrostatic probes is of interest in terms of implementation, use, data collection and cost. Probes can provide information about temperature, density, velocity, energy as well as flux and current. This data can lead to the assessment of the thruster performance, its beam divergence angle and current use. The electrostatic probe family is wide. It includes Langmuir probes [19], simple planar and guarded probes [16,17], retarding potential analyzers (RPA) [7,20,21], magnetically filtered Faraday probes [22], E × B probes [12,23] and Faraday cups [15,24]. A FC is certainly one of the most accurate tools to access ion current in the beam.
The functioning principles of a FC are similar to that of planar probes. A negative potential is applied to the diagnostic collector to attract and collect ions and repel electrons. Although planar probes are heavily impacted by sheath expansion and secondary electron emission (SEE), the geometry of a FC is thought to reduce and suppress these disturbances. Faraday cups architecture differs from planar probes as they use a hollow cylinder closed at one end as a collector and an additional electrode, called collimator, placed at the front of the probe. This electrode defines the collection solid angle, which confines the flux going through the collector. Due to the cylindrical shape of the collection surface, plasma sheath effects are negligible which greatly improve the accuracy of ion current measurement. The collimator along with the cavity shape, material properties and dimensions provide extra degrees of freedom enabling recollection of secondary electrons, a phenomenon which tends to artificially increase the ion current. Please note that many studies were conducted to prove the advantages of using a Faraday cup instead of a planar probe design [16,25,26] to study the plasma produced by an EP device. However, published work dealing with Faraday cup optimization can only be found for fields [15,24,27,28] where ion energies are three to six orders of magnitude larger (MeV) than expected energies in the electric propulsion filed (eV to keV). More precisely, previous research on an optimum collimator design for a Faraday cup was mostly performed in the field of nuclear physics where the ion energy is in the keV—MeV range [15,28,29]. In those cases, the collimator is mainly used to suppress secondary electrons produced by the collector. A negative potential, with a magnitude higher than the collector voltage, is applied to the collimator to repel all secondary electrons back into the cavity therefore avoiding large overestimate of the ion current. Considering the high energy of the ion in nuclear physics, thermal simulations as well as material sputtering yield determination are of great relevance [15,24]. In the field of EP, collimated Faraday cups are of interest as they give the possibility to shield the collection electrode against SEE and charge-exchange collisions (CEX). CEX collision events correspond to collision between slow neutrals and fast ions. They therefore produce fast neutrals and slow ions. This collision type is very often encountered in the beam of EP devices [30]. CEX collisions have two main origins, namely: the residual gas background pressure and the neutral particles flow at the thruster outlet. CEX is known to be the cause of an increase in the measured current [31], see Section 3.2. Eventually, studies upon the dimensioning of a collimator can be found in [27,32].
In this work different Faraday cup collimator aperture sizes and materials were studied. Each design was used to determine the ion current density in the far-field plasma plume of the 200 W-class ISCT200 laboratory model Hall thruster operated with ion energies from a few eV to 250 eV. The experimental campaign has been split in three main parts. First, measurements have been performed with different collimator materials, as this element is the most exposed to the beam. Secondly, the collimator aperture diameter has been varied to examine the impact on the measured ion flux. Finally, the collimator was placed behind the housing. With this configuration the collimator is a simple electrode, and the housing orifice determines the collection solid angle. Different potentials were applied to the collimator to study its capacity to better screen electrons and prevent CEX ions to be collected by the ion collector. As we shall see this approach gives a great flexibility for FC operation.
2. Experimental Arrangement
2.1. Vacuum Chamber, Instrument and Procedure
All experiments have been performed in the cryogenically pumped New Experiments on Electric Thrusters (NExET) vacuum chamber. It is a 1.8 × 0.8 m stainless steel vessel. The overall pump stack warrants a background pressure as low as mbar-Xe during operation of a 200 W input power plasma source. The grounded vacuum chamber is used as potential reference for all experiment series. A schematic of the experimental set-up is drawn in Figure 1. The Faraday cup is attached to an aluminum structure designed to automatically align the probe with the thruster equatorial plane. The mechanical frame is mounted on a URS1000BCC motorized rotation stage and controlled by a SMC100 unit provided by Newport. An in-house computer program was used to interface with the controller, record and save data. The pivot point of the rotating structure is aligned with both the thruster axis and exit plane. The system allows for a 180 scan on the horizontal plane with respect to the thruster. Probe alignment with the EP device is made using a laser system. The thruster centerline is referred to as the 0 angular position of the probe. The distance between the FC collimator entrance and the thruster exit plane (R) is here limited by the vacuum chamber diameter. Consequently, R is fixed at 27.4 ± 0.2 cm (∼6 thruster mean channel diameters). The far-field plume is usually defined as the region where R is greater than four thruster diameters [17]. In the far-field plume domain the thruster is assumed to be a point ion source [25,33,34]. The whole probe system is electrically connected to the common ground reference.
A calibrated Keithley 2410 sourcemeter in voltage source mode has been used to measure the ion current collected by the Faraday cup. A TTI-EX752M dual output 300 W power supply that can deliver up to ±75 V in single output mode is used to define the desired potential on the collimator. Both instruments are referenced to ground.
A standard procedure has been followed for each measurement. The different steps are listed in Table 1. For all measurement series, the rotation of the arm that supports the FC always follows the same cycle: start at −90°, angular sweep up to +90° and back to −90° the rest position. Here the angle refers to the FC angle. The angular step size is 1°.
2.2. 200 W-Class Hall Thruster
A Hall thruster is an electrical propulsion device that uses a plasma discharge with magnetized electrons to ionize and accelerate a propellant gas [34,35,36,37]. The principle relies upon a magnetic barrier and a low-pressure dc discharge generated between an external cathode and an anode. The latter is located at the upstream end of a coaxial annular dielectric channel that confines the discharge. A fraction of the electrons emitted by the thermionic cathode flows downstream to neutralize the ion beam. The remaining part travels toward the anode to maintain the plasma discharge. The propellant gas, typically xenon, is introduced at the back of the channel. Magnetizing coils or permanent magnets, incorporated into a magnetic circuit, provide a radially directed magnetic field of which the strength is maximum in the vicinity of the channel exhaust. The magnetic field is chosen to be strong enough to make the electron Larmor radius much smaller than the discharge chamber characteristic dimensions, but weak enough not to affect ion trajectories. The electric potential drop is mostly concentrated in the final section of the channel owing to the low axial mobility of electrons in this restricted area. The electric field governs the propellant atoms ionization and the ion acceleration. The combination of the radial magnetic field with the axial electric field generates an E × B electron drift in the azimuthal direction, the so-called Hall current. The latter is responsible for the very efficient ionization of neutral atoms inside the channel.
The ISCT200 Hall thruster is a 200 W-class HT with a classical magnetic field topology. Details about the ISCT200 series and thruster architecture can be found in [34,38]. The annular channel walls of the ISCT200 are made of BN-SiO2 ceramic. The channel geometry is in the so-called 2 configurations, which means the channel cross-sectional area is twice the one of the well-known Russian SPT100 [39,40]. The 2 configuration ensures a high ionization degree. The magnetic field is generated by way of small cylindrical samarium–cobalt magnets. The xenon propellant gas is injected homogeneously inside the channel using a high porosity mullite ring ceramic placed behind the channel back plate. The anode is a wide stainless steel ring placed at the back of the channel against the outer wall. During operation, the thruster body is floating. A heated 5 A-class hollow cathode with a disk-shaped LaB emitter was used to generate the electron current [5,41]. The cathode is located outside the channel with its orifice in the vertical plane that contains the channel outlet, tilted towards the thruster. The cathode, which is operated with a constant xenon mass flow rate () of 0.3 mg/s, is electrically connected to the thruster anode and floating.
The Faraday cup has been tested in the NExET chamber with the 200 W-class ISCT200 Hall thruster. Figure 2 shows the ISCT200 in operation with Xenon at 200 V during the campaign. One can notice the slight deviation of the inner beam to the positive side of the angular distribution (left in the picture). The deviation is visible in the measured ion current profiles display in next sections. The origin of the deviation is not completely known. However, we expect the phenomena to be caused by inhomogeneous or asymmetrical distribution of the magnetic field in the azimuthal direction because, for versatility purpose, we use an assembly of small magnets that are not perfectly identical. The use of a magnet ring instead would make the topology symmetrical yet at the expense of magnetic flexibility.
Throughout the whole test campaign two different operating conditions were chosen for the thruster, see Table 2. The discharge current was kept constant to allow accurate comparison between each firing parameter. For each of them, specific design of the FC was used to characterize the beam (I–V characteristics) and to map the angular current density of the plume ( profiles).
Finally, current oscillations acquired with a LECROY-HDO6104A oscilloscope during thruster operation at 0.66 A, 200 V and 250 V are plotted in Figure 3. The standard deviation as well as uncertainty computed for both whole data sample is also given.
Parameters calculated from the ion current density measured by a FC are given considering uncertainties (u) from our measurements. The final uncertainty is always given for 95% confidence level (i.e., 2u). Therefore, the current and propellant use are given with ±5% interval and divergence angles with ±2° accuracy.
3. Faraday Cup
3.1. Architecture
Measurements of the ion current density in the plasma plume or ion beam of electric propulsion devices are of great relevance as the flux of ejected ions determines the thruster properties such as the thrust level, the specific impulse, the propellant use and it plays a key role in overall thruster performance. Moreover, an accurate and comprehensive knowledge about ion current density is critical for the validation of plume modelling and numerical simulations [42,43], for thruster acceptance tests, for the study of facility effects [44,45] and for understanding the interactions between plasma plume and spacecraft elements [46,47,48,49]. The ion current density can be measured using an electrostatic probe that basically consists of a conducting electrode, termed the collector, polarized to a high negative voltage with respect to the local floating potential to repel electrons and capture ions. There are various configurations of probes from a simple metal disk to architectures with collimators, filters and guard rings with various materials [16]. A FC is a special kind of electrostatic planar probe. It is basically an isolated conductive cup dedicated to the detection of charged particles in a low-pressure or vacuum environment [16]. When a Faraday cup operates as an ion collector, which means the cup is negatively biased with respect to the floating potential, the ion current in the probe direction can be accurately measured. Contrary to other electrostatic probes, edge effects due to plasma sheath formation are negligible with a FC owing to the closed geometry.
In this study, FCs with collimator diameters of 10, 7, 5, 3 and 1 mm have been built. A large orifice collimator minimizes the impact of the neutral gas inside the cup. As a FC is collimated, the collection solid angle is below 2, contrary to a planar probe, therefore a fraction of the thermal ion current is not captured [16,17]. Nevertheless, a collimator has a key role to define the velocity vector of ions entering the device. Moreover, the collimator also limits the ion flux, which avoids saturation of the measurement signal when the FC is placed in the center of the ion beam, especially for high-power EP devices. A schematic view of the FC is shown in Figure 4. The FC assembly is composed of 5 different parts.
The collimator (3) is used to screen the electrons and define the solid angle of collection, see Table 3. In this work the FC is bombarded by high energy xenon ions. Graphite and molybdenum have thus been employed. The orifice dimensions are assessed in Section 5.3. A trade-off must be considered between increasing velocity filtering and minimizing pressure inside the cup. Indeed, if the FC is not evacuated a large pressure inside the cup enhances charge-exchange collision events, which may disturb the ion flux. The collimator is electrically isolated from the FC body and cup enabling independent potential variation.
A metal foam ion collector (1) forms the back of the cup (1 + 2). The collector is mechanically attached to the cup without welding. The cup is a stainless steel hollow cylinder. The diameter of the collector is 12 mm. The aluminum foam was provided by Exxentis. The type used in this study is an open-cell AlSi7Mg foam Nr. 4. Each pore has a diameter between 0.4 and 1 mm and are connected to each other via channels with diameters from 0.15 to 0.2 mm. The whole volume porosity is 60 ± 5%. The complex structure of a foam should reduce secondary electron emission and prevent ion rebounds [50,51,52,53,54]. The active length of the stainless steel cup is 50 mm (). The total volume of the cup is therefore 5.65 cm. The length should be longer than space-charge sheath thickness inside the probe to ensure the measurement outcomes are insensitive to the local plasma properties. The on-axis electron density and temperature in the ISCT200 plume far-field are typically m and ≈ 3 eV [55]. It gives a Debye length close to 0.1 mm [11]. Due to the relatively large voltage applied to the collector , where is the Boltzmann constant, the sheath thickness can be estimated assuming the current is space charged limited. Therefore, the sheath is governed by the Child-Langmuir law [56], and the sheath thickness s is given by:
A small FC also reduces the amount of sputtered material in the plasma beam and it minimizes flow disturbances. The cylinder plus the collector are maintained at a potential well below the floating potential to capture positively charged particles. The cup design limits the perturbation introduced by the SEE process: the cylindrical geometry allows the capture of most of the secondary electrons emitted by the collector surface. The length minimizes but does not completely compensate SEE effect.
The FC is encapsulated into a cylindrical aluminum pod (4) to protect the external PEEK insulator from ion bombardment and from the thermal load and to prevent ambient plasma to disturb cup measurements. The pod is grounded with respect to the local plasma potential (i.e., facilities ground). The pod (or housing) is also used to attach the probe to the rotating arm.
The spacers (5) act as electrical insulators. They electrically uncouple the cup from the collimator, as graphite and molybdenum are conductors, same as the housing. The size is chosen to reduce the occurrence of short-circuit between the collimator and the cup. The back of the cup is used to implement and accommodate wires and connections.
Figure 5 displays the different designs tested in this work. To prevent confusion a nomenclature (ID) is used to refer to a specific FC design. The ID is split into three parts (). The first component gives information about the material used to equip the front of the FC. It can be either G, Mo, or Al which respectively correspond to graphite, molybdenum and aluminum. The second component refers to the diameter of the inlet aperture. Therefore, one can have numbers 01, 03, 05, 07 and 10. Finally, the last part of the ID indicates information whether the collimator is exposed to or protected from the beam, using the letter E and P respectively. So, designs labelled differ from designs as the housing aperture diameter decreases while the collimator diameter behind becomes larger. Please note that with configuration the collimator can be grounded or biased while in configuration the latter is always grounded (see Section 6.3). As an example, the FC corresponds to a collimator made of graphite with an aperture diameter of 7 mm and is exposed to the beam.
3.2. Perturbations
Introducing an object inside the main beam of an EP device disturbs the plasma. Therefore, one must minimize the exposed surface and reduce the size of the probe as much as possible. Figure 6 shows the three physical mechanisms which depend on material properties during ion or electron bombardment: reflection, sputtering and secondary electron emission (SEE).
In this study, ion reflection events are considered minimal due to the length of the cup and the properties of the collector foam at the cup rear side. Indeed, the pores of the foam material should increase the probability to trap ions. If not, the reflected ion would not be able to reach the top of the cup entrance due to its length.
In contrast to ion reflection, SEE has a great impact on the measured ion current. The rate of electron emitted by a material depends on its properties, the projectile energy and angle of incidence [57,58,59,60,61,62,63]. In our study, we consider two possibilities:
- First, we consider an electron emitted by either the FC housing front or collimator. If the electron manages to reach the collector, the measured ion current will artificially be lowered and would read: with .
- Secondly, we consider now an electron emitted by the collector but not recollected by the latter. Therefore, the measured ion current will be higher than reality and would read: with .
In both cases the real ion current is not properly measured. Therefore, one must minimize and control the rate of SEE.
Lastly, sputtering is characterized by its yield () which defines the ratio of emitted atoms per incident ions. This parameter depends on the projectile and the target inner properties as well as the energy of impacting ions. Table 4 shows the yield for graphite, molybdenum and aluminum for ion energy corresponding to different thruster discharge voltages. These figures were obtained with the software SRIM [64], see Section 6.1. The primary danger with material sputtering is the collector deterioration which leads to a decrease of ion collection efficiency and prevent long operation. Another issue concerns particle deposition caused by sputtered material. It can lead to short-circuit between electrodes and create a current leak. Neutral sputtered atoms cannot directly contribute to the measured ion current. However, a collision between a neutral and the collector or collimator can create a secondary electron, which can lead to change the measured ion current as previously mentioned. A Hall thruster beam is composed of high kinetic energy ions and low temperature electrons [26,65]. A negative potential is therefore applied to the cup preventing any primary and secondary electrons to be captured. Section 5.4 shows the trade-off which must be considered between ion collection and electron repulsion.
A Hall thruster plume is subject to charge-exchange collisions (CEX). These events occur when a fast ion and a slow atom collide inelastically, resulting in a change of velocity distribution for both particles. The collision results in a slow ion with a random velocity distribution and a fast atom. The latter moved towards the edge of the plume which increase the so-called “wings” of the thruster, see Section 5.3. The probe becomes a potential sink which trap these ions with low energy and random velocity distribution. This effect occurs at large angle where the ion density is low, and the Debye length is large. CEX can occur in the HT channels or in the plume core due to high level of ion and neutrals density. Therefore, it increases when the propellant flow rate or the ionization efficiency increases. Consequently, higher ion current at the thruster “wings” increases the whole ion current measured. Nevertheless, a collimator can prevent such phenomena to disturb the measured current as it shields the cup from the ambient plasma [32].
4. Ion Current
4.1. Total Ion Current and Divergence Angle Determination
The ion current corresponds to a flux of positive charges going through a surface per unit of time. It reads:
The ion current density (A/m) is assumed to be collinear to the outward pointed unit normal vector to the surface. A spherical coordinate system is often used to determine and compute . The probe is usually fixed at a distance R and the thruster is supposed to be a point source at the center of a sphere. To compute it is needed to know , where is the latitude and the longitude. When the current density is solely recorded in a plane that contains the thruster axis, e.g., following the angle from to , one can assume a cylindrical symmetry of the ion beam around the thruster axis to determine and compute . It is in fact easier to use a cylindrical coordinate system to solve Equation (2). In that case the coordinate system is depicted in Figure 7 along with the elementary arc . The thruster exit plane points toward the x axis. Measurements are performed at a fixed distance R and defined by the angle . Cylindrical symmetry implies a constant inside the element with radius y and thickness . The sum of these elements, each weighted with , gives the ion current:
with = . With the help of several mathematical conventions and simplifications [66] we obtain the general final form of the ion current:
This form is also used by Brown et al. [17] in his recommended guidelines for use of Faraday probes.
The divergence half-angle refers to the width of the beam. It quantifies the beam deviation from a straight ion beam. The thrust is directly impacted, and it significantly decreases when the divergence angle gets large. The divergence half-angle of the ion beam is defined as the angle for which the ion current corresponds to a given fraction of the total ion current. In general, the ratio is 0.95. Therefore, the half-angle is mathematically related to according to:
Equation (5) shows that the way is calculated, as well as the treatment of the angular distribution of the ion current density (smoothing, fitting, filtering, interpolation), greatly influence the value of for a given dataset.
4.2. Current and Propellant Use
The current use () is of importance for Hall thrusters as those devices are not operated with direct ion current control. A Hall thruster provides thrust when delivering a discharge current () that incorporates both ion and electron contribution. The current use is the ratio between the experimental ion current and .
This ratio is around 0.8 for HTs [34,67]. That means about 20% of the current is provided by the electrons which do not contribute to the thrust. The propellant mass use is the ratio of the ion mass flow rate to the propellant mass flow rate. It corresponds to the fraction of the propellant mass flow rate injected into the discharge channel that is ionized. This quantity directly characterizes the ionization efficiency, hence it must be maximized. The propellant use reads [68,69]
where and are the ion mass flow rate and the atom mass flow rate, respectively, m is the atomic mass, e is the elementary charge and the current associated with ions having a electric charge. Please note that multiple-charged xenon ions with charges up to have been detected in the plume of high-power Hall thruster. As the multiple-charged ion fraction is often unknown, the ion beam is assumed to be solely composed of singly-charged ions. The propellant use is then given by the following formula:
Please note that the above equation overestimates the value of when multiple-charged ions are present in the thruster plasma plume [68]. For high-power Hall thrusters this ratio lies between 85% and 95%. For low-power HTs the current use is much lower with values around 70%. In all cases accurate FC measurements are used to get more precise and reliable values for the current ionization as this quantity plays a key role in HT optimization.
5. Impact of the Collimator Characteristics
5.1. I–V Curves
In this work, three different collimator designs were studied. The first series of experiments deals with the collimator material: graphite vs molybdenum. For the two other series the collimator is made of graphite. The second series evaluates the impact of the FC collection solid angle upon the ion current density. The last experiments investigate the influence of having the collimator screened from the ion beam. For all FC configurations the geometry and properties of the collector are unchanged. Configuration G.10.E, see Figure 4, is taken here as the reference. A current density profile is measured for all FC configurations. The thruster was operated at 200 V and 250 V with a fixed discharge current I = 0.66 A. The discharge power is 132 W and 165 W, respectively. The heat load on the thruster channel walls prevents the operation of the ISCT200 thruster above 250 V at 0.66 A.
Prior to FC measurements, current-voltage characteristic curves must be acquired to verify the proper design and functioning of the probe. Figure 8 shows I–V traces recorded at various angles in the plume of the ISCT200 Hall thruster firing at 250 V and 0.765 mg/s anode mass flow rate, see Figure 4. Measurements were carried out 27.4 cm downstream the thruster exit plane. A broad negative potential range must be swept to get an accurate picture of the FC behavior. Faraday cups provide reliable information upon the ion current as electrons are screened and sheath expansion effect and SEE are cancelled. Consequently, the ion branch, the part of the I–V curve where the probe is negatively biased, should be horizontal. This constant ion current is termed the saturation current [10]. The potential to apply to the collector is determined from the ion current saturation extracted from I–V curves. The latter is used to measure the current density angular distribution profile of the EP plume, see Section 5.3 and Section 5.4. In Figure 8, the collected ion current does not depend upon the cup voltage at large angles. The slow increase in ion current with the voltage at small angles finds its origin in an increase of secondary electron emission.
5.2. Collimator Material
In this experiment, the probe is equipped with either a 10 mm graphite (G.10.E) or a 10 mm molybdenum (Mo.10.E) grounded collimator. Figure 9 shows I–V curves for the two configurations at two different discharge voltages measured on the HT axis ( = 0°). The slope is of the order of 10 mA/cm for the two configurations. The ion current saturation is relatively constant indicating that most electrons are properly screened. The main difference between the two designs is the amplitude of the measured current. The FC equipped with a molybdenum collimator gives a current density which is about 20% lower. As can be noticed in Figure 9 the gap between the two curves increases when the voltage is ramped up for a fixed value of .
The total ion current is obtained from the current density profile as explained in Section 4.1. We use Equations (6) and (8) to obtain the current and propellant use. Figure 10 shows the value of and for two thruster operating conditions and two FC configurations. Both parameters are lower for the molybdenum collimator configuration. The difference remains true whatever the thruster discharge voltage with constant discharge current. For the two configurations is larger at 250 V because the ionization degree increases with voltage. Numerical simulations are used in Section 6.1 to discuss the behavior observed experimentally.
5.3. Collimator Diameter
Here, the collection solid angle of the FC is modified using five grounded graphite collimators with different aperture diameters (d): 10 mm (G.10.E), 7 mm (G.07.E), 5 mm (G.05.E), 3 mm (G.03.E) and 1 mm (G.01.E). The length of the cup is 50 mm. On-axis I–V characteristics are displayed in Figure 11. At = 200 V, the current density measured by G.01.E is constant until 100 V then it starts to rise. This behavior remains so far unexplained. At higher discharge voltage I–V curve measured with G.01.E is more unstable than the other curves. With a diameter of 1 mm the probe alignment with the thruster axis is difficult. A slight deviation of the probe pointing vector can lead to a large decrease in the measured ion current. Misalignment could then explain the different behavior observed between 200 V and 250 V. Figure 11 indicates the current density decreases when the collimator diameter is reduced.
Narrowing down the inlet aperture of the probe can prevent some thermal ions from being collected; however, the ion thermal current is small in the ISCT200 plasma plume [70]. Additionally, the drop in current does not vary linearly with the reduction of the collimator diameter. Figure 12 shows the rate of change of the current density for different collimator diameters factor of reduction. It refers to the aperture diameter diminution compared to a 10 mm diameter (). The Hall thruster fires at 250 V and 0.66 A. We observe a linear increase of the current density until a factor 6. After, the rate of change slows down and reaches a maximum when the diameter of the collimator is reduced by a factor 10.
Figure 13a,b show the beam profile of the HT for 200 V and 250 V at constant . The double peak shape visible on the thruster axis is due to the annular geometry of HTs. It is better seen at high voltages. Note when operated at 200 V and 0.66 A the thruster plume has instead a rounded shape. At this power level the thruster operates with a low efficiency. As can be seen in Figure 13, we observe four distinct zones, unrelated to the probe design and characteristic of the Hall thruster plume. For a given zone the differences observed between each profile is due to the probe configuration. The zone width depends on the thruster discharge voltage. Each zone is defined by a sharp change in current density slope. Zone 1 depends the most on the thruster operation. Indeed, we note that at 200 V zone 1 lies between −15° and 24° while at 250 V the zone width does not exceed 12°. This is due to the thruster performance. Indeed, at 200 V the thruster ionization process is not optimal which implies that ions travelling on the thruster axis have broader energy distributions and their velocity vector deviates more easily from the thruster firing axis. Therefore, when the aperture diameter of the FC is reduced it diminishes the probability for an ion to reach the collector. In contrast, at 250 V the ionization is better which creates a more focus beam with narrower ion energy distributions. Therefore, zone 1 is narrower. Please note that within zone 1, a major current density drop is observed with FC G.03.E. Moreover, in this zone the current density rate of change between each FC configuration is constant between 200 V and 250 V. Eventually, zone 2, 3 and 4 are larger at higher discharge voltage. Zones 3 and 4 are usually referred to the Hall thruster wings. They contain most of the slow ions with random velocity vectors induced by CEX and scattering collisions [71]. Please note that other thruster design parameters such as electric field distribution and zone of the ionization contribute to Hall thruster wings [70,72]. The ion density decreases fast in the plume of Hall thrusters when moving away from the centerline. The change of slope between each zone becomes less visible at higher discharge voltage. At 250 V, the ionization process in the thruster channel is more efficient. Consequently, the ion population increases. When the of ion density increases the rate of CEX becomes higher in the thruster channel and within the plume. Therefore, these two processes contribute to enlarge the beam divergence angles by increasing the ion density in zone 4. Please note that the current ratio between the core and large angle wings can reach three orders of magnitude in HT plumes.
5.4. Screened Collimator
In this experiment the probe is equipped with an aluminum housing (Al.05.P) with a front aperture of 5 mm. A 10 mm diameter graphite collimator is placed behind and is electrically isolated. The collector remains a foam. The first study is made with both housing and collimator grounded. The second study is performed with a polarized collimator while the housing is kept grounded. In both studies a voltage sweep is applied to the collector. Measurement outcomes are compared with the ones obtained with FC G.05.E configuration. The aperture diameter is similar for the two designs.
The beam profiles of the first study are displayed in Figure 14a,b (G.05.E and Al.05.P). At both discharge voltages Al.05.P measures the highest ion current density. On the thruster axis, the signal acquired by configuration X.X.P is 15 to 20% higher than X.X.E. The difference in current density is observed all over the beam profile. Actually, the current density decreases when the potential is more negative on the collimator. When the collimator is biased to −75 V, is near 5% less than the one obtained with a grounded collimator.
In the second part of the experiment four different potentials (−15 V, −25 V, −50 V and −75 V) have been applied to the collimator in the FC configuration Al.05.P. I–V curves at = 0° are plotted in Figure 15. One can notice all I–V curves are relatively flat when the FC potential is below −100 V. As mentioned in previous studies [73] SEE is characterized by a drop of ion current when the potential applied to the collector is higher than the electrode placed at the entrance of the FC (housing, collimator). Such behavior is not observed in Figure 15, which confirms the choice of FC architecture to suppress SEE.
Figure 16 shows I–V curve with a voltage sweep applied to the collimator while the collector is grounded, the current density measured on the collimator increases when the voltage applied is more negative. This trend is characteristic for I–V curves of Langmuir and non-guarded planar probes [16]. The collimator is a simple disk electrode with no specific design to reduce SEE. Moreover, sheath expansion effect is no longer negligible. This results in an artificial ion current increase as displayed in Figure 16.
Figure 15 and Figure 16 suggest that applying a negative voltage to the collimator, prevents a part of the ion current to reach the collector. To better understand changes observed in the measured ion current density, simulations have been carried out with the SIMION software [74]. The outputs of numerical simulations are discussed in Section 6.3.
Figure 17a,b show the beam profile obtained with FC Al.05.P with the collector potential fixed at −50 V and the collimator grounded (blue) or biased at −75 V (red) with the thruster firing at 200 V and 250 V, respectively. Only zones 1 and 4 introduced in Section 5.3 with Figure 13a,b are plotted. These zones are the most influenced by the probe voltage configuration. Indeed, in zone 1 there is a non-negligible drop of the current density measured by the FC configuration with −75 V applied to the collimator. In contrast, in zone 4 the current density measured with V at −75 V overtakes the grounded collimator configuration. The lower signal measured by the −75 V configuration in zone 1 is caused by larger ion energy distribution, see Section 5.3. Low energy ions will tend to be directly or indirectly (Section 6.3) collected by the collimator. The higher signal in zone 4 is another clue for the presence of CEX within a Hall thruster plume. In this zone low energy ions with random velocity vectors caused by CEX are predominant. Therefore, they will be more sensitive to any potential drop in their vicinity, such as the collimator voltage (Section 6.3), and will be attracted [71]. Since with this configuration the collimator is placed behind the housing and the collector is biased to −50 V, they will be directed towards the latter.
6. Discussions
6.1. FC Material
Experiments showed the influence of the material on the measured ion current. The software SRIM (Stopping and Range of Ions in Matter) was used to find the sputtering yield of Al, C (≡graphite) and Mo with Xe as the projectile. SRIM includes a group of programs which calculate the stopping and range of ions into matter. They use a quantum mechanical treatment of ion-atom collisions where projectile atoms are considered to be “ion” and target atoms as “atoms” [64]. Simulations that included 10000 singly-charged xenon ions were run to compute the yield and heat losses. The latter corresponds to the energy transferred by projectiles to the target materials and subsequently converted into heat. Figure 18 and Figure 19 show results for carbon (i.e., graphite) and molybdenum under singly-charged Xe ion bombardment. Simulation outcomes give an idea on how the target behaves under Xe ions bombardment.
The software computes the sputtering yield based on the binding surface energy () specific to each target. When this value is not known the heat of sublimation is used instead [64]. Moreover, strongly depends on the material cleanliness and roughness. These properties will change over time as the target gets bombarded. It can lead to quick change of the sputtering yield. For instance, Figure 18 shows the sputtering yield as a function of the target atom’s energy which reach the surface of the material. Singly-charged xenon ions are used as projectile and targets are made of carbon (top) and molybdenum (bottom). The vertical blue line, which defines the average surface binding energy, marked 7.4 eV and 6.8 eV for the carbon and molybdenum targets respectively. The arrow, to the left of this line, with the legend “not sputtered” implies the number of atoms which reached the surface with more than 7.4 eV (C) or 6.8 eV (Mo) is 0.005 and 0.18, respectively. These values correspond to the sputtering yield and are listed in Table 4. The vertical blue line will shift towards the left when the material surface gets damaged. The filled area shows how much effect small changes of the surface roughness (≡) will make on the final sputtering yield. It is seen that the two materials experience a fast degradation of the yield when the material surface is damaged. However, the maximum sputtering yield for carbon remains small (0.32 atoms/ion) compared to Mo yield that is 10 times higher.
Molybdenum targets release 3 to 1 ratio sputtered atoms per incoming ion which is not negligible. This is coherent with a simple comparison based on the atomic number between target and projectile. Xenon has an atomic number close to molybdenum, 54 and 42 respectively, while it is 6 for carbon. Since C is much lighter than Xe, the singly-charged xenon ions need numerous collision events to start sputtering carbon materials.
In the case of carbon, shortly after the vertical blue line, the yield becomes very small and sputtered particle only have energies from 7.4 eV to 12 eV. Molybdenum sees its sputter energy distribution to be more important. The atoms can reach energies from 6.8 eV up to 20 eV. From these two plots we understand that molybdenum will tend to sputter more atoms with an energy distribution broader than carbon. Any material subject to bombardment undergoes a heating process. Its impact can be estimated with the software SRIM as pictured in Figure 19. It shows the energy loss by the projectile for carbon and molybdenum. The red curve labelled “IONS” is the direct energy transferred from the ion to the target electrons. The blue curve, called “RECOILS”, represents the energy transferred from recoiling target atoms to the target electrons. Both phenomena contribute to the heating process of materials. Figure 19 pictures ion energy per angstrom losses with targets made of carbon and molybdenum. Losses are smaller with C than with Mo. Additionally, the energy loss decreases as the projectile goes deeper into the target. The energy loss distribution in C is wider through the material thickness than molybdenum. Most energy losses from Xe ions into Mo occurs near the surface enhancing local heating on the material.
Experimental results and numerical simulations can only suggest conservative measures to limit plasma–probe perturbations. The material chosen to be placed at the forefront of a Faraday cup must have a low sputtering yield. It should also have a low and wide energy absorption capacity to minimize the heating of the material surface.
6.2. Collimator Geometry
Figure 20 shows the evolution of the current utilization (top) and divergence angle (bottom) for different collimator diameters. Results for Hall thruster operation at 200 V and 250 V with 0.66 A are plotted. The divergence angle is not affected by the reduction of the collimator diameter. The small observed differences are within the measurement uncertainty. However, the current and propellant utilization computed with each FC configuration decreases when the collimator diameter is reduced. At 250 V and are up to 33% lower between the 10 mm and 3 mm diameter. It leaves no doubt to a dependency of the measured current density with the aperture diameter. One possible explanation is the invalidity of the point source assumption that is often found in the literature. Ions originate from an extended region of space that has an annular geometry. Moreover, the velocity vector dispersion is large in the case of HTs due to the overlap between the ionization and acceleration zones combined with many scattering and charge-exchange collision events. For those reasons, the collected ion current strongly depends on the FC solid angle. Note that this work reveals the thruster to probe distance necessary for the point source assumption to be valid is different than four thruster diameters, a classical value often encountered, if the collection surface is ≤5 mm. In the conditions of our experiments, a diameter larger than 5 mm seems correct to be used for further investigation.
6.3. Collimator as Electron Screen
When studying the ion beam of EP devices such as gridded ion engines [73] or FEEPs [75] with a Faraday cup the collimator is used to redirect secondary electrons back to the collector while preventing thermal ions from entering the cup. Those EP devices operate with ion energies from several hundreds to thousands of electron-volts. For plasma diagnostic standardization we shall start to compare FC architectures and measurement methods. Hall thrusters deliver high current densities with ion energy relativity low compared to other EP technologies. Therefore, using electric field to enhance the ion collection efficiency of a FC while working with a HT can be problematic. Voltages applied to a Faraday cup are of the same order of magnitude than HT discharge voltages which can greatly disturb the thruster behavior and properties.
We used SIMION to assess the plasma–probe interaction. SIMION is an ion optics simulation program that models ion optics problems with 2D symmetrical and/or 3D asymmetrical electrostatic and/or magnetic potential arrays. In our study, singly-charged Xe ions with different kinetic energy are flown through a 2-D FC. Additionally, we used the software to draw the field lines inside and outside the cup to evaluate possible perturbation with the ambient plasma near the FC entrance. Two FC configurations were used, and outcomes are shown in Figure 21. The Faraday cup located on the right corresponds to X.X.P while the left one refers to X.X.E. The top of the figure shows potential lines inside FC with the collimator (R) grounded and the collector (C) biased to −50 V. At the bottom −75 V is applied to the collimator (R) and the collector (C) remains at −50 V. Field lines from −5 V to −75 V are plotted. For a grounded collimator no major differences are observed between the two configurations. However, when −75 V is applied to the collimator the X.X.P design shields better field lines in the plasma in the probe vicinity.
The current density acquired by G.05.E and Al.05.P enable the computation of , and the divergence angle, see Figure 22. There both FC collectors are biased to −50 V while the collimator (R) is grounded. Although there is no impact on the determination of the divergence angle, we observe that and increases with the Al.05.P configuration. Both parameters are around 10% higher when the Faraday cup housing front is used to collimate the ion flux. With this design the collector is consequently further away from the point of collimation. Therefore, primary and secondary electrons from the probe entrance region are lost before reaching the collector. The latter is better shielded from external perturbations.
Furthermore, SIMION was used to simulate the behavior of different monoenergetic ion beams through the cup, see Figure 23 and Figure 24. The Faraday cup configuration studied is X.05.P. No material can be selected with the software. Two scenarios were considered. In the first case, the simulation displayed in Figure 23 includes 200 singly-charged xenon ions with energy of 5 eV (red), 10 eV (black), 100 eV (green) and 250 eV (blue). Ions have a velocity vector collinear to the Faraday cup axis. In the simulation a 10° divergence angle was applied to maximize the number of ions entering the cup. The collector, represented by the central cup, is biased to −50 V. Twice the potential of the collector is applied to the collimator, which is only an electron screen now. Section 5.4 shows with such a FC configuration a fraction of the ion current is collected by the collimator (electron screen) instead of the collector, see Figure 15 and Figure 16. We observe in Figure 23 no ions are captured by the collimator. On the contrary the beam is better focused onto the cup for low energy ions. We also notice that an important part of the beam is collected by the side walls of the cup.
In the second scenario we assumed ion beam trajectories with different incident angles, see Figure 24. At the top of the figure ions with low energy (10 eV) are flowing through the cup. The bottom figure shows results for 250 eV ions. The ion energy range was chosen based on the large ion energy distribution within the plume of a Hall thruster. For experimental purposes, the incident angles were chosen randomly, and the slope was accentuated to maximize the chance for an ion to be collected by the collimator. The goal here being to assess the probability of an incoming ion to reach the collimator placed behind the housing front. We observe that low energy ions are focused and directed towards the cup. However, highly energetic ones get closer to the collimator and a small fraction manage to touch it. Most of the ions are still collected by the side wall of the cup.
Consequently, two additional simulations were run as shown in Figure 25 and Figure 26. Here, we consider ion reflection or rebound from the original beam to the cup side and rear walls. The semi-half-angle of the possible reflected ions was maximized to 90°. Figure 25 shows the results of 250 eV ion reflection from the cup side walls at different locations for 35 mm (black), 40 mm (red), 45 mm (green) and 50 mm (blue) the bottom of the cup. It is assumed that in the best case reflected ions lose more than 95% of their energy and in the worst case only 50%. Ions with 10 eV and 100 eV are flown with random horizontal velocity vectors. For each case, the Faraday cup has a collector at −50 V and the collimator is either grounded (top) or biased to −100 V (bottom). When the collimator is grounded, around 5% of the ions with high energy escape the cup while all low energy ones are completely redirected back to the collector. However, once the collimator is at −100 V close to 10% of low energy ions escape the cup or are collected by the collimator. Ions with 100 eV are not affected by the change of equipotential field lines inside the cup.
Figure 26 simulates ion rebounds from the bottom of the Faraday cup (50 mm) for energies of 10 eV (black), 50 eV (red), 75 eV (green) and 100 eV (blue). The collector is at −50 V while the collimator is either grounded (top) or −100 V (bottom). In the same manner than ion reflection from the side walls, applying a potential to the collimator does attract a small fraction of reflected ions from the cup bottom. Most of the ions collected by the collimator are low energy ones.
Numerical simulations show the probability to collect primary ions from the original beam with the collimator protected behind the FC housing is negligible. Using a more negative potential on the collimator than on the collector enhances the ion trajectory towards the cup. This, however, leads to a larger ion spread, hence a larger ion collection on the side walls of the cup. Furthermore, ions reflected at the bottom and side walls of the cup can be directed towards the collimator if the latter is biased more negatively than the collector. As a result, a small fraction of the primary ions is not collected and the measured ion current is lower as seen during experiments, see Section 5.4. In our study, we used a collector disk made of aluminum foam which should reduce ions reflection and enhance ions trapping. However, the collector is electrically and mechanically connected to a stainless steel hollow cylinder, termed cup, see Section 3.1, which has no ion trapping capacities. Further investigations shall be carried out with a cup fully made of foam. It would bring more information about the influence of ion reflection inside a Faraday cup. Finally, a Hall thruster plume is more complex than a simple ion beam. Consequently, these simulations must be seen as a first, yet valuable, step to better grasp the ion behavior inside a FC.
7. Conclusions
In this paper, challenges in designing and using the collimator of a Faraday cup have been investigated in the case of Hall thruster plume through both experiments and computer simulations. Results allow us to propose general guidelines to optimize the architecture of a Faraday cup collimator. First, the front of the probe should be made with material that can sustain local heating and that exhibits a low sputtering yield (Section 5.2 and Section 6.1). Secondly, the distance between the point of collimation and the collector should be greater than the plasma sheath (Section 6.3). Moreover, in the case where the far-field plasma region of the ISCT200 is studied with FC architecture presented in this paper, the hypothesis of a point source is valid if the probe aperture diameter is ≥5 mm (Section 5.3 and Section 6.2). Further studies where the probe to thruster distance varies and the HT mean diameter (D) changes could bring valuable information to find a limit and relation between HT dimension, Faraday cup aperture diameter (d) and probe-thruster distance (l). In our case, we recommend for l ∼ 6 D to use a FC with D < 10d. Additionally, the collector must be biased negatively, the exact value must be determined with I–V characterization since it depends on the thruster plume properties, to attract and capture primary ions of the thruster plume (Section 5.1). Finally, the use of an additional electrode, placed between the point of collimation and the collector, to enhance SEE recollection is not necessary (Section 5.4 and Section 6.3). Eventually, to reduce measurement perturbations due to plasma–probe interaction (CEX, SEE), particular attention must be paid to the optimization of the geometry and material properties of the cup and collector. Based on results obtained in this study, we can propose an optimal Faraday cup front architecture to study the plume of a low-power Hall thruster at a distance greater than four times the HT channel outer dimension. The configuration X.X.P provides more reliable results and shield better the collector against perturbation induced by ambient plasma in the cup vicinity. Therefore, the FC should be equipped with a collimator used as electron screen and should use the front of its housing to collimate the ion flux through the collector cup. Additionally, this study did not assess the collector materials and dimensions. Nevertheless, based on our experiments a long cup with a metallic foam placed at its rear side seems to be adequate.
Author Contributions
Investigation, H.V.; Supervision, M.S.; Validation, M.S.; Writing—original draft, H.V. and M.S.; Writing—review and editing, H.V. All authors have read and agreed to the published version of the manuscript.
Funding
V.H. benefits from an ENPULSION grant. Part of this research is financially supported by the ESA, ESTEC under grant PO-5401003120, by the Région Centre-Val de Loire through the PEPSO-2 program and by the European Union’s Horizon 2020 research and innovation program under grant agreement 730135 CHEOPS.
Institutional Review Board Statement
Not applicable.
Informed Consent Statement
Not applicable.
Data Availability Statement
Plume data obtained in the frame of this study are available upon request. Contact the corresponding author. Data about the ISCT200 Hall thruster design are confidential.
Acknowledgments
The authors would like to thank Aumayr for his support on theoretical subject regarding plasma diagnostics design and behavior. Additionally, we would like to thank T. Hallouin for his help and expertise on Hall Thrusters.
Conflicts of Interest
The authors declare no conflict of interest.
Abbreviations
The following abbreviations are used in this manuscript:
| CEX | Charge-EXchange |
| EP | Electric Propulsion |
| FC | Faraday Cup |
| FEEP | Field Emission Electric Propulsion |
| GIE | Gridded Ion Engine |
| HT | Hall Thruster |
| IIEE | Ion Induced Electron Emission |
| ISCT200 | Icare Small Customizable Thruster 200 |
| NExET | New Experiments on Electric Thrusters |
| SEE | Secondary Electron Emission |
References
- Mazouffre, S. Electric propulsion for satellites and spacecraft: Established technologies and novel approaches. Plasma Sources Sci. Technol. 2016, 25, 27. [Google Scholar] [CrossRef]
- Dale, E.; Jorns, B.; Gallimore, A. Future Directions for Electric Propulsion Research. Aerospace 2020, 7, 120. [Google Scholar] [CrossRef]
- Lev, D.; Myers, R.M.; Lemmer, K.M.; Kolbeck, J.; Koizumi, H.; Polzin, K. The technological and commercial expansion of electric propulsion. Acta Astronaut. 2019, 159, 213–227. [Google Scholar] [CrossRef]
- Levchenko, I.; Xu, S.; Mazouffre, S.; Lev, D.; Pedrini, D.; Goebel, D.; Garrigues, L.; Taccogna, F.; Bazaka, K. Perspectives, frontiers, and new horizons for plasma-based space electric propulsion. Phys. Plasmas 2020, 27, 020601. [Google Scholar] [CrossRef] [Green Version]
- Joussot, R.; Grimaud, L.; Mazouffre, S. Examination of a 5 A-class cathode with a LaB6 flat disk emitter in the 2 A–20 A current range. Vacuum 2017, 146, 10. [Google Scholar] [CrossRef]
- Thoma, C.; Welch, D.R.; Yu, S.; Henestroza, E.; Roy, P.K.; Eylon, S.; Gilson, E.P. Comparison of experimental data and three-dimensional simulations of ion beam neutralization from the Neutralized Transport Experiment. Phys. Plasmas 2005, 12, 043102. [Google Scholar] [CrossRef]
- Marrese, C.M.; Majumdar, N.; Haas, J.M.; Williams, G.; King, L.B.; Gallimore, A.D. Development of a single-orifice Retarding Potential Analyser for Hall Thruster Plume Characterization. In Proceedings of the 25th International Electric Propulsion Conference, Cleveland, OH, USA, 24–28 August 1997. [Google Scholar]
- Sheridan, T.E. How big is a small Langmuir probe. Phys. Plasmas 2000, 7, 3084–3088. [Google Scholar] [CrossRef]
- Demidov, V.I.; Ratynskaia, S.V.; Rypdal, K. Electric probes for plasmas, the link between theory and instrument. Rev. Sci. Instrum. 2002, 73, 3409–3439. [Google Scholar] [CrossRef]
- Chen, F.F. Langmuir probe analysis for high density plasmas. Phys. Plasmas 2001, 8, 3029–3041. [Google Scholar] [CrossRef] [Green Version]
- Merlino, R.L. Understanding Langmuir probe current-voltage characteristics. J. Phys. 2007, 75, 1078–1085. [Google Scholar] [CrossRef] [Green Version]
- Terhune, K.J.; King, L. Ion and Mass Measurement of an ELectrospray Emitter using ExB filter. In Proceedings of the 32nd International Electric Propulsion Conference, Okinawa, Japan, 11–15 September 2011. [Google Scholar]
- Sheehan, J.P.; Hershkovitz, N. Emissive probes. Plasma Sources Sci. Technol. 2011, 20, 063001. [Google Scholar] [CrossRef]
- Teshigahara, N.; Shinohara, S.; Yamagata, Y.; Kuwahara, D.; Watanabe, M. Development of 2D Laser-Induced Fluorescence (LIF) System in High-Density Helicon Plasma. Plasma Fusion Res. 2014, 9, 3406055. [Google Scholar] [CrossRef] [Green Version]
- Rawat, B.S.; Vala, S.; Abhangi, M.; Kumar, R.; Chauhan, S. Design and simulation of 10 kW Faraday cup for ion beam current. In Proceedings of the 25th International Conference on Nuclear Engineering ICONE25, Shanghai, China, 2–6 July 2017. [Google Scholar]
- Mazouffre, S.; Largeau, G.; Garrigues, L.; Boniface, C.; Dannenmayer, K. Evaluation of various probe designs for measuring the ion current density in a Hall thruster plume. In Proceedings of the 35th International Electric Propulsion Conference, Atlanta, GA, USA, 8–12 October 2017. [Google Scholar]
- Brown, D.L.; Walker, M.L.R.; Szabo, J.; Huang, W.; Foster, J.E. Recommended Practice for Use of Faraday Probes in Electric Propulsion Testing. J. Propuls. Power 2017, 33, 582–613. [Google Scholar] [CrossRef] [Green Version]
- Vincent, B.; Tsikata, S.; Mazouffre, S.; Minea, T.; Ils, J.F. A compact new incoherent Thomson scattering diagnostic for low-temperature plasma studies. Plasma Sources Sci. Technol. 2018, 27, 055002. [Google Scholar] [CrossRef]
- Chen, F.F. Mini course on Plasma Diagnostics (Langmuir Probes); Electrical Engineering Department University of California: Los Angeles, CA, USA, 2003. [Google Scholar]
- Mühlich, N.; Keerl, S.; Engel, W.; Ceribas, E.; Koopmans, R.-J. Retarding Potential Analyser Development for Low Density FEEP Thruster Beam Diagnostics. In Proceedings of the 36th International Electric Propulsion Conference, Vienna, Austria, 15–20 September 2019. [Google Scholar]
- Zhang, Z.; Tang, H.; Zhang, Z.; Wang, J.; Cao, S. A retarding potential analyzer design for keV-level ion thruster beams. Rev. Sci. Instrum. 2016, 87, 123510. [Google Scholar] [CrossRef] [PubMed]
- Rovey, J.L.; Walker, M.L.R.; Gallimore, A.D.; Peterson, P.Y. Magnetically Filtered Faraday Probe for Measuring the Ion Current Profile of a Hall Thruster. Rev. Sci. Instrum. 2006, 77, 013503. [Google Scholar] [CrossRef] [Green Version]
- Renaud, D.; Gerst, D.; Mazouffre, S.; Aanesland, A. E × B probe measurements in molecular and electronegative plasmas. Res. Sci. Instrum. 2015, 86, 123507. [Google Scholar] [CrossRef]
- Harasimowicz, J.; Welsch, C.P. Faraday cup for Low-Energy, Low-intensity Beam Measurements at the USR. In Proceedings of the Beam Instrumentation Workshop, Santa Fe, NW, USA, 2–6 May 2010. [Google Scholar]
- Brown, D.L.; Gallimore, A.D. Evaluation of ion collection area in Faraday probes. Rev. Sci. Instrum. 2010, 81, 063504. [Google Scholar] [CrossRef] [PubMed] [Green Version]
- Dannenmayer, K.; Kudrna, P.; Tichý, M.; Mazouffre, S. Measurement of plasma parameters in the far-field plume of a Hall effect thruster. Plasma Sources Sci. Technol. 2011, 20, 9. [Google Scholar] [CrossRef]
- Kim, K.-R.; Jung, M.-H.; Ra, S.J.; Lee, S.K.; Hwang, S.T. Development of an External Faraday Cup for Beam Current Measurements. J. Korean Phys. Soc. 2010, 56, 2104–2107. [Google Scholar] [CrossRef]
- Cantero, E.D.; Andreaszza, W.; Bravin, E.; Fraser, M.A.; Lanaia, D.; Sosa, A.D. Performance Tests of a short Faraday Cup designed for HIE-ISOLDE. In Proceedings of the International Particle Accelerator Conference, New Orleans, LA, USA, 20–25 May 2012. [Google Scholar]
- Bol, A.; Leleux, P.; Lipnik, P.; Macq, P.; Ninane, A. A novel design for a fast intense neutron beam. In Nuclear Instruments and Methods in Physics Research; Elsevier Science: Amsterdam, The Netherlands, 1983; Volume 214. [Google Scholar]
- Miller, J.S.; Pullins, S.H.; Levandier, D.J.; Chiu, Y.R. Xenon charge exchange cross sections for electrostatic thruster models. J. Appl. Phys. 2002, 91, 984–991. [Google Scholar] [CrossRef]
- Grys, K.; Tilley, D.; Aadland, R. BPT Hall Thruster Plume Characterisitcs. In Proceedings of the 35th Joint Propulsion Conference and Exhibits, Los Angeles, CA, USA, 20–24 June 1999. [Google Scholar]
- Hofer, R.R.; Walker, M.L.R.; Gallimore, A.D. A Comparison of Nude and Collimated Faraday Probes for Use with Hall Thrusters. In Proceedings of the 27th International Electric Propulsion Conference, Pasadena, CA, USA, 15–19 October 2001. [Google Scholar]
- Brown, D.L.; Gallimore, A.D. Evaluation of facility effects on ion migration in a Hall thruster plume. J. Propul. Power 2011, 27, 573–585. [Google Scholar] [CrossRef]
- Hallouin, T.; Mazouffre, S. Far-Field Plume Characterization of a 100-W Class Hall Thruster. Aerospace 2020, 7, 58. [Google Scholar] [CrossRef]
- Humphries, S. Intense ion-beam neutralization in free space. Appl. Phys. Lett. Am. Inst. Phys. 1978, 32, 792–794. [Google Scholar] [CrossRef]
- Goebel, D.M.; Katz, I. Fundamentals of Electric Propulsion: Ion and Hall Thrusters; Jet Propulsion Laboratory, California Institute of Technology: Passadena, CA, USA, 2008; p. 493. [Google Scholar]
- Zhurin, V.V.; Kaufman, H.R.; Robinson, R.S. Physics of closed drift thrusters. Plasma Sources Sci. Technol. 1999, 8, R1. [Google Scholar] [CrossRef]
- Mazouffre, S.; Bourgeois, G.; Dannenmayer, K.; Lejeune, A. Ionization and acceleration processes in a small, variable channel width, permanent-magnet Hall thruster. J. Phys. D Appl. Phys. 2012, 45, 185203. [Google Scholar] [CrossRef]
- Sankovic, J.M.; Hamley, J.A.; Haag, T.W. Performance Evaluation of the SPT-100 Thruster at NASA LeRC. In Proceedings of the 23rd International Electric Propulsion Conference, Seattle, WA, USA, 13–16 September 1993. [Google Scholar]
- Nakles, M.R.; Hargus, W.A., Jr.; Delgado, J.J.; Corey, R.L. A Performance Comparison of Xenon and Krypton. In Proceedings of the 32nd International Electric Propulsion Conference, Wiesbaden, Germany, 11–15 September 2011. [Google Scholar]
- Potrivitu, G.-C.; Joussot, R.; Mazouffre, S. Anode position influence on discharge modes of a LaB6 cathode in diode configuration. Vacuum 2018, 151, 122–132. [Google Scholar] [CrossRef]
- Bulit, A.; Luna, J.; Ámo, J.D.; Lotz, B.; Feili, D.; Leiter, H. Field-Emission-Electric-Propulsion (FEEP) plasma modeling: 3-D full particle simulations. In Proceedings of the 35th AIAA/ASME/SAE/ASEE Joint Propulsion Conference and Exhibit, San Jose, CA, USA, 15–17 July 1999. [Google Scholar]
- Passaro, A.; Vicini, A.; Biagioni, L. Plasma Thruster Plume Simulation: Effect of Vacuum Chamber Environment. In Proceedings of the 35th AIAA Plasmadynamics and Lasers Conference, Portland, OR, USA, 28 June–1 July 2004. [Google Scholar]
- Randolph, T.; Kim, V.; Kaufman, H.; Kozubsky, K.; Zhurin, V.; Day, M. Facility effects on stationnary plasma thruster testing. In Proceedings of the 23rd International Electric Propulsion Conference, Seattle, WA, USA, 13–16 September 1993. [Google Scholar]
- Bulit, A.; Luna, J.; Ámo, J.D.; Lotz, B.; Feili, D.; Leiter, H. Experimental Investigations on the Influence of the Facility Background Pressure on the Plume of the RIT-4 Ion Engine. In Proceedings of the 32nd International Electric Propulsion Conference, Wiesbaden, Germany, 11–15 September 2011. [Google Scholar]
- Wang, J.; Brinza, D.E.; Polk, J.E.; Henry, M.D. Deep Space One Investiations of Ion Propulsion Plasma Environment: Initial Results. In Proceedings of the 26th International Electric Propulsion Conference, Kitakyushu, Japan, 17–19 October 1999. [Google Scholar]
- Bondar, E.A.; Schweigert, V.A.; Markelov, G.N.; Ivanov, M.S. Assessment of CEX ion backflow of SPT-100 thruster. In Proceedings of the Rarefied Gas Dynamic, 22nd International Symposium, Sydney, Australia, 1 October 2001. [Google Scholar]
- Tajmar, M.; Gonzalez, J.; Hilgers, A. Modeling of Spacecraft-Environment Interactions on SMART-1. J. Spacecr. Rocket. 2001, 38, 393–399. [Google Scholar] [CrossRef]
- Tajmar, M.; Scharlemann, C.; Genovese, A.; Buldrini, N.; Steiger, W.; Vasiljevich, I. Liquid-metal-ion source development for space propulsion at ARC. Ultramicroscopy 2009, 109, 442–446. [Google Scholar] [CrossRef] [PubMed]
- Ye, M.; He, Y.; Hu, S.; Wang, R.; Hu, T.C.; Yang, J.; Cui, W.X.Z. Suppression of secondary electron yield by micro-porous array structure. J. Appl. Phys. 2013, 113, 074904. [Google Scholar]
- Swanson, C.; Kaganovich, I. Modeling of reduced secondary electron emission yield from a foam or fuzz surface. J. Appl. Phys. 2018, 123, 023302. [Google Scholar] [CrossRef] [Green Version]
- Huerta, C.; Patino, M.I.; Wirz, R.E. Secondary electron emission from textured surfaces. J. Phys. D Appl. Phys. 2018, 51, 145202. [Google Scholar] [CrossRef]
- Ottaviano, A.; Banerjee, S.; Raitses, Y. A rapid technique for the determination of secondary electron emission yield from complex surfaces. J. Appl. Phys. 2019, 126, 223301. [Google Scholar] [CrossRef]
- Huerta, E.; Wirz, E. Ion-induced electron emission reduction via complex surface trapping. AIP Adv. 2019, 9, 125009. [Google Scholar] [CrossRef]
- Grimaud, L.; Vaudolon, J.; Mazouffre, S. Design and characterization of a 200W Hall thruster in magnetic shielding configuration. In Proceedings of the American Institute of Aeronautics and Astronautics, Salt Lake City, UT, USA, 25–27 July 2016. [Google Scholar]
- Benilov, M.S. The Child—Langmuir law and analytical theory of collisionless to collision-dominated sheath. Plasma Sources Sci. Technol. 2008, 18, 14. [Google Scholar] [CrossRef]
- Petry, R.L. Critical potentials in secondary electorn emission from Iron, Nickel and Molybdenum. Phys. Rev. 1925, 26, 346. [Google Scholar] [CrossRef]
- Kishinevsky, L. Estimation of electron potential emission yield dependence on metal and ion parameters. Radiat. Eff. Inc. Plasma Sci. Plasma Technol. 1973, 19, 23–27. [Google Scholar] [CrossRef]
- Laktis, G.; Aumayr, F.; Winter, H. Statistics of ion-induced electron emission from a clean metal surface. Rev. Sci. Instrum. 1989, 60, 3151–3159. [Google Scholar] [CrossRef]
- Laktis, G.; Aumayr, F.; Winter, H. Threshold of ion-induced kinetic electron emission from a clean metal surface. Phys. Rev. A 1990, 42, 5780. [Google Scholar] [CrossRef]
- Hasselkamp, D. Kinetic electron emission from solid surfaces under ion bombardment. Part. Induc. Electron. Emiss. II 1992, 123, 1–195. [Google Scholar]
- Farhang, H.; Napchant, E.; Blott, B. Electron backscattering and secondary electron emission from carbon targets. J. Phys. D Appl. Phys. 1993, 26, 2266–2271. [Google Scholar] [CrossRef]
- Taccogna, F.; Longo, S.; Capitelli, M. Plasma-surface interaction model with secondary electron emission effects. Phys. Plasma 2004, 11, 1220–1228. [Google Scholar] [CrossRef]
- Ziegler, J.F.; Biersack, J.P.; Ziegler, M.D. SRIM-The Stopping and Range of Ions in Matter, 7th ed.; SRIM Co.: Morrisville, NC, USA, 2008. [Google Scholar]
- Dannenmayer, K.; Mazouffre, S. Electron flow properties in the far-field plume of a Hall thruster. Plasma Sources Sci. Technol. 2013, 22, 4. [Google Scholar] [CrossRef]
- Hugonnaud, V.; Mazouffre, S.; Krejci, D.; Scharlemann, C.; Seifert, B. Faraday cup design for low power electric thrusters. In Proceedings of the 7th Space Propulsion Conference, Estoril, Portugal, 8–12 February 2021. [Google Scholar]
- Hofer, R.R.; Gallimore, A.D. High-Specific Impulse Hall Thrusters, Part 2: Efficiency Analysis. J. Propuls. Power 2006, 22, 732–740. [Google Scholar] [CrossRef] [Green Version]
- Dannenmayer, K.; Mazouffre, S. Elementary scaling relations for Hall effect thrusters. J. Propuls. Power 2011, 27, 236–245. [Google Scholar] [CrossRef]
- Hoffer, R.R.; Jankovsky, R. A Hall thruster performance model incorporating the effects of a multiply-charged plasma. In Proceedings of the 37th Joint Propulsion Conference and Exhibit, Salt Lake City, UT, USA, 8–11 July 2001. [Google Scholar]
- Vaudolon, J.; Mazouffre, S. Impact of the magnetic barrier extent on the performance of a krypton-fuelled Hall thruster. In Proceedings of the 51st AIAA/SAE/ASEE Joint Propulsion Conference, Orlando, FL, USA, 27–29 July 2015. [Google Scholar]
- Walker, M.L.R.; Victor, A.L.; Hofer, R.R.; Gallimore, A.D. Effect of Backpressure on Ion current density Measurements in Hall Thruster Plumes. J. Propuls. Power 2005, 21, 408–415. [Google Scholar] [CrossRef] [Green Version]
- Mazouffre, S.; Kualev, V.; Luna, J.P. Ion diagnostics of a discharge in crossed electric and magnetic fields for electric propulsion. Plasma Sources Sci. Technol. 2009, 18, 034022. [Google Scholar] [CrossRef]
- Habl, L.; Rafalskyi, D.; Lafleur, T. Ion beam diagnostic for the assessment of miniaturized electric propulsion systems. Rev. Sci. Instrum. 2020, 91, 093501. [Google Scholar] [CrossRef] [PubMed]
- Dahl, D.A. SIMION for the personal computer in reflection. Int. J. Mass Spectrom. 2000, 200, 3–25. [Google Scholar] [CrossRef]
- Keerl, S.; Engel, W.; Mühlich, N.S.; Fries, J.; Seifert, B. Two-dimensional plasma plume density characterisation of the IFM Nano Thruster. In Proceedings of the 36th International Electric Propulsion Conference, Vienna, Austria, 15–20 September 2019. [Google Scholar]
Figure 1.
Schematic (not to scale) of the experimental set-up for fare-field plume measurements of the ISCT200 Hall Thruster. The probe is aligned with the thruster centerline at 0°.
Figure 1.
Schematic (not to scale) of the experimental set-up for fare-field plume measurements of the ISCT200 Hall Thruster. The probe is aligned with the thruster centerline at 0°.

Figure 2.
Front view of the ISCT200 firing with xenon. The 5-A cathode is located above the thruster body.
Figure 2.
Front view of the ISCT200 firing with xenon. The 5-A cathode is located above the thruster body.

Figure 3.
Discharge current oscillation when the thruster fires at 0.66 A, 200 V (blue) and 250 V (red). For both curves, the standard deviation () and uncertainty averaged () over the whole data sample is given.
Figure 3.
Discharge current oscillation when the thruster fires at 0.66 A, 200 V (blue) and 250 V (red). For both curves, the standard deviation () and uncertainty averaged () over the whole data sample is given.

Figure 4.
Scheme showing the 5 main parts of a Faraday Cup.

Figure 5.
Cross section view showing the main components of the Faraday cup, collimator geometries and materials used in this study.
Figure 5.
Cross section view showing the main components of the Faraday cup, collimator geometries and materials used in this study.

Figure 6.
Schematic of three physical mechanism occurring on different FC parts which can lead to measurement perturbation. The arrows have arbitrary length and direction.
Figure 6.
Schematic of three physical mechanism occurring on different FC parts which can lead to measurement perturbation. The arrows have arbitrary length and direction.

Figure 7.
Cylindrical coordinate system used to express the current density . The latter is constant on a ring of radius y and thickness .
Figure 7.
Cylindrical coordinate system used to express the current density . The latter is constant on a ring of radius y and thickness .

Figure 8.
I–V characterization at different of the ISCT200 firing at 250 V, 0.66 A with 0.765 mg/s of anode mass flow rate. The measurements are conducted 27.4 cm from the thruster.
Figure 8.
I–V characterization at different of the ISCT200 firing at 250 V, 0.66 A with 0.765 mg/s of anode mass flow rate. The measurements are conducted 27.4 cm from the thruster.

Figure 9.
On-axis ( = 0°) I–V curves I = 0.66 A, U = 200 V (top) and 250 V (bottom). Faraday cup is in G.10.E (blue) and Mo.10.E (red) configuration.
Figure 9.
On-axis ( = 0°) I–V curves I = 0.66 A, U = 200 V (top) and 250 V (bottom). Faraday cup is in G.10.E (blue) and Mo.10.E (red) configuration.

Figure 10.
Current and propellant use obtained from profile with designs G.10.E and Mo.10.E.

Figure 11.
On-axis I-0V curves obtained at 200 V and 250 V and with different collimator diameters (I = 0.66 A). FC are equipped with a grounded graphite collimator. Configurations used are G.01.E, G.03.E, G.05.E, G.07.E and G.10.E.
Figure 11.
On-axis I-0V curves obtained at 200 V and 250 V and with different collimator diameters (I = 0.66 A). FC are equipped with a grounded graphite collimator. Configurations used are G.01.E, G.03.E, G.05.E, G.07.E and G.10.E.

Figure 12.
Evolution of the current density rate of change with collimator reduction factor. Faraday cup is 50 mm long with a Foam collector. It is equipped with a grounded graphite collimator. Hall thruster is operated at 250 V and 0.66 A.
Figure 12.
Evolution of the current density rate of change with collimator reduction factor. Faraday cup is 50 mm long with a Foam collector. It is equipped with a grounded graphite collimator. Hall thruster is operated at 250 V and 0.66 A.

Figure 13.
Current density angular distribution measured with different collimator diameters (G.10.E, G.07.E, G.05.E, G.03.E). The thruster fires at 0.66 A, 200 V (a) and 250 V (b). Profiles are displayed with a linear (top) and logarithmic (bottom) scale. Numbers refer to the different zones.
Figure 13.
Current density angular distribution measured with different collimator diameters (G.10.E, G.07.E, G.05.E, G.03.E). The thruster fires at 0.66 A, 200 V (a) and 250 V (b). Profiles are displayed with a linear (top) and logarithmic (bottom) scale. Numbers refer to the different zones.

Figure 14.
Current density angular profile with (G.05.E) and without (Al.05.P) exposure to the plasma beam. The thruster fires at 0.66 A, 200 V (a) and 250 V (b). Profiles are displayed with a linear (top) and logarithmic (bottom) scale.
Figure 14.
Current density angular profile with (G.05.E) and without (Al.05.P) exposure to the plasma beam. The thruster fires at 0.66 A, 200 V (a) and 250 V (b). Profiles are displayed with a linear (top) and logarithmic (bottom) scale.

Figure 15.
On-axis I–V curves with the collimator unexposed (Al.05.P) to the plasma beam for different collimator potentials (V). The thruster fires at 0.66 A and 250 V.
Figure 15.
On-axis I–V curves with the collimator unexposed (Al.05.P) to the plasma beam for different collimator potentials (V). The thruster fires at 0.66 A and 250 V.

Figure 16.
On-axis I–V curves acquired with design Al.05.P. A voltage sweep is applied to the collimator electrode while the collector is grounded. Thruster parameters are 250 V, 0.66 A, = 0.802 mg/s.
Figure 16.
On-axis I–V curves acquired with design Al.05.P. A voltage sweep is applied to the collimator electrode while the collector is grounded. Thruster parameters are 250 V, 0.66 A, = 0.802 mg/s.

Figure 17.
Current density angular profile without exposure to the plasma beam (Al.05.P configuration) for different collimator potentials. The thruster fires at 0.66 A, 200 V (a) and 250 V (b). Profiles are displayed with a linear (top) and logarithmic (bottom) scale.
Figure 17.
Current density angular profile without exposure to the plasma beam (Al.05.P configuration) for different collimator potentials. The thruster fires at 0.66 A, 200 V (a) and 250 V (b). Profiles are displayed with a linear (top) and logarithmic (bottom) scale.

Figure 18.
Carbon (top) and molybdenum (bottom) sputtering yields and threshold value for 250 eV Xe ions computed with the SRIM software.
Figure 18.
Carbon (top) and molybdenum (bottom) sputtering yields and threshold value for 250 eV Xe ions computed with the SRIM software.

Figure 19.
Xenon ions energy losses per angstroms to carbon (top) and molybdenum (bottom) targets computed with the SRIM software.
Figure 19.
Xenon ions energy losses per angstroms to carbon (top) and molybdenum (bottom) targets computed with the SRIM software.

Figure 20.
Evolution of the current utilization (top), propellant utilization (middle) and divergence angle (bottom) computed from current density distributions obtained with different inlet apertures. Hall thruster is operated at 200 V (blue), 250 V (red) and 0.66 A.
Figure 20.
Evolution of the current utilization (top), propellant utilization (middle) and divergence angle (bottom) computed from current density distributions obtained with different inlet apertures. Hall thruster is operated at 200 V (blue), 250 V (red) and 0.66 A.

Figure 21.
Field lines computed with SIMION. Configurations X.X.E (left) and X.X.P (right) with the collimator grounded (top) and at −75 V (bottom).
Figure 21.
Field lines computed with SIMION. Configurations X.X.E (left) and X.X.P (right) with the collimator grounded (top) and at −75 V (bottom).

Figure 22.
Evolution of the current use (top), propellant use (middle) and divergence angle (bottom) computed from current density distributions obtained with the collimator grounded and used as an electron screen. HT operates at 200 V and 250 V at 0.66 A.
Figure 22.
Evolution of the current use (top), propellant use (middle) and divergence angle (bottom) computed from current density distributions obtained with the collimator grounded and used as an electron screen. HT operates at 200 V and 250 V at 0.66 A.

Figure 23.
Ion simulations computed with the software SIMION. Each configuration displays the ion trajectory going through the FC. Potential is fixed at −50 V and −100 V for the collector and collimator, respectively. Ion energies are 5 eV (red), 10 eV (black), 100 eV (green) and 250 eV (blue). The probe aperture diameter is 5 mm.

Figure 24.
Ion simulations computed with the software SIMION. Each configuration displays the ion trajectory through the FC. The color code refers to different incident angles. Potential is fixed at −50 V and −100 V for the collector and collimator, respectively. Ion energies are 10 eV (top) and 250 eV (bottom).

Figure 25.
Ion simulations computed with the software SIMION. Each configuration displays the possible trajectory of ion rebounds from the lateral side of the FC. The color refers to different rebound location. The collector is at −50 V. The collimator is either grounded (top) or biased to −100 V (bottom). Ion energies are 10 eV (left) and 100 eV (right).

Figure 26.
Ion simulations computed with the software SIMION. Each configuration displays the possible trajectory of ion rebounds from the bottom of the FC. The collector is at −50 V. The collimator is either grounded (top) or biased to −100 V (bottom). Ion energies are 10 eV (black), 50 eV (red), 75 eV (green) and 100 eV (blue).


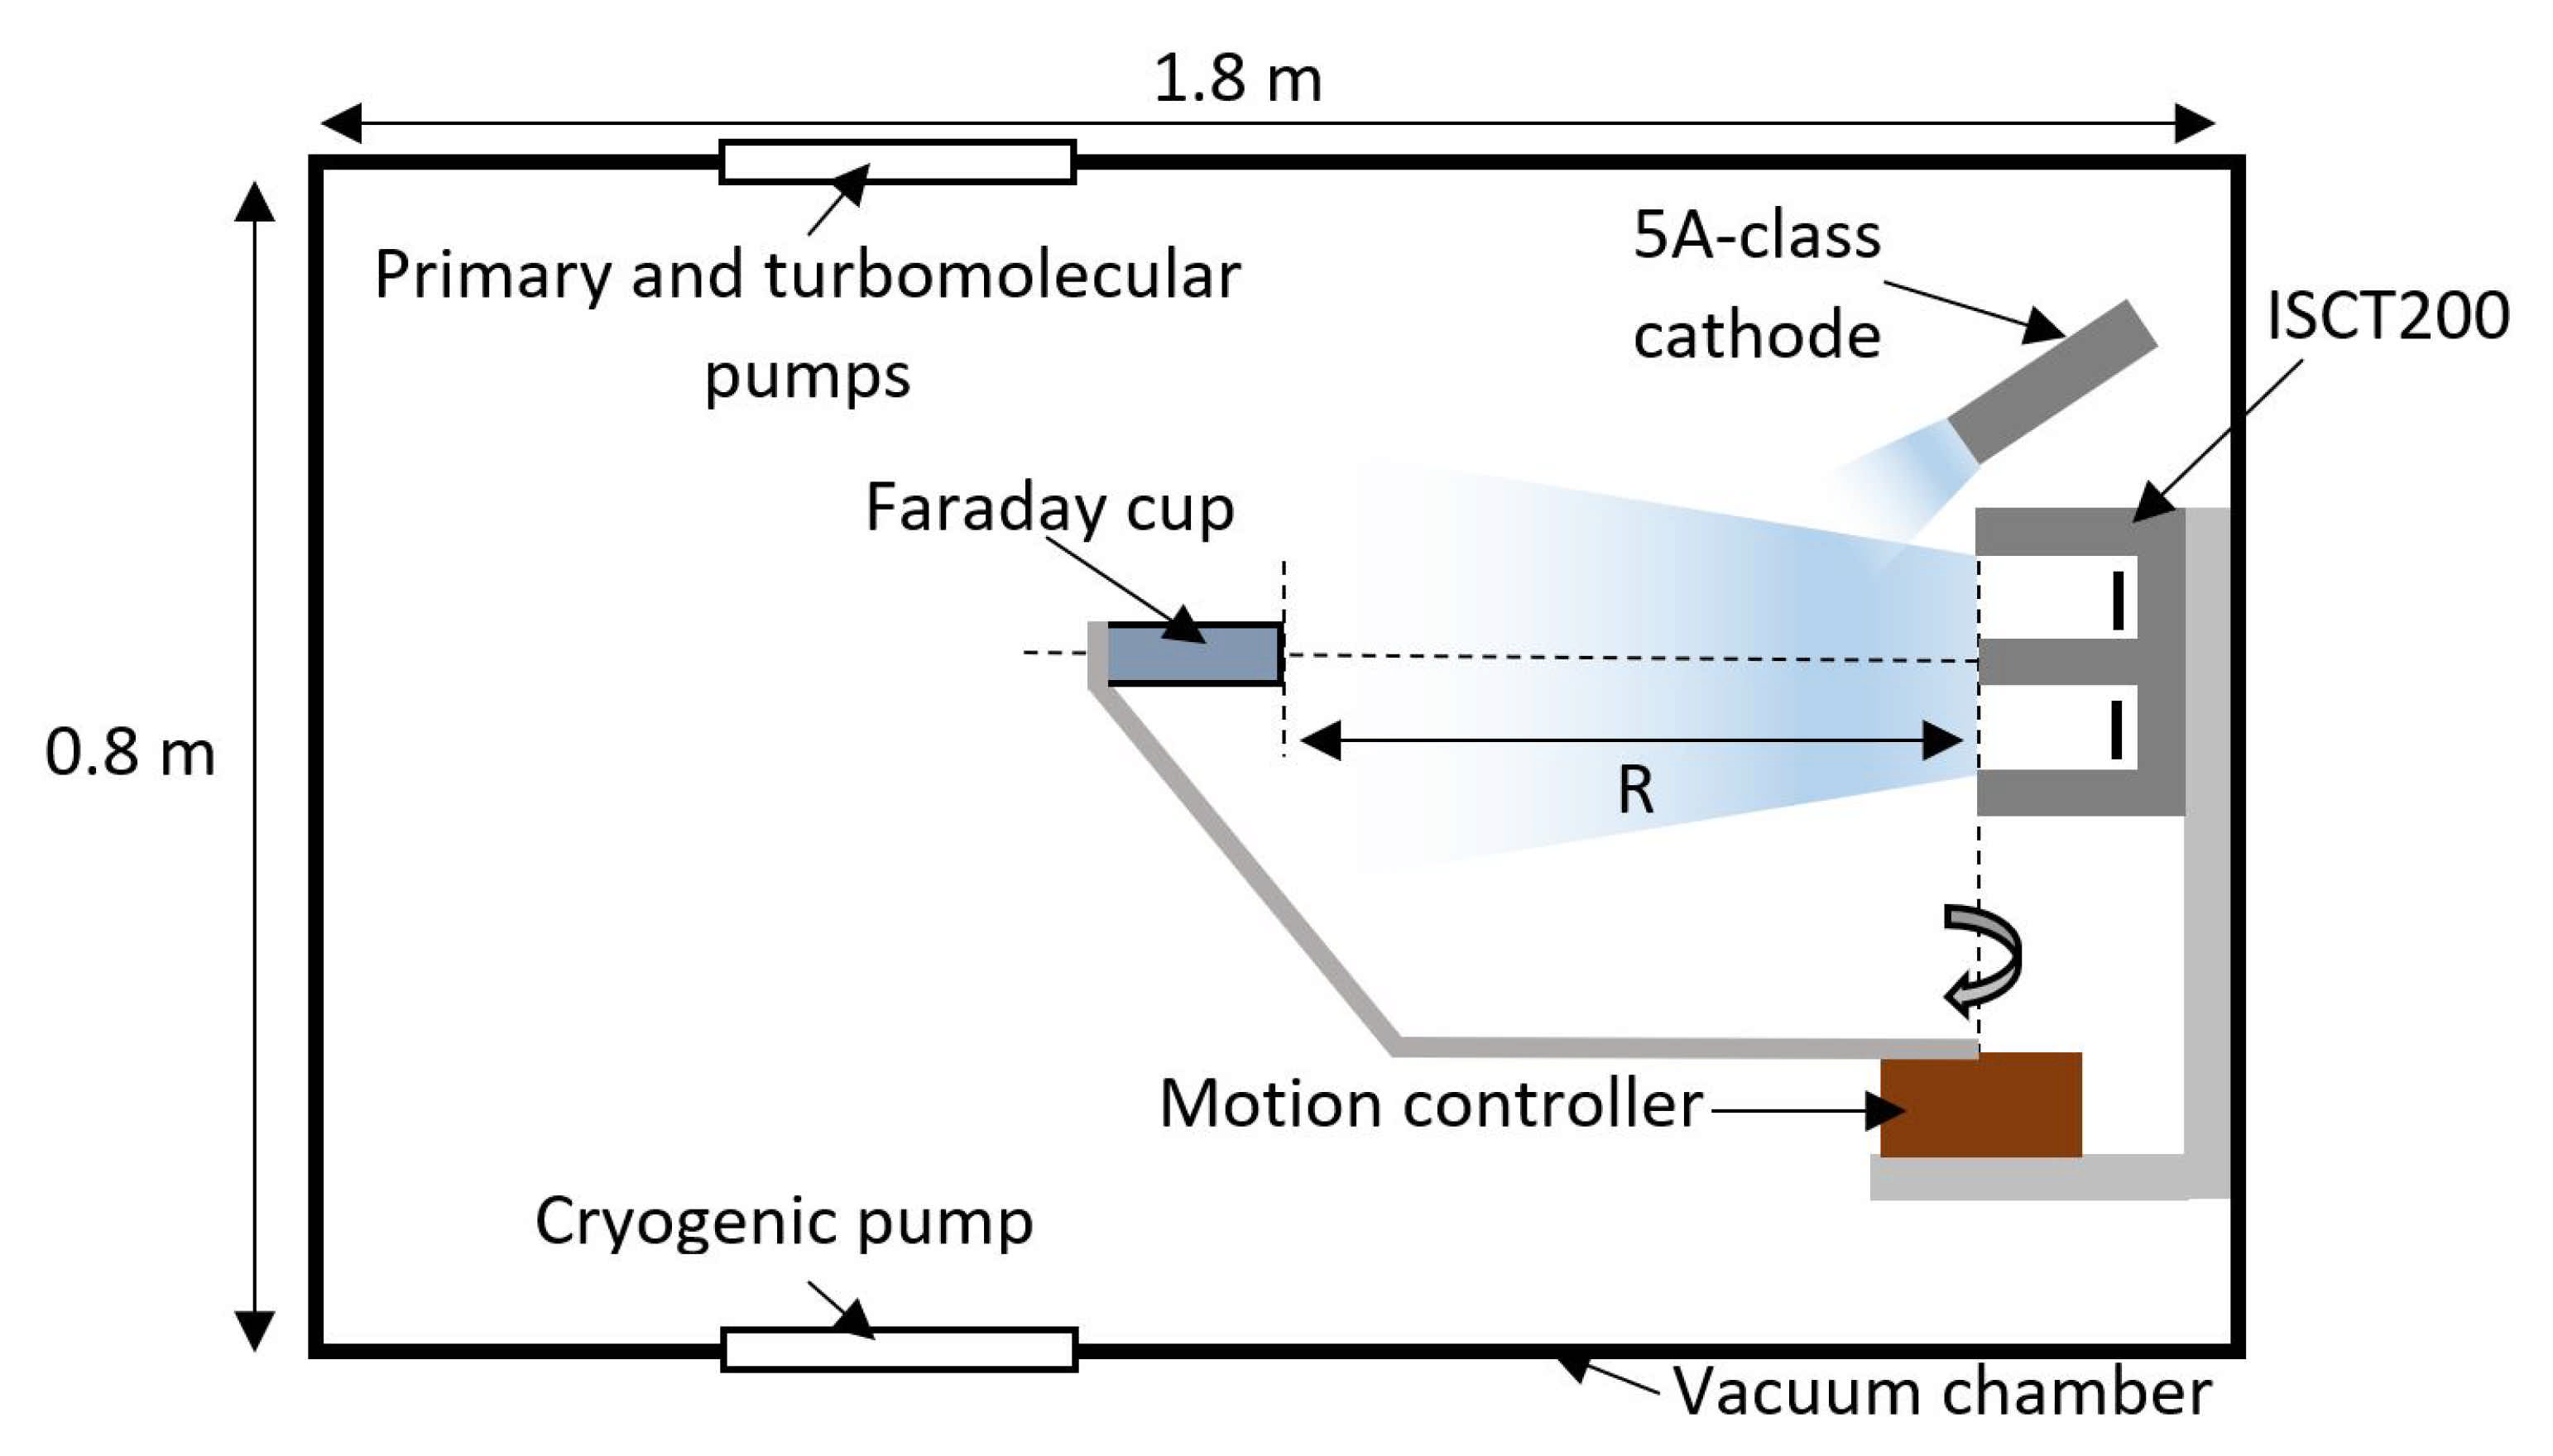
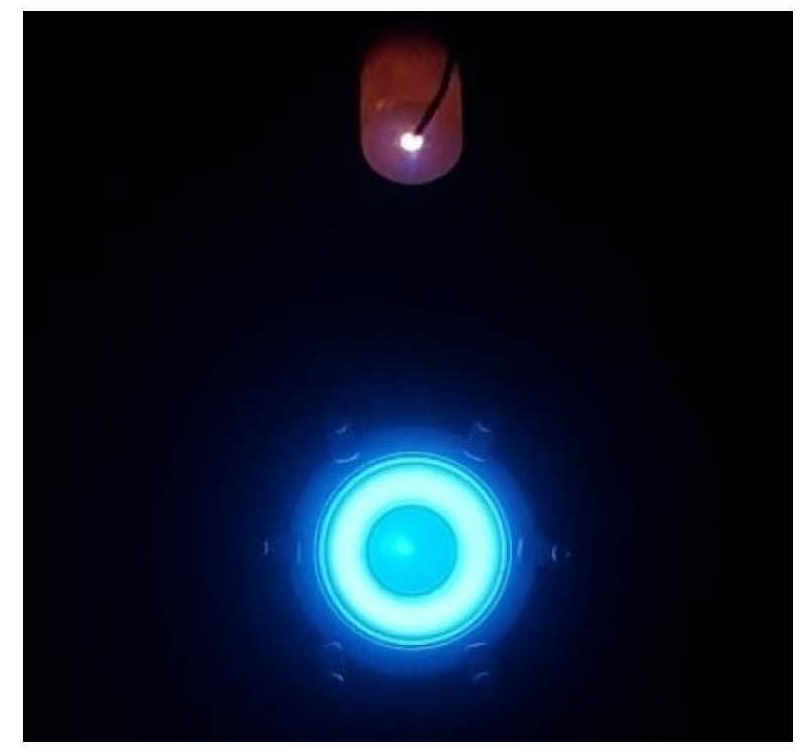
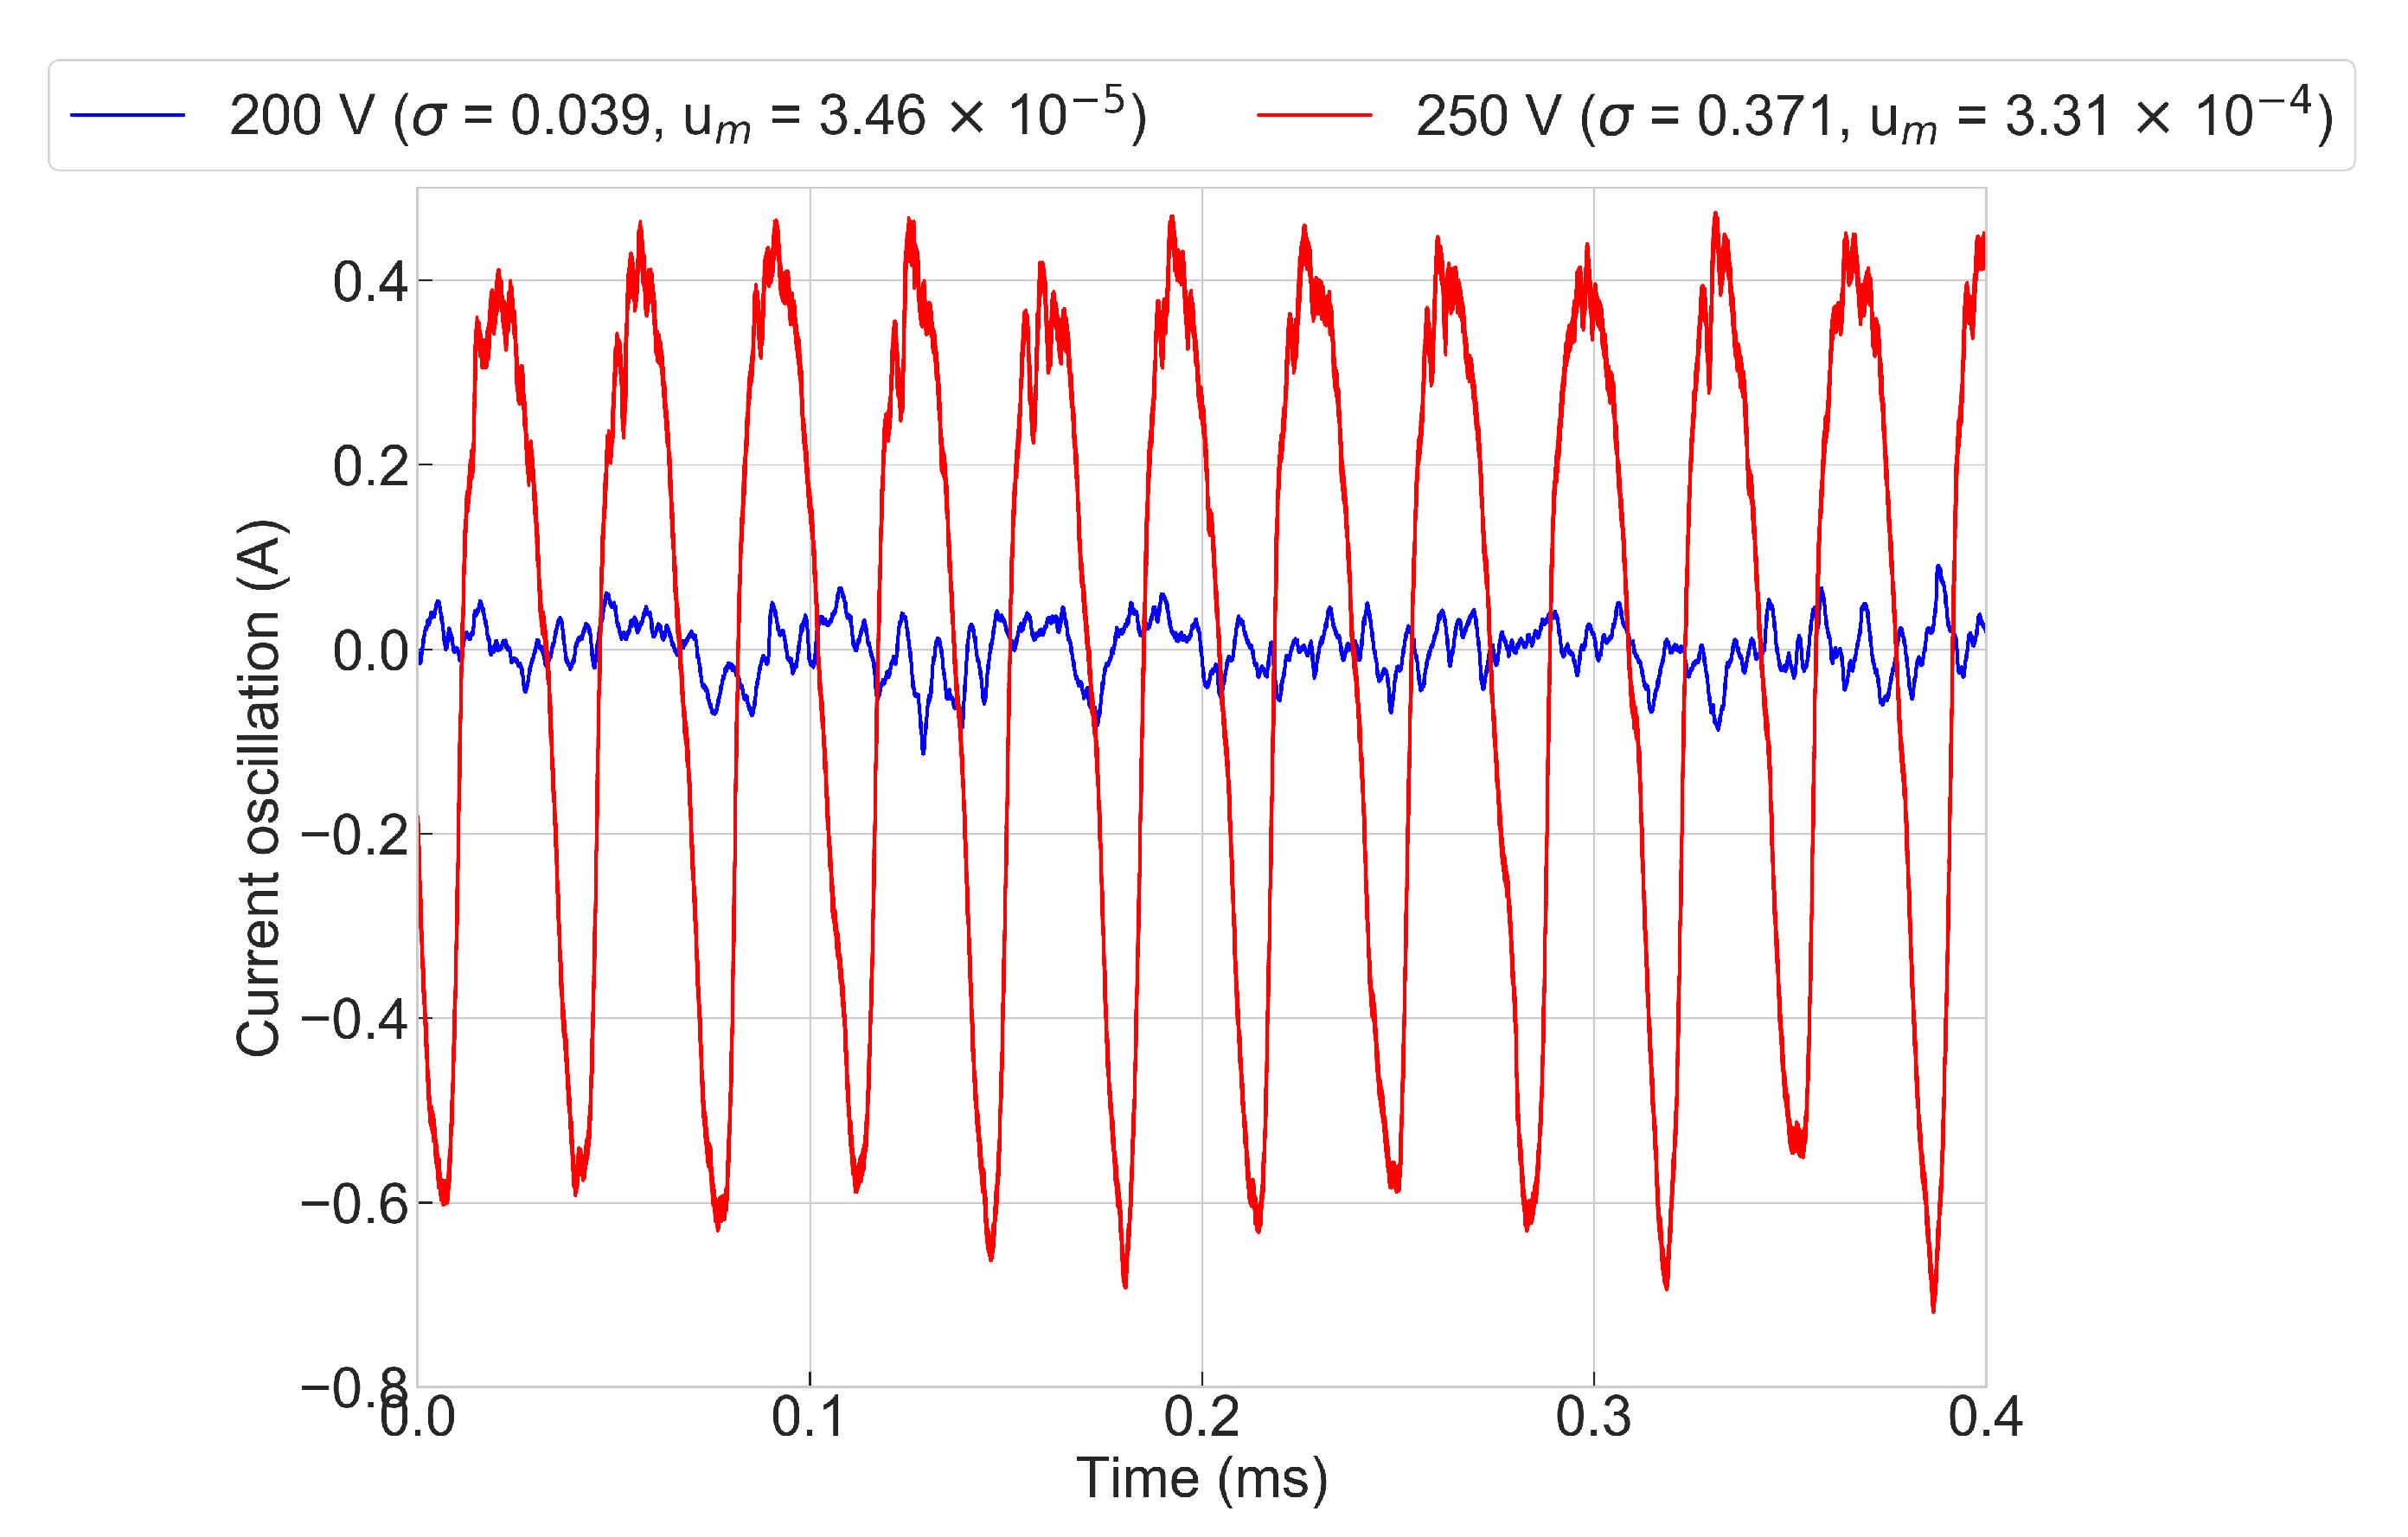
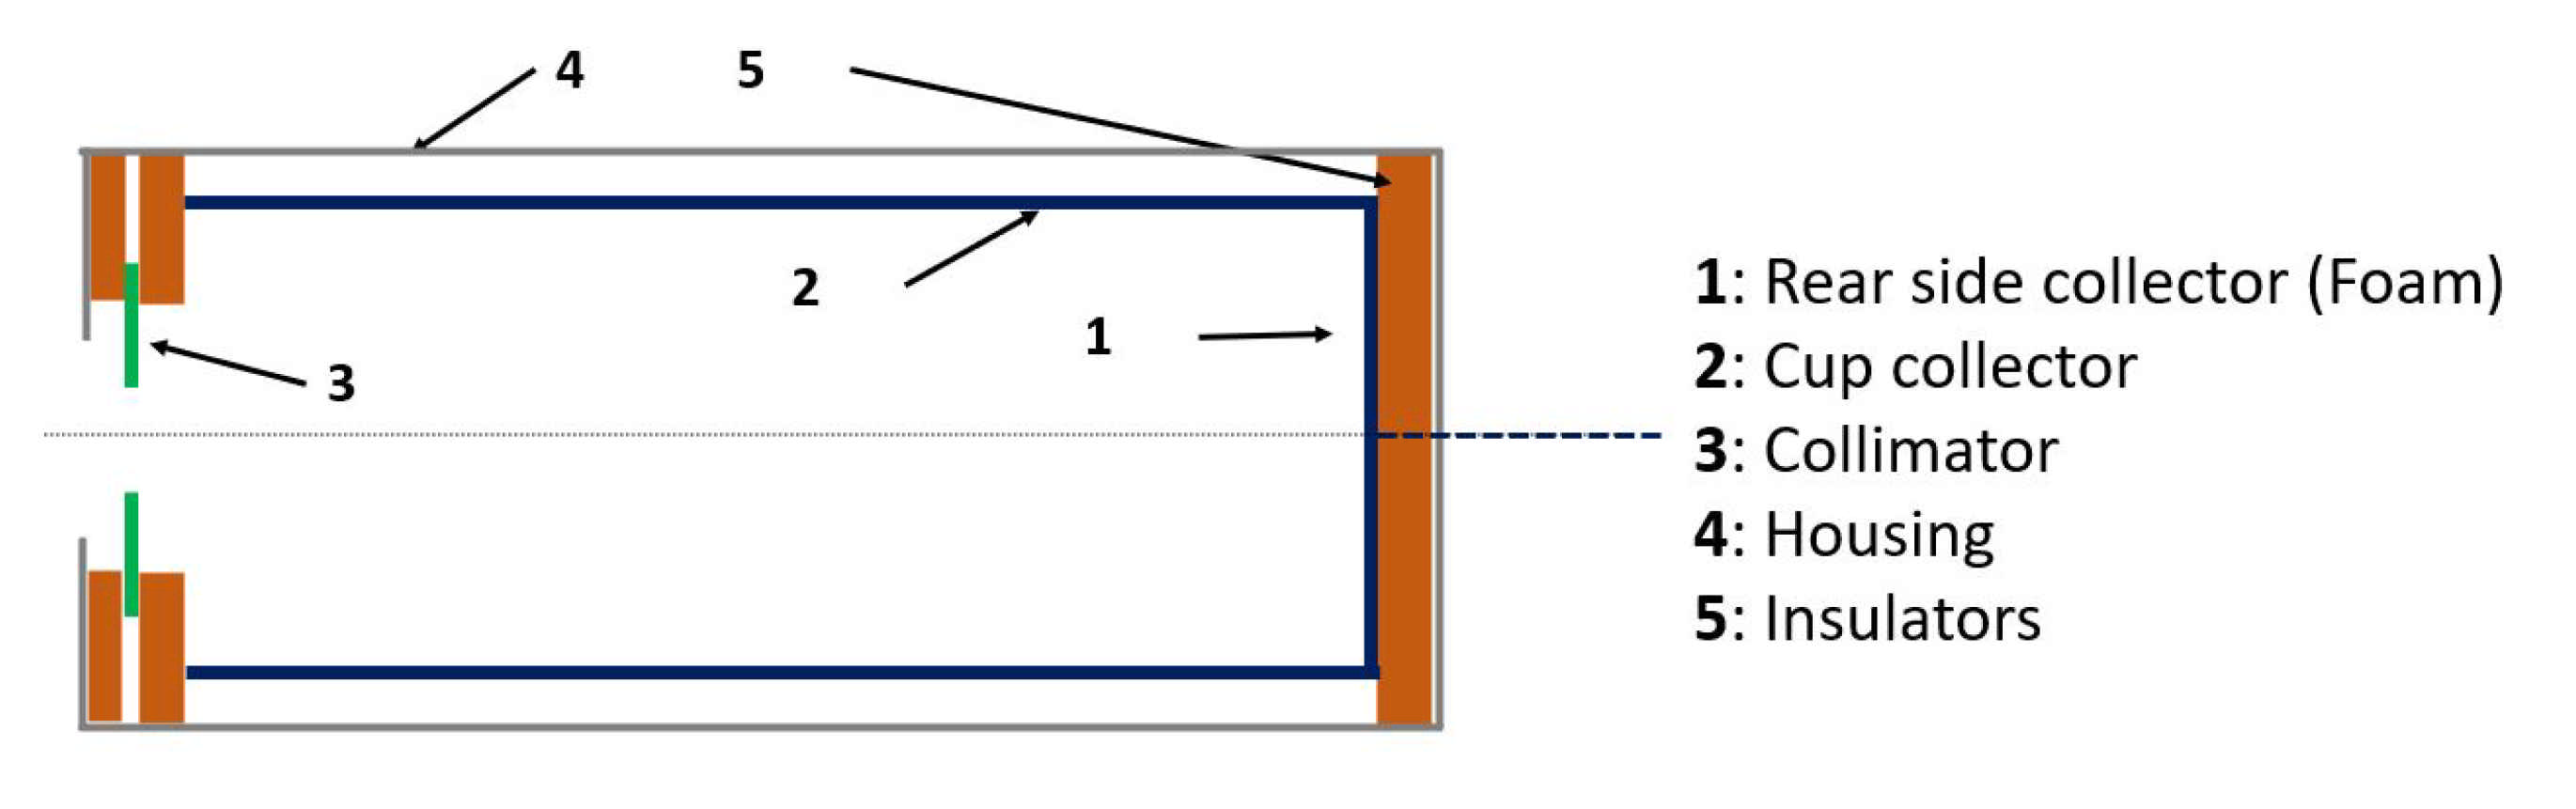
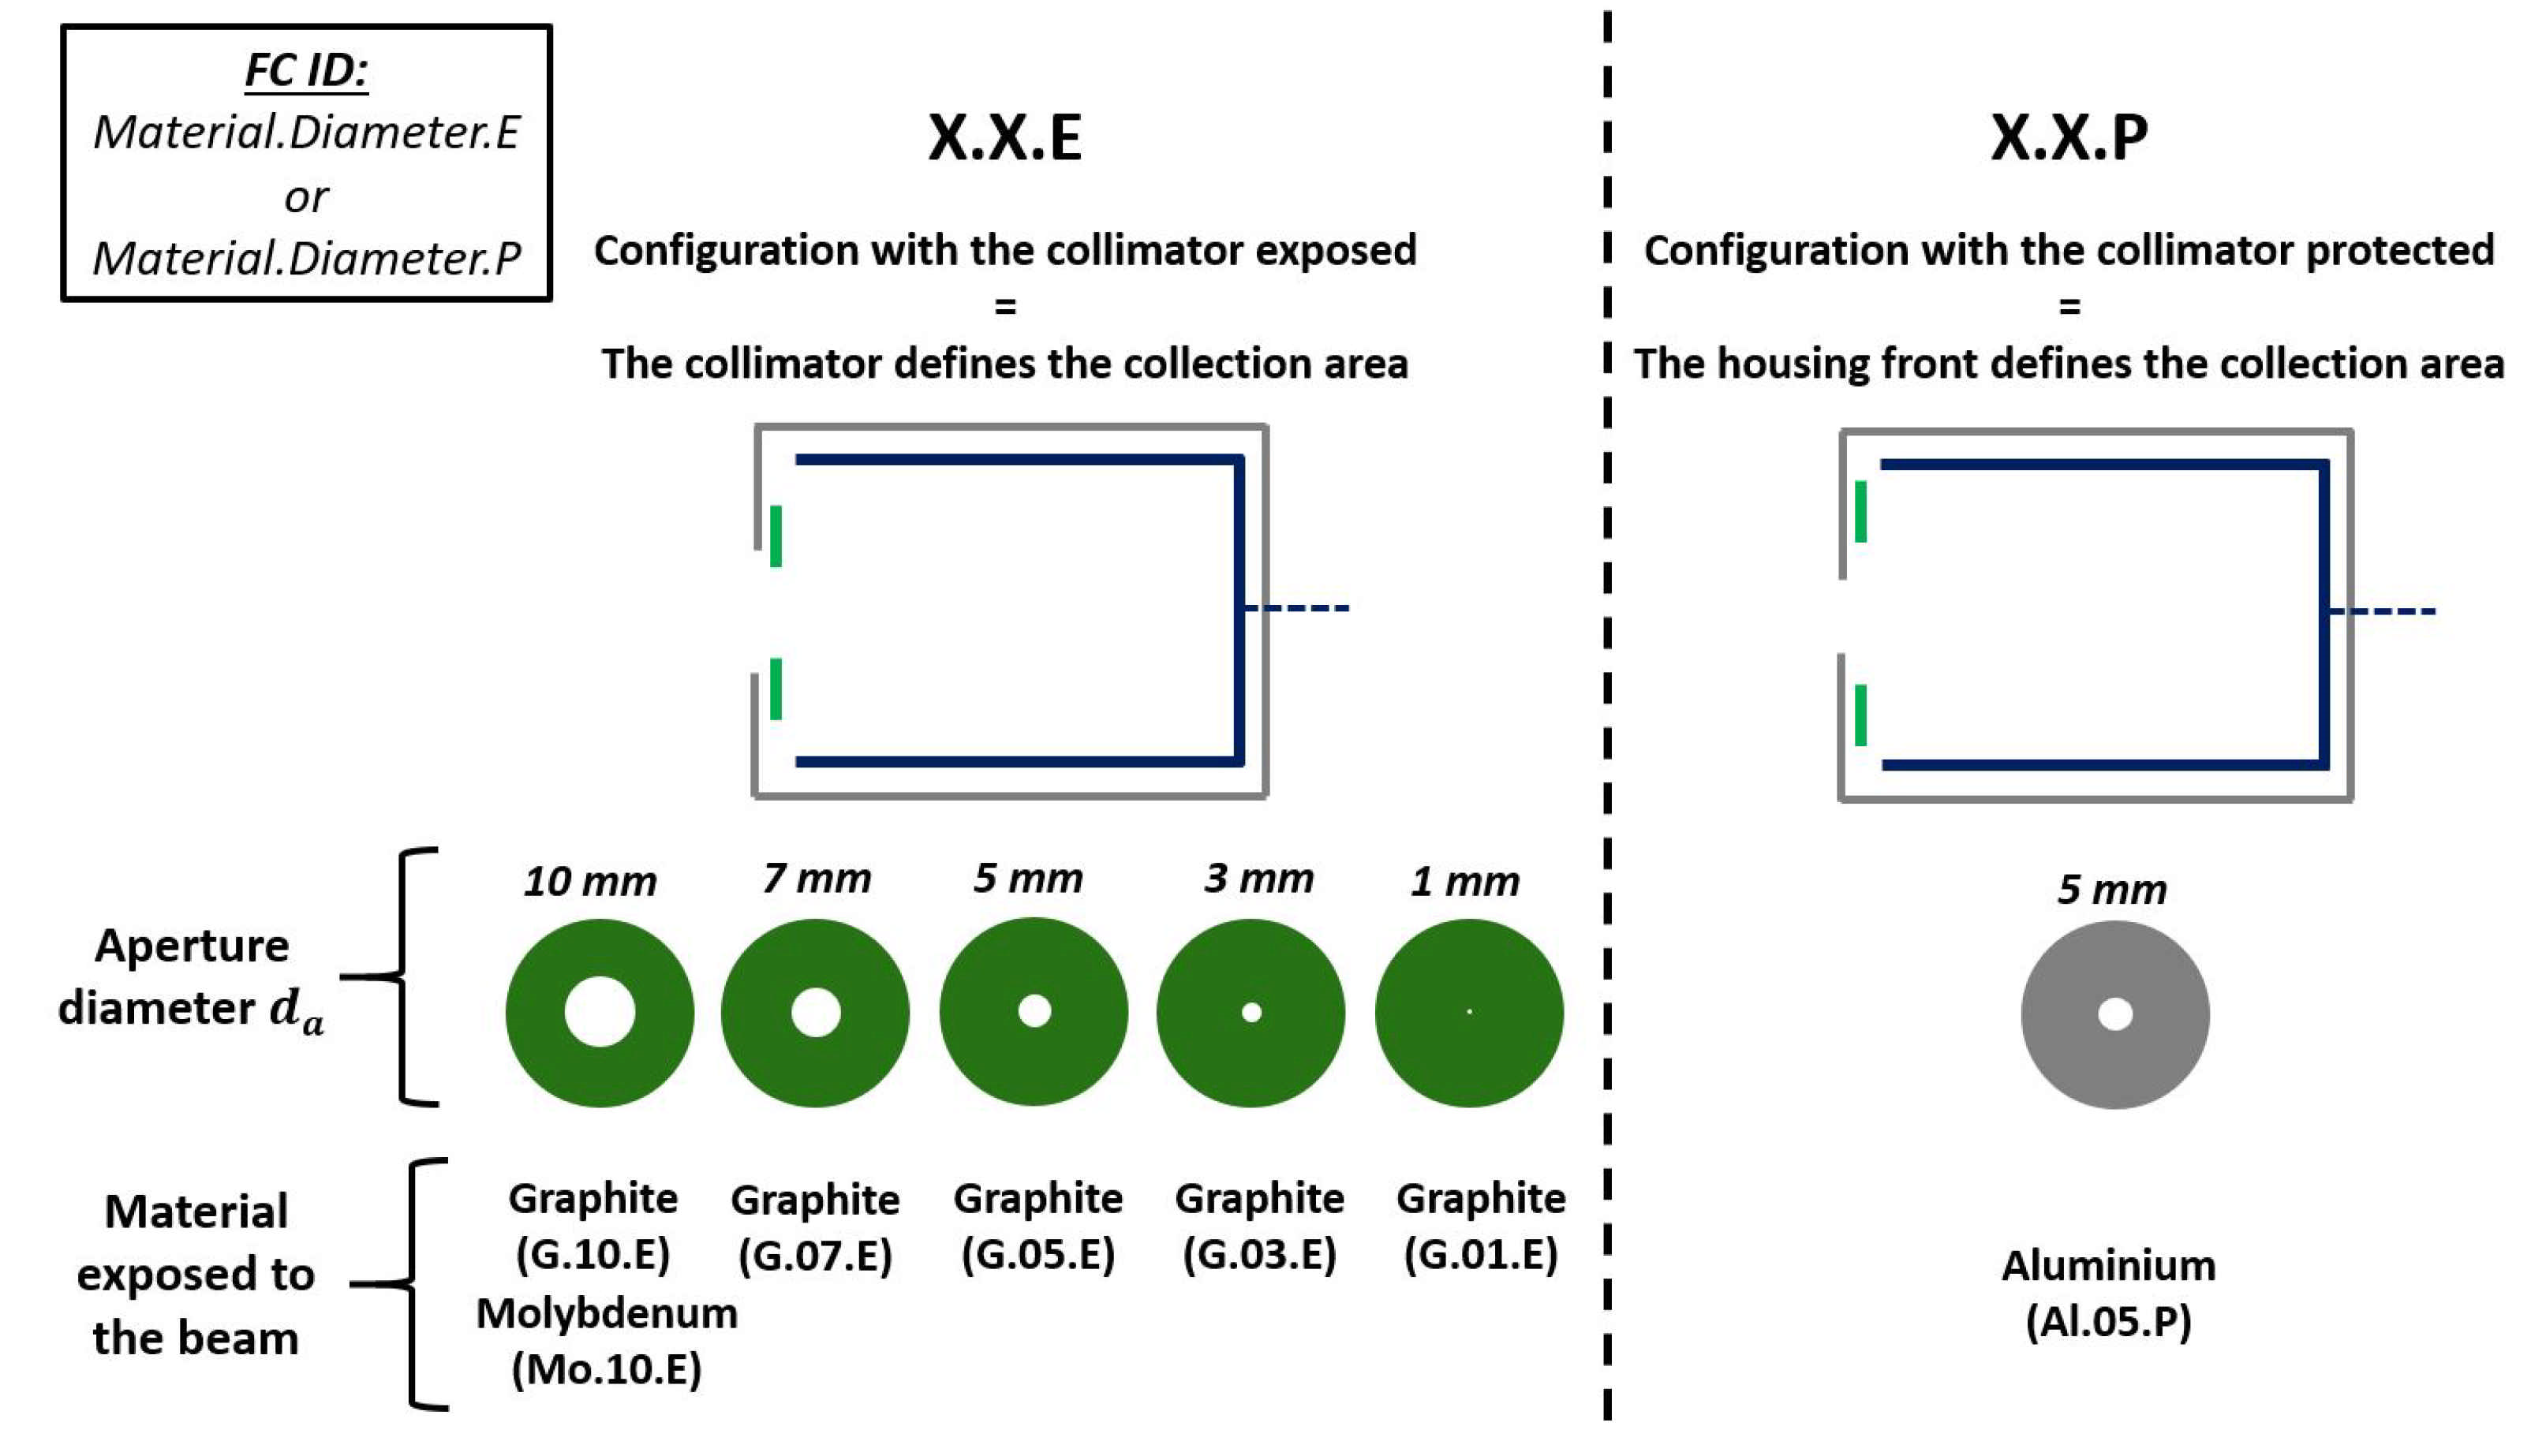
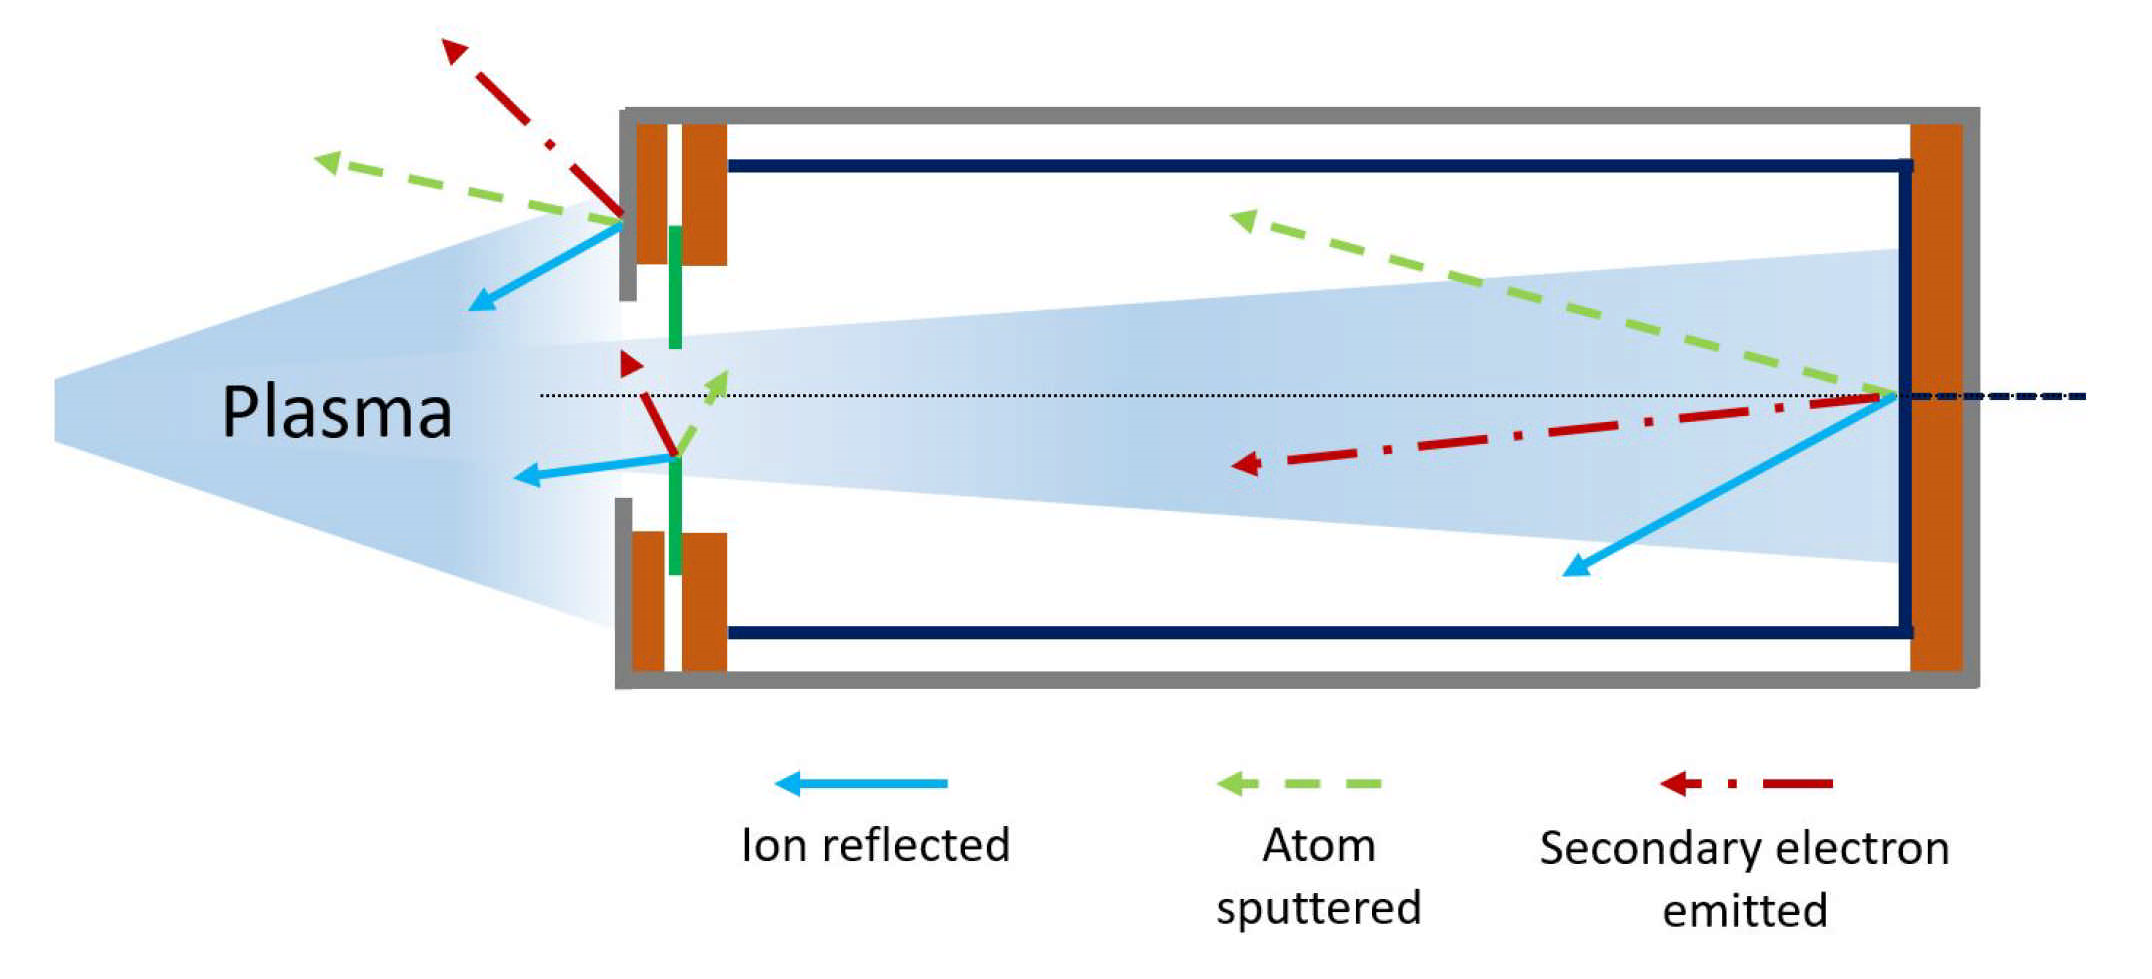
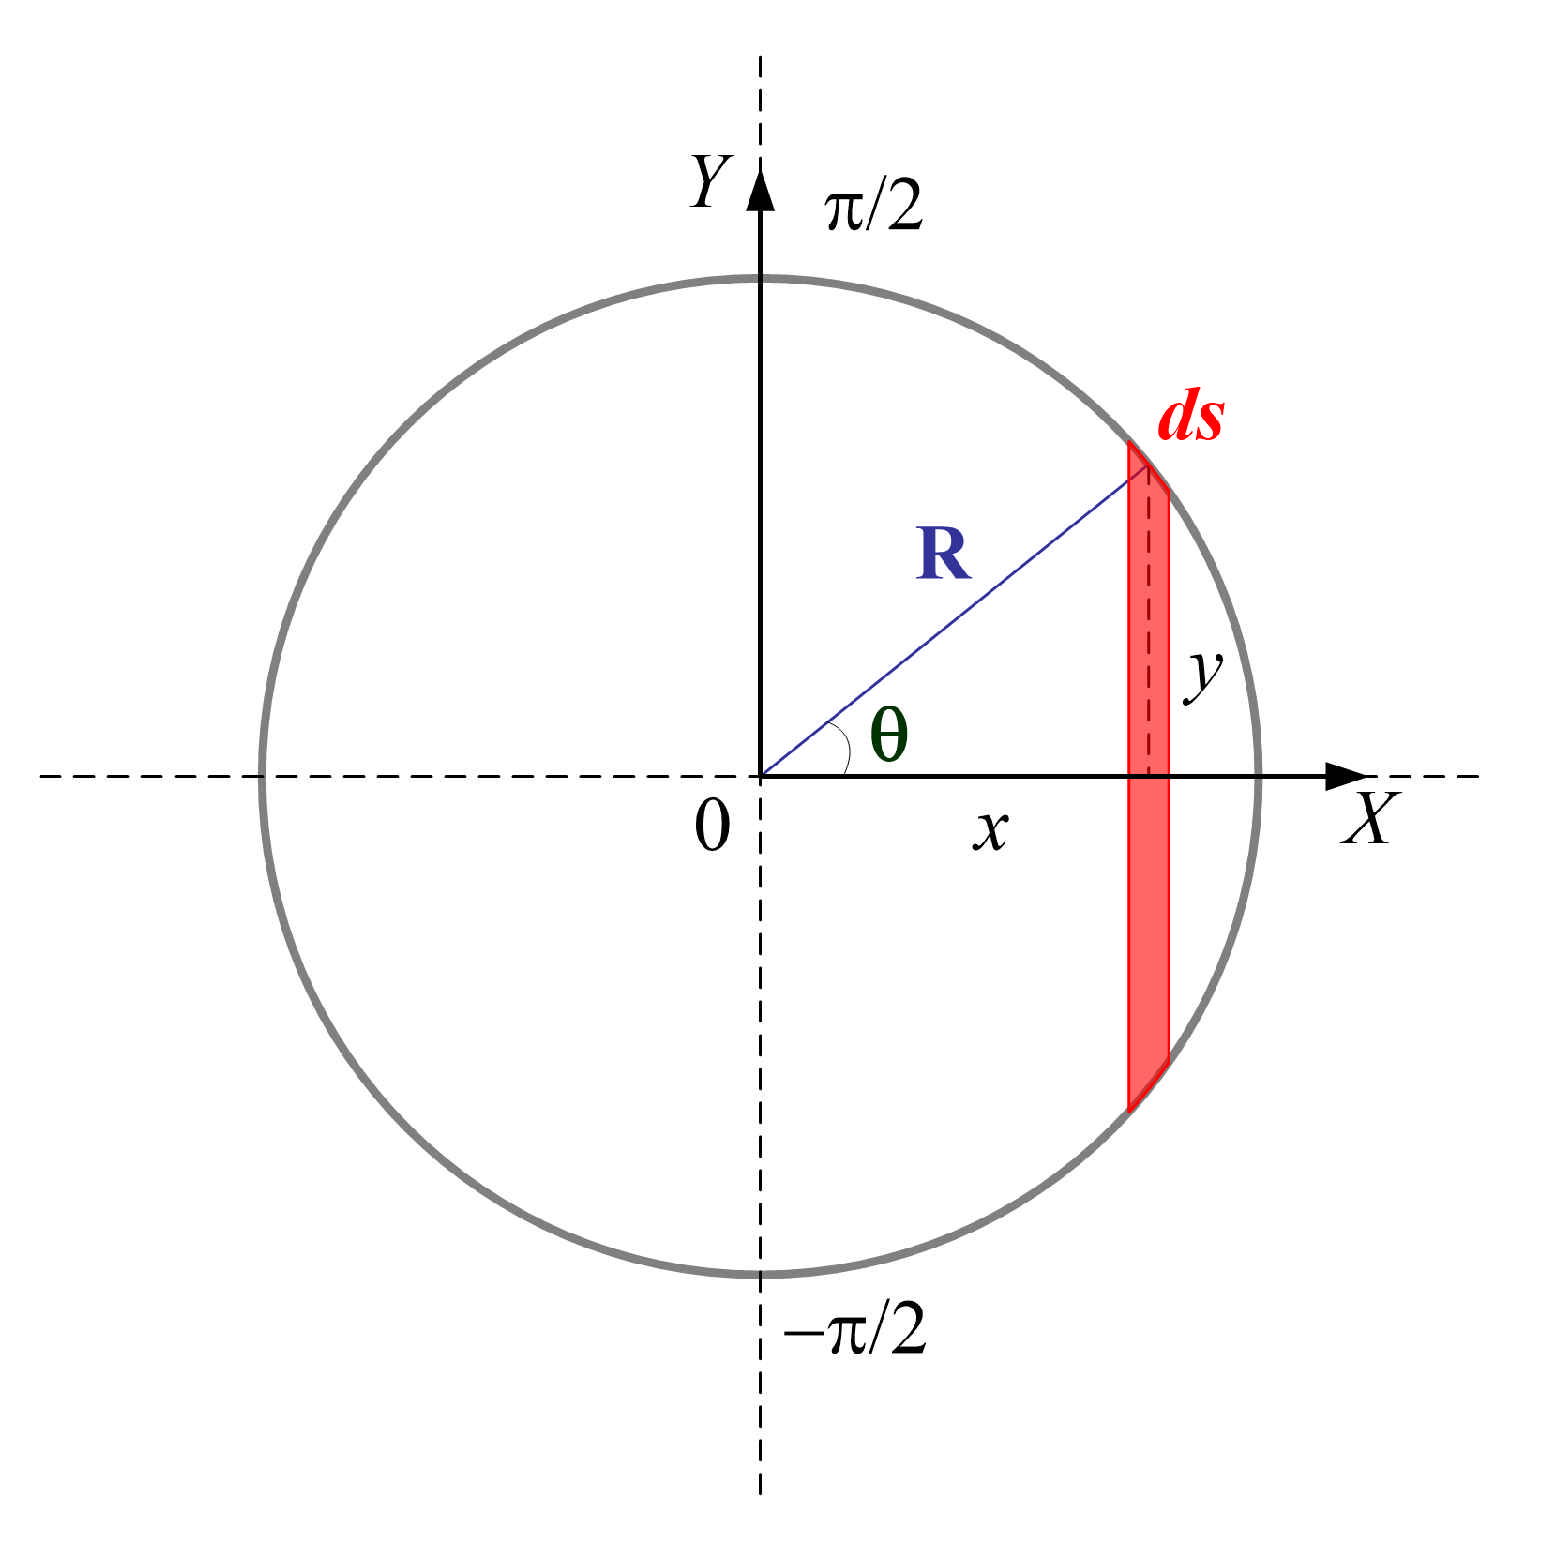
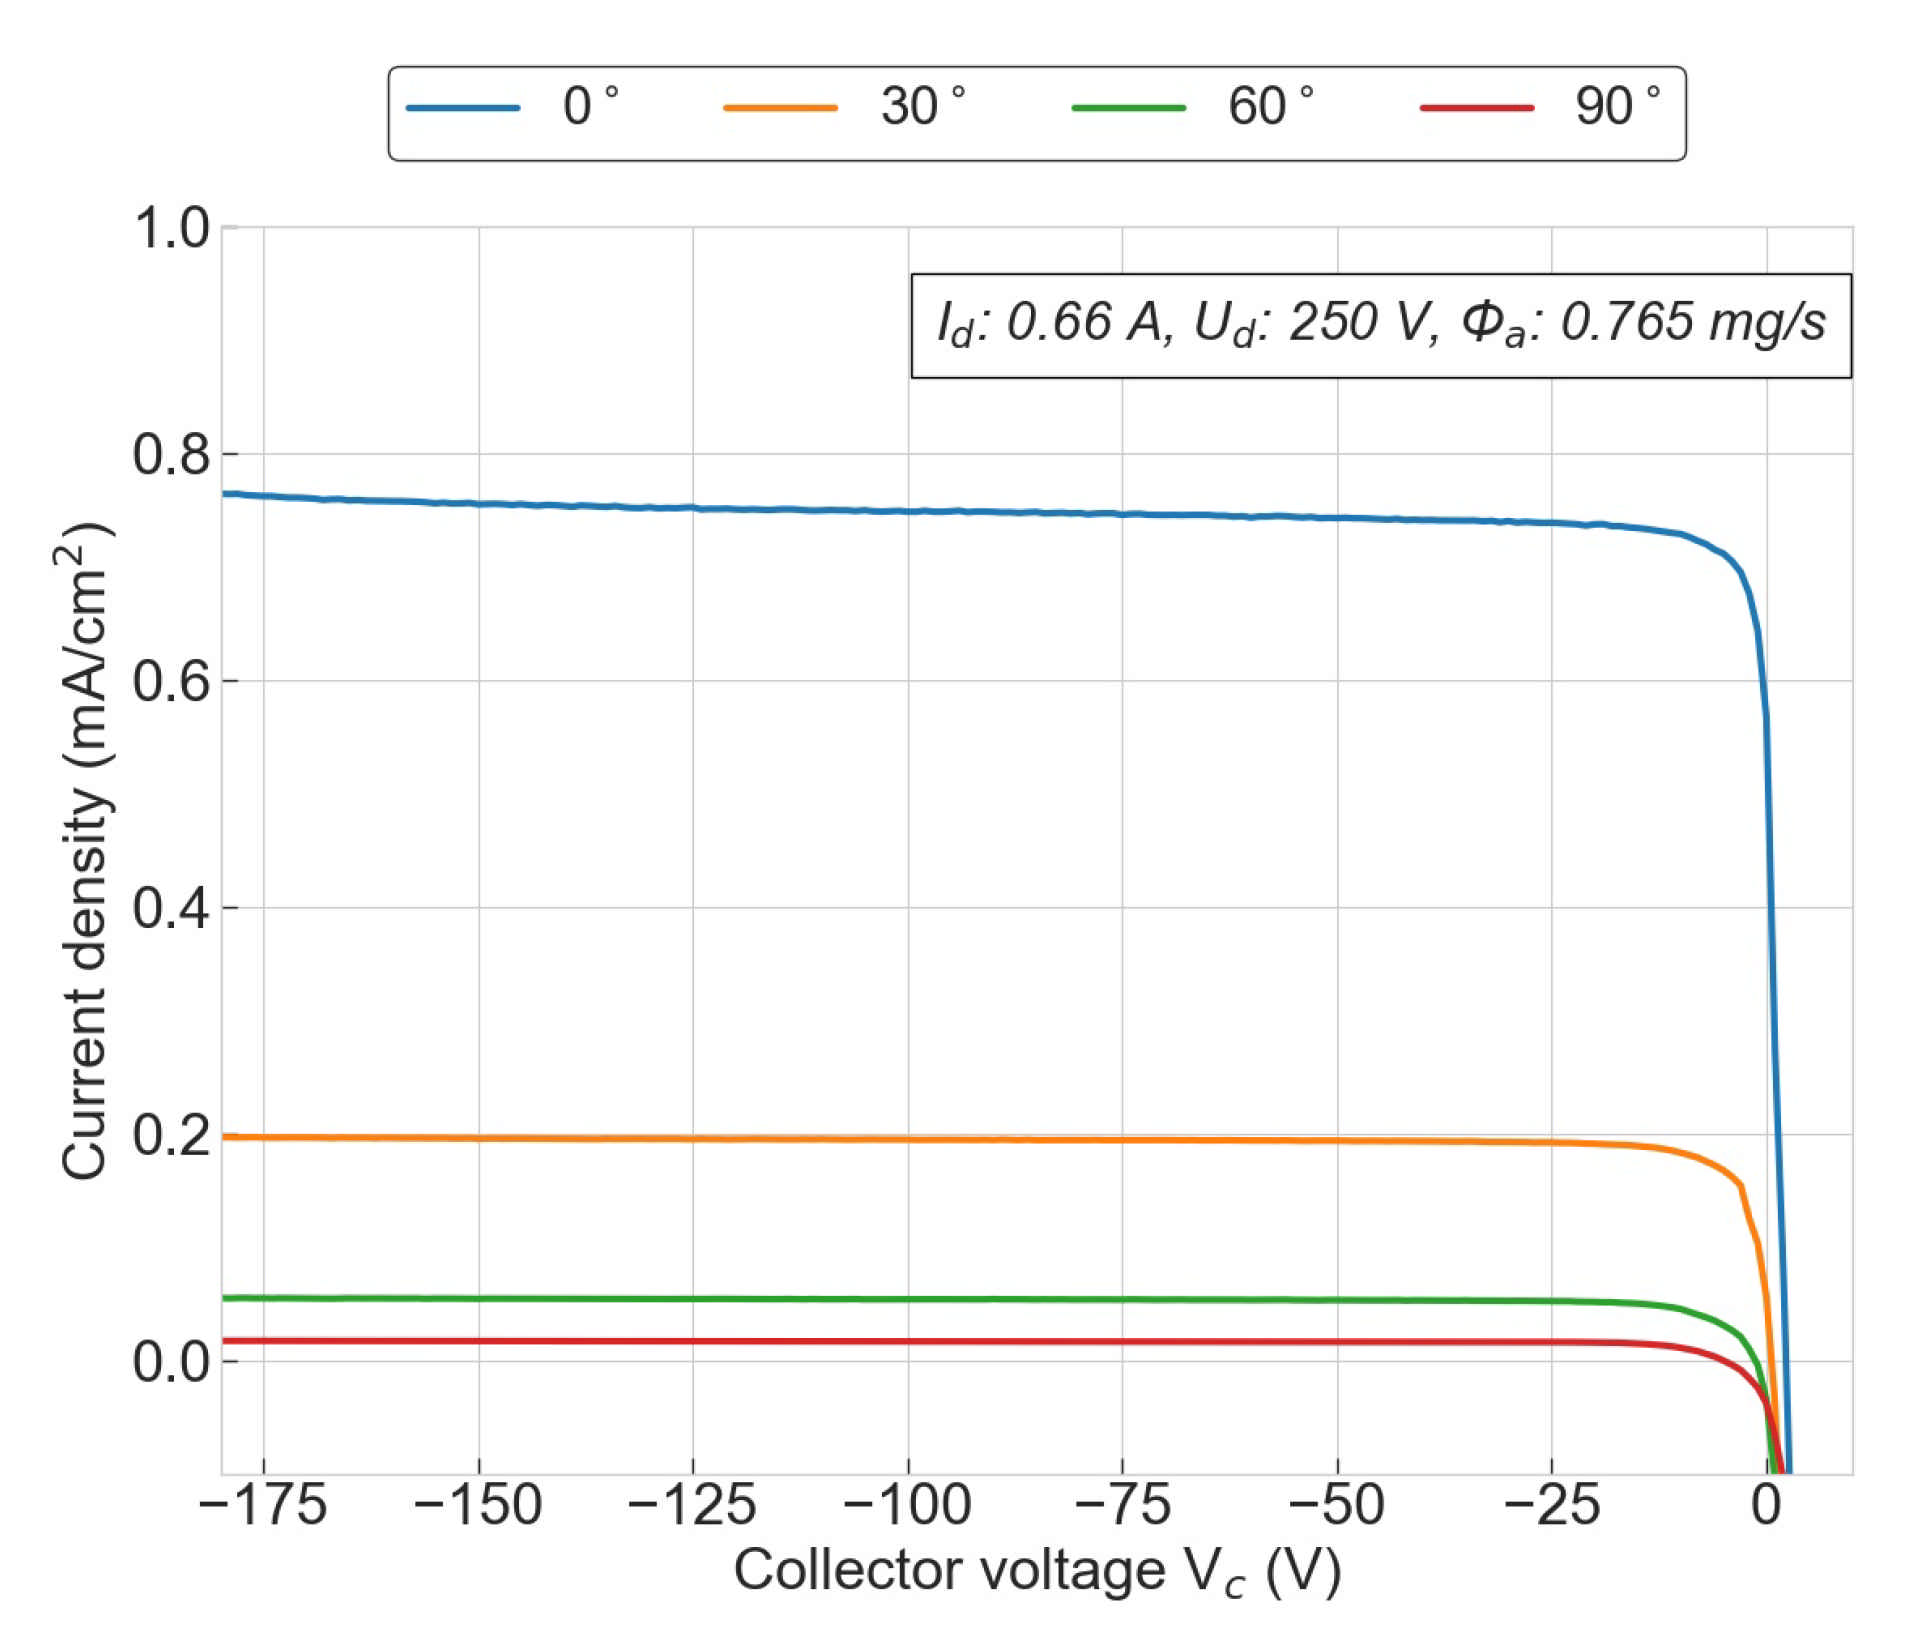
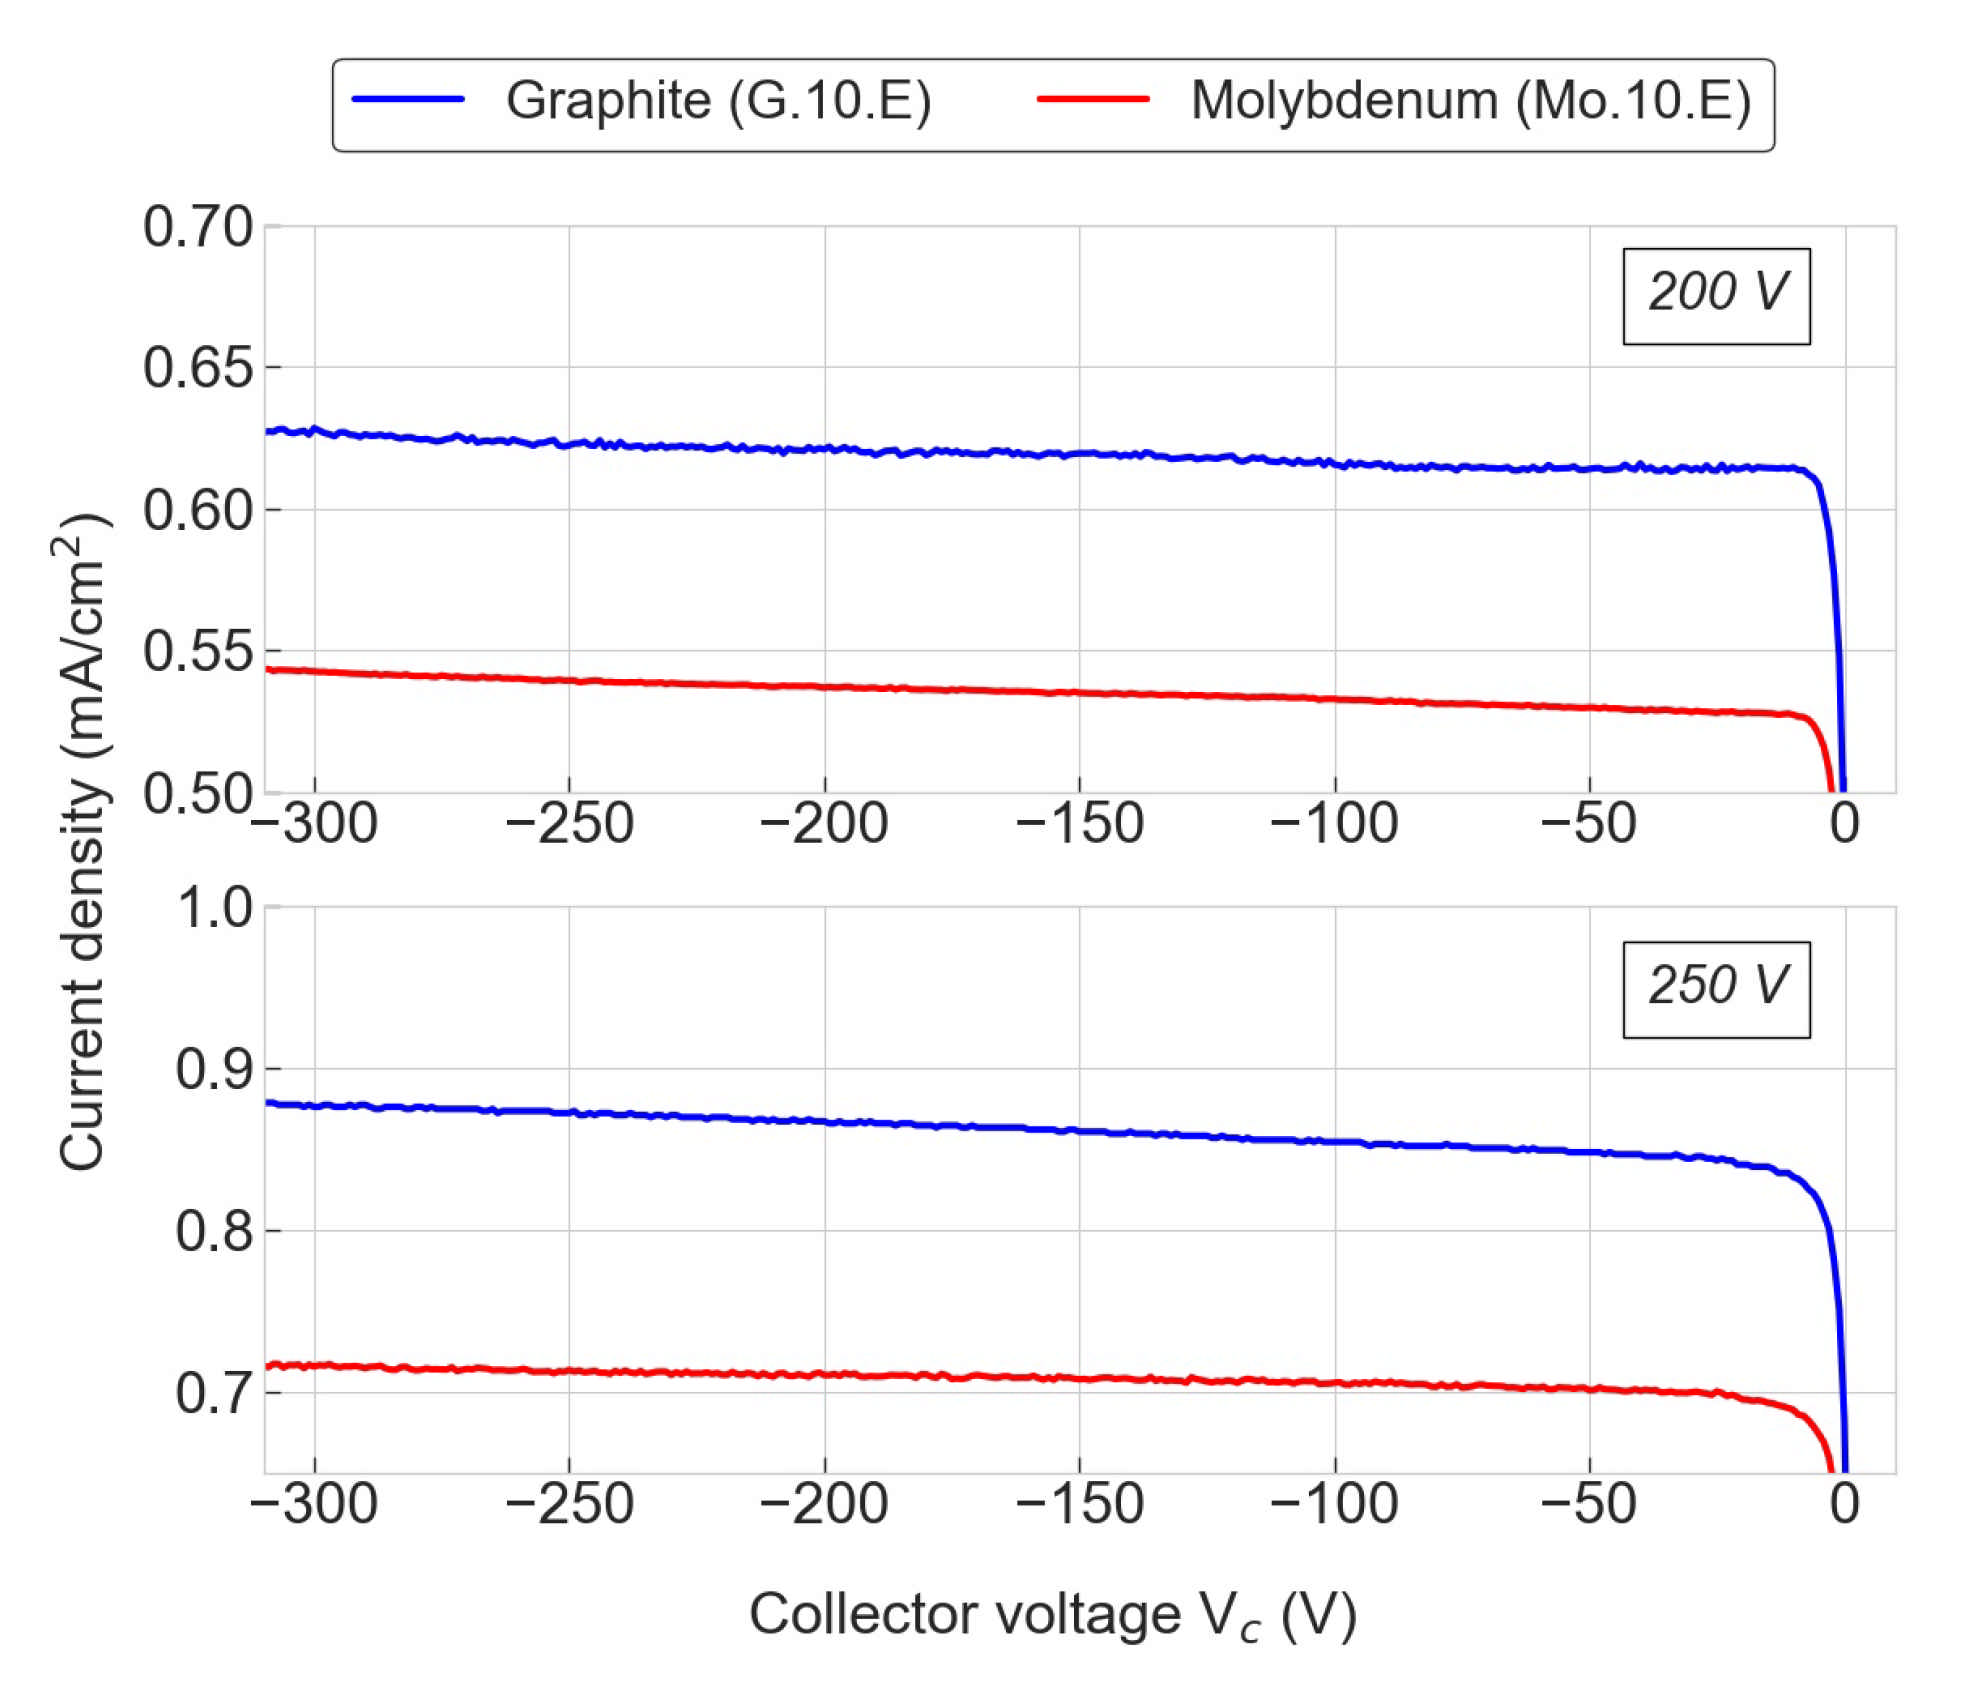
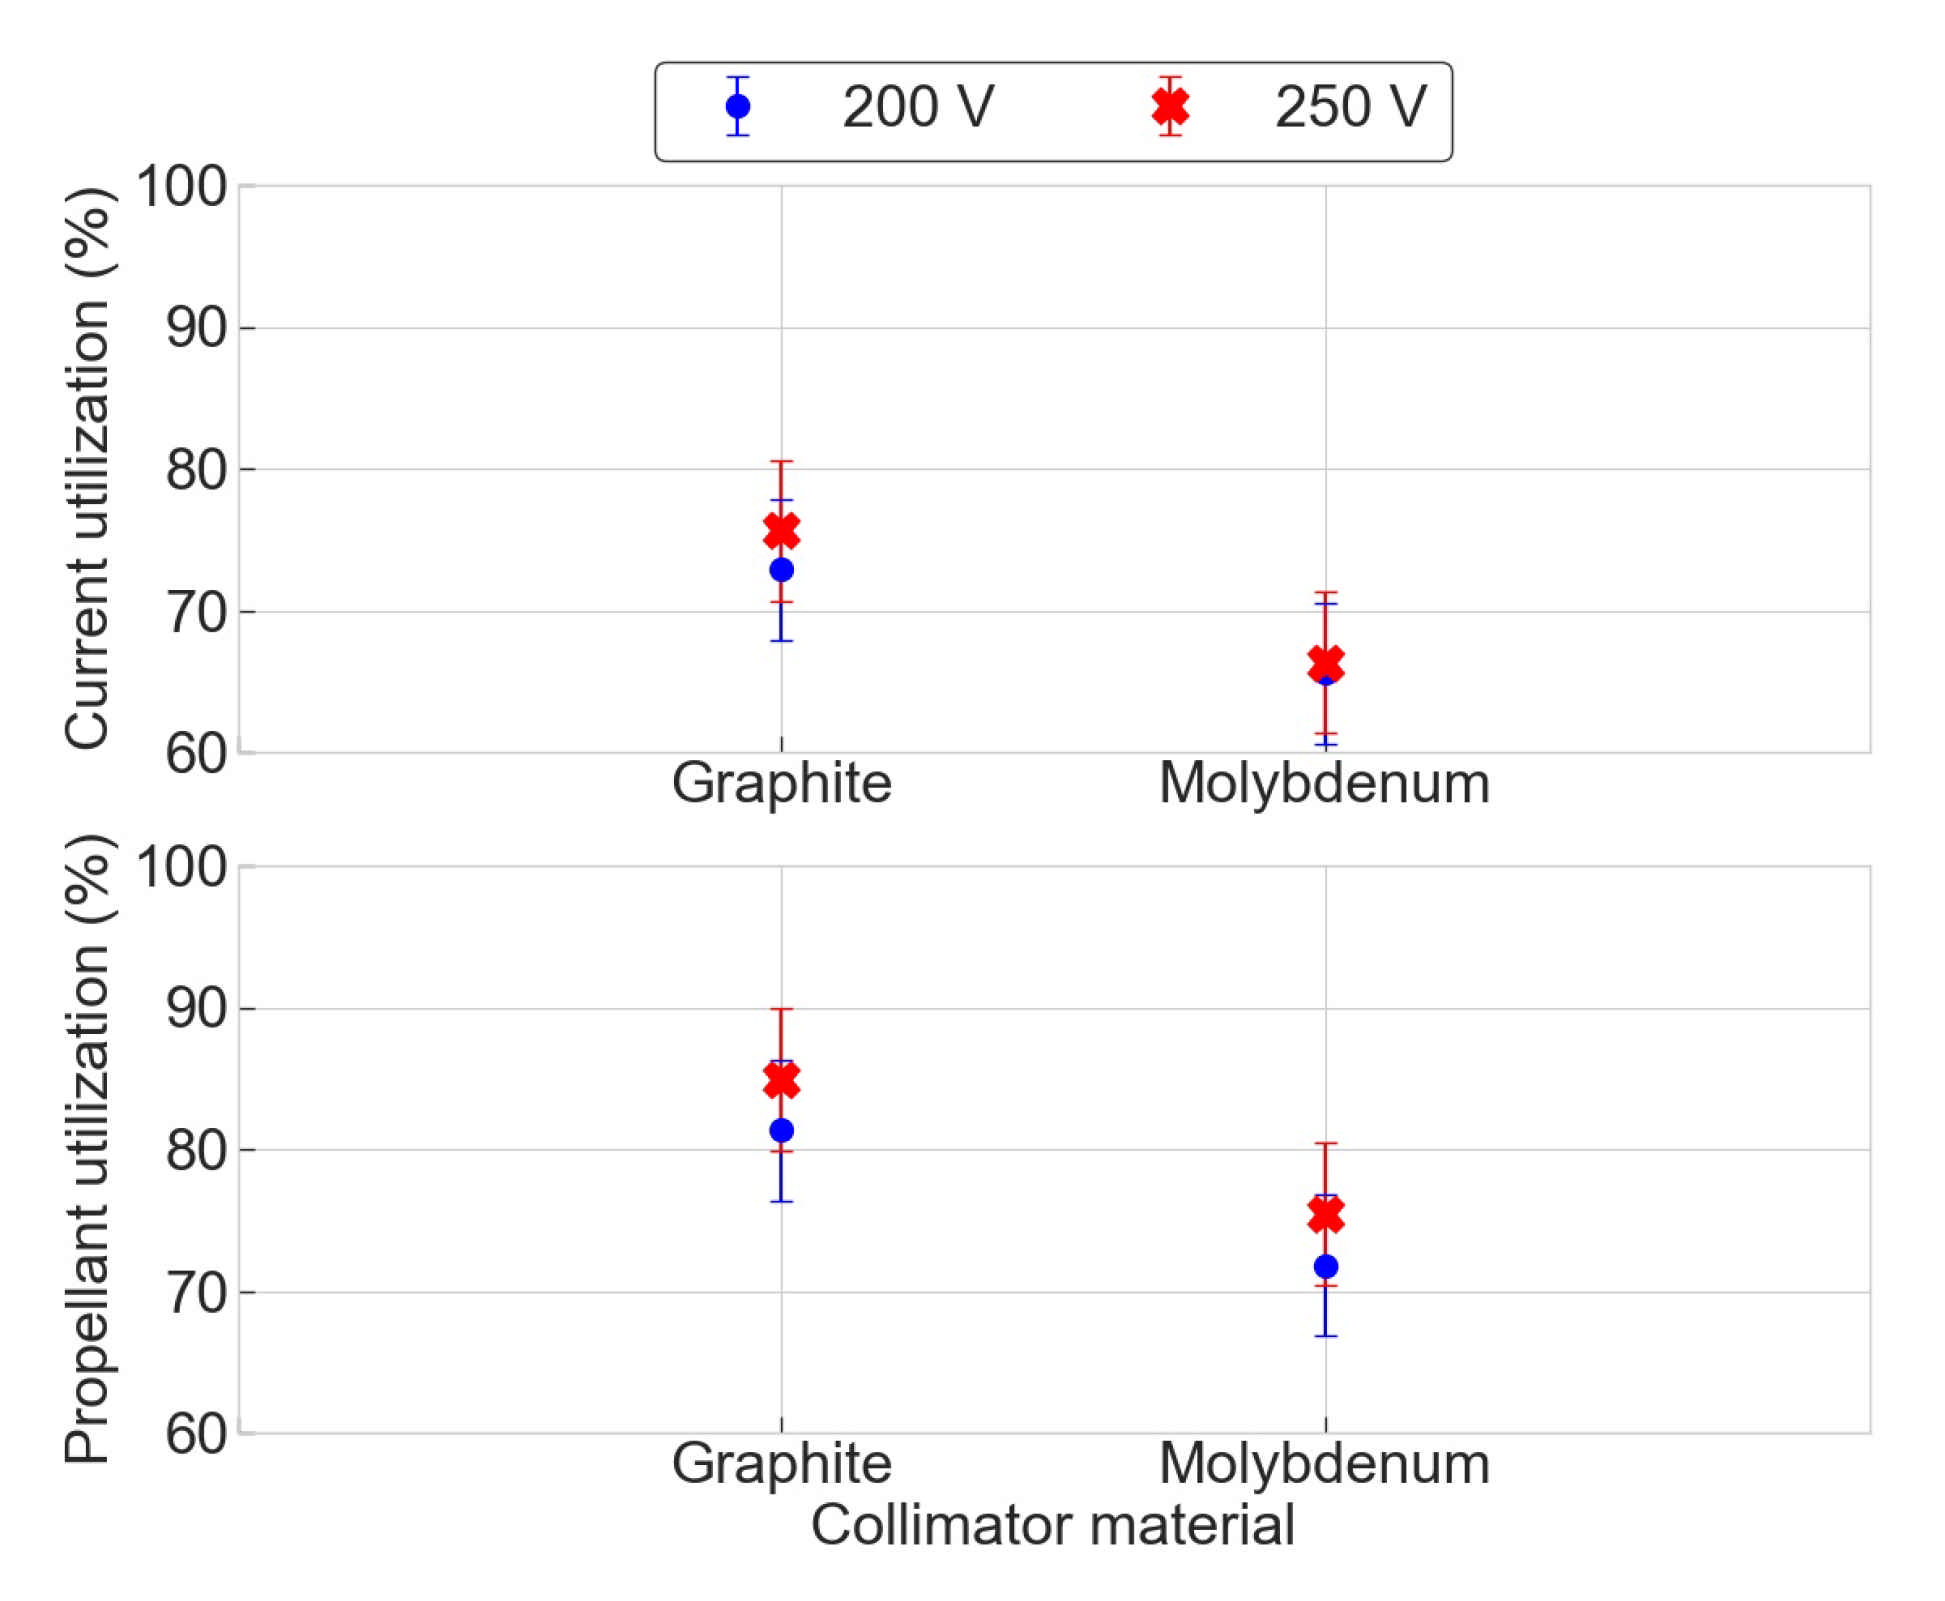
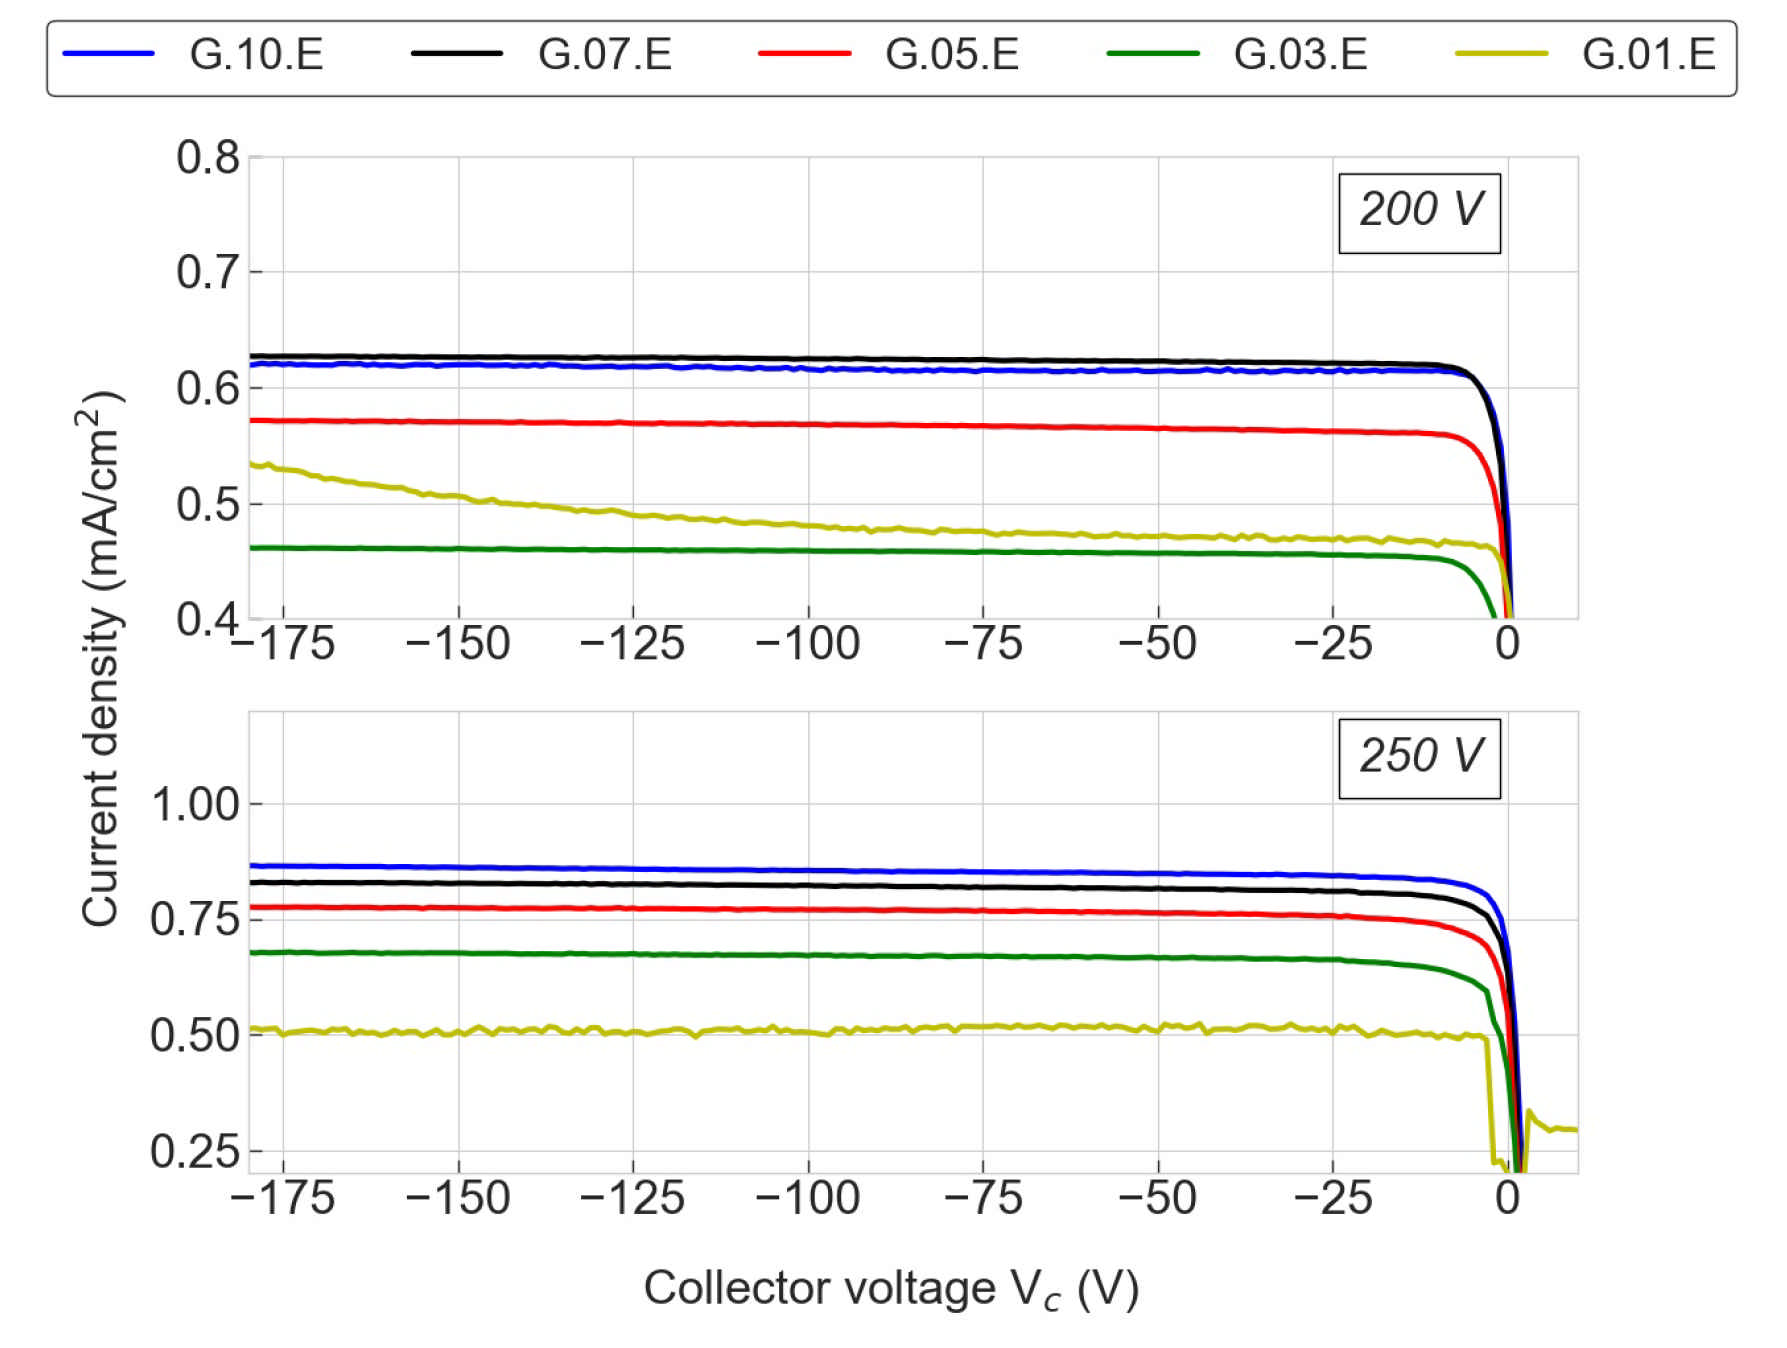
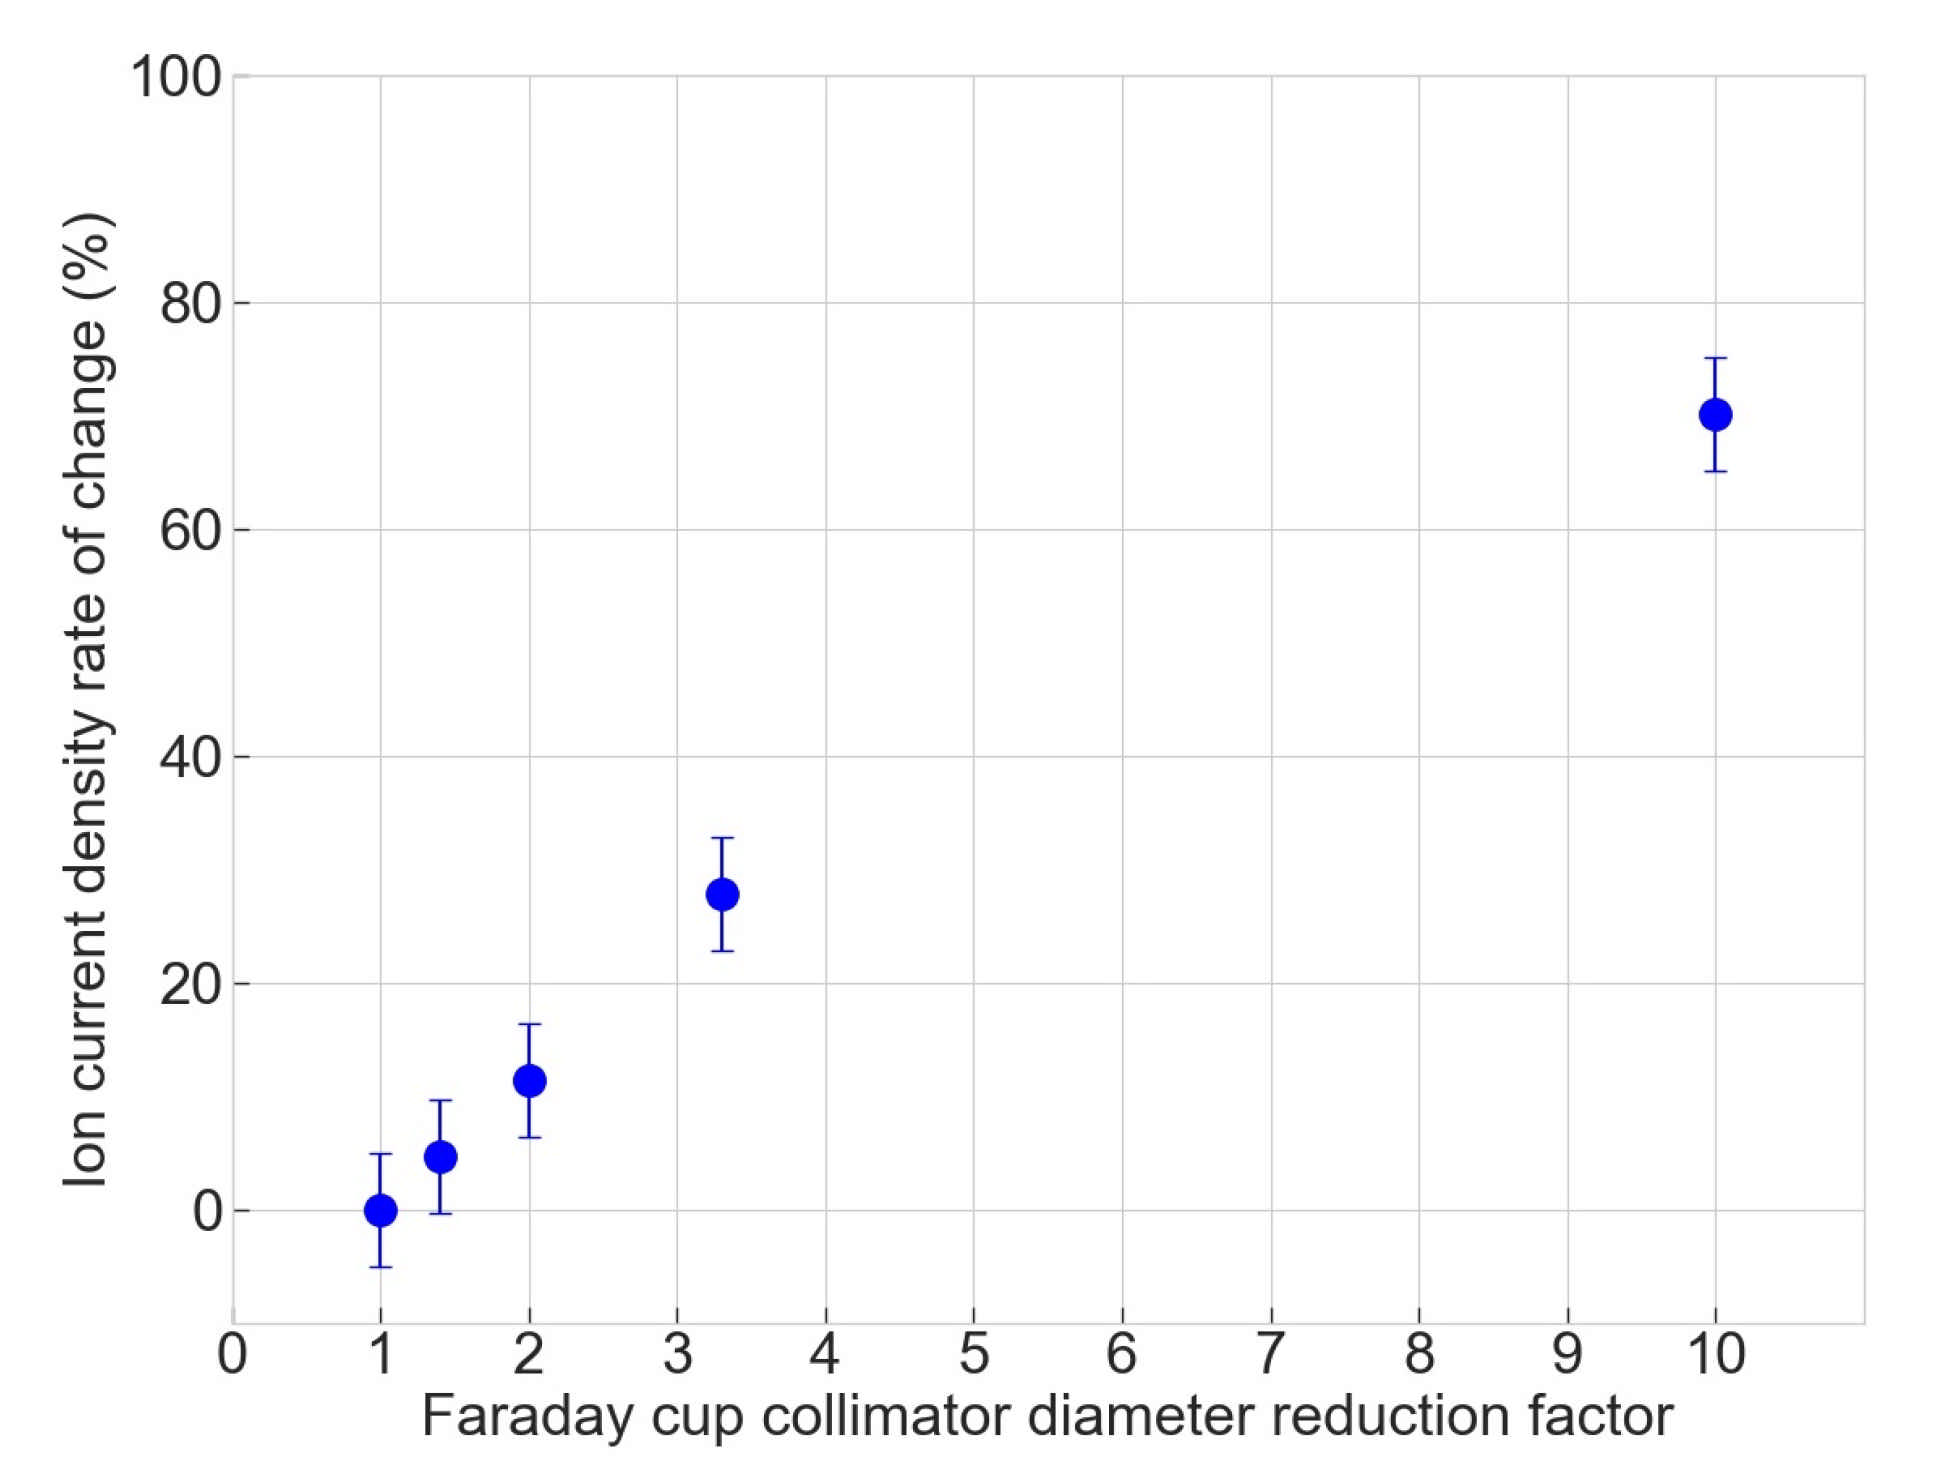
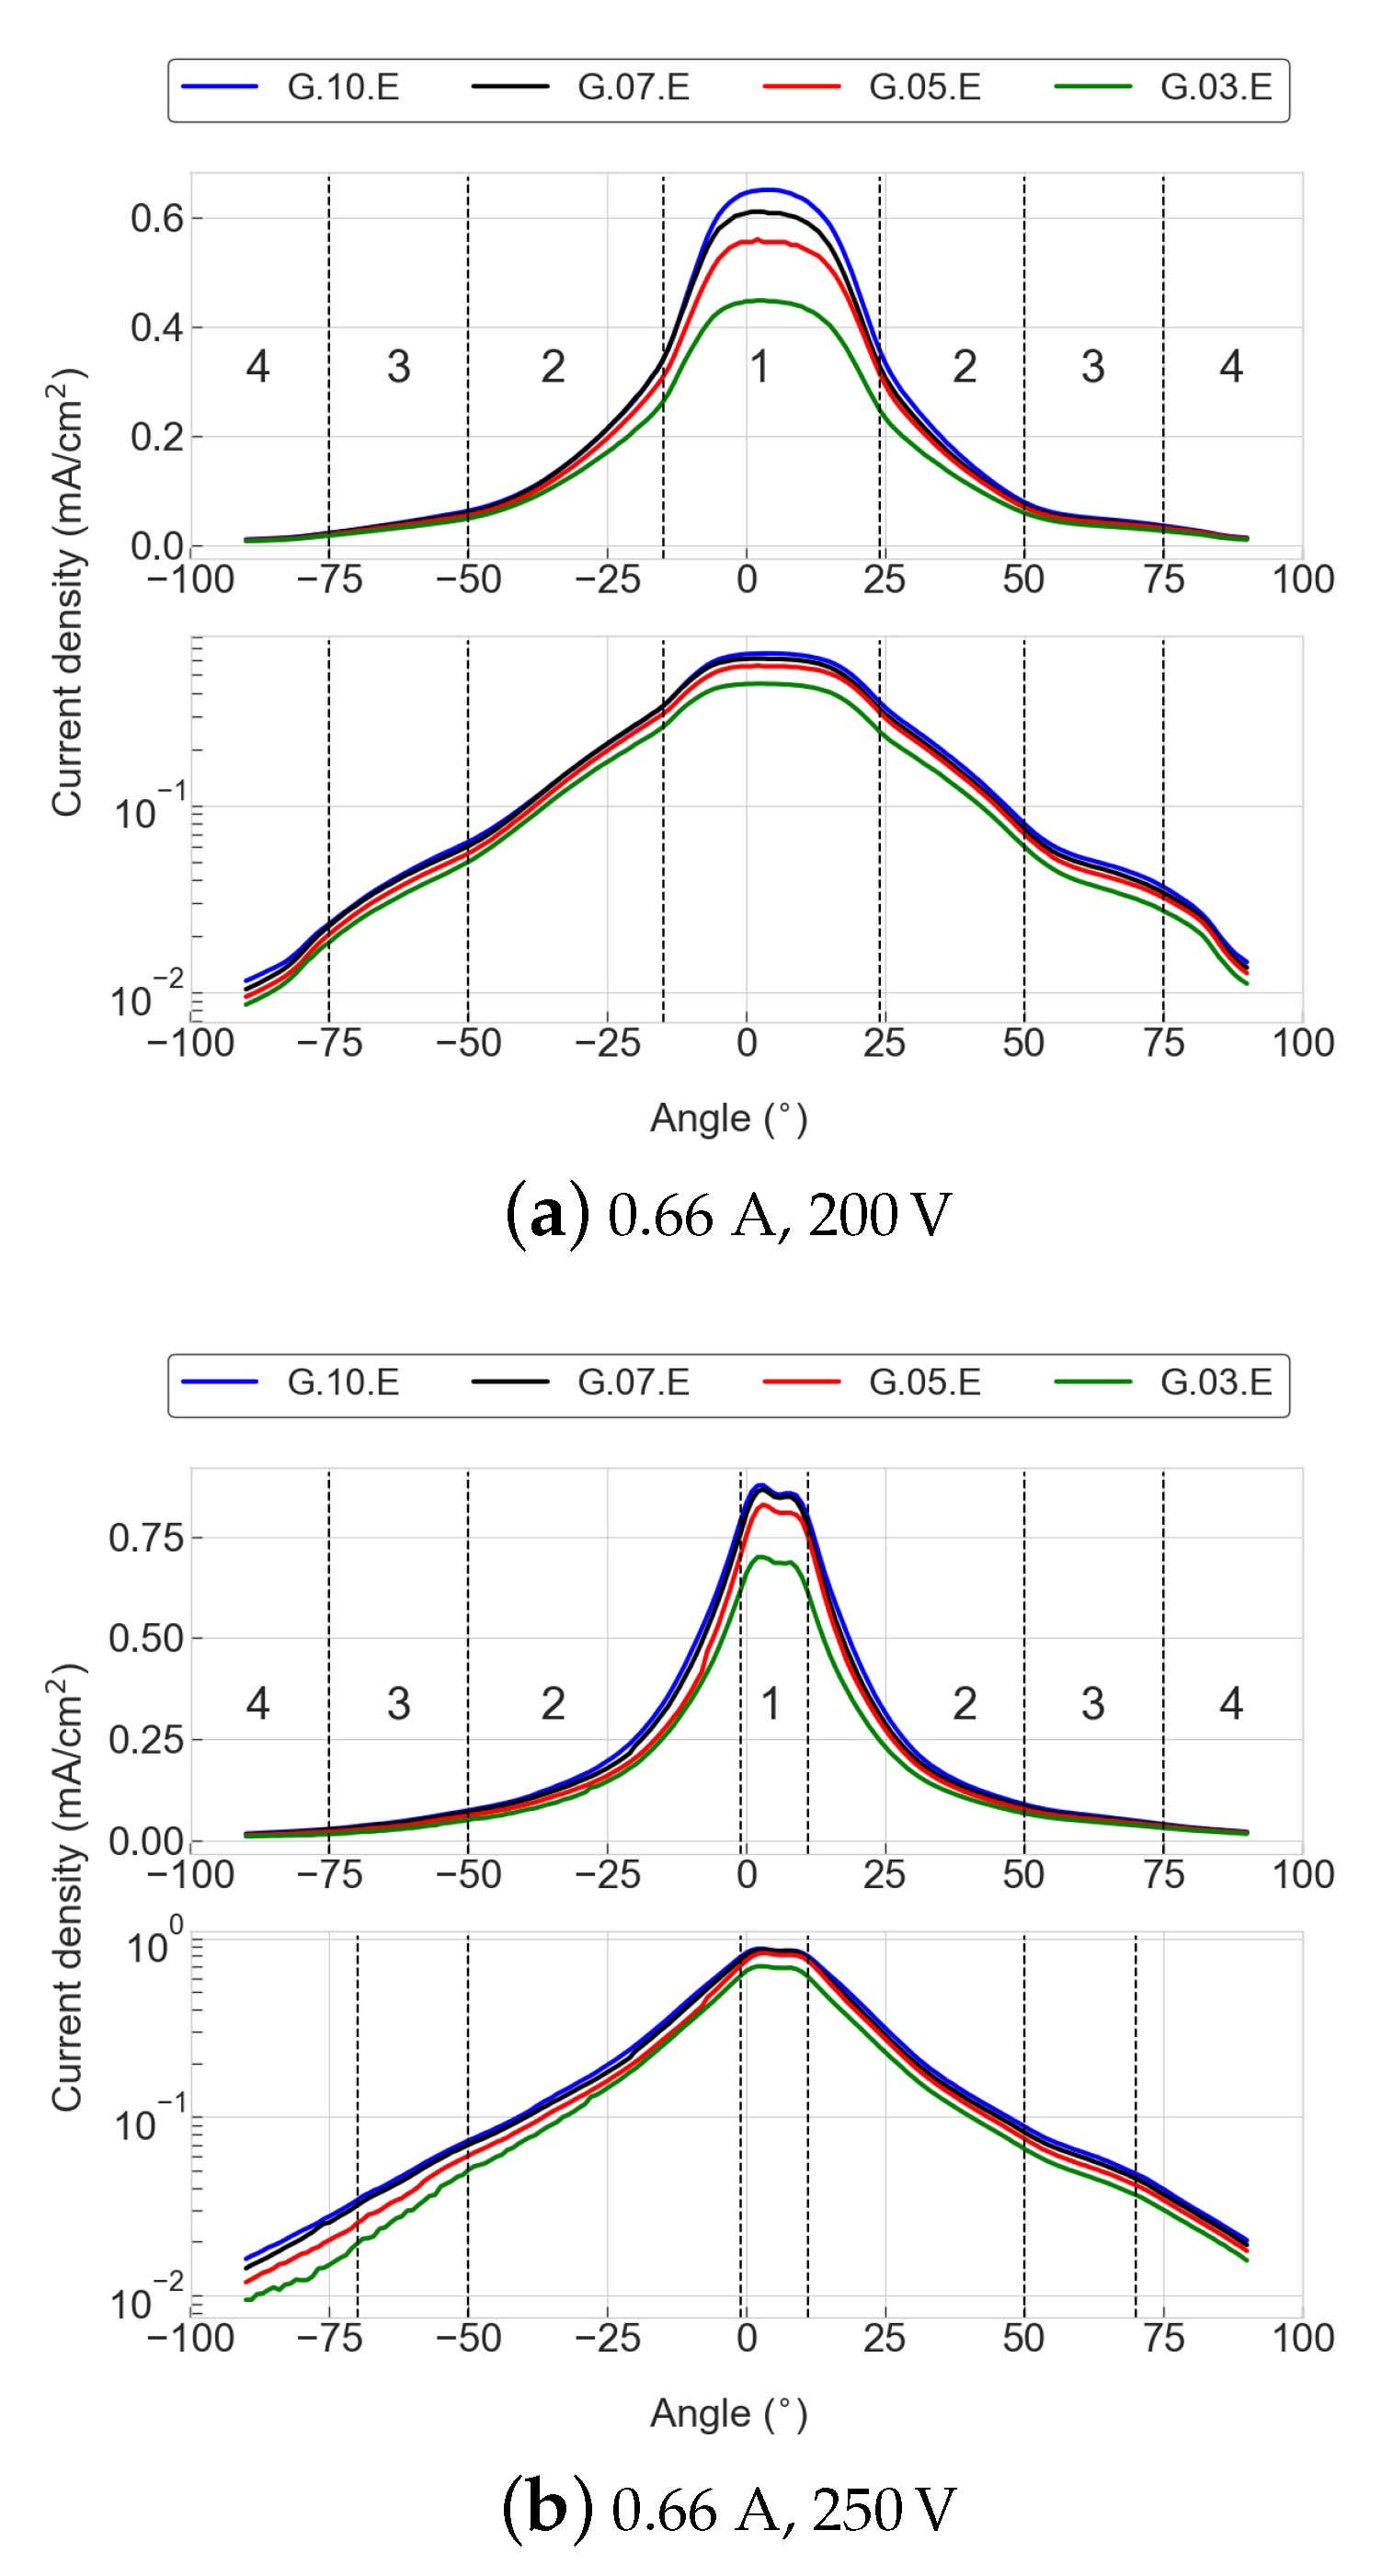
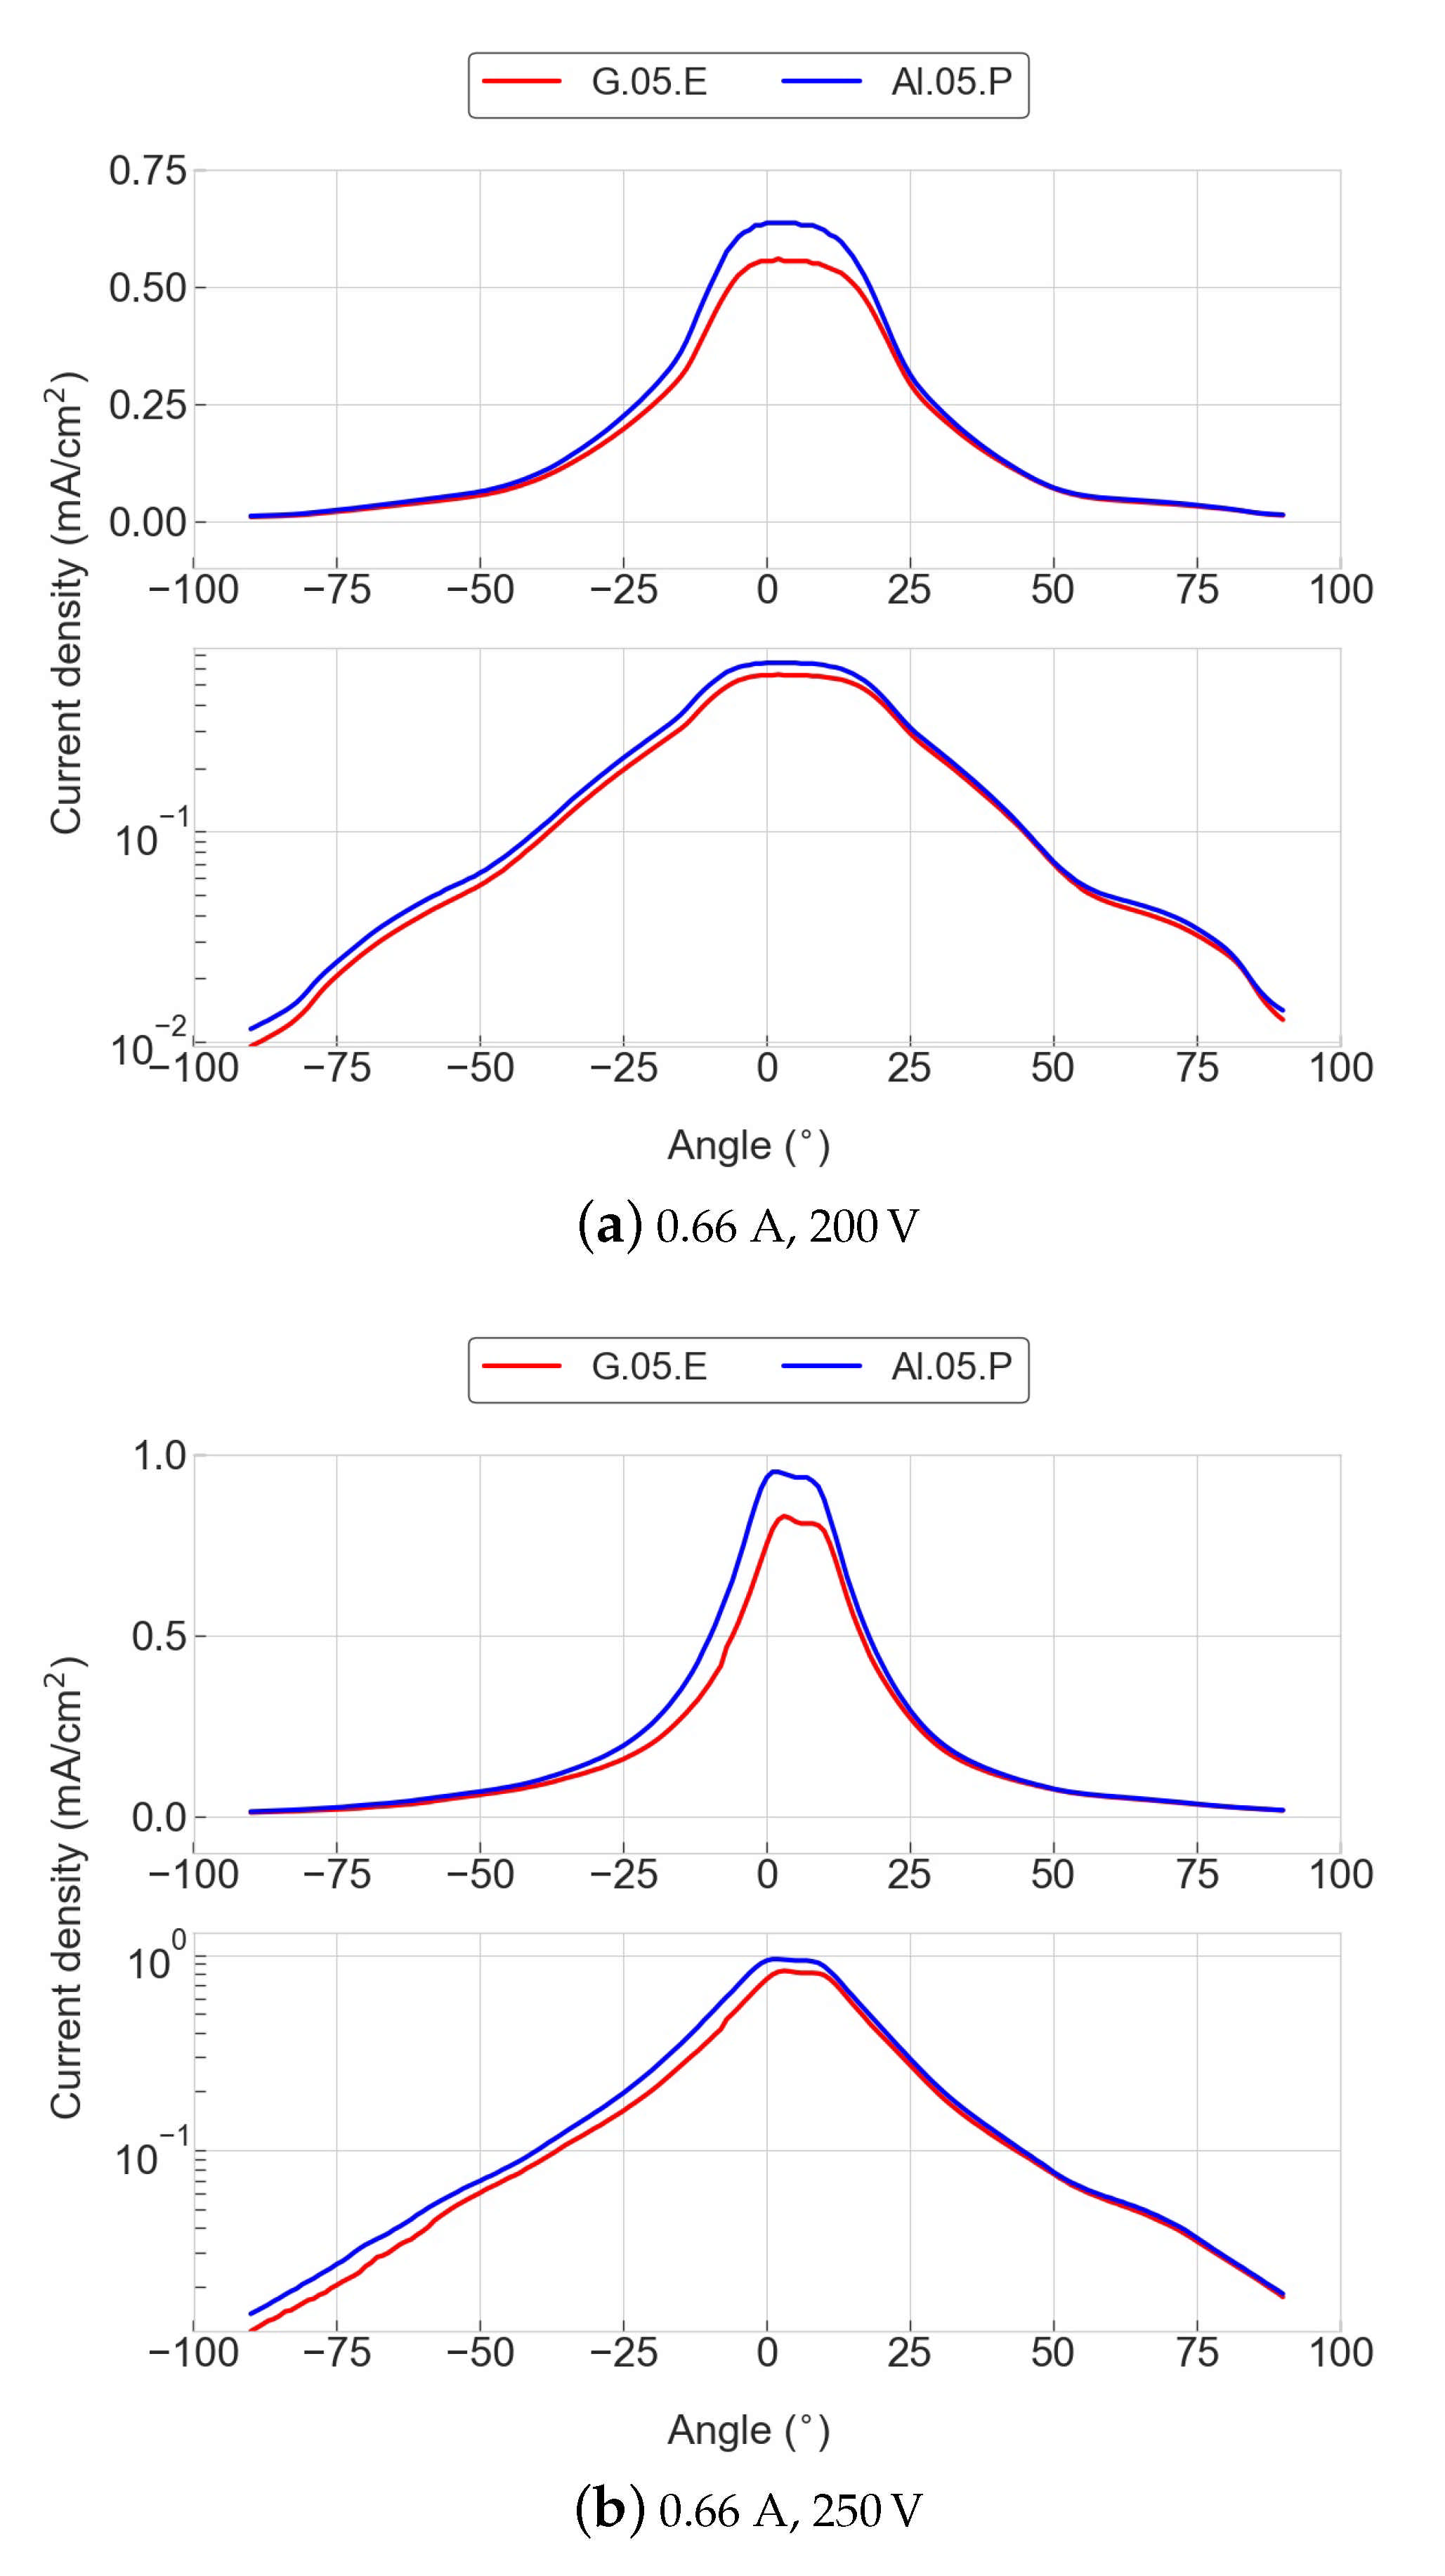
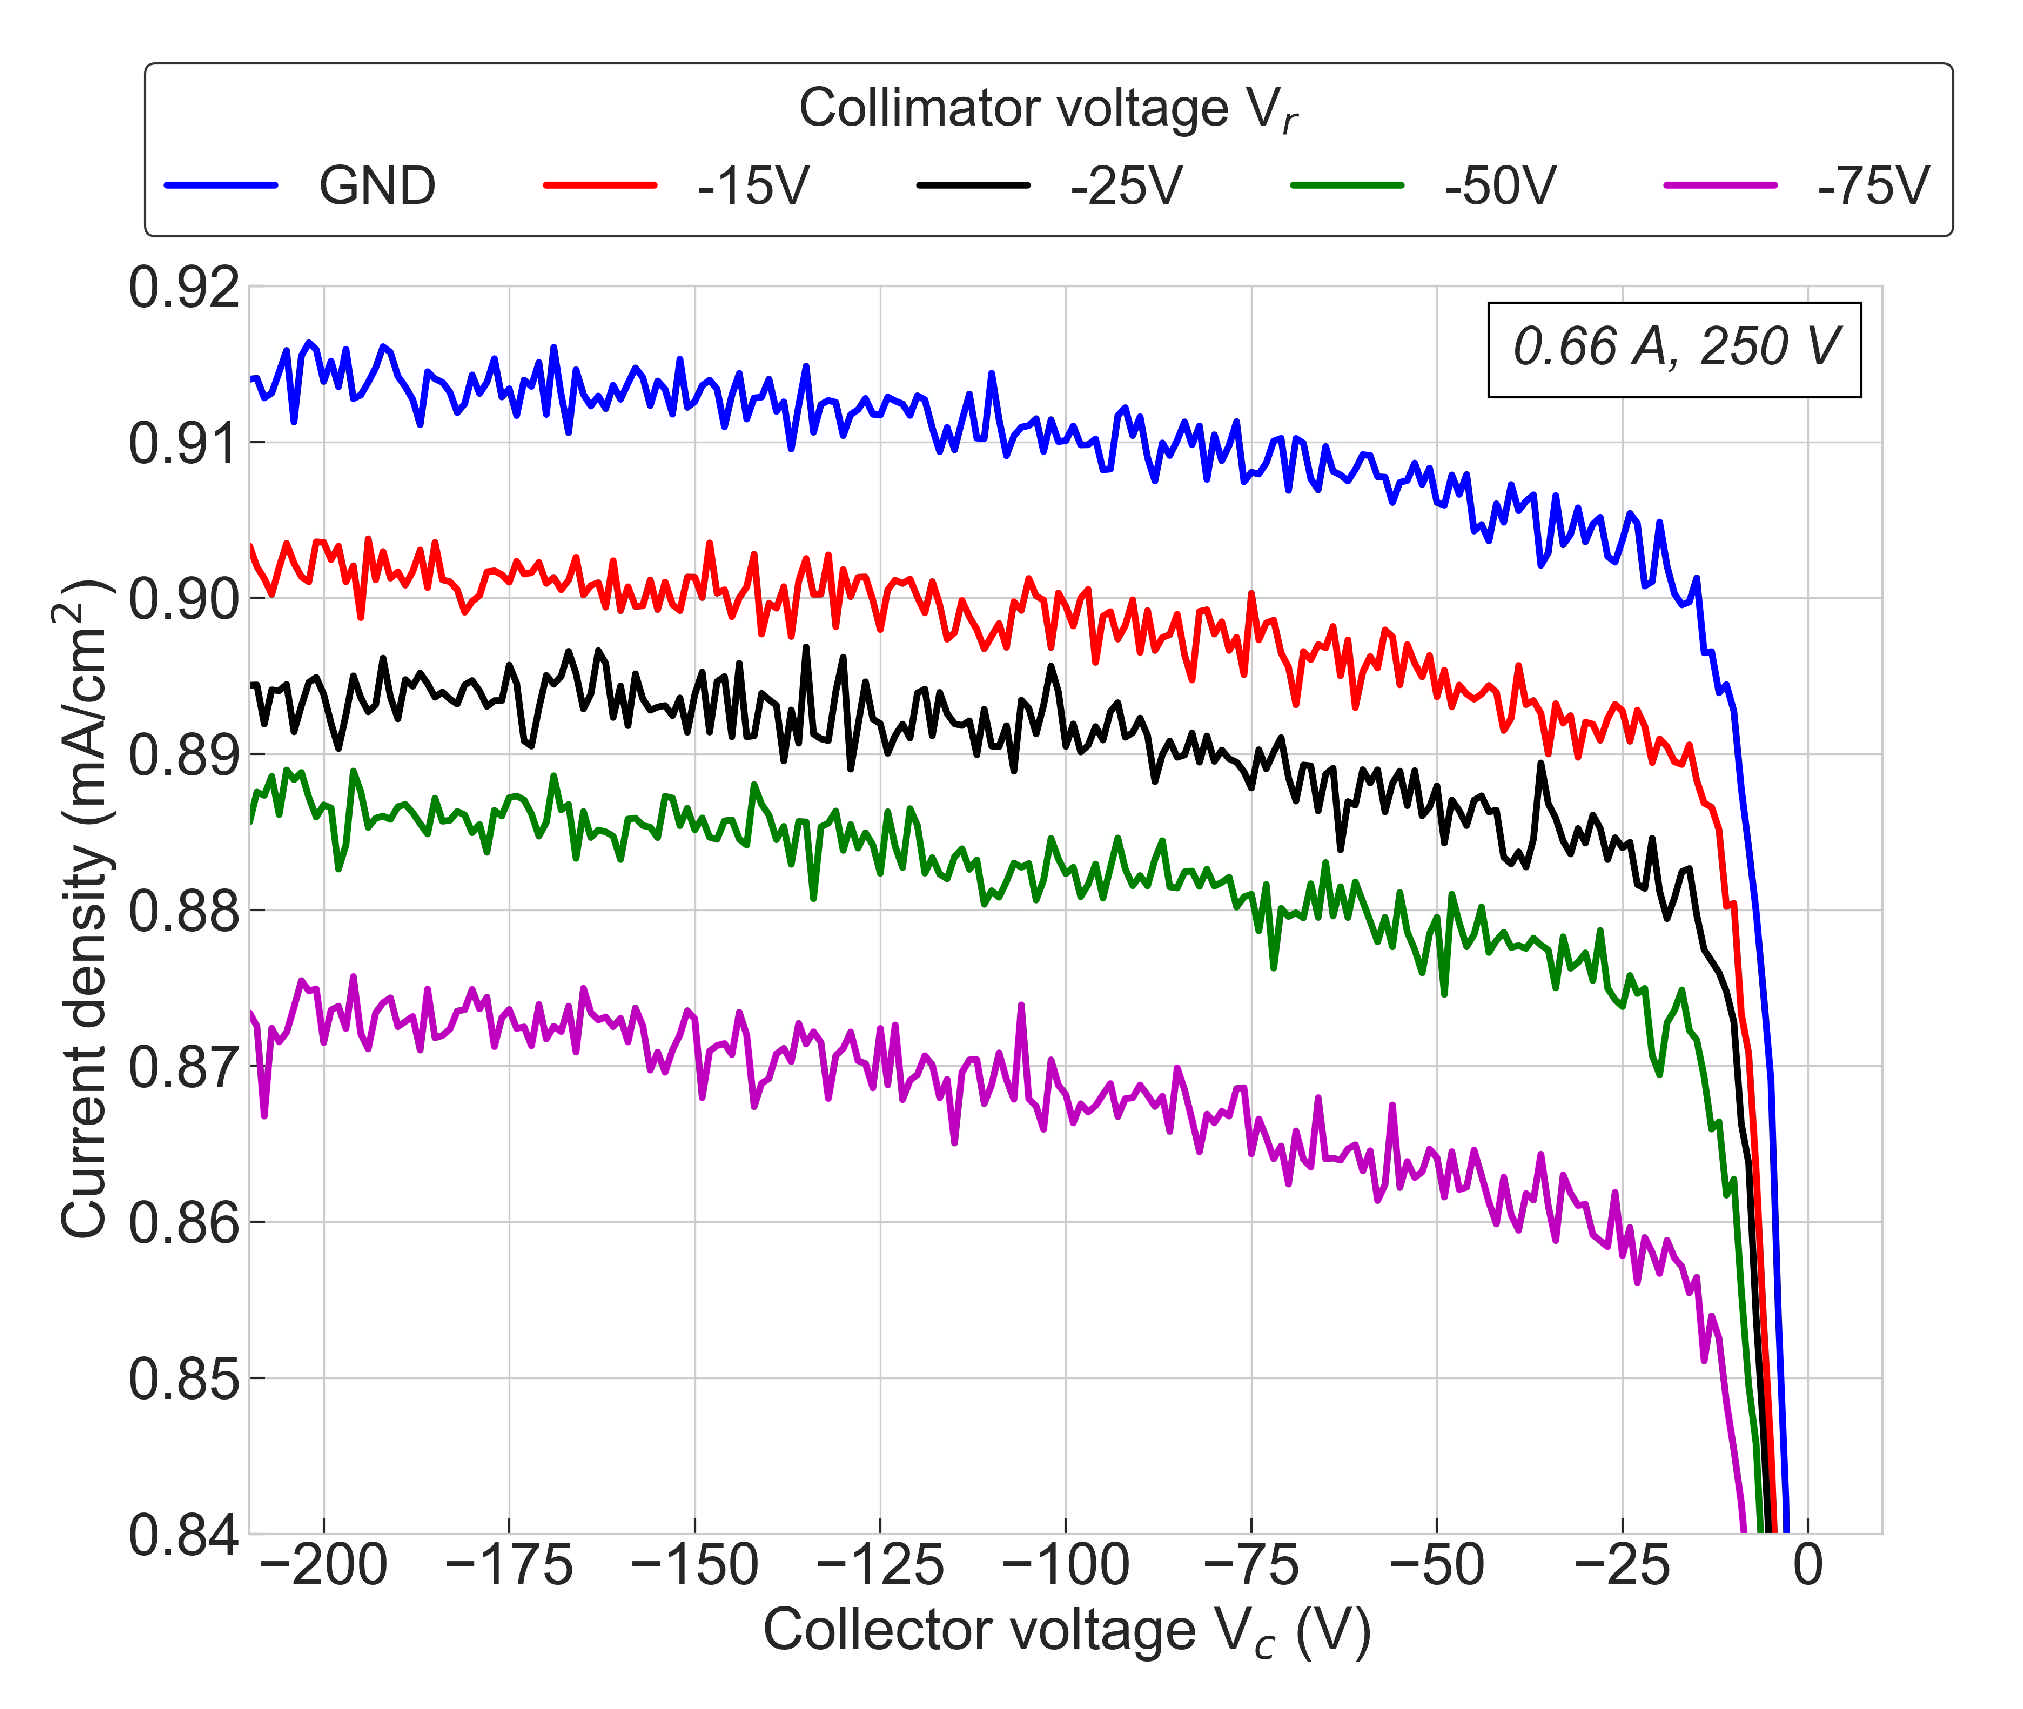
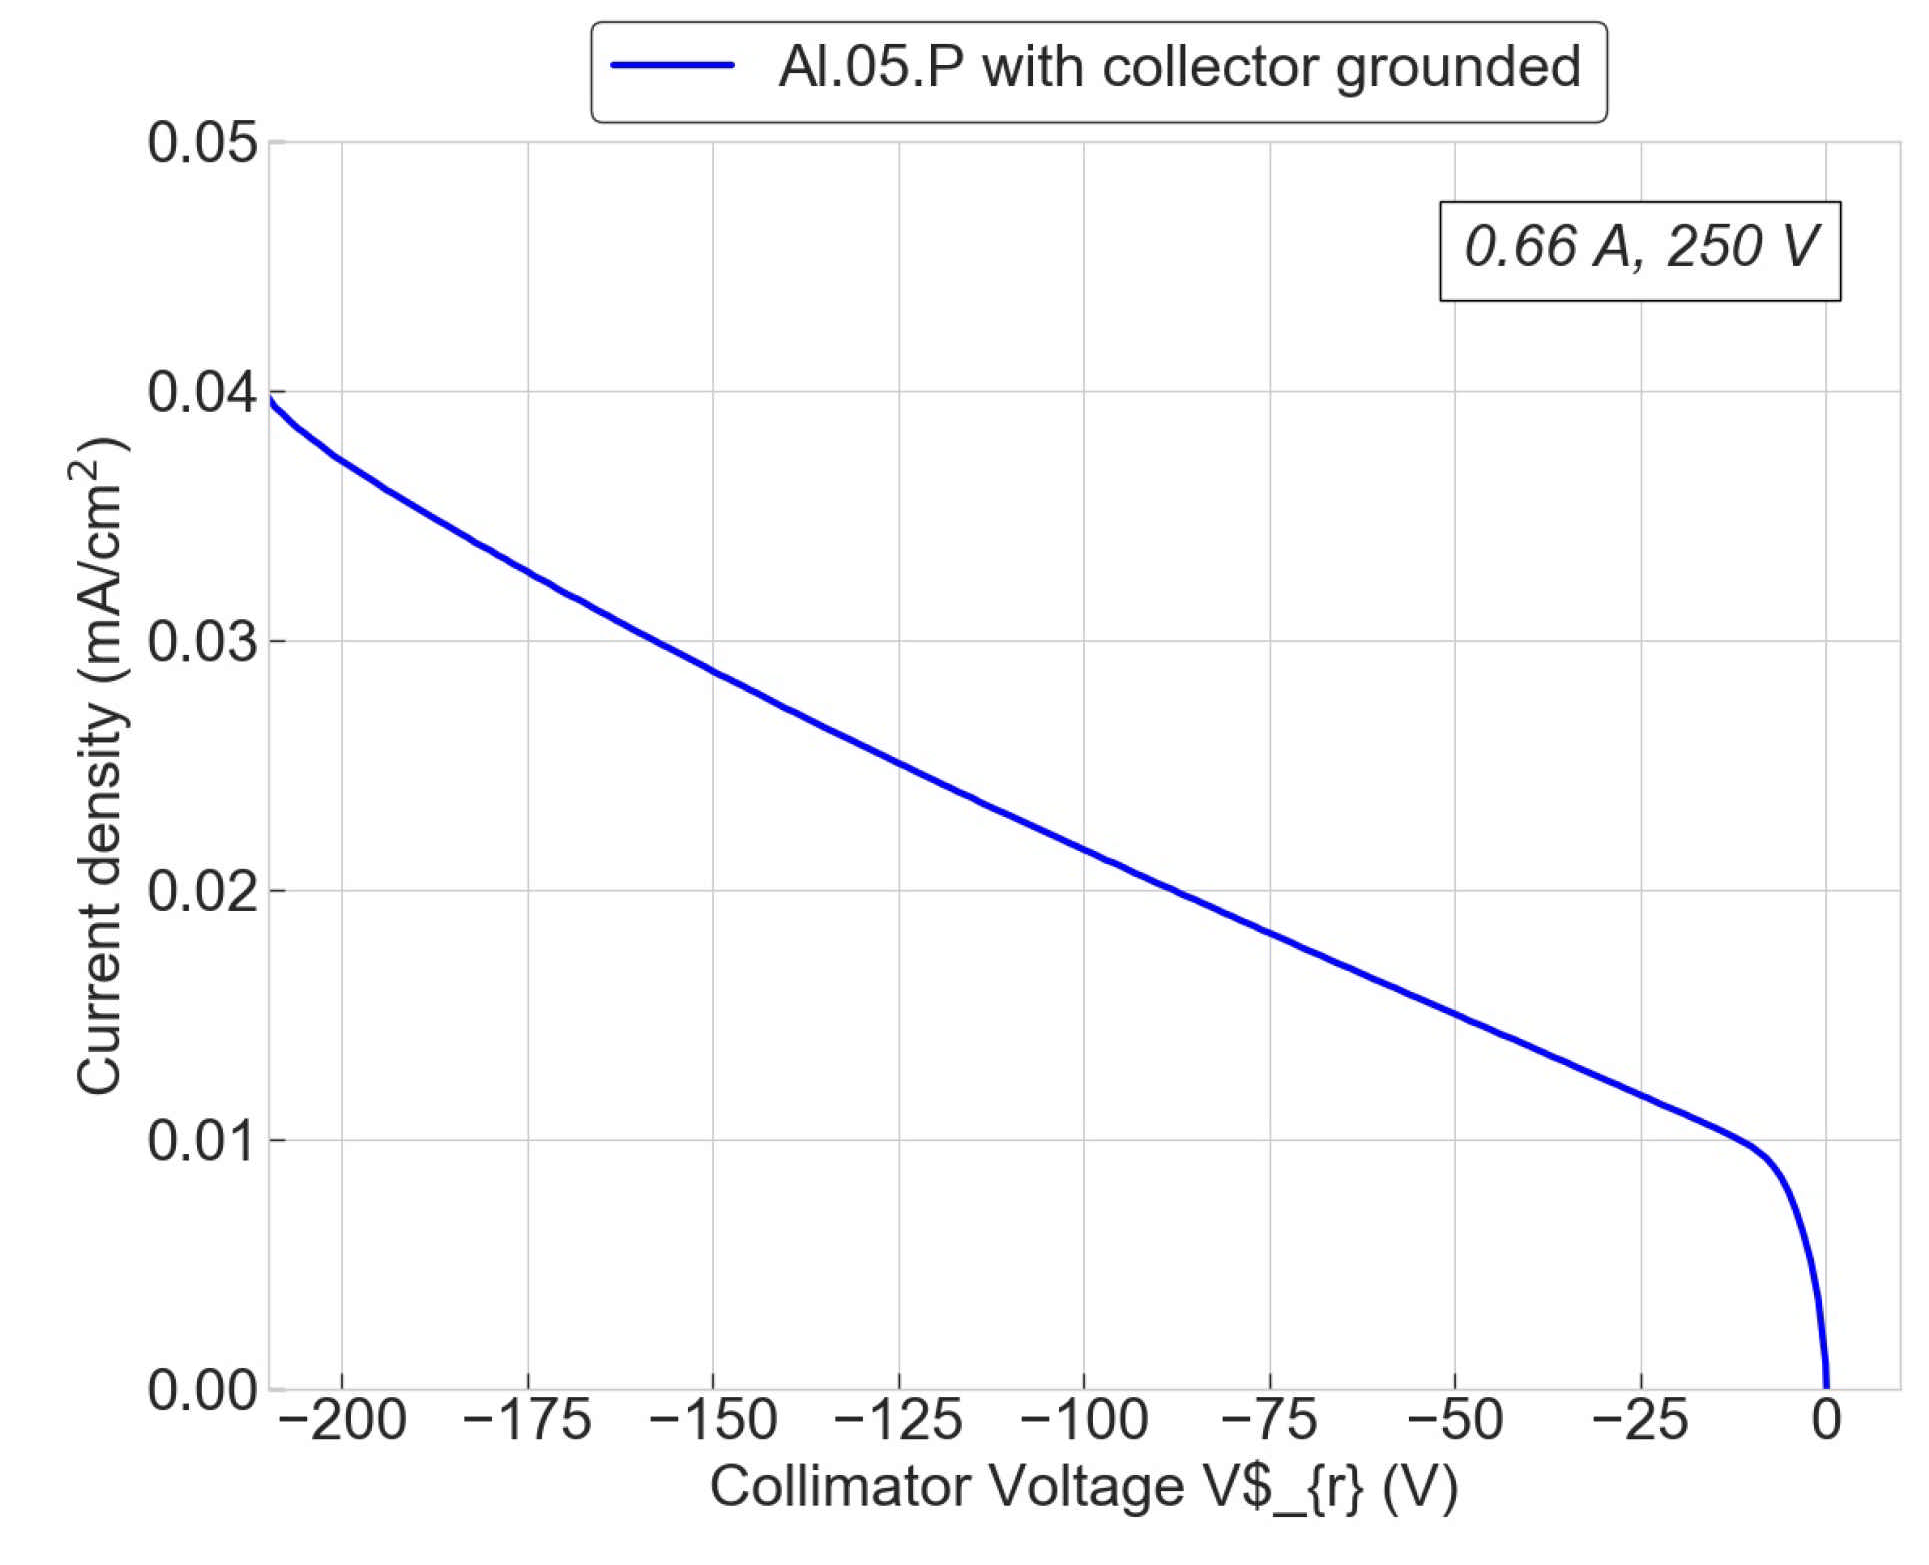
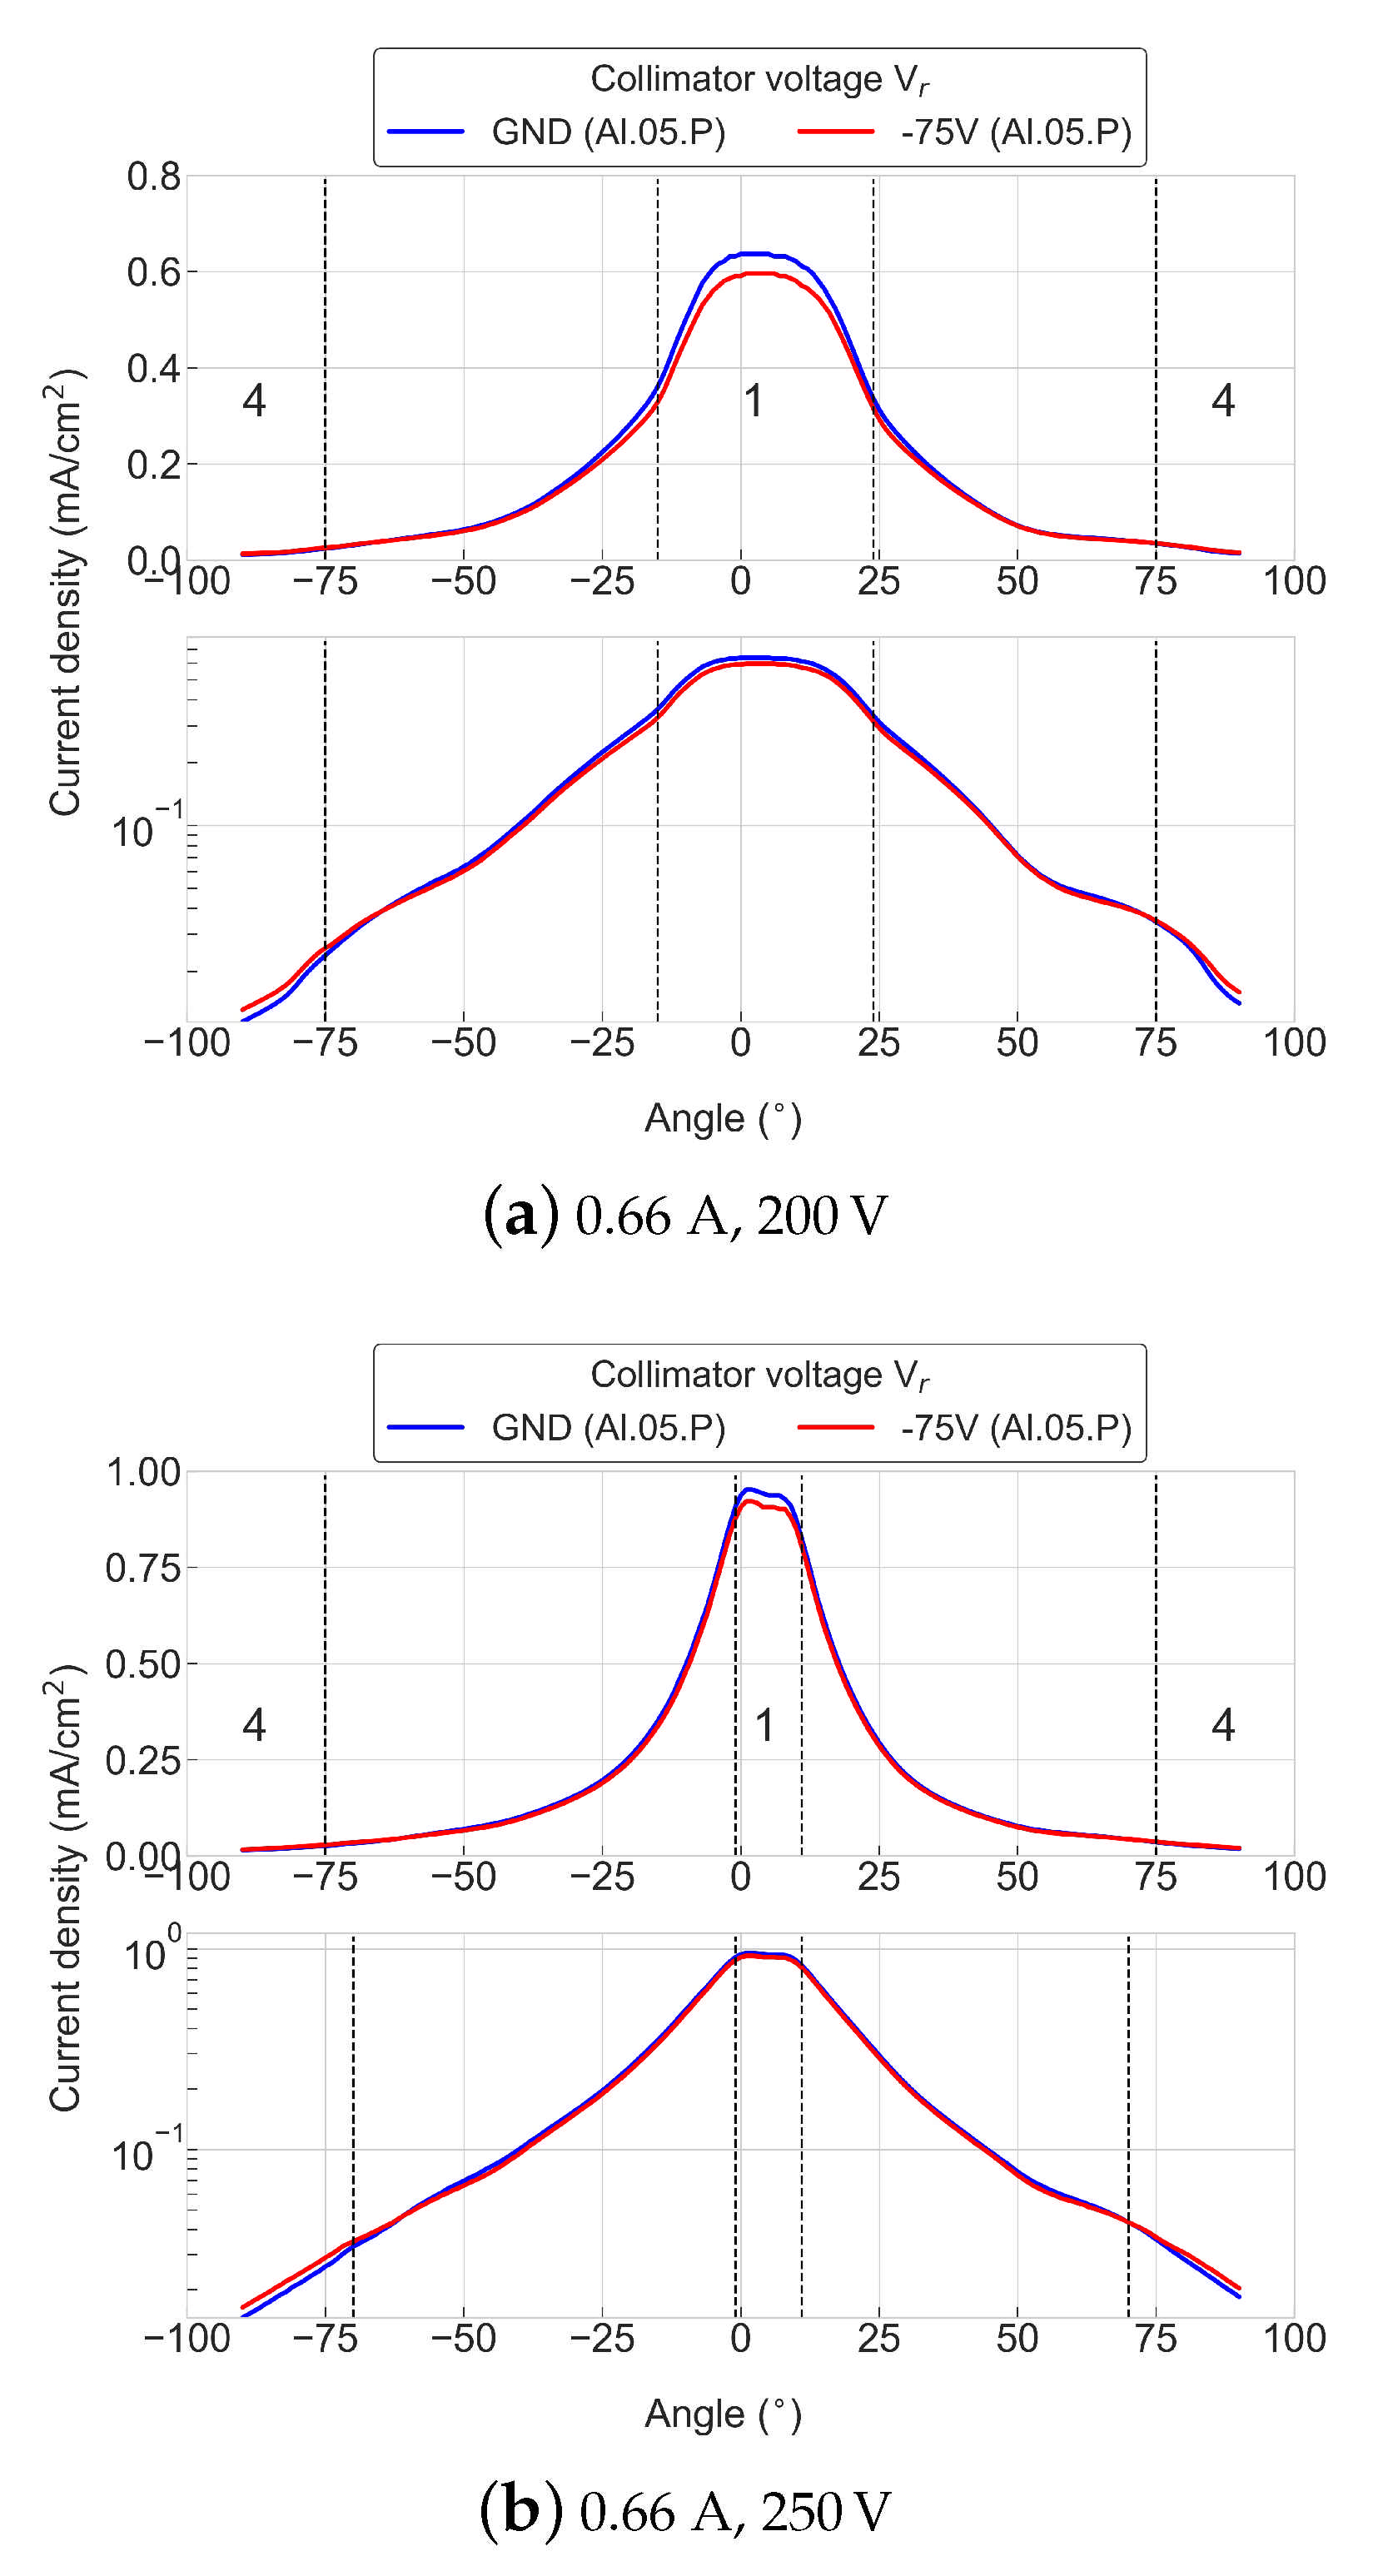
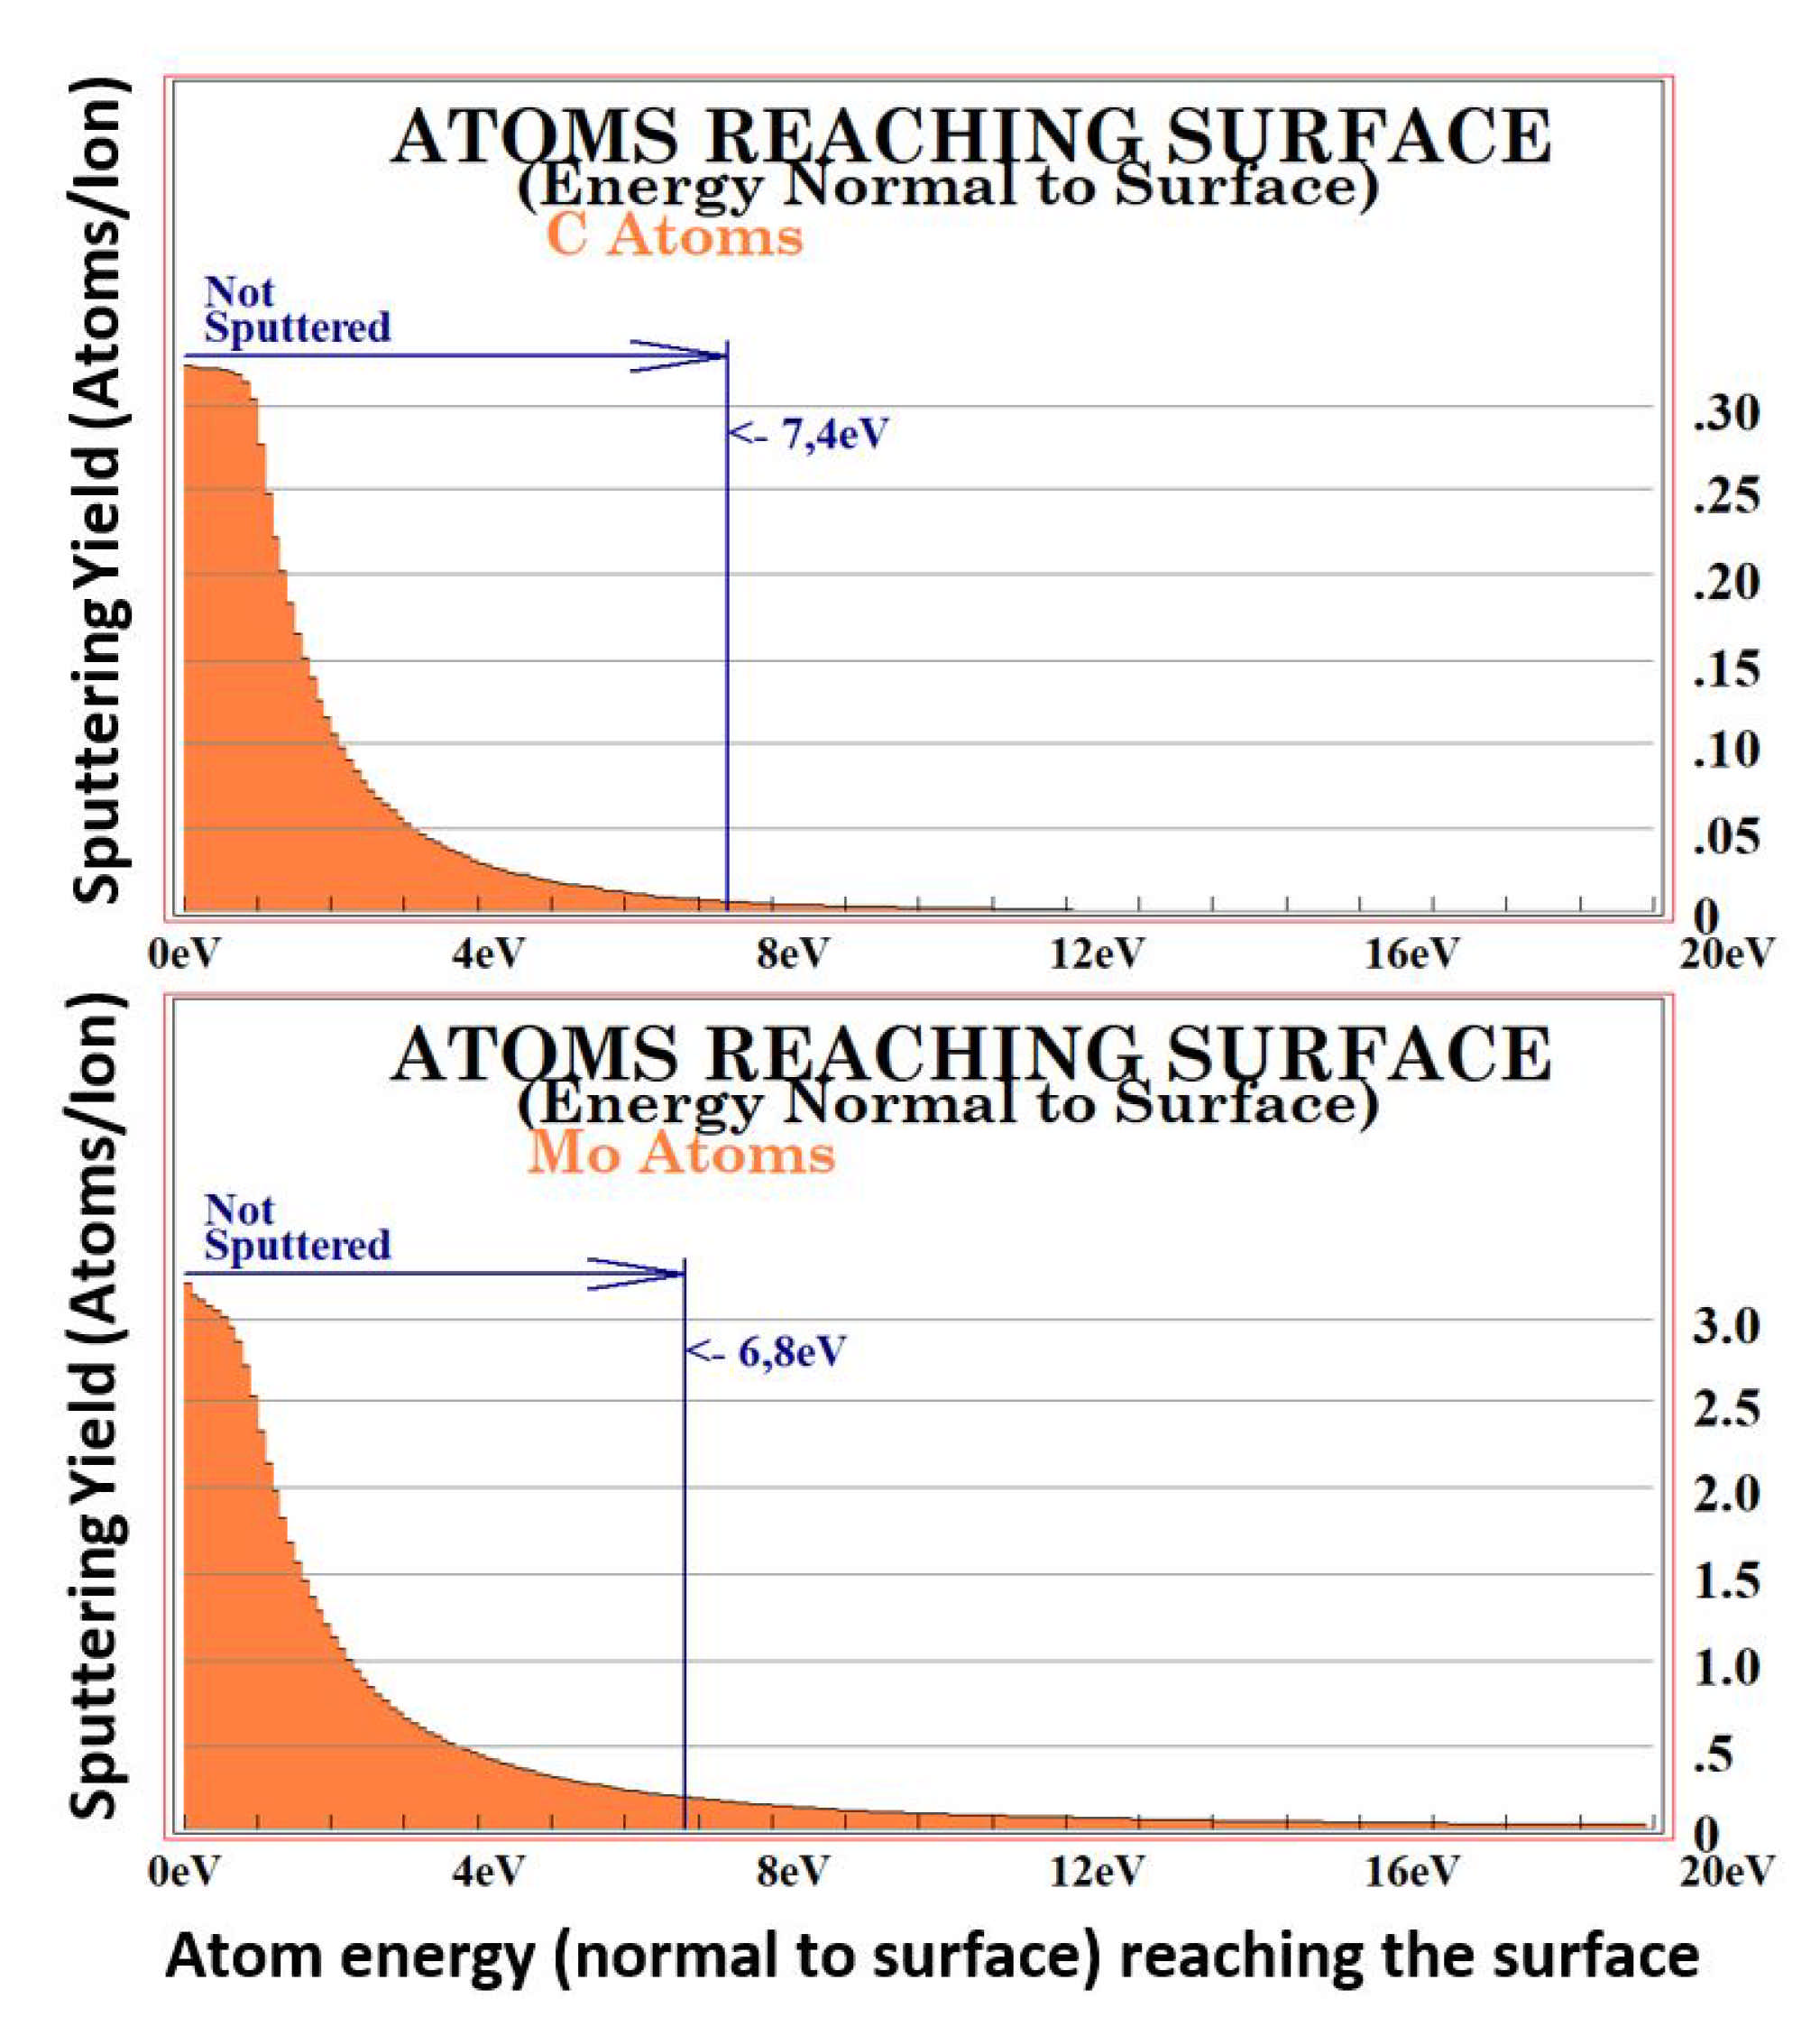
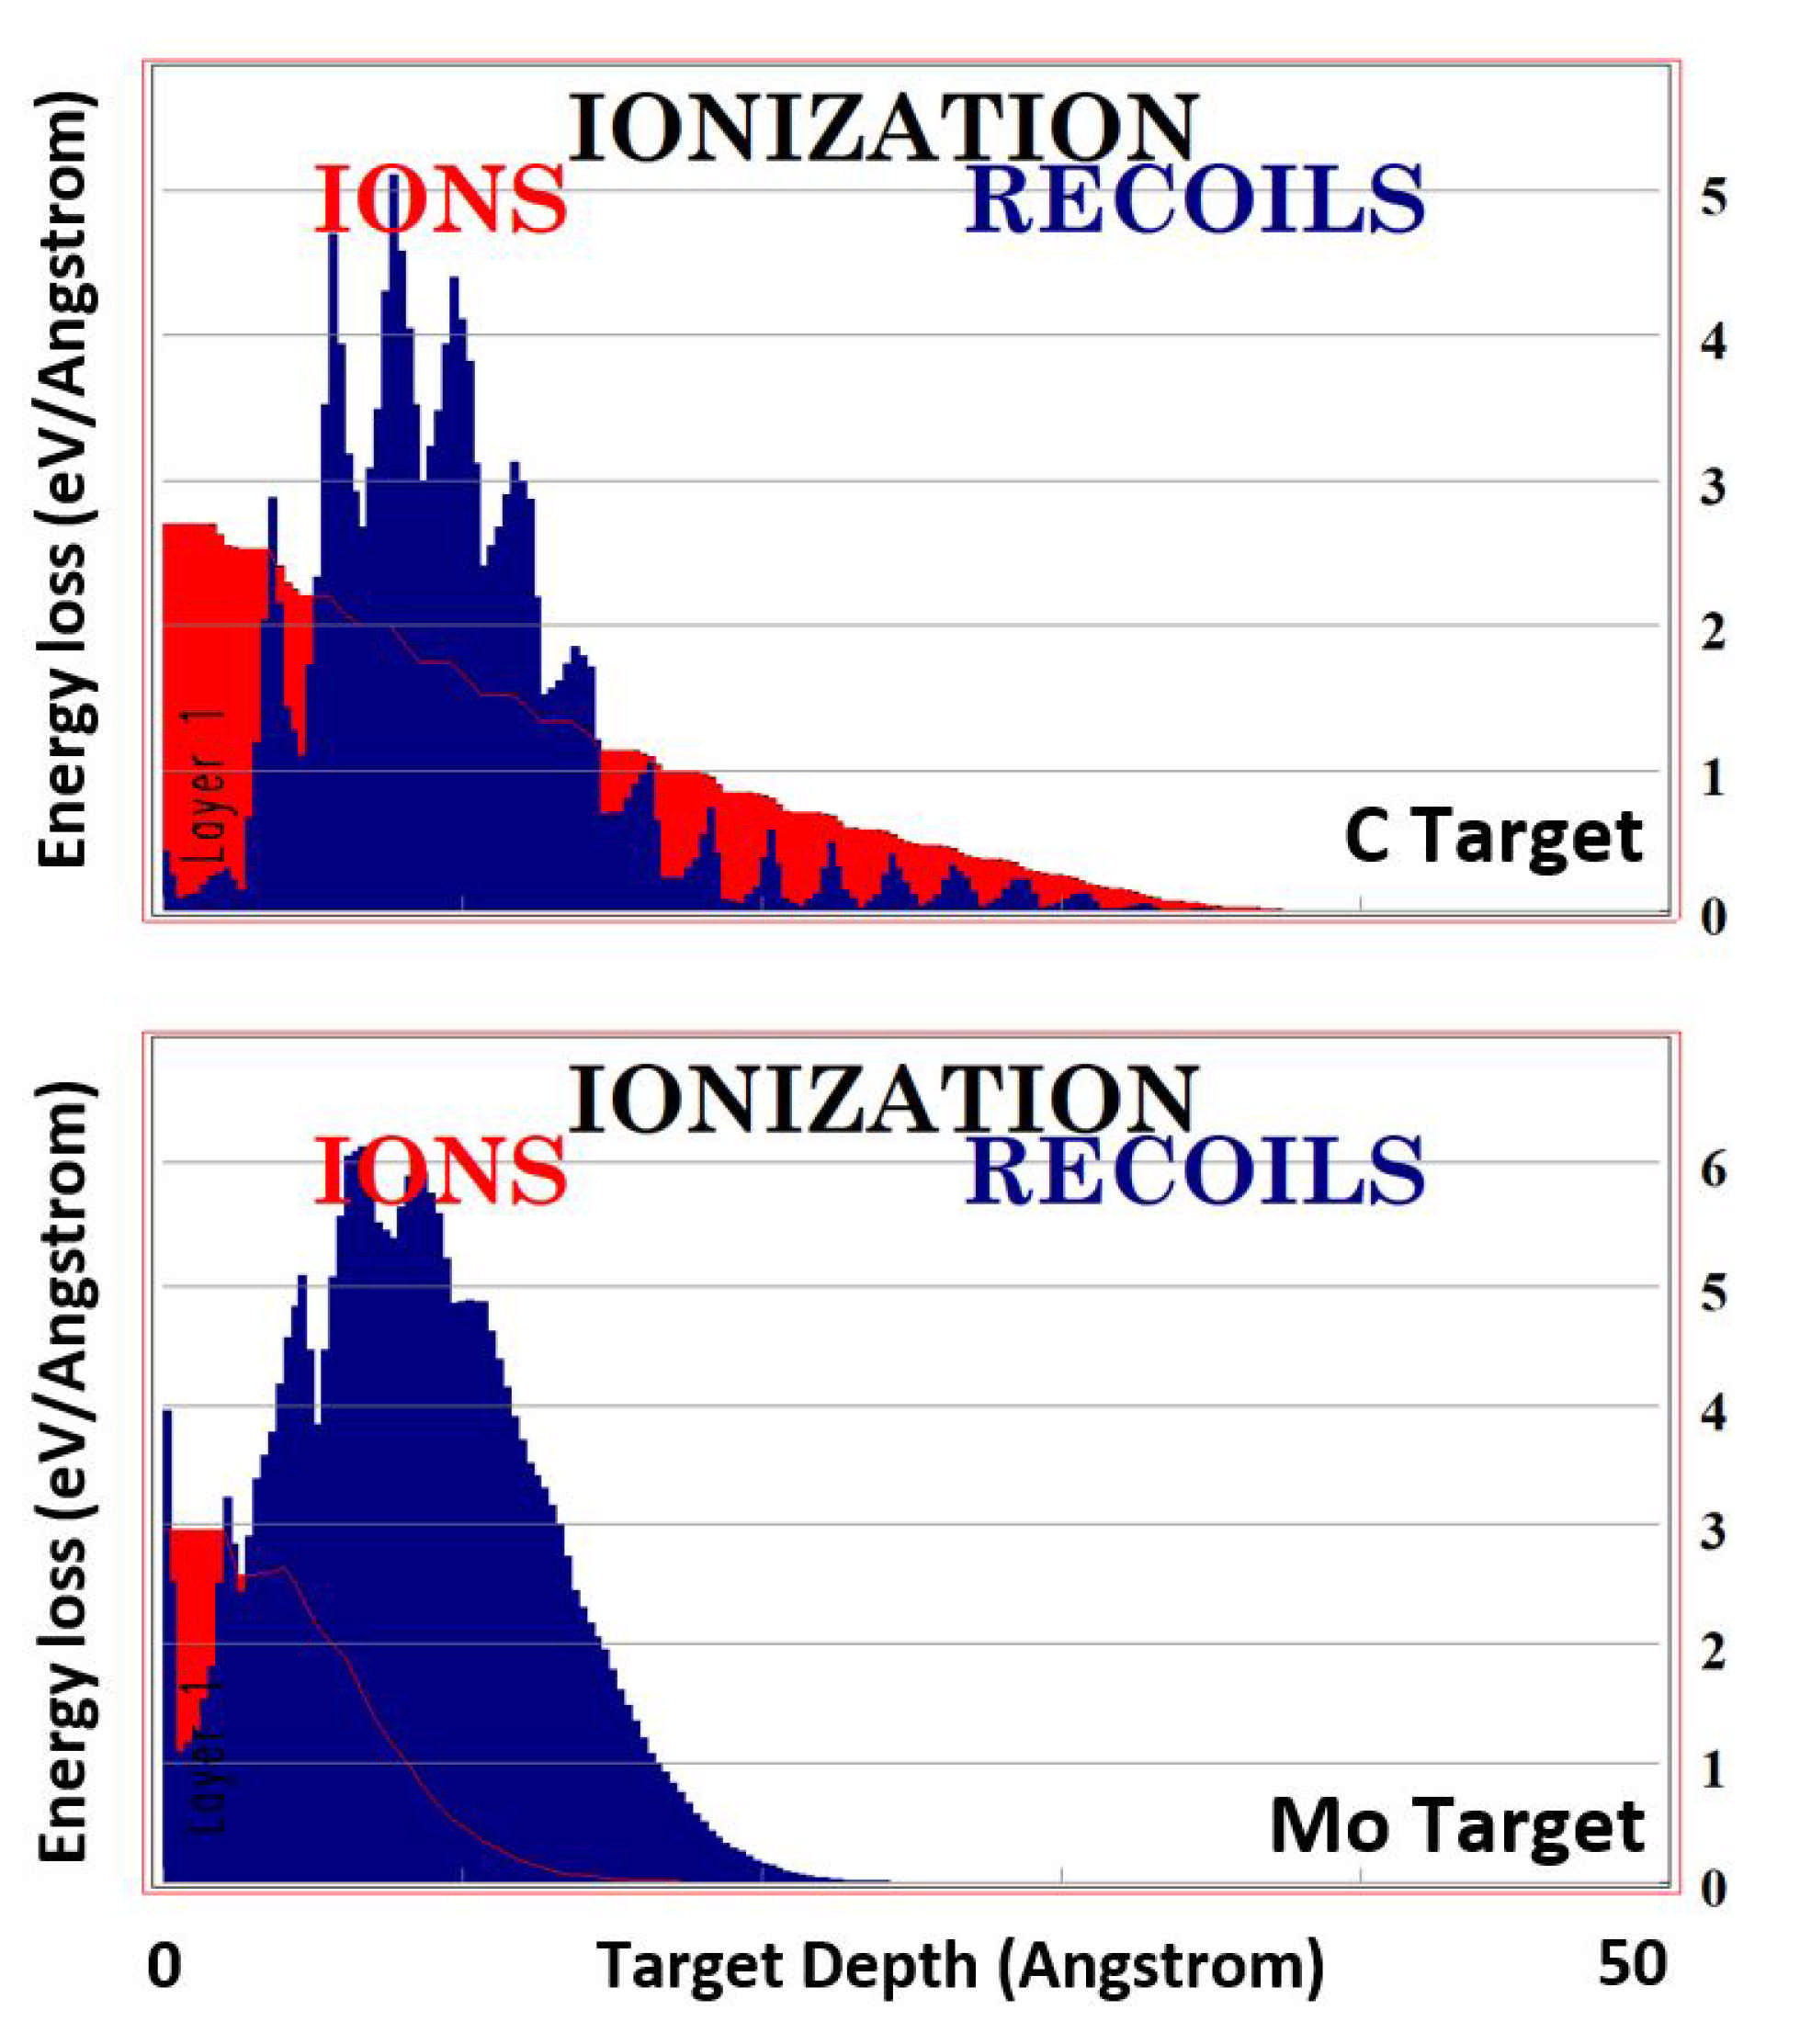
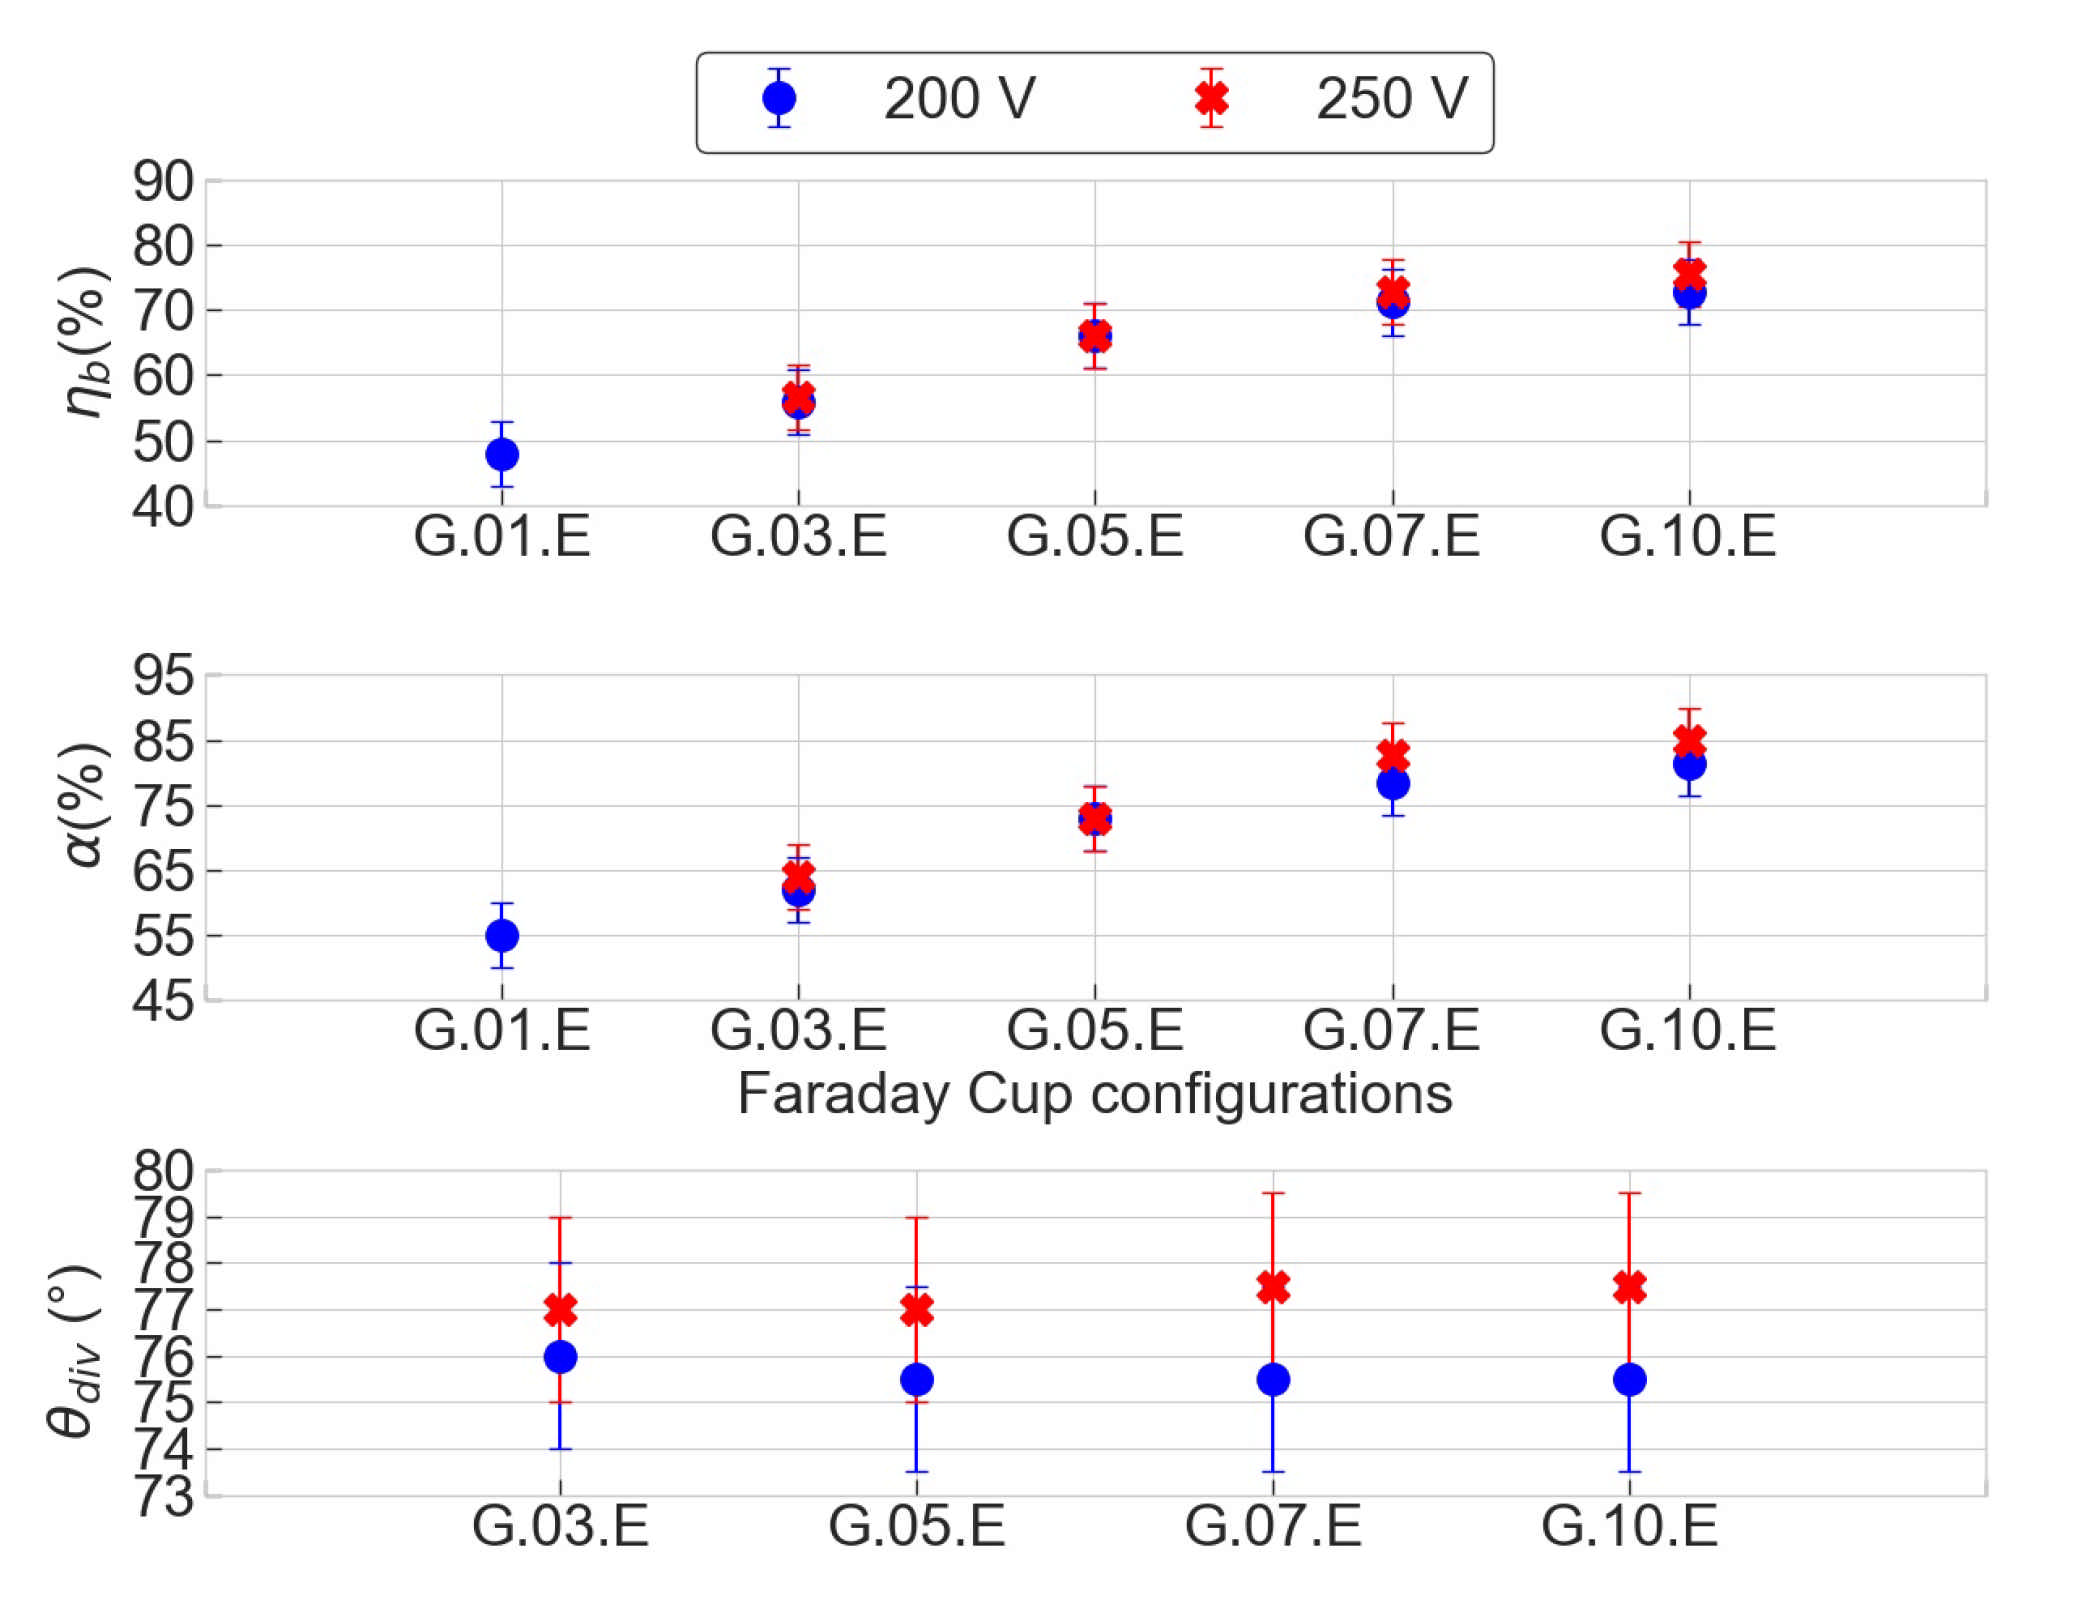
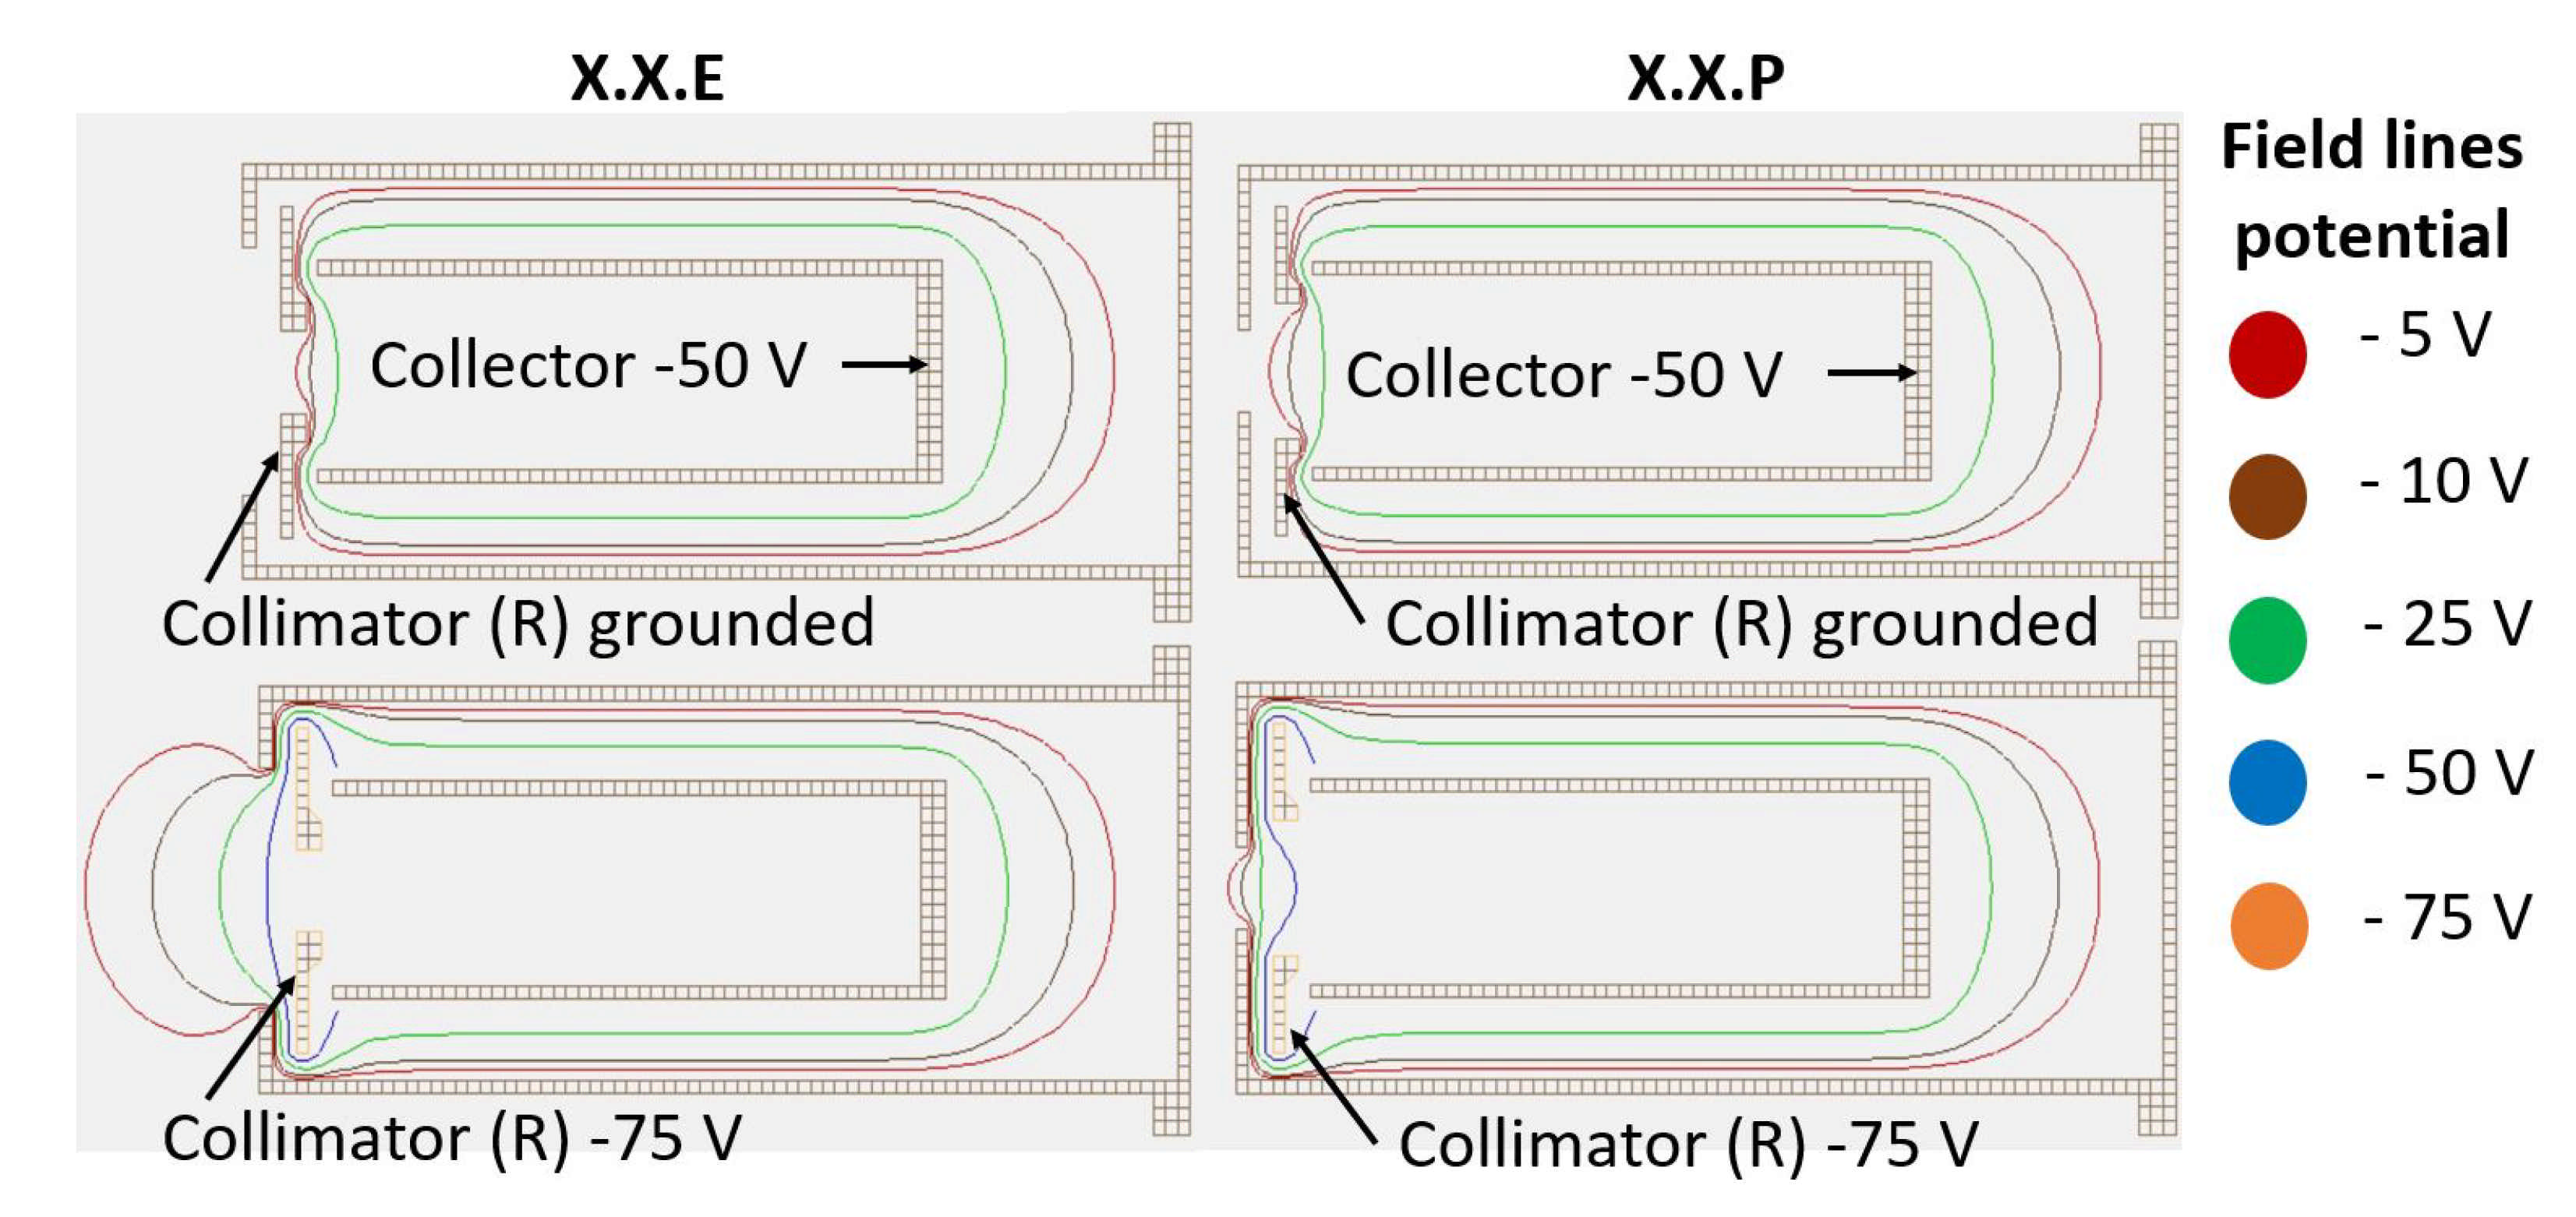
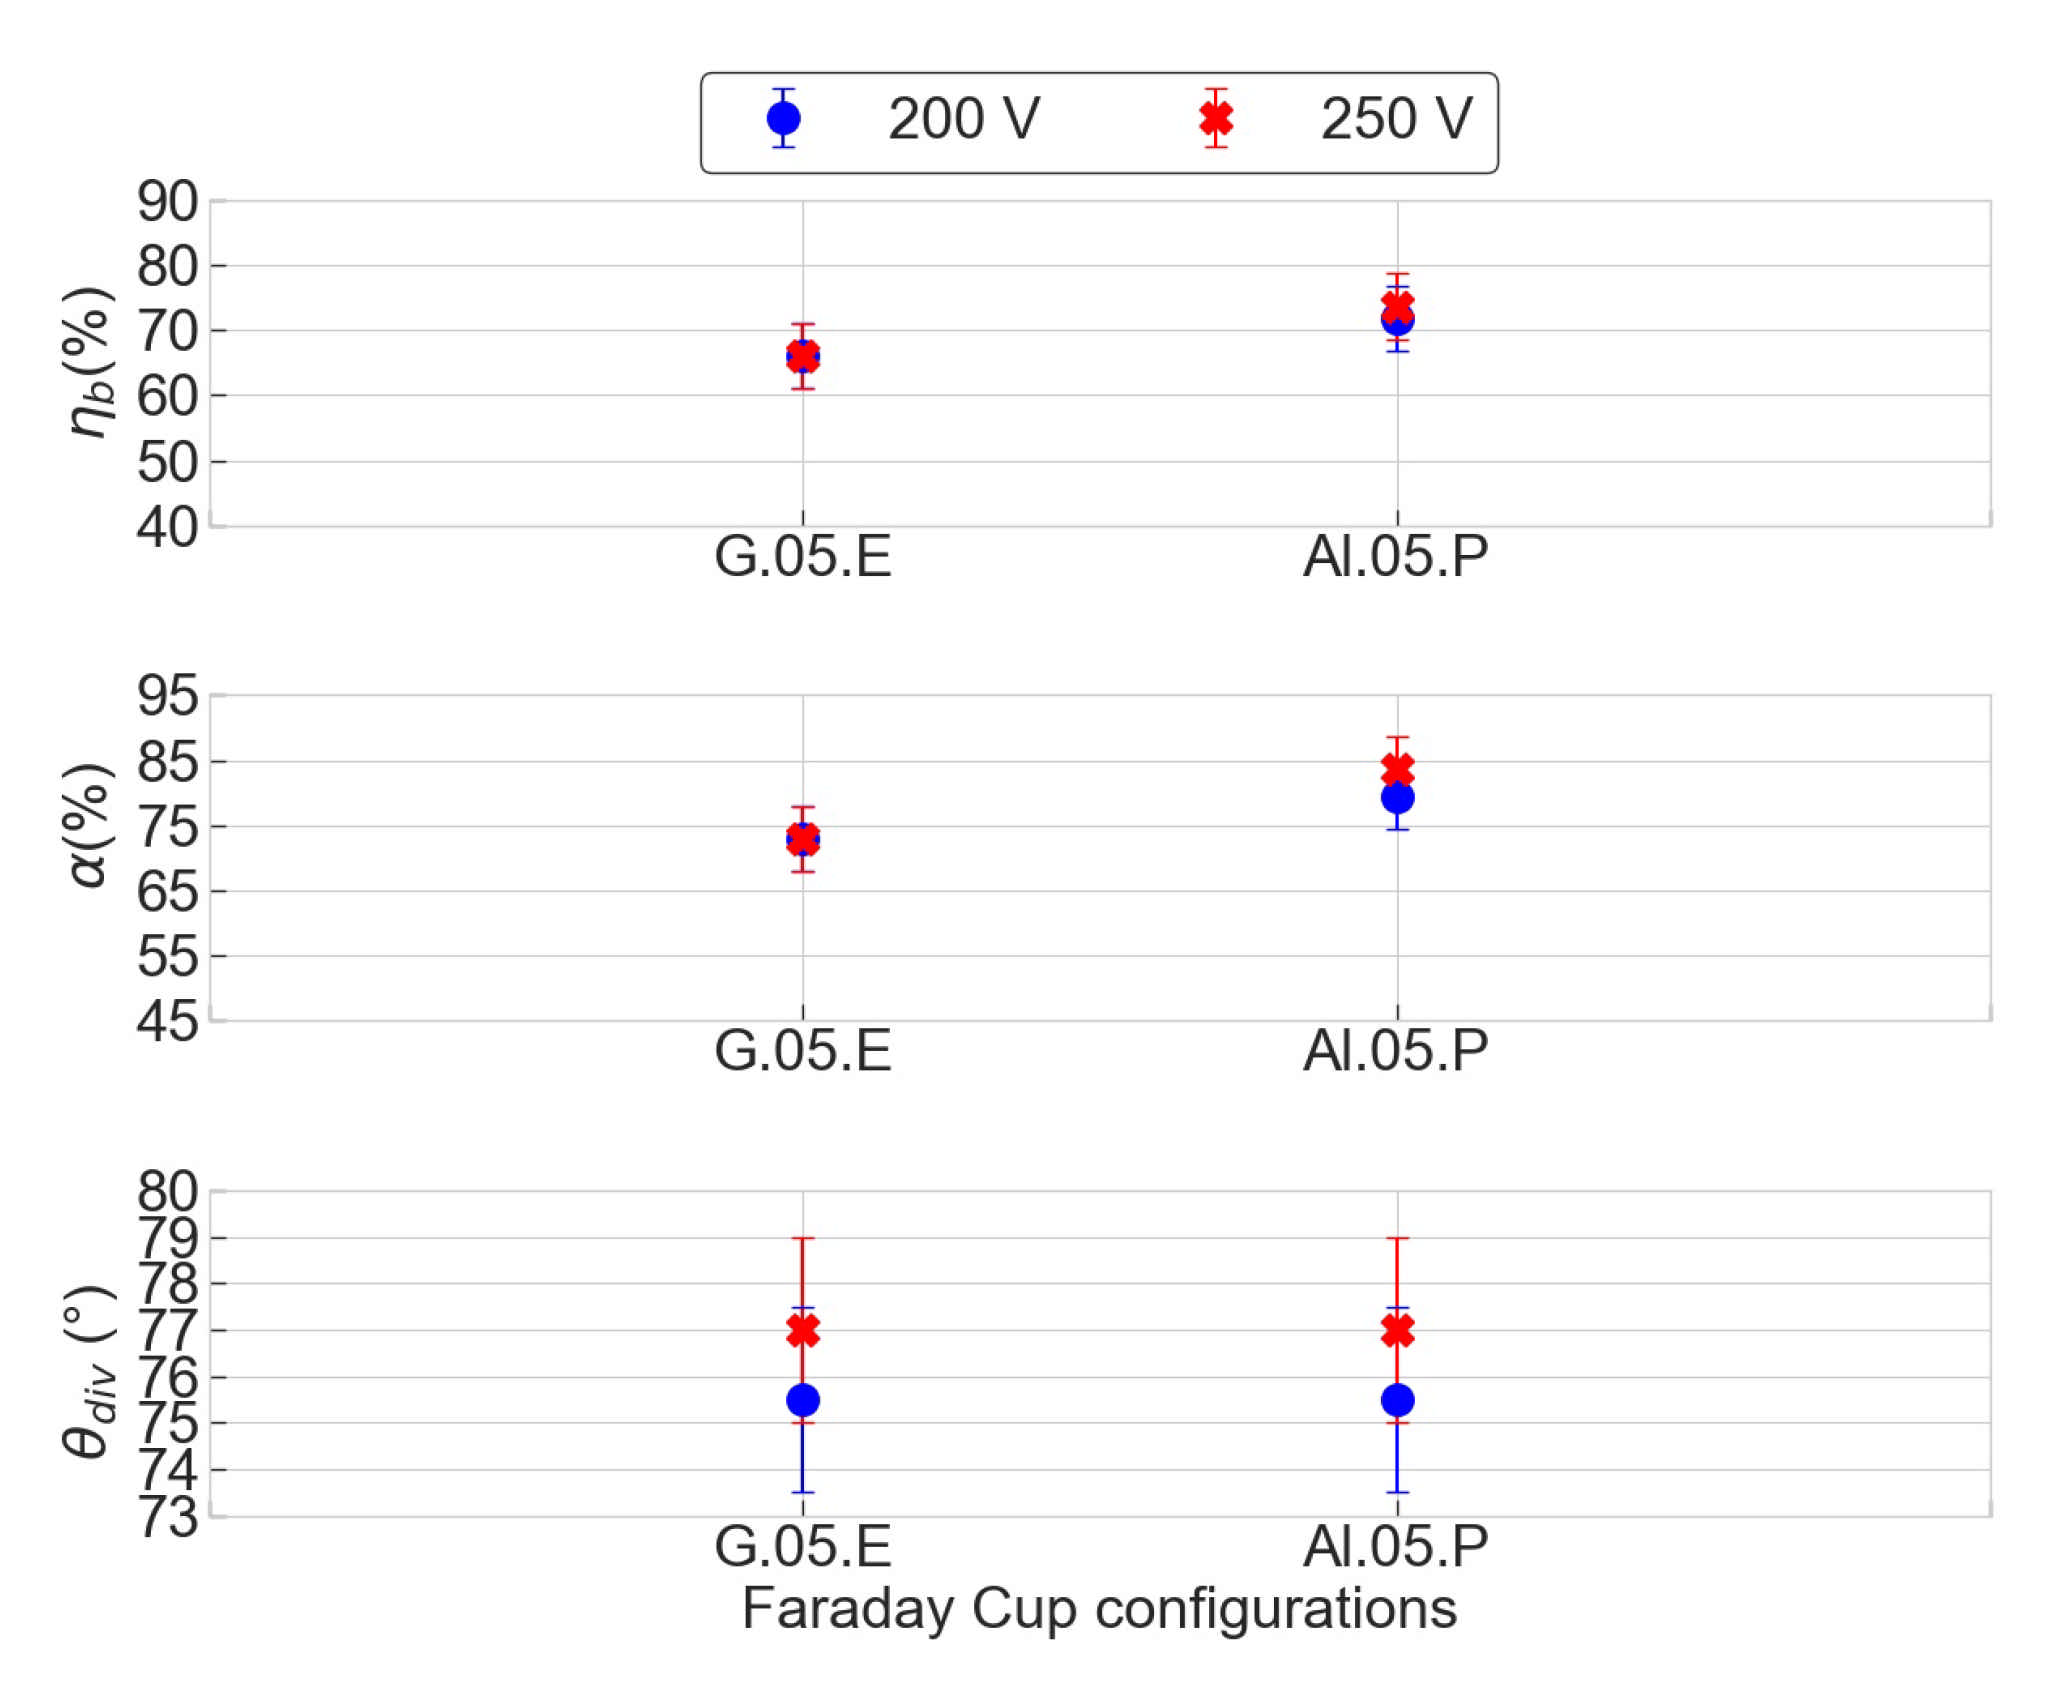
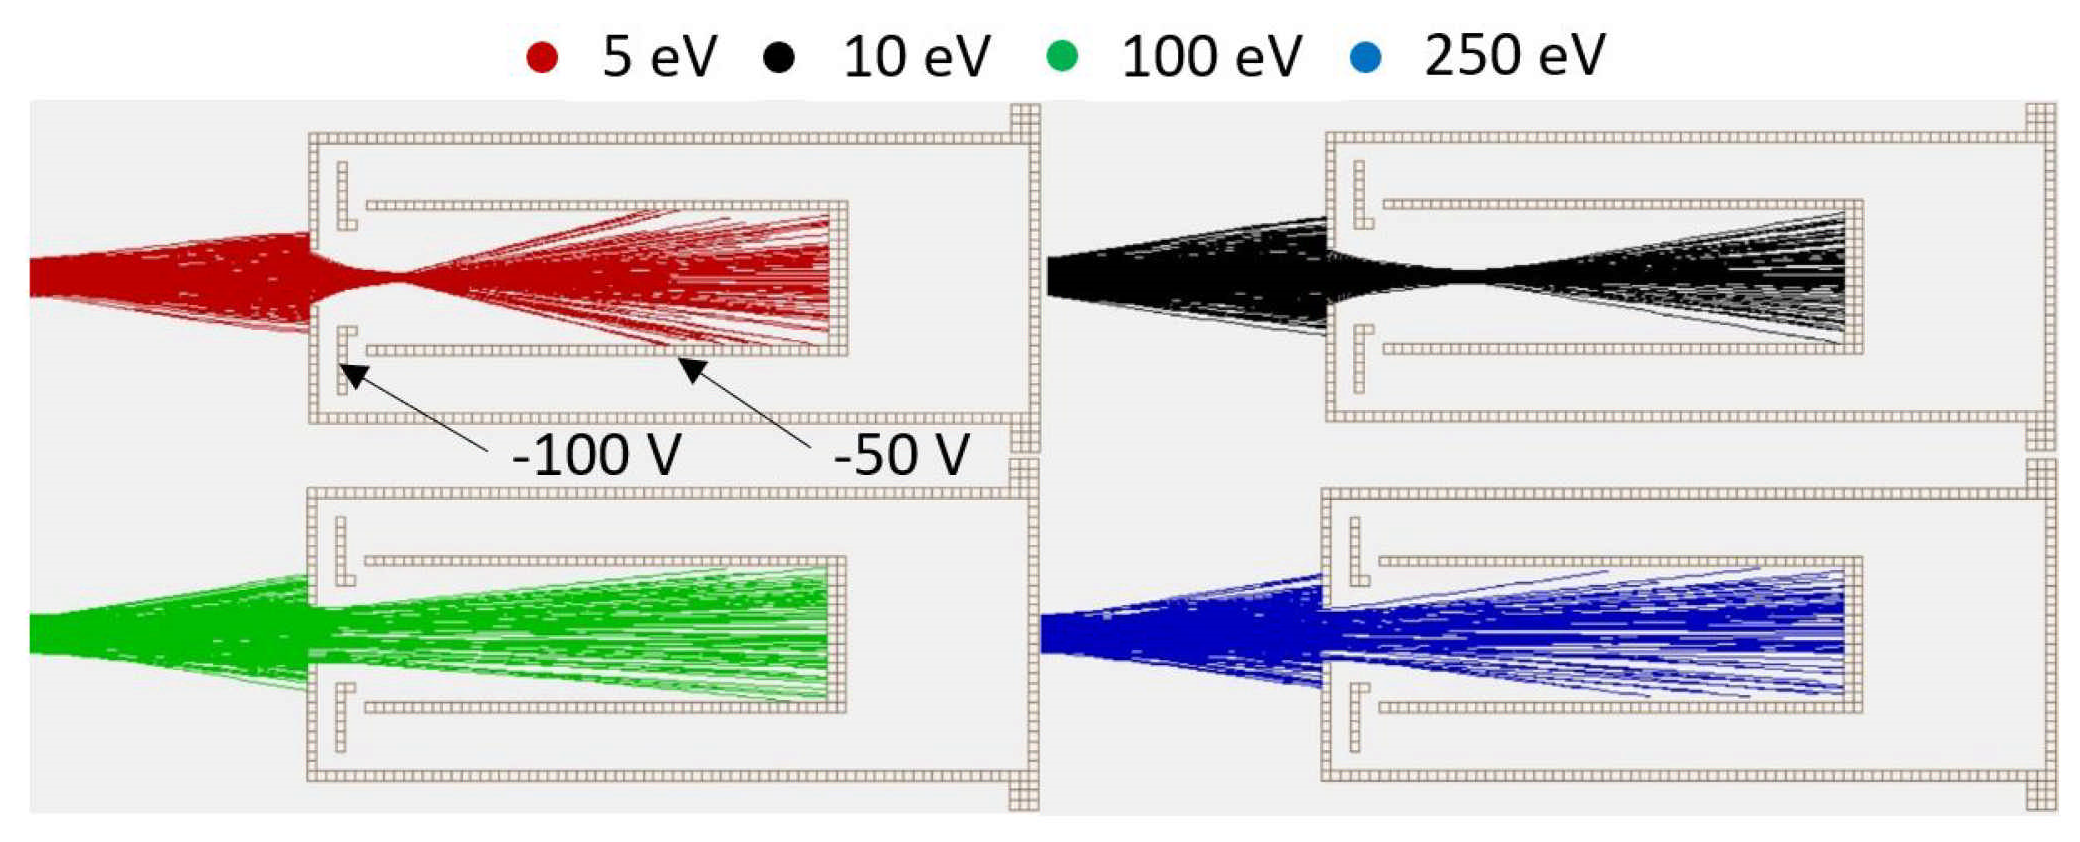
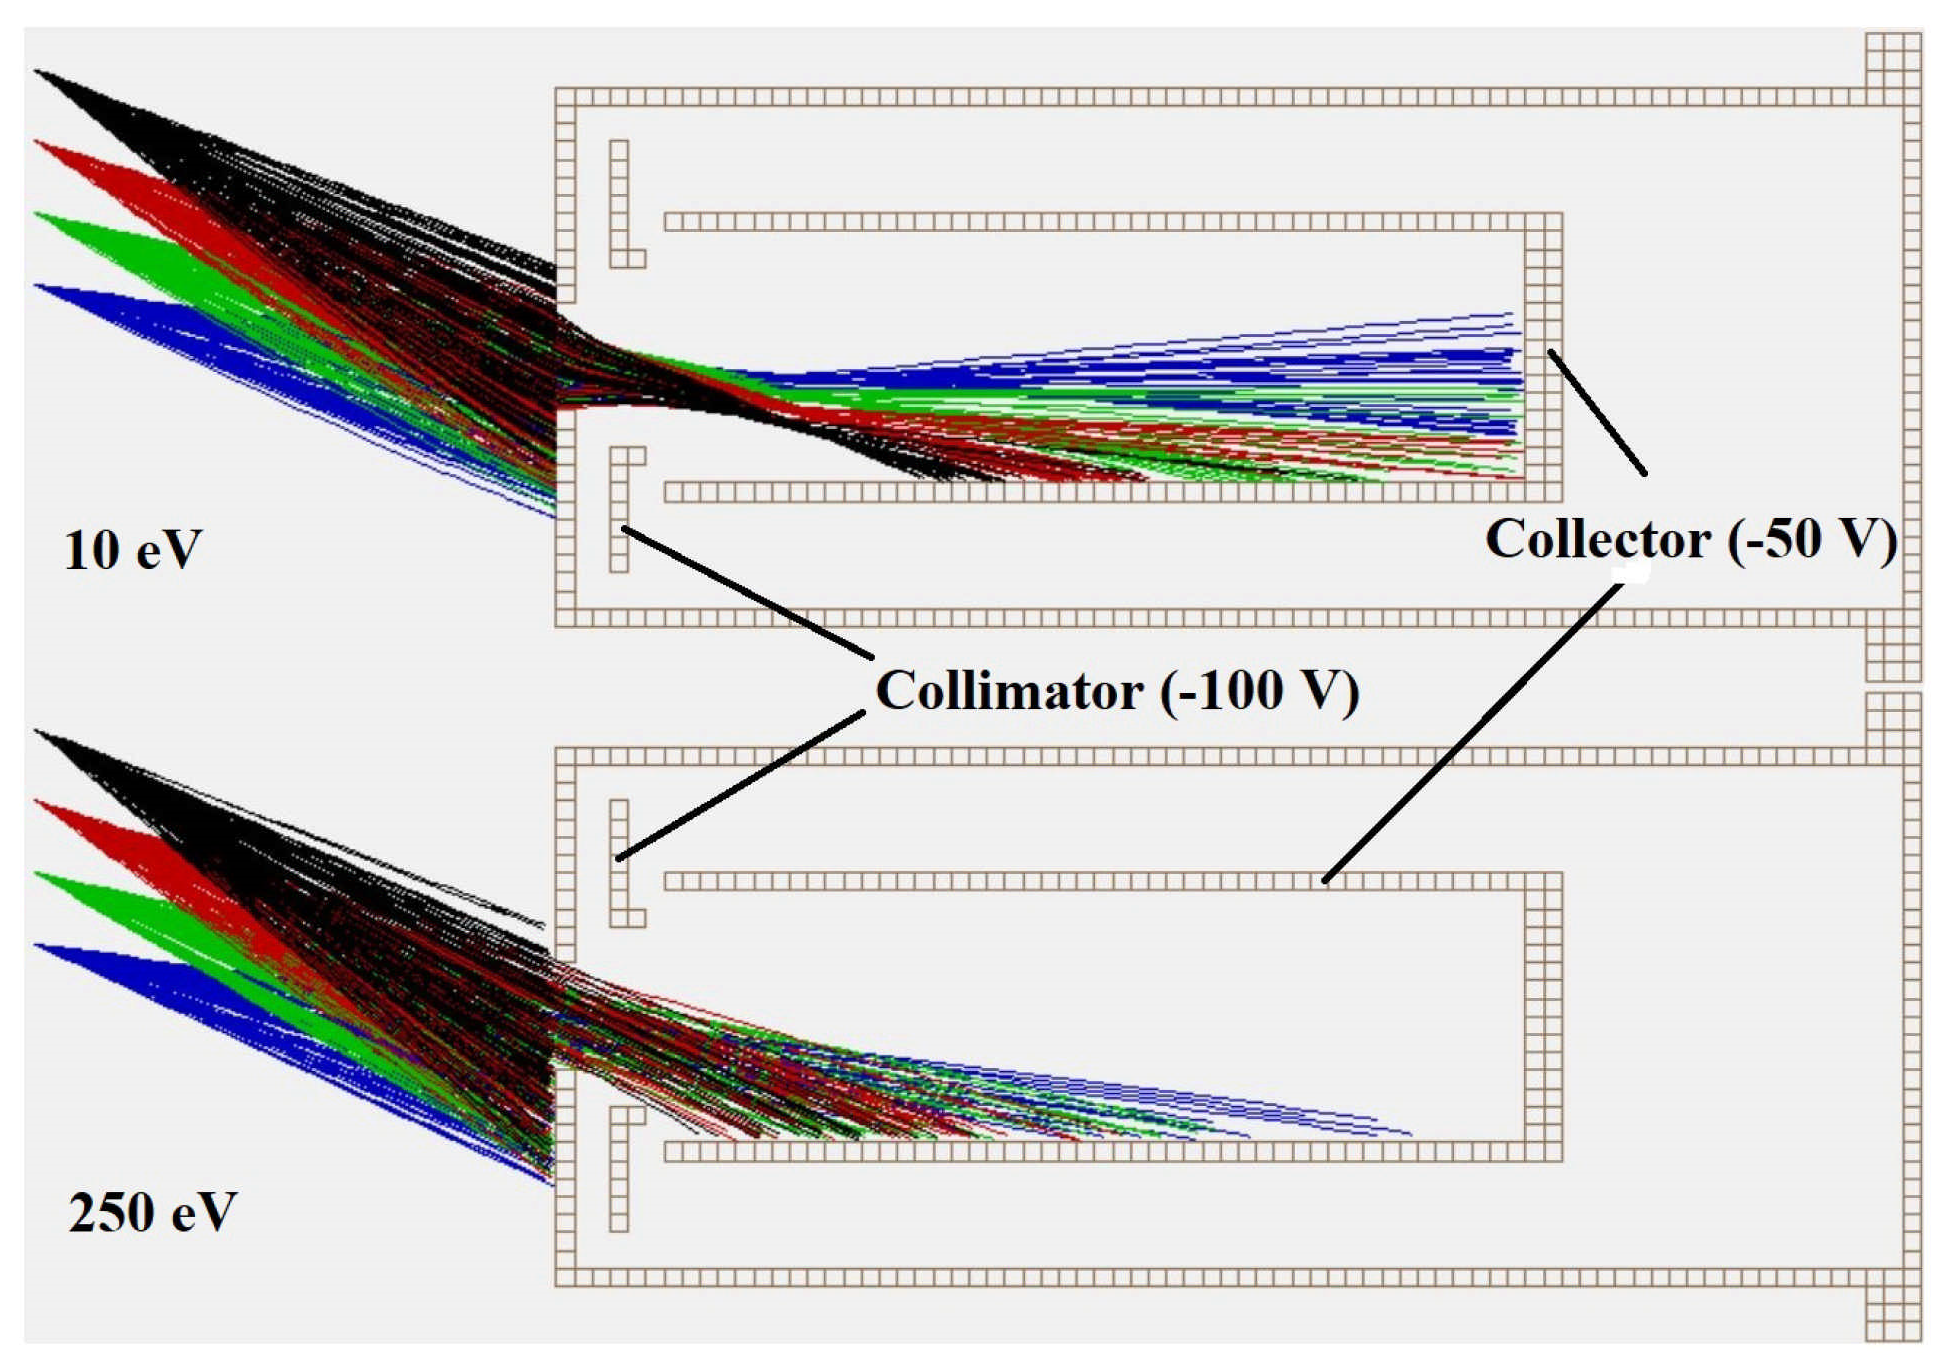
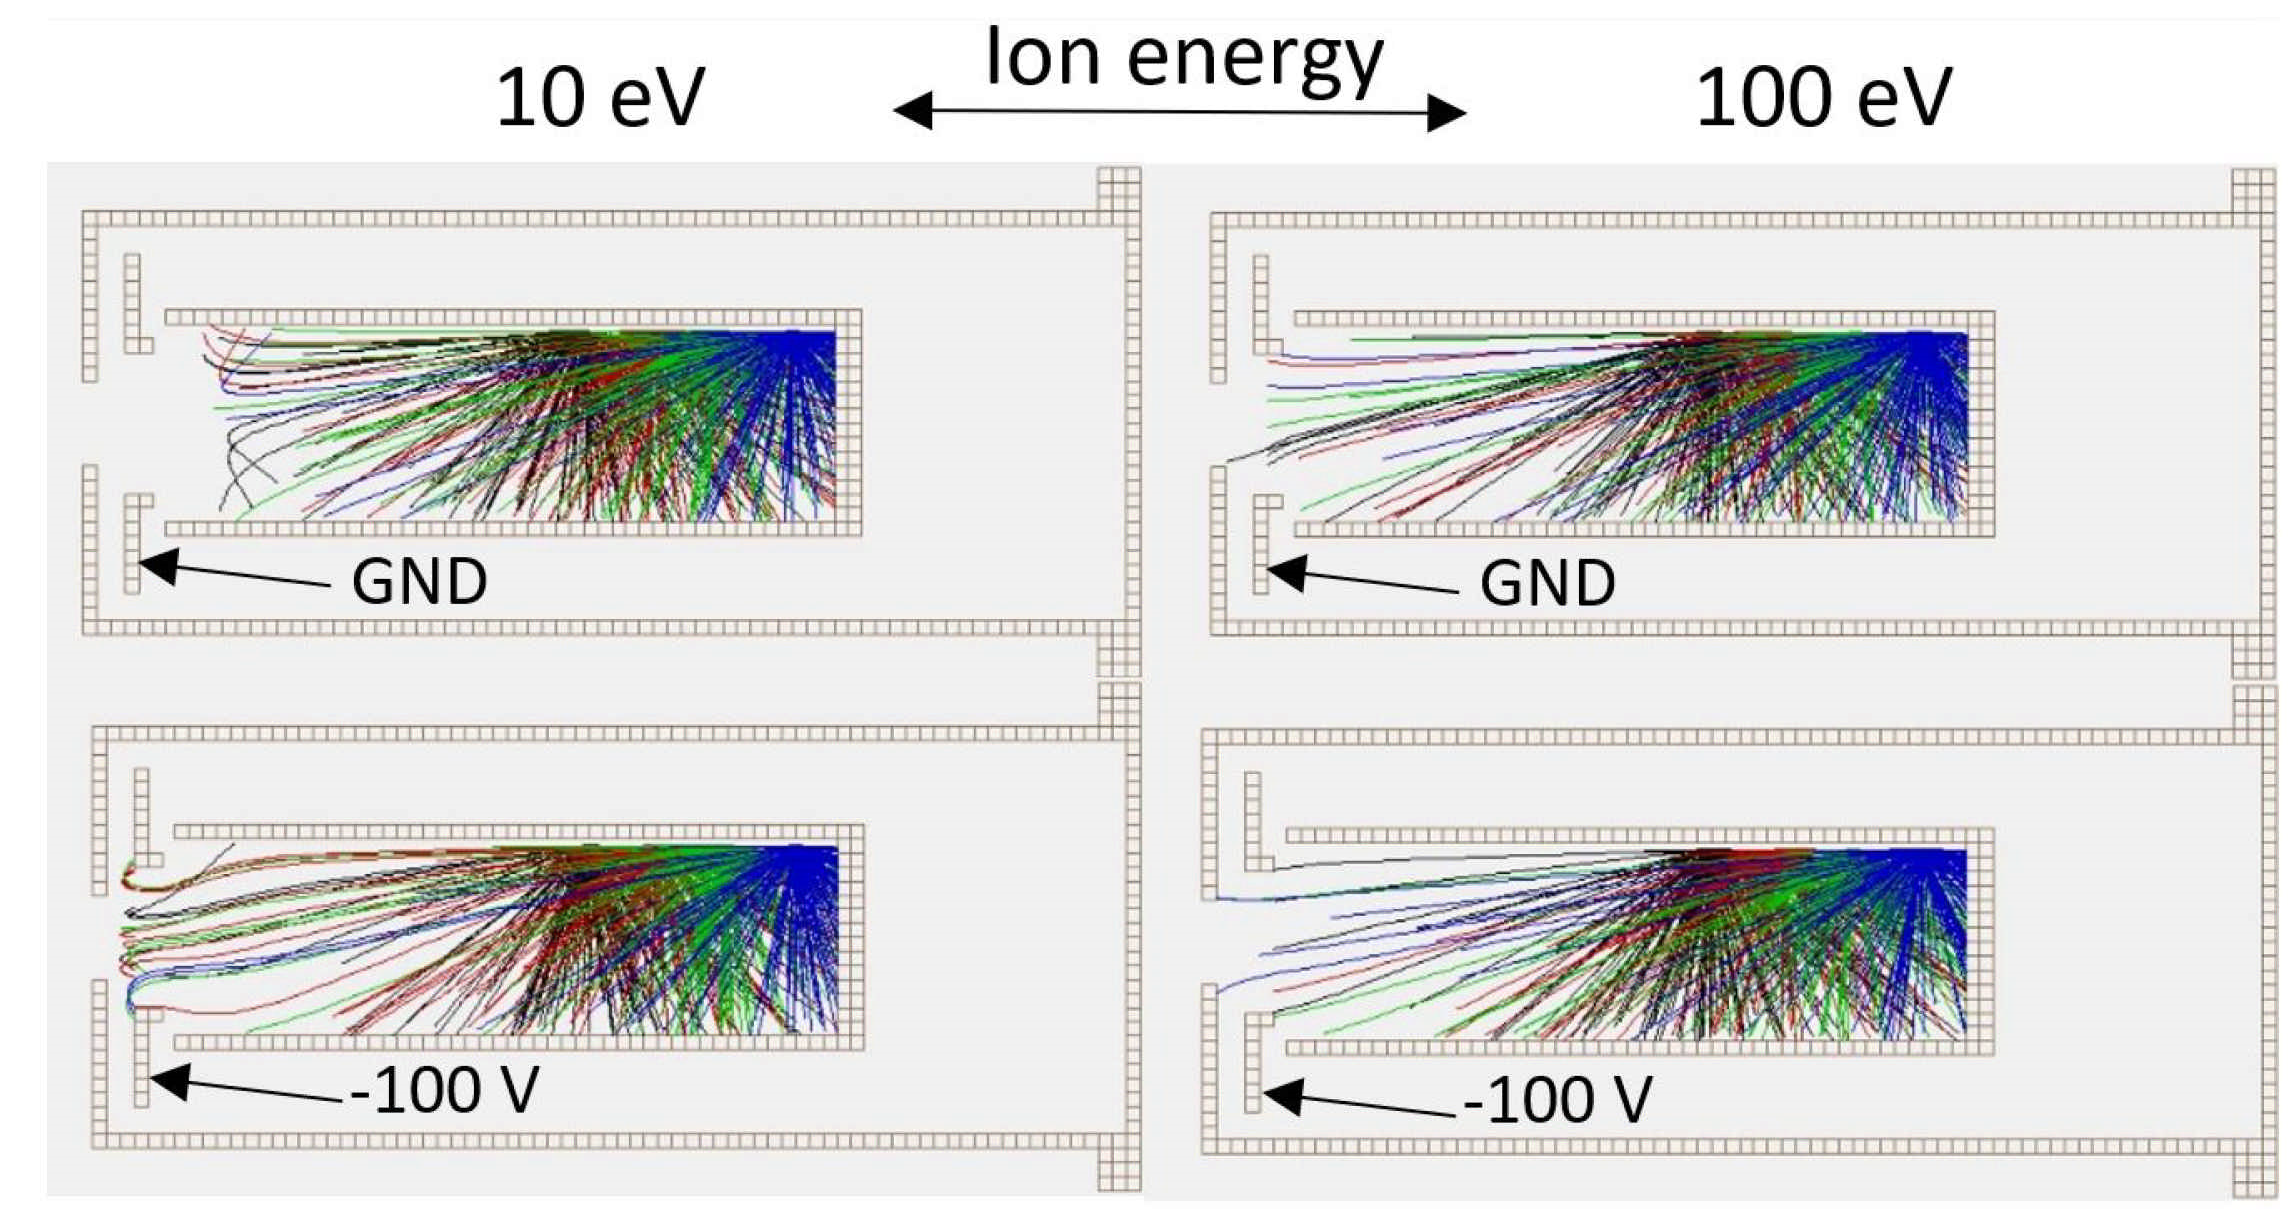
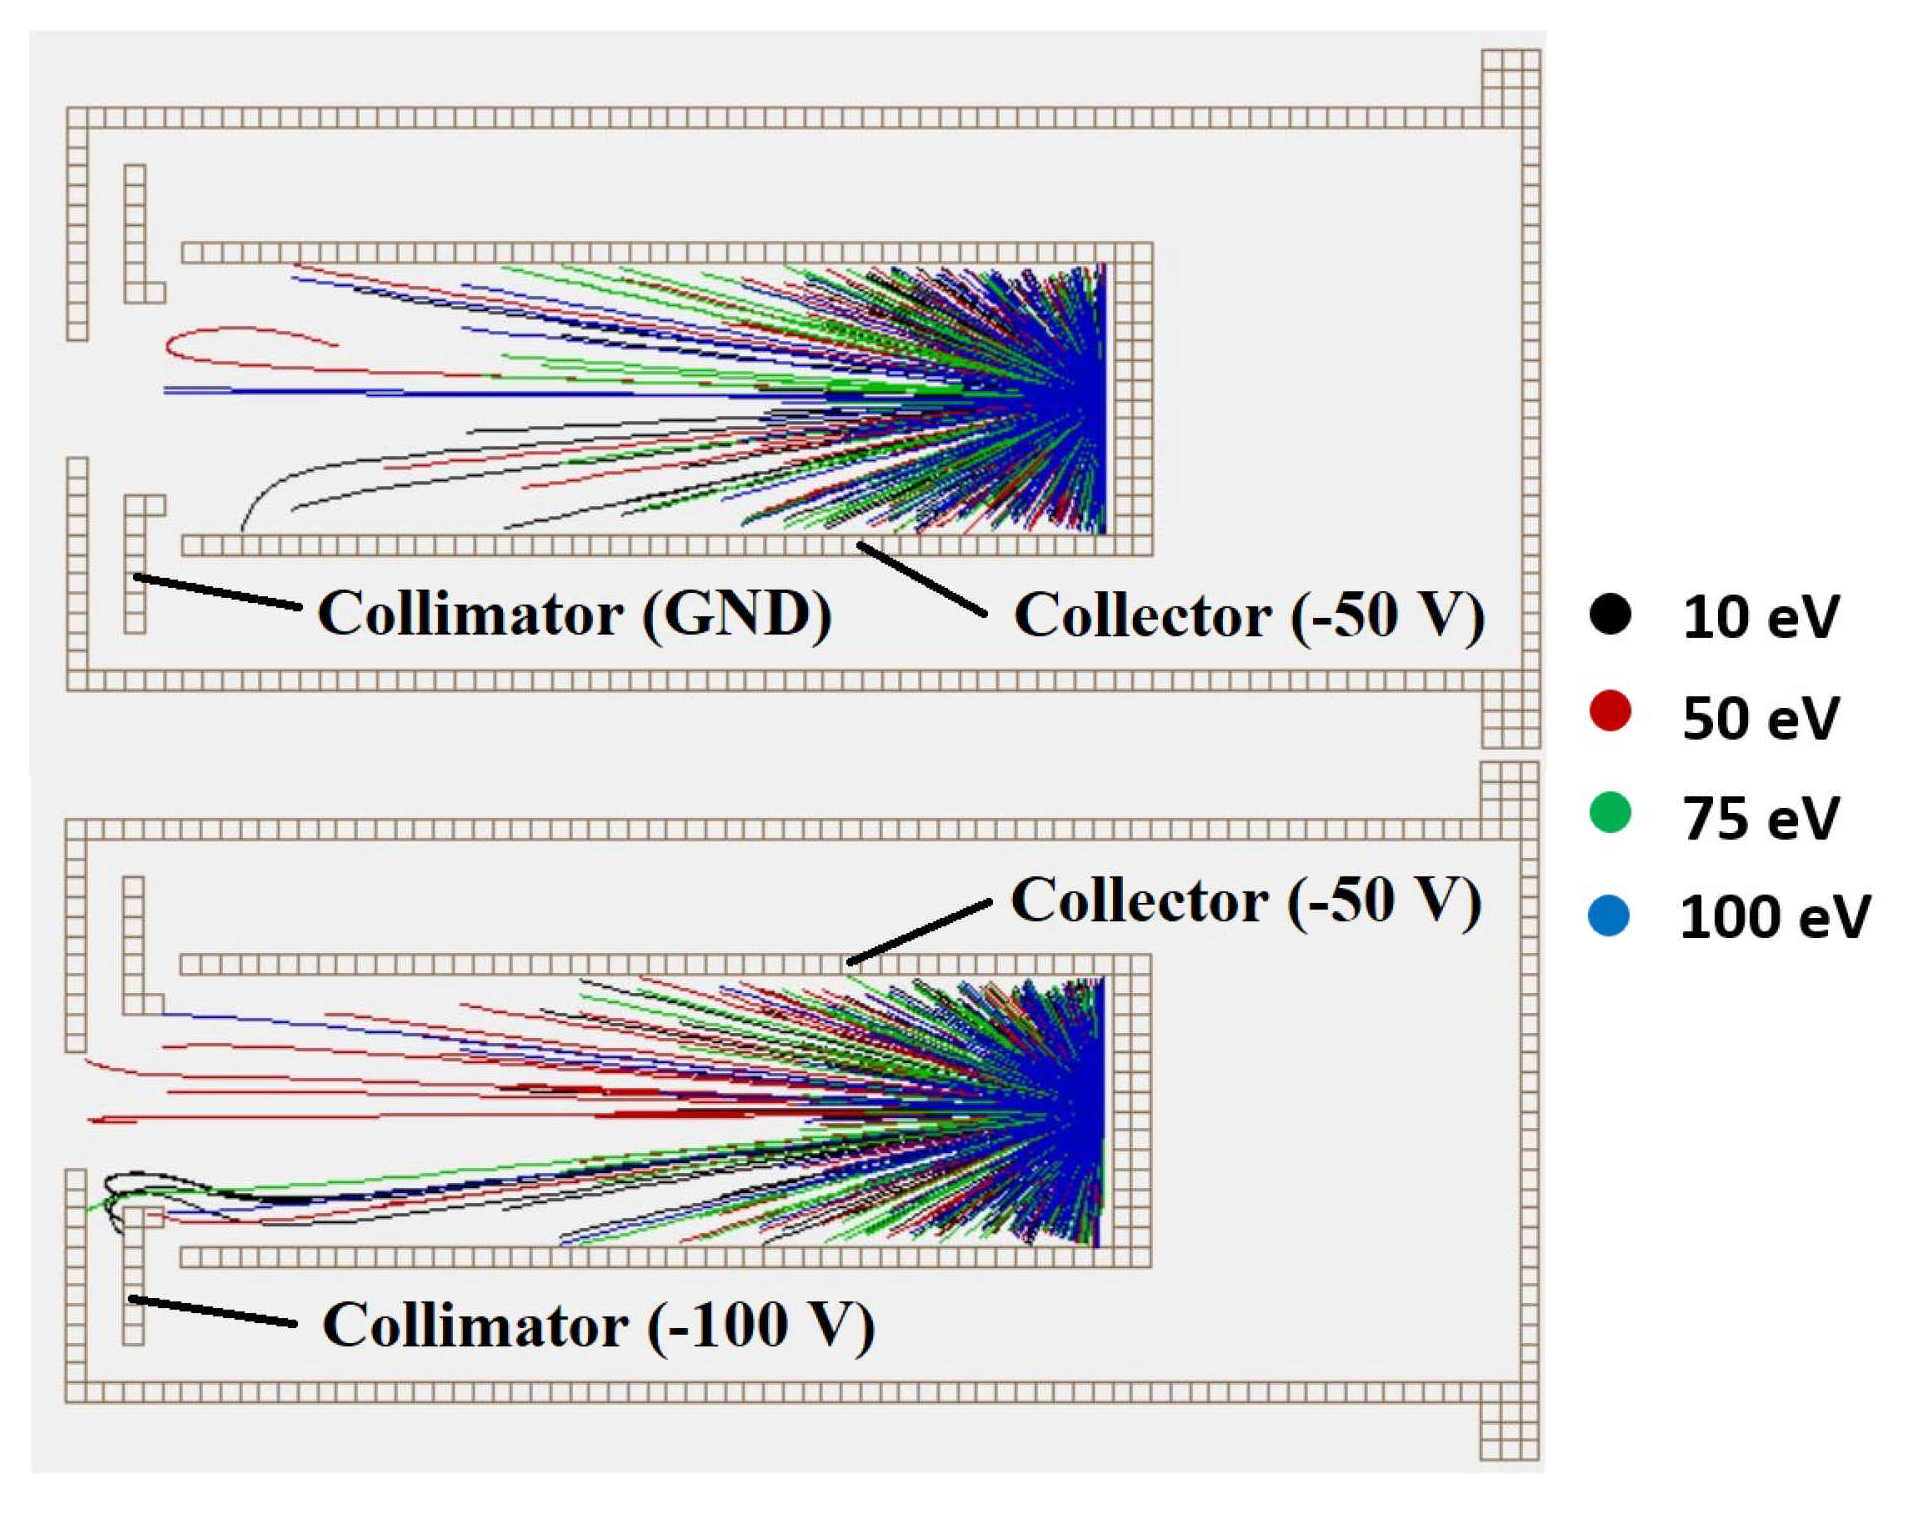
Table 1.
Heat-up, ignition, measurements and shut down procedure of the ISCT200.
| Step | Action | Duration |
|---|---|---|
| # | # | min |
| 1 | Cathode heating (16–18 A) | 20 |
| 2 | Thruster ignition (200 V and 1 mg/s) | |
| 3 | Hall thruster stabilization | 30 |
| 4 | Setting of the operation point and stabilization | 5 |
| 5 | Measurements | |
| 6 | Next operation point and stabilization | 5 |
| Repeat step 5 and 6 if needed | ||
| 7 | Thruster shutdown | |
| 8 | Cathode shutdown |
Table 2.
Hall thruster firing parameters.
| Discharge Voltage (U) | Discharge Current (I) | Anode Mass Flow Rate () |
|---|---|---|
| V | A | mg/s |
| 200 | 0.66 | 0.815 |
| 250 | 0.66 | 0.79 |
Table 3.
Solid angle for a given collimator diameter.
| Diameter | Solid Angle |
|---|---|
| mm | ° |
| 10 | 11.4 |
| 7 | 8.0 |
| 5 | 5.7 |
| 3 | 3.4 |
| 1 | 1.1 |
Table 4.
Sputtering yield coefficient computed for different discharge voltages with the software SRIM [64].
Table 4.
Sputtering yield coefficient computed for different discharge voltages with the software SRIM [64].
| Material | Sputtering Yield (200 V) | Sputtering Yield (250 V) |
|---|---|---|
| Carbon (Graphite) | 0.0018 | 0.0056 |
| Molybdenum | 0.13 | 0.18 |
| Aluminum | 0.11 | 0.16 |
Publisher’s Note: MDPI stays neutral with regard to jurisdictional claims in published maps and institutional affiliations. |
© 2021 by the authors. Licensee MDPI, Basel, Switzerland. This article is an open access article distributed under the terms and conditions of the Creative Commons Attribution (CC BY) license (http://creativecommons.org/licenses/by/4.0/).
Share and Cite
MDPI and ACS Style
Valentin, H.; Stéphane, M. Optimization of a Faraday Cup Collimator for Electric Propulsion Device Beam Study: Case of a Hall Thruster. Appl. Sci. 2021, 11, 2419. https://0-doi-org.brum.beds.ac.uk/10.3390/app11052419
AMA Style
Valentin H, Stéphane M. Optimization of a Faraday Cup Collimator for Electric Propulsion Device Beam Study: Case of a Hall Thruster. Applied Sciences. 2021; 11(5):2419. https://0-doi-org.brum.beds.ac.uk/10.3390/app11052419
Chicago/Turabian StyleValentin, Hugonnaud, and Mazouffre Stéphane. 2021. "Optimization of a Faraday Cup Collimator for Electric Propulsion Device Beam Study: Case of a Hall Thruster" Applied Sciences 11, no. 5: 2419. https://0-doi-org.brum.beds.ac.uk/10.3390/app11052419
Note that from the first issue of 2016, this journal uses article numbers instead of page numbers. See further details here.