
Optimal Planning Method for Large-Scale Historical Exhibits in the Taiwan Railway Museum

Department of Geography, National Taiwan University, Taipei 10617, Taiwan
*
Author to whom correspondence should be addressed.
Appl. Sci. 2021, 11(5), 2424; https://0-doi-org.brum.beds.ac.uk/10.3390/app11052424
Submission received: 12 February 2021
/
Revised: 3 March 2021
/
Accepted: 4 March 2021
/
Published: 9 March 2021
(This article belongs to the Special Issue AI and HCI Methods and Techniques for Cultural Heritage Curation, Exploration and Fruition)
Abstract
:The curation design of cultural heritage sites, such as museums, influence the level of visitor satisfaction and the possibility of revisitation; therefore, an efficient exhibit layout is critical. The difficulty of determining the behavior of visitors and the layout of galleries means that exhibition layout is a knowledge-intensive, time-consuming process. The progressive development of machine learning provides a low-cost and highly flexible workflow in the management of museums, compared to traditional curation design. For example, the facility’s optimal layout, floor, and furniture arrangement can be obtained through the repeated adjustment of artificial intelligence algorithms within a relatively short time. In particular, an optimal planning method is indispensable for the immense and heavy trains in the railway museum. In this study, we created an innovative strategy to integrate the domain knowledge of exhibit displaying, spatial planning, and machine learning to establish a customized recommendation scheme. Guided by an interactive experience model and the morphology of point–line–plane–stereo, we obtained three aspects (visitors, objects, and space), 12 dimensions (orientation, visiting time, visual distance, centrality, main path, district, capacity, etc.), 30 physical principles, 24 suggestions, and five main procedures to implement layout patterns and templates to create an exhibit layout guide for the National Railway Museum of Taiwan, which is currently being transferred from the railway workshop for the sake of preserving the rail culture heritage. Our results are suitable and extendible to different museums by adjusting the criteria used to establish a new recommendation scheme.
1. Introduction
The number of international tourists increased by 4% in 2019, by a total of 1.5 billion. The share of leisure travel grew from 50% in 2008 to 56%, and the international tourism expenditure was up to USD 1.4 billion in 2018 [1]. With the increase in leisure time and the level of education and income, many people like to travel to cultural tourism destinations to acquire different cultural experiences. Tourism is not only an important leisure activity, but it is also one of the fastest-growing industries in the world [2]. About 70% of tourists participate in culture tourism [3].
The museum is usually regarded as culturally significant and one of the world’s most important destinations [2,3,4,5]. Tourists like to visit museums to engage in and learn about the local culture and heritage [6]. A museum opens to the public by displaying the tangible and intangible heritage of the local culture by creating an environment suitable for education, study, and enjoyment [7]. Visiting the museum is a delightful leisure activity [8,9]; there has been a significant increase in the number of people interested in attending museums.
In Taiwan, the first museum was built in 1908 during the Japanese colonial period; the purpose was to investigate and study the natural resources and culture of Taiwan. In 1946, the Taiwan Provincial Government took over the museums established in Taiwan during the Japanese occupation. In 1949, lots of precious cultural relics were transported from Mainland China to Taiwan’s National Museum of History and the Palace Museum, which were built during 1950–1960 [10]. Huang stated that the development of museums in Taiwan could be divided into four stages: initial period, recovered period, revitalized period, and prosperous period [10] (Table 1). From the development of museums in Taiwan, we can broadly interpret the historical changes and cultural appearance. Nowadays, there are 486 museums in Taiwan with diverse types and multiscale runners in 2020 [11]. The first and unique national railway museum is currently under construction in Taiwan.
The railway was the main transportation mode in Taiwan from 1887 to 1978, and passenger and freight transportation by railways was the artery of the national economy. After the first Expressway was opened in 1978, the convenience of private vehicles changed the transportation pattern. During this time, Taiwan’s development significantly increased; everything was demand-oriented in terms of economic development. At that time, because the concept of preserving cultural heritage had not yet become a commonplace idea, many railway-related buildings, facilities, stations, and equipment have been demolished. In recent years, as the government and private sector have paid more and more attention to preserving cultural heritage, railway-related buildings and culture have been reevaluated and cherished, and they have tried their best to preserve those as important resources for tourism and recreation.
The Taipei Railway Workshop (TRW) was set up in 1935 at the present site in the Xinyi District of Taipei City to maintain the railway facilities and equipment of the Taiwan Railway Administration (TRA). Taipei, the capital city of Taiwan, had experienced rapid urban sprawl from 1949. The exponential growth of the Taipei metropolitan area population resulted in heavy traffic jams, especially in railway intersections. For a better-quality living environment, Taipei City residents petitioned the government to move the railway from aboveground to underground in the 1970 [12]. The underground railway project from Keelung City to Shulin District, which was 40.11 km in length, was started by the Railway Reconstruction Bureau in 1983, and the project was fulfilled in 2011.
After the railway had been reconstructed underground in the Taipei metropolitan area, TRW lost its original function and ceased operations in 2012. As the TRW had existed for almost 80 years, all railway facilities and equipment were regarded as industrial and cultural heritage and were preserved. In 2015, the Taiwan central government decided to establish a National Railway Museum in Taiwan (NRMT) at the site of the workshop, which is 17.03 ha in size. The Ministry of Culture announced that the NRMT would be fully operational by 2027 and expressed hope that there will be up to 510,000 visitors.
Railways and related facilities are important heritage tourism resources that encompass a range of attractions and experiences, and there have been cases of built railway heritage conversions around the world of differing scales and perceived success [13]. Railway museums are popular, as they are services with a history of their own; many countries have established national railway museums to preserve the cultural features of the railway and economic development (Table 2)—the Queensland Railway Museum in Australia is quite similar to TRW in size and maintenance.
Museum buildings are generally either purpose-built or conversions, and museums should be established or managed based on an understanding of both the form and function of these buildings [4]. Railways, buildings, and related facilities in the TRW are important national heritage sites; however, the TRW was not set up for the purpose of a museum, and as such, a lot of data, objects, maps, and documents were not saved, and trains are scattered in different places around Taiwan. The preserved TRW is now under preparation and construction to become an NRMT; in this process, many things should be done, e.g., measuring the size of the heritage location, surveying the features, renovating the broken parts, collecting historic and valuable objects, interviewing senior staff of the TRW, recording the processes of maintenance, determining function districts, and planning the exhibit layout, and so forth. It is a long and difficult road ahead for the TRW transition into an NRMT.
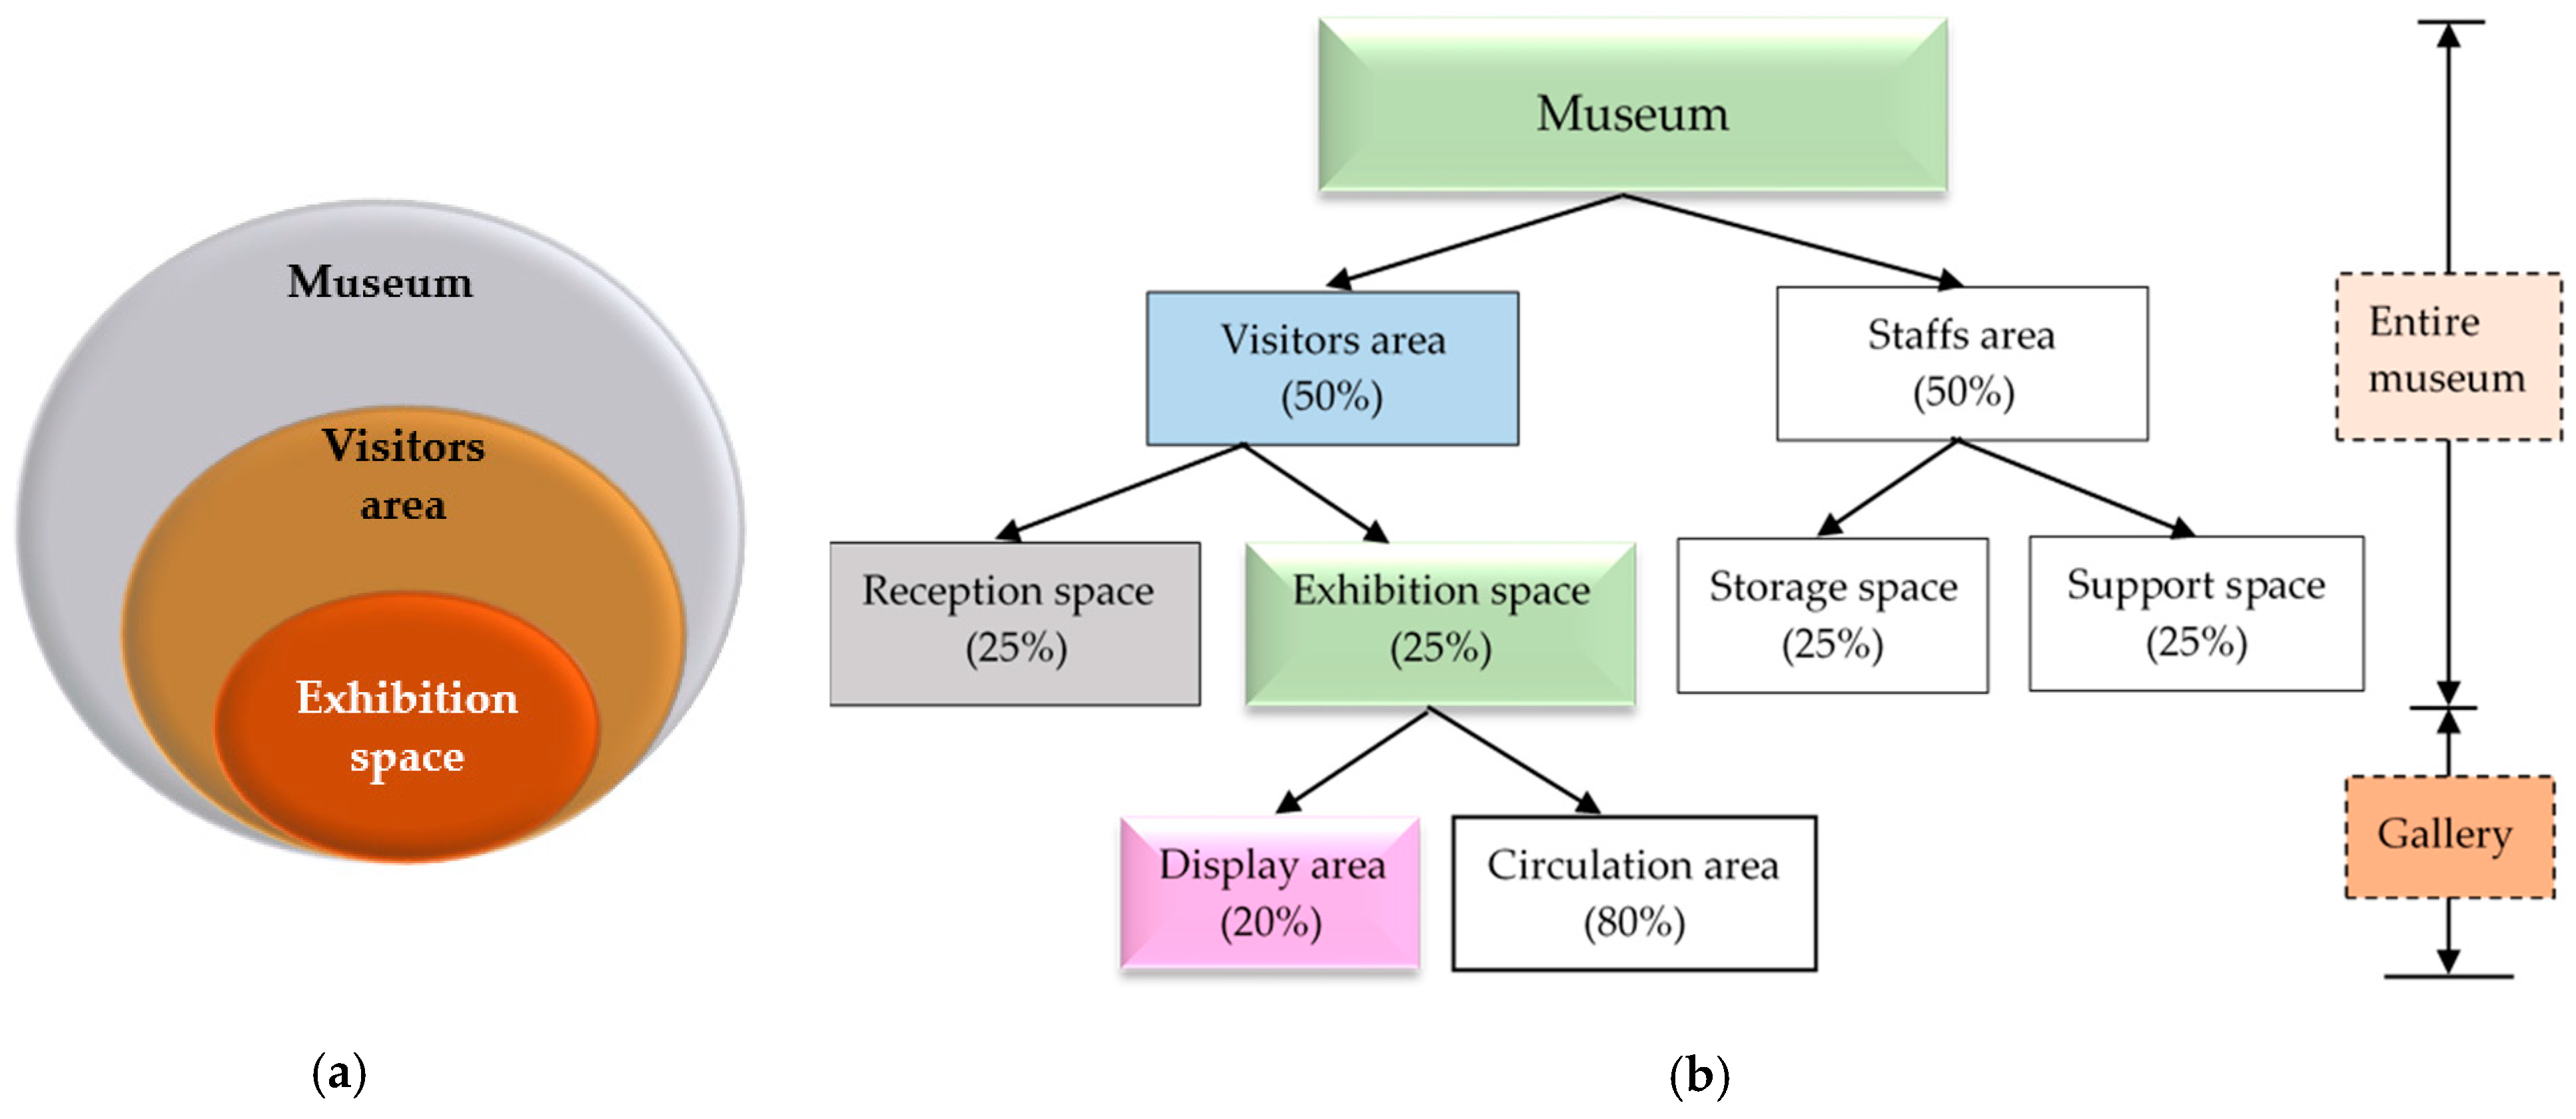
The museum is a multilayered and complex environment representing a diverse set of service units, such as exhibition space, store space, administration space, restaurant space, and shop space to match museums’ multigoals [4]. The layouts of the exhibition space are quite hierarchical; the whole museum arena, the museum building’s type, the configured shape of the entire exhibition space, and the individual display exhibition space all create spaces that lead to other spaces, giving visitors multidirectional views. A rough rule of thumb for space allocation is that, for the reception/visitor facilities, collections storage, displays/exhibitions, and support services, each function space is 25% of the museum. About 20% of the gallery is for displays, and about 80% of the gallery is used for the circulation area [4] (Figure 1). Although some researchers have a different understanding regarding the appropriate percentage of each function space [14,15], the approach suggested by Ambrose and Paine is accepted in this paper to develop some planning principles (Table 3).
Among the subfunction space, the exhibition space is a core area of museums [4,16,17], which interprets and transmits the culture, history, and characteristics of objects for visitors. Galleries act as the main attraction space in museums [4,9,18,19]. One of the main functions of a museum is the organization and display of select objects into a meaningful story for visitors [17,20]. “The museum experience occurs within the physical context, a collection of structures and things” [21]. Visitors move through an exhibition, whether along a defined path or by a freely self-directed path, which will structure the whole impression of the exhibition [22]. An exhibition is a kind of presentation of multiple technologies that implement communications and transmissions of different contents for visitors.
The space layout in the exhibition is a fundamental part of the museum’s display [9]. The museum exhibits provide a framework and shape the visitors’ perceptions of the history presented [6]. Visitors act as a sponge, accessing the expert knowledge provided by museums [8]. Consequently, the exhibition’s spatial layout should consider visitors’ behaviors and needs. No museum can physically display all exhibits at the same time [23]. It is important to consider the strategic placement of objects when determining what to display and where. In order to create a clear narrative, atmosphere, education, and reasonable exhibition environment to attract people to visit, one must consider exhibit layout planning (ELP) for thematic displays as the basic foundation of exhibition design.
For railway museums, the main display objects, e.g., locomotives, railvans, railcars, engineering cars, machines, etc., are significantly large. It is hard for planners in the gallery to place or relocate them on the spot. To organize and display the selected objects into a meaningful story for visitors, the optimal layout needs to be planned ahead of time. The exhibit layout is usually stored as texts, which is scattered in literature and it is difficult to access it. The planning principles are knowledge-based or rule-based, not data-driven, so acquiring the exhibit layout is a big challenge. In this article, we propose a rational and extensive approach to acquire physical planning principles by an experiential model, to integrate and deduce layout patterns by morphology, and to develop the optimal exhibit layout instance by objective function for planners to utilize repeatedly.
2. Literature Review
2.1. Interactive Experience in Exhibition Space
An exhibition is a fundamental mission to empower visitors and bridge the gap between the experts and the laymen with objects and experiments [20,24]. An exhibition is not merely space for visually displaying objects, but it is also to the view of exhibitions as environments in which visitors experience, history, nature, or science [9]. The interactive experience model (IEM) proposed by Falk and Dierking in 1991, is based on personal context, social context, and physical context, and each of these contexts is continuously constructed by the visitor; the interaction of these contexts form the basis of the visitor’s experience [21] (Figure 2): (1) Personal context: it incorporates a variety of experiences and knowledge, including prior knowledge, experience, interests, motivations, concerns, and agenda. Differences in personal context should help predict many differences in visitor behavior and learning. (2) Social context: most people visit museums in a group and those who visit alone meet other visitors and museum staff. Every visitor’s perspective is strongly influenced by social context. Whether or not the museum is crowded also strongly influences the visit experience. (3) Physical context: it includes the architecture, feel of the building, as well as objects and artifacts. How visitors behave, what they observe, and what they remember are strongly influenced by the physical context. The IEM yields a framework for making sense of museum visits and experiences, and we can understand visitors’ perspectives through these contexts in museums.
2.2. Formulation of Physical Principles
Detailed investigation on how the attributes of objects work together to create knowledge is still lacking [9]. A gallery does not simply refer to the physical parameters of the place in which objects are displayed but includes consideration of how visitor movement is directed or guided within that space [9]. Placing the function districts and display objects in a gallery requires the consideration of visitors’ behavior and the properties of objects and space to create and provide a learning environment. The most successful museums match their need to the space(s) available [4]. Visitors’ time, energy, and perception limitations, as well as their physical characteristics, create complex circulation patterns arising from these visitors’ interactions with exhibition layouts. Visitors often inhabit the space for a short time and roam about freely with the primary purpose of viewing objects within the space [25].
The systematic review of related literature guided by the IEM is a good process to acquire ELP knowledge. Planners can understand visitors’ perspectives from personal context, social context, and physical context in museums. ELP concentrates on visitors’ behavior and needs, thematic displays, attributions of objects, and containments of space. Consequently, three contexts of IEM can be divided into visitors’ behavior, the role of objects, and space layout. There are 30 physical principles and 24 suggestions (Table 4) guiding planners to develop the layout patterns.
- Principles for visitors’ behavior:
Suggestions are proposed: Arranging objects from right to left in a gallery should avoid the view of the exit being blocked from the entrance directly. The number of display objects should be limited in a gallery to allow visitors to participate in the whole narrative without missing any displays; 6–20 min is the optimal time for visitors to achieve this.
- 2.
- Principles for objects’ role:
Suggestions are proposed: Selecting exhibits can be acquired by heuristic algorithms, there should not be too many ground exhibits, and the distance and buffer area between segmented objects should be well designed.
- 3.
- Principles for space layout:
- Area ratio: About 20% of a gallery is used for the displays [4].
Suggestions are proposed: For the space dimension, the size of a gallery should be based on the type of museum, the central area should contain the main large exhibit, and should link the entrance, central area, and exit to form the main pathway for visitors to follow along; the ratio of this area and the gallery should be 1:5.
2.3. Integration of Rules into a General Planning Process
The morphology of the point–line–plane–stereo and the five elements of a place (i.e., nodes, paths, districts, edges, and landmark) are the important contexts to configure a gallery’s structure. In this paper, we propose five main procedures to form the structure of layout patterns for ELP in the railway museum.
- Point: Entrance, central area, and exit are focus points for orientation to guide visitors spatially. Main display exhibits are placed in the central area and block the exit from the entrance directly.
- Line: Linking focus points to form the main path to guide visitors’ movement through the gallery. Arrange exhibits from right to left because about 75% of visitors turned right after entering a space.
- Plane: To configure related objects in a cluster or to be separate from each other. The gallery would be divided into two main districts: circulation area and place area.
- Visual distance: Controlling and maintaining appropriate viewing distance: twice the object’s diagonal provides visitors with comfortable surroundings. The visual distance between the main display object and the distance from walls should be considered simultaneously. According to the trains’ properties, the visual distance we propose is 22.36~41.22 m (= 2 × (102 + 32 + 42)1/2~2 × (202 + 32 + 42)1/2); however, this visual distance is far beyond the width of general buildings, and as such, it is inappropriate for the railway museum. Consequently, the optimal visual distance used in this study was adopted as the diagonal of the object 11.18~20.61 m (= (102 + 32 + 42)1/2 ~ (202 + 32 + 42)1/2).
- Fine-tuning mechanism: Calculate and check the floor area of placement area: the floor area of grounded objects is about 20% of a gallery. The visual distance between the main display object and the distance from walls should be considered simultaneously.
2.4. Related Study of Spatial Planning with an Algorithm
Optimal solutions can be found based on a suitable heuristic algorithm; ML applications for spatial layouts can be grouped into three categories: facility layout, floor layout, and furniture layout (Table 5).
In the facility layout issue, the problem is determining the efficient arrangement of equipment in an area. Several studies address facility layout problems. In 2019, Lin and Yingjie applied GA to solve the facility layout problem [32]. Besbes et al. used A* search to determine the shortest path within the facility and transportation routes and then paired the A* with GA to improve the quality of the facility layouts [33]. Wei et al. utilized a chaos search combined with GA and Tabu search to optimize facility layout problems [34]. They found that the results were better than others in reducing operating costs. In 2020, Amaral improved the double row layout problem to minimize the total cost of material flow among machines [35]. Pourhassan and Raissi also utilized the GA and particle swarm algorithm (PSA) to experiment with the dynamic facility layout problem [36]. Wu et al. coupled GA with the surplus rectangle fill algorithm to experimental facility layout endeavors and achieved better solutions in their implementation [37].
In the floor layout, Erculiani et al. employed a perceptron learning algorithm to plan an apartment’s partitions into several separate rooms in a 10 × 10 bounding box [38]. They defined five different shapes (kitchen, living room, bedroom, bathroom, and corridor), and generated random contexts with a combination of room types to maximize the rooms with random to lower bounds. In 2020, Amin-Hosseini et al. utilized the shoelace algorithm to design the floor layout in post-disaster temporary housing units in a specific area (4.51 m × 5.01 m), which contained a living room, kitchen, entrance, and bathroom [39]. Shi et al. utilized the Monte Carlo tree search to address floor plans within adjacency constraints, and they obtained good results in a time-efficient manner to generate the plans [40].
Regarding furniture layout, Sun and Ji applied the improved particle swarm algorithm to optimize the arrangement of eight objects in the kitchen, and the arranged area is 48.6 m2, which is included the kitchen area and living area. The optimized plan was the core area of the kitchen operation center integrated the water tank, multifunction table, and user’s behavior line in the kitchen and living space, which was maximized to meet the needs of the user group [41]. Erculiani et al. employed a perceptron learning algorithm to arrange tables in a room by choosing a recommendation to synthesize a novel configuration [38].
Each heuristic algorithm has features to leverage people toward their intended target. Even with the same layout problem, e.g., facility layout or floor layout, some algorithms provide acceptable results depending on the desired outcome. It is important to choose the right algorithm depending on the features of properties and constraints of the training data. Among the above-mentioned layout categories, GA is the most common and basic algorithm for spatial layout problems. Consequently, GA is the optimal method for ELP to develop optimal layout instances.
3. Materials and Methods
3.1. Study Scope
A museum exhibition can be either object-proposed or concept-proposed. Object-proposed exhibition design phases could be divided into five phases: (1) project phase (budgeting); (2) conceptual phase (idea developing process, information gathering, storytelling, documentation, sketches, text writing; (3) design phase (designing the general concept of the exhibition, designing exhibition units); (4) production phase: (printouts, construction, illumination, audio visual design); (5) terminating and exhibiting phase [20].
The exhibit layout planning (ELP) belongs to the design phase and deals with the real and object-proposed layout in a physical environment, not including the ambient conditions and signs, symbols, and ornaments. The exhibition space is focused on the individual gallery, where it is surrounded by walls, with an entrance and an exit, and arranged within display objects.
3.1.1. Railway Type of Museum
The different types of railway museums can be classified into different categories, such as collections, runners, serving areas, etc. In other words, there are various types of museums, and each type has its unique characteristics. For example, the subtypes classified by collections can be divided into general museums, archaeology museums, art museums, history museums, ethnography museums, science museums, geology museums, industrial museums, military museums, etc. [4]. The railway type of museum belongs to the industrial and the transport museum category. The properties of the main railway objects (locomotives, railvans, railcars, engineering cars, etc.) are quite large in size and weight. Those immense and heavy objects fundamentally need large and spacious exhibition space to display, and they are usually placed on the ground of the first floor to configure the main structure of the gallery.
3.1.2. Definition of Exhibit Layout Planning
The ELP that we provide in this paper deals with selecting ground-based exhibits from the object database and the positions of these exhibits in a gallery in a storyline to frame the main structure of space for visitors to follow. Layout planning is usually represented as ensembles of ground-based objects whose properties (size, position, distance, length, width, etc.) determine the structure space of a gallery. The salient properties of the layout are captured by the properties of the exhibits (sort, history, maker, story, rarity, shape, age, weight, length, width, etc.) and their arrangement style (orientation, sequence, appropriate distances between the segmented exhibits, distances between exhibit and wall, etc.).
3.2. Data Collecting and Preprocessing
To preserve the cultural heritage of the facilities and equipment in the TRW, the entire TRW is being transformed into a railway museum; however, many properties of objects have not been recorded or authenticated in advance. To determine these data, it would take a lot of time to work with TRA staff to check and survey the properties of collected objects, buildings, and facilities.
There were 680 items collected in 2020 by TRA, including locomotives, railcars, railvans, dining railcars, trucks, inspection vehicles, drilling machines, lathes, grinder, steam boiler, crane, railed, generator, engine, water pump, flaw detector, thermometer, micrometer, steam hammer, jack, milling machine, whistle, stagnation, mold, monument, oil pot, hand hammers, plaques, uniforms, large hats, license plates, inscriptions, models, and photographs. Except for trains (locomotives, railvans, railcars, and engineering cars), most collections only have the name of the item (e.g., steam hammer, license plates, clothes), and the attributions of these items are still incomplete. The number of trains in the object data is 96, and the properties of the trains include sort, starting use year, place location, brief history, and manufacturer (Table S1).
These trains are the main and ground display objects used to configure the structure of a gallery in railway museum. For the development and evaluation of the results of the ELP, we needed to preprocess the properties of trains. The value of the properties needs to be quantified rationally. Each value score was ranked on a scale of 1–10. First, the trains were divided into four categories, i.e., locomotive, railcar, railvan, and engineering car, and the score is 10, 8, 6, or 4. Second, the trains’ features were evaluated in four variables with the criteria of history, attraction, story, rarity, and starting usage year in advance according to be quantified rationally by planners’ perception and empiricism. Third, after ranking each train’s value, the objects database was formulated (Table S2).
3.3. Reviews Guided by Interactive Experience Model
The exhibit layout planning knowledge is usually stored as a text, which is often found scattered in various literature. These texts are knowledge-based or rule-based, not data-driven, so acquiring this knowledge is a big challenge for people. IEM created an interactive experience framework and suggested that we can understand visitors’ perspective through by three contexts in museum. To acquire the procedures and physical principles of ELP systematically, guided by IEM is a good method. This model is based on personal context, social context, and physical context, and each of these contexts is continuously constructed by the visitor; the interaction of these contexts forms the basis of the visitor’s experience.
In this paper, the three contexts of IEM are divided into two main aspects: people and the physical environment. To find out the physical principles for an exhibit layout, the aspect of people is the dimension of visitors’ behavior in museums (galleries); the aspect of the physical environment is subdivided into the role of objects and the layout of space dimensions. Visitors, objects, and space are the three foundational factors of ELP.
3.4. Applying Morphology to Integrate Principles
According to the investigated results from Lynch in 1960, there seems to be a public image of any given place, and physical forms can be classified into five types of elements: paths, edges, districts, nodes, and landmarks—these seem to reappear in many types of environment images [42]. Nubani et al. stated that the visitors’ mental map can fall into one of the five types, defined by Kevin Lynch, helping them with wayfinding in the exhibition space [25]. The paths, edges, districts, nodes, and landmarks are formed from point, line, plane, and stereo.
Mclean stated that exhibition space’s morphogenesis starts from points, and then expands into lines, planes, or even the stereo-geometry [16]. Hence, the morphology of point–line–plane–stereo is not only a general concept, but it is also an essential strategy to configure the structure of a gallery. Applying the morphology to integrate the physical principle and suggestions, five main procedures were cast to develop reusable layout patterns for ELP optimal plans.
3.5. Plans Optimized by Genetic Algorithm
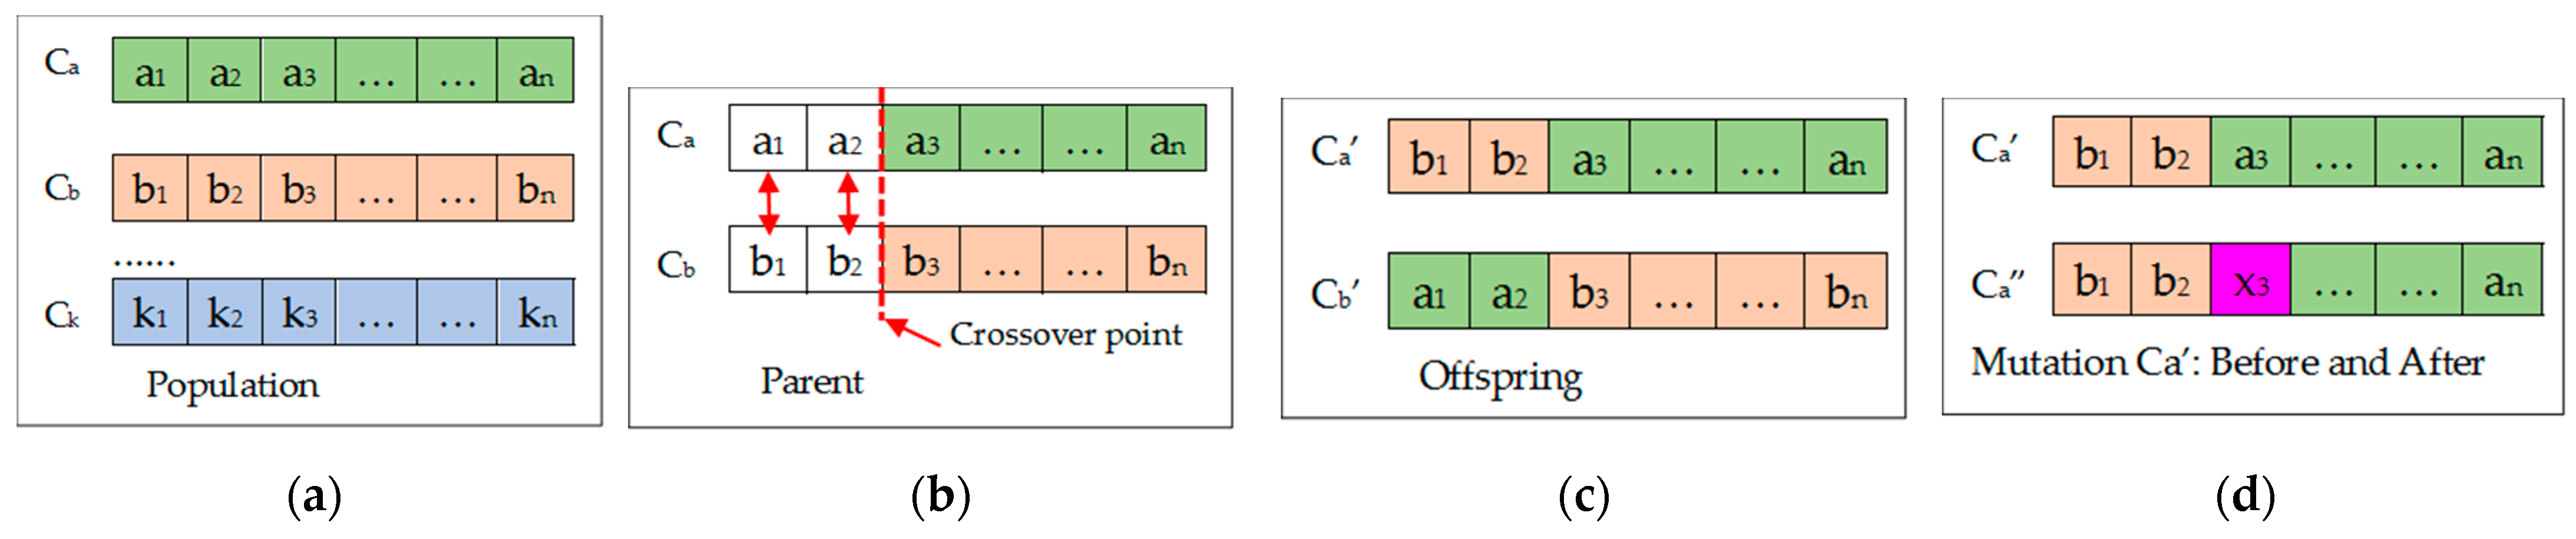
A genetic algorithm (GA) is used to find an optimal solution or suboptimal solution to a difficult optimization problem [43,44]. A GA is a machine learning (ML) algorithm that reflects the process of natural selection, where the fittest individuals are selected for reproduction in order to produce offspring of the next generation [33,43,44,45] (Figure 3). The GA operates with a set of problem solutions, referred to as a population. Each individual of the population is a chromosome and represents a possible solution. The fitness value of an individual (solution) represents its quality according to a given objective function; the higher the fitness value is, the more valuable the solution. Usually, the initial population is randomly generated, although a set of known individuals can be used to launch the evolution process. Then, the GA makes this population evolve iteratively. A subset of individuals is selected as the parents based on their high fitness value. The next generation is obtained thanks to crossover and mutation [33,43,44]. The gene, chromosome, and population, in this paper, means the train, layout instance, and layout instances separately.
4. Case Study
TRW is located in the Xinyi District of Taipei City, which is 17.03 ha in size, and adjacent to the Living Mall in the north and Songshan Cultural Park in the south. Land-use zoning is the third type of industrial zone. The landowners include the National Property Administration, Taipei City Government, and some private landholders. Nearby public facilities include parks, green spaces, squares, schools, administrative agencies, markets, parking lots, bus transfer stations, and Mass Rapid Transit stations. The service surrounding the museum has complete urban functions and convenient transportation [46].
4.1. Attributes of Buildings in TRW
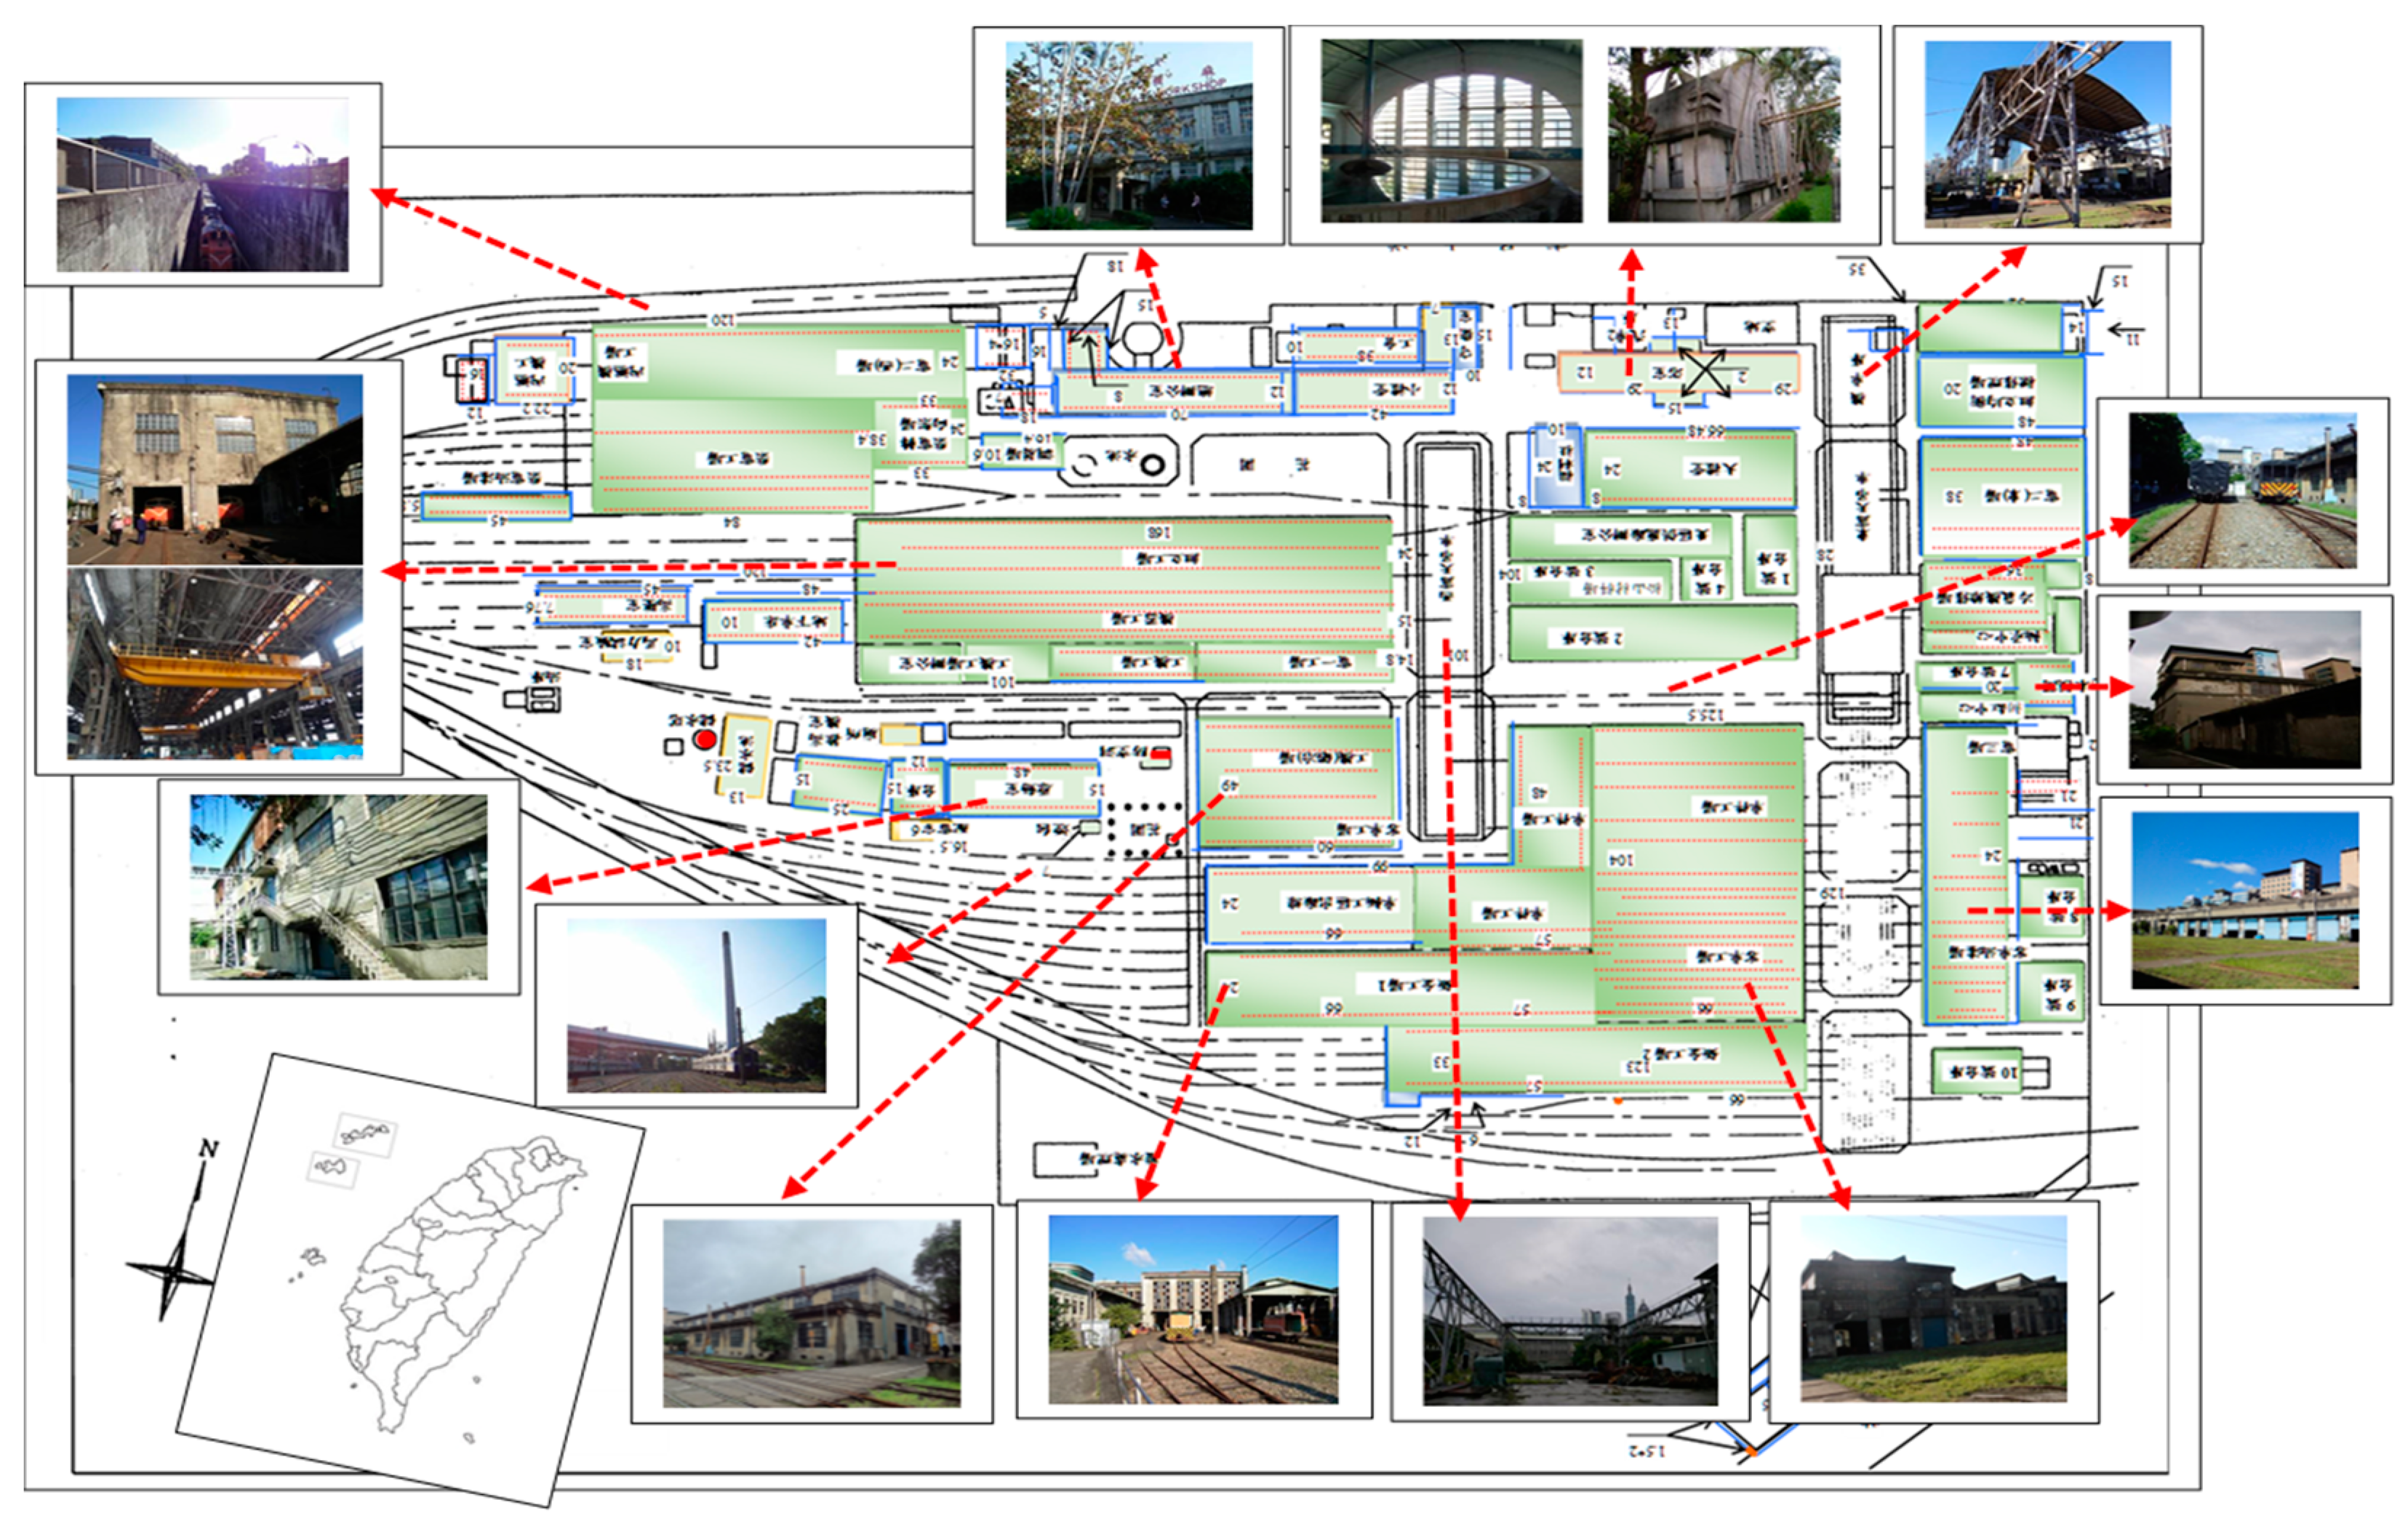
The buildings in the TRW include a general office, original moving room, assembling factory, blacksmith factory, bathhouse, coach factory, diesel–electric plant, painting factory, wooden-mold warehouse, etc. (Figure 4). The architectural features in TRW are a tall, large span steel structure, mold roof, and large windows. Furthermore, railway facilities and equipment include the axis track, fan-shaped track, steam hammer, steam pipelines, etc.
There are approximately 52 buildings in the TRW with brick or reinforced concrete structures. Each building has a unique size and shape. The length of buildings is between 9 and 168 m, the width is between 6 and 66 m, and the height is between 3.63 and 18.19 m per story. The total floor area of the building is between 180 and 8500 m2. The majority of the buildings are single-floor industry buildings, and some buildings are two or three stories.
The railway museum will be housed in historic buildings, but not all buildings can display immense and heavy objects. The building’s location is easy for visitors to access, and the building is large enough to be qualified for the railway exhibition building/space. For the exhibition gallery candidates in this study, we suggest 14 buildings (Table S3), whose width is above 17 m and with a height of above 10 m. To simulate the main railcars arranged in the exhibition gallery, one of the candidate buildings was selected as a representative template module. The 7th building location is near to the main entrance of the TRW, which has good accessibility for visitors. Hence, the 7th building was selected as the candidate building to develop the layout template, which is 84 m in length, 38.4 m in width, and 14.54 m in height.
4.2. The Properties of Trains
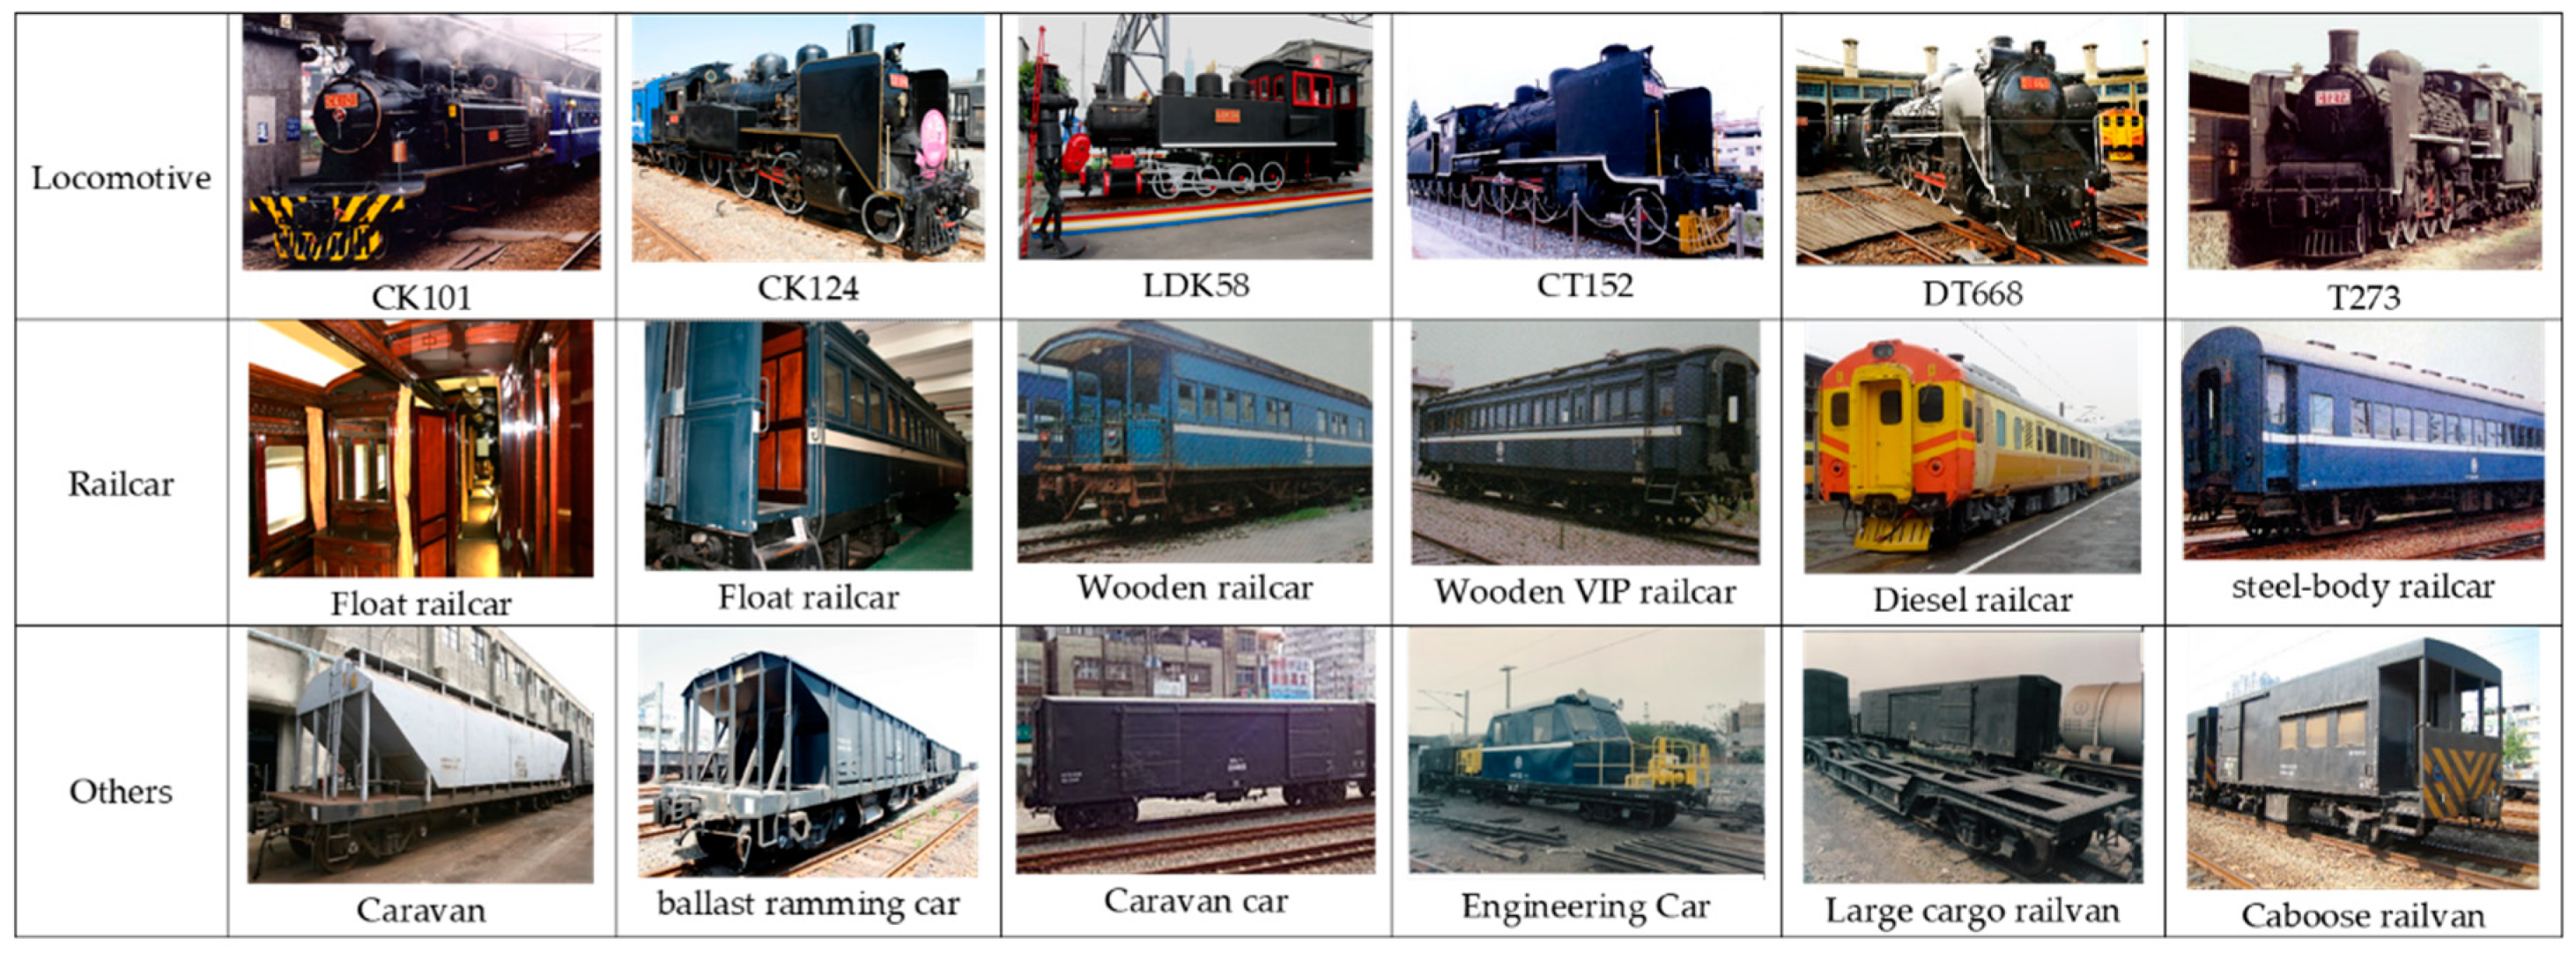
The trains are physically large (about 10~20 m in length, 3 m in width, 5 m in height) and extremely heavy (about 10~40 ton in weight). An object’s importance is basically judged by its history, attraction, story, special manufacturing, preciousness, rarity, etc. For instance, the early steam locomotives three dimensional and main display objects, and not only have the aforementioned characteristics but also have special appearances to attract people (Figure 5). The individual observations would be analyzed into a set of quantifiable properties, known variously as explanatory variables or features. These properties of collections may be categorical (locomotive, railcar, railvan, engineering car, machines, or others), ordinal (large, medium, or small), integer-valued (the number of occurrences of a particular object), or real-valued (length, height, width, and weight). Other classifiers work by comparing observations to previous observations by means of a similarity or distance function.
4.3. Evaluated Variables
The features of the objects database are dependent on the type of museum. Collected objects in the database of any museum can be divided into different categories according to the collections’ characteristics. Every object’s criteria are judged by the planner’s perception and knowledge, depending on the factors of history, attraction, story, rarity, etc. These factors are considered evaluated variables.
There are two categories of scores within six variables proposed to evaluate and calculate in advance for production and optimization of layout instances. Category I is concerned with the properties of every object, and Category II is concerned with the relationship between exhibits, the gallery, and the arrangement with the entire exhibition space. Every score (λ) of variables is ranked on a scale of 1~10, and the total score λ(∗) is to sum up six scores. The definition of every type of score (λ) is as follows:
- Category I: The attributions of each object.
There are four variables to evaluate every train in the objects database. These types of scores are Story_score, Age_score, Sort_score, and Rarity_score.
- Story_score (λStory): The history of each train is different from others, and the story score of everyone can be scaled according to aspects of special social event, contact with celebrities, manufacturers, etc. The average value for all selected exhibits based on certain aspects can be calculated.
- Age_score (λAge): Taking 2020 A.D. as the calculated base year, the older train gets the highest score: (2020 ‒ start using the year of the train)/(2020 ‒ the oldest year of start using year in objects database) × 10.
- Sort_score (λSort): Trains with stronger engines, notable figures, and colorful appearances are more attractive to visitors, which gets a higher score.
- Rarity_score (λRarity): Depending on the amount of each type of train. The fewer the amount, the higher the score. If there is only one of any given type of train, that train is awarded the highest score (10).
- 2.
- Category II: Relationship with the display object and space.
According to the layout patterns of ELP and the dynamic size of different selected objects, the exhibits cannot exceed the area’s boundary. There are two variables to evaluate the selected exhibits within the gallery. These two scores are Space-gap_score (λSpace-gap) and Ratio_score (λRatio).
- Space-gap_score (λSpace-gap): The smaller the gap between the train and the place area, the higher the score. This means that the train appropriately fits the space. The score of Space-gap (λSpace-gap) is (L + W)/2.
- Where: L = 10 − | (place area in length) − (real object in length)|; W = 10 − |(place area in width) − (real object in width)|.
- Ratio_score (λRatio): The percentage of display area to a gallery’s floor area is about 20%, and it gives visitors better benefits in the initial time spent visiting (i.e., 6~20 min) to engage in the narrative theme of the museum. The score of the ratio is the display area to 20% of the gallery. The score of ratio (λRatio) is (Σ L × W (i.e., sum of display area)/floor area of the gallery) ×10.
- 3.
- The total score of a layout instance:
The final score λ(∗) of each layout instance is the sum of Category I and Category II (Equation (1)):
where: ni is the number of trains in a gallery; i is the ordinal number of trains.
λ(∗) = (Σλi)/6 =((ΣλStory + ΣλAge + ΣλSort + ΣλRarity + ΣλSpace-gap + ΣλRatio)/ni)/6
According to every score’s definition, type scores in Category I of each object are evaluated and scaled by evaluators in advance. Type scores in Category II depend on the selected exhibits and the gallery’s related distance and floor area.
4.4. Objective Function of Optimal Plans
It is difficult and challenging to construct the right balance between exhibit layout constraints and thousands of objects for ELP. One layout pattern may generate P(n, r) = permutation of layout instances at random (n and r represent number of collected objects and number of place areas, respectively). Providing good layout instances for planners can save their endeavors. Evaluating the optimization of such mass layout instances is the key problem.
The objective function of optimization can be abstracted into a mathematical model. It is a good way to refer to and modify the equation from Guo et el. [43]—see Equation (2), where A is a learning algorithm and λ is the type score of A. The ultimate goal of the optimization is to find the optimal total scores λ(∗) to maximize the generalization score Gχ [V(χ; Aλ(χ(train)))] of the learning algorithm A on dataset χ(train) (a P(n, r) = set of samples from Gχ). If the total score λ(∗) of a certain layout instance is bigger than the threshold score, then this instance would be a great addition to the layout instances database:
where λ(∗) is the final score; λi is type score; i is the ordinal number of type score; Gχ is layout pattern; y is the ordinal number of geometric type; V is average of type score = ()/r; P(n, r)= is a set of layout instances from Gχ; n is number of objects; r is number of place area in layout pattern; Aλi is χj(train) score; χj(train) is objects = {train1, train2, train3,…, trainn }; j is 1, 2, ... n.
λ(∗) = arg max Gχ[V(χ; Aλi(χj(train)))]λ∈Λ
5. Results
5.1. Building Layout Pattern and Template
According to the location of the entrance and exit in the long walls of a gallery (i.e., right, left, or middle of the wall), there are 9 = P (3, 1) × P (3, 1) geometric types in the related position. Every synthesis pattern considers the spatial attributes of the exhibit gallery (such as size, shape, length, width, entrance, and exit), visitors’ behavior (e.g., orientation, movement paths, and appropriate visual distance), and properties of objects.
The construction of the exhibition space structure represents the design patterns. The five main procedures, 30 physical principles, and 24 suggestions (Table 4) guide the configuration of the exhibit layout to synthesize the layout patterns. First, we place the main thematic grounded object in the central area to block the view from the entrance to the exit. Second, linking entrance, central area, and exit, the main path guild visitors move forward around the gallery. Third, the selected exhibit sequence is placed along the main path from right to left, starting from the entrance. These exhibits can be placed in either a cluster or in separate locations according to the narrative’s needs. Consequently, 32 types of layout patterns were developed (Figure 6). When placing these exhibits, it is important to calculate and check the fine-tuning mechanism and the appropriate visual distances according to the size and the characteristics of exhibits.
The number of objects collected for NRMT so far is 96. There are 32 types of layout patterns, with place areas 1, 2, 3, 4, or 5, and each pattern will produce a mass of layout instances (Table 6). Taking the layout pattern type 10 within four place areas; for example, it may generate 79,727,040 = P (96, 4) layout instances at random.
The layout template is to position ri place areas within a gallery according to the focus points (entrance, centrality, and exit), main path, orientation, visual distance, and the size of trains, taking layout pattern 10 as a module. There are four place areas in this layout pattern. The 7th building in the TRW is the candidate gallery, and the width of both the entrance and exit is 8 m.
The Euclidean distance was used to illustrate the layout template with a fixed length (L) of 84 m and a width (W) of 38.4 m. The gallery is considered a grid of rectangular space. Using layout pattern 10 and assuming that the suitable visual distance is about 11.18~20.61 m, the place area within the exhibition gallery was positioned. The considered factors include (1) the size (length, width) of the gallery, place area, and trains; (2) the position (geometry coordinate) of exit, entrance, place area, and trains; (3) distances between the entrance, and in front of the first train, separated trains, trains, and the bounding (walls and edges); (4) direction from the entrance; (5) appropriate visual distance (suggested visual distances are 12, 17, and 17.7 m); (6) main path and the movement of visitors; (7) corner area for turn at least 12 × 12 m2. The layout template is shown in Figure 7.
Codes were assigned by their horizontal (Ri) and vertical (Cj) dimensions to name the points on the vertexes and junctions, and the coordinates (Xi, Yj) of each point are listed in Table 7. The codes can be compiled into RiCj, where i = 1~7, j = 0~4. The A, B, C, and D points are the vertexes of the exhibit gallery. The other vertexes are the points of each place area unit, and junctions include the intersection point of the wall and the entrance gate or exit.
5.2. Layout Instance and Optimization
- Generating parent layout instance
The GA approach was applied to generate the parent layout instance. Four trains from the objects database were selected at random, one by one, as the Parent I. Those four trains were brought into the list. Another four trains were selected from the objects database at random again as Parent II. These four trains were also brought into the list (Table 8). The total score of Parent I is 7.26 and Parent II is 7.24. Parent I is a little better than Parent II, and these scores are similar (Figure 8).
- 2.
- Producing offspring layout instance
The trains were crossed over to produce offspring. The first and second position trains (genes) were exchanged in the layout instance (chromosomes) of Parent I and Parent II, and then Offspring I and Offspring II were produced. The total score of Offspring I is 7.69, and Offspring II is 6.82. Offspring I is higher than Offspring II. Offspring I’s score is also better than the original score of Parent I. Simultaneously, the score of Offspring II after crossover is 6.82, which is worse than the original score of Parent II. In other words, the Offspring I is a good option for mutation.
- 3.
- Mutating layout instance
The third position train (gene) was replaced with the other train. Then, the total score was counted to distinguish and compare its parent and generations. After the mutation of the Offspring I, the score of Offspring I’ is 8.3. Offspring I’ gains a higher score than Offspring I and gets an optimization result. Then, the train (genes) list of the next generation after mutation was rewritten (Table 9). The calculating process of scores of layout instances for ELP is shown in Algorithm S1.
As we know, planners’ threshold score is the key decision related to the number of layout instances for ELP. In this case, if the threshold score is 7, and then the Parent I, Parent II, Offspring I, and Offspring I’ are good options as layout instances. If the threshold score is 7.5, and Offspring I and Offspring I’ are good optimizations for ELP. Moreover, if the threshold score is 8, and just Offspring I’ is the option as layout instance.
6. Discussion
ELP has structural differences compared to other spatial layout problems because there are usually hundreds or even thousands of collected objects with different properties (i.e., size, length, width, history, story, function, maker, and sort) to deal with in any exhibition. Previous studies into ML applications of facility, floor, or furniture layout problems were mostly focused on equally sized objects [33,38]. Some addressed 10–20 differently sized items [37], or the number of layout objects was usually less than 10 items [34,38,39,41]. In addition, the entire size of the space was small or hypothetical e.g., a 10 × 10 bounding box [38], 4.51 × 5.01 m [39], or 48.6 m2 [41]. It seems unreasonable to generalize the layout problem with equal size objects for ELP in museums.
Utilizing the real and individual size of collected objects from each museum in ELP is a complex endeavor. The variety of collected objects with different characteristics for planners to deal with is more difficult and challenging than facility layout. In the opinion of Hosseini-Nasab et al., the facility layout problems have been studied over six decades, but research on many aspects of this issue is still in its infancy [47]. There is more than USD 250 billion per year assigned to them [48]. As the ELP is a knowledge-intensive and time-consuming process, ML has not meaningfully been applied to ELP so far.
Traditionally, exhibition planners brainstorm in a workshop or in the gallery many times for several months. During this period, planners discuss and exchange ideas, write down their ideas, draw up their blueprints and modify plans, either by hand or via AutoCAD. This process is repeated, and it is a time-consuming, high-cost, and laborious manual task. The trains are huge and heavy objects for railway museums, and it is very hard for planners to work on-site. ELP is mainly established empirically based on planners’ perception, but there is some common knowledge and principles, which can be extracted and quantized by systematic integration.
What is a solution to the layout problem that would allow people to use it a million times without doing it the same way twice? In 1990, people proposed that the expert system (ES) would be an appropriate method to leverage spatial planning [49]. Wagner viewed hundreds of papers of ES cases studies from 1984 to 2016 and stated that ES applications in planning and design mainly focused on theories or concepts between 1984 and 1995 [50]. There is hardly any research applying ES to enhance or implement spatial planning automation, e.g., urban planning, land-use planning, site planning, or layout planning. Owing to the drawbacks of expert support systems, such as the limited extensibility, many studies [51,52,53] applied ML models to improve the shortcomings of ES.
Nowadays, new technologies such as the Internet of Things (IoT), ML, Virtual Reality (VR), and wearable devices have been widely applied in museums. It is important for commercial and research investigations to develop technology support systems such as multimedia guides by handheld or wearable devices, art authentication, and recommendation systems according to customer’s preferences. AI, sometimes called machine intelligence, has been seeping into our lives, and we use it to accomplish fundamental tasks [54]. In 2017, Majd and Safabakhsh attempted to group ML applications in museums into art authentication, commercial recommendations, guiding, three-dimensional virtual reality, data analysis, ticketing, and museum layout [55]. Consequently, it is important to improve the problem of ELP by utilizing new technologies such as automating layout [42], ML [56,57,58,59], big data analysis [60], etc.
Museum crews dynamically fill in the objects database for any museum, and the number of collected objects could be thousands or even more. Selecting four trains just from the objects database of 96 items in this study may generate 79,727,040 = P (96,4) layout instances at random. This is a hard problem for planners to manually optimize such numerous permutations manually by calculating the total score of each layout instance with six variables. If there are thousands of objects collected, the optimization of ELP is much more challenging and arduous than this study. It is essential to optimize ELP plans in advance before the exhibition, and it needs appropriate technologies to leverage planners to complete the endeavor. The heuristic algorithms of ML have solved the layout problems of facility, floor, and furniture; a GA is a fundamental algorithm and can be a great help for planners to overcome the layout problem effectively. Research into ML application in ELP is a very interesting and feasible issue to work on. It is urgent and important to establish a customized recommendation scheme using heuristic algorithms to support ELP.
Railway museums belong to the transport and industry museum category, and the majority of real display objects are commonly immense and heavy. In general, the proposed three aspects, 12 dimensions, 30 physical principles, 24 suggestions, and 5 main procedures, which are suitable for multiple types of museums not limited to transport, or industry museums, e.g., geology museum, military museums, and art museums etc. Some conditions of principles can be adjusted, e.g., the appropriate visual distance should be modified by the size of 3D exhibits for best visual distance that is twice the diagonal of an object [26]. Besides, due to the cultural heritage and the desire for historical buildings to be an exhibition space, museum curators should notice and select the shortest width of the gallery walls: which, to our understanding, is [(2× object height × 1.6) + 1] m [26]. These principles, suggestions, and procedures can also be used to develop layout patterns for multiple types of museums.
Appropriate layout planning can reduce costs by at least 30% [48]. Of course, the impact factor of ELP is not only costs but also includes the precious cultural heritage, value of collections, efficiency, visiting time, reception/visitor facilities, visitors’ behavior and satisfaction, etc. ELP, a design of a physical environment in which the interpretive environment is provided, is becoming an increasingly critical issue as our society faces the development of cultural tourism and economy. ELP is a tactical decision and a complex, high-cost, time-consuming, and laborious manual process. Establishing a customized recommendation scheme in ELP by ML can help planners and museum crews collect and accumulate the prior knowledge for sustainable utilization and improve ELP. ML application in ELP is a hard task and needs the cooperation of domain experts to implement it.
There is currently not enough space to provide visitors an abundant, knowledgeable, and educational setting within supplementary displays. The shape and size of objects obviously impact the entire layout space, but previous layout research focused on either equally sized or objects with small variation in size. In fact, it is unreasonable to generalize the layout problem with equal size objects. This study utilized real and individual sizes of objects collected from the museums. Due to the exhibit layout problem’s complexity and diversity, a complete set of optimization methods for handling dynamic ELP is urgently needed.
7. Conclusions
Museums can provide a significant range of social and cultural benefits for the locations or destinations in which they are set [4]. Thanks to the economic contribution of museum tourism to the national economy, Taiwan’s government has been strongly invested in museums. The preservation of railway heritage made for leisure was not a key target for the Taiwan government several decades ago, yet leisure travel and urban sprawl accounts for a large proportion of car mileage in Taipei City and increasingly adds to congestion, pollution, accidents, and parking problems. The Taipei Railway Workshop lost its maintenance function after the underground railway project was fulfilled in 2011. The entire Taipei Railway Workshop, regarded as a national and precious cultural heritage for National Railway Museum in Taiwan in 2014, provides a case study to plan an exhibit layout of a heritage attraction for a railway museum. Frequent changes in exhibitions occur to keep public interest and engagement high and maintain visiting satisfaction [4,5]. The change in culture tourism development has forced the museum crews to adopt a more flexible production project to stay competitive. The customized recommendation scheme by heuristic algorithms to support exhibit layout planning for museum curation is an urgent and important task.
We identified the problems of exhibit layout planning for museums, implemented a point–line–plane–stereo morphological strategy to integrate planning knowledge of museums and proposed a genetic algorithm as an appropriate algorithm to leverage the exhibit layout planning of optimization. The main ideas presented in this paper should be useful to three domain experts: (1) museum curators who want to manage the museum well to attract more people by providing or changing the target exhibits; (2) spatial planners who want to acquire and interpret the cultural heritages in a gallery based on the relationship between visitors and exhibits by an efficient, flexible, cost-cutting approach; (3) machine learning experts who look for a good application to validate and implement their algorithms. Furthermore, visitors can acquire the greatest visiting benefits when visiting their chosen museums and accessing precious cultural heritage. Studies investigating machine learning being applied to exhibit layout planning will continue.
Supplementary Materials
The following are available online at https://0-www-mdpi-com.brum.beds.ac.uk/2076-3417/11/5/2424/s1, Table S1. The raw data of collected objects for NRMT, Table S2. The ranked score of evaluated variables of each train in the objects database, Table S3. The attributions of buildings in Taipei Railway Workshop, Algorithm S1 The calculating process of scores of layout instances for ELP.
Author Contributions
Conceptualization, L.P.F.; methodology and validation, L.P.F. and T.H.C.; investigation, resources, data curation, and writing—original draft preparation, L.P.F.; writing—review and editing, L.P.F. and T.H.C.; supervision, T.H.C. All authors have read and agreed to the published version of the manuscript.
Funding
This research received no funding.
Institutional Review Board Statement
Not applicable.
Informed Consent Statement
Not applicable.
Data Availability Statement
Data available in a publicly accessible repository.
Acknowledgments
Our sincere thanks go to the staff of Taiwan Railways Administration providing the raw data of the buildings in TRW and collected objects for NRMT.
Conflicts of Interest
There are no conflict of interest to declare.
Abbreviations
The following abbreviations are used in this manuscript:
| ELP | Exhibit layout planning |
| ES | Expert system |
| GA | Genetic algorithm |
| IEM | Interactive Experience Model |
| ML | Machine learning |
| NRMT | National Railway Museum in Taiwan |
| TRA | Taiwan Railway Administration |
| TRW | Taipei Railway Workshop |
References
- World Tourism Organization (UNWTO) World Tourism Barometer and Statistical Annex. January 2020. Available online: https://www.e-unwto.org/doi/abs/10.18111/wtobarometereng.2020.18.1.1 (accessed on 20 December 2020).
- Huang, K.N. New Visions for Museums; Culture and Art Publishing House: Beijing, China, 2011. [Google Scholar]
- Kervankiran, I.; Temurcin, K.; Yakar, M. The Development of Museology in Turkey, a Spatial Analysis of Museums and their Contribution to Tourism in Turkey. Almatourism J. Tour. Cult. Territ. Dev. 2016, 13, 1–22. [Google Scholar] [CrossRef]
- Ambrose, T.; Paine, C. Museum Basics, 4th ed.; The International Council of Museum in UNESCO; Routledge: London, UK; New York, NY, USA, 2018. [Google Scholar]
- Keng, F.Y. Breakthrough and Innovation: New Visitors for National Museum Exhibition. Museol. Q. 2017, 31, 79–98. [Google Scholar] [CrossRef]
- Jolliffe, L.; Smith, R. Heritage, Tourism and Museums: The case of the North Atlantic islands of Skye, Scotland and Prince Edward Island, Canada. Int. J. Herit. Stud. 2001, 2, 149–172. [Google Scholar] [CrossRef]
- International Council of Museums (ICOM). Available online: https://icom.museum/en/resources/standards-guidelines/museum-definition/ (accessed on 17 January 2021).
- Macdonald, S. Interconnecting: Museum visiting and exhibition design. CoDesign 2007, 3, 149–162. [Google Scholar] [CrossRef]
- Moser, S. The Devil is in the Detail: Museum Displays and the Creation of Knowledge. Mus. Anthropol. 2010, 33, 22–32. [Google Scholar] [CrossRef]
- Huang, K.N. Museum Enterprise; Arts Press: Taipei, Taiwan, 2007. [Google Scholar]
- Chinese Association of Museums. Available online: http://www.cam.org.tw/museumsintaiwan/ (accessed on 30 January 2021).
- Taiwan Railway Administration. Taipei Railway Workshop Relocation Project; Taiwan Railway Administration: Taipei, Taiwan, 2005.
- Henderson, J. Railways as heritage attractions: Singapore’s Tanjong Pagar station. J. Herit. Tour. 2011, 6, 73–79. [Google Scholar] [CrossRef]
- Genoways, H.H.; Lreland, L.M. Museum Administration: An Introduction; AltaMira Press: Lanham, MD, USA, 2003. [Google Scholar]
- Bànzé, Z. Museum Architecture—Space Project of Museum, Art Museum; Archives; Kashima Press: Tokyo, Japan, 1997. [Google Scholar]
- Mclean, K. Planning for People in Museum Exhibition; Association of Science-Technology Centers: Washington, DC, USA, 1996. [Google Scholar]
- Tzortzi, K. Spatial concepts in museum theory and practice. In Proceedings of the 10th International Space Syntax Symposium, London, UK, 13–17 July 2015; Volume 37, pp. 1–16. [Google Scholar]
- Ahmad, S.; Abbas, M.Y.; Taib, M.Z.-M.; Masri, M. Museum Exhibition Design: Communication of meaning and the shaping of knowledge. Procedia Soc. Behav. Sci. 2014, 153, 254–265. [Google Scholar] [CrossRef] [Green Version]
- Li, Z.; Wei, Q.; He, H. A brief analysis of spatial constitution and functional organization of museum architecture: A case study on museums in Hefei. Front. Archit. Res. 2013, 2, 354–361. [Google Scholar] [CrossRef] [Green Version]
- Demir, C. Graphic design for a permanent exhibition: Exhibition design of the Museum Mimar Kemaleddin. Procedia Soc. Behav. Sci. 2012, 51, 495–500. [Google Scholar] [CrossRef] [Green Version]
- Falk, J.H.; Dierking, L.D. The Museum Experience; Routledge: New York, NY, USA, 2016. [Google Scholar]
- Wineman, J.D.; Peponis, J. Constructing Spatial Meaning: Spatial Affordances in Museum Design. Environ. Behav. 2009. [Google Scholar] [CrossRef]
- Carliner, S. Modeling Information for Three-dimensional Space; Lessons Learned from Museum Exhibit Design. Tech. Commun. 2001, 48, 66–81. [Google Scholar]
- McLean, K. Museum Exhibitions and the Dynamics of Dialogue. Daedalus 1999, 128, 83–107. Available online: http://0-www-jstor-org.brum.beds.ac.uk/stable/20027568 (accessed on 14 November 2019).
- Nubani, L.; Puryear, A.; Kellom, K. Measuring the Effect of Visual Exposure and Saliency of Museum Exhibits on Visitors’ Level of Contact and Engagement. Behav. Sci. 2018, 8, 100. [Google Scholar] [CrossRef] [PubMed] [Green Version]
- Zeng, Y.Z.; Lin, Z.J.; Wu, J.Q.; Lin, J.Y.; Gui, Y.W. (Eds.) Friedrich Waidacher, Handbuch der Allgemeinen Museologie; Museum Education Development Association: Taipei, Taiwan, 2005. [Google Scholar]
- Krukar, J. Walk, Look, Remember: The Influence of the Gallery’s Spatial Layout on Human Memory for an Art Exhibition. Behav. Sci. 2014, 4, 181–201. [Google Scholar] [CrossRef]
- Guo, Z.L. A Deep Breath in A Century: Approaches to the Exhibition Design of “The Story of Collection in A Century: National Taiwan Museum”. Natl. Taiwan Mus. 2009, 102, 82–91. [Google Scholar]
- Tzortzi, K. Museum Building Design and Exhibition Layout: Patterns of Interaction. In Proceedings of the 6th International Space Syntax Symposium, Istanbul, Turkey, 12–15 June 2007; Volume 72, pp. 1–16. [Google Scholar]
- Ding, X. Architectural Space and Exhibition Design of Museums. Archit. Creat. 2010, 10, 164–171. [Google Scholar]
- Kweon, Y. A Comparative Study on Centrality in Museum Layouts—In the Case of the Royal Museum of Scotland and Burrell Gallery. J. Asian Arch. Build. Eng. 2002, 1, 205–212. [Google Scholar] [CrossRef]
- Lin, Z.; Yingjie, Z. Solving the Facility Layout Problem with Genetic Algorithm. In Proceedings of the IEEE 6th International Conference on Industrial Engineering and Applications, Tokyo, Japan, 26–29 April 2019; pp. 164–168. [Google Scholar]
- Besbes, M.; Zolghadri, M.; Affonso, R.C.; Masmoudi, F.; Haddar, M. A methodology for solving facility layout problem considering barriers: Genetic algorithm coupled with A* search. J. Intell. Manuf. 2019, 31, 615–640. [Google Scholar] [CrossRef]
- Wei, X.; Yuan, S.; Ye, Y. Optimizing facility layout planning for reconfigurable manufacturing system based on chaos genetic algorithm. Prod. Manuf. Res. 2019, 7, 109–124. [Google Scholar] [CrossRef]
- Amaral, A.R.S. A heuristic approach for the double row layout problem. Ann. Oper. Res. 2020. [Google Scholar] [CrossRef]
- Pourhassan, M.R.; Raissi, S. A Hybrid Genetic and Particle Swarm Optimization Algorithms for Dynamic Facility Layout Problem with Multiple Transporters. In Proceedings of the 15th Iran International Industrial Engineering Conference, Yazd, Iran, 23–24 January 2019. [Google Scholar]
- Wu, Y.; Xu, S.; Zhao, H.; Wang, Y.; Feng, X. Coupling Layout Optimization of Key Plant and Industrial Area. Processes 2020, 8, 185. [Google Scholar] [CrossRef] [Green Version]
- Erculiani, L.; Dragone, P.; Teso, S.; Passerini, A. Automating layout synthesis with constructive preference elicitation. Machine Learning and Knowledge Discovery in Databases. Lect. Notes Comput. Sci. 2019, 11053, 254–270. [Google Scholar] [CrossRef]
- Amin-Hosseini, S.M.; Yazdani, R.; Fuente, A. Multi-objective interior design optimization method based on sustainability concepts for post-disaster temporary housing units. Build. Environ. 2020, 173, 1–15. [Google Scholar] [CrossRef]
- Shi, F.; Soman, R.K.; Han, J.; Whyte, J.K. Addressing adjacency constraints in rectangular floor plans using Monte-Carlo Tree Search. Autom. Constr. 2020, 115, 1–14. [Google Scholar] [CrossRef]
- Sun, X.; Ji, X. Integrated kitchen design and optimization based on the improved particle swarm intelligent algorithm. Comput. Intell. 2020, 1–12. [Google Scholar] [CrossRef]
- Lynch, K. The Image of the City, 20th ed.; Massachusetts Institute of Technology and the President and Fellows of Harvard College: Cambridge, MA, USA, 1990. [Google Scholar]
- Guo, B.; Hu, J.; Wu, W.; Peng, Q.; Wu, F. The Tabu_Genetic Algorithm: A Novel Method for Hyper-Parameter Optimization of Learning Algorithms. Electronics 2019, 8, 579. [Google Scholar] [CrossRef] [Green Version]
- Mallawaarachchi, V. Introduction to Genetic Algorithms—Including Example Code. 2017. Available online: https://towardsdatascience.com/introduction-to-genetic-algorithms-including-example-code-e396e98d8bf3 (accessed on 25 March 2020).
- Snaselova, P.; Zboril, F. Genetic Algorithm using Theory of Chaos. Procedia Comput. Sci. 2015, 51, 316–325. [Google Scholar] [CrossRef] [Green Version]
- Taipei City Government. The Main Plan of the Taipei Rail Workshop Museum’s Specific Dedicated Area and Road Land; Taipei City Government: Taipei, Taiwan, 2014.
- Hosseini-Nasab, H.; Fereidouni, S.; Ghomi, F.S.M.T.; Fakhrzad, M.B. Classification of facility layout problems: A review study. Int. J. Adv. Manuf. Technol. 2018, 94, 957–977. [Google Scholar] [CrossRef]
- Al-Zubaidi, S.Q.D.; Fantoni, G.; Failli, F. Analysis of drivers for solving facility layout problems: A Literature review. J. Ind. Inf. Integr. 2020, 21, 1–13. [Google Scholar] [CrossRef]
- Kim, T.J.; Wiggins, L.L.; Wright, J.R. (Eds.) Expert systems: Applications to Urban Planning; Springer-Verlag: New York, NY, USA, 1990. [Google Scholar]
- Wagner, W.P. Trends in expert system development: A longitudinal content analysis of over thirty years of expert system case studies. Expert Syst. Appl. 2017, 76, 85–96. [Google Scholar] [CrossRef]
- Levy-Fix, G.; Kuperman, J.G.; Elhadad, N. Machine learning and visualization in clinical decision support: Current state and future directions. arXiv 2019, arXiv:1906.02664. [Google Scholar]
- Ling, Y.; Hasan, S.A.; Datla, V.; Qadir, A.; Lee, K.; Liu, J.; Farri, O. Diagnostic inferencing via improving clinical concept extraction with deep reinforcement learning: A preliminary study. In Proceedings of the Machine Learning for Healthcare Conference, Boston, MA, USA, 18–19 August 2017; pp. 271–285. [Google Scholar]
- Ravuri, M.; Kannan, A.; Tso, G.J.; Amatriain, X. Learning from the experts: From expert systems to machine-learned diagnosis models. Proc. Mach. Learn. Res. 2018, 85, 1–16. [Google Scholar]
- Styx, L. How Are Museums Using Artificial Intelligence, and Is AI the Future of Museums? MuseumNext. 2019. Available online: https://www.museumnext.com/article/artificial-intelligence-and-the-future-of-museums/ (accessed on 17 May 2020).
- Majd, M.; Safabakhsh, R. Impact of machine learning on improvement of user experience in museums. In Proceedings of the Artificial Intelligence and Signal Processing (AISP), Shiraz, Iran, 25–26 October 2017; pp. 195–200. [Google Scholar]
- Dan, T.X.; Phuc, P.N.K. Application of machine learning in forecasting energy usage of building design. In Proceedings of the 4th International Conference on Green Technology and Sustainable Development, Ho Chi Minh City, Vietnam, 23–24 November 2018; pp. 53–59. [Google Scholar] [CrossRef]
- Lin, Y.; Pan, D.Z. Machine learning in physical verification, mask synthesis, and physical design. In Machine Learning in VLSI Computer-Aided Design; Elfadel, I., Boning, D., Li, X., Eds.; Springer: Cham, Switzerland, 2019; pp. 95–115. [Google Scholar]
- Pavlidis, G. Apollo—A hybrid recommender for museums and cultural tourism. In Proceedings of the International Conference on Intelligent Systems, Funchal, Portugal, 25–27 September 2018; pp. 94–101. [Google Scholar] [CrossRef]
- Selin, J.; Rossi, M. The functional design method for buildings (FDM) with gamification of information models and AI help to design safer buildings. In Proceedings of the Federated Conference on Computer Science and Information Systems, Poznan, Poland, 9–12 September 2018; Volume 15, pp. 907–911. [Google Scholar] [CrossRef]
- Salas-Olmedo, M.H.; Moya-Gomez, M.; Garcia-Palomares, J.C.; Gutierrez, J. Tourists’ digital footprint in cities: Comparing big data sources. Tour. Manag. 2018, 66, 13–25. [Google Scholar] [CrossRef] [Green Version]
Figure 1.
The multilayered environment of a museum (this study): (a) exhibition space is the core area of a museum; (b) concept tree of each function area and percentage in museums.
Figure 1.
The multilayered environment of a museum (this study): (a) exhibition space is the core area of a museum; (b) concept tree of each function area and percentage in museums.

Figure 2.
The interactive experience model (IEM) (source: adapted from Falk and Dierking [21]).
Figure 2.
The interactive experience model (IEM) (source: adapted from Falk and Dierking [21]).

Figure 3.
The approach and steps of the genetic algorithm (source: adapted from Mallawaarachchi [44]): (a) the relationship of population, chromosomes, and genes (Population = ∑Cj; Ca … Ck are the chromosomes in a population, j is the ordinal number of the chromosome; ai, … kn are the genes in the chromosomes, i is the ordinal number of the gene); (b) crossover point of parents’ gene; (c) producing new offspring after crossover; (d) selecting better offspring to mutation, and the difference of before and after mutation.

Figure 4.
Taipei Railway Work’s rail cultural heritage landscape (source: adapted from Taiwan Railway Administration (TRA)).
Figure 4.
Taipei Railway Work’s rail cultural heritage landscape (source: adapted from Taiwan Railway Administration (TRA)).

Figure 5.
Some pictures of collecting trains for National Railway Museum in Taiwan (adapted from TWA).
Figure 5.
Some pictures of collecting trains for National Railway Museum in Taiwan (adapted from TWA).

Figure 6.
Thirty-two synthesis layout patterns with entrances facing away from the exits. Note: The pattern 10 in red boundary is used to develop layout template.
Figure 6.
Thirty-two synthesis layout patterns with entrances facing away from the exits. Note: The pattern 10 in red boundary is used to develop layout template.

Figure 7.
The layout template of the main structure of grounded objects in the galley (7th building in the Taipei Railway Workshop (TRW) and the size is 84 × 38.4 m in Length × Width).
Figure 7.
The layout template of the main structure of grounded objects in the galley (7th building in the Taipei Railway Workshop (TRW) and the size is 84 × 38.4 m in Length × Width).

Figure 8.
The optimal processes of layout instance: (a) the score of Parent I is 7.26, and the Parent II is 7.24; (b) the score of Offspring I is 7.69, and Offspring II is 6.82; (c) after mutation, the score of Offspring I’ is 8.3. (Note: the number is the selected ordinal number, not the number of trains in the objects database).


Table 1.
The stages of museum development in Taiwan.
| Stage | Name | Year | Social Phenomenon | Representative | Feature |
|---|---|---|---|---|---|
| I | Initial period | 1908–1949 | Japanese colonization | The Memorial Museum Affiliated to the Ministry of Civil Affairs of the Governor-General of Taiwan (1) | Investigation of the natural resources and humanities in colonial areas and tools for ideological and cultural identification |
| II | Recovered period | 1950–1960 | Important and precious cultural relics from the Central Government of Mainland to Taiwan |
| Inheritance and development of Chinese culture |
| III | Revitalized period | 1970–1980 | Economic development, social transformation, and the rise of native literature movement |
| Focus on the development of native culture, enhance public awareness of museums, and promote international exchanges |
| IV | Prosperous period | 1990–present | The rise of local autonomy and community cultural concepts |
| Diversified types and performances |
Source: adapted from Huang [10]. (1). National Taiwan Museum; (2). Natural Science Museum, Taiwan Art Museum, Science and Technology Museum, Taiwan Museum of Prehistory, Marine Biology Museum; (3). Taipei Museum of Fine Arts, Kaohsiung Museum of Fine Art; (4). Thirteen Lines Museum, Yingge Ceramics Museum, Sandi Township Aboriginal Museum; (5). Shunyi Aboriginal Museum, Chi Mei Museum, Hongxi Art Museum, and Ju Ming Art Museum.
Table 2.
Some national railway museums in the world.
| Nation | Name/Year | Feature | Visitor |
|---|---|---|---|
| France | Milos Railway Museum (1971) |
| 120,000/year |
| Britain | York Railway Museum (1975) |
| 744,000/year |
| Germany | Nuremberg Transport Museum (1899) |
| 200,000/year |
| Germany | Bochum Railway Museum (1977) |
| 70,000/year |
| Australia | Queensland Railway Museum (2002) |
| 250,000/year |
| India | New Delhi Railway Museum (1977) |
| 300,000/year |
| Japan | Omiya Railway Museum (2007) |
| 1,000,000/year |
Source: this study.
Table 3.
Museum space function and proportion.
| Researcher | Function Category | Area Ratio | Other Note |
|---|---|---|---|
| Ambrose and Paine (2018) | 1. Reception 2. Storage 3. Exhibitions 4. Support service | The area of each functional category is 25% | It is more effective to use limited space for regularly changing exhibitions for small or museums |
| Genoways and Lreland (2003) | 1. Storage 2. Displays 3. Others | 1. The area of storage and display is both 30% 2. Other area is 40% | |
| Bànzé Zhòngxìn (1997) | 1. Reception 2. Display 3. Collection 4. Research 5. Education 6. Management | 1. The area of exhibition and storage is both 25% 2. Sum area of research and education is 25% 3. Sum area of reception and management is 25% | The exhibition area of small and medium museums is about 50% |
Source: this study. Different researchers have different statements, the idea of Ambrose and Paine is accepted in this study.
Table 4.
The abstract of the physical principles and suggestions for exhibit layout planning (ELP).
| Dimension | Physical Principle | Suggestion | |
|---|---|---|---|
| Visitors | Orientation |
|
|
| Visiting time |
|
| |
| Visual distance |
|
| |
| Number of visitors |
|
| |
| Objects | Function |
| Selecting exhibits acquired by a heuristic algorithm |
| Attributions |
|
| |
| Arrangement |
|
| |
| Buffer area |
| Distance and buffer area between segmented objects should be well designed | |
| Space | Containment |
|
|
| Centrality |
|
| |
| Main path |
|
| |
| District |
| Layout structure guides visitors to go along with exhibits | |
| Capacity |
| The capacity of a gallery is floor area ×80% /5 m2. (Same for the number of visitors) | |
| Area ratio | About 20% of gallery for the displays | The ratio of placement and the galley is 1:5 |
Note: (1) The total physical principles are 30 items; (2) the principles of “About 80% of the gallery is used for circulation”, and “Roughly 5 m2 per person in busy time” are double used in the dimension of “Number of visitors”, and “Capacity”.
Table 5.
Genetic algorithm application in some spatial layout problems.
| Domain | Researcher | Year | Factor | Area | Algorithm |
|---|---|---|---|---|---|
| Facility | Amaral | 2020 | Row, amount, position, length, width, distance | - | GA + PSA |
| Besbes et al. | 2019 | Aisle, distance, obstacle, coordinates | 30 × 20 m2 | A* + GA | |
| Lin and Yingjie | 2019 | Plant size, width, length, position, distance | 48(= 8 × 6) m2 | GA | |
| Wei et al | 2019 | Workshop size (length, width), distance, cost, material flow | 192(= 16 × 12) m2 | GA, CGA, T_CGA | |
| Pourhassan and Raissi | 2019 | Position, time, numbers, cost | -- | GA + PSA | |
| Floor | Erculiani et al. | 2019 | Size (bounding box, tables), number of tables, distance, | 10 × 10 | Perceptron |
| Shi et al. | 2020 | Adjacency, boundary, rectangular | -- | Monte Carlo | |
| Wu et al. | 2020 | Plant size (length, width), direction, cost, boundary, non-overlapping | 2183–317,254 m2 of each plant | GA + SRFA | |
| Amin-Hosseini et al. | 2020 | Wall, floor, roof, door, window, size | 22.6 (= 4.51 × 5.01) m2 | Shoelace | |
| Furniture | Erculiani et al. | 2019 | Size (bounding box, tables), number of tables, distance, | 12 × 12 | Perceptron |
| Sun and Ji | 2020 | Object size (length, width), coordinates, distance, boundary | 48.6 m2 | PSA |
Note: genetic algorithm (GA), A* is a graph traversal and path search algorithm, chaos genetic algorithm (CGA), surplus rectangle fill algorithm (SRFA), particle swarm algorithm (PSA).
Table 6.
The result of permutations with place areas 1–5 and object 96.
| Place Amount | #Place Area = 1 | #Place Area = 2 | #Place Area = 3 | #Place Area = 4 | #Place Area = 5 |
|---|---|---|---|---|---|
| Pattern Number | Type 1 | Type 2, 3, 4 | Type 5, 6, 7 | Type 8~28 | Type 39~32 |
| Instance Quantity | P(96,1) = 96 | P(96,2) = 9120 | P(96,3) = 857,280 | P(96,4) = 79,727,040 | P(96,5) = 7,324,887,680 |
Note: The number of objects in the data is 96 so far.
Table 7.
The coordinates on the vertexes of edges in the layout template.
| R1Cj | X,Y | R2Cj | X,Y | R3Cj | X,Y | R4Cj | X,Y | R5Cj | X,Y | R6Cj | X,Y | R7Cj | X,Y |
|---|---|---|---|---|---|---|---|---|---|---|---|---|---|
| A R1C0 | 0,0 | D R7C0 | 0,38 | ||||||||||
| R1C1 | 14,0 | R2C1 | 64,3 | R3C1 | 69,15 | R4C1 | 12,17.7 | R5C1 | 12,20.7 | R6C1 | 59,26 | R7C1 | 14,38.4 |
| R1C2 | 22,0 | R2C2 | 84,3 | R3C2 | 72,15 | R4C2 | 32,17.7 | R5C2 | 32,20.7 | R6C2 | 62,26 | R7C2 | 22,38.4 |
| R1C3 | 64,0 | R4C3 | 52,17.7 | R5C3 | 52,20.7 | ||||||||
| B R1C4 | 84,0 | C R7C3 | 84,38.4 |
Table 8.
The attributions and type scores of the selected trains (a pair of chromosomes).
| No | Type | Name | Year | λStory | λSort | λRarity | Length × Width | Area(m2) |
|---|---|---|---|---|---|---|---|---|
| 1 | 25SA4101 | Float railcar | 1912 | 10 | 8 | 10 | 16.4 × 2.7 m | 44.28 |
| 2 | 25DR2055 | Diesel passenger railcar | 1975 | 6 | 8 | 8 | 5.6 × 2.42 m | 37.75 |
| 3 | 25DR2053 | Diesel passenger railcar | 1975 | 6 | 8 | 8 | 15.6 × 2.42 m | 37.75 |
| 4 | 25TPK2053 | Wooden passenger railcar | 1921 | 8 | 8 | 9 | 16.54 × 2.74 m | 45.32 |
| 5 | 35SA32820 | Float railcar | 1967 | 10 | 8 | 10 | 20 × 2.9 m | 58 |
| 6 | 20SA4102 | Float railcar | 1904 | 10 | 8 | 10 | 14 × 2.62 m | 36.68 |
| 7 | 35DR2009 | Diesel passenger railcar | 1985 | 6 | 8 | 8 | 15.6 × 2.42 m | 37.75 |
| 8 | LTPB1813 | Narrow gauge passenger carriage | 1970 | 8 | 8 | 9 | 11 × 2.3 m | 25.3 |
Note: Year means the starting usage year of the train.
Table 9.
After mutation of the layout instance (optimal chromosomes).
| No | Type | Name | Year | λStory | λSort | λRarity | Length × Width | Area(m2) |
|---|---|---|---|---|---|---|---|---|
| 5 | 35SA32820 | Float railcar | 1967 | 10 | 8 | 10 | 20 × 2.9 m | 58 |
| 6 | 20SA4102 | Float railcar | 1904 | 10 | 8 | 10 | 14 × 2.62 m | 36.68 |
| 9 | DR668 | Steam locomotive | 1940 | 10 | 10 | 10 | 19.7 × 2.89 m | 37.75 |
| 4 | 25TPK2053 | Wooden passengerrailcar | 1921 | 8 | 8 | 9 | 11 × 2.3 m | 25.3 |
Publisher’s Note: MDPI stays neutral with regard to jurisdictional claims in published maps and institutional affiliations. |
© 2021 by the authors. Licensee MDPI, Basel, Switzerland. This article is an open access article distributed under the terms and conditions of the Creative Commons Attribution (CC BY) license (http://creativecommons.org/licenses/by/4.0/).
Share and Cite
MDPI and ACS Style
Fan, L.P.; Chu, T.H. Optimal Planning Method for Large-Scale Historical Exhibits in the Taiwan Railway Museum. Appl. Sci. 2021, 11, 2424. https://0-doi-org.brum.beds.ac.uk/10.3390/app11052424
AMA Style
Fan LP, Chu TH. Optimal Planning Method for Large-Scale Historical Exhibits in the Taiwan Railway Museum. Applied Sciences. 2021; 11(5):2424. https://0-doi-org.brum.beds.ac.uk/10.3390/app11052424
Chicago/Turabian StyleFan, Lin Pey, and Tzu How Chu. 2021. "Optimal Planning Method for Large-Scale Historical Exhibits in the Taiwan Railway Museum" Applied Sciences 11, no. 5: 2424. https://0-doi-org.brum.beds.ac.uk/10.3390/app11052424
Note that from the first issue of 2016, this journal uses article numbers instead of page numbers. See further details here.