
Drivers’ Psychomotor Reaction Times Tested with a Test Station Method


Department of Vehicles and Fundamentals of Machine Design, Lodz University of Technology, 1/15 Stefanowskiego St., 90-924 Lodz, Poland
*
Author to whom correspondence should be addressed.
Appl. Sci. 2021, 11(5), 2431; https://0-doi-org.brum.beds.ac.uk/10.3390/app11052431
Submission received: 21 December 2020
/
Revised: 26 February 2021
/
Accepted: 28 February 2021
/
Published: 9 March 2021
(This article belongs to the Special Issue Human Factors in Transportation Systems)
Abstract
:The article presents the standard method of the evaluation of car drivers’ psychomotor reaction times. A characteristic feature of this method is the ability to conduct tests using real vehicles equipped with mobile measuring apparatus. Measurements are carried out on people whose task is to initiate specific maneuvers (such as: a braking or turning maneuver, a combined braking and turning maneuver, as well as e.g., the use of an audio signal) in response to external stimuli coming from different directions. The sources of the stimuli are light signals emitted by variable message signs placed around the vehicle. The developed control and measurement equipment allows us to realize various and complex test scenarios. It generates stimulus sequences, assesses the correctness of the driver’s response and measures its time. This method allows us to obtain sets of results from tests carried out under different conditions and variable test durations. The possibility of testing a large number of participants in a relatively short time and in repetitive conditions allows for reliable statistical inference. The paper presents examples of research results obtained on the basis of few thousand tests carried out on a large group of respondents. The registered data was statistically processed and referred to the literature. A high degree of correlation between the analyzed results and the literature reports proves that the presented method may be a source of data for the analysis of phenomena related to the time of the driver’s response, especially the influence of various factors affecting its values.
1. Introduction
Driving a vehicle, especially in heavy urban traffic conditions, results in a significant number of stimuli that are important from the transport point of view reaching the driver. They have to be isolated, assessed, a decision needs to be made and then followed by a potential physical response. Each of the stages takes a specific amount of time. Their total determines the total reaction time. The value of the time is important for traffic safety and should be a premise for designing road infrastructure components and driver assistance systems in a vehicle.
Reaction time is an individual feature of every driver and depends on many factors. Most often the research focuses on determining a brake response time [1,2,3,4,5,6,7]. A much smaller number of papers appear in the field of analysis of steering response time [1,2] or complex reactions, e.g., braking and steering maneuvers [2].
It is commonly known that the driver’s reaction time may depend on the sex [2], age [2,6,8] and experience of the driver [9]. The reaction time is also affected by additional factors such as: attention distractors (cell phone [10,11,12,13,14], music [12]), other mental burdens [8], weather conditions [2,9], the amount of alcohol consumed [6], driving speed [1,2], stress [7,15], diseases [4,5,6], stimulus contrast [16], as well as traffic and type of vehicle [2].
Access to statistical studies on reaction time, covering big groups of drivers, helps to formulate conclusions useful for projects concerning the improvement of road traffic safety.
Presently, works aimed at determining the value of the reaction time are carried out with several methods. One group of test methods enabled simple reaction time measurement under isolated laboratory conditions [17,18]. Another approach included field tests in conditions similar to actual road situations [1]. Recently, simulation-based test station methods have emerged. Owing to IT progress, they help to render drivers’ working conditions in a fairly reliable way (vehicle dynamics) as well as to simulate and visualize variable conditions of the environment [15,19]. Noteworthy is an another very important method based on the analysis of data collected from vehicles moving in real road traffic [2].
Each of these methods has its advantages and disadvantages [20,21,22], especially taking into account the purpose of the work. Namely, persons applying for a driver’s position or already working as drivers have to confirm their aptitude during regular psychological examinations [17,23]. The examined parameters include simple reaction times under isolated laboratory conditions. The examination is performed using such measurement techniques as Piórkowski’s apparatus (also called Möde–Piorkowski’s apparatus or Piorkowski-type machine—one of the first devices used for the diagnosis of visual and motor coordination of the upper limbs as well as the properties of motor reactions, also used to assess the psychomotor performance (reaction time) of vehicle drivers), reflection meters and cross visual–motor testers. Despite the fact that all abovementioned stations enable reaction measurement expressed in time units, they do not reflect the whole process of the driver’s reaction. However, due to their low cost, they are commonly used not only for drivers but also for machine operators and other staff whose work requires special focus. In real situations on the road, a driver’s psychomotor reaction is far more complex than the one registered and analyzed with use of the laboratory tests performed in isolated and idealized conditions. A decision-making cycle evaluation (isolating a stimulus, its assessment, making a decision and physical reaction) requires a different test environment. It can be performed as part of road tests or using driving simulators which reproduce conditions similar to real road situations. Nevertheless, both solutions require significant financial resources, which limits their common use.
Premises for Developing an Alternative Test Station Method for Reaction Time Assessment
The abovementioned test station methods provide a synthetic parameter describing the test participant’s psychomotor aptitude. Despite the fact that the parameter is expressed in time units, it does not correspond to the driver’s actual reaction to a situation on the road. Still, it is a good base for periodical comparison of the subject’s condition. The low cost of the test and its simplicity make it suitable for common use, e.g., for professional drivers’ qualification tests.
Methods based on road tests enable the measurement of a real delay between the occurrence of a stimulus and the driver’s physical response which results in an action. The equipment, test track and measurements entail significant expenditure, and the amount of time they consume challenges the tests carried out on a larger population. Extending the test in time can lead to changes in the outdoor conditions related e.g., to the weather. Such disturbance makes conducting the tests difficult and introduces the nondesired stochastic component. It can be difficult to ensure diversified but reproducible outdoor conditions within the time intended for the tests.
The presented simulation test station methods enable conducting the tests under reproducible laboratory conditions. Parts of a real vehicle cabin are normally used for the tests, which allows recording of a complete reaction time. Despite its undisputable advantages, the method can hardly become popular e.g., for mass drivers’ qualification tests due to high cost of building the test stations. Moreover, even if the driver’s cabin is rendered as reliably as possible, the results will not be universal, because taking into account different types of vehicle interior designs, including ergonomics, multiplies the costs disproportionately to the test effect.
As the abovementioned approaches were considered nonsatisfactory in relation to studies on contemporary road traffic safety, works were initiated towards developing an effective and versatile method of examining the phenomena pertaining to a driver’s psychomotor reaction time. The priority was to develop a method of collecting information about the driver’s complex reaction time under controlled laboratory conditions, using portable apparatuses mounted in real vehicles.
The reduction of the cost of making the equipment was also important, as it would contribute to more common use of the measurement set in the future, e.g., for drivers’ periodical examinations. It would be an alternative for standard examinations, which nowadays do not fully include motor coordination in a driver’s standard actions.
2. Method
2.1. Assumptions for Test Station Design (in-House Application)
Based on the abovementioned considerations, the assumptions for designing one’s own test station were specified. It should enable measuring the time of a driver’s relevant responses to a set of diversified stimuli. During the test the driver should be able to initiate maneuvers in a real vehicle, which could be made ready for the tests only by connecting several sensors. A vehicle used for the tests will not be an intrinsic part of the test station and so it will be possible to compare the effect of the driver’s different places of work on his/her reaction time, e.g., depending on the field of vision or cabin ergonomics. The equipment used for the measurements should be portable to extend its application capacity. With regard to the above a decision was made to power it with 12/24 V voltage, which will enable taking advantage of the wiring system of the vehicle used for the tests.
The test subject should have the possibility to react to optical stimuli coming from different directions. The stimuli should appear across the whole field of vision and their form should require the driver’s unambiguous interpretation and initiation of a specific maneuver. The signal of a horn can be an additional, nondirectional stimulus. The stimuli reaching the driver can be combined, e.g., a sound with a single optical stimulus, two optical stimuli coming from different directions etc. It is recommended that the stimuli should be emitted in a pseudorandom way, according to the previously arranged pattern.
The control and measurement equipment should allow for executing the scheduled test course. The test procedure prepared in a file will identify the type of stimulus, its location, the correct reaction pattern and position in time. A complete test includes a series of incoming stimuli in response to which the driver should initiate specific maneuvers such as braking, turning the steering wheel to the particular side, braking and turning simultaneously, and emitting a sound signal. A neutral position in which the driver is waiting for the next stimulus is setting the steering wheel to driving straight and pushing the accelerator. The system controlling the test station should check if this condition has been fulfilled.
The time measuring accuracy should not be less than 0.01 s. It applies both to the intervals between the stimuli and to the stimulus–reaction time interval. Increasing the time measurement accuracy does not result in increasing the usability of the acquired data.
A dynamic course of the test naturally forces the automatic collection of the measurement results in a file for its archiving, further processing and interpretation. The file should include information sequences concerning the kind of stimulus, correctness of the reaction and its measured duration.
The possibility of adding disturbing stimuli as the test station was developing needed to be taken into account. Depending on the test schedule, the stimuli could be light and/or sound stimuli. An alternative group of interferences affecting the driver’s motor coordination while responding to set stimuli could include forced motions of the vehicle body.
2.2. Test Station
Following the presented assumptions, a test station was constructed which consisted of:
- -
- Sources of stimuli in a form of symbols with variable content;
- -
- Set of sensors mounted to the vehicle;
- -
- Electronic components controlling and conditioning the signals from the sensors;
- -
- PC control and measurement application.
A vehicle, which does not require permanent modifications for mounting the sensors, is a separate, replaceable component of the test station.
2.3. Test Station Equipment
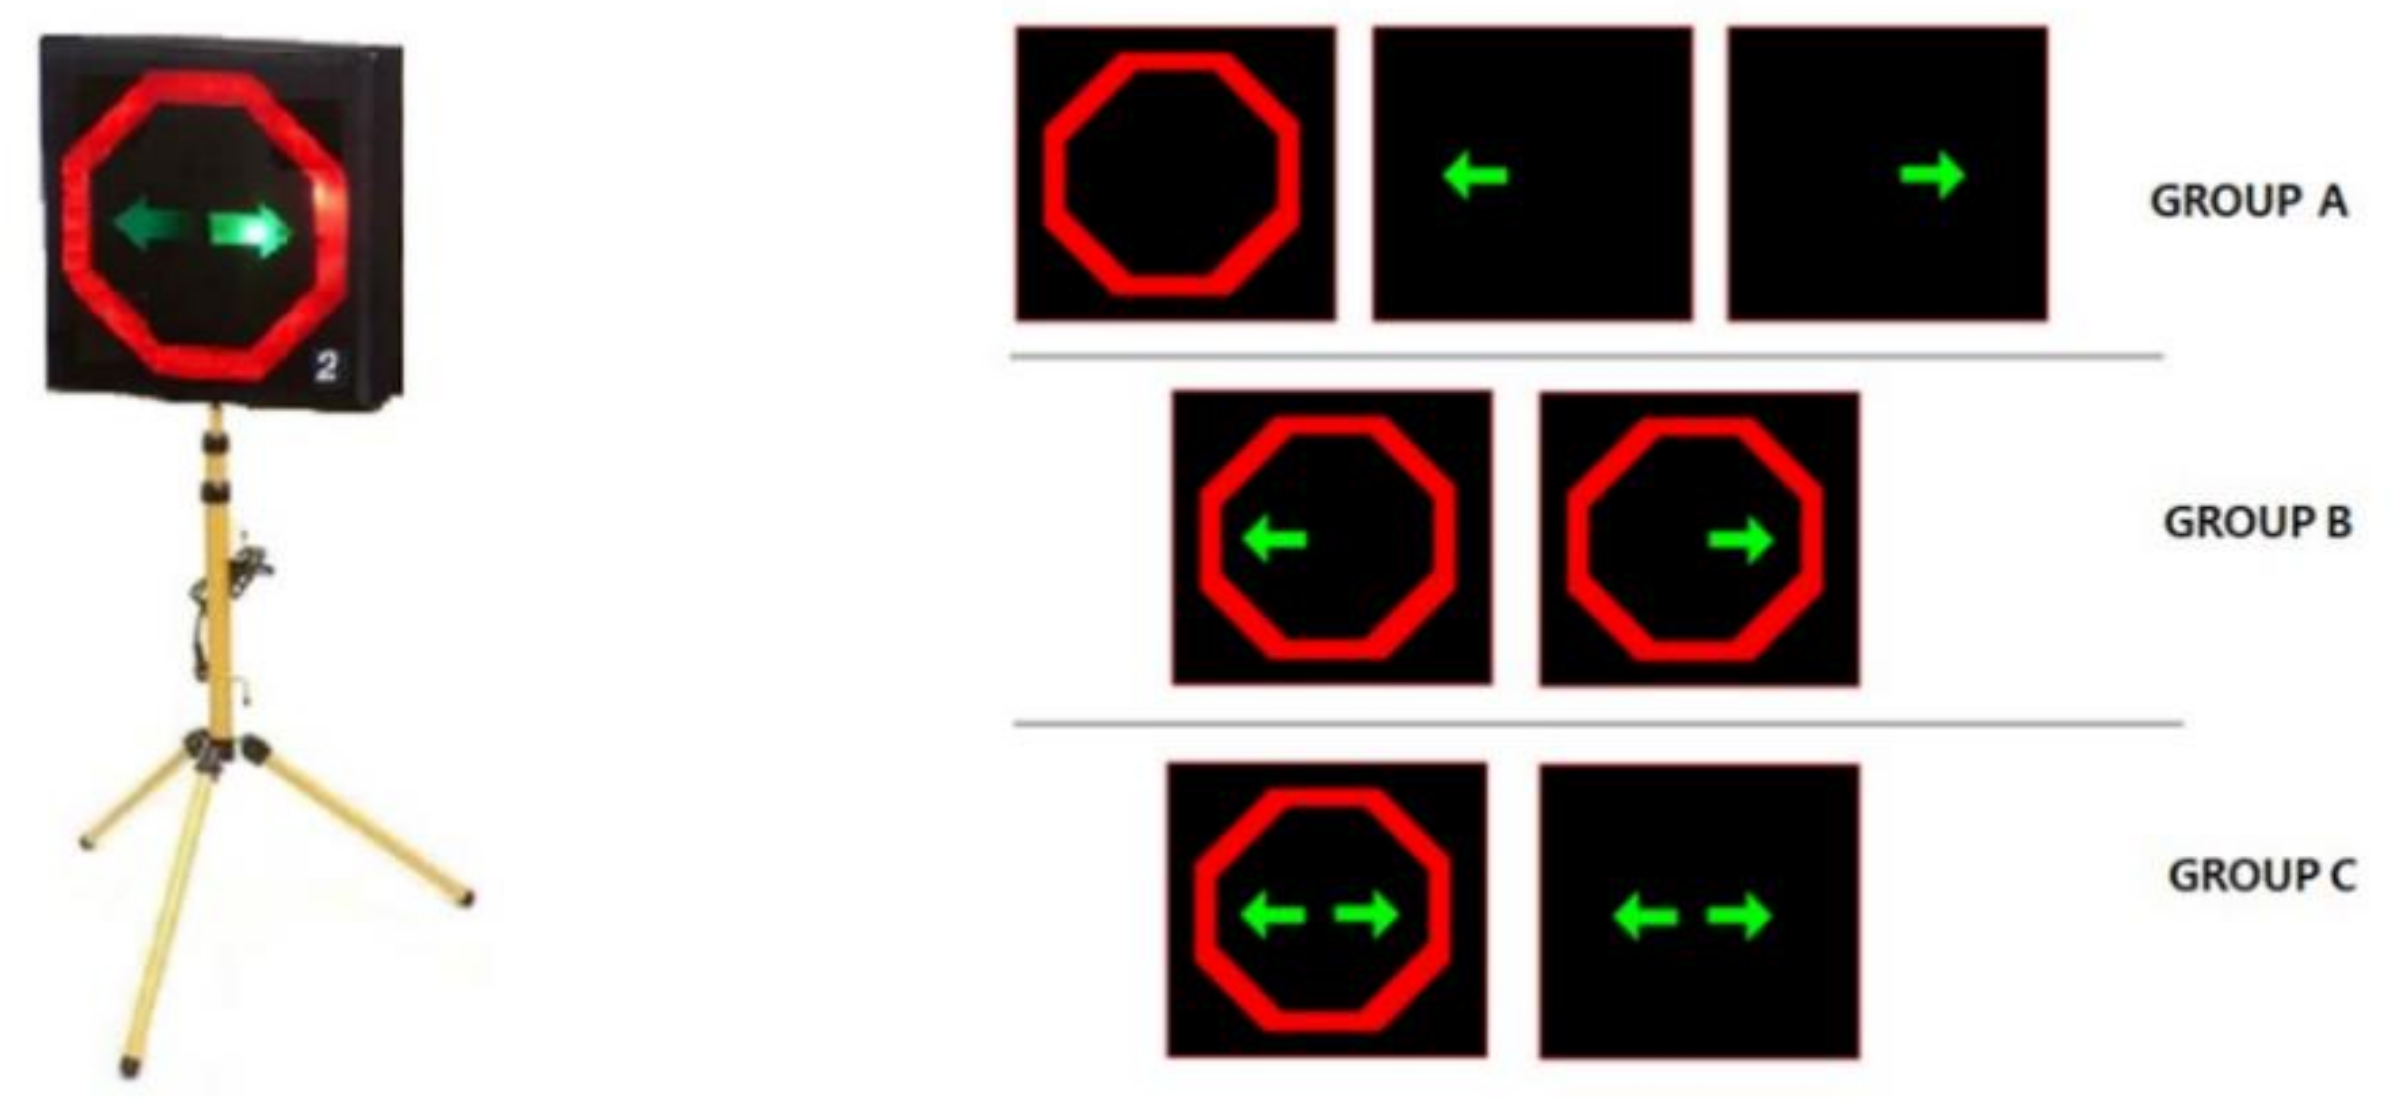
LED light boards with variable content were used as the source of stimuli. They were made as identical panels with a set collection of symbols. The area of each panel was the same as the area of a standard road sign. Telescopic bases allowed the boards positioning at different heights, depending on the size of the vehicle taking part in the test. The maximum distance between the signs and the vehicle was 15 m due to cabling, which is justified by the fact that the point was to reproduce typical road traffic conditions.
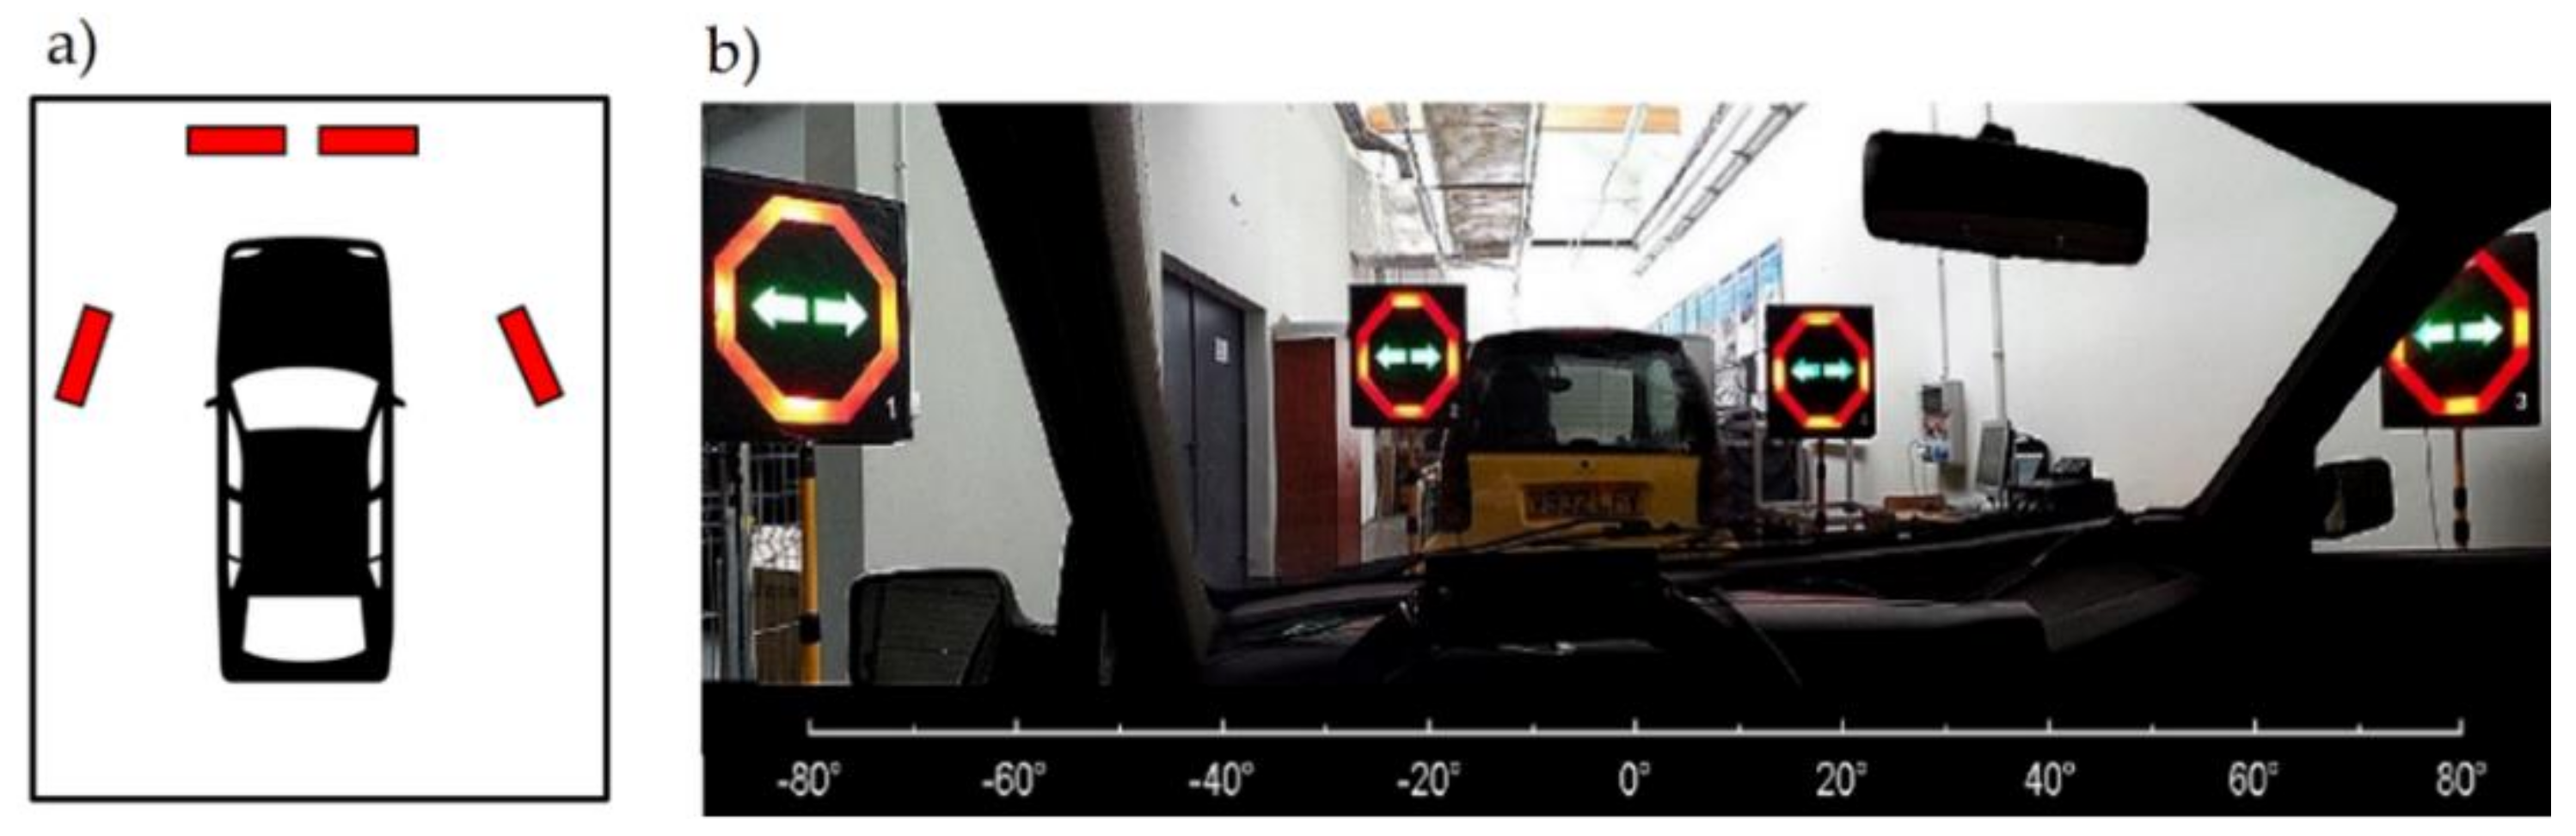
Five identical copies of the sign were made—Figure 1. Their location around the vehicle depends on the purpose of the study. In the original configuration two signs appeared in the center of the driver’s field of vision and two at the extremes (the test results for this configuration are presented in this paper)—Figure 2. There is also the possibility to put one sign behind the vehicle—visible in the rear view window.
The introduction of symbols helped to define eight conditions (states), seven of which are presented in Figure 1. The eighth one is when the sign is off.
The driver’s expected response was assigned to each pictogram. It was ensured that their interpretation should intuitively result from the shape of the symbols to reduce the necessary time devoted to the driver’s initial training. The following maneuvers were encoded in the group A symbols (Figure 1): brake, turn left and turn right. The group B symbols included double maneuvers: brake and turn left, and brake and turn right. Group C covered pictograms which could be used as instructions to use a horn and brake simultaneously or only to use the horn.
The subject’s reaction is detected in the vehicle by means of sensors. The sensors are installed in any vehicle used for the tests and so they can be easily mounted with rubber bands and suction cups.
The driver’s response is recorded by the sensors mounted in the cabin: the inertia turning sensor on the steering wheel, the photo-optical STOP light sensor and a microphone as a sound signal detector.
The expected initial position of the driver entails the need to push the accelerator brake and set the steering wheel to drive straight, hence it was necessary to introduce an additional push contact sensor mounted on the accelerator. The implemented initial condition forced the driver to make a complete motion of moving their right leg from the accelerator to the brake. It corresponds to typical driving conditions and eliminates the attempts to improve one’s results by getting ready to use the brake.
Both the sensors and the signs are connected to a PC-based control device. It obtains the input data with a measurement card (five binary signals) and controls the signs owing to a specially designed fifteen-channel set of MOSFET electronic relays. It features a function of changing the sign light intensity, which helps to diversify the contrast of the visual stimuli.
2.4. Software
The test station control application was developed in the LabVIEW environment from National Instruments and it is responsible for:
- -
- Loading a previously prepared file which defines the course of the test.
- -
- Pictogram control on each sign.
- -
- Collecting signals from sensors, evaluation of the correctness of the responses and reaction time measurement.
- -
- Visualization of the current test stage on the computer screen.
- -
- Saving the measurement results in the file.
- -
- Initial statistical analysis of the measurement results.
A file which defines the course of the test contains series of encoding information: sign number (location), displayed pictogram and time delay until the next stimulus is emitted.
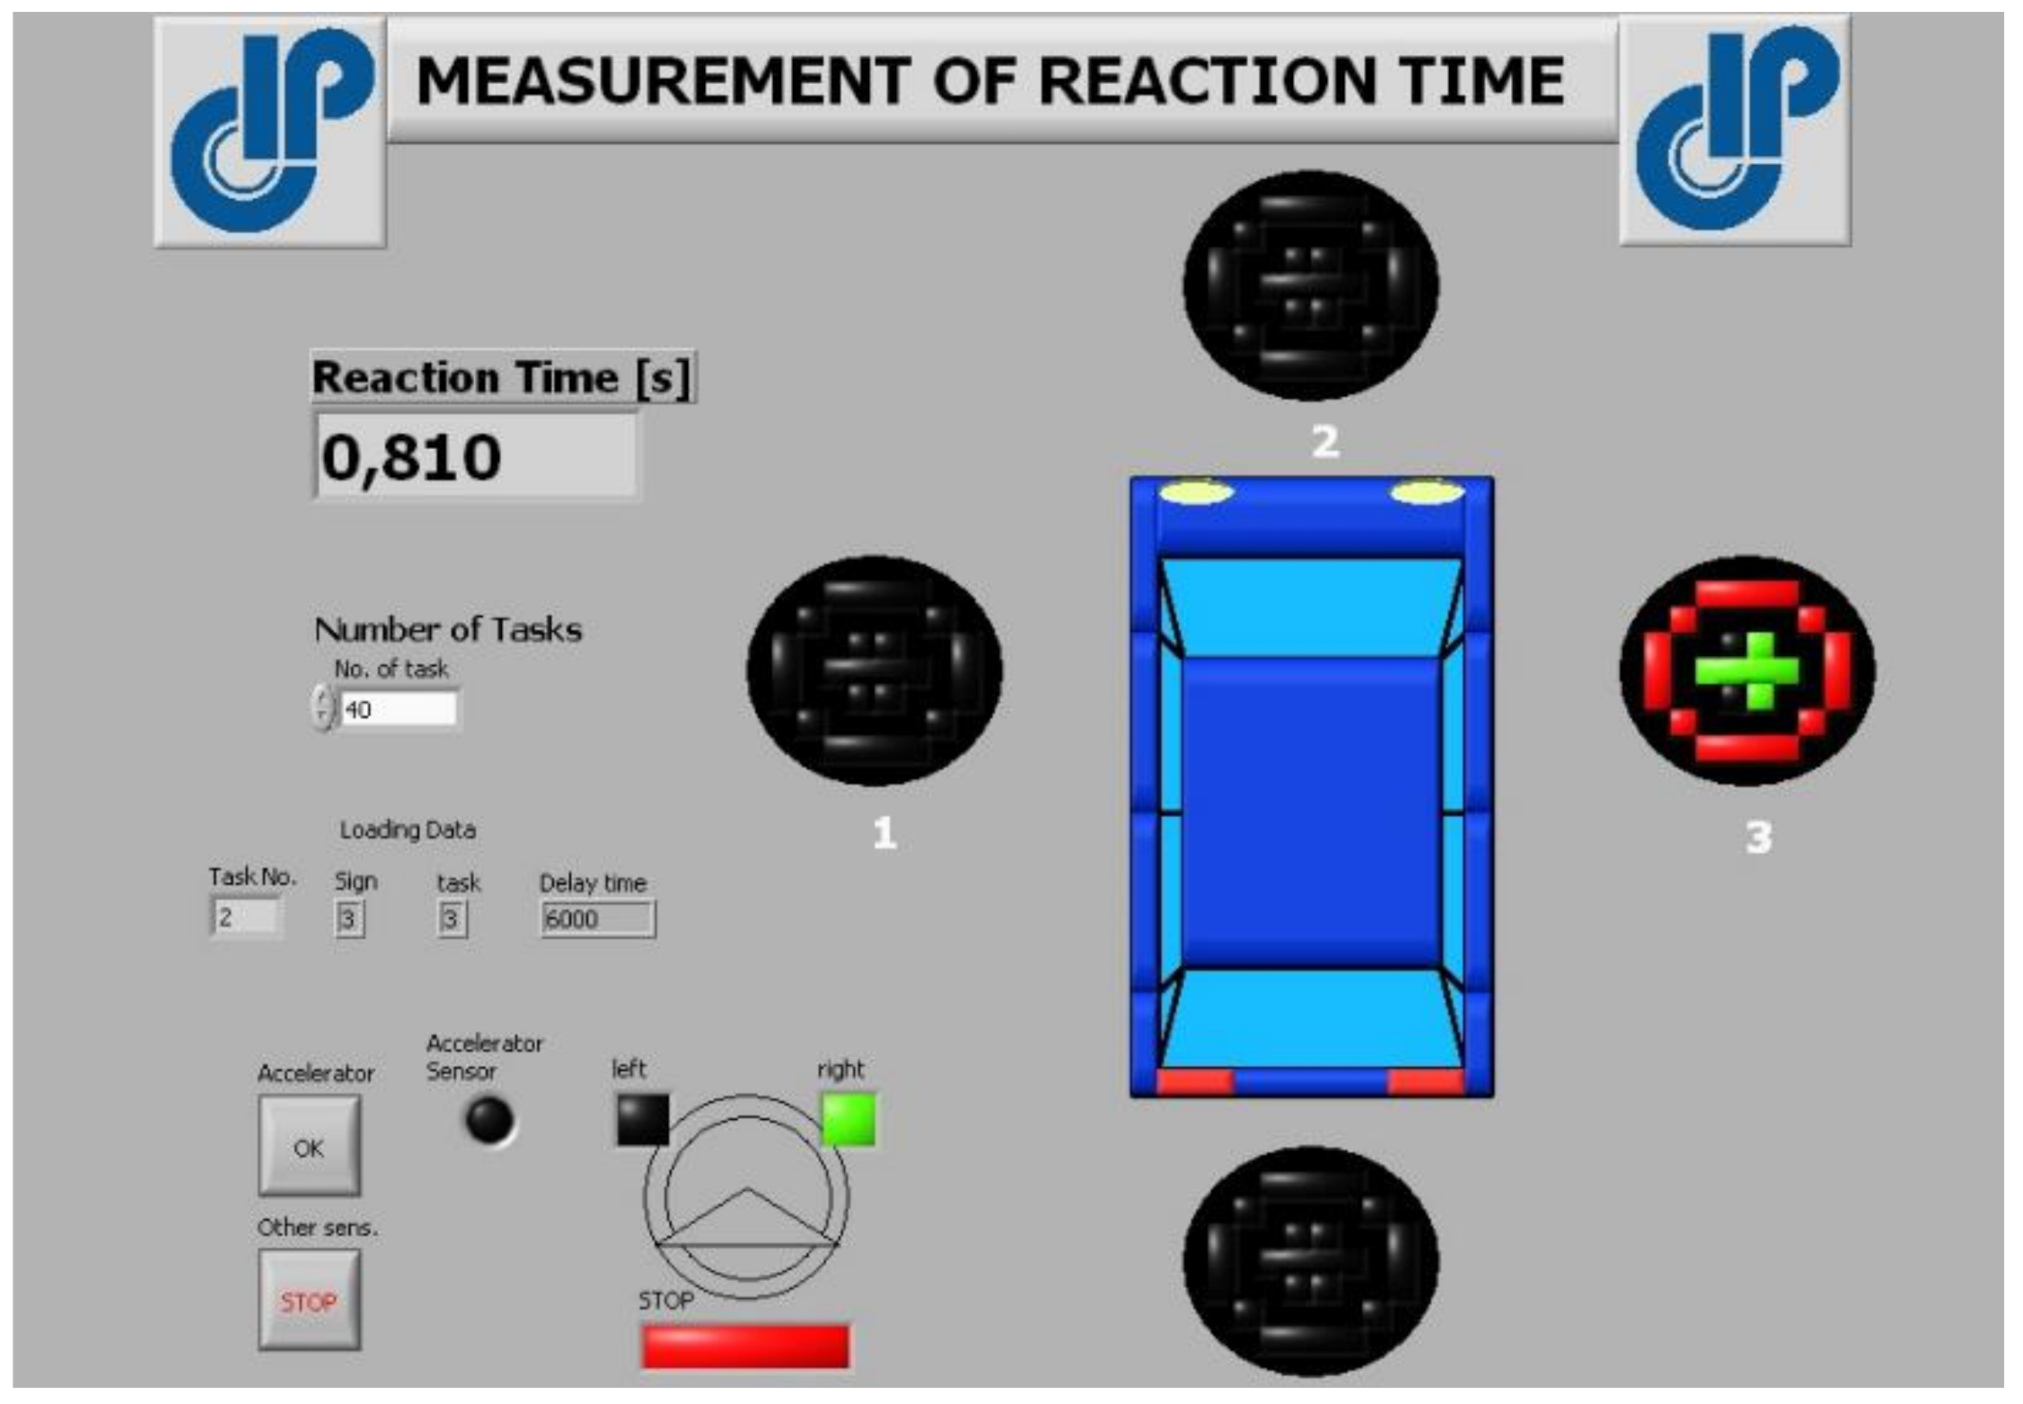
The application allows for tracing the test progress and always shows on the computer screen (Figure 3) the last recorded reaction time and the number of the test task being executed.
2.5. Course of the Test in Nominal Conditions
The possibility of examining the sensitivity of the proposed measurement method to detect the reaction time change depending on the kind of stimuli was the main topic of the study. An assumption was made that the stimuli reaching the driver would be diversified for their location against the vehicle. Additionally, the differences in the measured reaction time for turning and braking were checked.
The purpose of the study was to get the answers to the following questions:
- Is it possible to observe and measure the following aspects in the tests:
- -
- Diversification of the response time depending on the expected reaction—braking, turning or braking and turning simultaneously?
- -
- Diversification of the driver’s response time depending on the direction from which the stimulus arrives?
- Are the potentially measured differences in the reaction times confirmed in the literature data obtained with other methods?
The test schedule included long-term tests consisting of several dozen pseudorandomly sequenced stimuli coming from different directions. The signs were arranged around the vehicle so that they could provide visible signals (Figure 2):
- -
- In the center of the field of vision.
- -
- At the extremes of the field of vision, on the left and right.
- -
- In the rear view mirror (the sign is placed behind the vehicle).
In response to the stimuli, the following reactions were expected from the driver: turning the steering wheel left or right, pushing the brake, or a combined reaction of braking and turning. The tests applied to a single driver while more numerous tests were supposed to confirm the phenomena statistically.
At the beginning of the tests it was assumed that the study material to be collected should be as extensive and diversified as possible. Appropriate statistical processing of the results should enable initial evaluation of the factors which affect the reaction time. Groups consisting of several dozen drivers were examined using tests that included 50 stimuli coming at intervals lasting from 1 to 30 s. This helped to collect a few thousand responses.
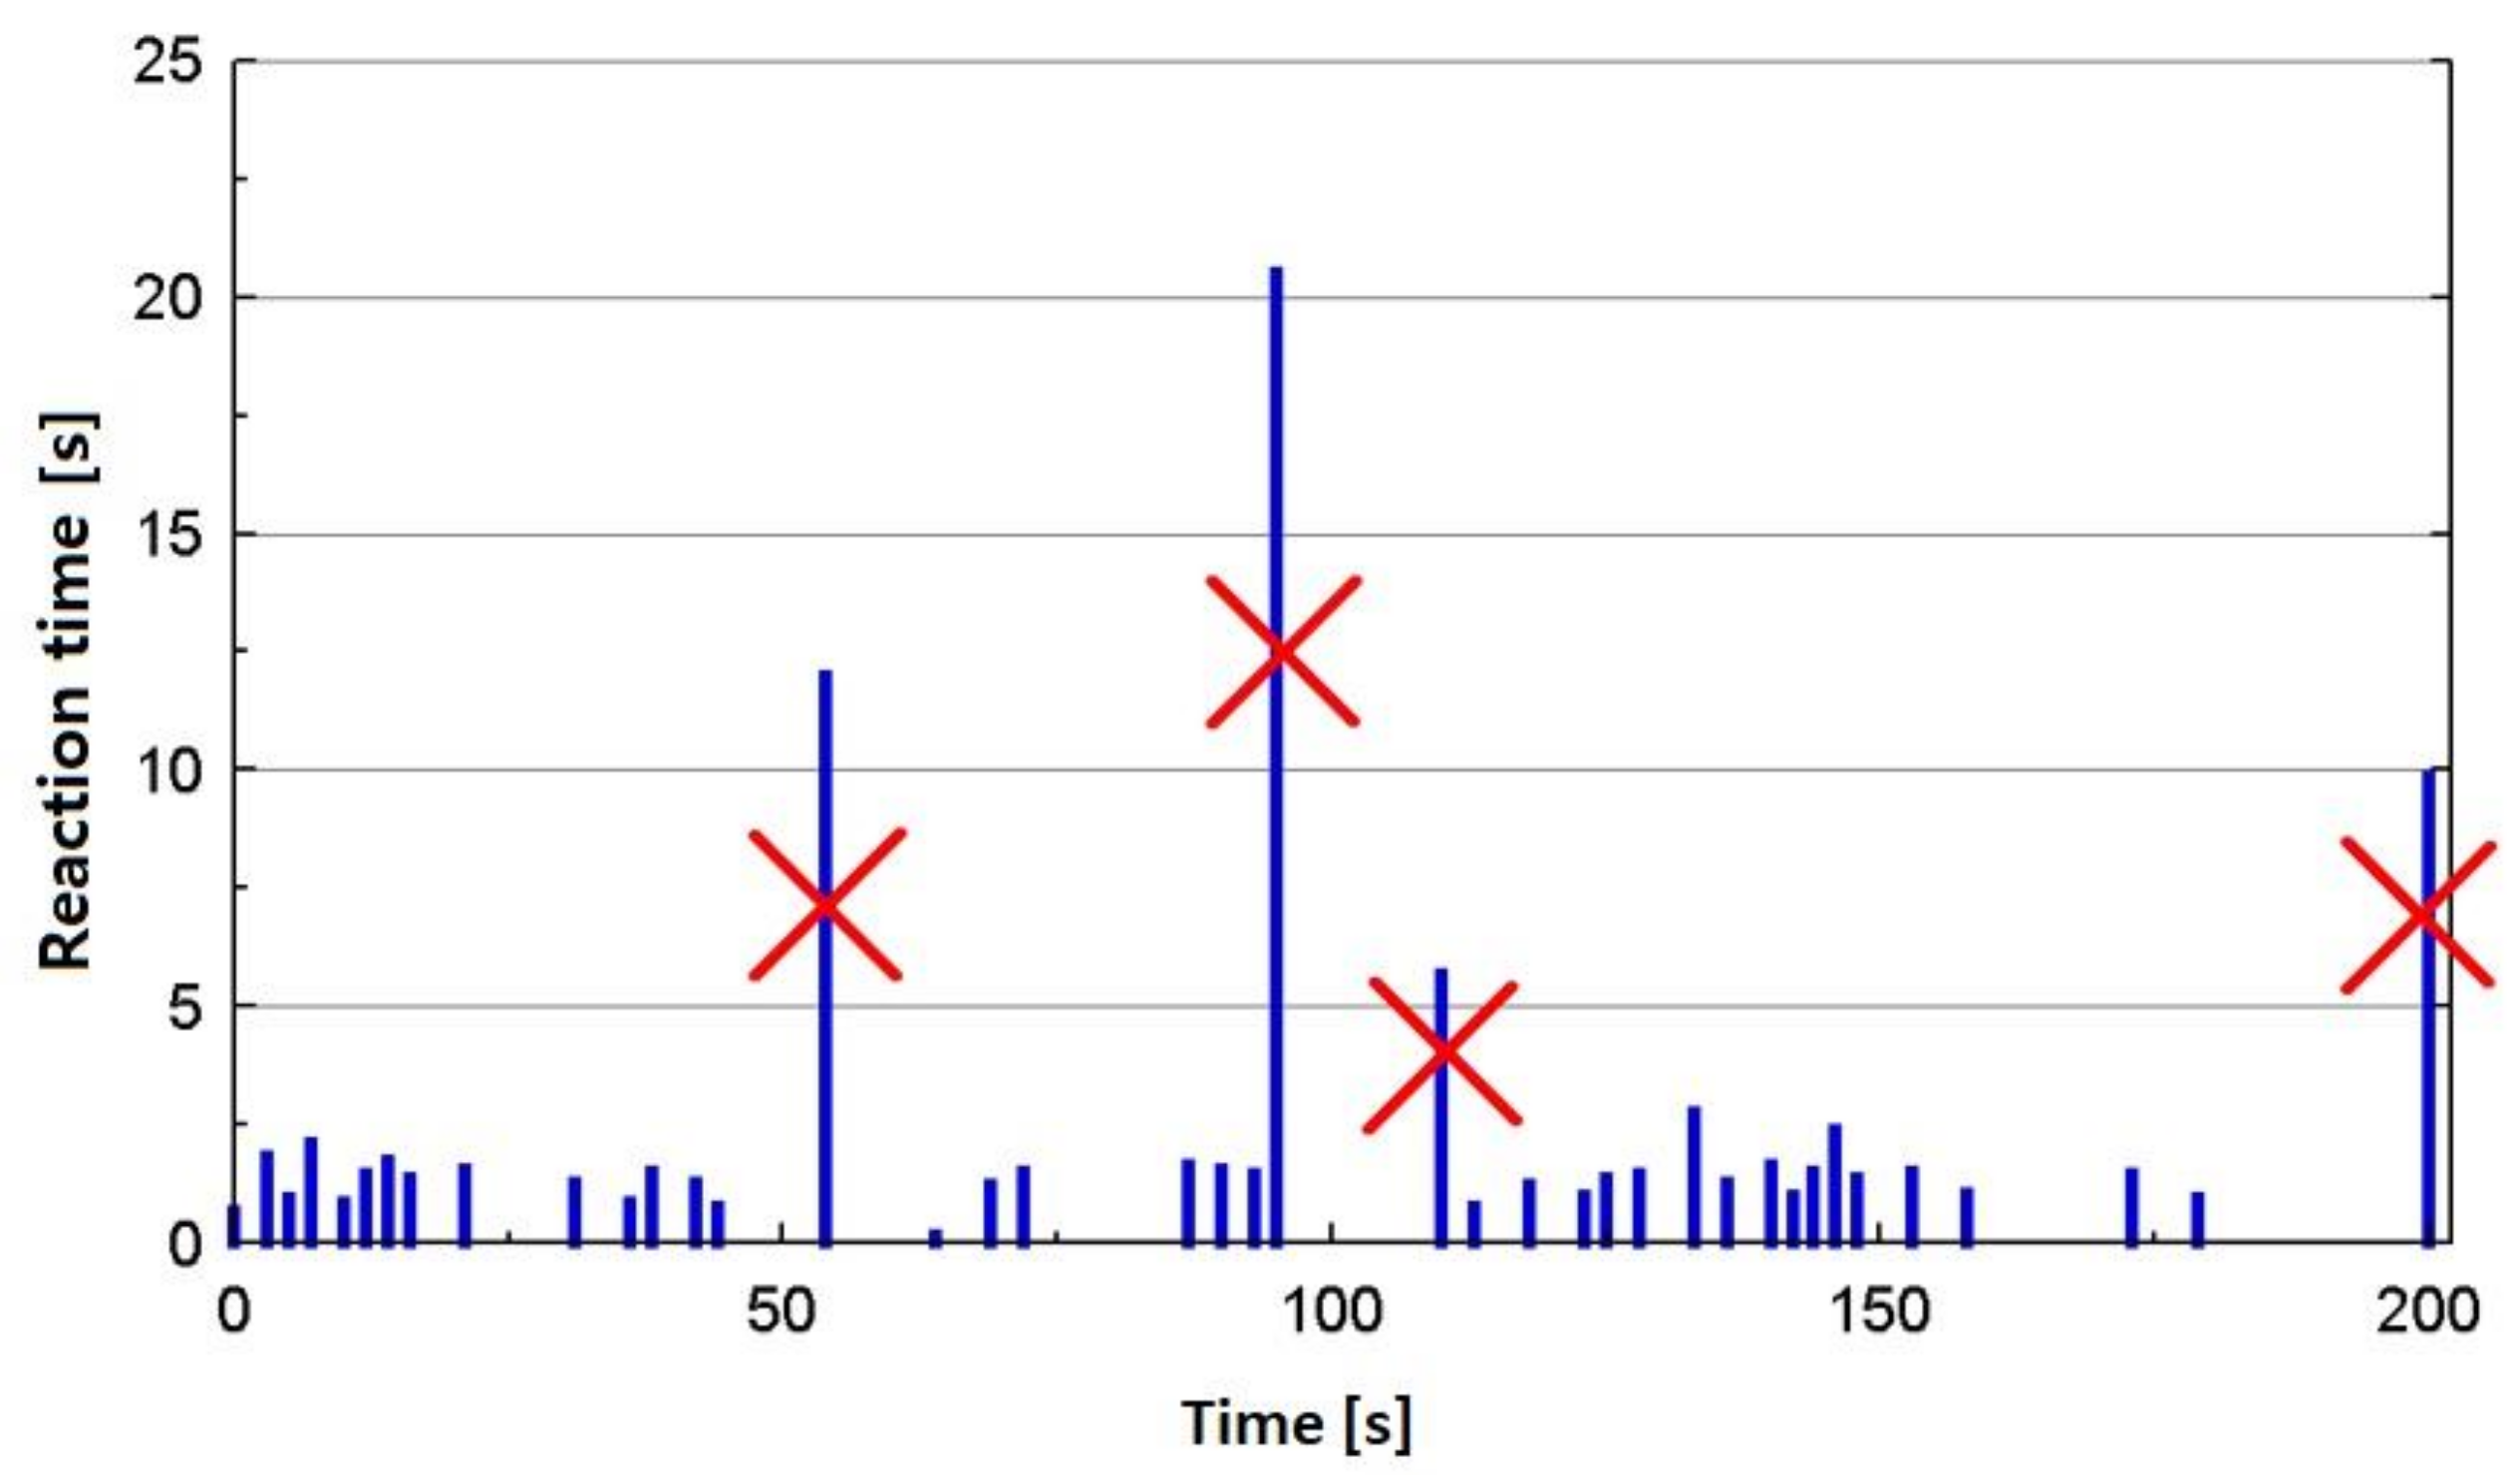
Grave errors were eliminated from the results. They constituted 4% of the responses and had unrealistically long reaction times of over a few seconds—Figure 4. The values occurred as a result of a specific reaction time measurement method in which the driver does not know whether his/her maneuver was accepted by the measurement system (the sensors purposefully do not provide feedback and switching the light sign off is the only signal informing about shifting to the next period of waiting for the subsequent stimulus).
The measurement application helped to make an initial assessment of the averaged values of a particular driver’s reaction and referring his/her result to the whole studied population owing to collection of global data.
3. Results and Discussion
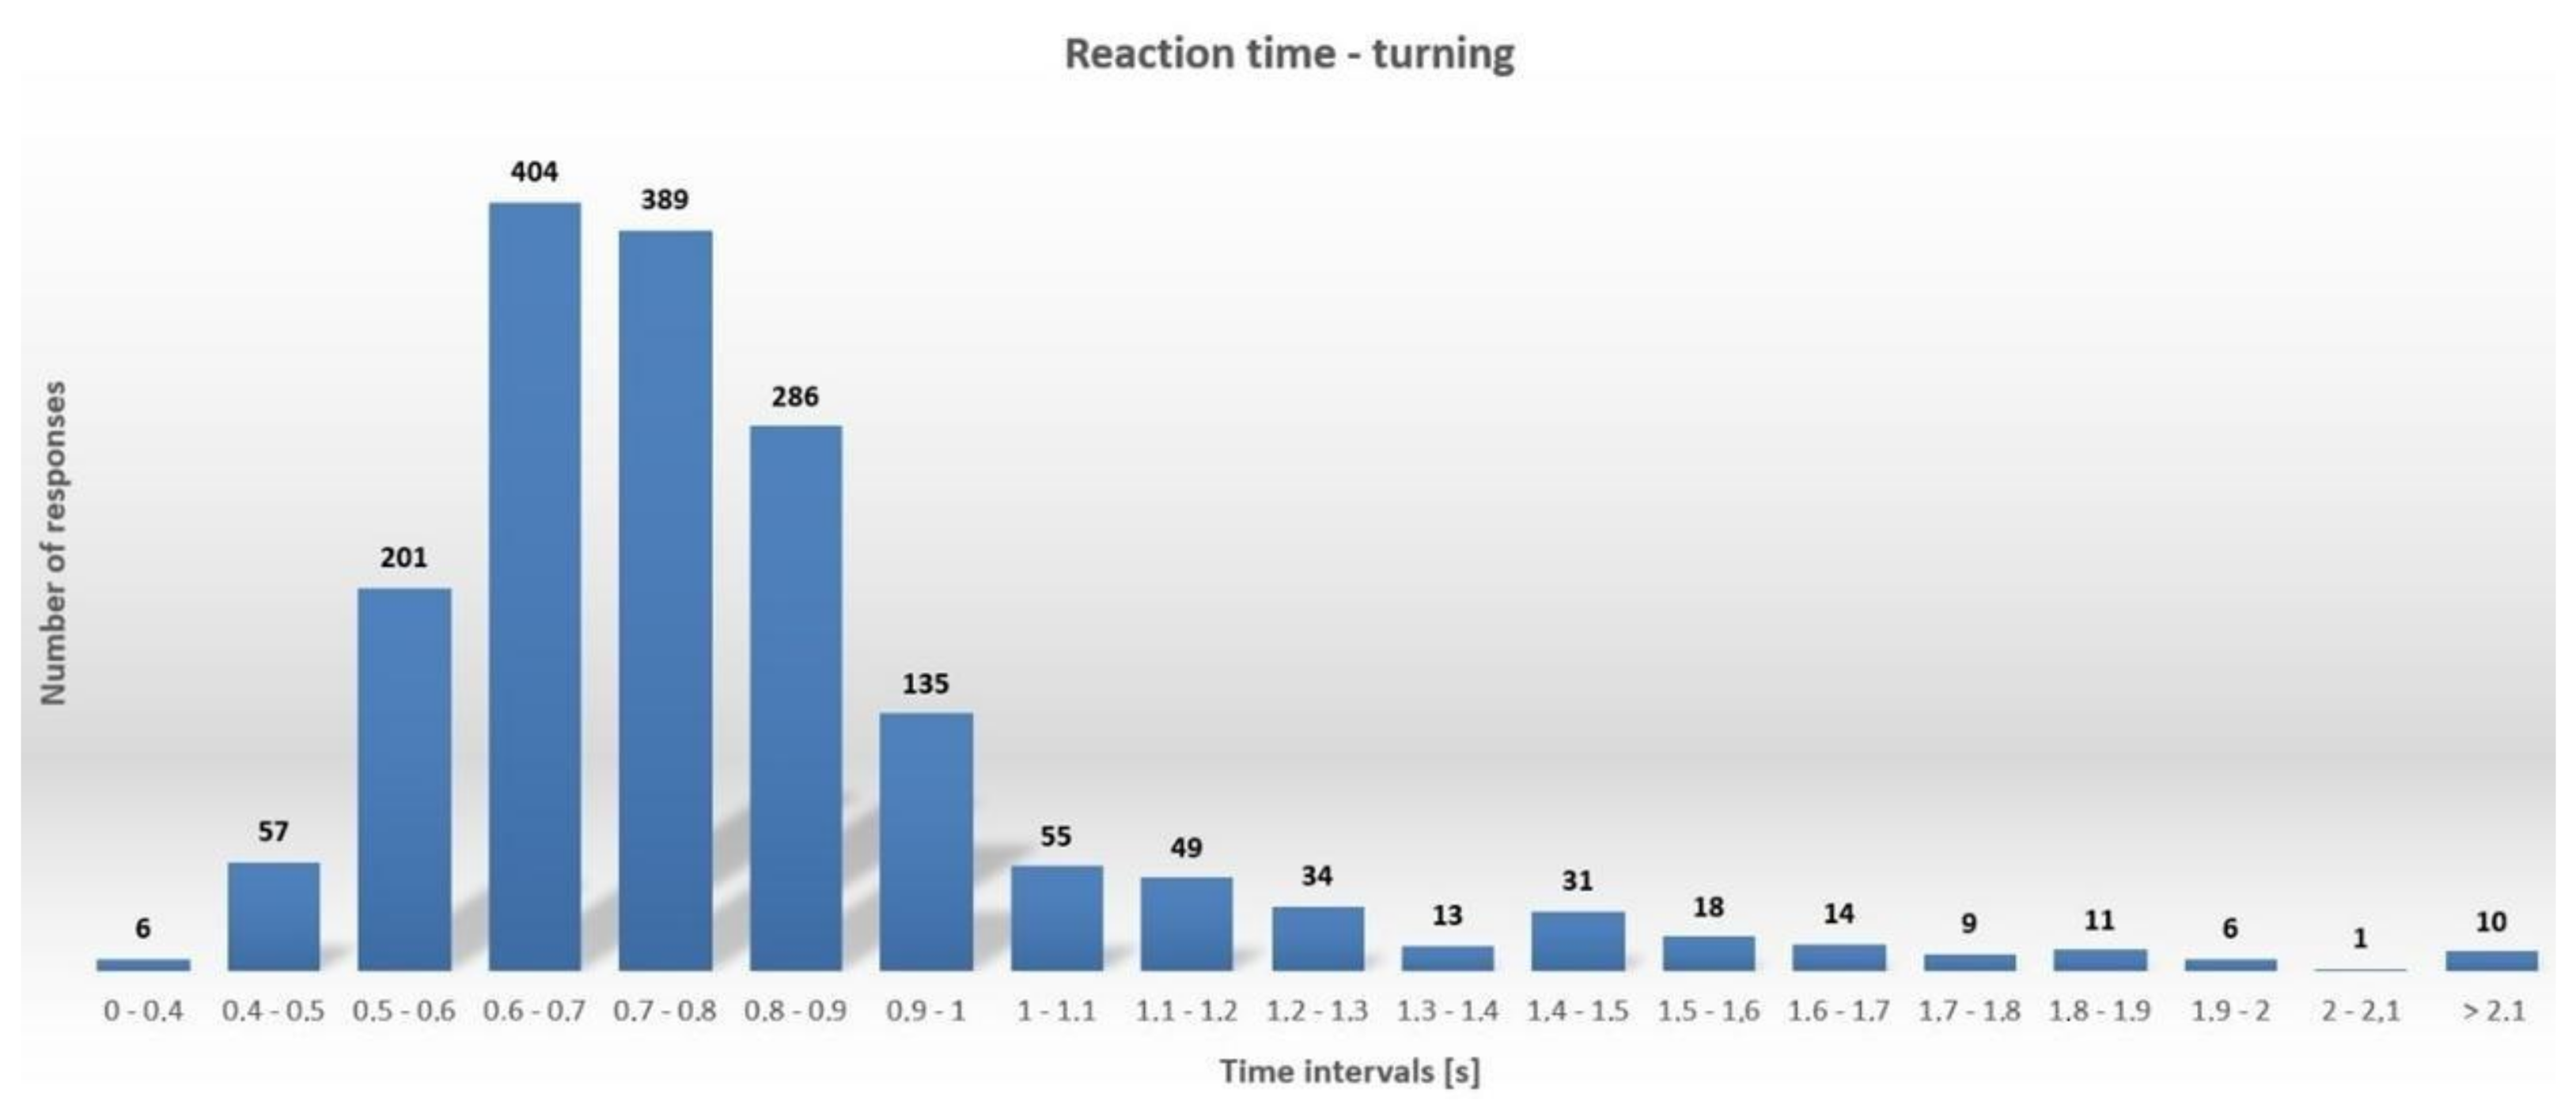
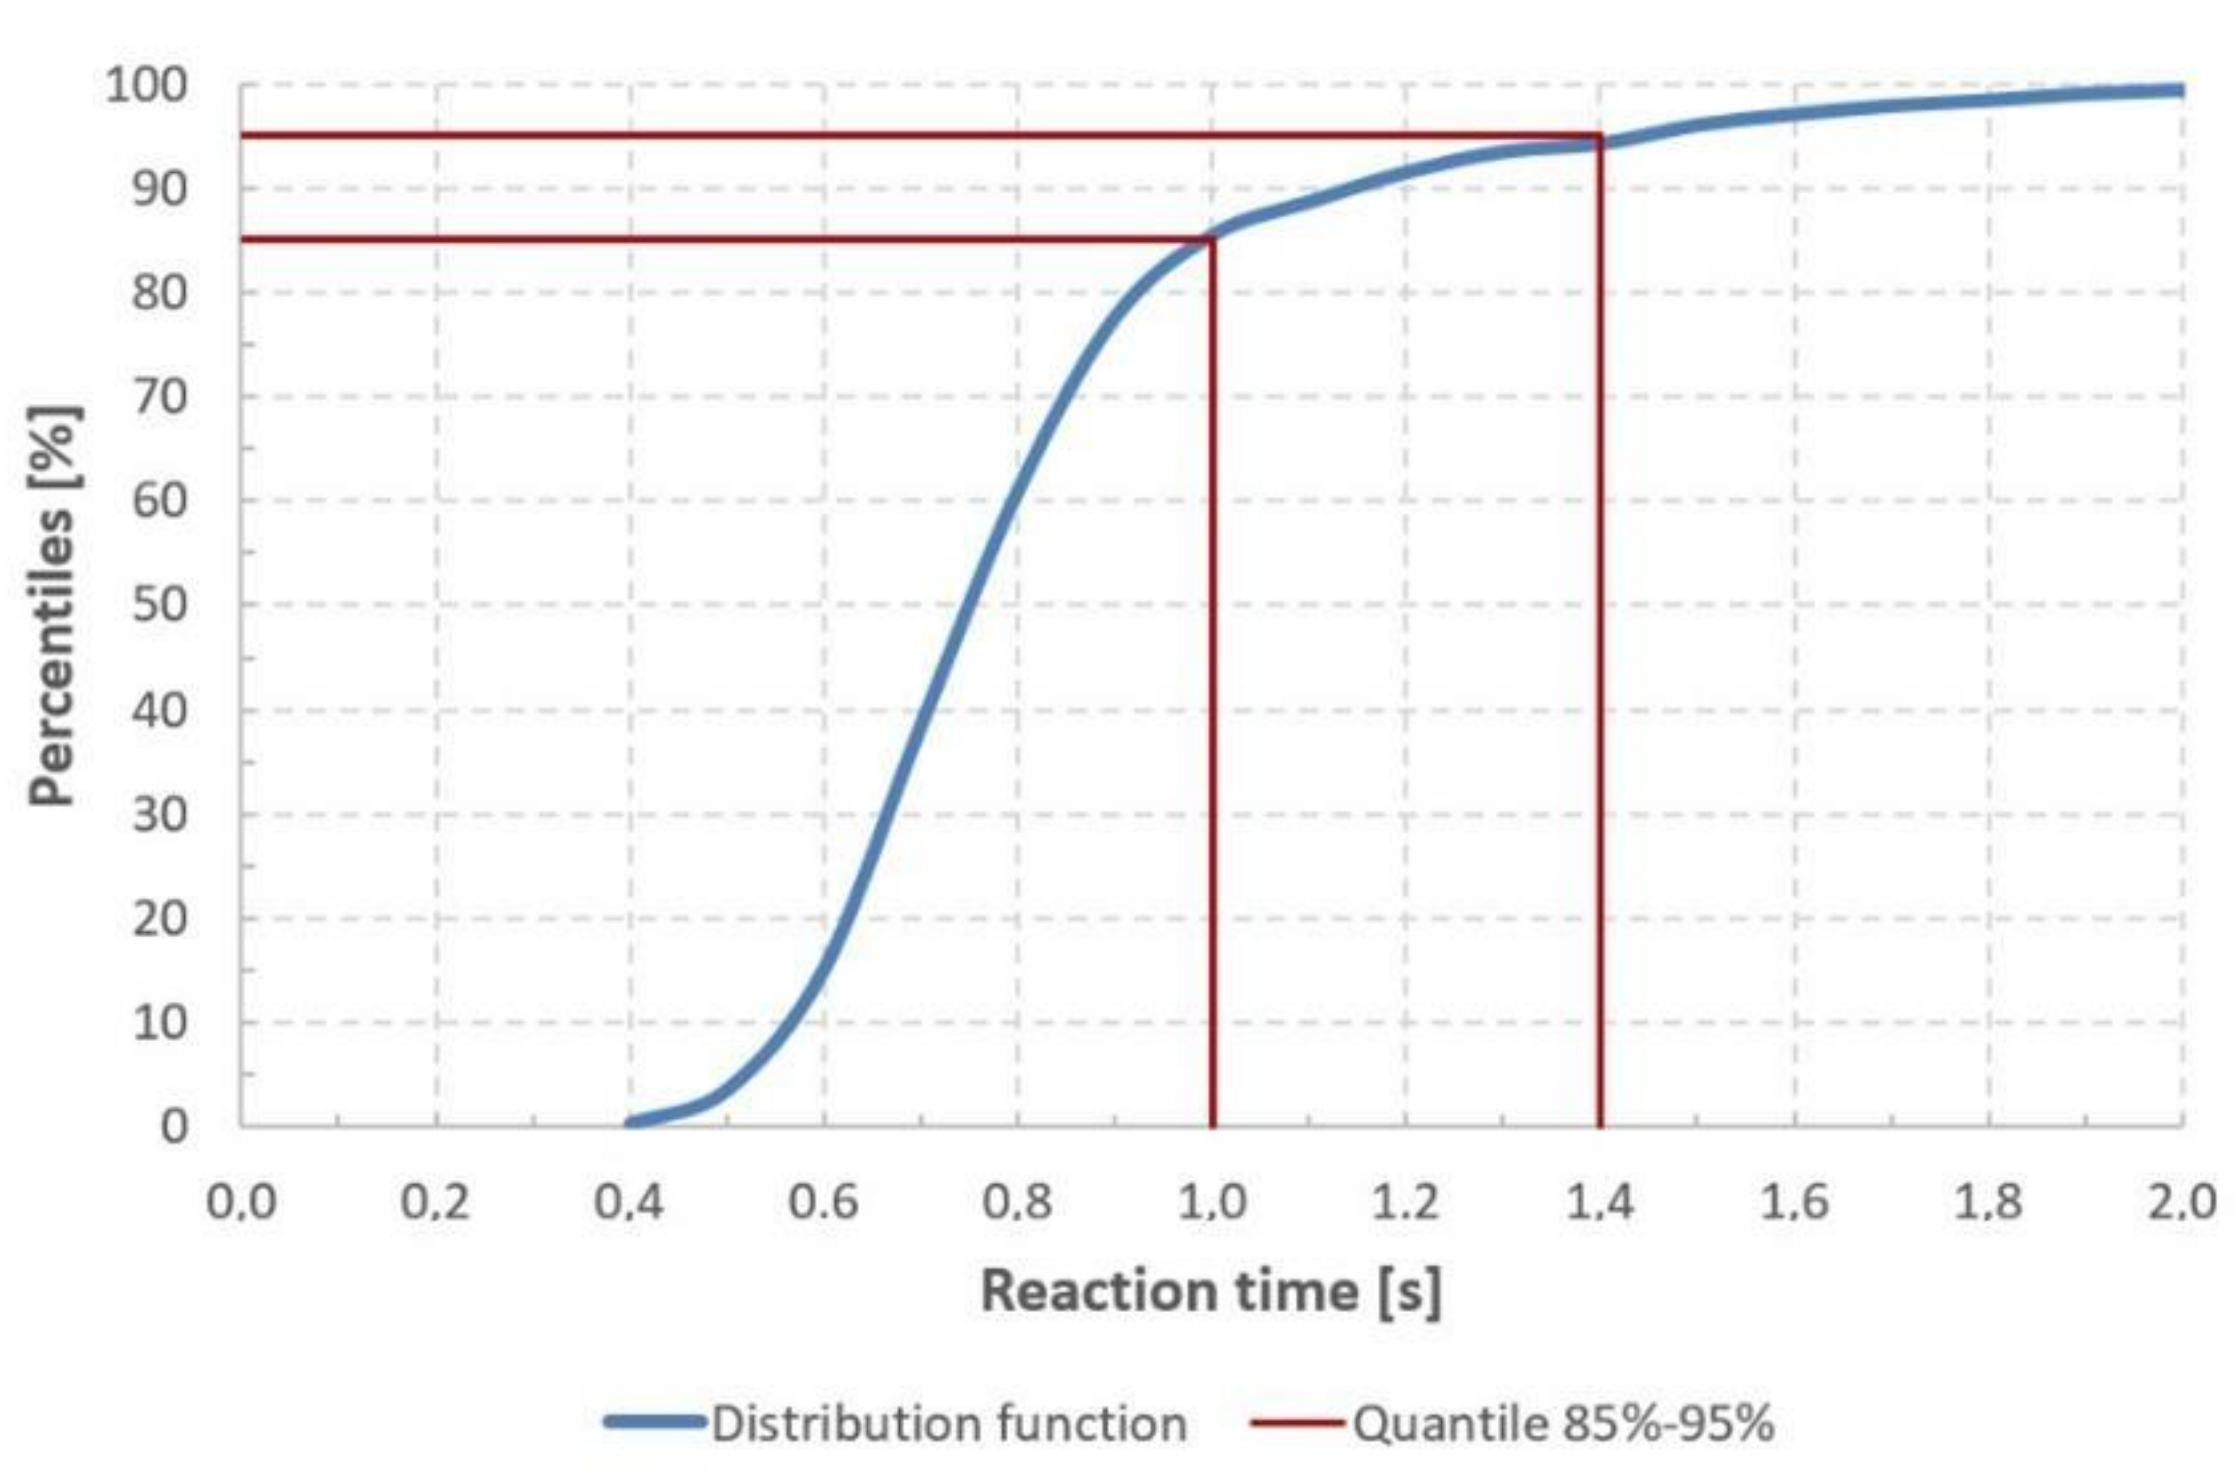
The statistical material presented below was obtained by the authors of the paper as part of students’ theses and research projects. The paper presents the results obtained on the basis of about few thousand tests carried out on a group of 82 respondents aged between 21–24 years old and having a driving license. The results were processed statistically. In the case of each analyzed maneuver (turning, braking and combined braking and turning) the results were presented in the form of histograms, showing a relative frequency as a function of the reaction time and graphs presenting the total relative frequency as a function of the reaction time. Additionally, the mean values and medians of the reaction times were determined. The method of processing the results is presented on the example of reaction times obtained for turning. The histogram (Figure 5) shows the number of responses in a reference time interval. Based on the same data an analysis of probability density distribution was performed (Figure 6).
An analysis of the histogram presented above suggests that distribution of the results does not correspond to a standard normal distribution. A clear limit of the minimum reaction time can be observed, which in this case amounted to 0.38 s. The upper limit has not been identified. The results included ones which exceeded a few seconds, but they were considered as grave errors and eliminated from further analysis. The most numerous group of responses ranged from 0.6 to 0.7 s. The mean value for the analyzed test results was 0.81 s, while the median amounted to 0.75 s. Taking into account the distribution function of the reaction time distribution at turning it can be demonstrated that 85% ÷ 95% of the studied population’s reaction times ranged from 1.0 to 1.4 s (Figure 6).
Another examined behavior of the driver was panic braking, which involved the instant shifting of the leg from the accelerator to the brake and pushing the brake strongly. Such a maneuver is far more complex than fairly simple turning, which extends the total reaction time to a stimulus. It can be observed in histogram (Figure 7), where the most numerous group of responses fell within the range between 0.9 and 1.0 s.
The minimum observed reaction time was 0.49 s, while only one response fell within the range of 0.4 ÷ 0.5 s. Another range with a low number of responses was 0.5 ÷ 0.6 s, with only four responses.
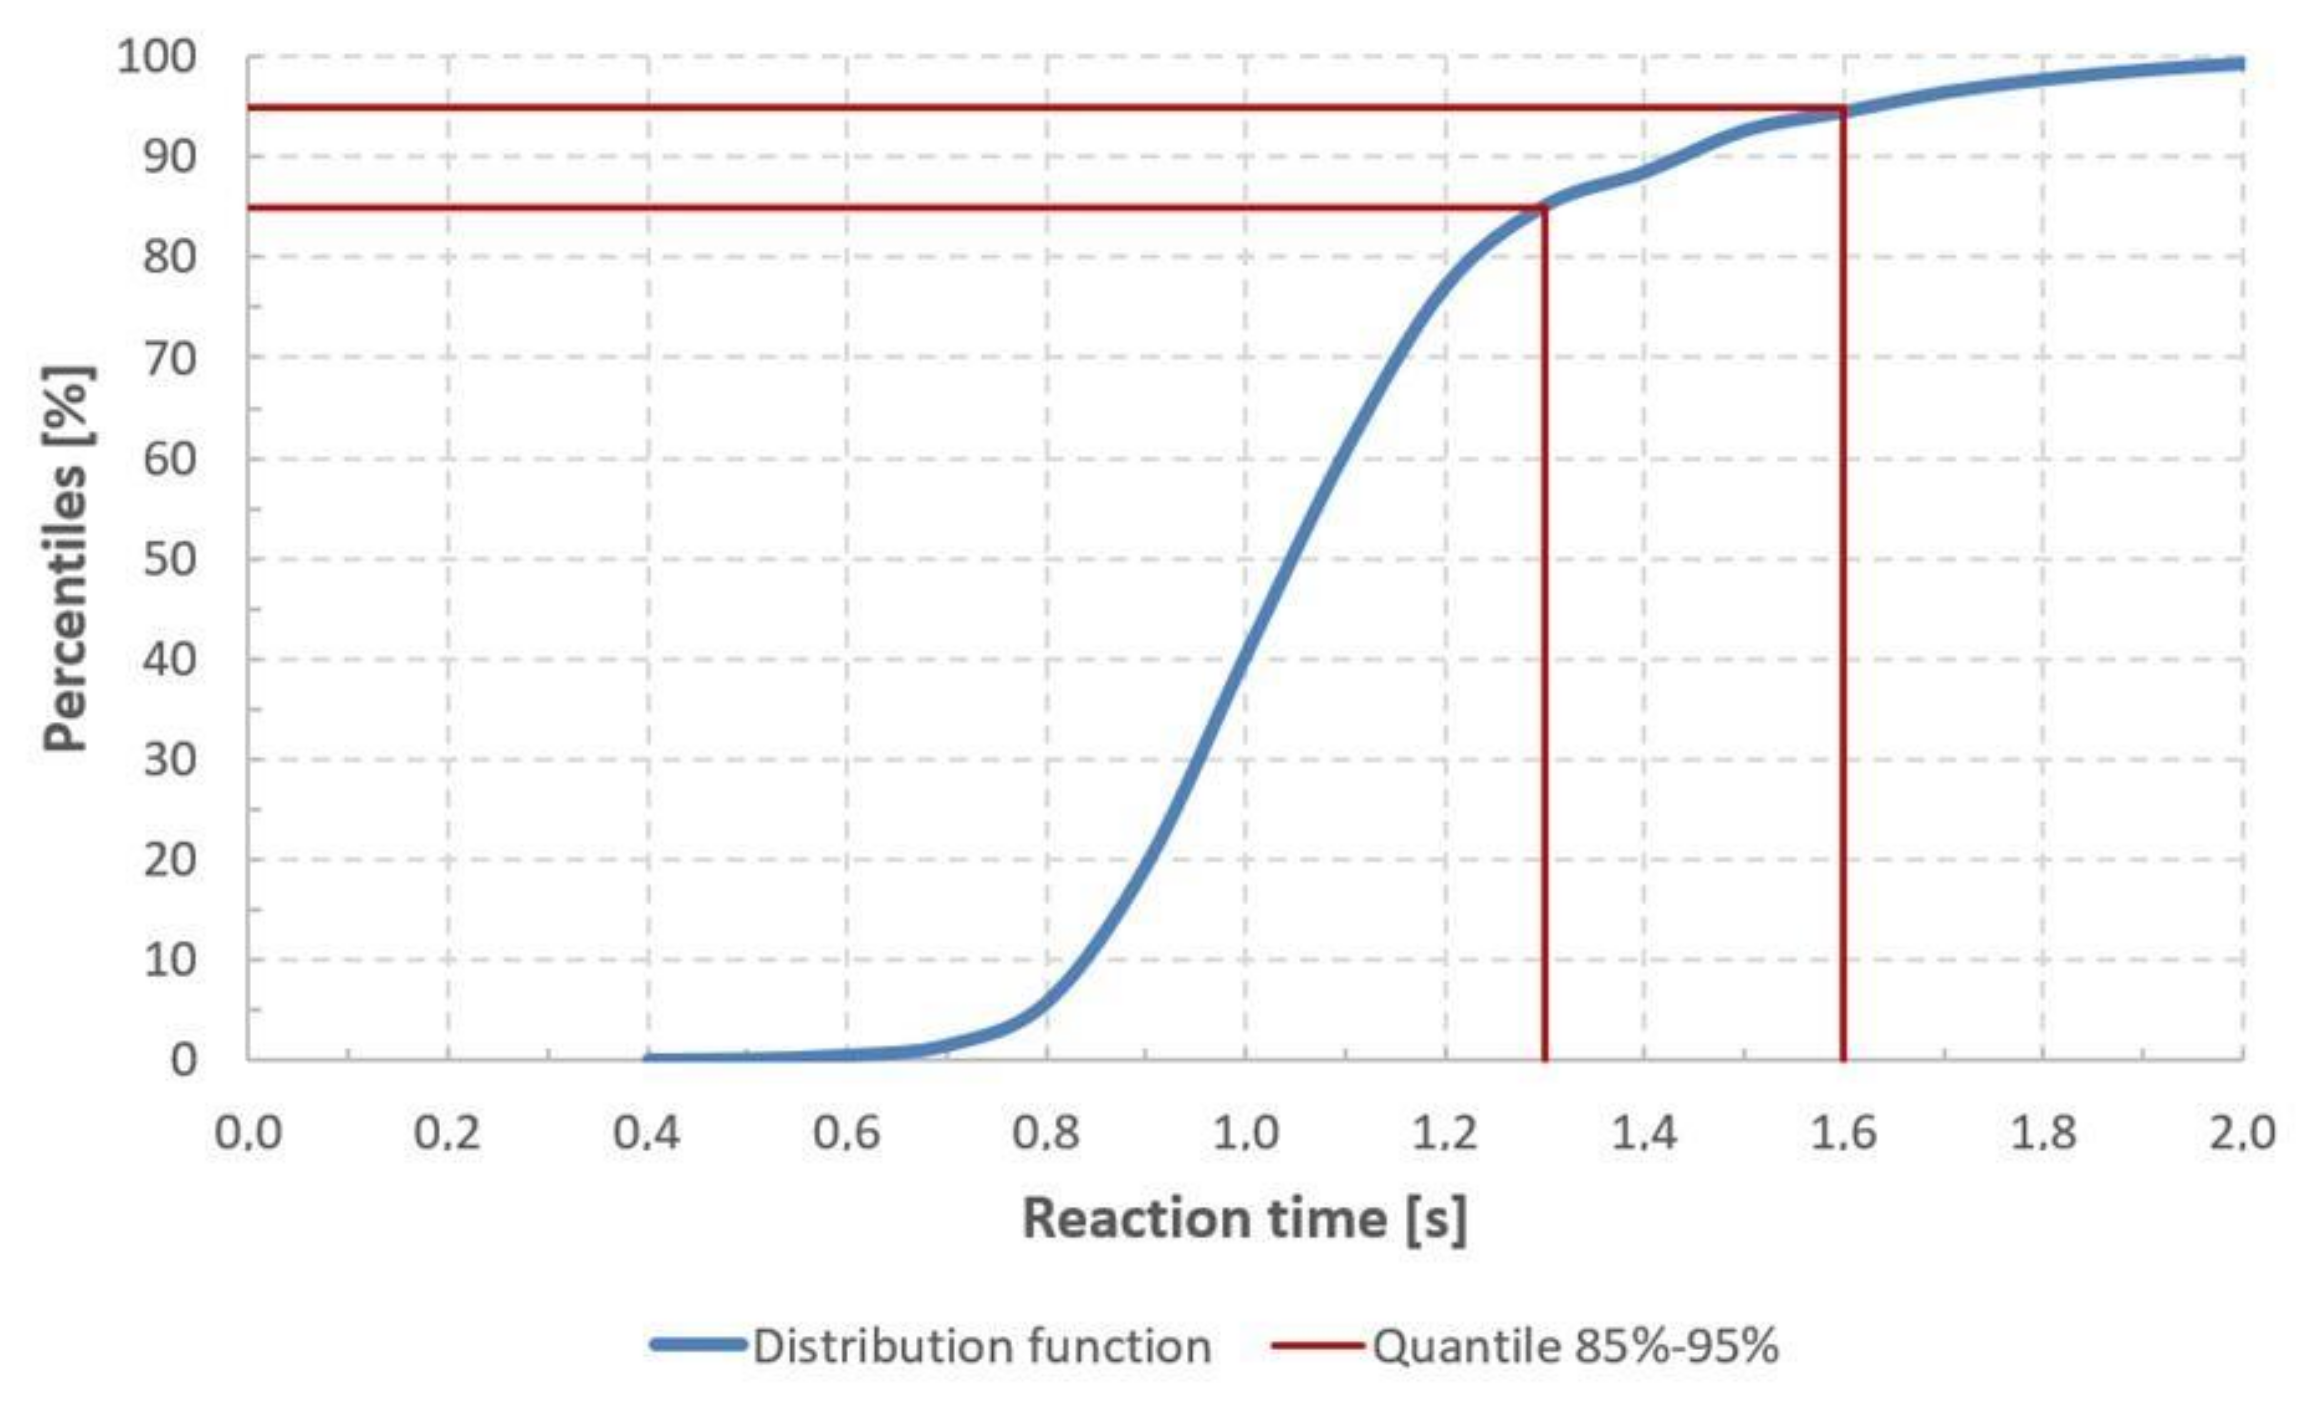
The distribution function of the reaction times at braking shows that 85% ÷ 95% of the studied population’s responses ranged between 1.3 and 1.6 s (Figure 8).
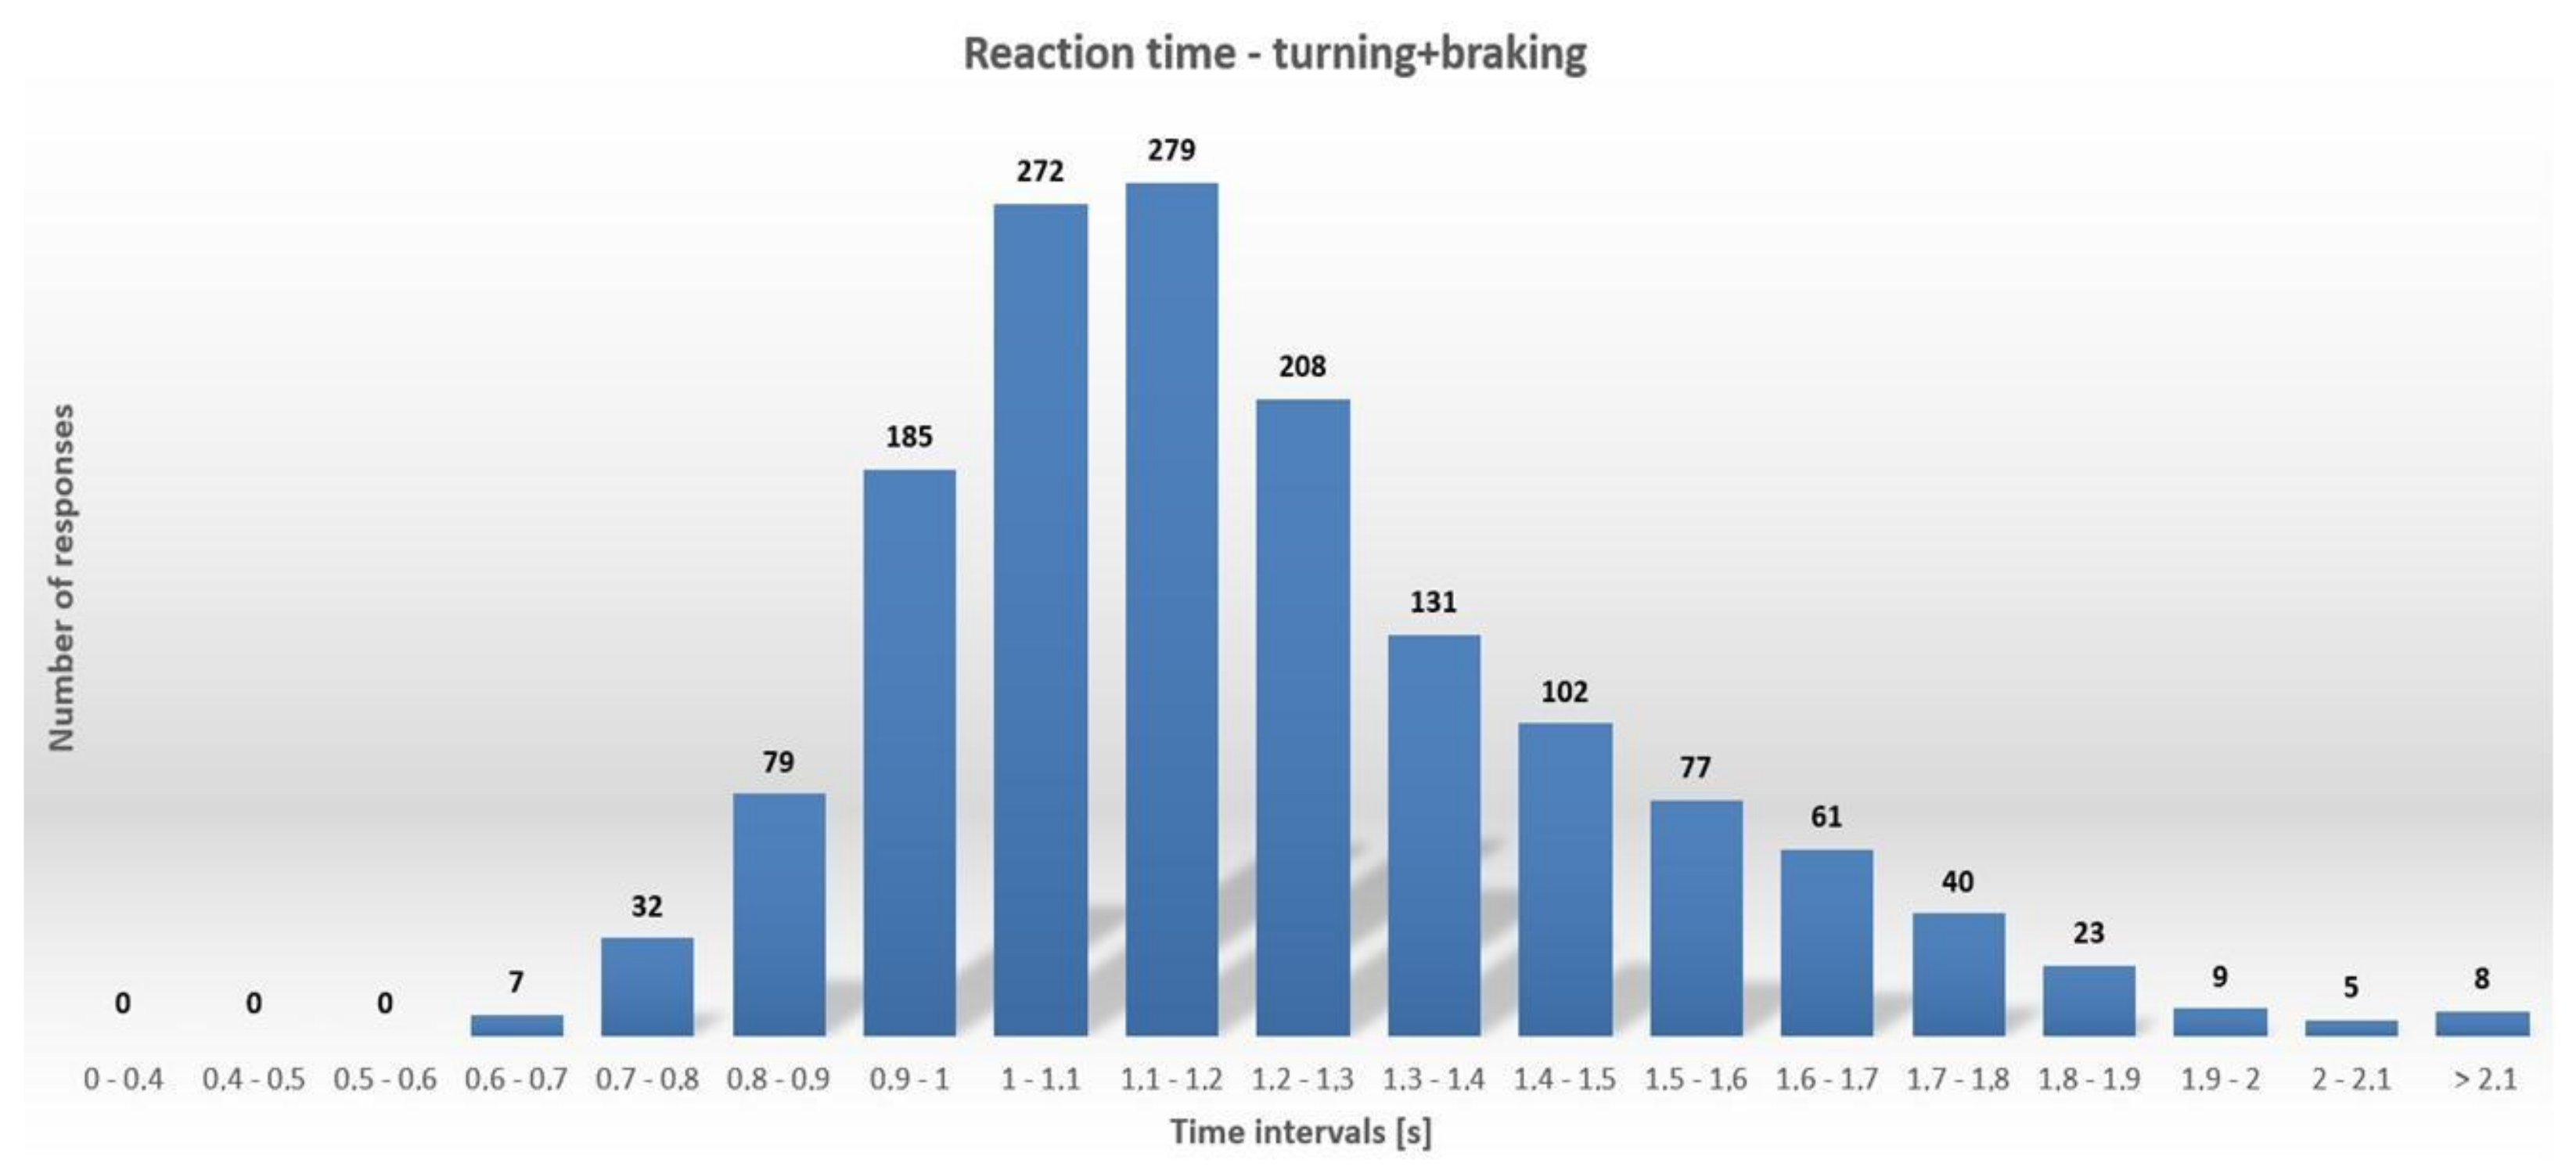
Braking with simultaneous turning of the steering wheel was the most complex maneuver.
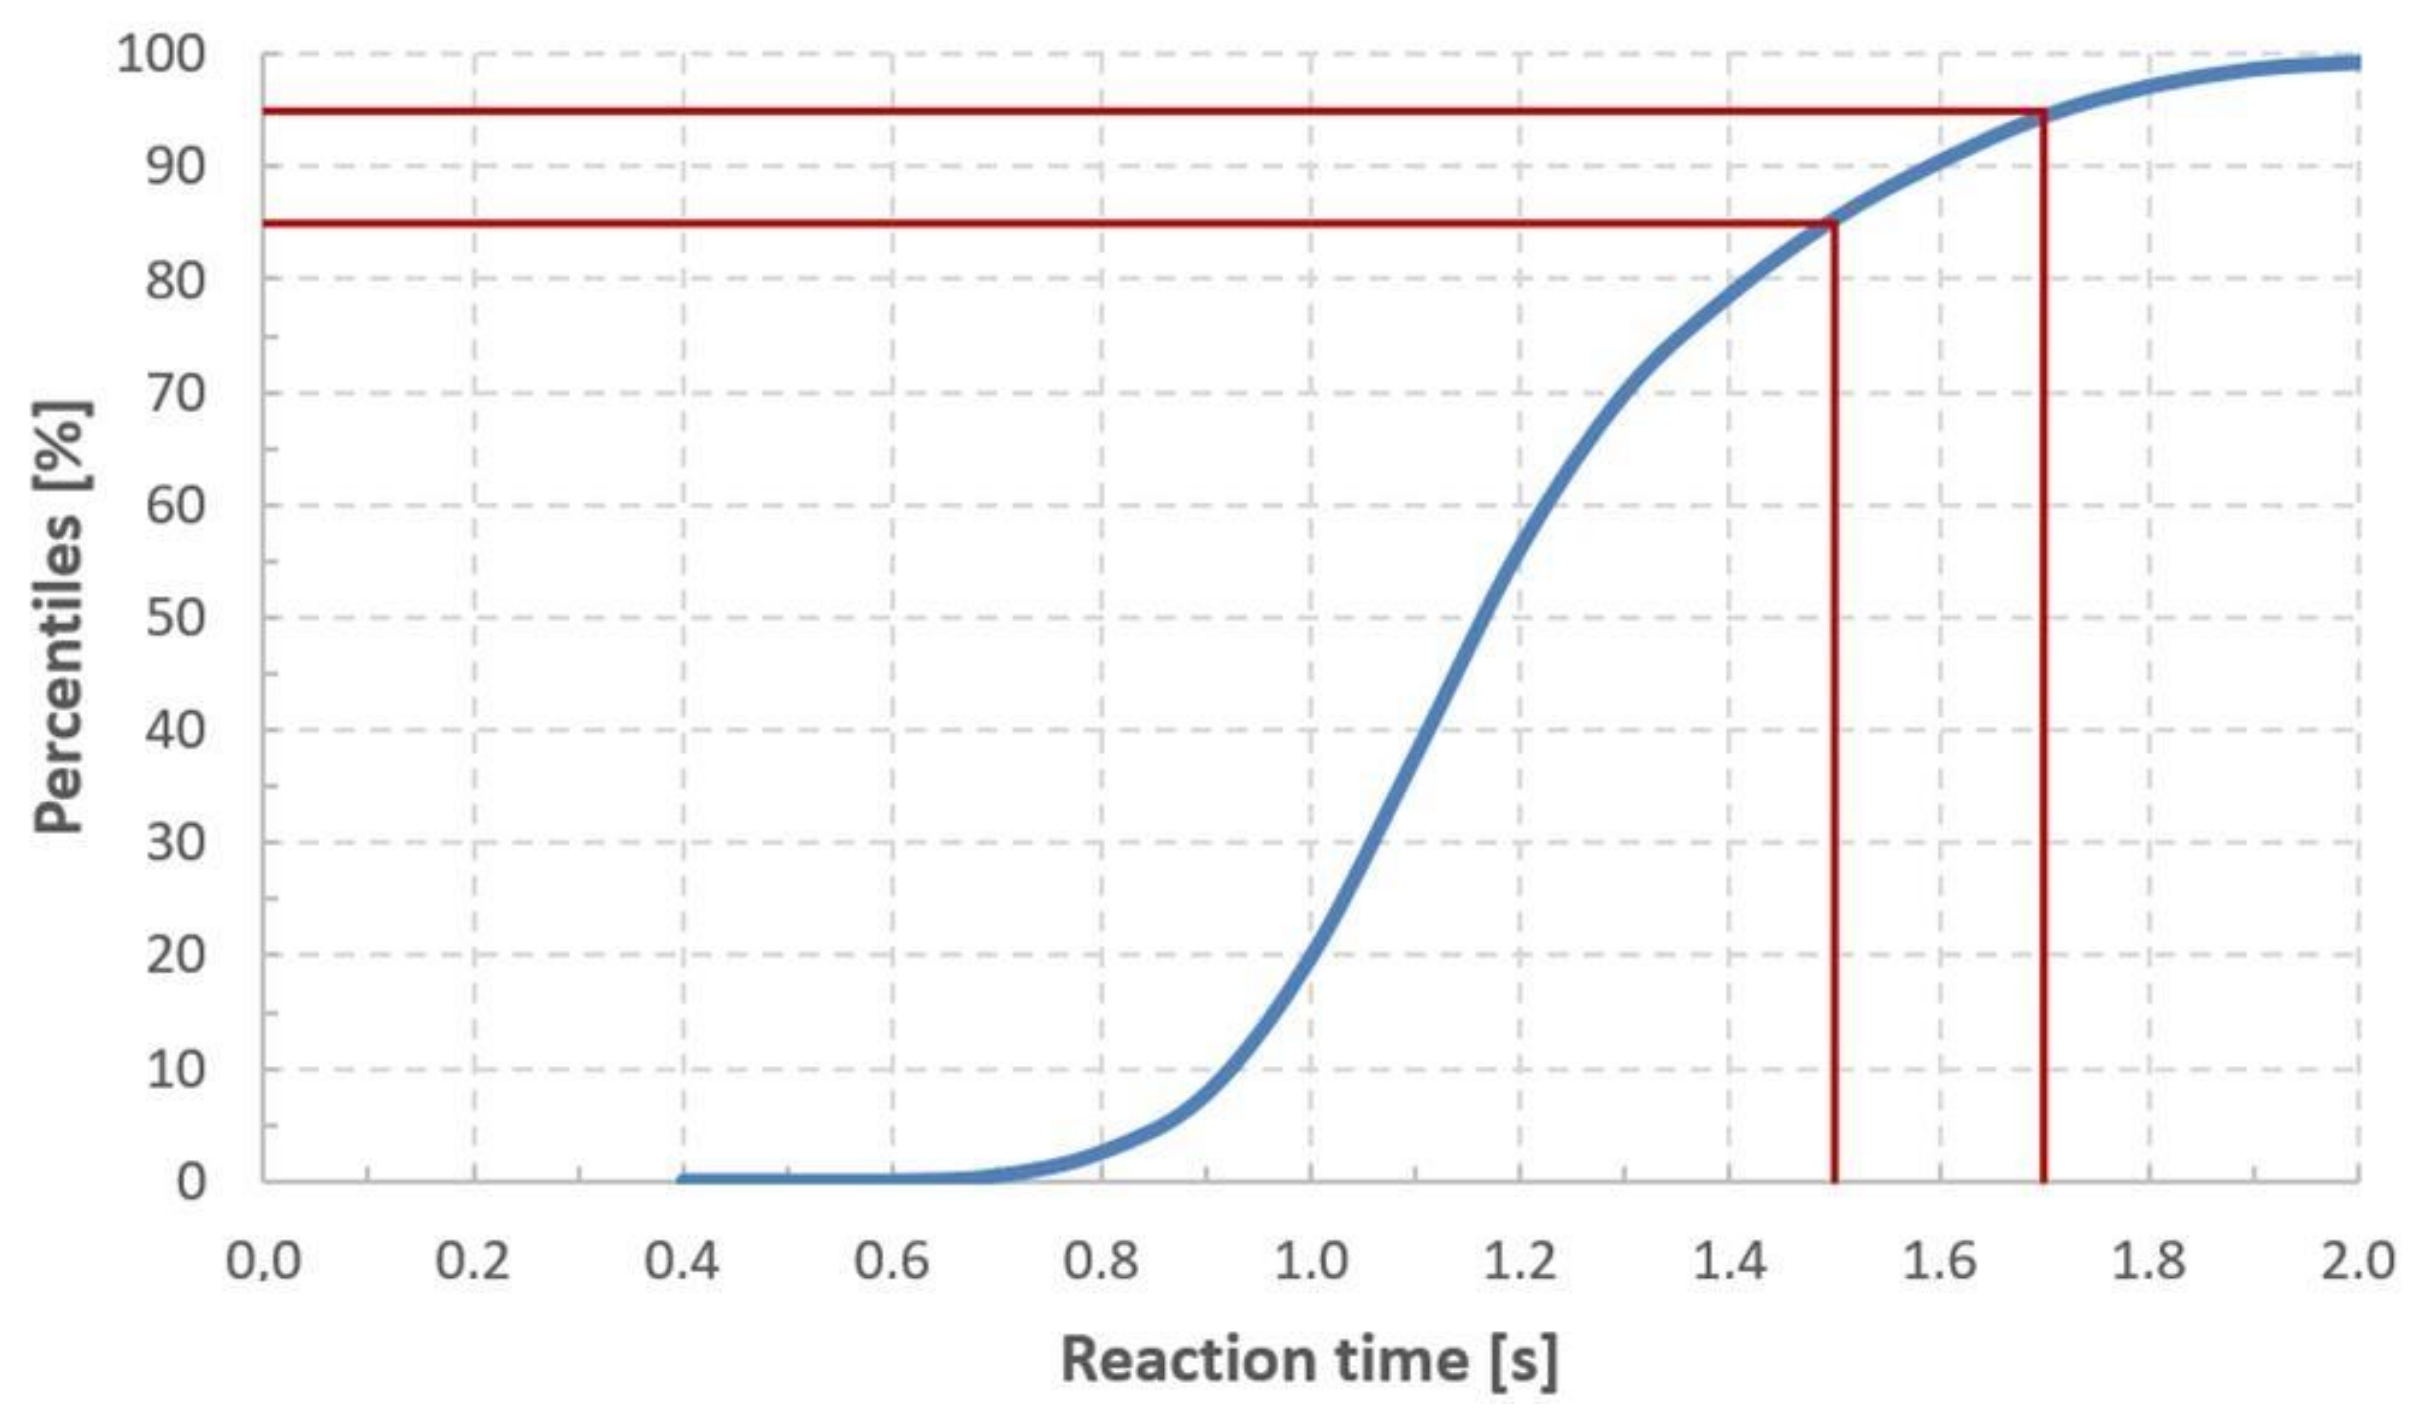
Despite certain independence of the muscular reaction at turning and braking it turns out that the drivers needed most time to make such maneuvers. According to the histogram (Figure 9) the minimum reaction times observed for such a complex maneuver ranged from 0.6 to 0.7 s. The most numerous group of answers ranged from 1.1 to 1.2 s, while the 85% ÷ 95% quantiles amounted to 1.5 ÷ 1.7 s, respectively (Figure 10).
The obtained characteristic results of analyses from all tests are presented in Table 1.
The obtained average values (median) of reaction time are consistent with those presented by the authors in Ref. [8], who analyzed the behavior of drivers in real road conditions. However, their research shows that the reaction time in the case of a turning maneuver is about 0.3 s longer than in the case of a braking maneuver. According to the authors this was due to the fact of checking the availability of the adjacent lanes to make sure the steering maneuver was safe.
In the presented test results, the exact opposite trend was obtained, and the average reaction time in the case of a turning maneuver was shorter by about 0.3 s than the reaction time in the case of a braking maneuver.
This can be explained by the results of the field (road) research conducted by the authors of Ref. [3]. In their research, they included an additional parameter called Time To Collision (TTC). The results of their research may explain the above discrepancies. For low TTC values, when the driver started the maneuver without much thought, the values of the reaction time in the case of a turning maneuver were shorter by about 0.3 s in comparison to the reaction time in the case of a braking maneuver for the same TTC. On the other hand, for longer TTCs, the situation was reversed and the reaction times in the case of a turning maneuver were longer than in the case of a braking maneuver. In the case of our stand, the respondent was to perform the assigned task as quickly as possible, which could be compared with the shortest TTC values. Moreover, as the literature indicates, one of the main components of the total braking reaction time is the time necessary to move the leg from the accelerator to the brake pedal [24]. It is said to amount to ca. 0.1 ÷ 0.3 s. Nearly identical values were obtained at the described test station—Table 1. It can be seen as the difference in the time of turning and braking. Turning the steering wheel shall be approached as a simple reaction because the driver performs the recorded motion instantly in response. In the case of braking, pushing the brake is recorded only after the driver has moved their leg from the accelerator.
The abovementioned part of the study revealed the relevance of the presented test station method for observing phenomena resulting from the different complexities of the expected reactions. The accuracy of the time measurements of 1 ms helps to clearly identify the effects. Based on this, one can conclude that the influence of the vehicle’s interior ergonomics on the driver’s reaction time can also be measured. Moving the equipment to another vehicle enables performing such a test program.
4. Conclusions
The presented method of studying the drivers’ reaction times was developed as a compromise between the repeatability of the results typical of laboratory tests and the reliability of road tests. The test stand was validated by means of conducting tests on the reaction times of drivers performing basic maneuvers, such as turning or braking, and a complex turning maneuver with braking. We examined a group of young drivers who performed the abovementioned maneuvers in response to pictograms displayed on variable content signs located around the real vehicle. During the tests, the drivers were not affected by disruptive stimuli that could have an impact on the reaction time—such research scenarios are planned for later. The obtained reaction time values for the particular maneuvers were presented in the form of histograms and probability density distribution graphs. The charts were supplemented with such characteristic data as the medians, mean values and time intervals in which 85% ÷ 95% of the respondents reacted. The results obtained so far (median of: turning time reaction equal to 0.8 s, braking time reaction equal to 1.0 s and their difference) indicate a correlation with the field methods. This leads to the assumption that despite the fact that some stimuli were modelled in the test station conditions, the obtained results may have a significant cognitive value, especially in the case of tests aimed at the determination of the influence of distracting factors (e.g., weariness, alcohol consumption) on the reaction time of the driver. A high degree of the test station configurability and possibility to introduce variable but controlled test conditions provide an advantage as compared to analogical but hard to execute road tests. The tests confirmed the relevance of the method for the detection and evaluation of the impact of selected factors on the driver’s resultant reaction times. It works both for the evaluation of a statistical population and a single driver’s aptitude. The method is still being improved and provides data for further analyses.
Author Contributions
Conceptualization, T.S.; data curation, K.S.; formal analysis, K.S.; investigation, T.S. and K.S.; methodology, T.S.; software, K.S.; supervision, D.B.; writing—original draft, T.S. and K.S.; writing—review and editing, T.S., K.S. and D.B. All authors have read and agreed to the published version of the manuscript.
Funding
This research received no external funding.
Institutional Review Board Statement
Ethical review and approval were waived for this study since no threat to the health and life of the participants occurred. The participants did not take any medications, drugs or other medical treatments.
Informed Consent Statement
Informed consent was obtained from all subjects involved in the study.
Data Availability Statement
Data sharing not applicable.
Conflicts of Interest
The authors declare no conflict of interest.
References
- Jurecki, R.S.; Stanczyk, T.L. Driver Reaction Time to Lateral Entering Pedestrian in a Simulated Crash Traffic Situation. Transp. Res. Part F 2014, 27, 22–36. [Google Scholar] [CrossRef]
- Dozza, M. What Factors Influence Drivers’ Response Time for Evasive Maneuvers in Real Traffic? Accid. Anal. Prev. 2013, 58, 299–308. [Google Scholar] [CrossRef] [PubMed]
- Meyr, A.J.; Spiess, K.E. Diabetic Driving Studiesd—Part 1: Brake Response Time in Diabetic Drivers with Lower Extremity Neuropathy. J. Foot Ankle Surg. 2017, 56, 568–572. [Google Scholar] [CrossRef] [PubMed]
- Spiess, K.E.; Sansosti, L.E.; Meyr, A.J. Diabetic Driving Studiesd—Part 2: A Comparison of Brake Response Time between Drivers With Diabetes With and Without Lower Extremity Sensorimotor Neuropathy. J. Foot Ankle Surg. 2017, 56, 573–576. [Google Scholar] [CrossRef] [PubMed]
- Sansosti, L.E.; Spiess, K.E.; Meyr, A.J. Diabetic Driving Studiesd—Part 3: A Comparison of Mean Brake Response Time between Neuropathic Diabetic Drivers With and Without Foot Pathology. J. Foot Ankle Surg. 2017, 56, 577–580. [Google Scholar] [CrossRef] [PubMed]
- Yadav, A.K.; Velaga, N.R. Modelling the relationship between different Blood Alcohol Concentrations and reaction time of young and mature drivers. Transp. Res. Part F 2019, 64, 227–245. [Google Scholar] [CrossRef]
- Pawar, N.M.; Velaga, N.R. Modelling the influence of time pressure on reaction time of drivers. Transp. Res. Part F 2020, 72, 1–22. [Google Scholar] [CrossRef]
- Makishita, H.; Matsunaga, K. Differences of drivers’ reaction times according to age and mental workload. Accid. Anal. Prev. 2008, 40, 567–575. [Google Scholar] [CrossRef] [PubMed]
- Chakrabartya, N.; Guptab, K. Analysis of Driver Behaviour and Crash Characteristics during Adverse Weather Conditions. Procedia Soc. Behav. Sci. 2013, 104, 1048–1057. [Google Scholar] [CrossRef] [Green Version]
- Haque, M.M.; Washington, S. A parametric duration model of the reaction times of driversdistracted by mobile phone conversations. Accid. Anal. Prev. 2014, 62, 42–53. [Google Scholar] [CrossRef] [PubMed] [Green Version]
- Hancock, P.A.; Lesch, M.; Simmons, L. The distraction effects of phone use during a crucial driving maneuver. Accid. Anal. Prev. 2003, 35, 501–514. [Google Scholar] [CrossRef] [Green Version]
- Berg, W.P.; Dessecker, D.J. Evidence of unconscious motor adaptation to cognitive and auditory distraction. Adapt. Behav. 2013, 21, 346–355. [Google Scholar] [CrossRef]
- Hendrick, J.L.; Switzer, J.R. Hands-free versus hand-held cell phone conversation on a braking response by young driver. Percept. Mot. Ski. 2007, 105, 514–522. [Google Scholar] [CrossRef] [PubMed]
- Žuraulis, V.; Nagurnas, S.; Pečeliūnas, R.; Pumputis, V.; Skačkauskas, P. The analysis of drivers’ reaction time using cell phone in the case of vehicle stabilization task. Int. J. Occup. Med. Environ. Health 2018, 31, 633–648. [Google Scholar] [CrossRef] [PubMed]
- Pawar, N.M.; Khanuja, R.K.; Choudhary, P.; Velaga, N.R. Modelling braking behaviour and accident probability of drivers under increasing time pressure conditions. Accid. Anal. Prev. 2020, 136, 105401. [Google Scholar] [CrossRef] [PubMed]
- Plainis, S.; Murray, I.J. Reaction times as an index of visual conspicuity when driving at night. Ophthal. Physiol. Opt. 2002, 22, 409–415. [Google Scholar] [CrossRef] [PubMed]
- Rotter, T. Methodology of Psychological Testing of Drivers; Automotive Transport Institute Publisher: Warsaw, Poland, 2003. [Google Scholar]
- Krauss, D. Forensic Aspects of Driver Perception and Response; Lawyers & Judges Publishing Company Inc.: Tucson, AZ, USA, 2015. [Google Scholar]
- Yanqun, Y.; Xinyi, Z.; Sudan, J.; Yifan, X. Drivers’ Reaction Time towards Red-Light Timing at Urban Intersections. Procedia Soc. Behav. Sci. 2013, 96, 2506–2510. [Google Scholar] [CrossRef] [Green Version]
- Stańczyk, T.L.; Jurecki, R. Precision in estimation time of driver reaction in car accident reconstruction. In Proceedings of the XVI EVU Annual Meeting (European Association for Accident Research and Accident Analysis), Cracow, Poland; 2007; pp. 325–333. [Google Scholar]
- Hugemann, W. Driver Reaction Times in Road Traffic. In Proceedings of the XI EVU Annual Meeting, Portorož, Slovenija, 6–7 September 2002. [Google Scholar]
- Green, M. “How Long Does It Take to Stop?” Methodological Analysis of Driver Perception-Brake Times. Transp. Hum. Factors 2000, 2, 195–216. [Google Scholar] [CrossRef]
- Regulation of the Minister of Health of 8 July 2014 on psychological tests of persons applying for driving licenses, drivers and persons performing work as a driver. Journal of Law, 16 July 2014; item 937.
- Krochmann, J. Reaktionszeiten von Kraftfahrern; Institut für Lichttechnik der Technische Universität Berlin: Berlin, Germany, 1979. [Google Scholar]
Figure 1.
Signs with variable content and the pictograms which can be displayed.

Figure 2.
Examples of light board arrangements around the vehicle: (a) diagram, (b) view of a real test station.
Figure 2.
Examples of light board arrangements around the vehicle: (a) diagram, (b) view of a real test station.

Figure 3.
View of the control application screen.

Figure 4.
Result of a single driver’s test, including the distribution of intervals between the stimuli and errors marked.
Figure 4.
Result of a single driver’s test, including the distribution of intervals between the stimuli and errors marked.

Figure 5.
Histogram presenting the number of responses at turning.

Figure 6.
Distribution function of the reaction time distribution at turning.

Figure 7.
Histogram presenting the number of responses to a braking signal.

Figure 8.
Distribution function of reaction time distribution at braking.

Figure 9.
Histogram presenting the number of responses to a signal of braking and turning simultaneously.
Figure 9.
Histogram presenting the number of responses to a signal of braking and turning simultaneously.

Figure 10.
Distribution function of the reaction time distribution at braking and turning simultaneously.
Figure 10.
Distribution function of the reaction time distribution at braking and turning simultaneously.


Table 1.
Comparisons of different reaction times.
| Kind of Reaction | Mean | Median | Quantile 85% ÷ 95% |
|---|---|---|---|
| Turning | 0.81 s | 0.75 | 1.0 ÷ 1.4 s |
| Braking | 1.09 s | 1.04 | 1.3 ÷ 1.6 s |
| Braking and turning | 1.21 s | 1.16 | 1.5 ÷ 1.7 s |
Publisher’s Note: MDPI stays neutral with regard to jurisdictional claims in published maps and institutional affiliations. |
© 2021 by the authors. Licensee MDPI, Basel, Switzerland. This article is an open access article distributed under the terms and conditions of the Creative Commons Attribution (CC BY) license (http://creativecommons.org/licenses/by/4.0/).
Share and Cite
MDPI and ACS Style
Szydłowski, T.; Surmiński, K.; Batory, D. Drivers’ Psychomotor Reaction Times Tested with a Test Station Method. Appl. Sci. 2021, 11, 2431. https://0-doi-org.brum.beds.ac.uk/10.3390/app11052431
AMA Style
Szydłowski T, Surmiński K, Batory D. Drivers’ Psychomotor Reaction Times Tested with a Test Station Method. Applied Sciences. 2021; 11(5):2431. https://0-doi-org.brum.beds.ac.uk/10.3390/app11052431
Chicago/Turabian StyleSzydłowski, Tomasz, Krzysztof Surmiński, and Damian Batory. 2021. "Drivers’ Psychomotor Reaction Times Tested with a Test Station Method" Applied Sciences 11, no. 5: 2431. https://0-doi-org.brum.beds.ac.uk/10.3390/app11052431
Note that from the first issue of 2016, this journal uses article numbers instead of page numbers. See further details here.