Article

Effects of Accelerated Carbonation Testing and by-Product Allocation on the CO2-Sequestration-to-Emission Ratios of Fly Ash-Based Binder Systems

by
Philip Van den Heede
and
Nele De Belie
*
Magnel-Vandepitte Laboratory for Structural Engineering and Building Materials, Ghent University (UGent), B-9052 Ghent, Belgium
*
Author to whom correspondence should be addressed.
Submission received: 27 February 2021 / Revised: 14 March 2021 / Accepted: 19 March 2021 / Published: 19 March 2021
(This article belongs to the Special Issue Concrete and Mortar with Non-conventional Materials)

Abstract

:
Carbonation of cementitious binders implies gradual capture of CO2 and significant compensation for the abundant cement-related CO2 emissions. Therefore, one should always look at the CO2-sequestration-to-emission ratio (CO2SP/EM). Here, this was done for High-Volume Fly Ash (HVFA) mortar (versus two commercial cement mortars). Regarding their CO2 sequestration potential, effects of accelerated testing (at 1–10% CO2) on as such estimated natural carbonation degrees and rates were studied. Production related CO2 emissions were evaluated using life cycle assessment with no/economic allocation for fly ash. Natural carbonation rates estimated from accelerated tests significantly underestimate actual natural carbonation rates (with 29–59% for HVFA mortar) while corresponding carbonation degrees are significantly overestimated (67–74% as opposed to the actual 58% for HVFA mortar). It is advised to stick with the more time-consuming natural tests. Even then, CO2SP/EM values can vary considerably depending on whether economic allocation coefficients (Ce) were considered. This approach imposes significant portions of the CO2 emissions of coal-fired electricity production onto fly ash originating from Germany, China, UK, US and Canada. Ce values of ≥0.50% lower the potential CO2SP/EM values up to a point that it seems no longer environmentally worthwhile to aim at high-volume replacement of Portland cement/clinker by fly ash.

1. Introduction

Recent reports indicate that CO2 emissions should be reduced as much as needed to keep global temperature increase relative to pre-industrial levels below 1.5 °C by 2100. This is required for Earth to remain livable. Therefore, global net CO2 emissions need to decline by about 45% from 2010 levels, reaching net zero around 2050 [1]. The cement industry, accountable for no less than 8% of the global anthropogenic CO2 emissions [2], is thus being encouraged strongly to cut down on its carbon footprint. This can be done by shifting more to binders with considerable portions of carbon-intensive Portland clinker replaced by supplementary cementitious materials (SCMs). On the one hand, this will often result in concrete that is more susceptible to carbonation-induced corrosion of embedded reinforcing steel. On the other hand, the reduced CO2 buffering capacity of these binders may diminish the considerable CO2 sequestration potential [3]. The latter property covers the CO2 uptake that inevitably occurs during the use and end-of-life phase of cement-bound building materials and the structures made thereof. According to Xi et al. [4], the estimated global carbon uptake between 1930 and 2013 through cement carbonation during service life and after demolition and secondary use of concrete waste represents a large and growing net sink of CO2, growing from 0.10 GtCarbon yr−1 in 1998 to 0.25 GtCarbon yr−1 in 2013. Thus, besides focusing on the CO2 emissions in the production stage of cement-bound materials, also their CO2 sequestration potential should be addressed in order to adequately evaluate their sustainability. A balance should be sought that minimizes production related CO2 emissions and maximizes CO2 uptake, yet without compromising the service life of concrete structures. The favorability of this balance could be assessed by calculating CO2 sequestration-to-emission ratios for binder systems with high SCM contents replacing the Portland clinker/cement and comparing these with those of traditional, more commonly used binders. This was one of the main goals of this study, in particular for a High-Volume Fly Ash (HVFA) mortar with 50% of Portland cement replaced by pozzolanic fly ash originating from coal-fired electricity production.
From the viewpoint of production, HVFA mortar counts as a potentially ‘green’ material since the Portland cement responsible for a carbon footprint of almost 1 kg/kg [5] is reduced by half [6]. Moreover, an industrial by-product from another industry is given a useful destination implying less mere landfilling of fly ash and less exploitation of virgin resources for producing Portland cement. Quantitative assessment in that regard can be achieved by means of environmental impact calculations in Life Cycle Assessment (LCA) software. As will be seen in this study, the outcome of such calculations can be seriously affected by the considered product status for the fly ash and the related fair assignment of impacts related to the main production process, i.e., coal-fired electricity production, by means of allocation [5,6,7,8,9,10].
Beyond the production stage, the greenness of the HVFA binder will mainly depend on the carbonation resistance in steel reinforced concrete applications. For non-steel reinforced use, the focus of this paper, the key sustainability factor is the achievable carbonation extent in the ‘beyond-production’ stage to assess the portion of production related CO2 emissions that could potentially be recuperated through carbonation-induced CO2 sequestration. This requires a thorough understanding of the material’s carbonation behavior under its expected natural exposure conditions. However, since natural carbonation is a process that occurs slowly, one often tends to shift to accelerated laboratory testing. This then implies exposing the binder system to elevated CO2 levels. As already pointed out in earlier work by the authors, one should be careful when using results from accelerated carbonation experiments to predict natural carbonation rates [11,12]. Excessive production of the H2O reactant during carbonation at highly elevated CO2 levels (i.e., 10% CO2) may have a pore blocking effect hindering further carbonation [13,14]. Even after carbonation at only slightly elevated CO2 levels lower than the 3% maximum threshold specified by Sisomphon and Franke [15], adequate conversion to reliable natural carbonation rates is often questionable. Similar statements probably hold true when studying achievable natural carbonation degrees by a particular binder system. Therefore, they require further study when evaluating the CO2 sequestration potential of the HVFA mortar under investigation. Note that the earlier expressed concerns related to carbonation testing at highly elevated CO2 levels mainly require attention when the aim is to relate accelerated carbonation data to natural carbonation behavior. Intentional accelerated carbonation to produce innovative non-traditional CO2 hardened binders or to induce (mechanical) performance enhancement in these binders cf. [16,17,18] is seen as non-problematic.
In this paper, production-related global warming potential calculations were performed in the renowned LCA software SimaPro for HVFA mortar. In order to have a point of reference, the same was done for mortars consisting of commercially available fly ash-based composite cement and a traditional Portland cement. Thorough attention went to the effects of different allocation approaches and related regional differences to assign impacts to the fly ash. Furthermore, natural and accelerated carbonation experiments were executed to study the effects of accelerated testing on the estimation of natural carbonation rates and degrees for quantification of the actual CO2 sequestration potentials of the mortar mix designs and their related CO2-sequestration-to-emission ratios (CO2SP/EM) for overall sustainability assessment.

2. Materials and Methods

2.1. Binder Material Characteristics and Mix Proportioning

In a first research stage, natural and accelerated carbonation experiments were performed on a potentially ‘green’, yet carbonation sensitive, HVFA mortar with a 50% replacement of traditional Portland cement CEM I 52.5 N from Holcim by pozzolanic class F fly ash originating from a coal fired power plant in Germany. The chemical and mineralogical composition and basic physical properties (Blaine fineness, 45 µm fineness, density, 2-day and 28-day compressive strength requirements) of this cement are shown in Table 1. Same goes for the fly ash (except for the strength requirements).
Key properties in relation to the CO2 sequestration potential of the HVFA mortar made with this cement and fly ash are its CaO and CO2 content as will be discussed further on in Section 2.4 and Section 2.5.
A batch of the studied HVFA mortar consisted of 1350 g of sand, 225 g of CEM I 52.5 N, 225 g of fly ash and 247.5 g of water. Sand and total binder content were in agreement with the specifications for a standard mortar as mentioned in NBN EN 196-1 [19]. The water content was higher than the normally proposed 225 g per batch in order to achieve a water-to-binder ratio of 0.55 which is common for exposure class XC3 (exposure to carbonation with moderate humidity, e.g., external environment, sheltered from rain) as defined in NBN EN 206 [20]. Note that the 50% fly ash content of the binder fraction implies a low carbonatable material content for the HVFA mortar and thus a low buffering capacity for penetrating CO2 and a fast inward movement of the carbonation front cf. [21]. This means that the binder proportioning of this potentially ‘green’ HVFA mortar may be less suitable for steel reinforced applications and also less ideal for maximizing its CO2 sequestration potential. Obviously, this issue of a mixture merely being ‘green’ from a production point of view without necessarily being it performance-wise will be the subject of further discussion in Section 3. Table 2 gives the mix design of this HVFA mortar per m3 which is a more useful format for further CO2 sequestration and production related CO2 emission calculations. A typical air content of 2% was assumed for each mix design.
In a second research step, a more common fly ash-based mortar mix was made to undergo a similar experimental test program. Its binder portion consisted of a commercially available composite cement CEM II/B-V 42.5 N. According to NBN EN 197-1 [22], the fly ash content of this cement type ranges between 21% and 35%, leaving a Portland clinker content of only 79–65%. Chemical and mineralogical composition as well as basic physical properties of this cement have been summarized in Table 1. Just like for the HVFA mortar mix, the mix proportion per batch amounted to 1350 g sand, 450 g cement and 247.5 g water. The corresponding mix design per m3 (while again assuming a 2% air content) has been given in Table 2. A Portland cement based equivalent consisting of CEM I 42.5 N was made and tested in parallel as reference. Characterization of the CEM I 42.5 N cement and the mix proportioning of the reference mix made with it have been included in Table 1 and Table 2 as well. Note that the CEM II/B-V 42.5 N mix and the CEM I 42.5 N mix were part of an ongoing interlaboratory test campaign on carbonation within the framework of RILEM TC 281-CCC. Given their similar general mix proportions per batch and the fact that they incorporate more commonly used commercial binders, it seemed worthwhile to also assess their CO2SP/EM.

2.2. Sample Conditioning Prior and during Natural and Accelerated Carbonation

For the test campaign on HVFA mortar, 160 × 20 × 40 mm3 mortar prisms were cast. Sample preconditioning consisted of 1 day of in-mold optimal curing at 20 °C and 95% relative humidity (RH) while sealed with plastic film, 6 days of the same optimal curing conditions after demolding, 4 days of drying at 40 °C and 3 days of storage at 20 °C and 60% RH. The latter exposure conditions correspond with the temperature and RH prescribed during subsequent natural/accelerated carbonation tests. This way of sample preconditioning was similar to the one used in earlier carbonation related research by the authors [12]. After preconditioning the mortar prisms were equally divided in three groups for carbonation at 0.04%, 1% and 10% CO2.
For the CEM II/B-V 42.5 N mix and reference CEM I 42.5 N mix, regular 160 × 40 × 40 mm3 mortar prisms were cast. Sample preconditioning also lasted for 14 days, yet differed somewhat given the test protocols prescribed by RILEM TC 281-CCC. After 24 h of in-mold optimal curing at 20 °C and 95% RH while sealed with plastic film, the demolded samples were kept completely wrapped in plastic film at 20 °C and 60% RH for the remainder of the preconditioning period (13 days). Only two carbonation exposure conditions were considered, i.e., natural carbonation at 0.04% CO2, 20 °C and 60% RH, as well as slightly accelerated carbonation at 1% CO2, 20 °C and 60% RH. The findings for HVFA mortar led to the decision not to consider highly accelerated carbonation at 10% CO2 any further (see Section 3.1).

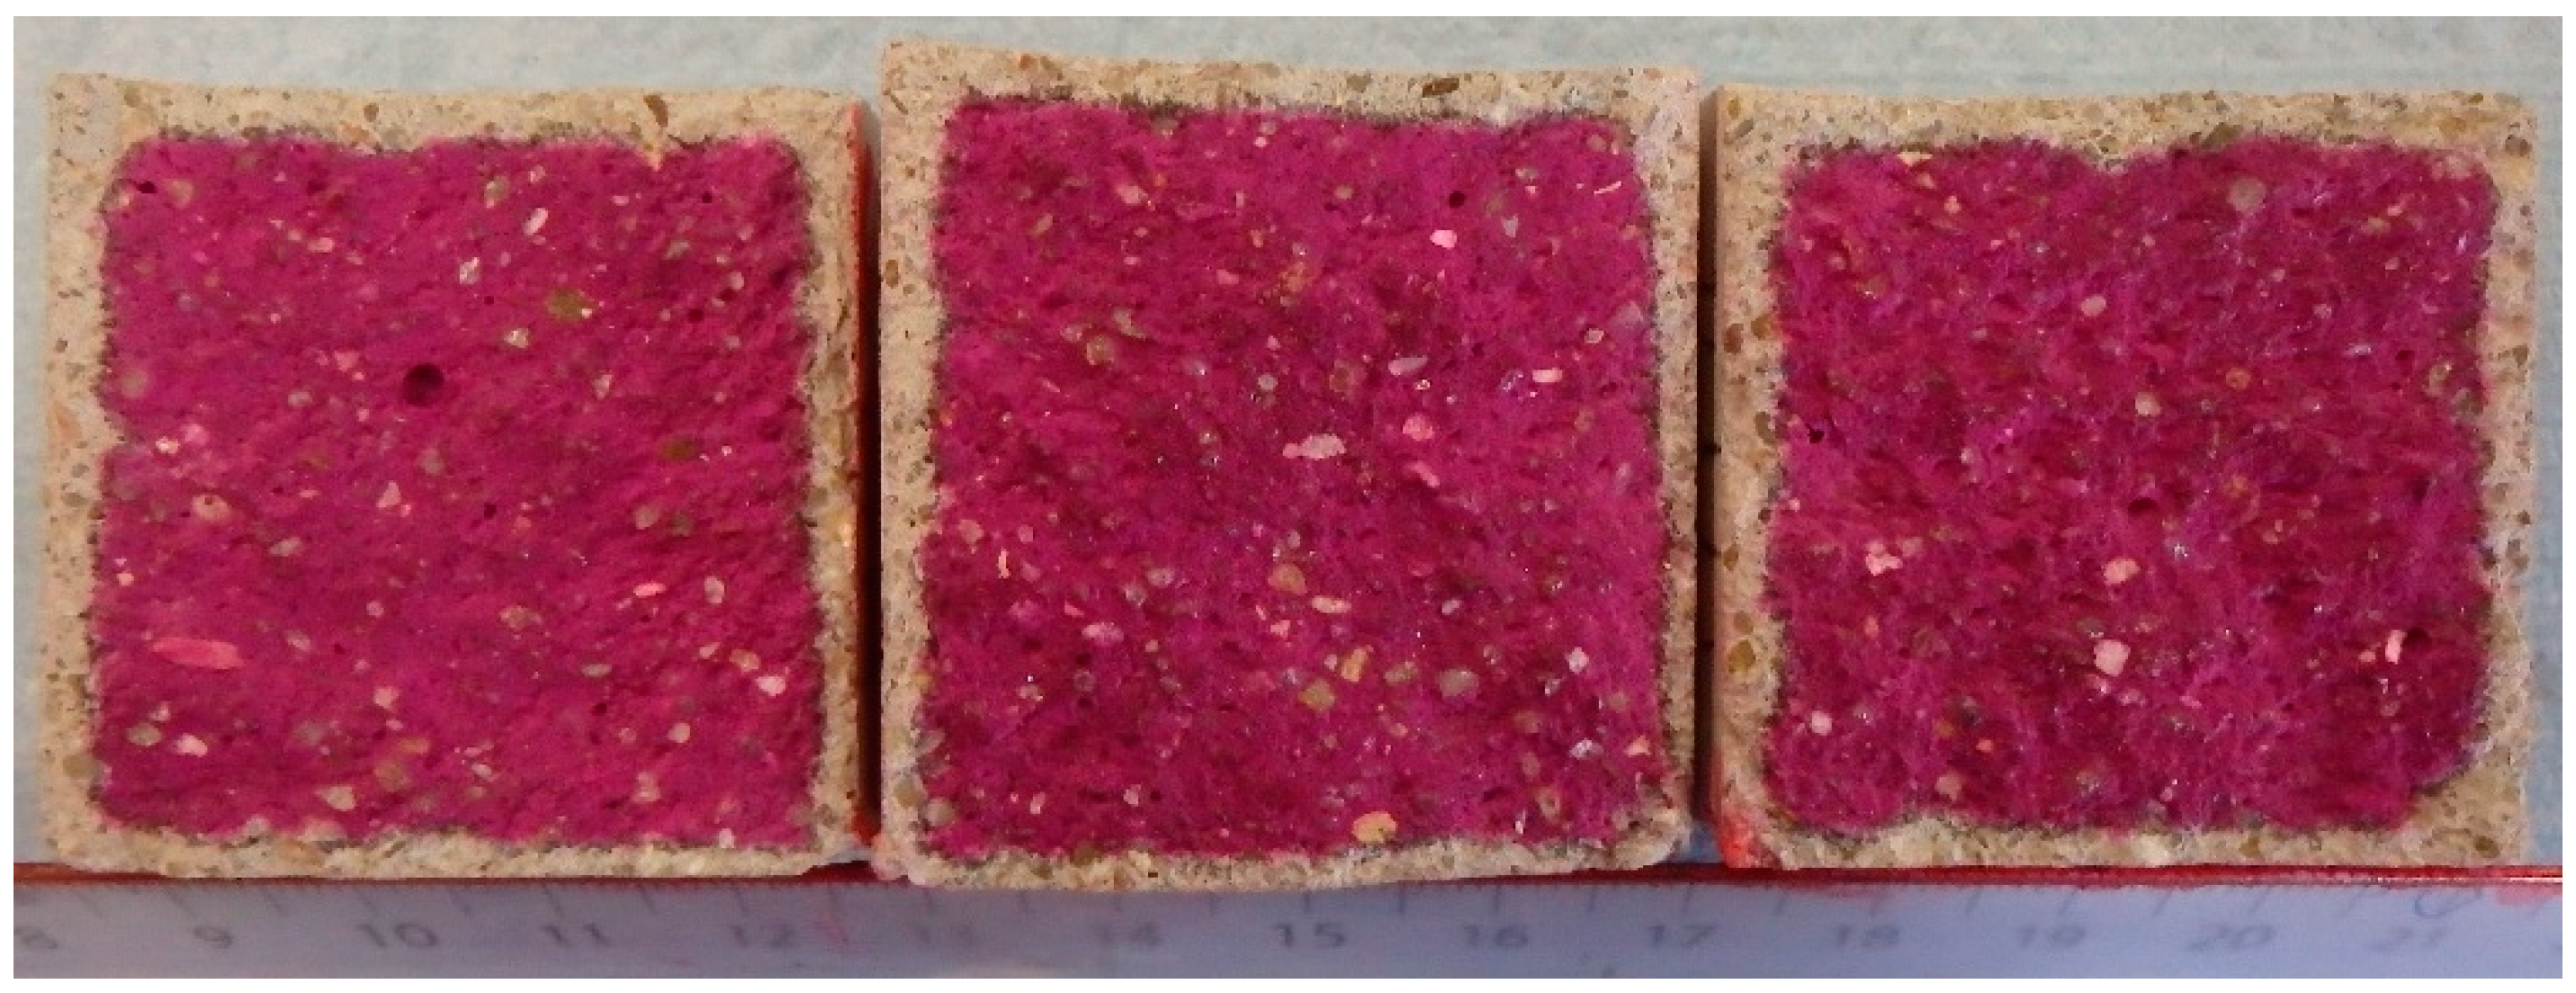
2.3. Colorimetric Carbonation Assessment

The HVFA mortar prisms were not used for intermittent assessment of the carbonation front using phenolphthalein color indicator to determine the carbonation rate by plotting the as such observed carbonation front as a function of the square-root of the exposure time. This was already done in earlier research by the authors [12]. For each of the three considered exposure conditions (natural vs. slightly accelerated vs. highly accelerated carbonation) the obtained carbonation rates are summarized in Section 3.1. The ones representing the accelerated exposure conditions were also converted to a value that is to be expected under natural exposure by means of the conversion formula proposed by Sisomphon and Franke [15] (Equation (1)).
A acc A nat = c acc c nat
with Aacc, the measured accelerated carbonation rate (in mm/√weeks), Anat, the estimated natural carbonation rate (in mm/√weeks), cacc, the applied CO2 concentration during accelerated carbonation testing (1% or 10% CO2), cnat, the natural CO2 concentration (0.04% CO2).
The 160 × 20 × 40 mm3 HVFA mortar prisms were mainly used for assessment of the carbonation-induced calcium carbonate content by means of thermogravimetric analysis (TGA) once it was sure that the fully carbonated state was reached for all three exposure conditions. Logically, the prisms stored at 10% CO2 reached the, with phenolphthalein assessed, fully carbonated state much earlier than those stored at 1% CO2 and 0.04% CO2. Anyhow, a 17 weeks exposure period was considered in that perspective. At that moment, slices with a thickness of 3 mm were cut from the fully carbonated prisms. In accordance with Durdziński et al. [23], these slices were immersed in isopropanol for 7 days to stop the hydration by solvent exchange whereupon they were vacuum dried for another 7 days to remove the isopropanol. At this point, the slices were ready to be crushed and sieved for TGA on powdery samples of each carbonation test series in triplicate (Section 2.4).
After 0, 2, 4, 8, 13 weeks of slightly accelerated carbonation at 1% CO2, a more or less 25 mm thick slice was split from three prisms of the CEM II/B-V 42.5 N mix and the CEM I 42.5 N mix. In total, 1% phenolphthalein solution was sprayed onto the fractured surfaces to visualize the pH responsive color change boundary which tends to correspond quite well with the carbonation front (colorless: carbonated; purple: not carbonated; see Appendix A, Figure A1). The square-root-time relation for carbonation was determined and carbonation rates at 1% CO2 (in mm/√weeks), were deduced from it. It was assumed that the carbonation depth after 0 weeks of exposure must equal 0 mm. A similar testing approach was adopted for natural carbonation. Only difference were the considered time intervals for colorimetric carbonation assessment, i.e., 0, 6, 8, 13, 20 and 26 weeks. Just like for the HVFA mortar related results for accelerated carbonation, the ones for the CEM II/B-V 42.5 N mix and the CEM I 42.5 N mix were converted to estimated natural values using Equation (1). Note that for both carbonation conditions, exposure was continued for long after 13 weeks in case of slightly accelerated carbonation or 26 weeks in case of natural carbonation. Final sampling for colorimetric carbonation assessment and subsequent TGA analysis on samples taken from the carbonated zone was done after a total exposure period of 44 weeks. At that moment, none of the fractured surfaces was fully carbonated yet, so slices of the carbonated zone had to be cut from the pieces of prism. These slices were then treated in a similar way cf. Durdziński et al. [23] for further TGA analysis (see Section 2.4).

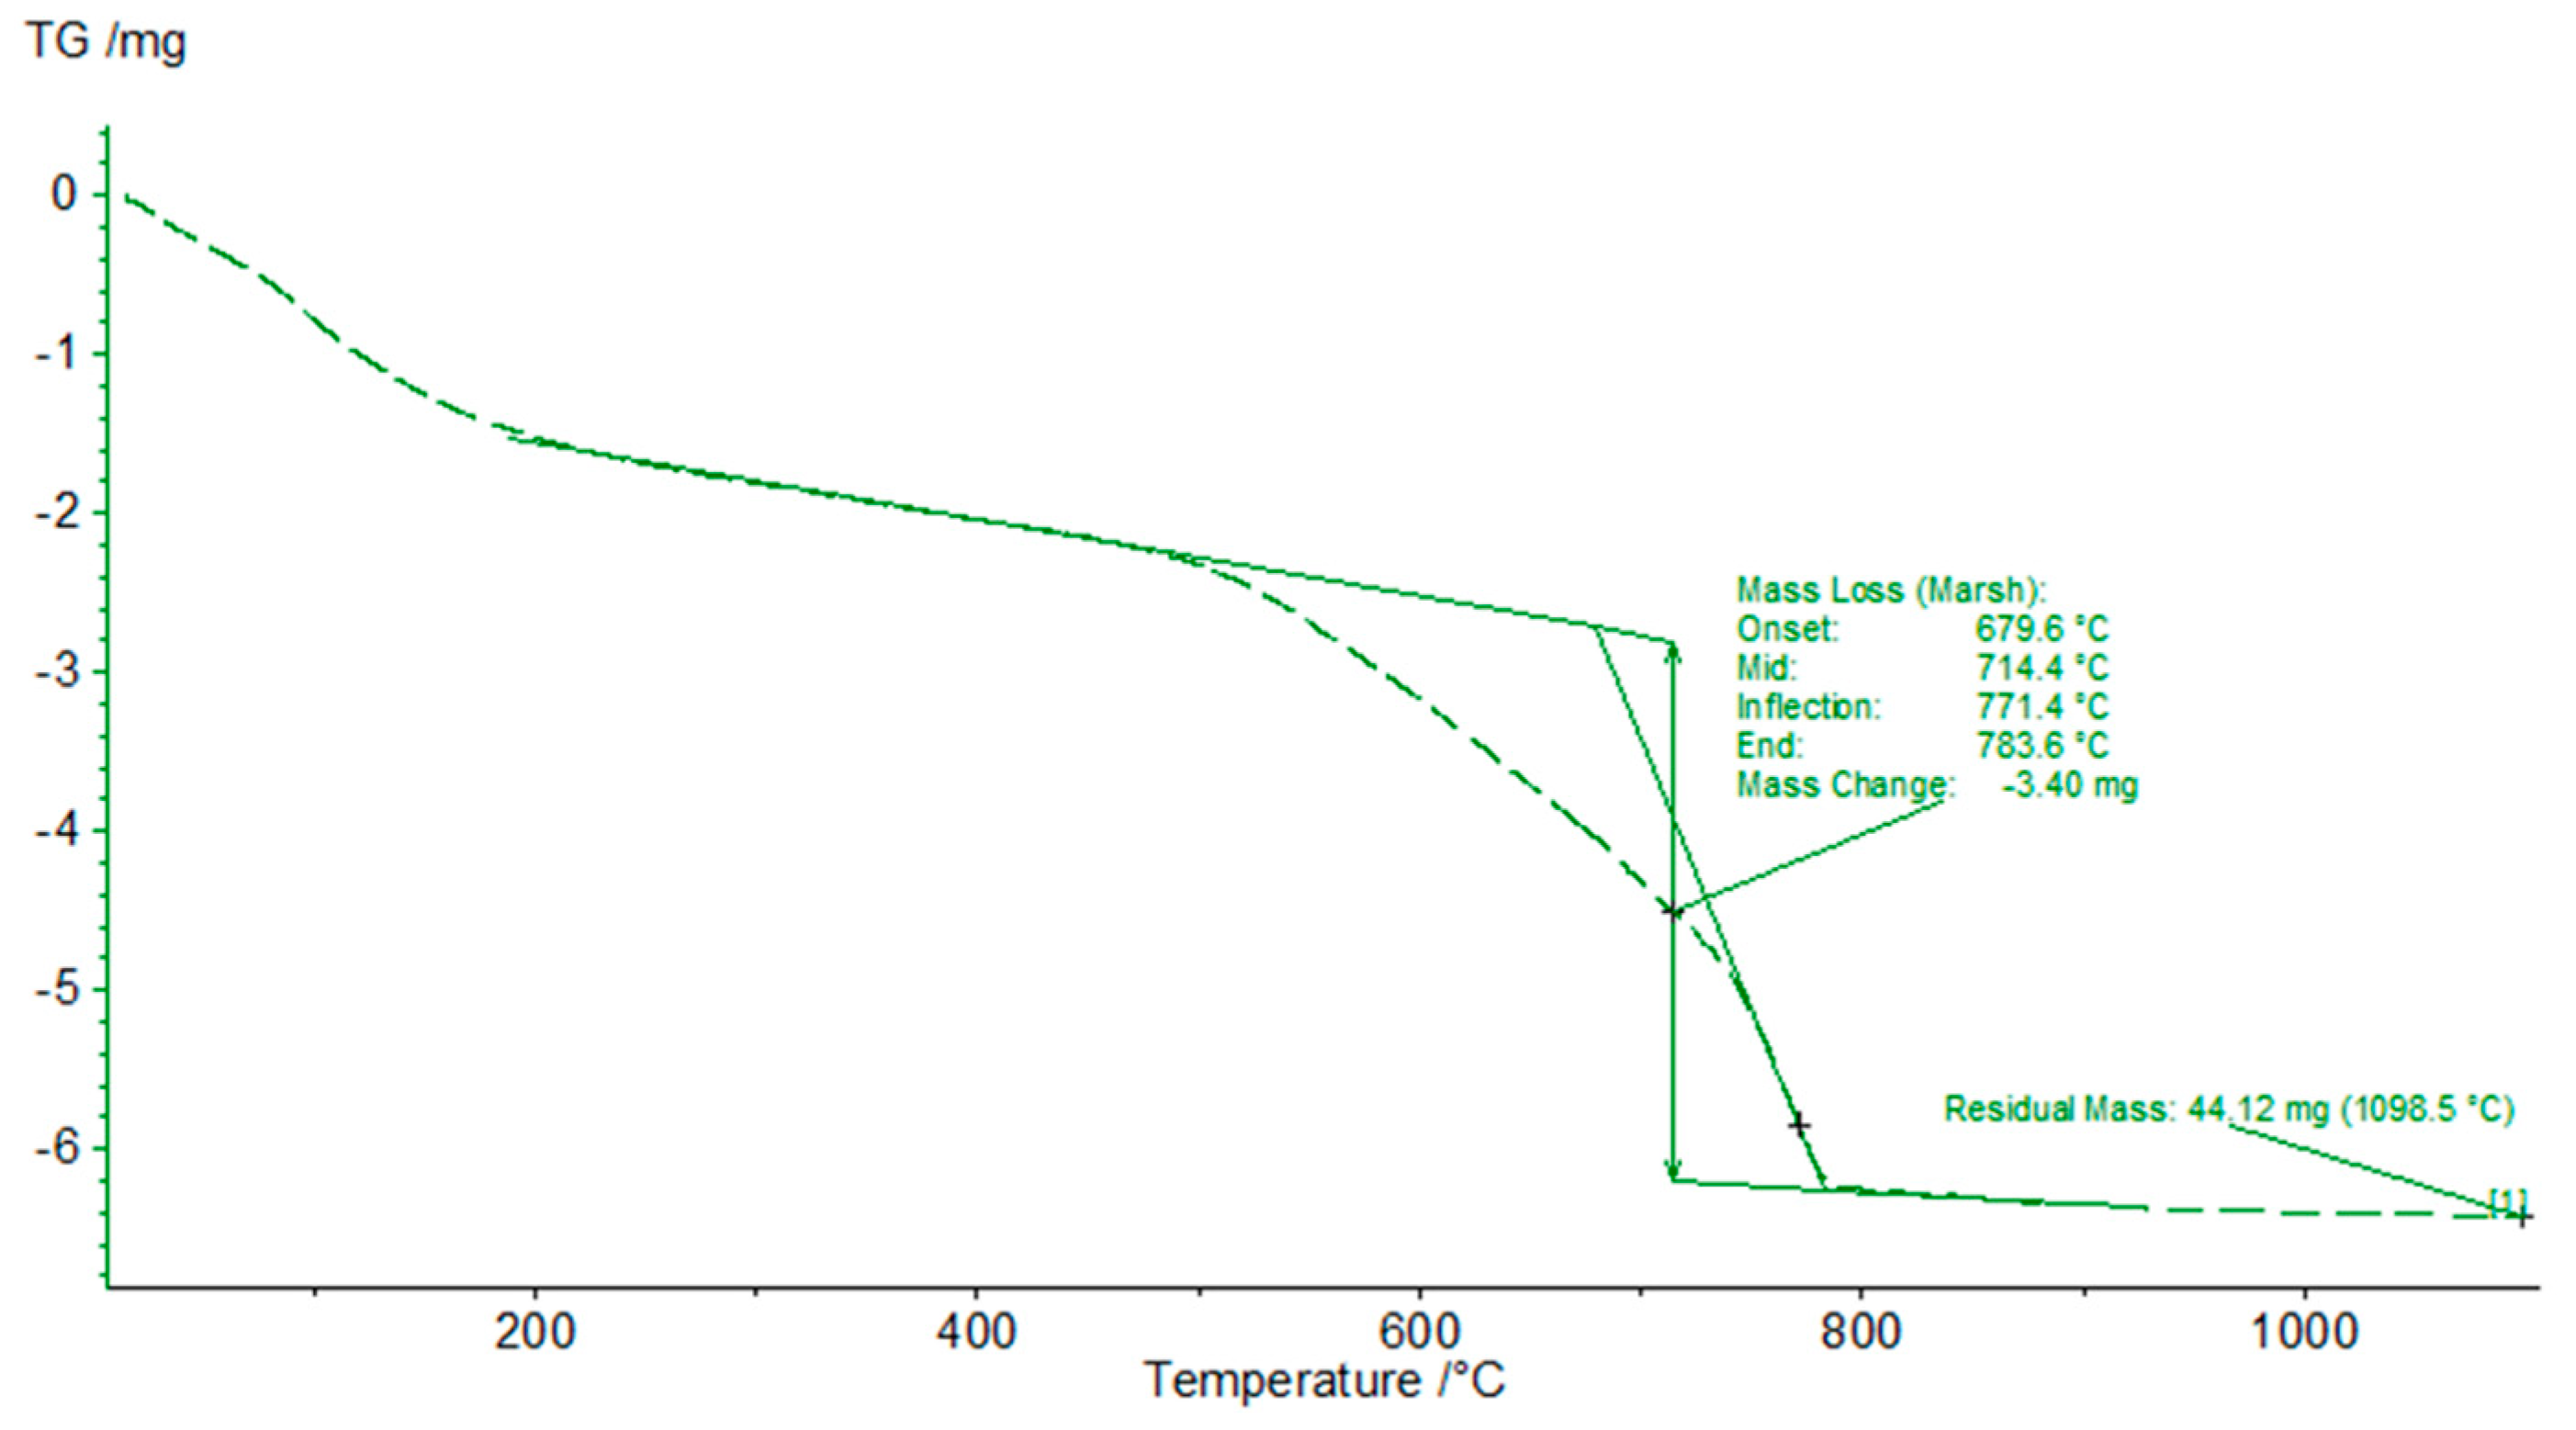
2.4. Thermogravimetric Analysis

TGA was performed on powdery samples taken from the pre-treated slices of each test series of mortar prisms. To obtain these powders, the mortar prism slices were mechanically crushed until all material could pass a sieve with a 63 µm mesh size. Per mortar mix design and carbonation condition, three powdery samples of around 50 mg were heated from 20 °C to 1100 °C at a rate of 10 °C/min under an inert nitrogen atmosphere in a Netzsch Sta 449 F3 Jupiter TGA apparatus. The recorded mass change as a function of temperature was analyzed in Netzsch-Proteus Analysis software [24] (see Appendix A, Figure A2). The main region of interest of the obtained thermal decomposition curves lies between 600 °C and 800 °C which corresponds with the thermal decomposition of calcium carbonate (CaCO3) to CaO and CO2 cf. Lothenbach et al. [25]. The mass loss recorded in that region was expressed in % m/m relative to the residual mass of the powdery sample at 1100 °C recalculated relative to the estimated binder portion of this residual mass. It should be noted that this mass loss was corrected for the concurrent dehydration of other hydrated compounds. This was completed using the tangential method of Baert [26]. For the quantification of the CaCO3 content, Equation (2) was used.
%   m / m   CaCO 3 = ( WL CaCO 3   exposed WL CaCO 3   original   CO 2 ) · MW CaCO 3 MW CO 2
with WLCaCO3 exposed, mass loss attributed to decarbonation, WLCaCO3 original CO2, mass loss due to decarbonation of the original cement and fly ash (see Table 1: CO2), MWCaCO3, molecular weight of CaCO3 (100 g/mol) and MWCO2, molecular weight of CO2 (44 g/mol).

2.5. Calcium Carbonate Content, Carbonation Degree and CO2 Sequestration Potential

With the CaCO3 content known and some basic stoichiometry one can easily quantify the amount of CaO that reacted with the CO2 that penetrated during the natural, slightly accelerated and highly accelerated carbonation experiments (Equation (3)).
%   m / m   CaO reacted = %   m / m   CaCO 3 · MW CaO MW CaCO 3
with % m/m CaCO3, the outcome of Equation (2), MWCaO, molecular weight of CaO (56 g/mol) and MWCaCO3, molecular weight of CaCO3 (100 g/mol). By dividing this value by the reactive CaO content that is initially available in the binder system (CaOreactive = CaO as specified in Table 1), an estimation of the carbonation degree ac (–) is obtained (Equation (4)). For the HVFA mortar this overall initially available reactive CaO content equals 0.5 x CaOCEM I 52.5 N + 0.5 CaOFly ash or 33.02% m/m. For the CEM II/B-V 42.5 N mix and the CEM I 42.5 N reference mix the CaO values of their cements amount to 49.28% m/m and 63.12% m/m, respectively.
a c = CaO reacted CaO reactive
Given the carbonation degree per carbonation condition (natural vs. slightly accelerated vs. highly accelerated) for each studied mortar mix, one can now determine a CO2 sequestration potential (CO2SP, kg/m3) cf. Equation (5) as proposed by [27].
CO 2 SP   =   a c · B · CaO reactive · MW CO 2 MW CaO
with ac, the carbonation degree (–), B, the binder content of the mortar (Table 2: 473.28 kg/m3 (HVFA Mix), 483.21 kg/m3 (CEM II/B-V 42.5 N Mix), 490.36 kg/m3 (CEM I 42.5 N Mix), CaOreactive, the initially available reactive CaO content (33.02% m/m (HVFA mix), 49.28% m/m (CEM II/B-V 42.5 N Mix), 63.12% m/m (CEM I 42.5 N Mix), MWCO2, molecular weight CO2 (44 g/mol) and MWCaO, molecular weight CaO (56 g/mol). Note that the as such calculated CO2SP value assumes that the carbonation front traversed the entire mortar volume. In reality, the natural carbonation rates for each of the studied mortar compositions will be different. To enable comparisons, a reference timeframe during which carbonation can take place needs to be set. In this study, a time period of 100 years was considered in this regard. Moreover, the earlier mentioned generic mortar volume of 1 m3 should be specified more in terms of dimensions. For this study, a 1 m3 wall element measuring 2.24 × 2.24 × 0.20 m3 was considered with only one 2.24 × 2.24 m2 side subject to CO2 exposure. As such, the carbonated mortar volume within a 100-year timeframe could be calculated using the actual natural carbonation rates and the ones estimated from the slightly and highly accelerated carbonation experiments. CO2 sequestration potentials were then calculated for only this mortar volume. Subsequent CO2-sequestration-to emission-ratios (CO2-SP/EM) of all three binder systems were determined using two approaches: (i) by dividing the CO2 sequestration potential of the full carbonated volume by the global warming potential of the binder fraction of the full generic 1 m3 mortar volume, and (ii) by dividing the CO2 sequestration potential of the carbonated volume within 100 years by the global warming potential of the binder fraction of the full 2.24 × 2.24 × 0.2 m3 mortar volume of the wall element.

2.6. Life Cycle Assessment

2.6.1. Definition of Goal and Scope

The aim of this study was not a full LCA for the three mortar mixes under investigation. It merely envisaged a quantification of the production related greenhouse gas emissions for the binder fraction of 1 m3 of each mortar to be evaluated against their respective CO2 sequestration potentials. As such, it is rather a cradle-to-gate assessment of the carbon footprint of each mortar. True, the additional consideration of their potential CO2 sequestration potential within a 100-year time period puts it somehow beyond the scope of a cradle-to-gate study. Yet, this covers only one aspect of the ‘beyond production’ stage. As maintenance and end-of life issues are not covered, one cannot attribute conclusions of this study to a full cradle-to-grave scope.

2.6.2. Inventory Analysis

Life Cycle Inventories (LCIs) for the binder fractions per m3 of each mortar were compiled in the LCA software SimaPro (Version 9.1.1.1) equipped with the ecoinvent database (Version 3.4) [28]. The following ecoinvent data sets were used to model the cements of three mortar mix designs:
  • CEM I 52.5 N: Cement, Portland {Europe without Switzerland}|production|Cut-off, U.
  • CEM II/B-V 42.5 N: Cement, pozzolana and fly ash 11–35% {Europe without Switzerland}|cement production, pozzolana and fly ash 11–35%|Cut-off, U.
  • CEM I 42.5 N: Cement, Portland {Europe without Switzerland}|production|Cut-off, U.
It should be noted that the same LCI was assigned to CEM I 52.5 N and CEM I 42.5 N. Within ecoinvent, there is currently no possibility to differentiate within a certain cement type (i.e., Portland cement) when their strength class varies. A higher strength class of a cement normally requires more intensive milling of the Portland clinker and thus more milling related energy consumption. Therefore, one would expect a set of LCIs being available for Portland cement with an increasing energy input as the strength class goes up. It remains unclear at this point whether this anomaly is due to the fact that the extra milling does not cause significant extra impacts or that this issue has simply been overlooked until now. Either way, this specific aspect should definitely be subject of further research, but for now no differentiation was made between Portland cements with a strength class of 52.5 and 42.5.
With regard to the composite cement CEM II/B-V 42.5 N, it must be mentioned that the selected ecoinvent data set for this cement corresponded best with this cement type in terms of clinker content. With a clinker content of 77%, this cement can be classified as a CEM II/B-V 42.5 N in accordance with NBN EN 197-1 [22]. Unfortunately, the actual clinker of the cement used was not known. Based on its compliance with NBN EN 197-1 [22], we could only conclude that it ranged between 65% and 79%. Yet, we do not know how exact the match in clinker content was. Further, note that the LCI does not include any processes that can be traced back to the fly ash. Environmental impacts calculated using this LCI will not reflect any fly ash related impact. This is questionable given the available literature on LCA of fly ash based cementitious materials. Therefore, this issue will be dealt with further on after having dealt with the inventory analysis of fly ash as separate mortar constituent in the HVFA mortar.
Different approaches were followed based on the product status of fly ash. As pointed out by Chen et al. [7], fly ash can no longer be seen as a mere waste product. In accordance with the applicable European Directive 2008/98/EC [29], it meets all the criteria of being a valuable industrial by-product. As a consequence, part of the life cycle inventory and resulting environmental impact of the main production process, i.e., coal-fired electricity production, should be assigned to it in a fair manner. Normally, the ISO standards on life cycle assessment (ISO 14040-14044 [30,31]) point out that this is rather to be done using the subdivision method or the system expansion method, than via allocation. However, Seto et al. [10] explain that these methods are unfeasible when dealing with coal-fired electricity production and fly ash. Thus, only an allocation of impacts remain as valid options. Mass allocation imposes a huge environmental impact onto the fly ash as only a very little amount of fly ash (0.052 kg) is produced per kWh of electricity. It results in a carbon footprint of fly ash that is way higher than for cement. From an environmental viewpoint it would no longer be worthwhile to use the fly ash as partial cement replacement [6]. Apart from that, Seto et al. [10] have more general concerns with mass allocation. A high mass of the waste product relative to the primary product could have the adverse effect that the manufacturer starts claiming that the environmental impact of their primary product is low. Economic allocation which additionally considers the differences in economic value between primary product and by-product normally overcomes this issue. Yet, one must remain aware of the fact that economic allocation coefficients calculated as such may not be very constant because of the temporal and geographical variability of the economic value. To overcome this issue for this paper, multiple recent economic allocation coefficients were used to assign part of the carbon footprint of coal-fired electricity production to the fly ash. Table 3 gives an overview of these economic allocation coefficients (Ce).
Equation (6) shows the underlying formula for calculation of this Ce value:
C e =   ( p · m ) by product ( p · m ) primary   product + ( p · m ) by product
with (p · m) the price per unit of the materials (p) multiplied by the mass of materials produced during the process (m), the by-product being the fly ash and the primary product being coal-fired electricity. Note that in order to have a mass value for the electricity in Equation (6) the amount of hard coal burned (around 0.367 kg) to produce 1 kWh of electricity was used as input cf. Chen et al. [7]. Each of the economic allocation coefficients listed in Table 3 were once applied to the following ecoinvent LCI for coal fired electricity production: Electricity, high voltage {DE}|electricity production, hard coal|Cut-off, U. As such, 5 different LCIs representing economic allocation for the fly ash were obtained. Since the fly ash used in this research originated from a coal-fired power plant in Germany, the LCI based on a Ce value of 0.50% is probably the most representative one for further carbon footprint calculations in this regard. However, additional consideration of similar calculations done with the LCIs based on the other Ce values will give an indication on to what extent the outcome of carbon footprint calculations for fly ash can vary.
According to Chen et al. [7] the basic treatment of the fly ash after its capture from the flue gases by the electrostatic precipitators should be fully assigned to the fly ash. This basic treatment comprises basic drying and storage. Chen et al. proposed an LCI for this. The same LCI was used in this study after updating all input data to the most recent version of the ecoinvent database. A detailed overview of the LCI can be found in Appendix A (Table A1).
Thus, a full LCI for fly ash comprises the sum of the LCI covering its basic treatment (drying + storage) and the LCI that deals with the economic allocation of coal fired electricity production. In total, five versions of this fully LCI were compiled considering the five considered Ce values from literature (Table 3). Apart from that, also an LCI only addressing the basic treatment was drafted. This was done for the following reason: Despite the fact that fly ash clearly meets the criteria of being a by-product, it is generally not yet well accepted to include an allocated impact for the fly ash. For example, environmental product declarations (EPDs) of commercially available composite cements rarely account for it. Also the earlier mentioned ecoinvent data set for pozzolan and fly ash based cement does not assign any impact to the fly ash. Simply assigning the impact of the basic treatment of the fly ash seems then a more realistic approach.
Given the above mentioned multiple ways of dealing with the inventory analysis of fly ash, it seems appropriate to adopt a similar approach for the composite cement CEM II/B-V 42.5 N. Therefore, five additional variations on the ecoinvent LCI data set for this cement were compiled, i.e., one that covers only the basic treatment of its 23% fly ash content, and five others that additionally cover economic allocation of coal-fired electricity production according to the 5 Ce values mentioned in Table 3.

2.6.3. Impact Analysis

The production-related greenhouse gas emissions for the binder fraction of each considered mortar mix design were calculated using the global warming impact indicator of the CML-IA impact method available in SimaPro. It gives a global warming potential expressed in kg CO2 eq with 100 years as reference timeframe.

2.6.4. Interpretation

The obtained production-related greenhouse gas emissions were mainly used to determine CO2SP/EM values per mix design and assess the influence of the underlying carbonation testing protocol (natural vs. slightly accelerated vs. highly accelerated) as well as the fly ash allocation approach on these CO2SP/EM values.

3. Results

3.1. Experimental and Estimated Natural Carbonation Rates

All carbonation rates obtained represent the typical outspoken linear relation between the carbonation depth and the square-root-value of the exposure time. R2 values approach 1.00, with values equaling 0.92 or higher (Table 4). The mortar mix with HVFA additions seems most susceptible to carbonation. Given its Portland cement content of only 50%, hence lower availability of portlandite as a main carbonatable material, the CO2 buffering capacity of this HVFA mortar will probably be on the low side. Thus, an experimental natural carbonation rate Anat of 15.29 mm/√years does not really come as a surprise for this mix design. When comparing this value with the natural carbonation rates estimated from the slightly/highly accelerated carbonation tests using Equation (1), it is immediately clear that this approach results in a significant underestimation of the actual natural carbonation rate Anat. When the estimation is based on the output of a highly accelerated carbonation experiment at 10% CO2 (Anat: 6.35 mm/√years), this implies an underestimation of the actual value with no less than 59%. Given the fact that the conversion formula proposed by Sisomphon and Franke [15] (Equation (1)) can normally be used for elevated CO2 levels up to 3%, this severe underestimation was perhaps to be expected. Note that for this reason, carbonation at 10% CO2 was no longer considered for the other two mortar mixes. However, when using the result of the slightly accelerated carbonation experiment at 1% as input for calculating Anat (10.89 mm/√years), the actual natural carbonation rate is still underestimated with 29%. Apparently, Equation (1) seems not very suitable to be applied on accelerated carbonation test results of the studied HVFA mortar.
The CEM II/B-V 42.5 N mix and the CEM I 42.5 N mix are characterized by experimental natural carbonation rates of only 3.10 mm/√y and 2.31 mm/√y, respectively. The composite cement has a reduced Portland clinker content of 65–79% according to NBN EN 197-1 [22]. This seemed to have had consequences for the reduction of the CO2 buffering capacity and the related carbonation rate. The Anat value of the CEM II/B-V 42.5 N mix turned out 1.34 times higher than for the CEM I 42.5 N mix. When comparing the estimated natural carbonation rate with the experimental one, it can be noticed that the underestimation of the former value is much less pronounced. For the CEM II/B-V 42.5 N and CEM I 42.5 N based mortar mixes, the actual Anat value is underestimated by only 6.0% and 7.5%, respectively. For mortar consisting of the two commercial cements much less harm seems to come from the conversion of carbonation test results obtained at 1% CO2 using Equation (1).

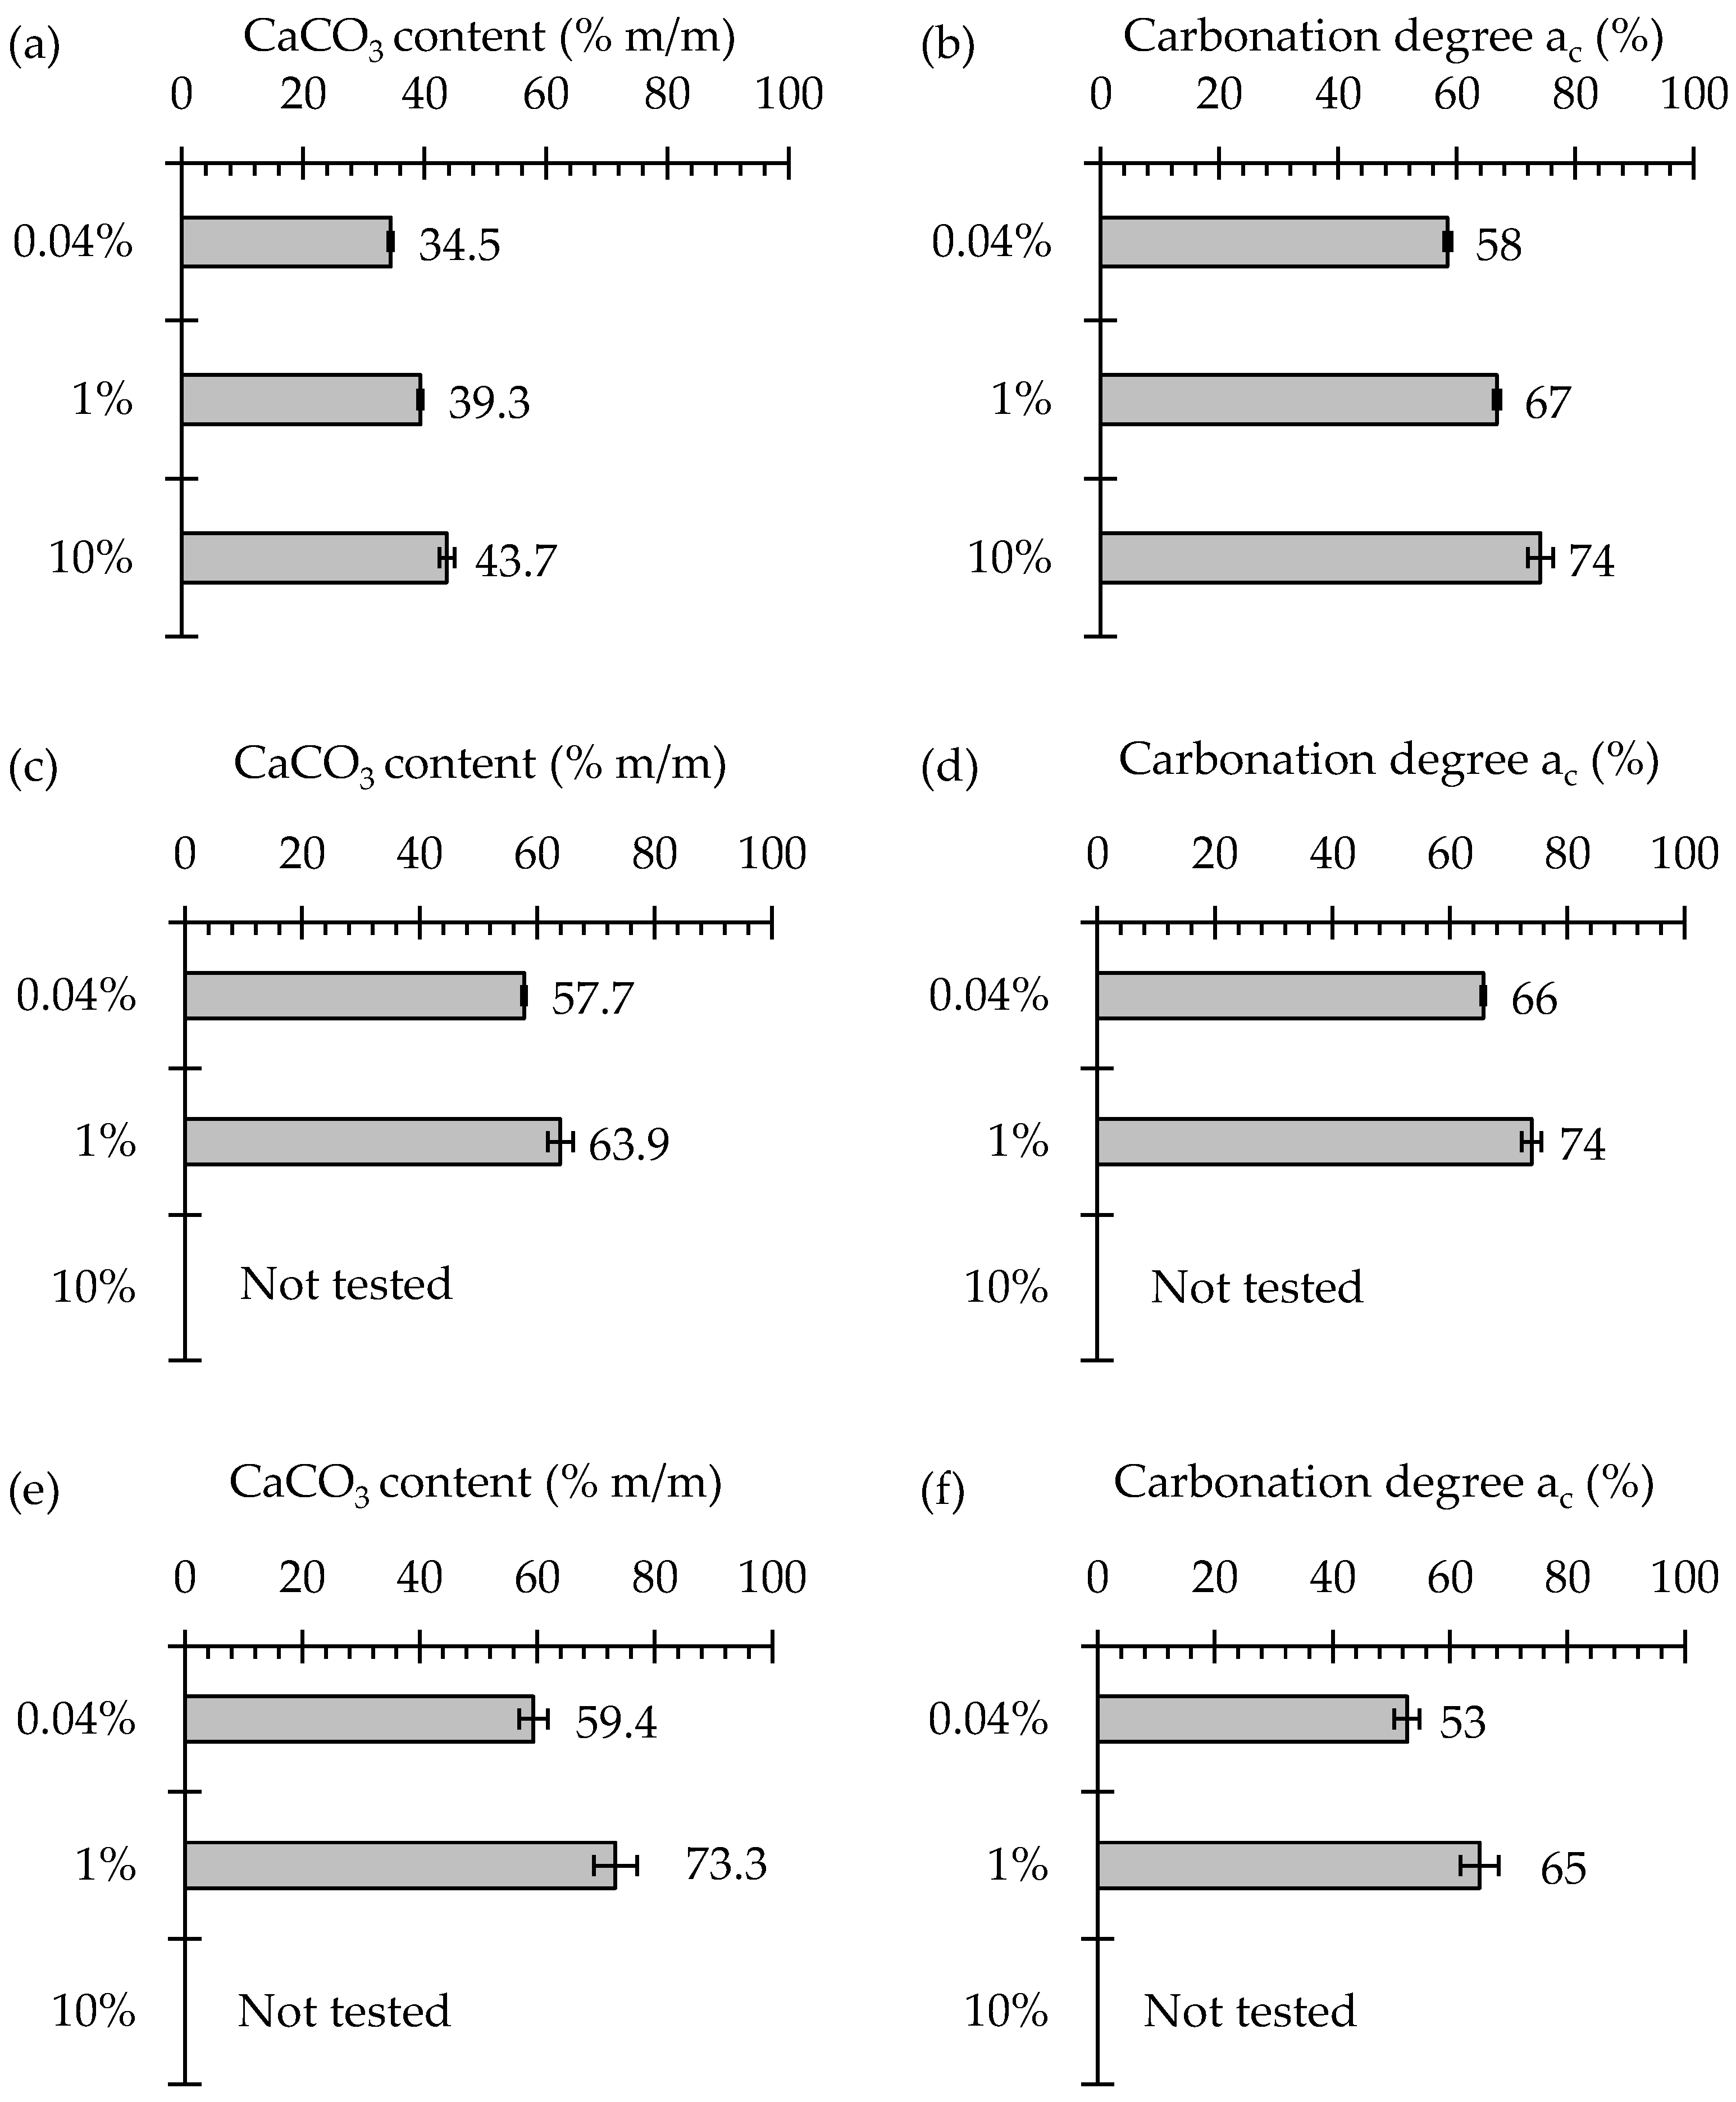
3.2. CaCO3 Content and Carbonation Degree

The thermal decomposition curves of all HVFA mortar samples did not show a distinct mass loss in the 400–500 °C temperature range. This indicates that there was no Ca(OH)2 present in those samples. Clearly, the remaining fraction of Ca(OH)2 that was not consumed in the pozzolanic hydration reaction of the fly ash, carbonated fully for all three exposure conditions under investigation (natural vs. slightly accelerated vs. highly accelerated carbonation). Contrarily, all these curves were characterized by a very pronounced continuous mass loss within the temperature range for CaCO3 in all its common mineralogical phases (550–680 °C: the amorphous phase; 680–780 °C: the metastable phase, i.e., vaterite and aragonite; 780–990 °C, the stable phase, i.e., well-crystallized calcite [32]). Figure 1a shows the CaCO3 content of the HVFA mortar (in % m/m relative to the binder) after 17 weeks of carbonation at 0.04%, 1% and 10% CO2. A most striking observation for these results was the significant increase in CaCO3 content with the applied CO2 concentration during carbonation. The corresponding carbonation degrees ac (%), that directly depend on this CaCO3 content, evolved in a very similar way (Figure 1b). The fact that samples carbonated at 10% and 1% CO2 reached the state of full carbonation already much longer than the naturally carbonated samples after 17 weeks, could perhaps have played a role. Nonetheless, TGA analysis performed on the samples subject to accelerated carbonation after already 4 weeks of exposure could not confirm this. CaCO3 contents and carbonation degrees for carbonation at 10% CO2 equaled 41.8% m/m and 71%. For the 1% CO2 exposure condition, these values amounted to 39.7% m/m and 67%. These values are very similar to what was recorded after 17 weeks of exposure. Carbonating the samples longer than needed to reach full carbonation (based on the colorimetric assessment method) can thus not be identified as a key influencing factor.
A significant increase in total CaCO3 content and carbonation degree ac with an increasing CO2 concentration could also be confirmed for the mortar consisting of the commercially available fly ash based composite cement CEM II/B-V 42.5 N. Exposing the mortar for 44 weeks to 1% CO2 instead of 0.04% CO2 resulted in a rise in carbonation induced CaCO3 content from 57.7% m/m to 63.9% m/m (Figure 1c). Consequently, the carbonation degree ac rose from 66 to 74% m/m (Figure 1d). The total exposure period for this mortar mix was more than double the exposure period adopted for the HVFA mix. This makes it difficult to make direct comparisons between the two. Nonetheless, the obviously higher CaCO3 contents for the CEM II/B-V 42.5 N mix are most likely related to their much higher carbonatable material content (see Section 2.5: 49.28% CaO vs. 33.02% CaO). For this mix it could be observed that the carbonation degrees calculated were exceeding those of the HVFA mix. One would perhaps also attribute this to the higher carbonatable material content of the former mix. However, when considering these results alongside the carbonation degrees obtained for the reference mix consisting of Portland cement CEM I 42.5 N with a CaO content of no less than 63.12% (the highest value of the three considered binders), this statement does not seem to hold true. With carbonation degrees of 53% and 65% at 0.04% CO2 and 1% CO2, respectively (Figure 1f), they are the lowest when compared with the corresponding ones of the CEM II/B-V 42.5 N mix and the HVFA mix. Still, the CEM I 42.5 N reference mix has the highest carbonation induced CaCO3 content of all three considered mixes after carbonation at 0.04% CO2 and 1% CO2 (Figure 1e). As stated earlier, this can most probably be explained by the high CaO content of the cement used (63.12%) and thus an overall high carbonatable material content of this mortar mix. Note that also for this Portland cement reference mix, the CaCO3 content tends to increase with the applied CO2 concentration from 59.4% m/m to 73.3% m/m.

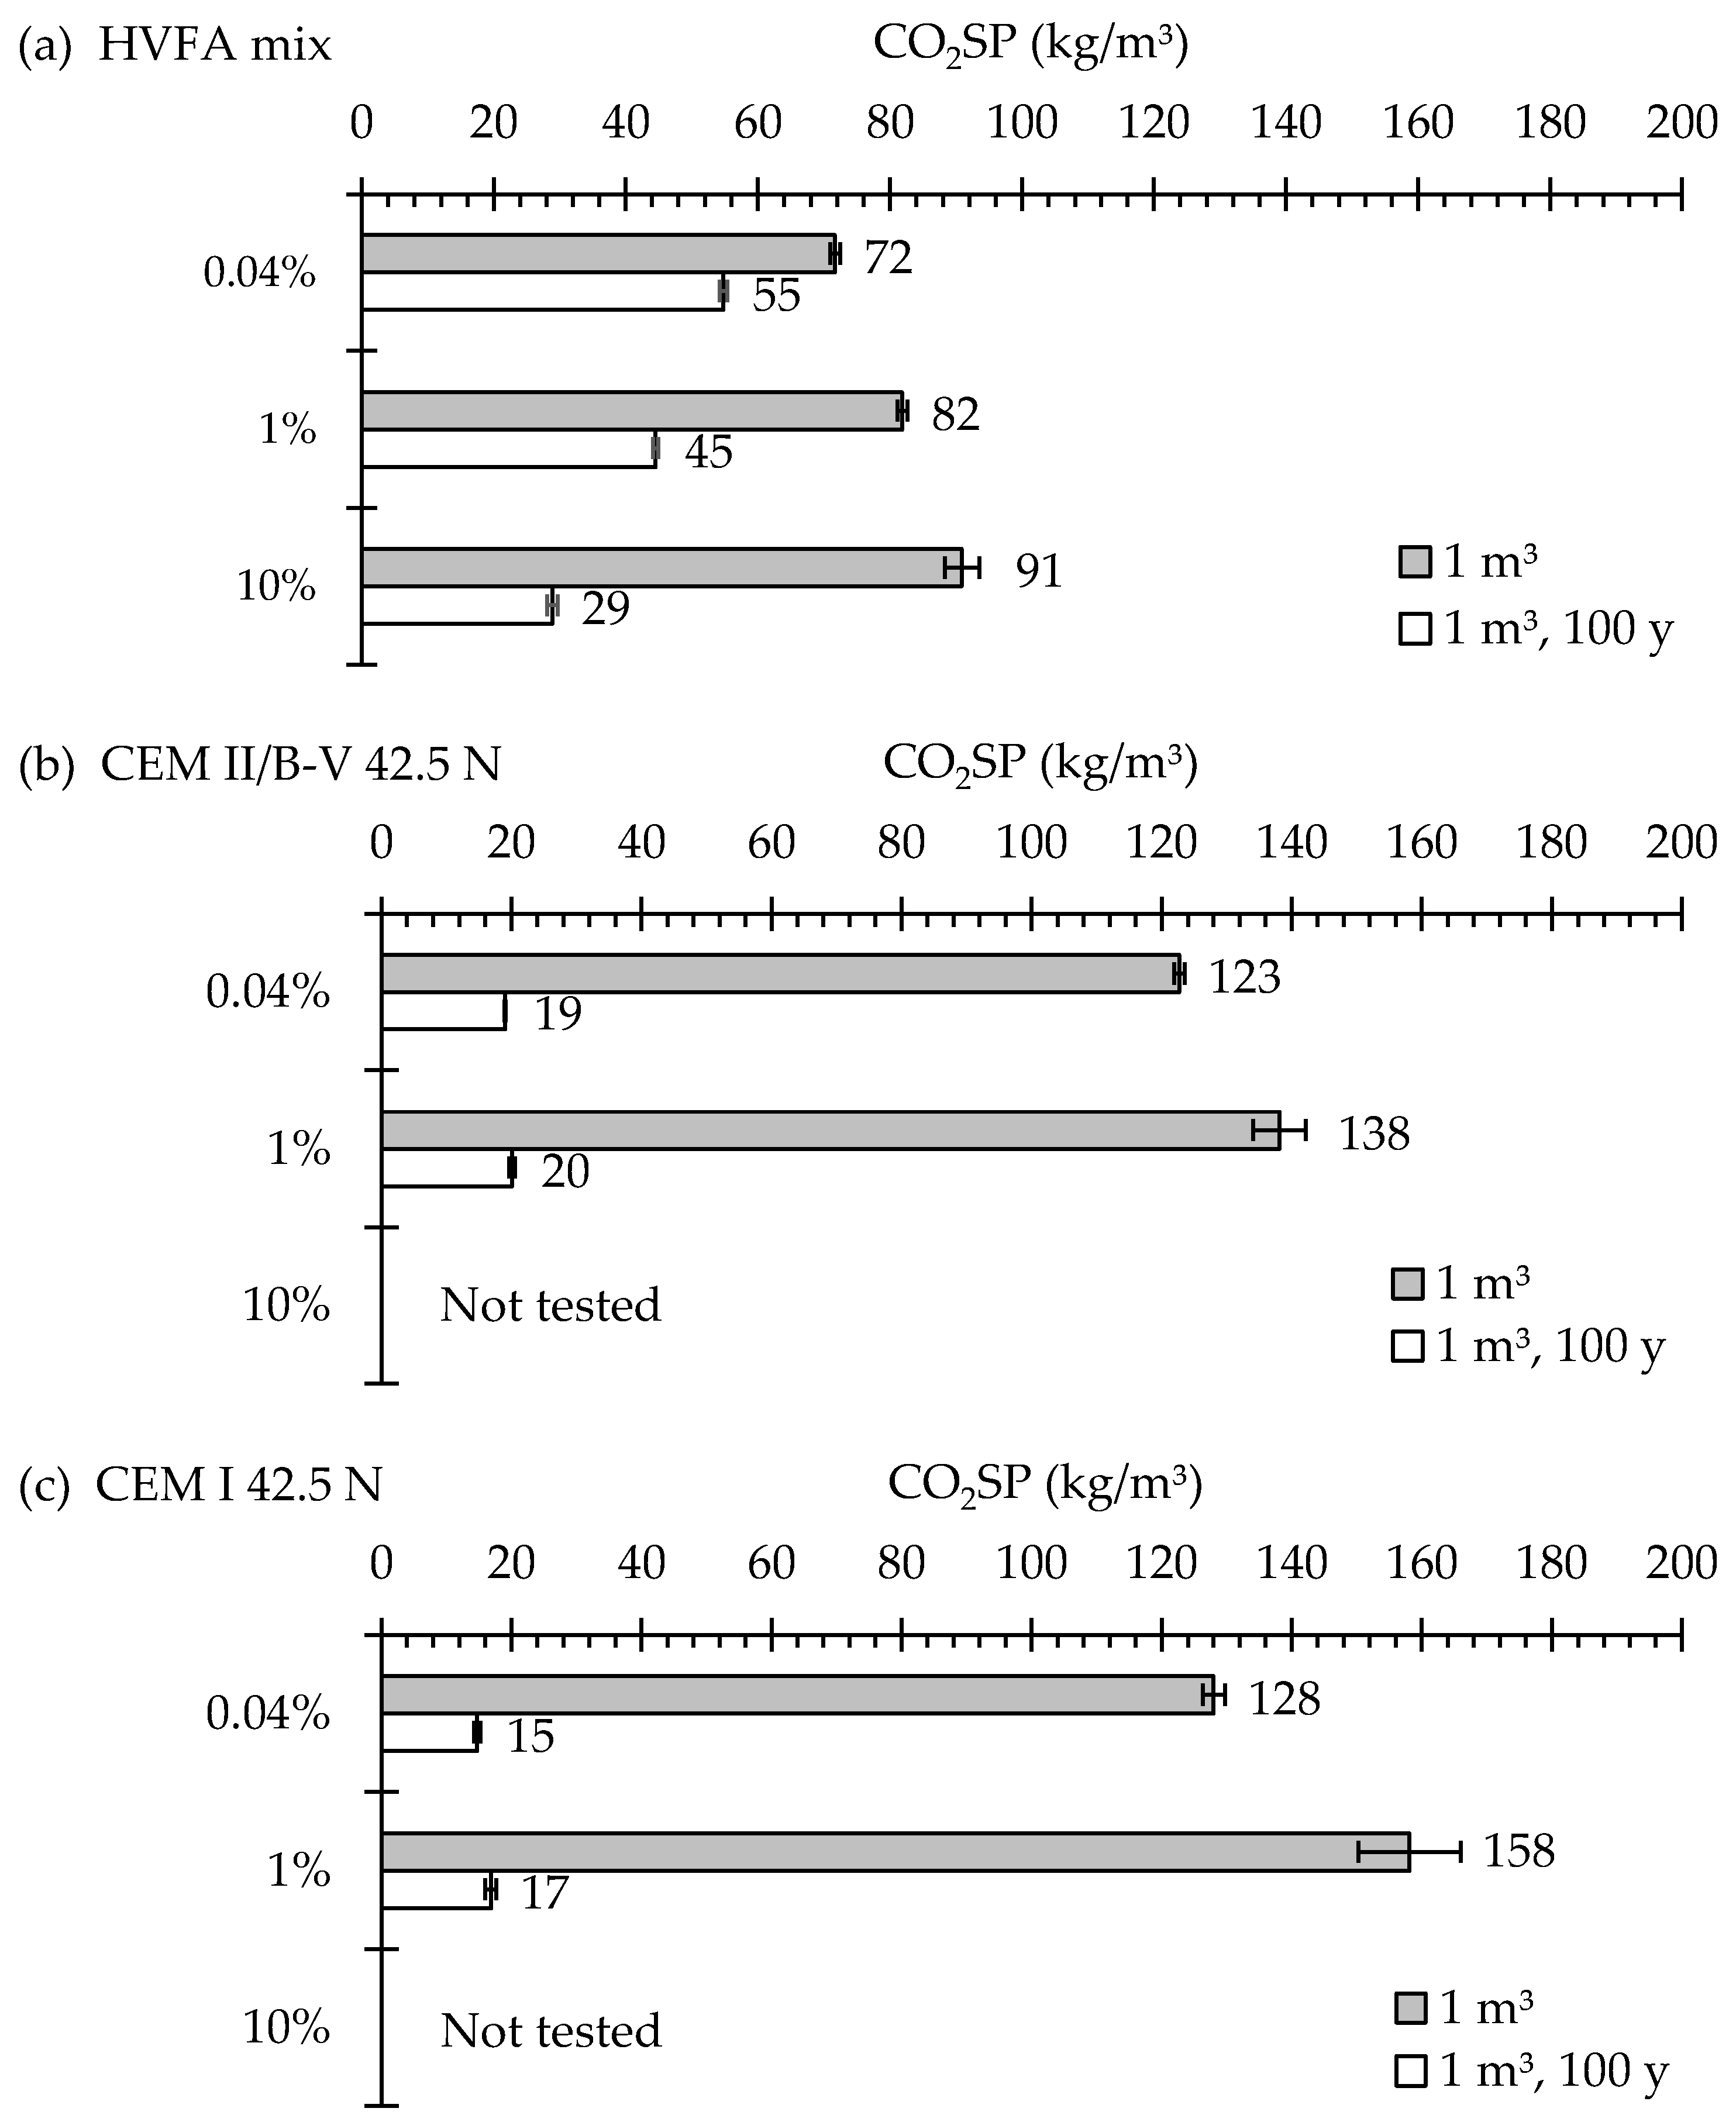
3.3. CO2 Sequestration Potential

When assuming full carbonation (by assessment of the phenolphthalein color indicator) for the 1 m3 mortar volume, the CO2 sequestration potentials (CO2SP) of the HVFA mix, the CEM II/B-V 42.5 N mix and the CEM I 42.5 N mix amount to 72–91 kg/m3, 123–138 kg/m3 and 128–158 kg/m3, respectively (Figure 2, grey bars). Despite their differences in the 14-day sample preconditioning and exposure period for the HVFA mix and the other two mixes, the observed increasing CO2SP values can most probably be associated with their decreasing fly ash content and thus increasing carbonatable material content. It should be noted though that the differences in CO2SP between the CEM II/B-V 42.5 N mix and the CEM I 42.5 N mix are not that large. A larger difference might perhaps be expected given the fact that the Portland clinker content of the composite cement CEM II/B-V 42.5 N is reduced with 21–35% in comparison with the Portland cement CEM I 42.5 N mix. Differences in potential carbon material and related CaO content (see Table 1) are a direct result of this. Another peculiar observation is that the highest CO2SP values for the CEM I 42.5 N mix are there despite the fact that this mortar mix showed the lowest carbonation degree of all three considered mixes (see Section 3.2). Apparently, the higher CaO content of the Portland cement (Table 1: 63.12% vs. 49.28%) compensated for this. Additionally, the somewhat higher binder content of the Portland cement mortar mix (Table 2: 490.36 kg/m3 vs. 483.21 kg/m3) played a role in that.
The underlying carbonation test method to determine the achievable carbonation degree for each binder system seriously affected the eventually obtained CO2SP value that is calculated from it. With an increasing CO2 concentration applied during the carbonation experiment (from 0.04% CO2 to 1% CO2 and 10% CO2), the expected CO2SP value increases significantly. This is a serious matter of concern. Apparently, accelerated carbonation testing cannot be used for an adequate assessment of the expected CO2 sequestration potential under natural exposure conditions. Even slightly accelerated carbonation at 1% CO2 already gives this problem.
The findings described above might be of limited use since the exposure periods needed to come to the earlier mentioned state of full carbonation varied considerably between the three mortar mix designs under investigation. From that point of view, it is more interesting to look at CO2SP values obtained for a dimensions specific 2.24 × 2.24 × 0.20 m3 = 1 m3 mortar volume after 100 years of exposure (Figure 2, white bars). As such, differences in progression of the carbonation front with time and related differences in carbonated mortar volume up to the point of the carbonation front after 100 years are accounted for. The resulting CO2SP values for the HVFA mix, the CEM II/B-V 42.5 N mix and the CEM I 42.5 N mix amount to 55–29 kg/m3, 19–20 kg/m3 and 15–17 kg/m3, respectively. Contrarily to the previous calculation approach for a generic 1 m3 mortar volume, the HVFA mix now seems the most beneficial one when it comes to potential CO2 sequestration and related sustainability aspects.
For a time and dimensions specific mortar volume, the effect of the applied CO2 concentration during carbonation testing changes. For the HVFA mix, CO2SP values decrease with the applied CO2 concentration. This mainly due to the important underestimation of natural carbonation rates when estimated from the outcome of accelerated carbonation experiments (see Section 3.1: 29–59%). The other two mortar mix designs still show a slight increase in CO2SP value when CO2 concentration during carbonation testing shifts from 0.04% to 1%. This can probably be explained by the fact that the underestimations of the actual natural carbonation rates when based on the outcome of an accelerated experiment conducted at 1% CO2 were limited (see Section 3.1: 6.0–7.5%). Under these conditions, the effect of having a higher carbonation degree with an increasing CO2 concentration applied, was more dominant.

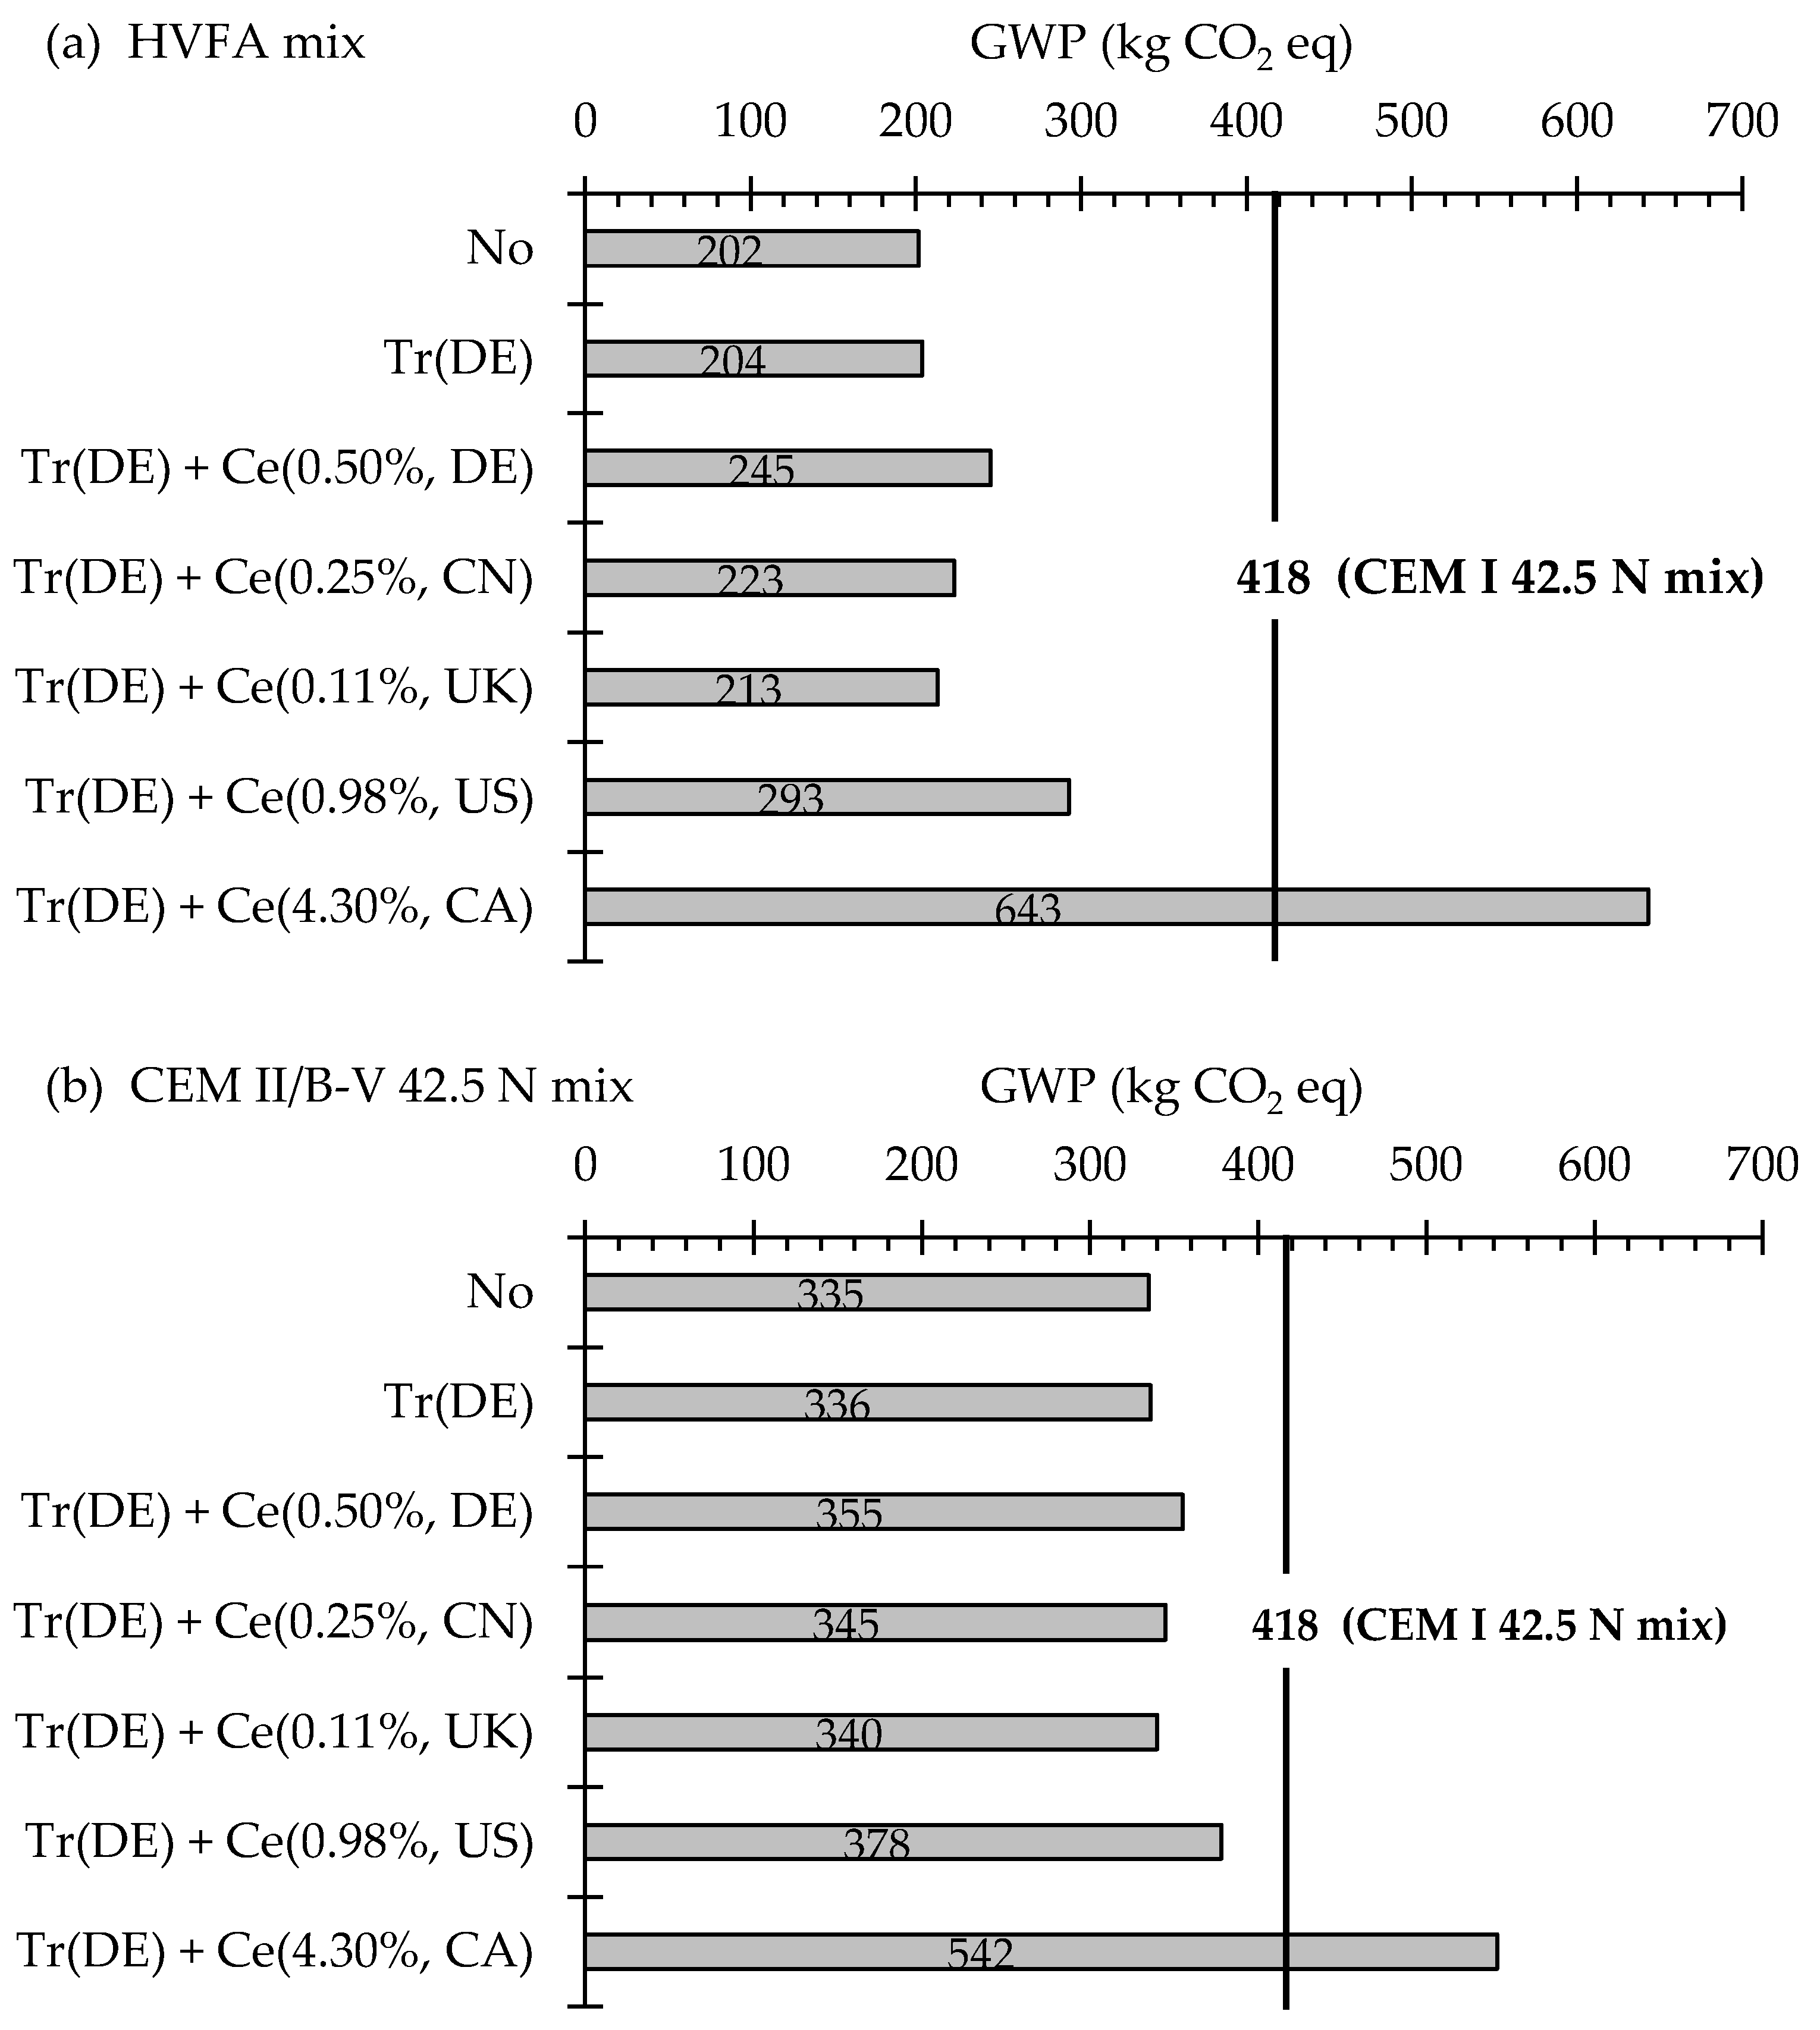
3.4. Production-Related Greenhouse Gas Emissions

The global warming potentials of the binder fractions of 1 m3 of HVFA and CEM II/B-V 42.5 N mortar can vary considerably with the way impact was assigned to the fly ash (Figure 3). Mere consideration of the basic treatment of the fly ash (drying + storage) barely increases the GWP value (HVFA: +2 kg CO2 eq; CEM II/B-V 42.5 N: +1 kg CO2 eq) relative to the no-impact approach (HVFA: 202 kg CO2 eq; CEM II/B-V 42.5 N: 335 kg CO2 eq). Additional inclusion of a partial impact of coal-fired electricity production by means of economic allocation affects the GWP values obtained more substantially.
As a German fly ash was used for this research, it is evident that the Tr(DE) + Ce(DE) value is seen as reference case for the economic allocation approach (Ce: 0.50% cf. Table 3). It adds 43 kg CO2 eq and 20 kg CO2 eq to the carbon footprints of the binder fractions of the HVFA mortar and the CEM II/B-V 42.5 N mortar, respectively. It is logical that this increase is lower for the latter, given its lower fly ash content (23% as opposed to 50%). The GWP values drop further when the lower economic allocation coefficients representative for China (Ce: 0.25% cf. Table 3) and UK (Ce: 0.11% cf. Table 3) are considered. The opposite trend was observed in case of economic allocation based on data from the United States (Ce: 0.98% cf. Table 3) and Canada (Ce: 4.30% cf. Table 3). Economic allocation by 4.30% imposes overall carbon footprints for both fly ash-based mortars (HVFA: 643 kg CO2 eq; CEM II/B-V 42.5 N: 542 kg CO2 eq) that exceed the Portland cement-based reference mortar (CEM I 42.5 N: 418 kg CO2 eq.) by far. For this calculation approach, it seems no longer sustainable to incorporate fly ash in the binder system, even when the amounts remain limited to the typical Portland clinker replacement levels of commercial composite cements.

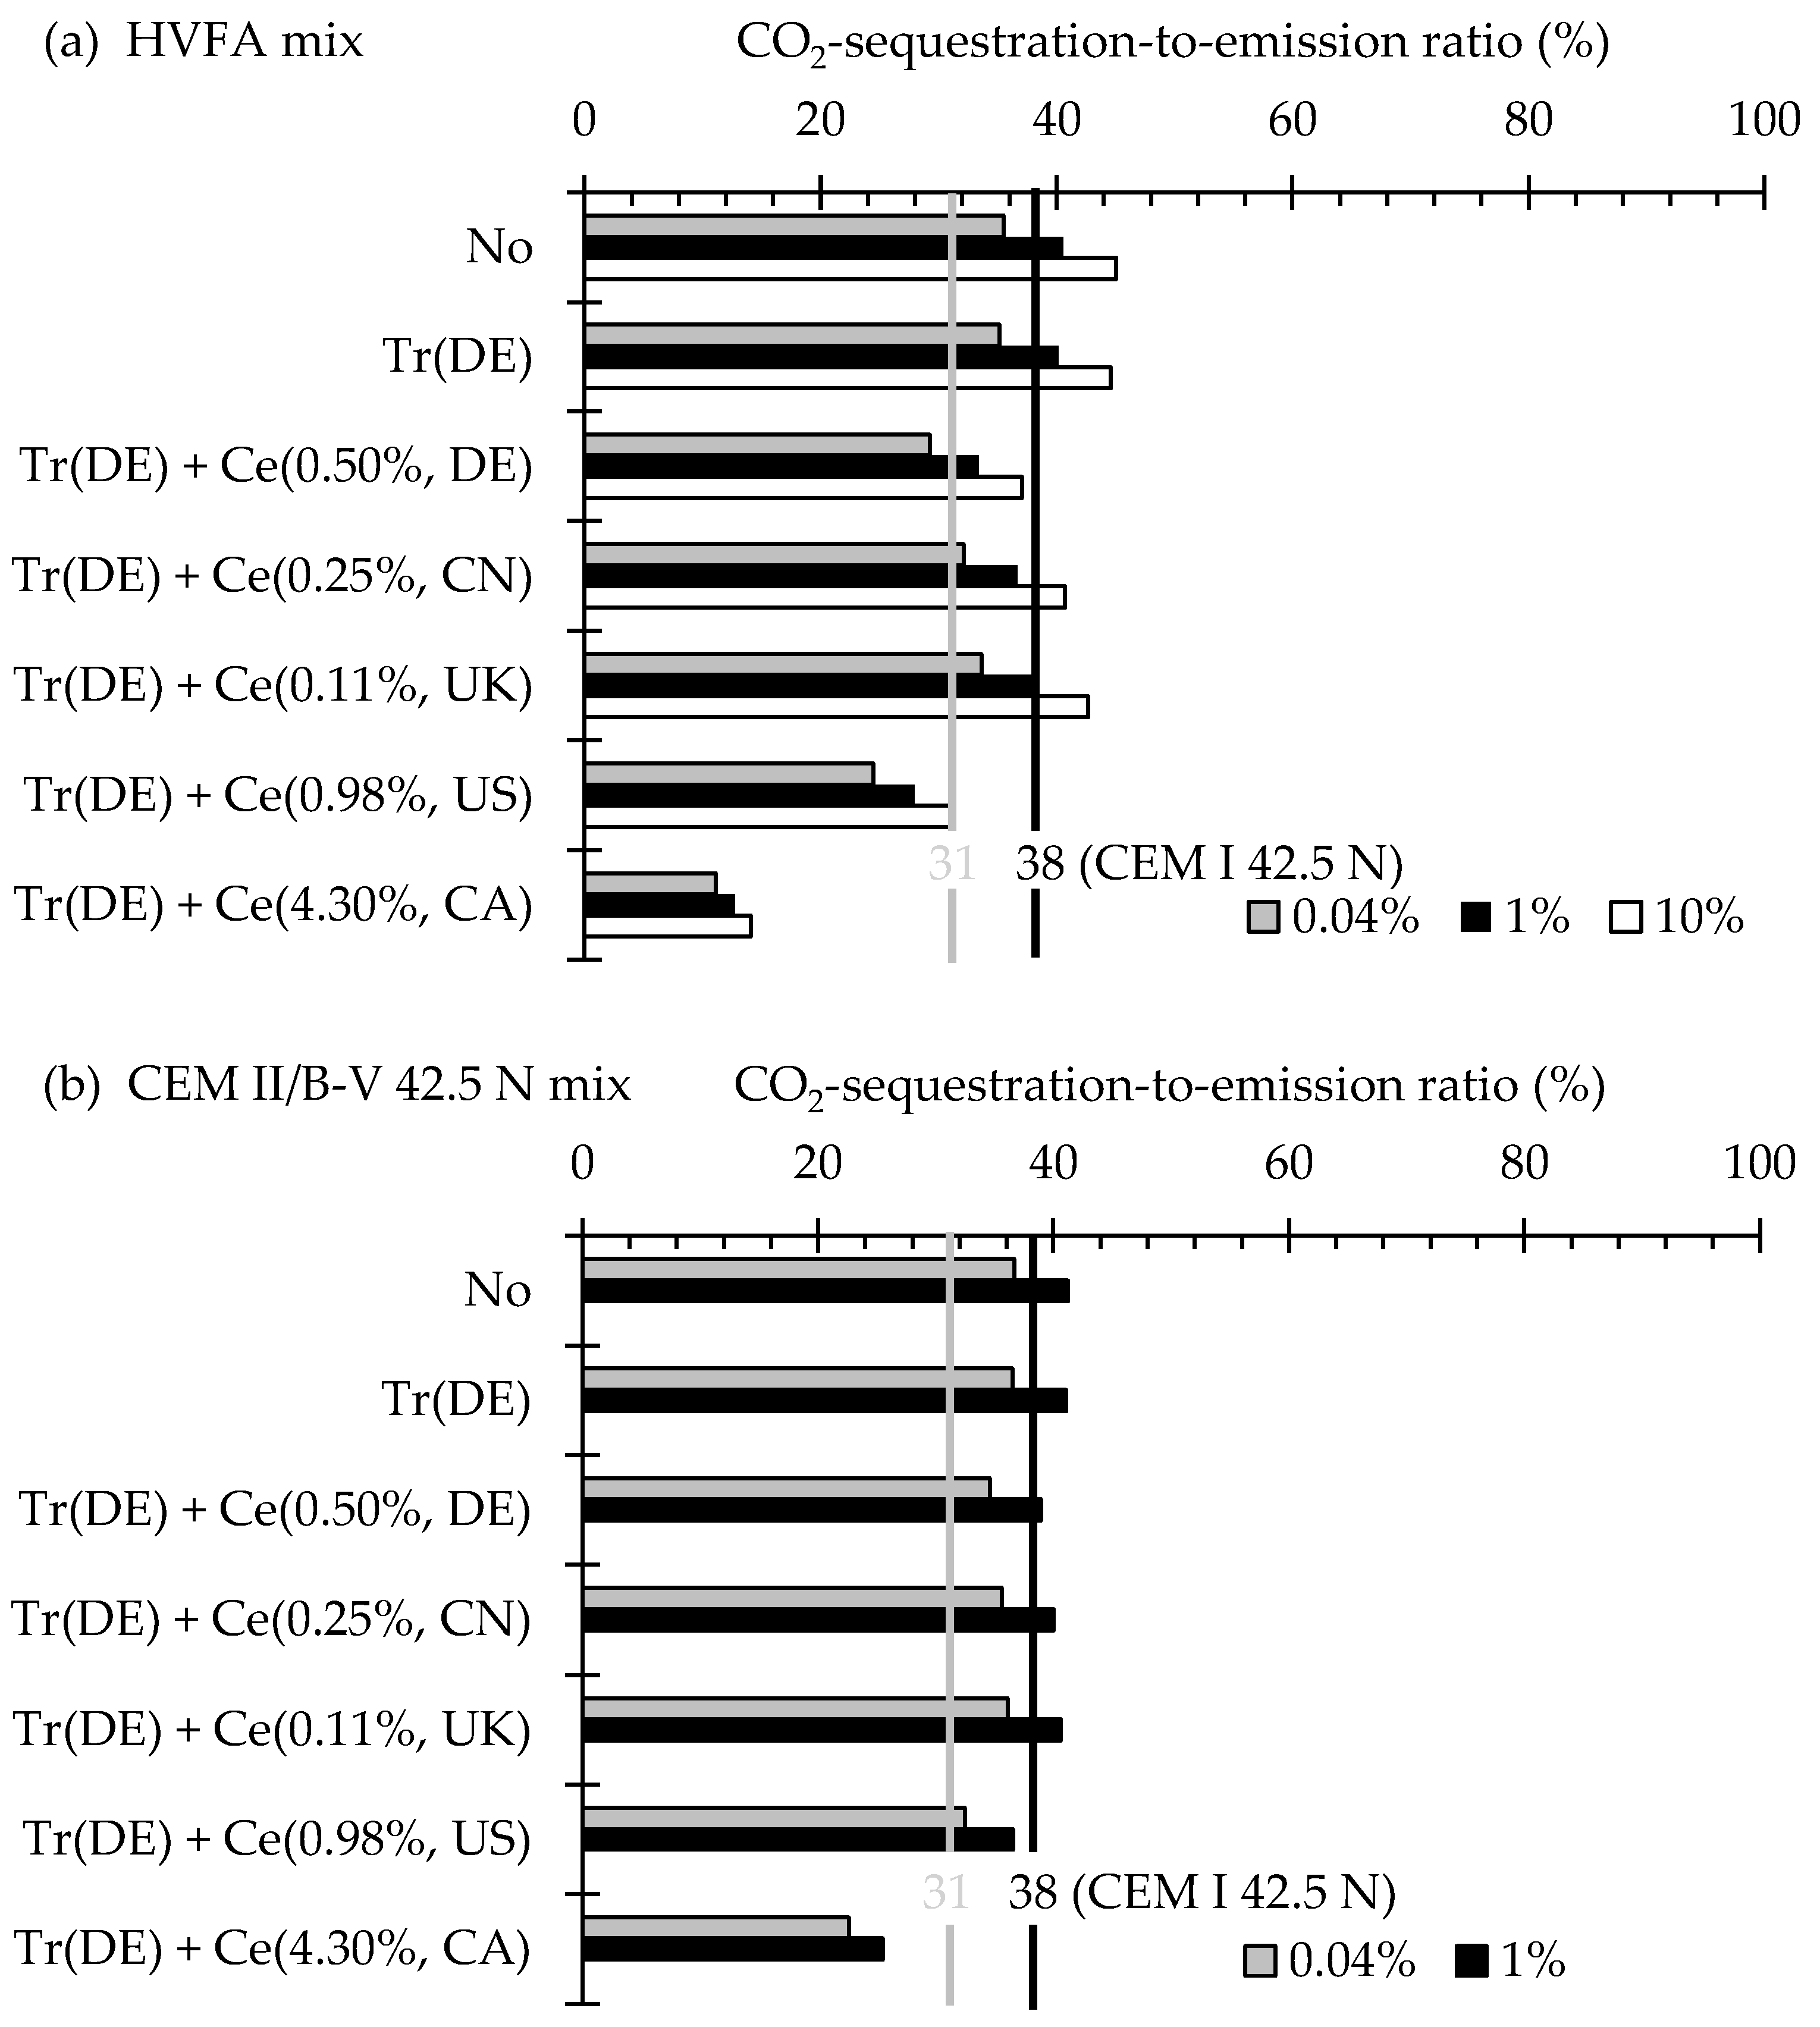
3.5. CO2-Sequestration-to-Emission Ratios

An overall evaluation of sustainability performance in relation to global warming can only be made by considering the CO2 sequestration potential and the greenhouse gases emitted during production together. To achieve this goal CO2SP/EM values were calculated. Figure 4 shows these values for the binder fraction of a generic 1 m3 mortar volume of the HVFA mix (Figure 4a) and the CEM II/B-V 42.5 N mix (Figure 4b) while considering different options of assigning production-related environmental impact to the fly ash.
An assigned impact consisting of both the impact of basic treatment (Tr) and the allocated impact of coal-fired electricity production by economic value (Ce), can result in a substantial decrease of the CO2SP/EM indicator when compared with corresponding values of scenarios considering no impact assignment or mere consideration of only the basic fly ash treatment. As soon as the economic allocation coefficient reaches 0.98% (cf. data of Chen et al. for the US [9], see Table 3), this drop in CO2SP/EM value becomes quite substantial. An economic allocation coefficient of 4.30% cf. Seto et al. [10] for Canadian fly ash causes a drop in CO2-SP/EM value of more than 50% for the HVFA mix. A similar trend was observed for the CEM II/B-V 42.5 N mix, yet be it to a lower extent given the lower fly ash content of the mix. When additionally looking at the effect of the underlying carbonation test conditions, it is clear that accelerated testing at elevated CO2 levels significantly overestimates the CO2SP/EM indicator corresponding with the actual natural exposure conditions. However, it seems that the way of calculating production-related greenhouse gas emissions has a more dominant effect on the outcome of this indicator, than the way of quantifying the CO2 sequestration potential.
Comparison with the expected CO2SP/EM value for the Portland cement reference demonstrates that when based on natural carbonation tests (Figure 4, grey line, CO2SP/EM = 31%), the HVFA mix outperforms the CEM I 42.42.5 N mix, unless the economic allocation coefficient for the fly ash is 0.50% or more (i.e., scenarios Tr(DE)+Ce(DE), Tr(DE)+Ce(US) and Tr(DE)+Ce(CA)). In case of accelerated carbonation at 1% CO2 as underlying test method (Figure 4, black line, CO2-SP/EM = 38%), the CEM I 42.5 N mix gets the benefit over the HVFA mix as soon as the economic allocation coefficient reaches 0.25% (i.e., scenario Tr(DE)+Ce(CN)). For the CEM II/B-V 42.5 N mix with a fly ash content of only 21–35%, a much higher economic allocation coefficient is required before it is outperformed by the Portland cement reference. This was only the case under the assumption of a Ce value of 4.30% (scenario Tr(DE)+Ce(CA)) and carbonation at 0.04% CO2 as underlying test method. When based on slightly accelerated carbonation at 1% CO2, a Ce value of 0.98% (scenario Tr(DE)+Ce(US)) seems to be sufficient already to have a CO2SP/EM value that is lower than the one of the Portland cement reference.
When shifting from generic fully carbonated 1 m3 mortar volumes to time and dimensions specific 1 m3 mortar volumes with a varying carbonation status after 100 years, the CO2SP/EM results are quite different (Figure 5). First of all, CO2SP/EM indicators drop quite spectacularly in value. Values are especially low for the mixes incorporating the commercially available cement CEM II/B-V 42.5 N (±6%) and CEM I 42.5 N (±4%). This is mainly to be attributed to the fact that within a 100-year timeframe there has been only limited progression of the carbonation front, leaving large amounts of carbon material uncarbonated and thus not taking part in CO2 sequestration. At this point, the way of assigning impact to the fly ash for the CEM II/B-V 42.5 N mix becomes quite irrelevant. The same statement holds true when it comes to the underlying carbonation test method (natural vs. slightly accelerated). However, in the case of the HVFA mix, both effects still matter. Depending on the way of assigning impact to the fly ash, the CO2SP/EM ratio still covers quite a broad value range. For Ce values up to 4.30% (scenario Tr(DE)+Ce(CA)), the HVFA mix keeps on showing higher CO2SP/EM values than the Portland cement reference. Accelerated carbonation as an underlying method for potential CO2 sequestration assessment gives substantially lower CO2SP/EM values than natural carbonation. The profound underestimation of the natural carbonation rate when estimated from accelerated tests is mainly causing this. This effect is dominant over the fact that accelerated carbonation is usually responsible for significantly higher carbonation degrees.
Regardless of the adopted approach for calculating the CO2SP/EM indicator, the HVFA mix keeps on holding the benefit over the Portland cement reference by far. One could perhaps make the same statement for the CEM II/B-V 42.5 N mix consisting of a commercially available fly ash based cement. However, the corresponding benefits observed relative to the Portland cement reference are much more limited. From this perspective, it seems worthwhile to aim at high fly ash contents in binder systems. A 21–35% fly ash content seems to give only modest value when it comes to the simultaneous consideration of CO2 sequestration potential and production related greenhouse gas emissions. Furthermore, it should be emphasized that the two considered fly ash based binders are to be preferred over the Portland cement mix. This may not be immediately expected given the lower CO2 buffering capacity of fly ash based binders. Yet, their resulting susceptibility to carbonation ensures larger carbonated binder volume within a typical structure lifespan of 100 years. Furthermore, these binders were found to have substantially larger carbonation degrees within this carbonated volume.

4. Conclusions

CO2 uptake by carbonation during a structure’s lifetime can indeed compensate significantly for the production related greenhouse gas emissions. One should get rid of the idea that this benefit cannot be profoundly exploited for binder systems with low Portland cement/clinker content because of their low CO2 buffering capacity. HVFA binder systems with a low production carbon footprint maintain their ‘green’ properties even when their CO2 sequestration potential is considered as well. Their CO2SP/EM values were higher than those of binders consisting of commercial fly ash based composite cement and regular Portland cement. However, one should be aware of three critical issues.
Firstly, one should avoid accelerated carbonation testing for assessing the CO2 sequestration potentials which heavily depend on actual natural carbonation rates and degrees. Natural carbonation rates derived from carbonation tests at 1% and 10% CO2 underestimate actual natural rates with no less than 29% and 59%, respectively. This underestimation issue also exists for more traditional CEM II/B-V 42.5 N and CEM I 42.5 N based binders, yet to a much lesser extent (only 6.0–7.5%). On the other hand, carbonation degrees estimated from the same accelerated carbonation tests overestimate actual natural carbonation degrees. Obviously, there is need for more reliable conversion methods to go from in-lab observed accelerated carbonation behavior to natural behavior. For this reason, ongoing and future research by the authors is focused on how the conversion formula for carbonation rate of Sisomphon and Franke [15] could be optimized using key carbonation related properties such as CO2 diffusivity, carbonatable material content and effects of excess H2O reactant presence as additional input parameters.
Secondly, production-related CO2 emissions were found to be highly influenced by the way of assigning impact to fly ash. As an industrial by-product, part of its impact should be an allocated portion of the impact of coal-fired electricity production. The most viable option is then impact assigned by economic allocation which is to be added to impact of basic treatment (drying and storage). In this study, this was achieved by considering economic allocation coefficients for Germany (0.50%), China (0.25%), UK (0.11%), US (0.98%) and Canada (4.30%). As soon as Ce ≥ 0.50%, CO2SP/EM for the binder fraction of 1 m3 of fully carbonated HVFA mortar loses advantage over the Portland cement reference.
Thirdly, choosing 1 m3 of fully carbonated mortar as assessment unit may lead to erroneous conclusions. It disregards that CO2 sequestration is usually evaluated against the typical lifetime of a structure (when not considering further intentional carbonation at the end-of-life after demolition). The expected carbonation extent within that time window is key. When considering a more appropriate time and dimensions specific 1 m3 wall element, HVFA binders seem to have the environmental benefit over more traditional commercial binder systems. CO2SP/EM values are then around 20%, while this is only 4–6% for binders consisting of CEM I 42.5 N or CEM II/B-V 42.5 N.

Author Contributions

P.V.d.H. and N.D.B. Conceptualization, P.V.d.H. and N.D.B.; methodology, P.V.d.H.; software, P.V.d.H.; validation, P.V.d.H.; formal analysis, P.V.d.H.; investigation, P.V.d.H.; resources, P.V.d.H.; data curation, P.V.d.H.; writing—original draft preparation, P.V.d.H.; writing—review and editing, N.D.B.; visualization, P.V.d.H.; supervision, N.D.B.; project administration, N.D.B.; funding acquisition, P.V.d.H. and N.D.B. All authors have read and agreed to the published version of the manuscript.

Funding

This research was funded by Research Foundation Flanders (FWO), grant numbers 3E013917 and G062720N.

Data Availability Statement

Raw data in Netzsch-Proteus and SimaPro software for the TGA and LCA based calculations presented in this study are available on request from the corresponding author. The data are not publicly available due to copyright reasons related to the two software applications.

Acknowledgments

The authors would like to thank Els Bruneel from the UGent Department of Chemistry for her assistance with TGA measurements during the COVID-19 lockdown of 2020–2021.

Conflicts of Interest

The authors declare no conflict of interest.

Appendix A

Figure A1. Example of colorimetric carbonation depth assessment after 26 weeks of natural carbonation at 0.04% CO2 on three fractured surfaces of a CEM II/B-V 42.5 N mortar prism using 1% phenolphthalein color indicator.
Applsci 11 02781 g0a1
Figure A2. Example of a thermal decomposition curve as obtained from TGA for CEM I 42.5 N mortar fully carbonated at 1% CO2, with indication of the mass loss due to decarbonation using the tangent method and the residual mass of the powdery sample.
Applsci 11 02781 g0a2
Table A1. Life cycle inventory for basic fly ash treatment (drying + storage) cf. Chen et al. [7], yet updated to be in compliance with ecoinvent 3.4.
Outputs to TechnosphereAmountUnit
FA (DE) Treatment1kg
Inputs from TechnosphereAmountUnit
Electricity, medium voltage (DE)|market for|Cut-off, U6.82 × 10−3kWh
Natural gas, high pressure (DE)|market for|Cut-off, U7.57 × 10−3m3
Diesel (Europe without Switzerland)|market for|Cut-off, U8.57 × 10−4kg
Transport, freight, lorry > 32 metric ton, euro6 (RER)|market for Transport, freight, lorry > 32 metric ton, EURO6|Cut-off, U3.00 × 10−3tkm
Emissions to airAmountUnit
Particulates3.23 × 10−5kg
Sulfur oxides9.13 × 10−8kg
Nitrogen oxides1.75 × 10−5kg
Carbon monoxide9.05 × 10−6kg
Outputs to Technosphere: Waste and emissions to treatmentAmountUnit
Fly ash and scrubber sludge (Europe without Switzerland)|market for fly ash and scrubber sludge|Cut-off, U8.48 × 10−5kg

References

  1. Masson-Delmotte, V.; Zhai, P.; Portner, H.-O.; Roberts, D.; Skea, J.; Shukla, P.R.; Pirani, A.; Moufouma-Okia, W.; Pean, C.; Pidcock, R. (Eds.) Global Warming of 1.5 °C, An IPCC Special Report on the Impacts of Global Warming of 1.5 °C above Pre-Industrial Levels and Related Global Greenhouse Gas Emission Pathways in the Context of Strengthening the Global Response to the Threat of Climate Change, Sustainable Development, and Efforts to Eradicate Poverty; Intergovernmental Panel on Climate Change: Geneva, Switzerland, 2018. [Google Scholar]
  2. Andrew, R.M. Global CO2 emissions from cement production, 1928–2017. Earth Syst. Sci. Data 2018, 10, 2213–2239. [Google Scholar] [CrossRef] [Green Version]
  3. Van den Heede, P.; De Belie, N. CO2 sequestration potential of High-Volume Fly Ash (HVFA) mortar when based on accelerated carbonation tests. In Proceedings of the International Workshop on CO2 Storage in Concrete (CO2STO2019), Marne La Vallée, France, 24–25 June 2019; Djerbi, A., Omikrine-Metalssi, O., Fen-Chong, T., Eds.; IFFSTAR: Marne La Vallée, France, 2019; pp. 186–192. [Google Scholar]
  4. Xi, F.; Davis, S.J.; Ciais, P.; Crawford-Brown, D.; Guan, D.; Pade, C.; Shi, F.X.T.; Syddall, D.C.-B.M.; Lv, J.; Ji, L.; et al. Substantial global carbon uptake by cement carbonation. Nat. Geosci. 2016, 9, 880–883. [Google Scholar] [CrossRef] [Green Version]
  5. Van den Heede, P.; De Belie, N. Environmental impact and life cycle assessment (LCA) of traditional and ‘green’ concretes: Literature review and theoretical calculations. Cem. Concr. Compos. 2012, 34, 431–442. [Google Scholar] [CrossRef]
  6. Van den Heede, P. Durability and Sustainability of Concrete with High Volumes of Fly Ash. Ph.D. Thesis, Ghent University (UGent), Ghent, Belgium, 2014. [Google Scholar]
  7. Chen, C.; Habert, G.; Bouzidi, Y.; Jullien, A.; Ventura, A. LCA allocation procedure used as an incitative method for waste recycling: An application to mineral additions in concrete. Resour. Conserv. Recycl. 2010, 54, 1231–1240. [Google Scholar] [CrossRef] [Green Version]
  8. Hafez, H.; Kurda, R.; Cheung, W.M.; Nagaratnam, B. Comparative life cycle assessment between imported and recovered fly ash for blended cement concrete in the UK. J. Clean. Prod. 2020, 244, 9. [Google Scholar] [CrossRef]
  9. Chen, X.; Wang, H.; Najm, H.; Venkiteela, G.; Hencken, J. Evaluating engineering properties and environmental impact of pervious concrete with fly ash and slag. J. Clean. Prod. 2019, 237, 11. [Google Scholar] [CrossRef]
  10. Seto, K.E.; Churchill, C.J.; Panesar, D.K. Influence of fly ash allocation approaches on the life cycle assessment of cement-based materials. J. Clean. Prod. 2017, 157, 65–75. [Google Scholar] [CrossRef]
  11. Van den Heede, P.; De Schepper, M.; De Belie, N. Accelerated and natural carbonation of concrete with high volumes of fly ash: Chemical, mineralogical and microstructural effects. R. Soc. Open Sci. 2019, 6, 181665. [Google Scholar] [CrossRef] [PubMed] [Green Version]
  12. Van den Heede, P.; Thiel, C.; De Belie, N. Natural and accelerated carbonation behaviour of high-volume fly ash (HVFA) mortar: Effects on internal moisture, microstructure and carbonated phase proportioning. Cem. Concr. Compos. 2020, 113, 103713. [Google Scholar] [CrossRef]
  13. Saetta, A.V.; Vitaliani, R.V. Experimental investigation and numerical modeling of carbonation process in reinforced concrete structures. Cem. Concr. Res. 2004, 34, 571–579. [Google Scholar] [CrossRef]
  14. Von Greve-Dierfeld, S.; Lothenbach, B.; Vollpracht, A.; Wu, B.; Huet, B.; Andrade, C.; Medina, C.; Thiel, C.; Gruyaert, E.; Vanoutrive, H. Understanding the carbonation of concrete with supplementary cementitious materials—A critical review by RILEM TC 281-CCC. Mater. Struct. 2020, 53, 34. [Google Scholar] [CrossRef]
  15. Sisomphon, K.; Franke, L. Carbonation rates of concretes containing high volume of pozzolanic materials. Cem. Concr. Res. 2007, 37, 1647–1653. [Google Scholar] [CrossRef]
  16. Wang, L.; Chen, L.; Provis, J.L.; Tsang, D.C.; Poon, C.S. Accelerated carbonation of reactive MgO and Portland cement blends under flowing CO2 gas. Cem. Concr. Compos. 2020, 106, 103489. [Google Scholar] [CrossRef]
  17. Wang, L.; Chen, L.; Tsang, D.C.; Guo, B.; Yang, J.; Shen, Z.; Hou, D.; Ok, Y.S.; Poon, C.S. Biochar as green additives in cement-based composites with carbon dioxide curing. J. Clean. Prod. 2020, 258, 120678. [Google Scholar] [CrossRef]
  18. Siauciunas, R.; Hilbig, H.; Prichockiene, E.; Smigelskyte, A.; Takulinskas, Z. Accelerated carbonation of C2SH based dense concrete. Ceram. Int. 2020, 46, 29436–29442. [Google Scholar] [CrossRef]
  19. Bureau for Standardization (NBN). NBN EN 196-1: 2016, Methods of Testing Cement—Part 1: Determination of Strength; NBN: Brussels, Belgium, 2016. [Google Scholar]
  20. Bureau for Standardization (NBN). NBN EN 206: 2013 + A1: 2016, Concrete—Specification, Performance, Production and Conformity; NBN: Brussels, Belgium, 2016. [Google Scholar]
  21. Lammertijn, S.; De Belie, N. Porosity, gas permeability, carbonation and their interaction in high-volume fly ash concrete. Mag. Concr. Res. 2008, 60, 535–545. [Google Scholar] [CrossRef]
  22. Bureau for Standardization (NBN). NBN EN 197-1, 17. Cement—Part 1: Composition, Specifications and Conformity Criteria for Common Cements; NBN: Brussels, Belgium, 2011. [Google Scholar]
  23. Durdziński, P.T.; Ben Haha, M.; Bernal, S.A.; De Belie, N.; Gruyaert, E.; Lothenbach, B.; Méndez, E.M.; Provis, J.L.; Schöler, A.; Stabler, C.; et al. Outcomes of the RILEM round robin on degree of reaction of slag and fly ash in blended cements. Mater. Struct. 2017, 50, 135. [Google Scholar] [CrossRef]
  24. Netzsch Proteus–Thermal Analysis; Version 6.1; Computer Software; Netzsch Proteus: Selb, Germany, 2018.
  25. Lothenbach, B.; Durdzinski, P.T.; De Weerdt, K. Thermogravimetric analysis. In A Practical Guide to Microstructural Analysis of Cementitious Materials, 1st ed.; Scrivener, K., Snellings, R., Lothenbach, B., Eds.; CRC Press, Taylor & Francis Group: Boca Raton, FL, USA, 2016; pp. 178–213. [Google Scholar]
  26. Baert, G. Physico-Chemical Interactions in Portland Cement-(High Volume) Fly Ash Binders. Ph.D. Thesis, Ghent University (UGent), Ghent, Belgium, 2011. [Google Scholar]
  27. Lagerblad, B. Carbon Dioxide Uptake During Concrete Life Cycle—State of the Art, Nordic Innovation Centre Project NI-Project 03018-CO2 Uptake during the Concrete Life Cycle; Cement och Betong Institutet: Stockholm, Sweden, 2005; p. 48. [Google Scholar]
  28. SimaPro; Version 9.1.1.1; Equipped with Ecoinvent 3.4 Database, Computer Software; PRé Sustainability: Amersfoort, The Netherlands, 2020.
  29. European Union. Directive 2008/98/EC of the European parliament and the council of 19 November 2008 on waste and repealing certain directives. Off. J. Eur. Union 2008, L312, 3–20. [Google Scholar]
  30. ISO. ISO 14040, Environmental Management—Life Cycle Assessment—Principles and Framework; ISO: Geneva, Switzerland, 2006. [Google Scholar]
  31. ISO. ISO 14044, Environmental Management—Life Cycle Assessment—Requirements and Guidelines; ISO: Geneva, Switzerland, 2006. [Google Scholar]
  32. Thiery, M.; Villain, G.; Dangla, P.; Platret, G. Investigation of the carbonation front shape on cementitious materials: Effects of the chemical kinetics. Cem. Concr. Res. 2007, 37, 1047–1058. [Google Scholar] [CrossRef]
Figure 1. CaCO3 content (% m/m relative to the binder) and carbonation degree ac (%) for the HVFA mortar (a,b), CEM II/B-V 42.5 N mortar (c,d), and CEM I 42.5 N mortar (e,f). Error bars correspond with the standard deviation on the mean (n = 3).
Applsci 11 02781 g001
Figure 2. CO2 sequestration potential CO2SP (kg/m3) for the binder fraction of a generic 1 m3 and a 100-year timeframe, dimensions specific 2.24 × 2.24 × 0.20 m3 = 1 m3 volume of the HVFA mortar (a), CEM II/B-V 42.5 N mortar (b) and CEM I 42.5 N mortar (c), as obtained from natural (0.04% CO2), slightly accelerated (1% CO2) and highly accelerated carbonation (10% CO2). Error bars correspond with the standard deviation on the mean (n = 3).
Applsci 11 02781 g002
Figure 3. Production-related global warming potential GWP (kg CO2 eq) for the binder fraction of 1 m3 of the HVFA mortar (a) and CEM II/B-V 42.5 N mortar (b) in relation to the one of reference CEM I 42.5 N mortar, using various approaches for assigning impact for their fly ash content: No impact (No), impact of basic treatment (Tr), impact of basic treatment and economic allocation (Tr + Ce).
Applsci 11 02781 g003
Figure 4. CO2-sequestration-to-emission ratios for the binder fraction of 1 m3 of the HVFA mortar (a) and CEM II/B-V 42.5 N mortar (b) in relation to the one of reference CEM I 42.5 N mortar, using various approaches for assigning impact for their fly ash content: No impact (No), impact of basic treatment (Tr), impact of basic treatment and economic allocation (Tr + Ce).
Applsci 11 02781 g004
Figure 5. CO2-sequestration-to-emission ratios for the binder fraction of a 100-year timeframe, dimensions specific 2.24 × 2.24 × 0.20 m3 = 1 m3 of the HVFA mortar (a) and CEM II/B-V 42.5 N mix (b) in relation to the one of reference CEM I 42.5 N mortar, using various approaches for assigning impact for their fly ash content: No impact (No), impact of basic treatment (Tr(DE)), impact of basic treatment and economic allocation (Tr + Ce).
Applsci 11 02781 g005
Table 1. Chemical and mineralogical composition (% m/m), loss on ignition (% m/m), Blaine fineness (m2/kg), 45 µm fineness (% m/m) and density (kg/m3) of the binder materials used, and 2-day and 28-day compressive strength requirements (MPa) for the cements used.
CEM I 52.5 NFly AshCEM II/B-V 42.5 NCEM I 42.5 N
CaO62.883.1549.2863.12
SiO218.2456.0528.2620.32
Al2O35.3122.628.954.60
Fe2O34.146.924.323.30
MgO1.281.861.901.92
K2O0.381.860.910.61
Na2O0.440.710.370.26
SO33.150.322.643.20
CO22.150.901.200.98
LOI2.612.331.861.69
Blaine fineness408-413264
45 µm fineness-22.5--
Density3100220028903160
2-day strength≥20-≥10≥10
28-day strength≥52.5-≥42.5≥42.5
Table 2. Mix designs of the studied mortar mixes.
High-Volume Fly Ash (HVFA) Mix *CEM II/B-V 42.5 N MixCEM I 42.5 N Mix
Sand1419.851449.641471.08
Cement 236.64483.21490.36
Fly ash236.64--
Water260.31265.77269.70
* consisting of 50% fly ash and 50% CEM I 52.5 N by mass.
Table 3. Overview of the considered economic allocation coefficients (Ce) for fly ash from literature.
SourceCe (%)CountryYear
Hafez et al. [8]0.50Germany2020
Hafez et al. [8] 0.25China2020
Hafez et al. [8]0.11United Kingdom2020
Chen et al. [9]0.98United States2019
Seto et al. [10]4.30Canada2017
Table 4. Experimental natural/accelerated carbonation rates and estimated natural carbonation rates from accelerated tests at 1% (and 10%) CO2 using Equation (1) for the HVFA mortar mix, the CEM II/B-V 42.5 N mix and the CEM I 42.5 N mix.
HVFA Mix0.04% CO21% CO210% CO2
Experimental. Anat or Aacc (mm/√weeks)2.12 (R2: 0.92)7.54 (R2: 0.92)13.94 (R2: 0.95)
Experimental */estimated ** Anat (mm/√years)15.29 *10.89 **6.35 **
CEM II/B-V 42.5 N Mix0.04% CO21% CO210% CO2
Experimental. Anat or Aacc (mm/√weeks)0.43 (R2: 0.99)2.02 (R2: 1.00)-
Experimental */estimated ** Anat (mm/√years)3.10 *2.91 **-
CEM I 42.5 N Mix0.04% CO21% CO210% CO2
Experimental. Anat or Aacc (mm/√weeks)0.32 (R2: 0.95)1.48 (R2: 0.95)-
Experimental */estimated ** Anat (mm/√years)2.31 *2.13 **-
Publisher’s Note: MDPI stays neutral with regard to jurisdictional claims in published maps and institutional affiliations.

