
Numerical Analysis of the Beam-Column Resistance Compared to Methods by European Standards


Department of Structures and Bridges, Faculty of Civil Engineering, University of Žilina, Univerzitná 8215/1, 010 26 Žilina, Slovakia
*
Author to whom correspondence should be addressed.
Appl. Sci. 2021, 11(7), 3269; https://0-doi-org.brum.beds.ac.uk/10.3390/app11073269
Submission received: 18 February 2021
/
Revised: 14 March 2021
/
Accepted: 17 March 2021
/
Published: 6 April 2021
(This article belongs to the Special Issue Advances on Structural Engineering, Volume II)
Abstract
:The optimisation of the design method for verification of slender steel beam-columns is still a current issue not only from scientific point of view, but also for design practice. Therefore, the main objective of this paper is comparison of the suitability of established design approaches, according to the European standards for steel and aluminium structures, on the basis of numerical simulations. Thus, a finite element model was validated on the basis of experimental analysis available in the scientific literature. To perform the comparison of accuracy of design approaches according to European standards, a commercial software program ANSYS was used for observation of the resistances of beam-columns. The resistance of european I beams with parallel flanges (IPE) and a rectangular hollow cross-section (RHS) were investigated for four load cases on a simply supported member and also on a pinned-fixed beam column with linear bending moment distribution, where the resistance of the cross-section governs. Finally, the conclusions for suitability of the respective design approaches are discussed, together with some findings that arose from this work.
1. Introduction
The high strength properties of steel are one of the greatest advantages of constructional steel compared to the other materials used in civil engineering, and allows us to design lighter, slender and, therefore, more economical structures. However, the material’s utilization is also reaching its limits. The resistance of steel members subjected to a combination of axial compressive forces and bending moments, the so-called beam columns, is affected by stability problems, which occur with increasing slenderness of structural elements. The basis of this scientific discipline was set by Euler in the 18th century [1]. Since then, thanks to the hard work of researchers dealing with buckling phenomena, development in this field of study has gone a long way, as various design approaches have been developed to include these phenomena into design calculations.
The equivalent column method was adopted in European standards for design of steel members subjected to an axial compressive force and bending moment about either or both principal axes of cross-section, as summarised in papers [2,3,4]. This design approach is simple and general for a wide range of applicability. On the other hand, these attributes cause the loss of accuracy in a variety of load cases, and discrepancies can occur due to the complexity of creation of the equivalent member. Therefore, a huge amount of effort is still dedicated by researchers to either optimise or replace this design procedure, which recently resulted in the development of several alternative design approaches.
The first alternative method for verification of beam columns susceptible to out-of-plane buckling was proposed by Tankova et al. [5,6], on the basis of a derivation performed by Szalai and Papp [7]. The result of this derivation was a design formula based on the well-known Ayrton-Perry format. However, as the authors themselves acknowledged that for practical applications the proposal for in-plane buckling of beam-columns has to be derived, covering the combined effects of in-plane and lateral torsional buckling modes [5].
The overall interaction concept [8], the direct strength method [9] and continuous strength method [10] are other design methods, which are being currently developed. These design methods are based on a similar approach to the general method included in clause 6.3.4 of EN 1993-1-1:2005 [11], which uses generalised relative slenderness as the key parameter for interaction between resistance and instability. The main advantages of these design methods are their ability to account for beneficial strain hardening effects of stocky members and avoidance of complex and burdensome calculation of effective cross-sectional properties in the case of local buckling of slender cross-sections.
Nowadays, as more sophisticated numerical software is commonly used in design practice, the possibility of inclusion of local and global imperfections [12,13,14] directly into numerical analysis is more relevant. So, as the imperfections are already included in the nonlinear global analysis, the consecutive verification for stability effects is not necessary. However, this advantage seems to be less significant with the growing complexity and size of the numerical models, because in these cases the computational time is markedly increasing.
It seems that the design method of Eurocode 9 has been forgotten in the shadow of the aforementioned design methods. Even though aluminium and steel are two different materials, because of their similar mechanical behaviour similarities in the concepts of calculating aluminium and steel constructions can be seen. The possibility of application of a unified design method according to Eurocode 9 [15] was, therefore, presented for steel members by Höglund [16]. The fact that this design method was originally used for verification of steel members in Sweden is another proof for its possible utilization for steel members.
A few comparable studies between this design method and the equivalent column method can be found in [16], but extensive comparison between the design methods of Eurocode 3 and Eurocode 9 is missing. The aim of this paper is to reduce this gap, compare the accuracy of the two design methods by geometrically and materially nonlinear analysis with imperfections (GMNIA), summarize the benefits and disadvantages of the unified design method of Eurocode 9, and assess the possibility of application of this design method for steel structures.
2. Numerical Analysis
Modern numerical methods are commonly used to study a wide range of civil engineering problems [17,18,19,20], as they are able to a burdensome and, in most cases financially unfeasible, experimental methods. One of the greatest advantages of numerical analysis is that it allows the isolation of the governing parameters. Therefore, the commercial finite element software ANSYS [21] was used for comparison of the equivalent column method and the unified method according to Eurocode 9. Because the objective of this paper is to compare these two approaches, the same members and material properties of steel were used to determine the analytical member resistances according to these approaches. Members with IPE 100 and RHS 200/100/10 cross-sections were used in this analysis to simulate the behaviour of sections susceptible and not susceptible to fail in lateral-torsional buckling mode. Both sections belong to the 1.class of cross-section classification.
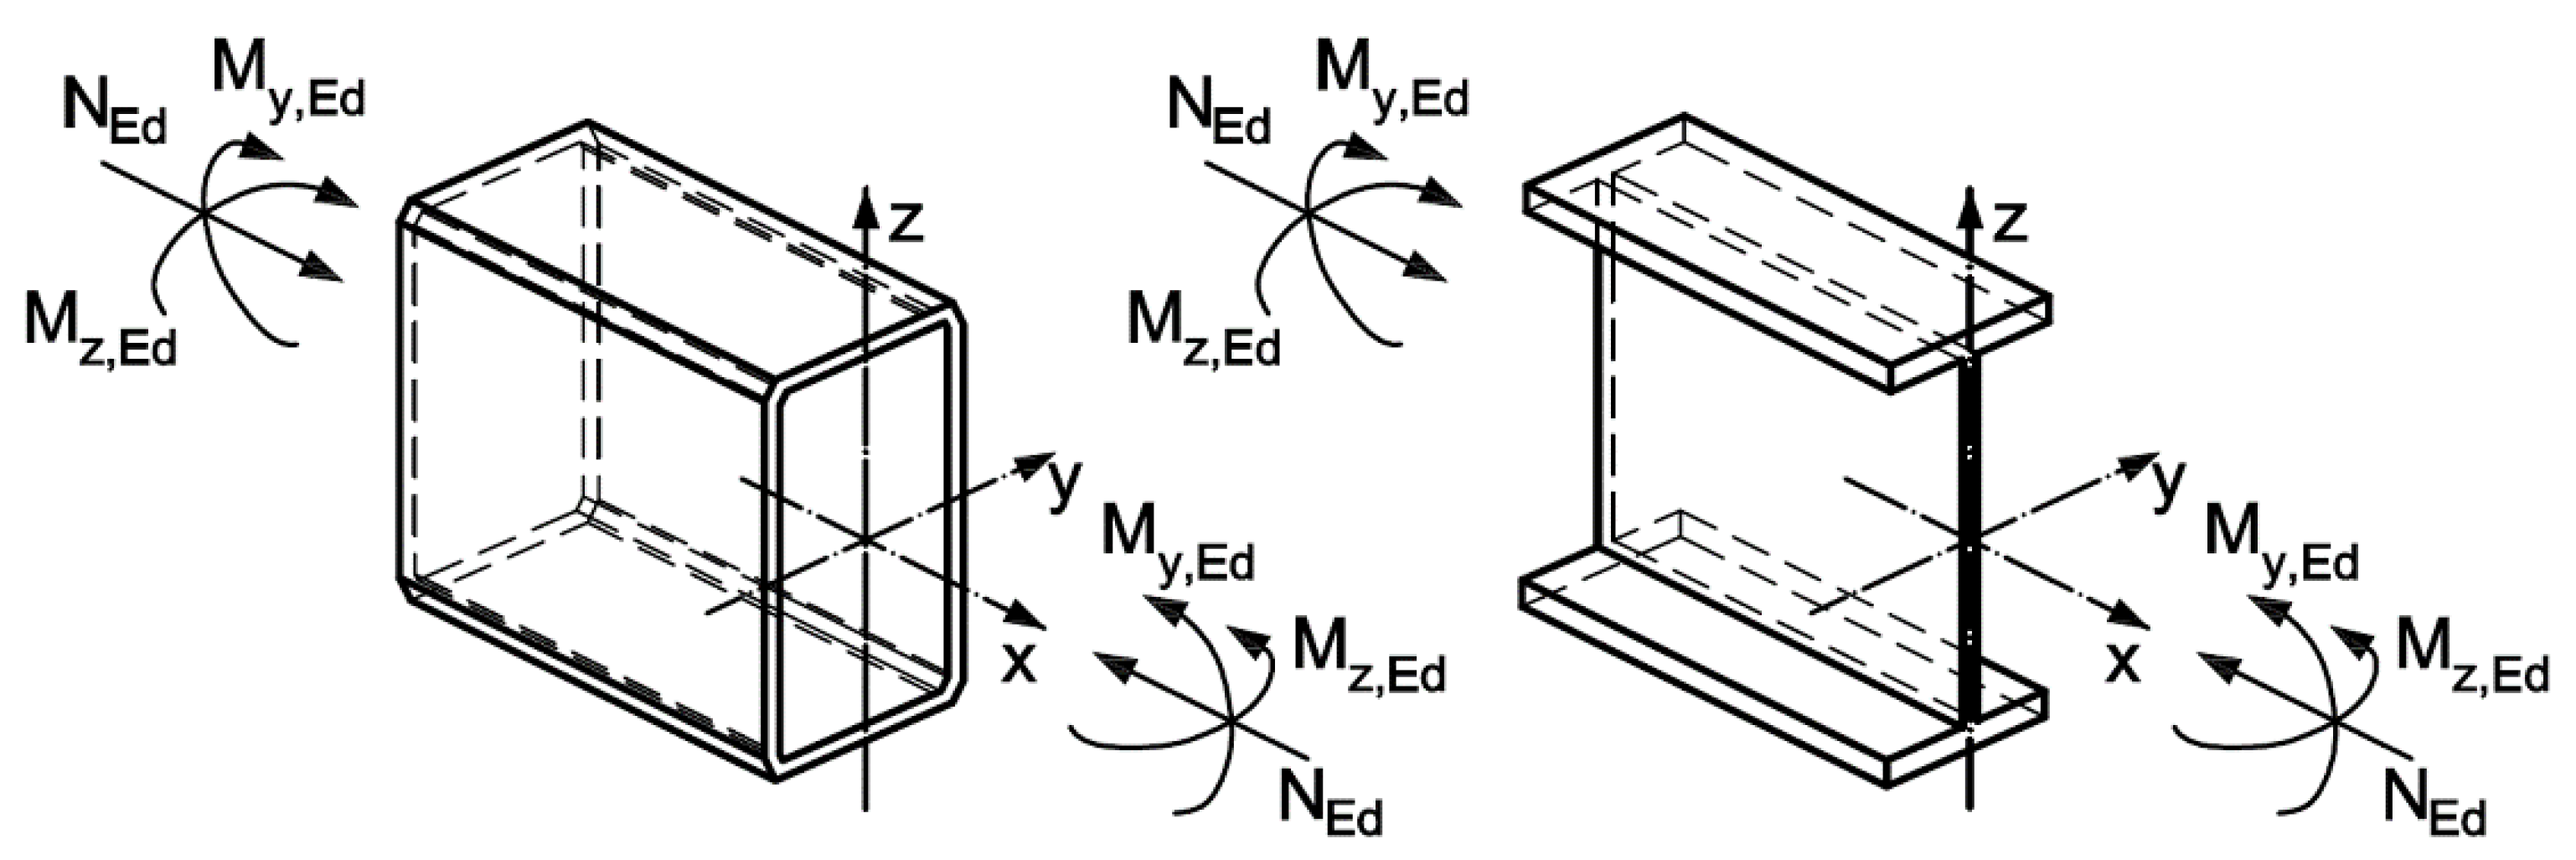
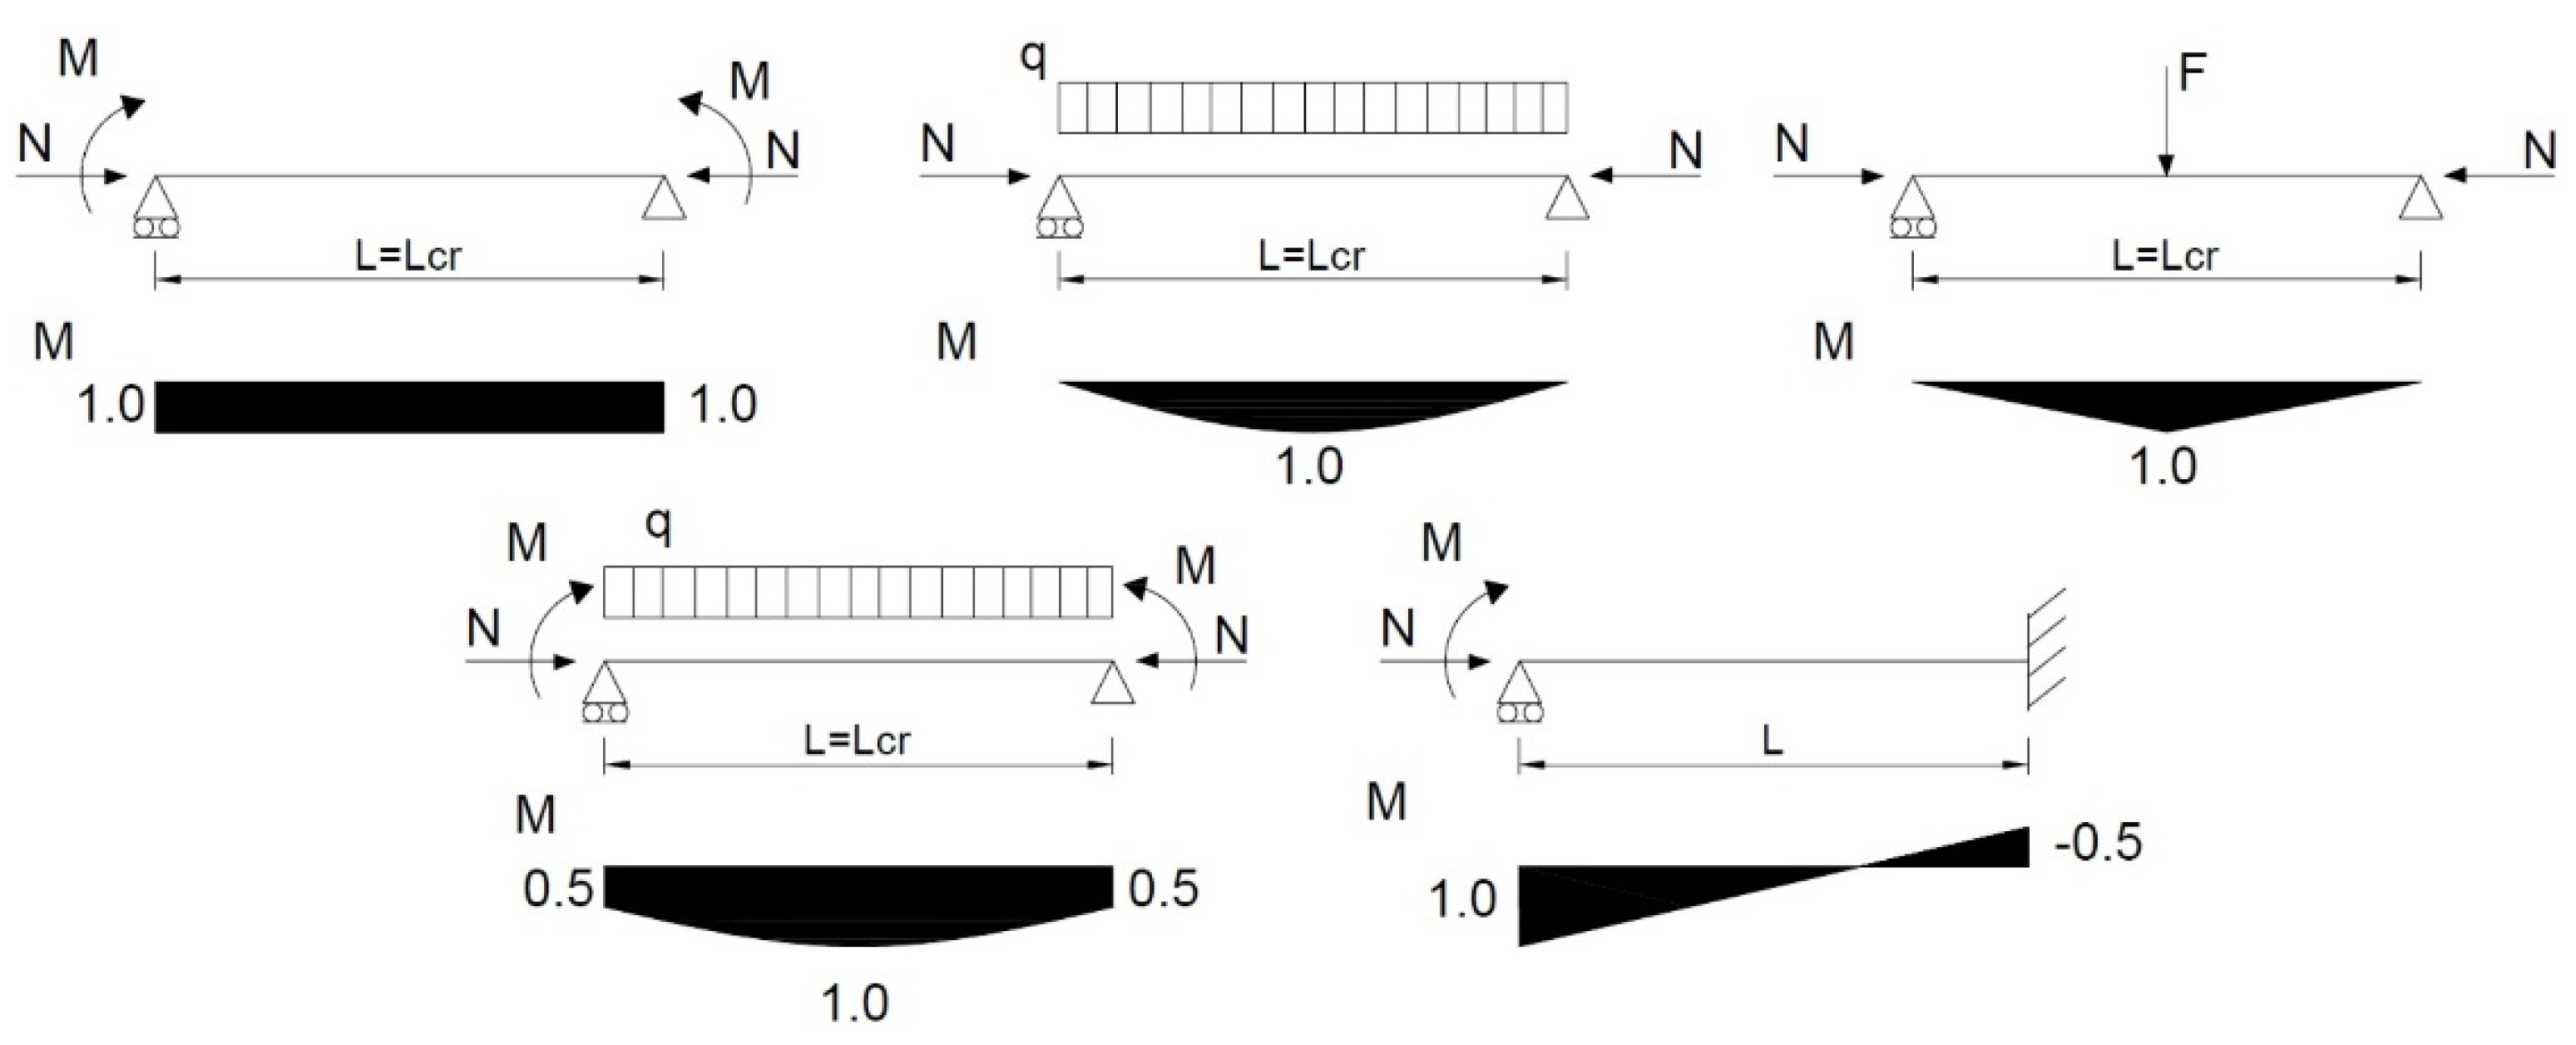
The members were subjected to a combination of axial compressive force and uniaxial bending moment about both cross-sectional axes separately (NEd + My,Ed, NEd + Mz,Ed). The definition of the cross-sectional axes for the appropriate type of cross-sections can be found in in Figure 1. Five different load cases were studied, four on simply supported member and one on a pinned-fixed beam-column, as seen in Figure 2. These load cases represent some of the elementary load cases, which are used by the equivalent column method to transform the buckling case of members with different boundary conditions to the standard case of a simply supported member using an appropriate beam-column model. The transformation of a pinned-fixed beam column to a simply supported member with linear bending moment gradient is also presented using this method.
The ultimate resistances for these load cases were investigated for both in-plane (y-y, z-z) and also for out-of-plane buckling modes. To represent a wide range of results, four nondimensional slenderness ratios were observed.
2.1. Finite Element Modelling
The assumptions for finite element modeling (FEM) are presented. However, as the concept of modelling is similar for both IPE and RHS cross-sections, the assumptions for members with an IPE cross-section are presented, mentioning only differences for members with RHS cross-section in the Section 3.2.
The shell element SHELL181 was used for the FE model. This is a four-node element with six degrees of freedom in every node and is applicable for nonlinear analysis including large strain and/or large rotation problems. Five integration points through the element layer were used, as only one layer through element thickness was assumed in the model. Since the objective of the numerical analysis was to determine ultimate beam-column resistances, the Newton-Raphson iteration method was chosen for the calculation. The cross-section parts consisted of twelve elements per flange width and twenty elements for web height.
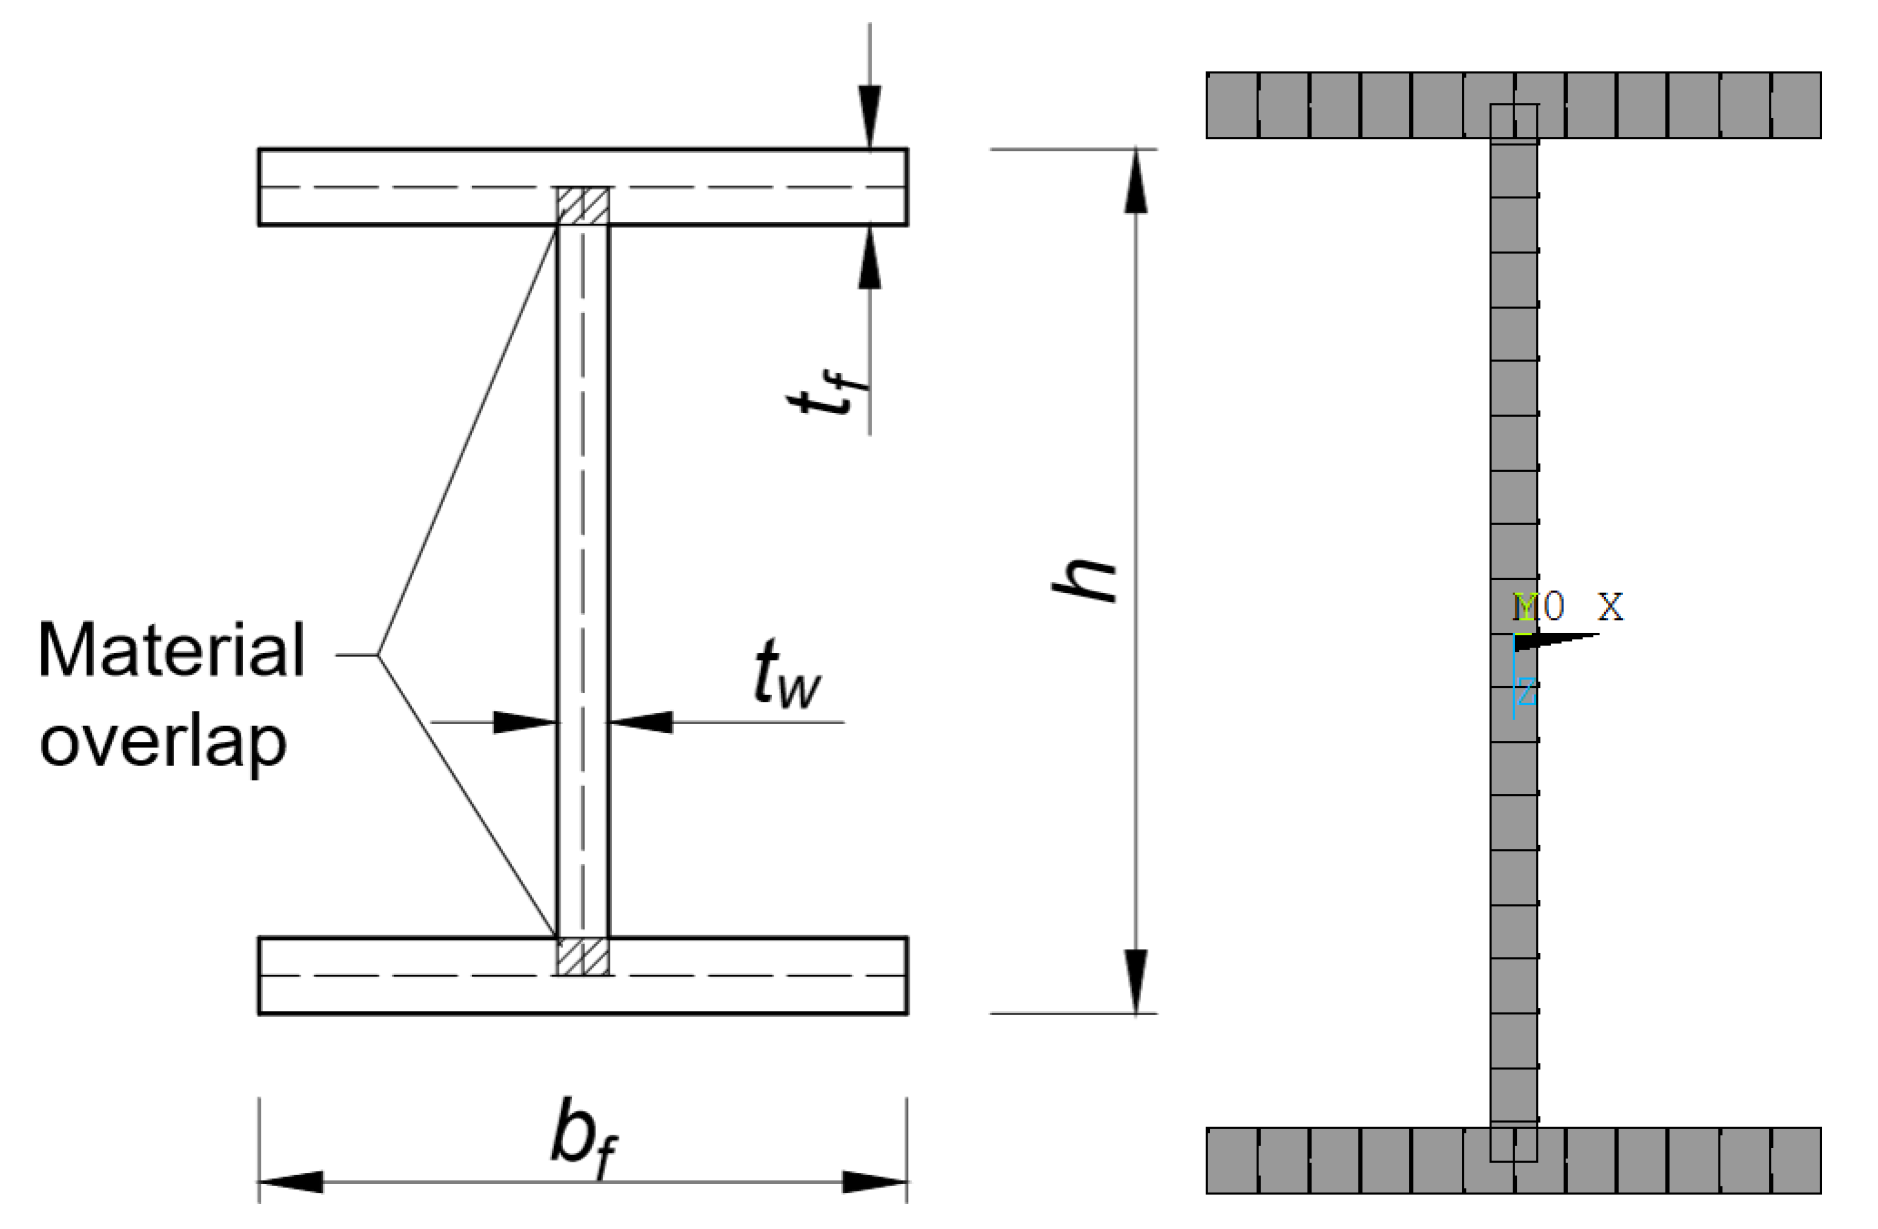
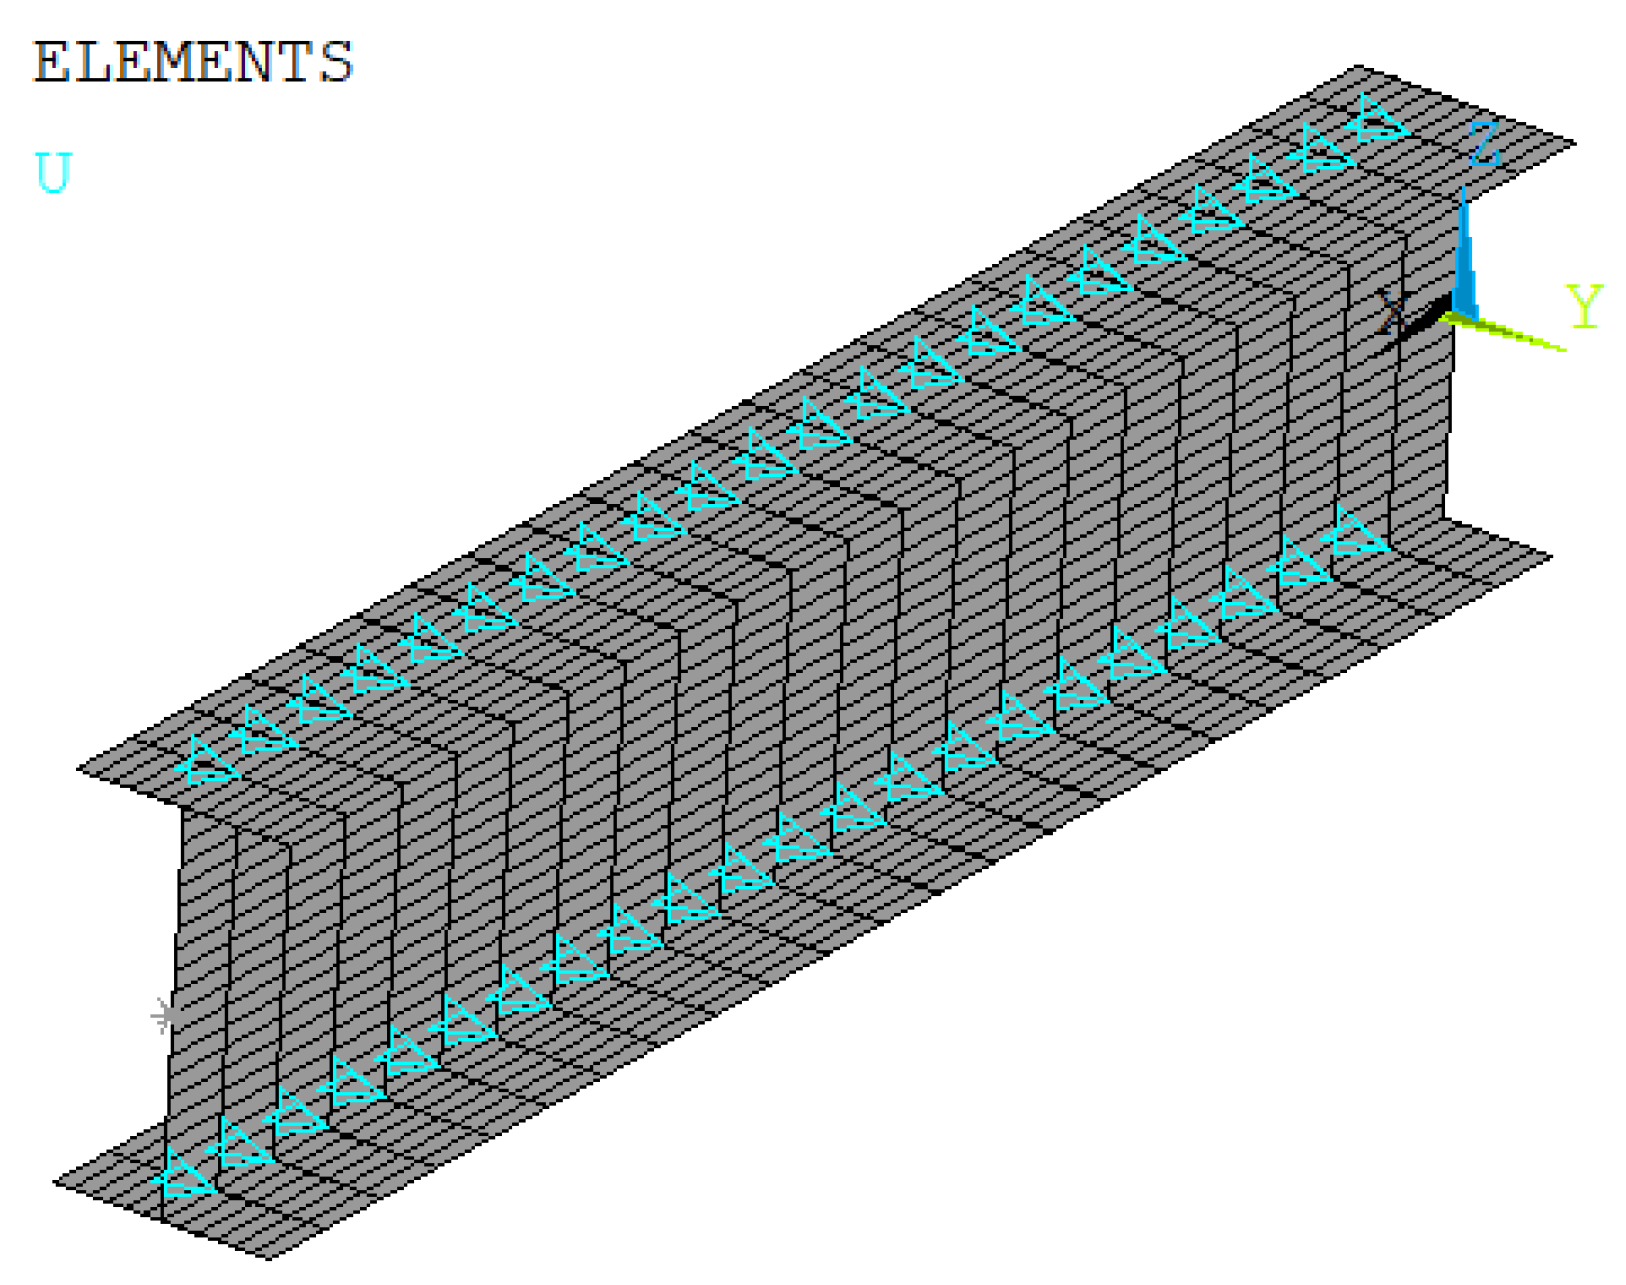
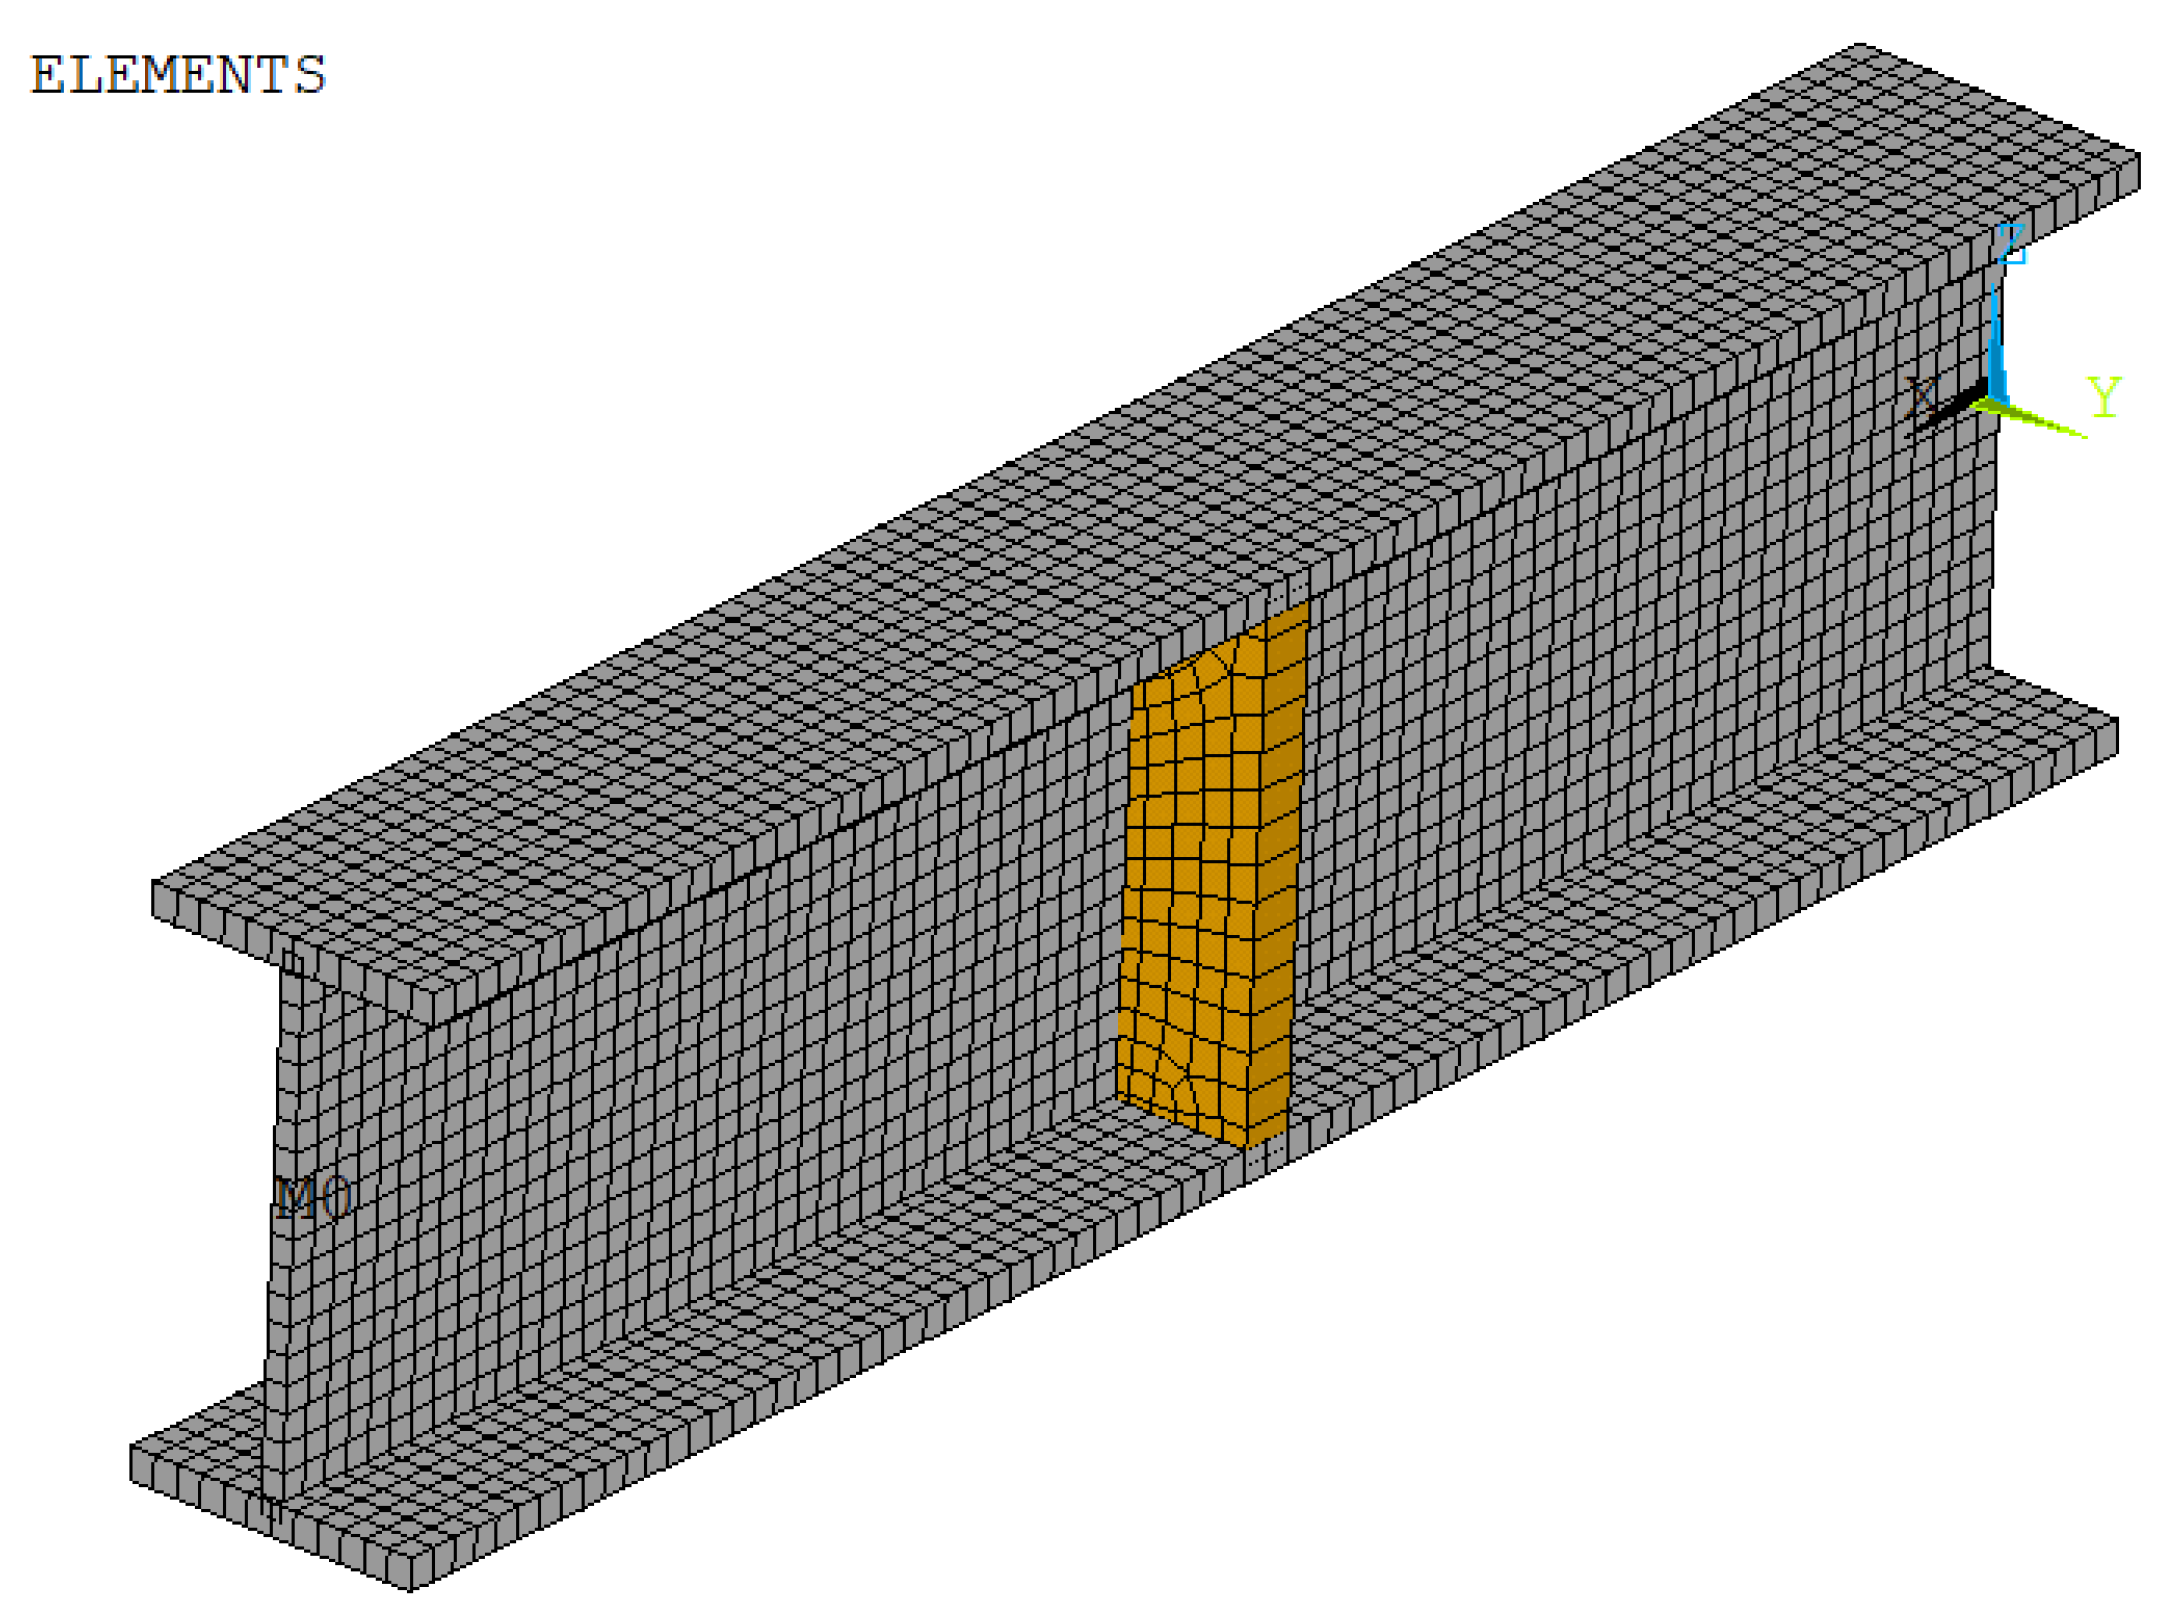
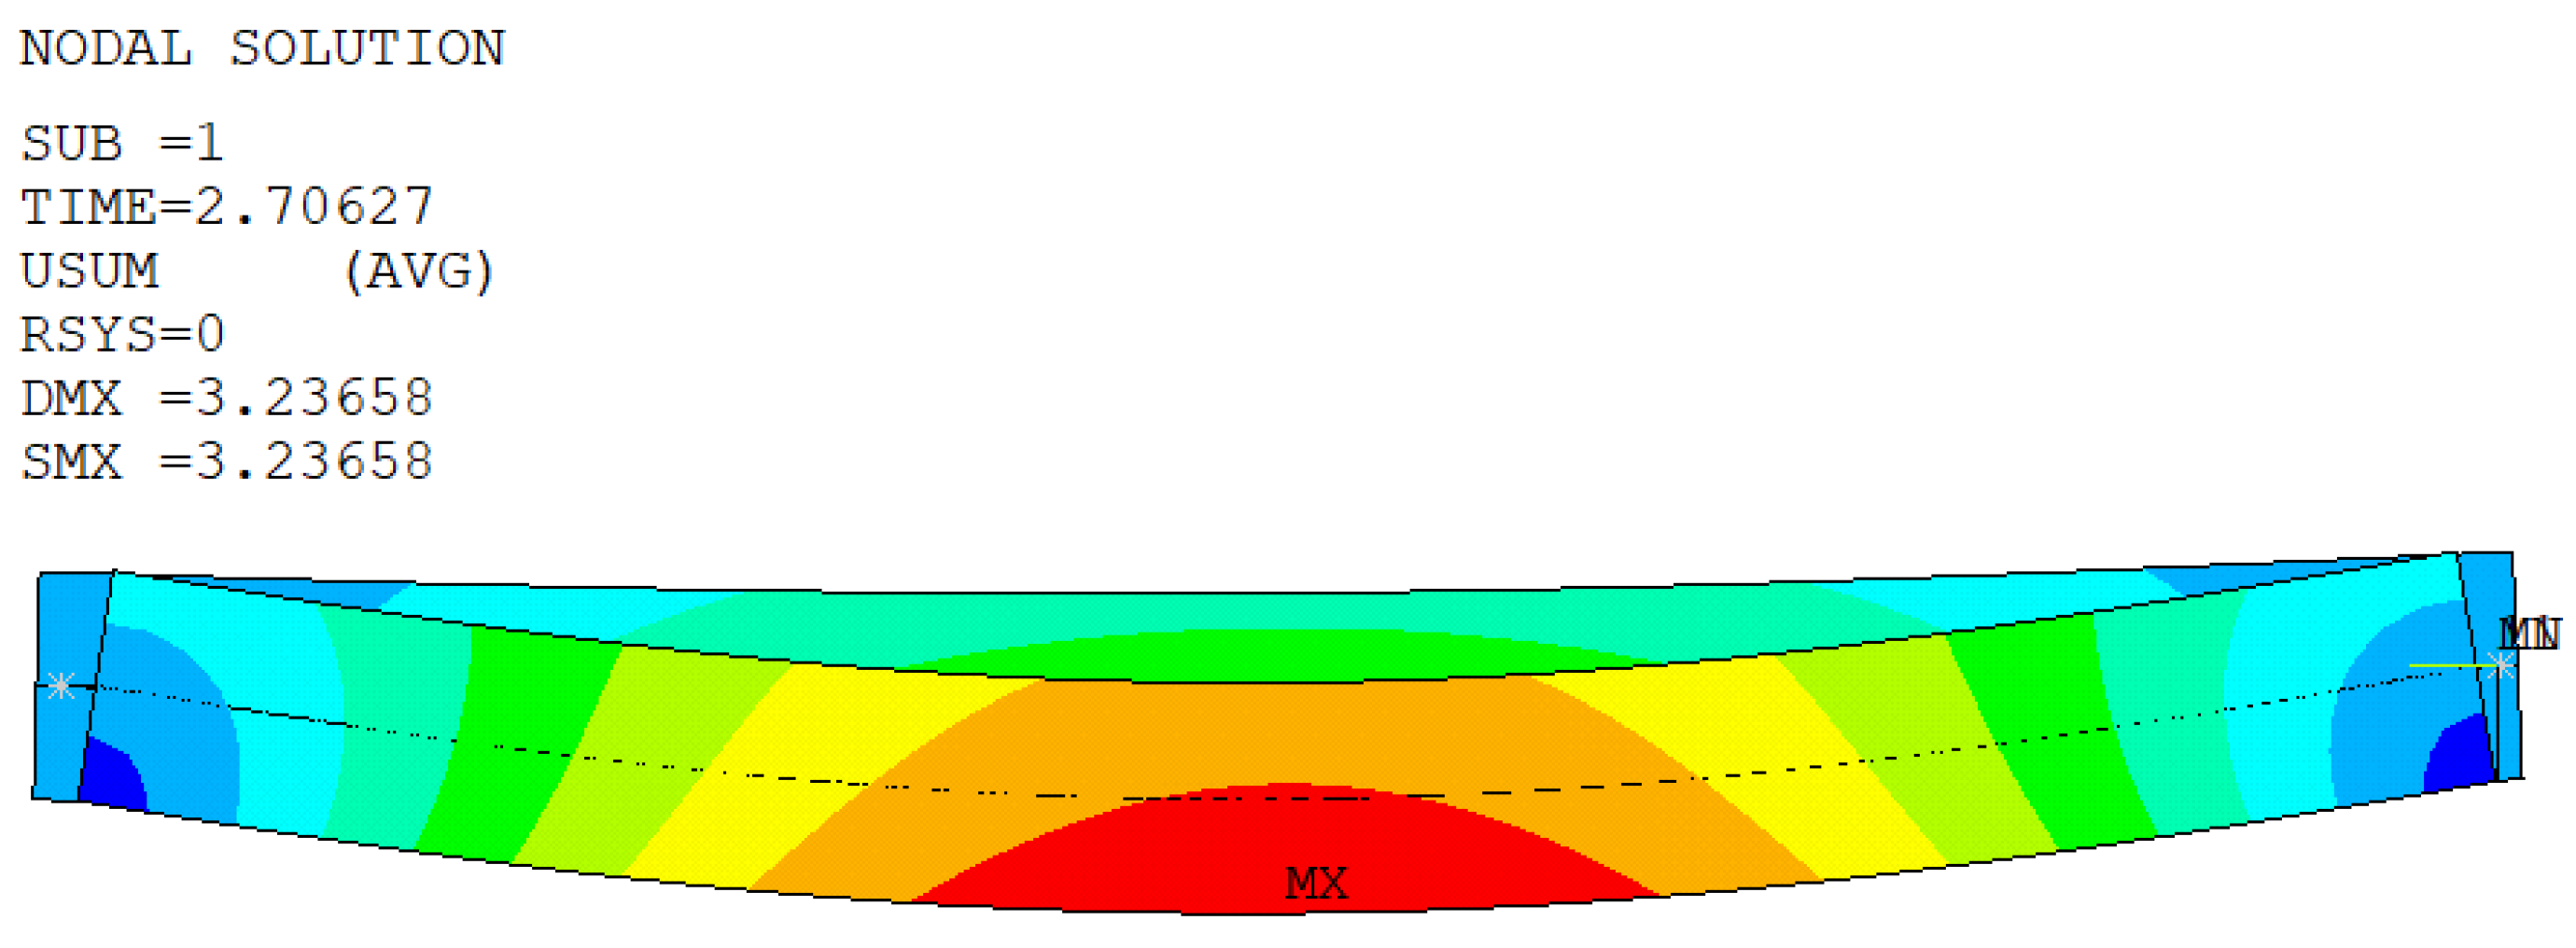
The connection between web and flange elements of hot-rolled I sections can be accomplished in various ways. A small material overlap is generated by the direct connection of the web and flange elements in their common nodes. One of the few approaches to avoid this material overlap is the use of a modified element in the location of the web-flange connection with dimensions such that area of this modified element is the same as the difference between radius zones and the overlapped area [22,23]. Another method is to offset the web boundary elements by half of a flange thickness and connect the web and flange nodes by rigid constraint elements [24]. Finally, the direct connection of web and flange elements in their common nodes with a small material overlap was used in this analysis (Figure 3), although the tabular cross-sectional dimensions were used for analytically derived beam-columns resistances. These assumptions were chosen to simplify modelling in case of members with an RHS cross-section. Moreover, it was also observed that the radius zones had negligible influence in the case of lateral-torsional buckling [25]. This is also valid because the material overlap is almost at the same location as the radius zones, so the material overlap partly compensates the effect of the radius zones on the member resistance.
The material properties of steel grade S235 were considered in the analysis, with a yield stress fy = 235 MPa and modulus of elasticity E = 210,000 MPa. According to Annex C of Eurocode 3 part 1–5 [26], the following material models can be used while modelling plated structures:
- elastic-plastic without strain hardening,
- elastic-plastic with a nominal plateau slope of 1 MPa or a similar low value,
- elastic-plastic with a strain hardening slope of E/100,
- true stress-strain curve modified from test results.
The elastic-plastic material model with insignificant hardening slope was used because the strains at ultimate resistance of slender structures are small, so strain hardening has little effect on the ultimate resistance. On the other hand, the bilinear material model without strain-hardening could be the cause of convergence issues during numerical analysis [27]. Strain-hardening gains higher importance for stocky members, where the strains reach higher magnitudes at ultimate limit states.
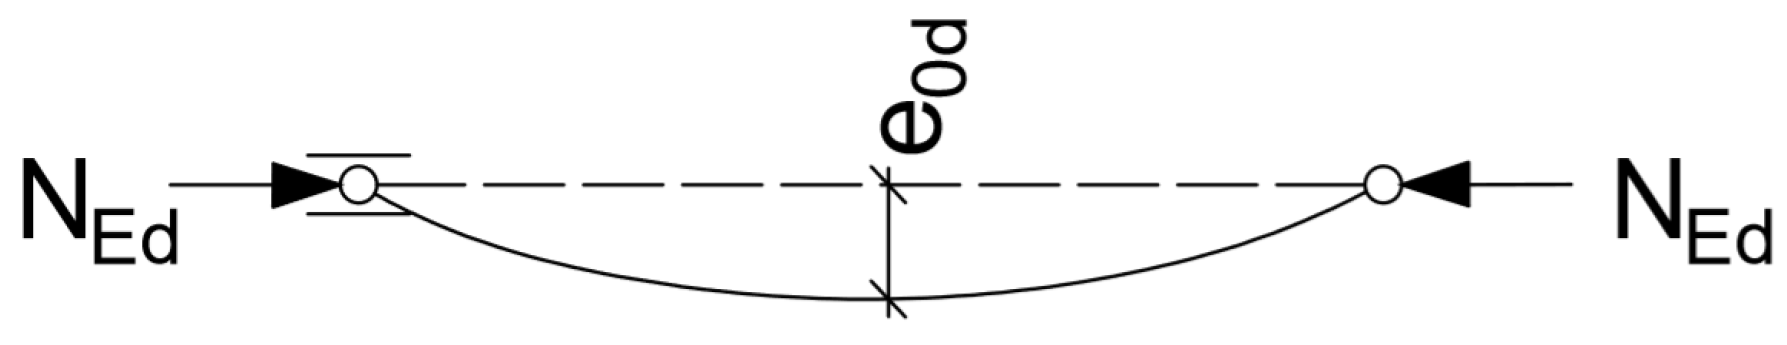
Imperfections are other phenomena which affect the resistance and behaviour of real members under combination of loading. In the case of numerical analysis of beam-columns, it is typical to consider geometric imperfections in the form of member bow curvature, and structural imperfections in the form of residual stresses. The initial imperfections have to be included in the nonlinear numerical analysis, not only due to the effect on the member resistance but also because buckling may not occur in the case of perfect straight members without any imperfections under axial compressive force and symmetric element distribution. The commonly used amplitude of initial bow imperfection L/1000 [2,28] (Figure 4) was used in these numerical simulations. The shape of the initial geometric imperfection was extracted from preliminary linear buckling analysis.
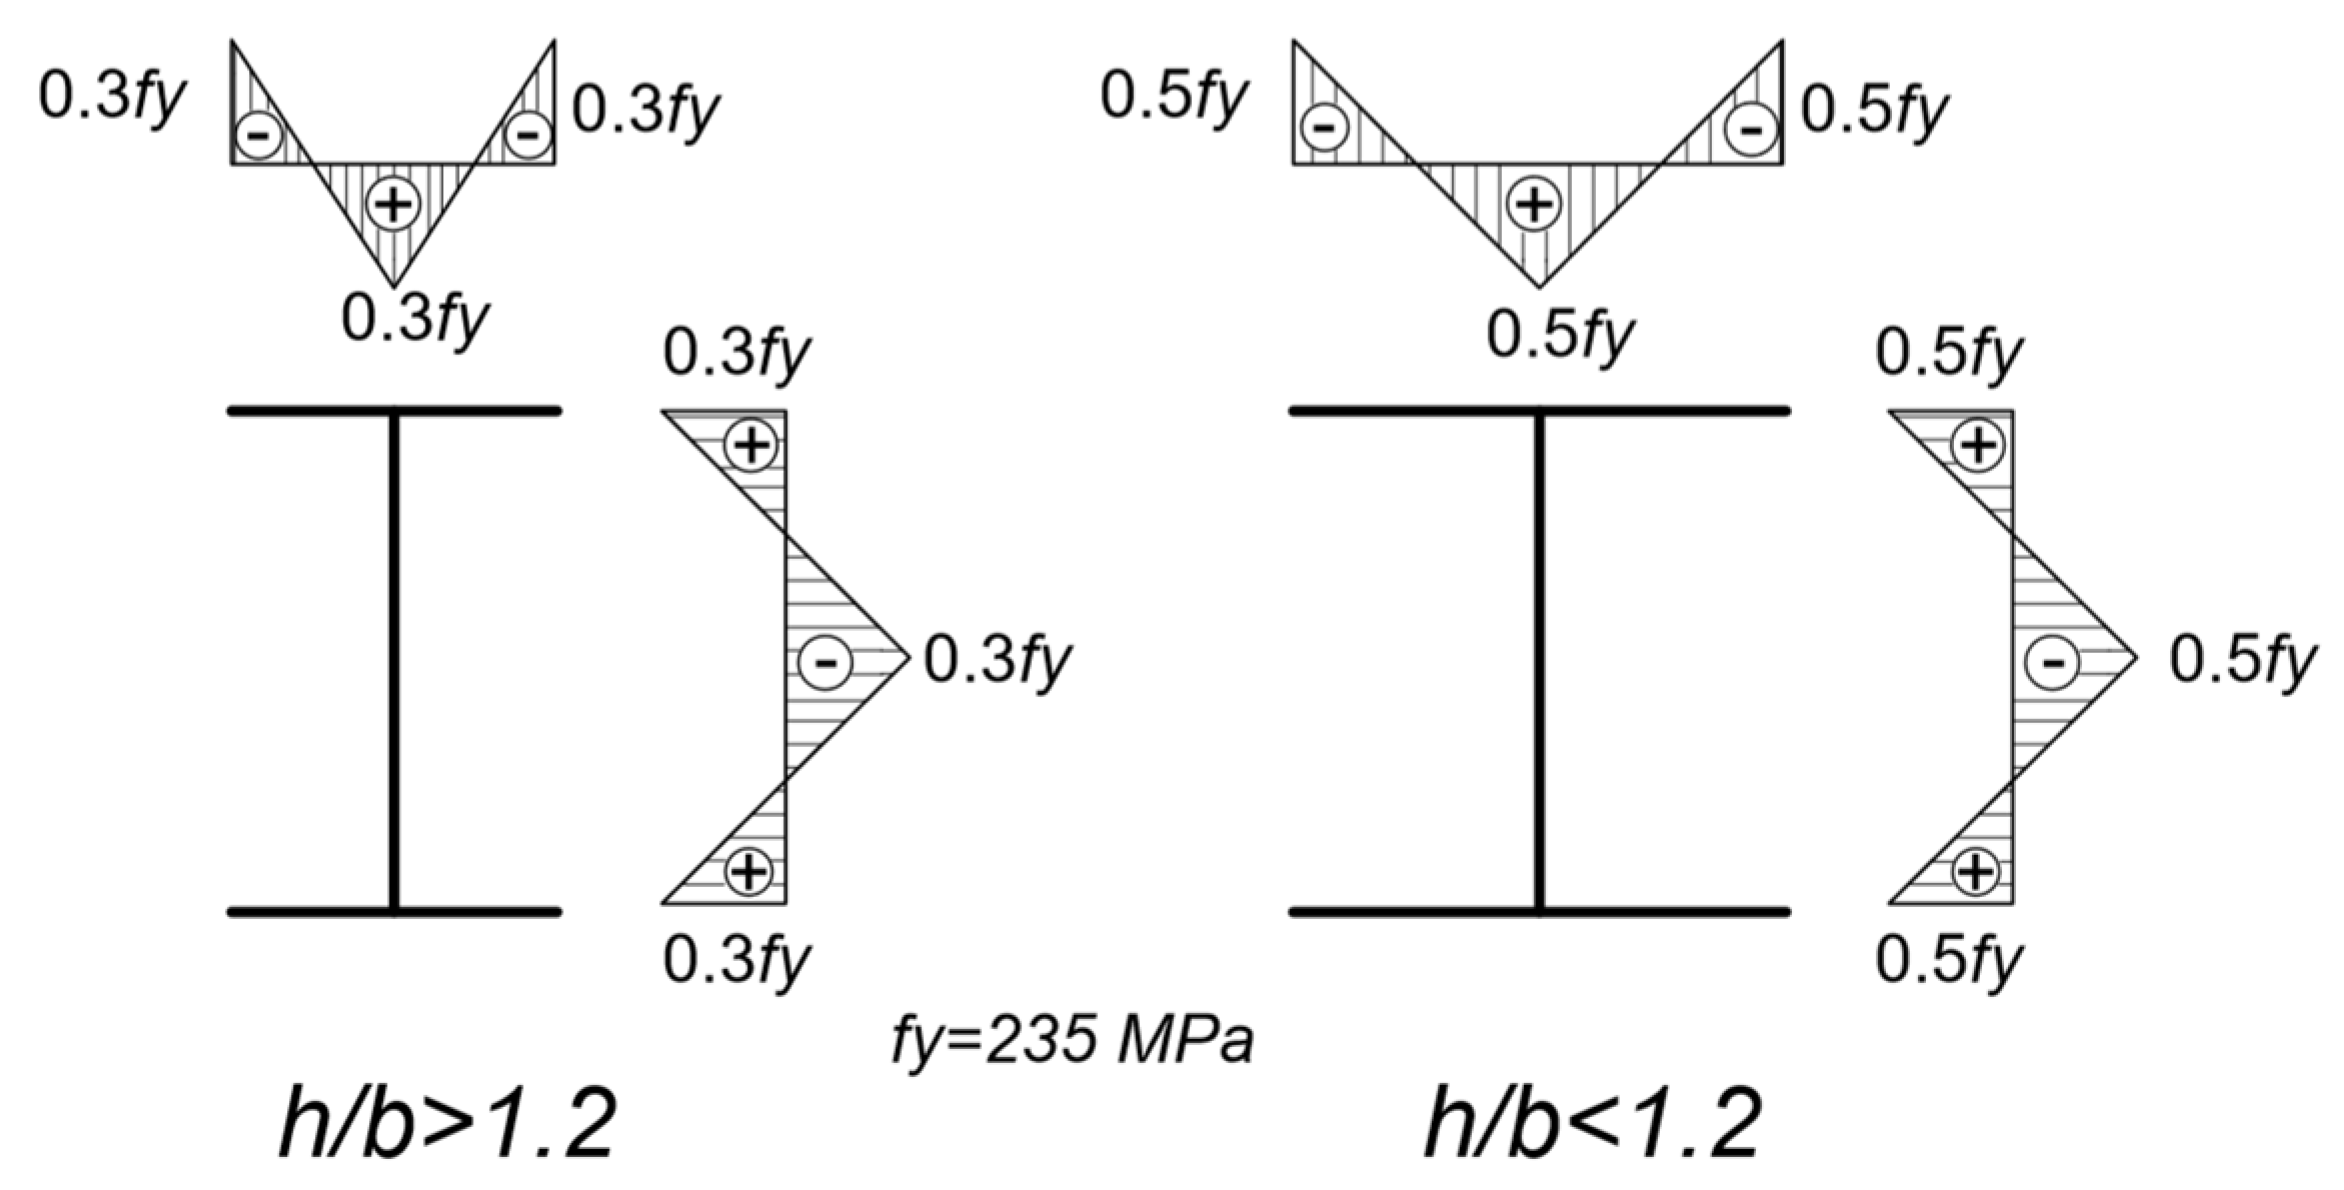
The structural imperfections were included in the numerical analysis in the form of residual stresses. The commonly used distribution of residual stresses for hot rolled I and H-profiles can be seen in Figure 5. Although a parabolic distribution according to measurements seems to be more appropriate, simplified linearized stress distributions provided more conservative but similar results. Therefore, the linear stress distribution of residual stresses was used in the numerical analysis. The measurements of residual stresses performed by Alpsten or ECCS also proved [2] that the magnitudes of the residual stresses are not dependent on steel grade, so the magnitude of the residual stresses for higher strength steels should be also considered with relevance to steel grade S235. More detailed background research about this topic can be found in [2].
The boundary conditions on both member ends were modelled in one “Master node”, which were located in the centre of gravity of end cross-sections, and these nodes were shifted 1 mm away from them. Therefore, the lengths of the members were shorter by 2 mm. These master nodes were modelled by one node element, MASS 21, which has six degrees of freedom. The master nodes were coupled to all nodes of end cross-sections by “constraint equations” in a such way that they behaved like a rigid plate, and the displacements and rotations of end cross-sections were dependent on the motion of the master node. Therefore, it was possible to apply the boundary conditions and loads directly to one node, simplifying the modelling process. This also compensates for modelling material zones in the ends of the member with the higher value of Young’s modulus of elasticity [29], which prevents the development of stress concentrations under concentrated loads. As there is also analysis of IPE members with free warping of the end cross-sections in this paper, a different modelling technique of such boundary conditions is explained later in the paper.
2.2. Validation of the FEM Model
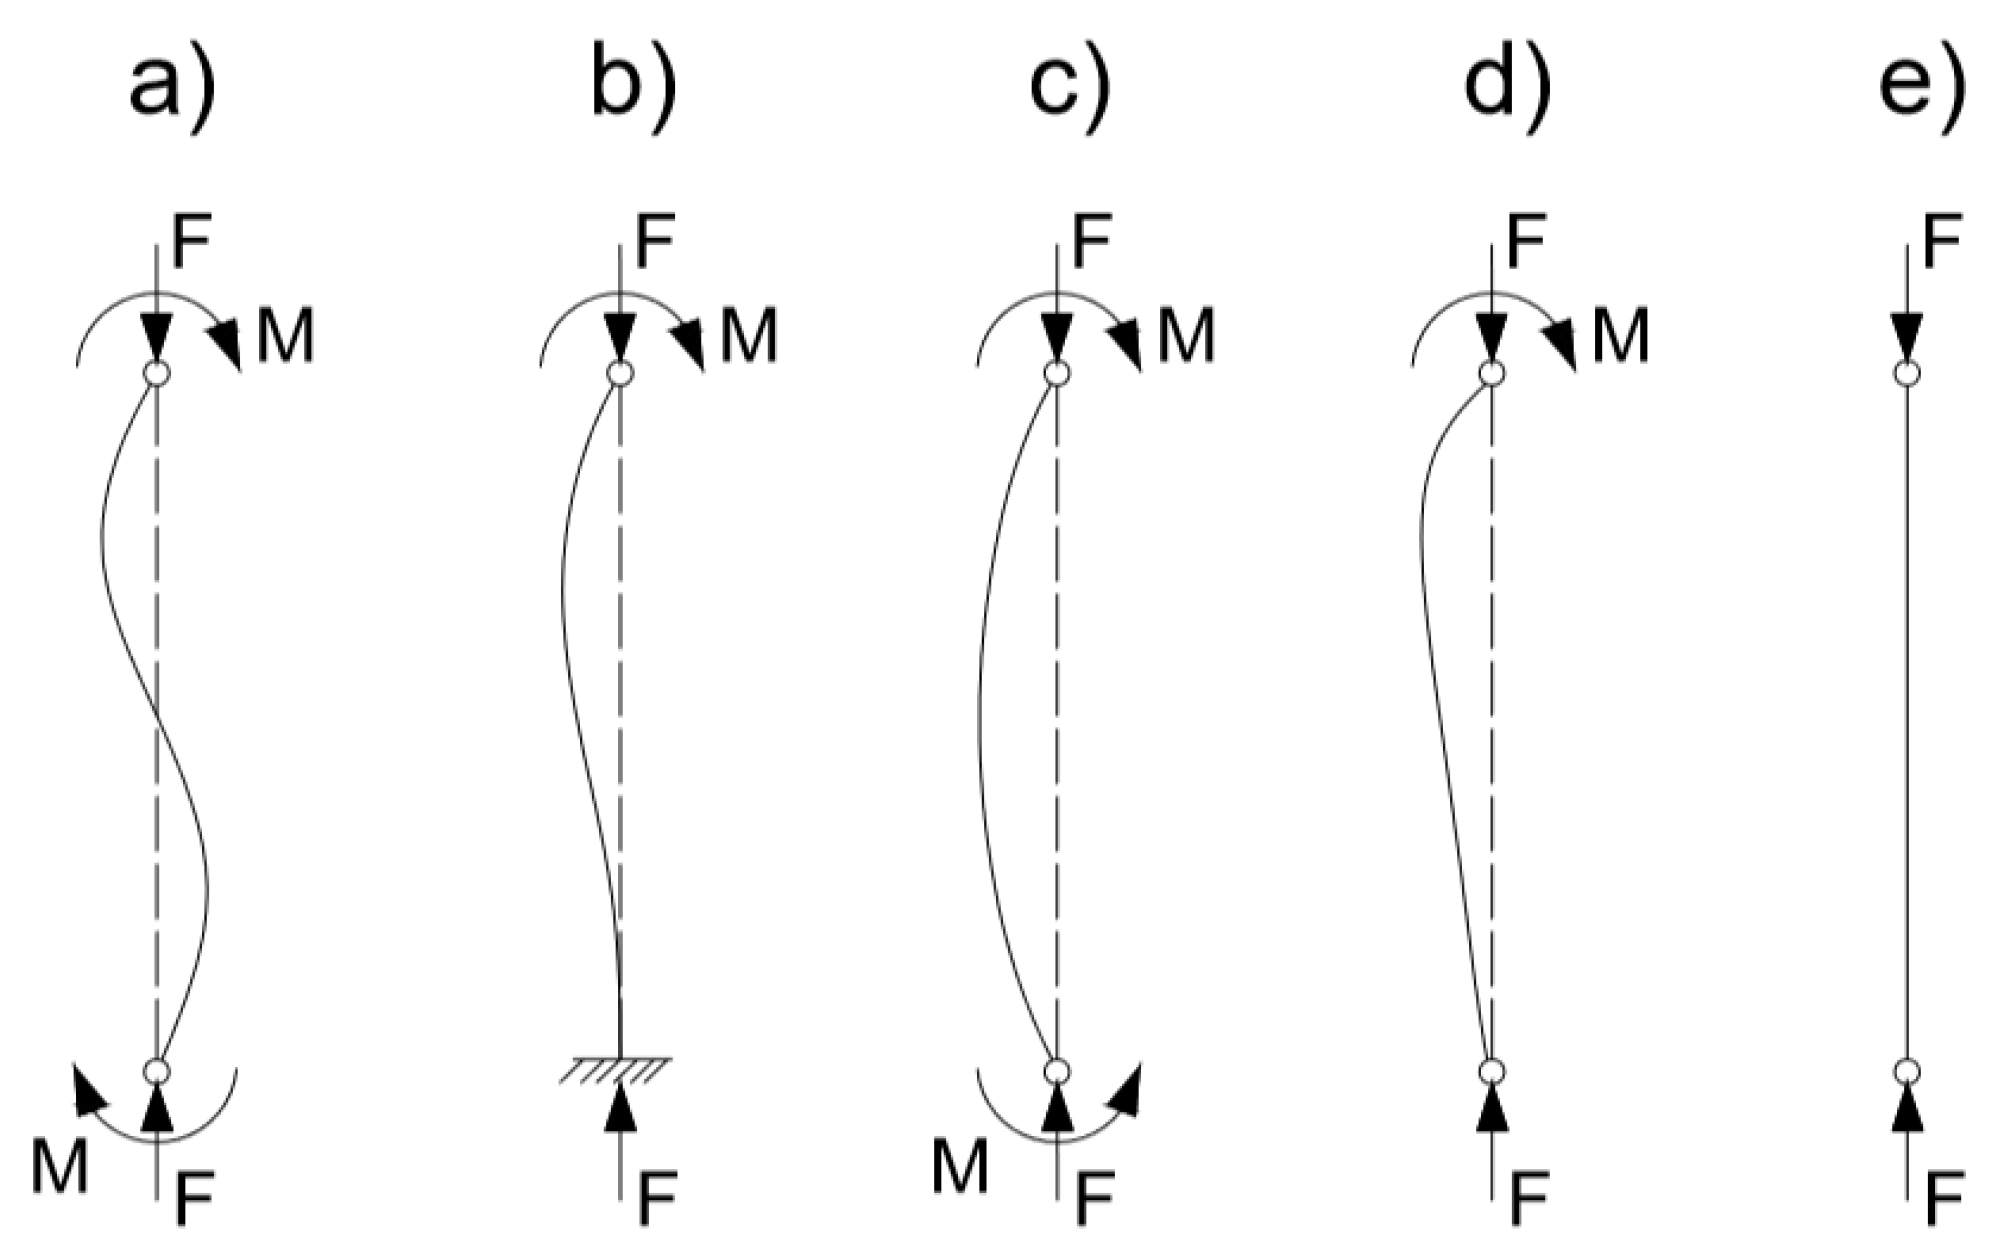
Validation of this modelling approach was performed using the experimental analysis performed by Galambos and Kuren [30]. This experimental programme contains a description of 42 hot-rolled wide-flange columns subjected to axial force and bending moments. Most of the columns were subjected to bending moments about their major principal axis, except two specimens, T25 and T27, which were subjected to a bending moment about their minor principal axis. The boundary conditions were pin ended in the plane of applied bending moments and almost fixed in the perpendicular plane, as the buckling length was approximately 0.6 L for this plane. The five load cases investigated by this experimental analysis can be seen on Figure 6.
The loading components were applied independently of each other. Most of the specimens were first loaded to a certain level by an axial force, and after that the application of bending moments was continued until failure.
Appropriate material properties and column dimensions were adopted in the numerical analysis for each member, as various cross-sections and steel properties were used for the specimens. Also, a linear residual stress distribution according to Figure 5. for members with a ratio h/b ≤ 1.2 was used. As the initial geometric imperfections are not presented in this report, the initial bow imperfections were applied in the shape of first buckling mode with an amplitude of L/1000.
To sum up, a total of 16 specimens were used for this validation, covering a wide range of load cases and also relative slenderness and axial force ratios. The ultimate resistances of specimens from experimental analysis were compared to the ultimate resistances gathered by numerical analysis. The comparison of these specimens can be seen in Table 1. The specimens, which were firstly loaded by a bending moment and then by an increasing axial force till failure, are denoted by “*”, and the specimens which were pinned in the plane of the minor axis are denoted by “z”.
As can be seen, the resistances given by the numerical analysis are in good agreement with the resistances gathered by the experimental loading tests. A similar level of accuracy was also achieved in an analysis performed by Kucukler [31]. The deviations were both higher and also lower than the resistances from the experimental analysis with a maximum deviation of 13%. Also it can be seen that whether the resistances were higher or lower than the “real” resistances was not dependent on the load case, as the specimens T8 and T12 had the same relative slenderness and boundary conditions and the difference between their deviations was 9%. Therefore it can be stated that the model provides consistently accurate results, as the resistances are not strictly on the safe or unsafe side. The reason for these deviations could be the difference between the real and assumed geometrical imperfections involved in the numerical analysis, as they were not reported by authors.
Moreover, a good agreement has to be highlighted in the case of specimen T2, where the bending moment resistance achieved by the experimental test was higher than the analytical cross-sectional plastic resistance. Therefore, it can be concluded that this model also provides good results in cases where the large plastic strains should be considered.
3. Verification According to European Standards
A comparison of ultimate resistance of the beam-column using design methods according to Eurocode 3 and Eurocode 9 with the numerical analysis is presented in this section. As was mentioned earlier in this paper, the comparison was performed for beam-columns with IPE and RHS cross-sections for five load cases. The flexural buckling resistance was investigated for both axes for both cross-sections. Moreover, in the case of members with IPE cross-section, which are prone to torsional deformations, the lateral-torsional buckling resistances were compared. This comparison was performed for members with two types of boundary conditions, both for warping restrained and unrestrained end cross-sections. The reason is that these types of constraints can produce different results and, therefore, they can provide another perspective from the viewpoint of this analysis.
To provide better understanding of this chapter, the organization of the following sections is here briefly discussed. The analysis for members with IPE cross-section according to different loading conditions is presented first, followed by analysis for members with an RHS cross-section. The interaction curves according to design approaches and numerical analysis are presented in the following sections, together with a short discussion of the results.
The design of beam-columns according to Eurocode 3 have to satisfy multiple design equations; two equations providing buckling resistance according to clause 6.3.3 of this standard, and also equations determining cross-sectional resistance according to the appropriate class of cross-section specified in Section 6.2 in Eurocode 3. Therefore, the lowest resistance from these equations is considered in the interaction curves below. The buckling resistance design equations according to this standard are as follows:
where: NEd, My,Ed, and Mz,Ed are the design values of the compression force and the maximum bending moments about the y-y and z-z axis along the member, ∆My,Ed and ∆Mz,Ed are the bending moments due to the shift of the centroid axis for class 4 of cross-sections, χy and χz are the reduction factors due to flexural buckling, χLT is the reduction factor due to lateral torsional buckling, kyy, kyz, kzy, kzz are the interaction factors that are relative to either method Annex A or Annex B of standard EN 1993-1-1, NRk, My,Rk, and Mz.Rk are the characteristic values of resistances to normal force and bending moments y-y and z-z axis, and γM1 is the partial factor for resistance of members to instability assessed by member checks.
A cross-sectional check is included in the buckling resistance formulas according to Eurocode 9 Section 6.3.3, so that only the lowest resistance from the buckling resistance formulas is considered in the verification. This is especially true in the case of a laterally unrestrained beam-column subjected to a combination of axial compressive force and bending moment about the major axis, as the failure can occur due to the large bending moment in the plane of bending and to the large axial force in the direction perpendicular to the plane of bending.
Flexural buckling verification of beam-column with open double-symmetric cross-section has to satisfy two expressions according to Eurocode 9:
The hollow cross-sections and tubes have to be verified according to the design equation:
The beam-columns with open double-symmetric or monosymmetric cross-sections have to be verified for lateral torsional buckling about the weak axis of cross-section according to the following expression:
where: ξyc = 0.8 or alternatively ξyc = ξ0χy, bu ξyc ≥ 0.8; ηc = 0.8 or alternatively ηc = η0χz, but ηc ≥ 0.8; ξzc = 0.8 or alternatively ξzc = ξ0χz, but ξzc ≥ 0.8; η0, ξ0, γ0 are defined in the Section 6.2.9.1 of the standard; NEd, My,Ed, and Mz,Ed are the design values of the compression force and the bending moments about the y-y and z-z axis in the verified cross-section; NRd, My,Rd, and Mz,Rd are the design values of resistances to normal force and bending moments about the y-y and z-z axis in the verified cross-section; Nb,Rd,min = min(χyωxNRd; χzωxNRd) depending on the direction of buckling Ψc = max(1.3χy; 0.8) or Ψc = max(1.3χz; 0.8) depending on direction of buckling; ωx and ωxLT are the coefficients taking into account the distribution of the secondary bending moment along the member; xs is the distance between support or point of inflection in the case of elastic flexural buckling and the point of verification;
ω0 is the coefficient taking into account the effect of cross welds, for a cross-section with no cross welds ω0 = 1; γc = γ0, χ = χy, or χz are the reduction factors due to flexural buckling depending on the direction of buckling and lc is the flexural buckling length.
3.1. Resistance of Beam-Columns with IPE 100 Type of Cross-Section
3.1.1. Axial Compression and Major-Axis Bending Laterally Restrained
The objective of these loading conditions is to study the flexural buckling in the plane of bending about the major axis. This type of failure occurs for beam-columns with double symmetric I sections subjected to a combination of axial compressive force and bending moment only if the sufficient lateral restraints are present. The lateral restraints were modelled in the place where web and flanges are connected, as can be seen in Figure 7.
Method 2, according to Eurocode 3, also differentiates between members susceptible and not susceptible to torsional deformations. Therefore, the appropriate interaction factors kij have to be used.
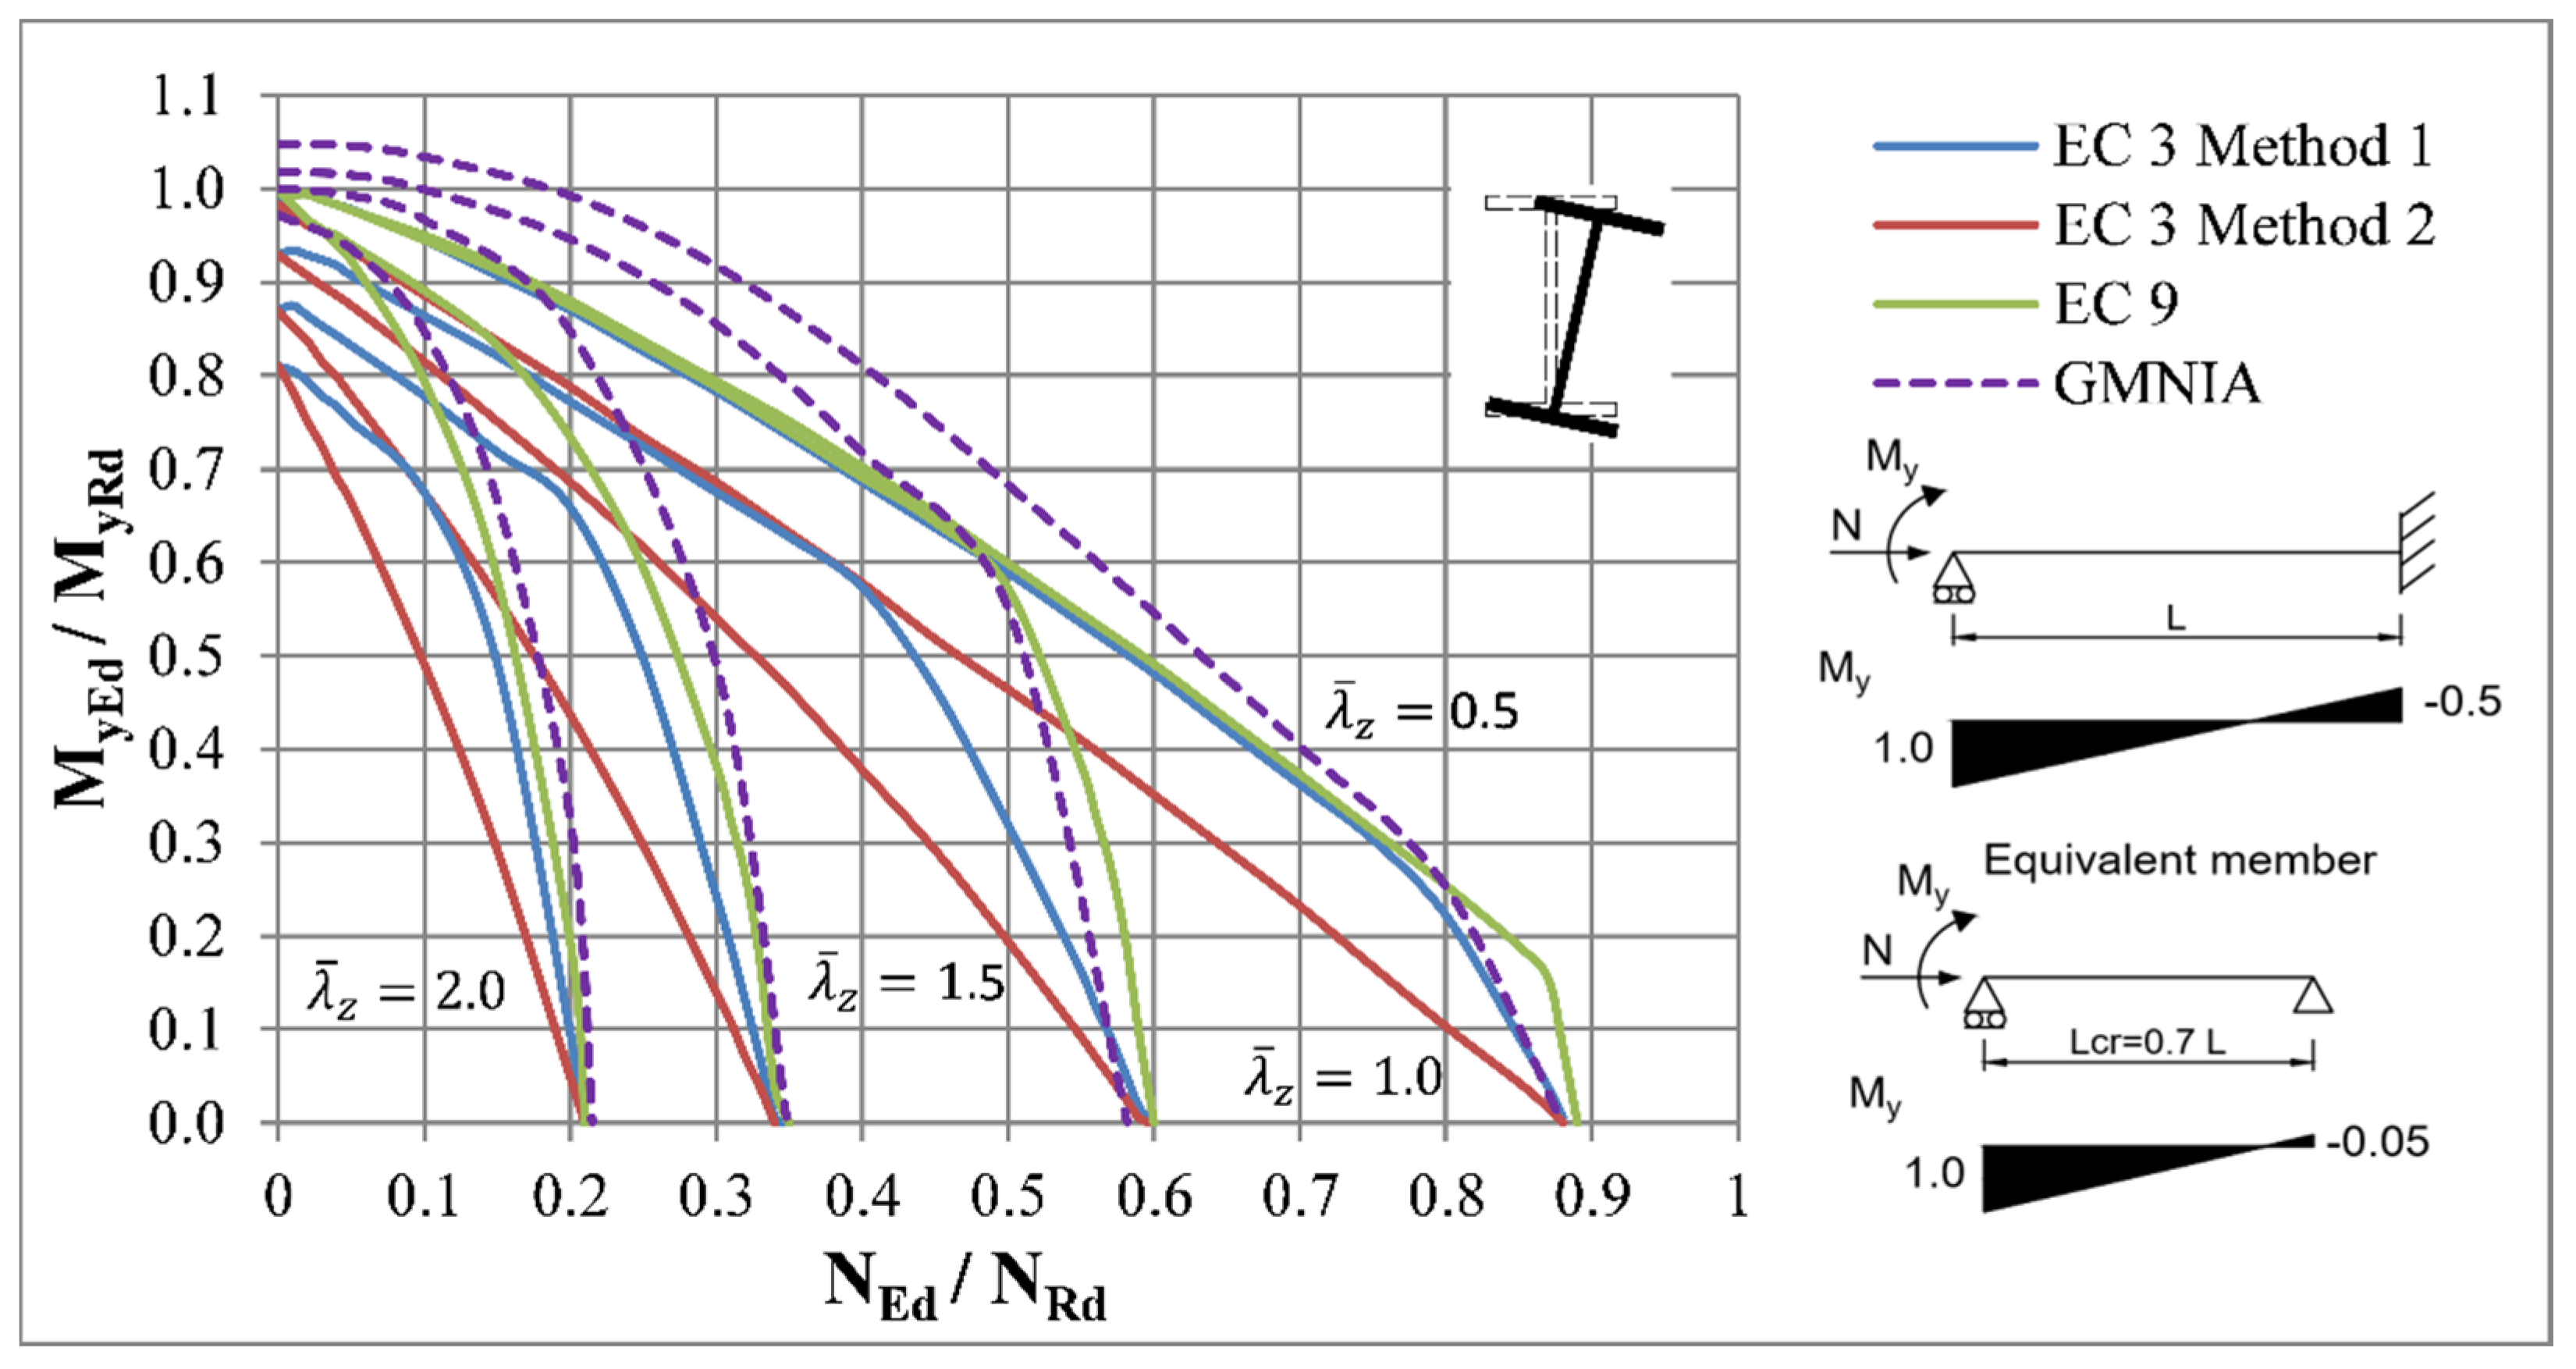
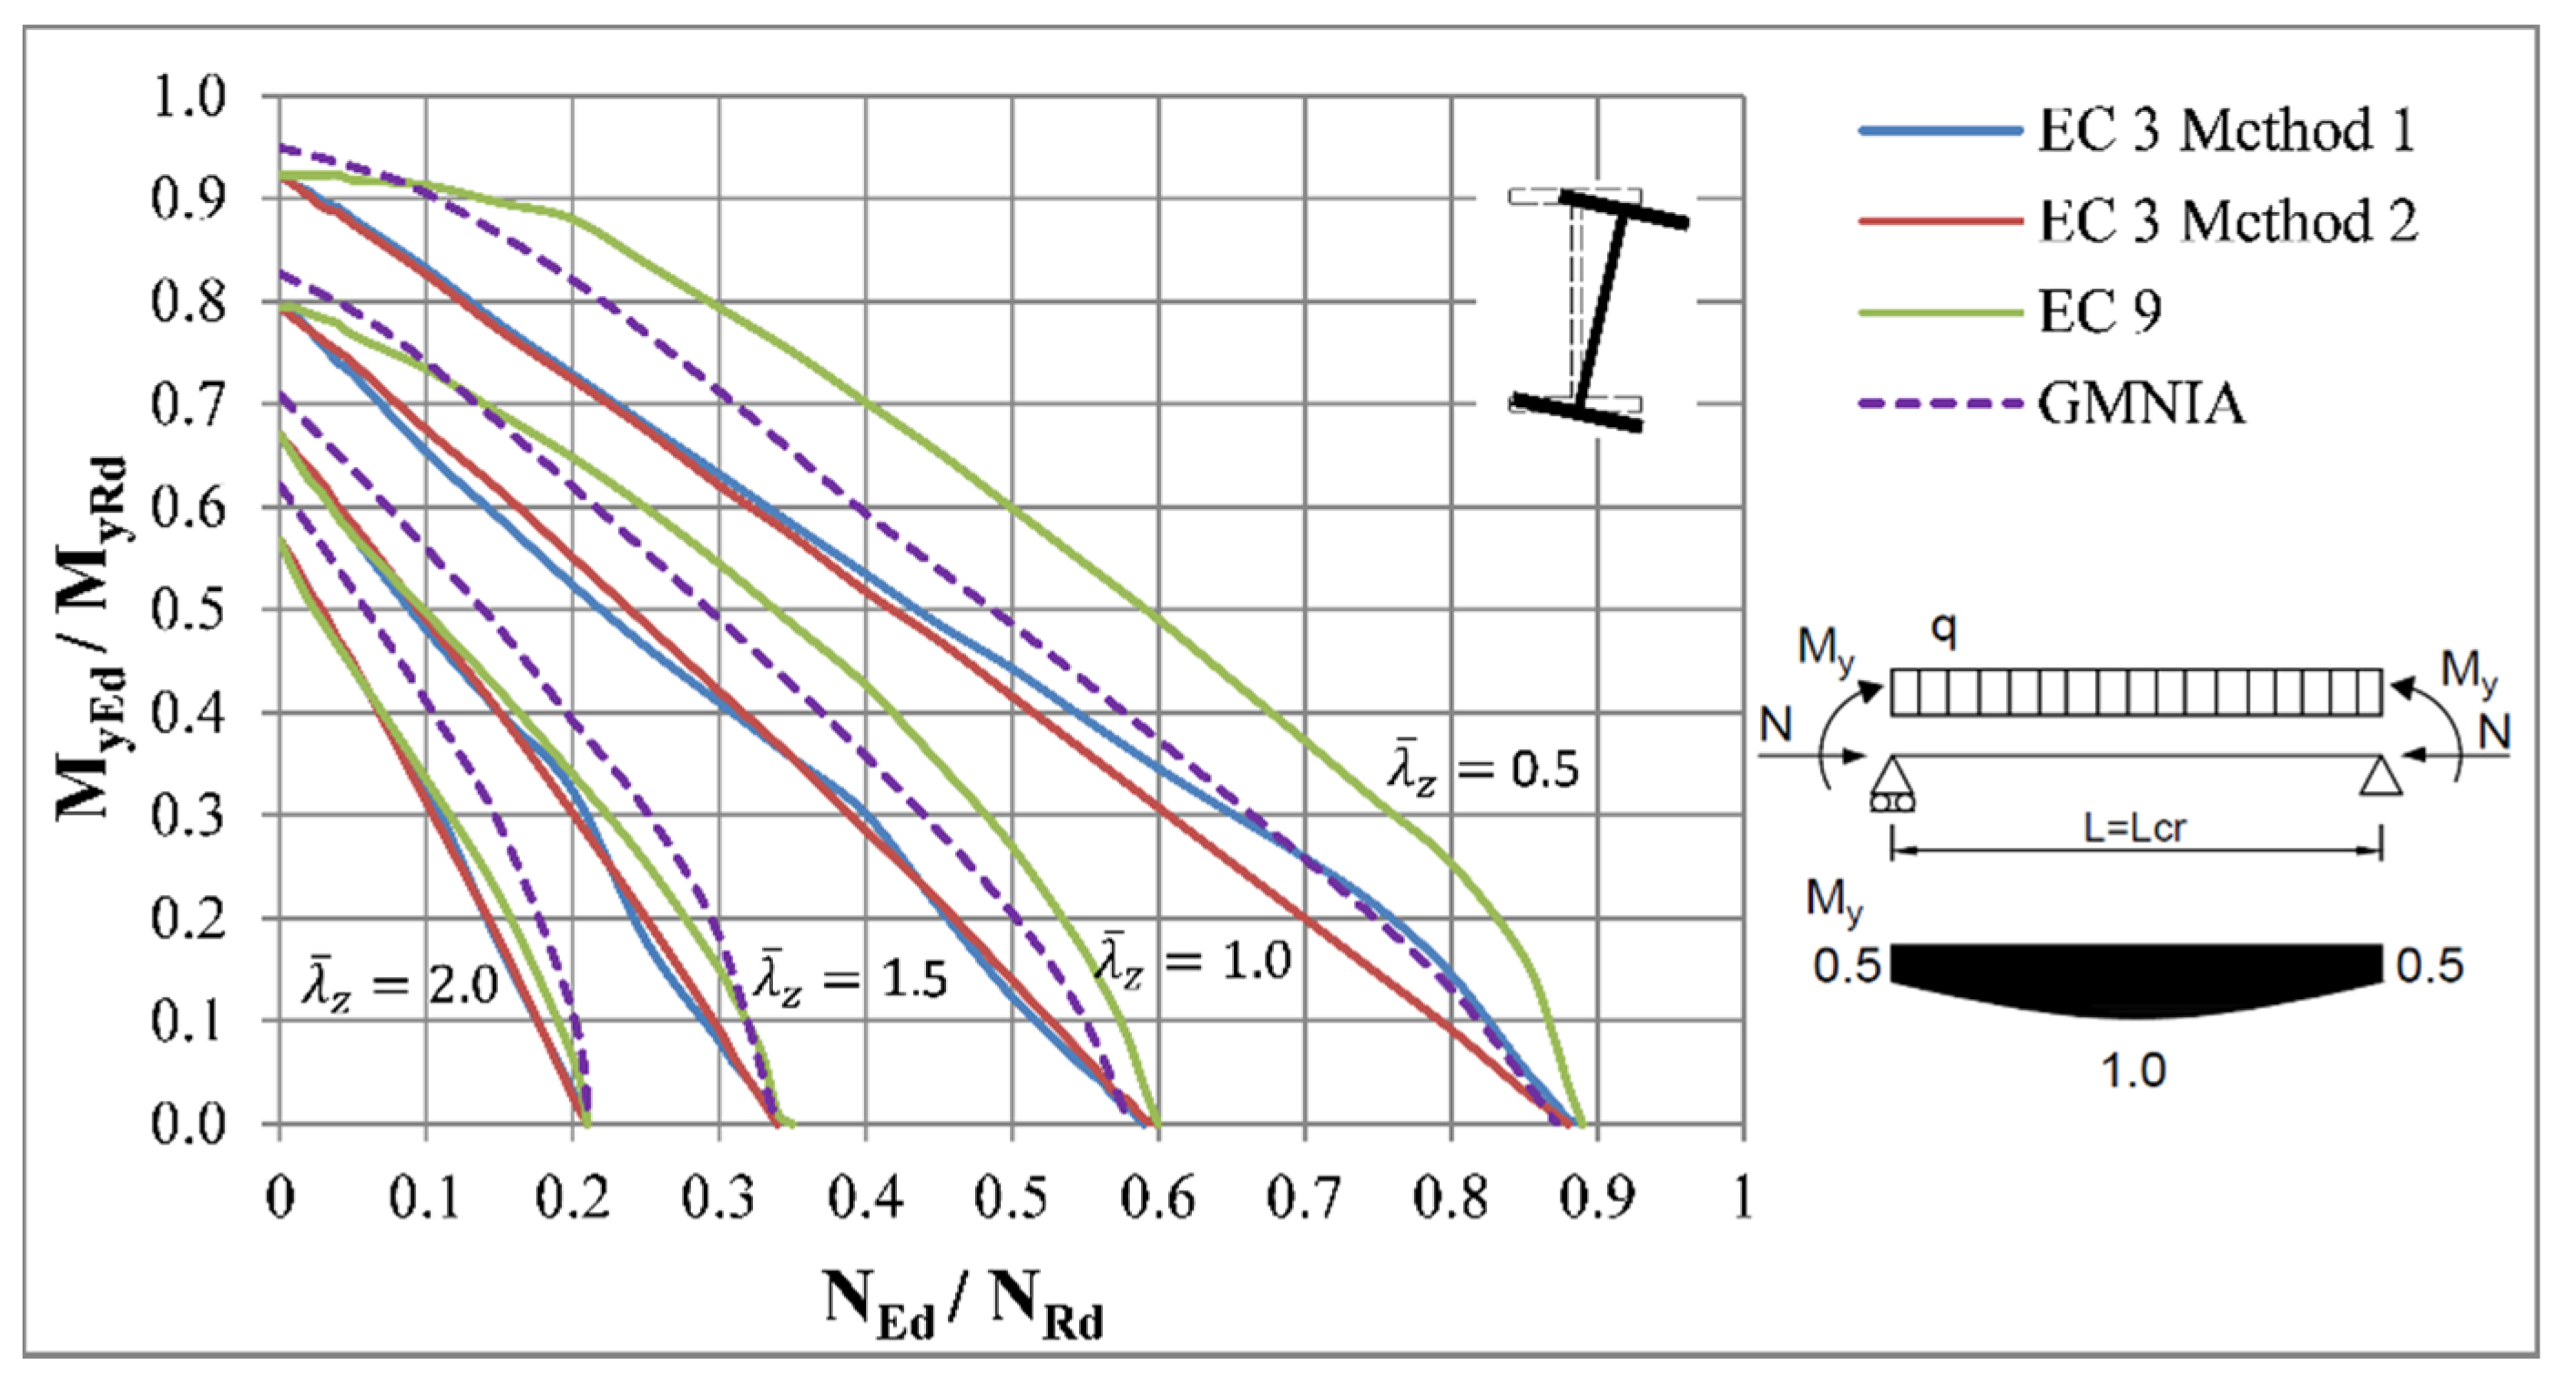
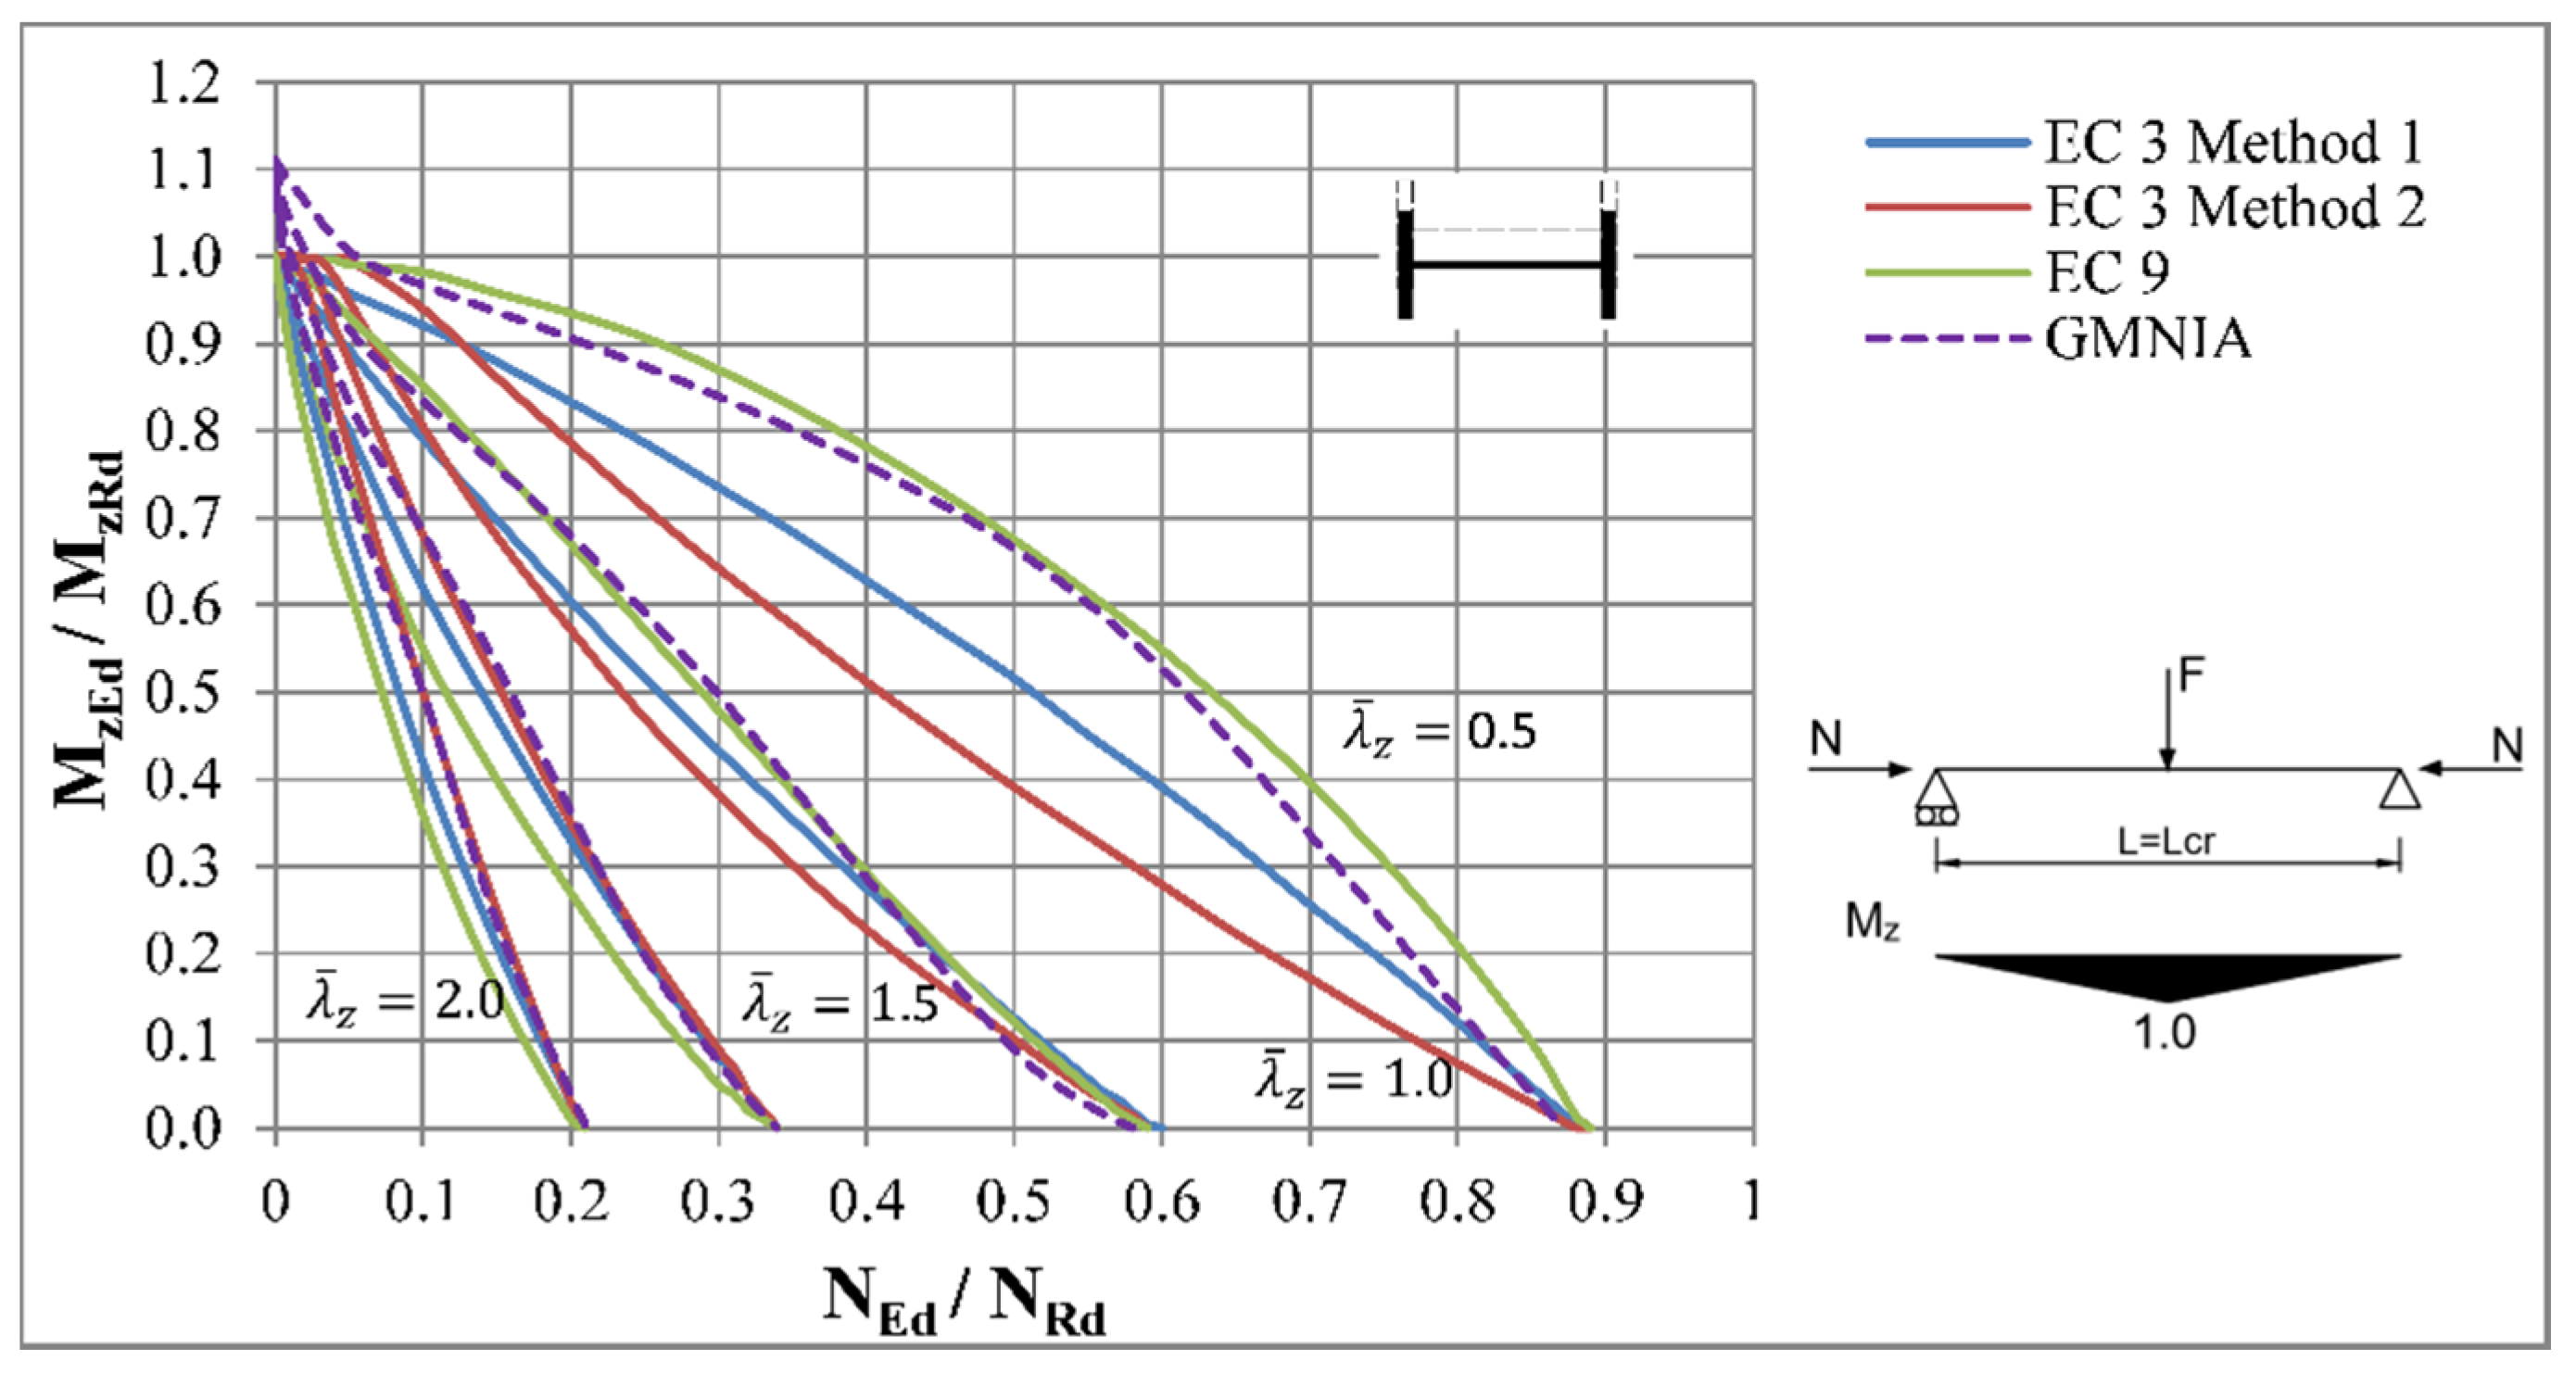
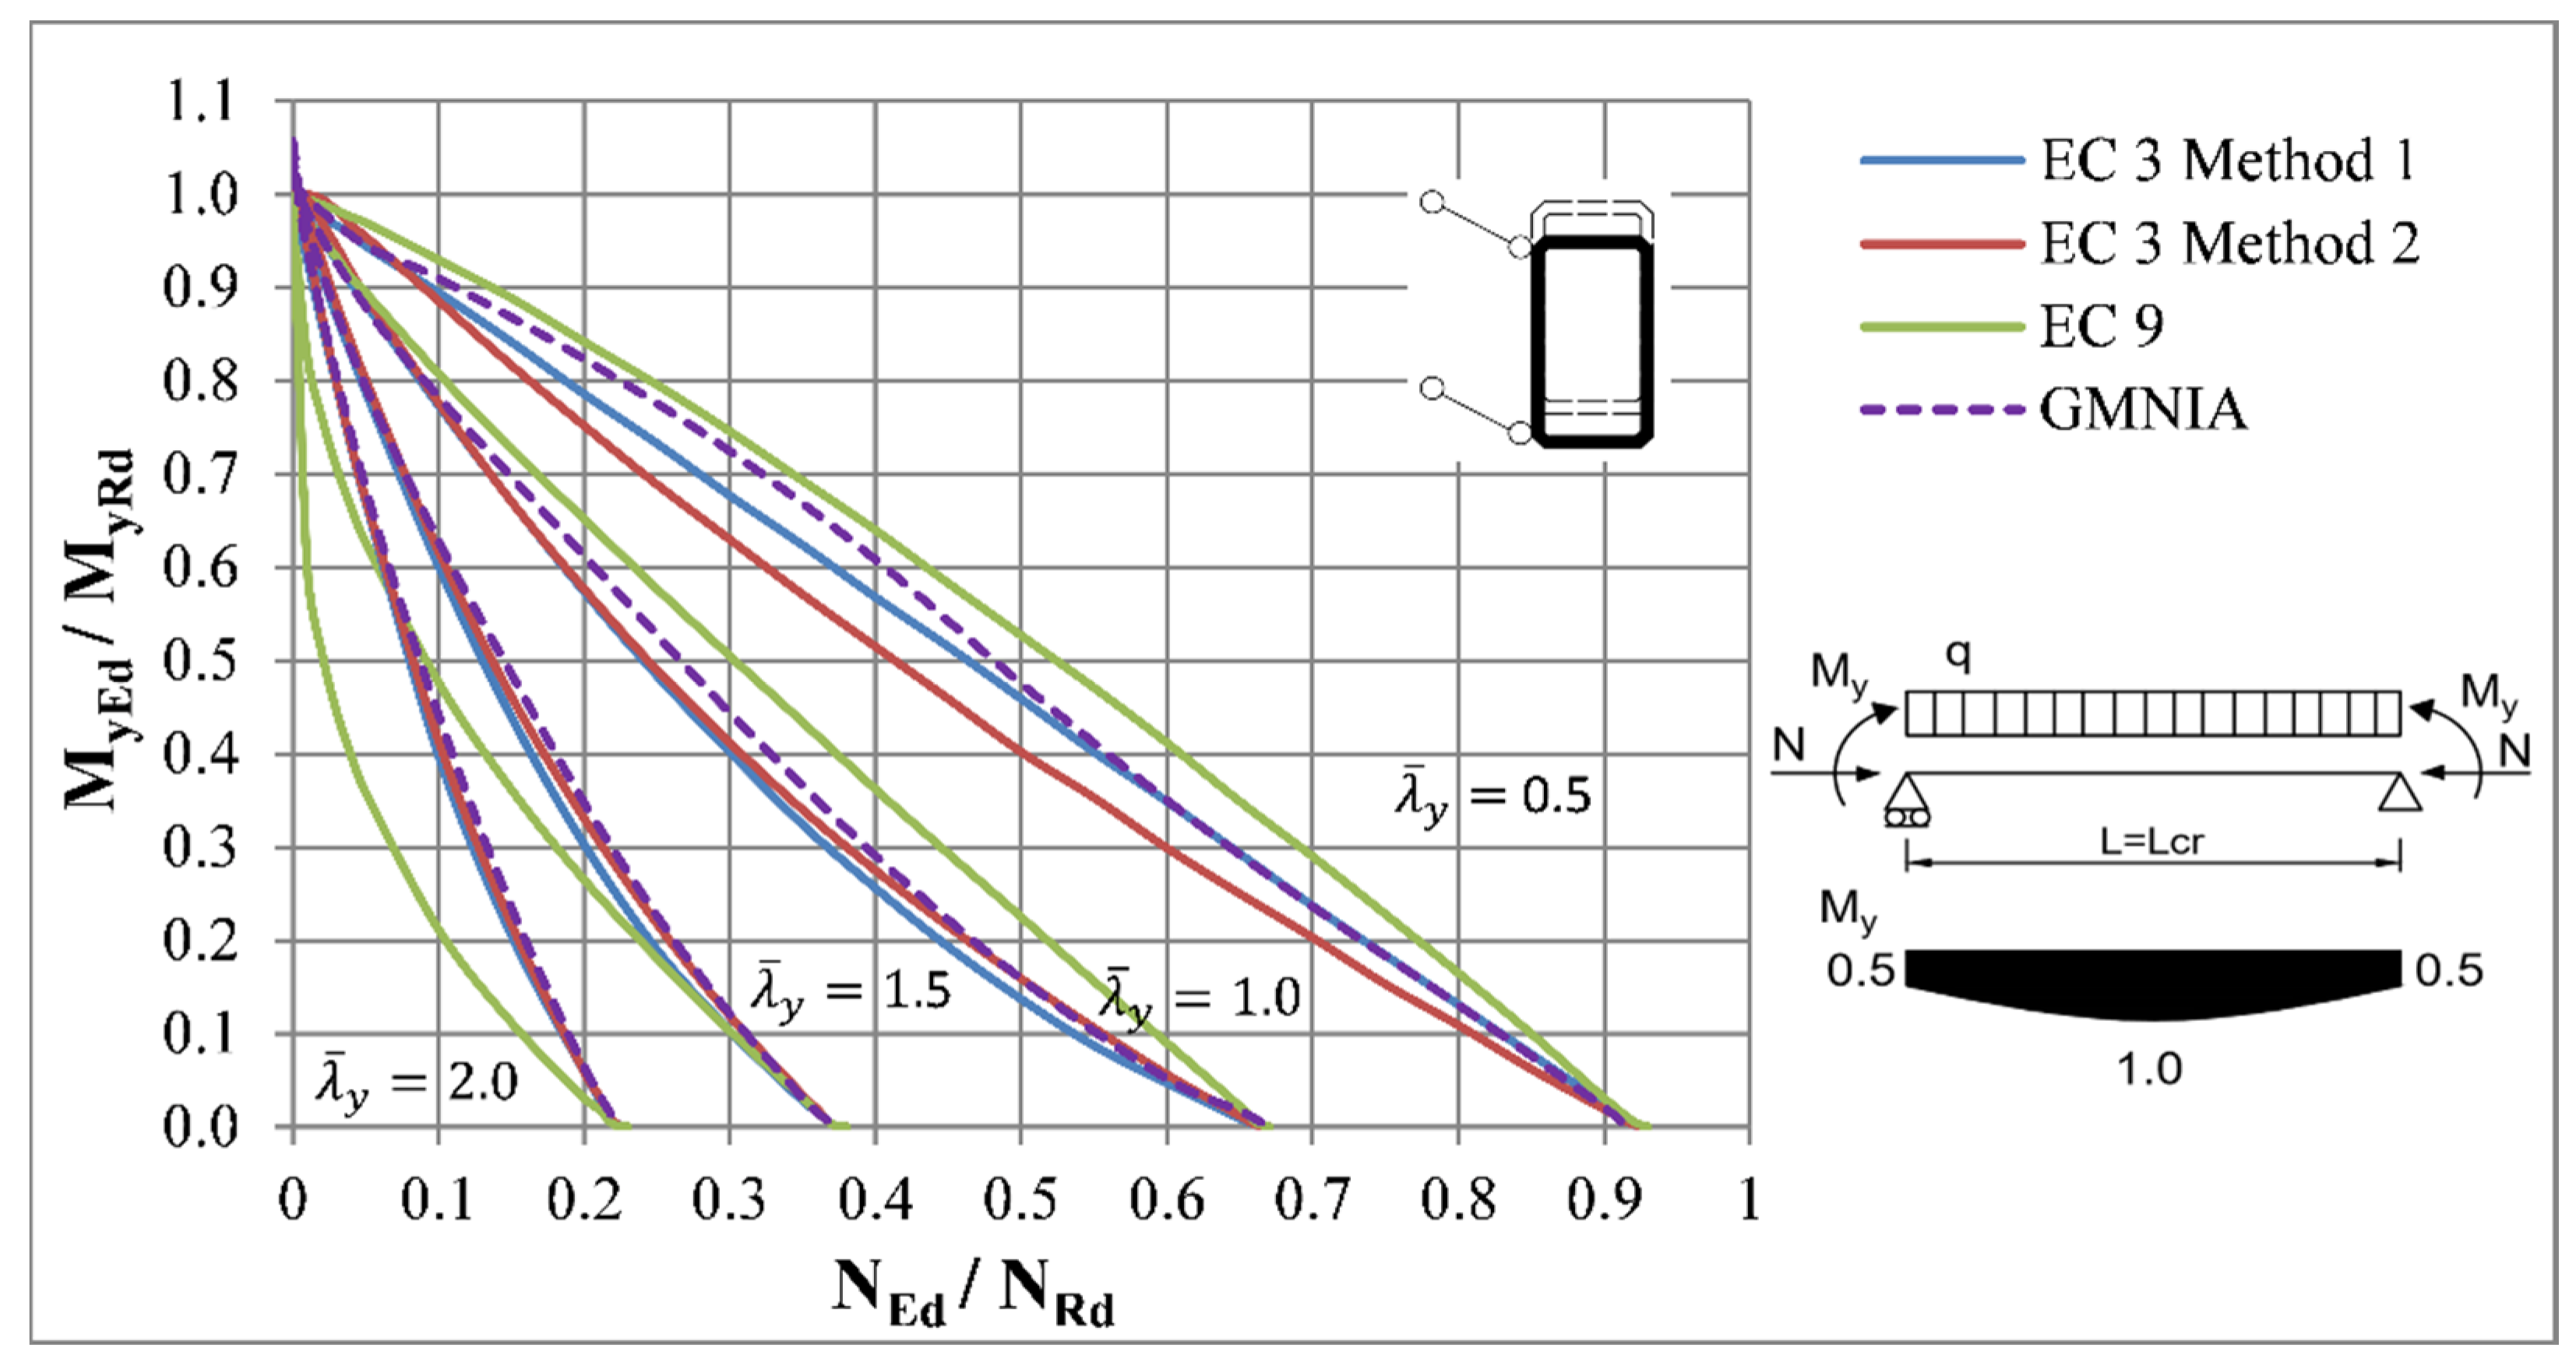
The interaction curves according to design approaches compared to the results of numerical analysis are presented on the Figure 8, Figure 9, Figure 10, Figure 11 and Figure 12. There is also introduced an equivalent member in the case of a pinned-fixed beam column.
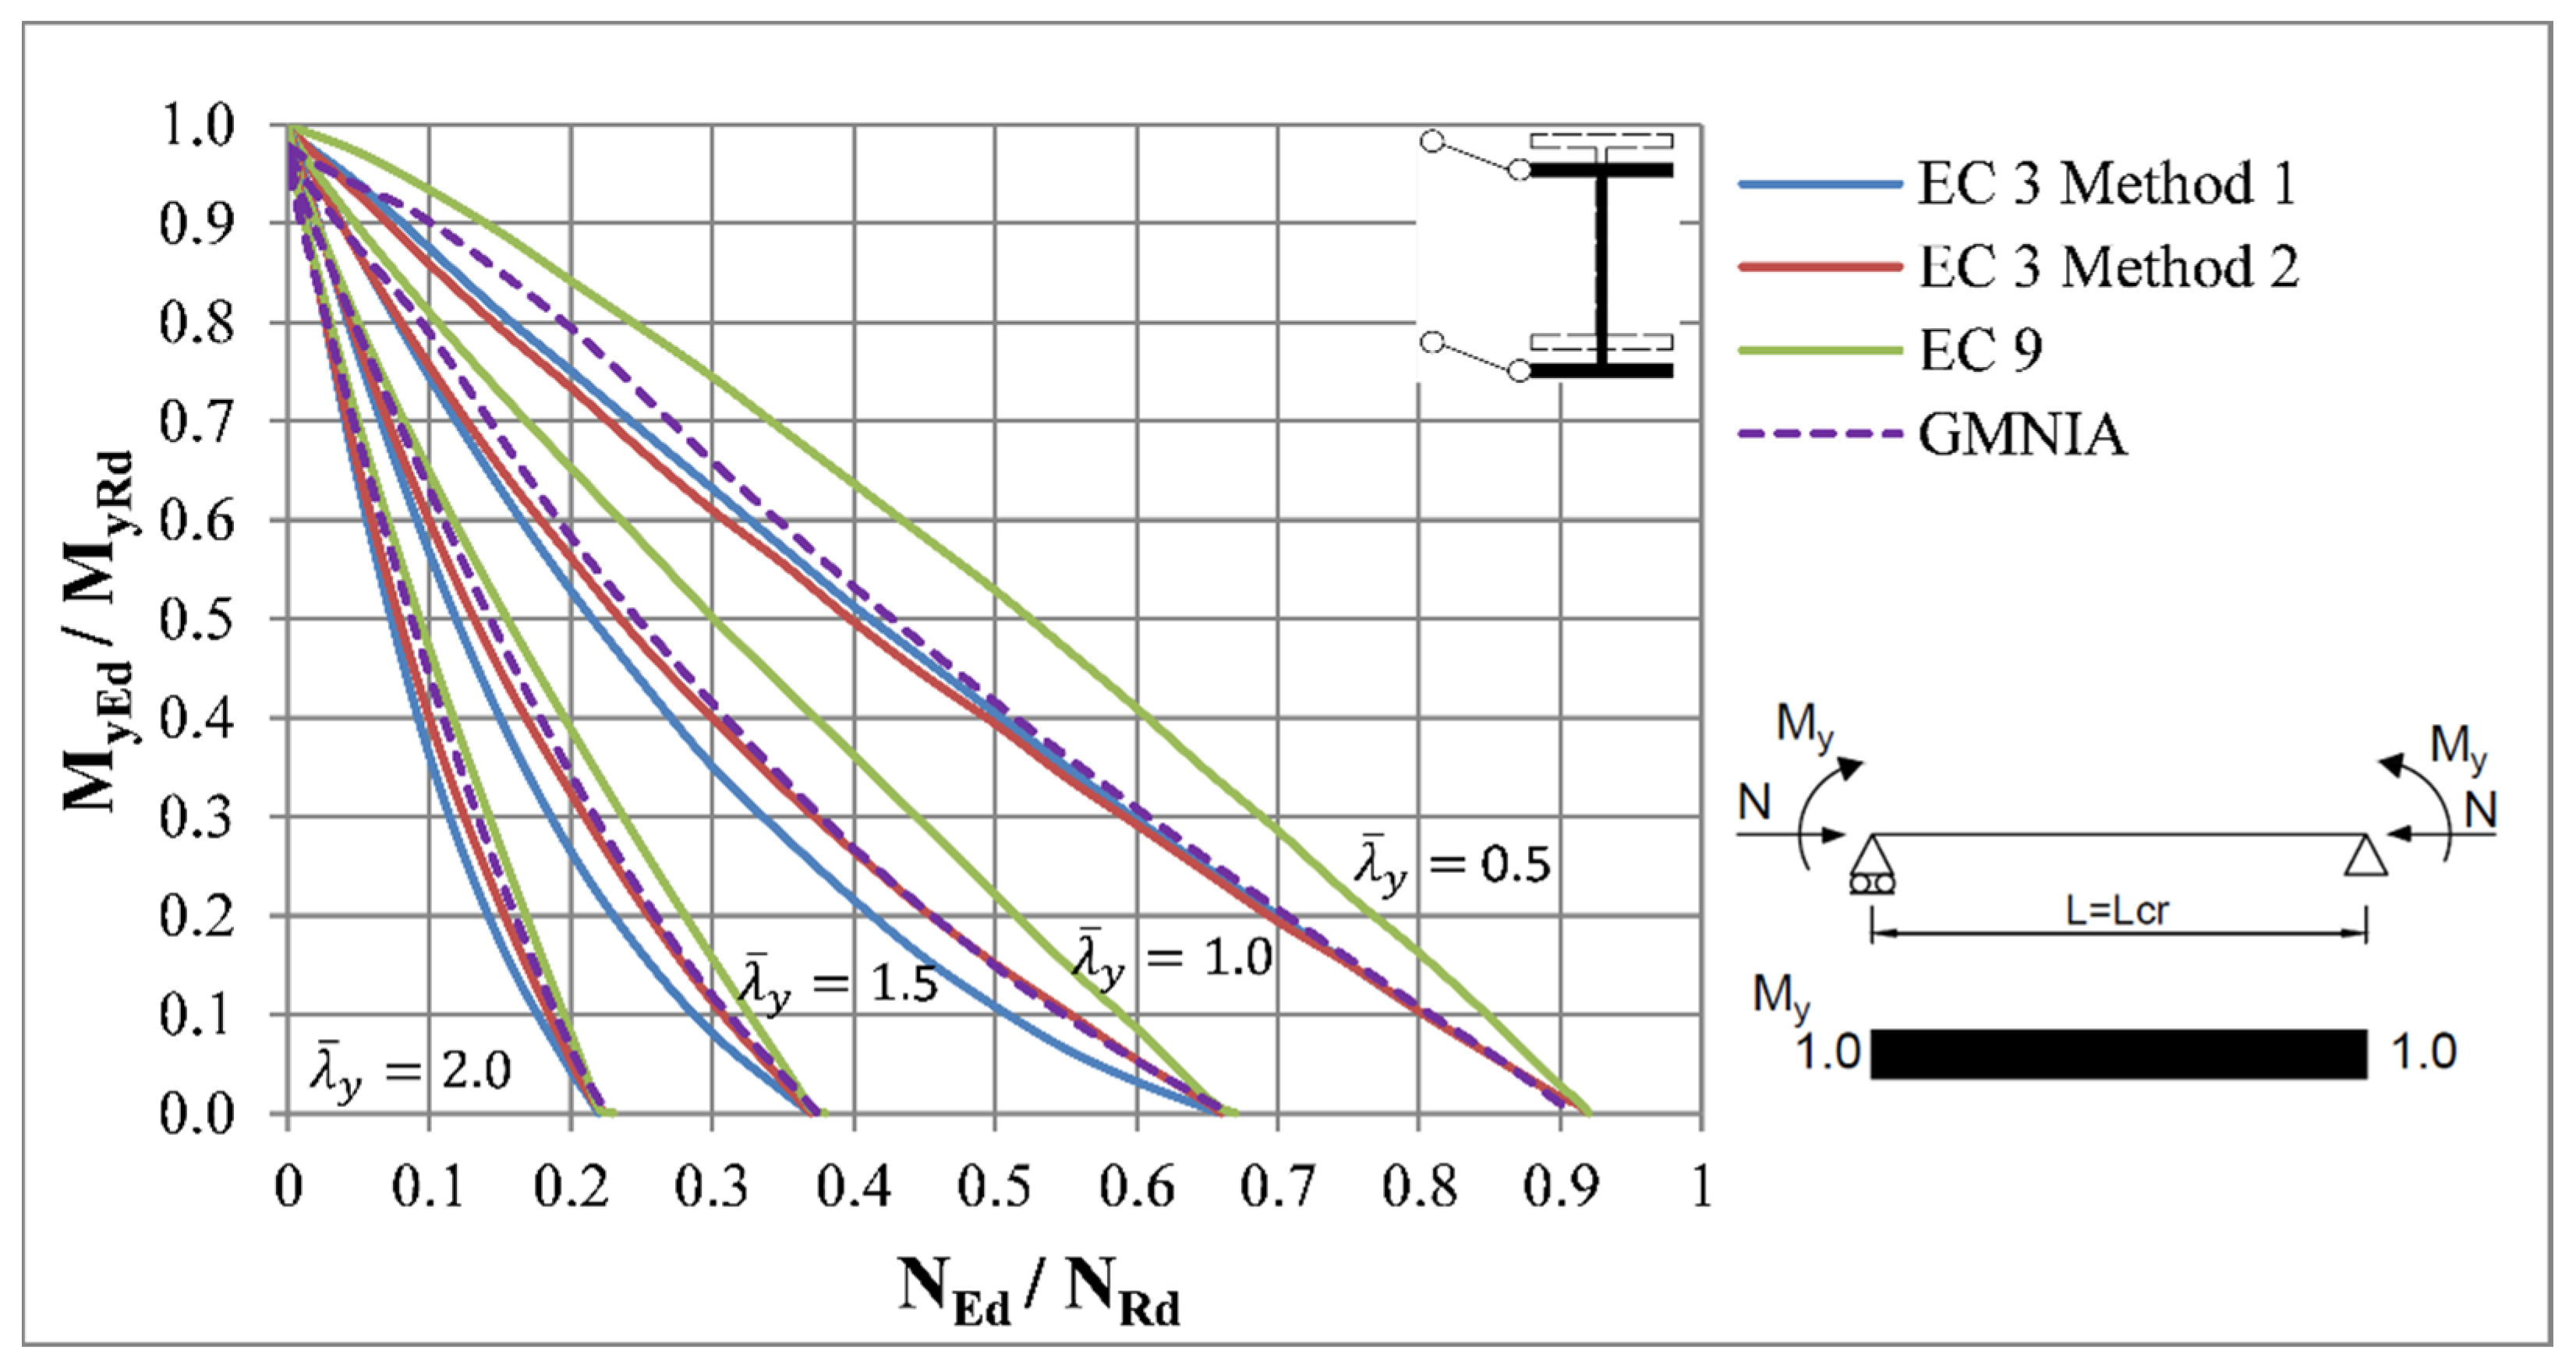
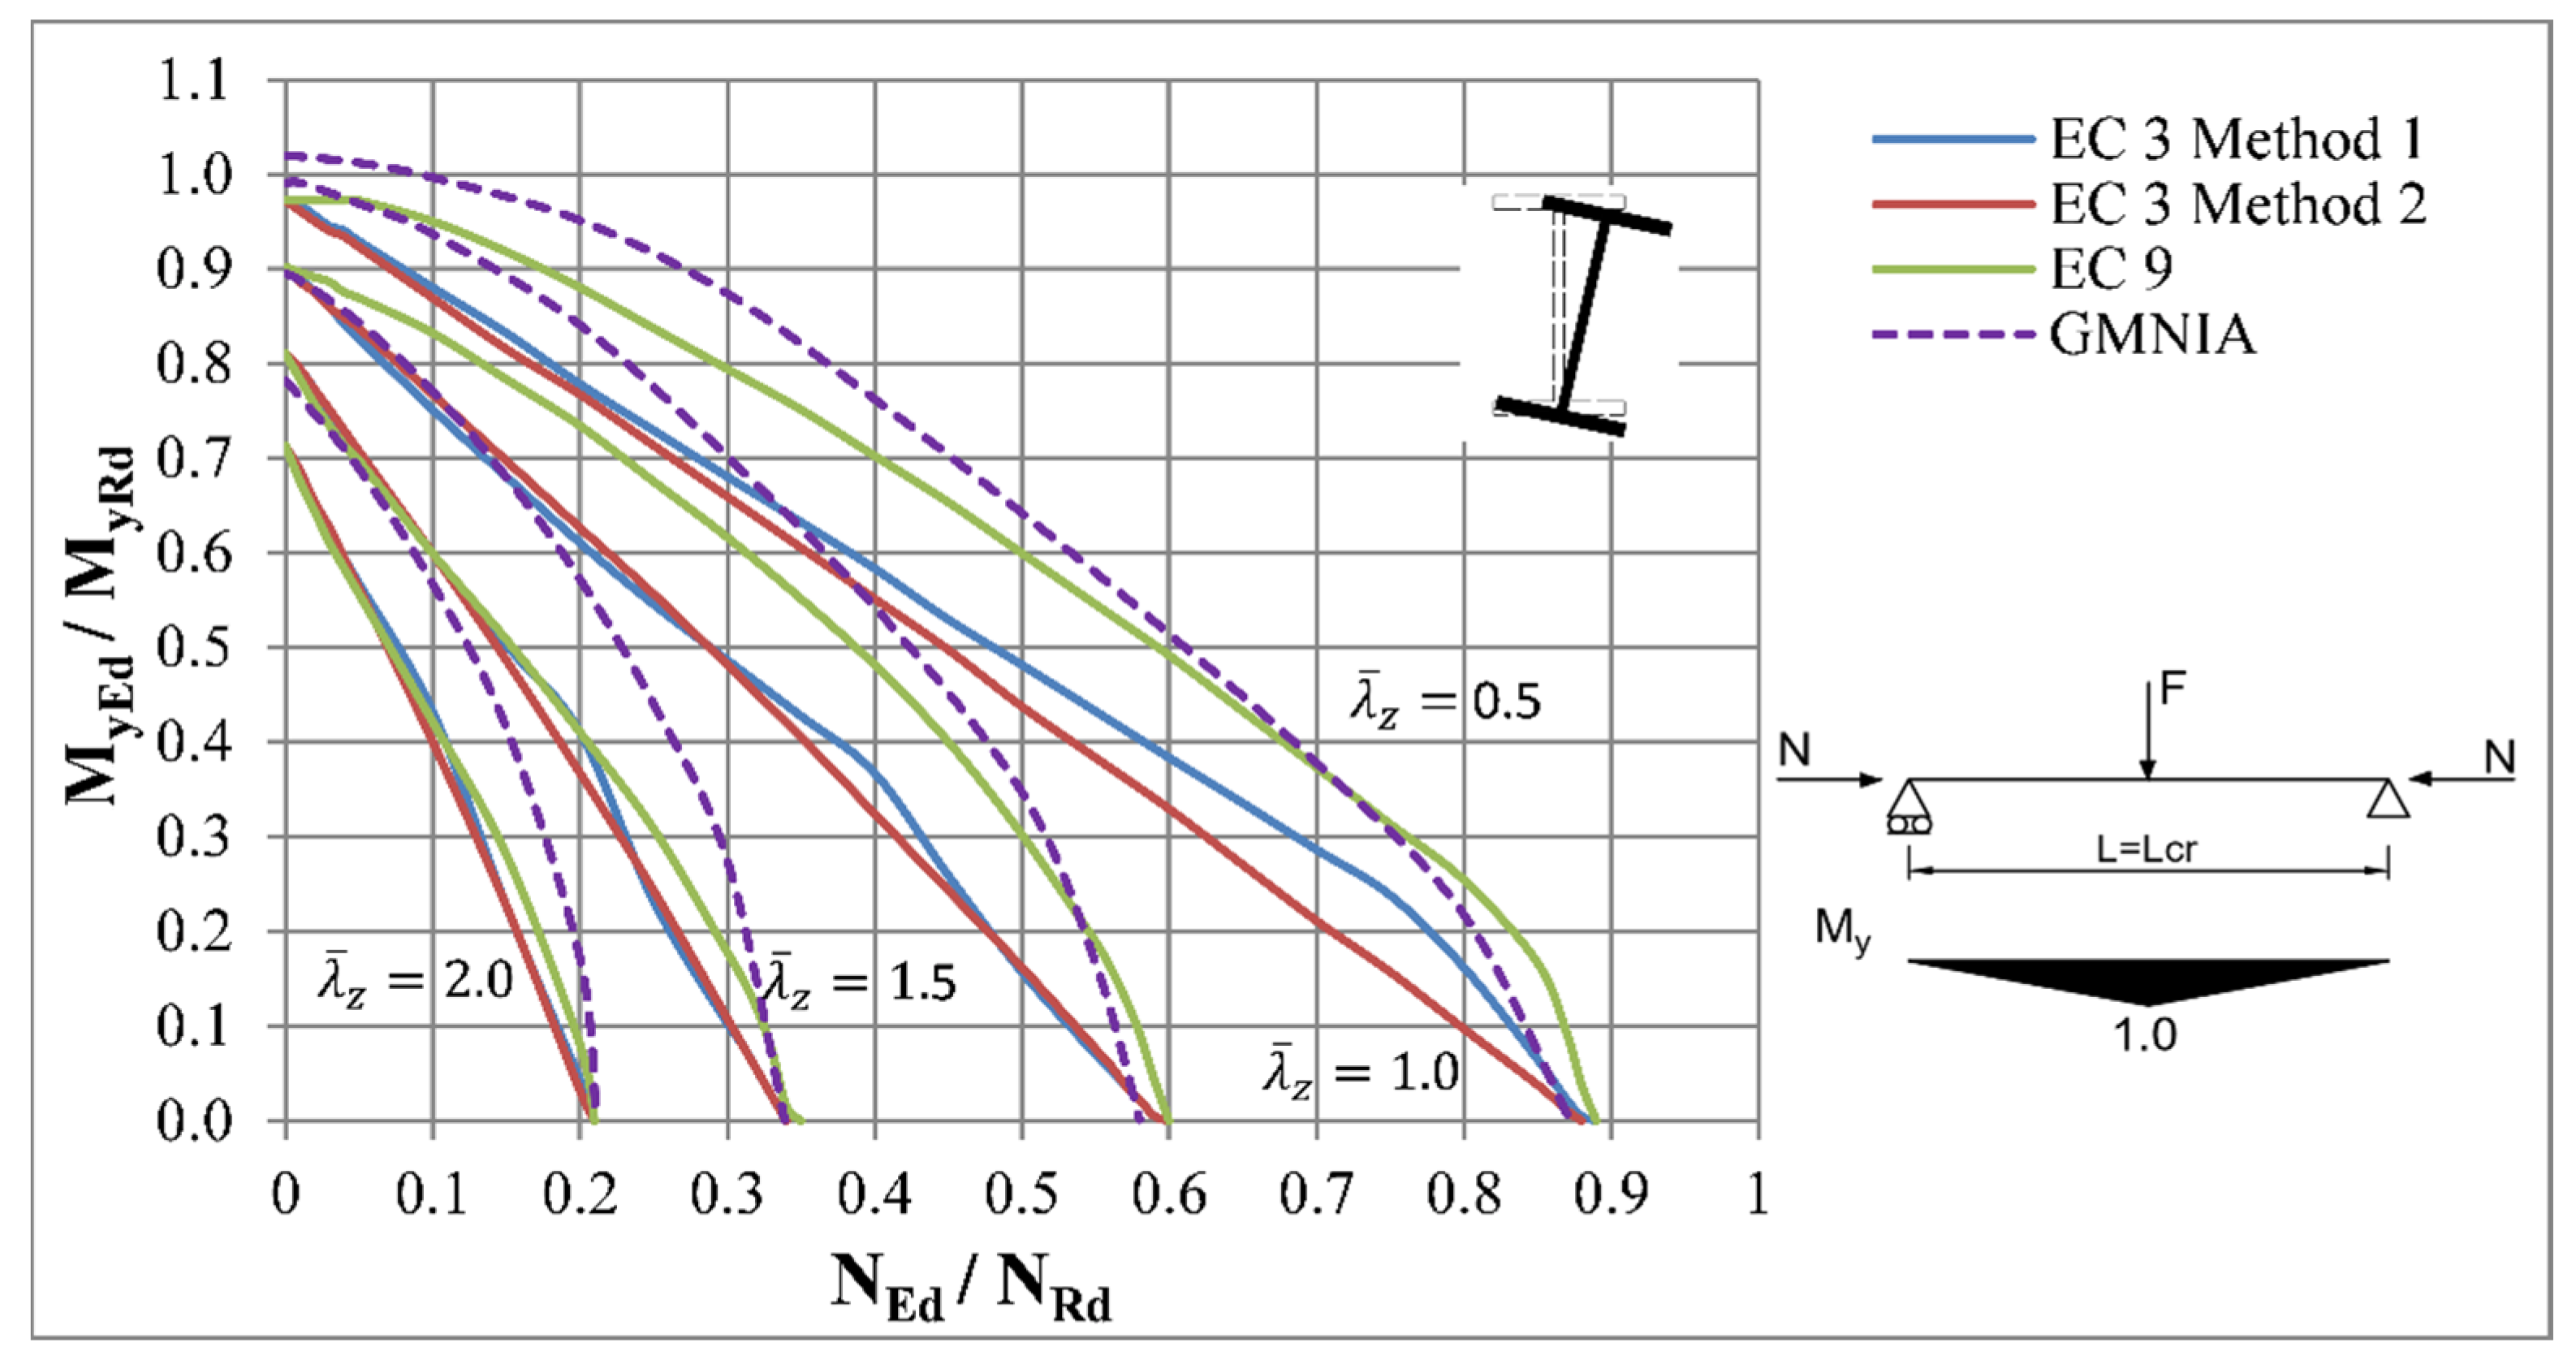
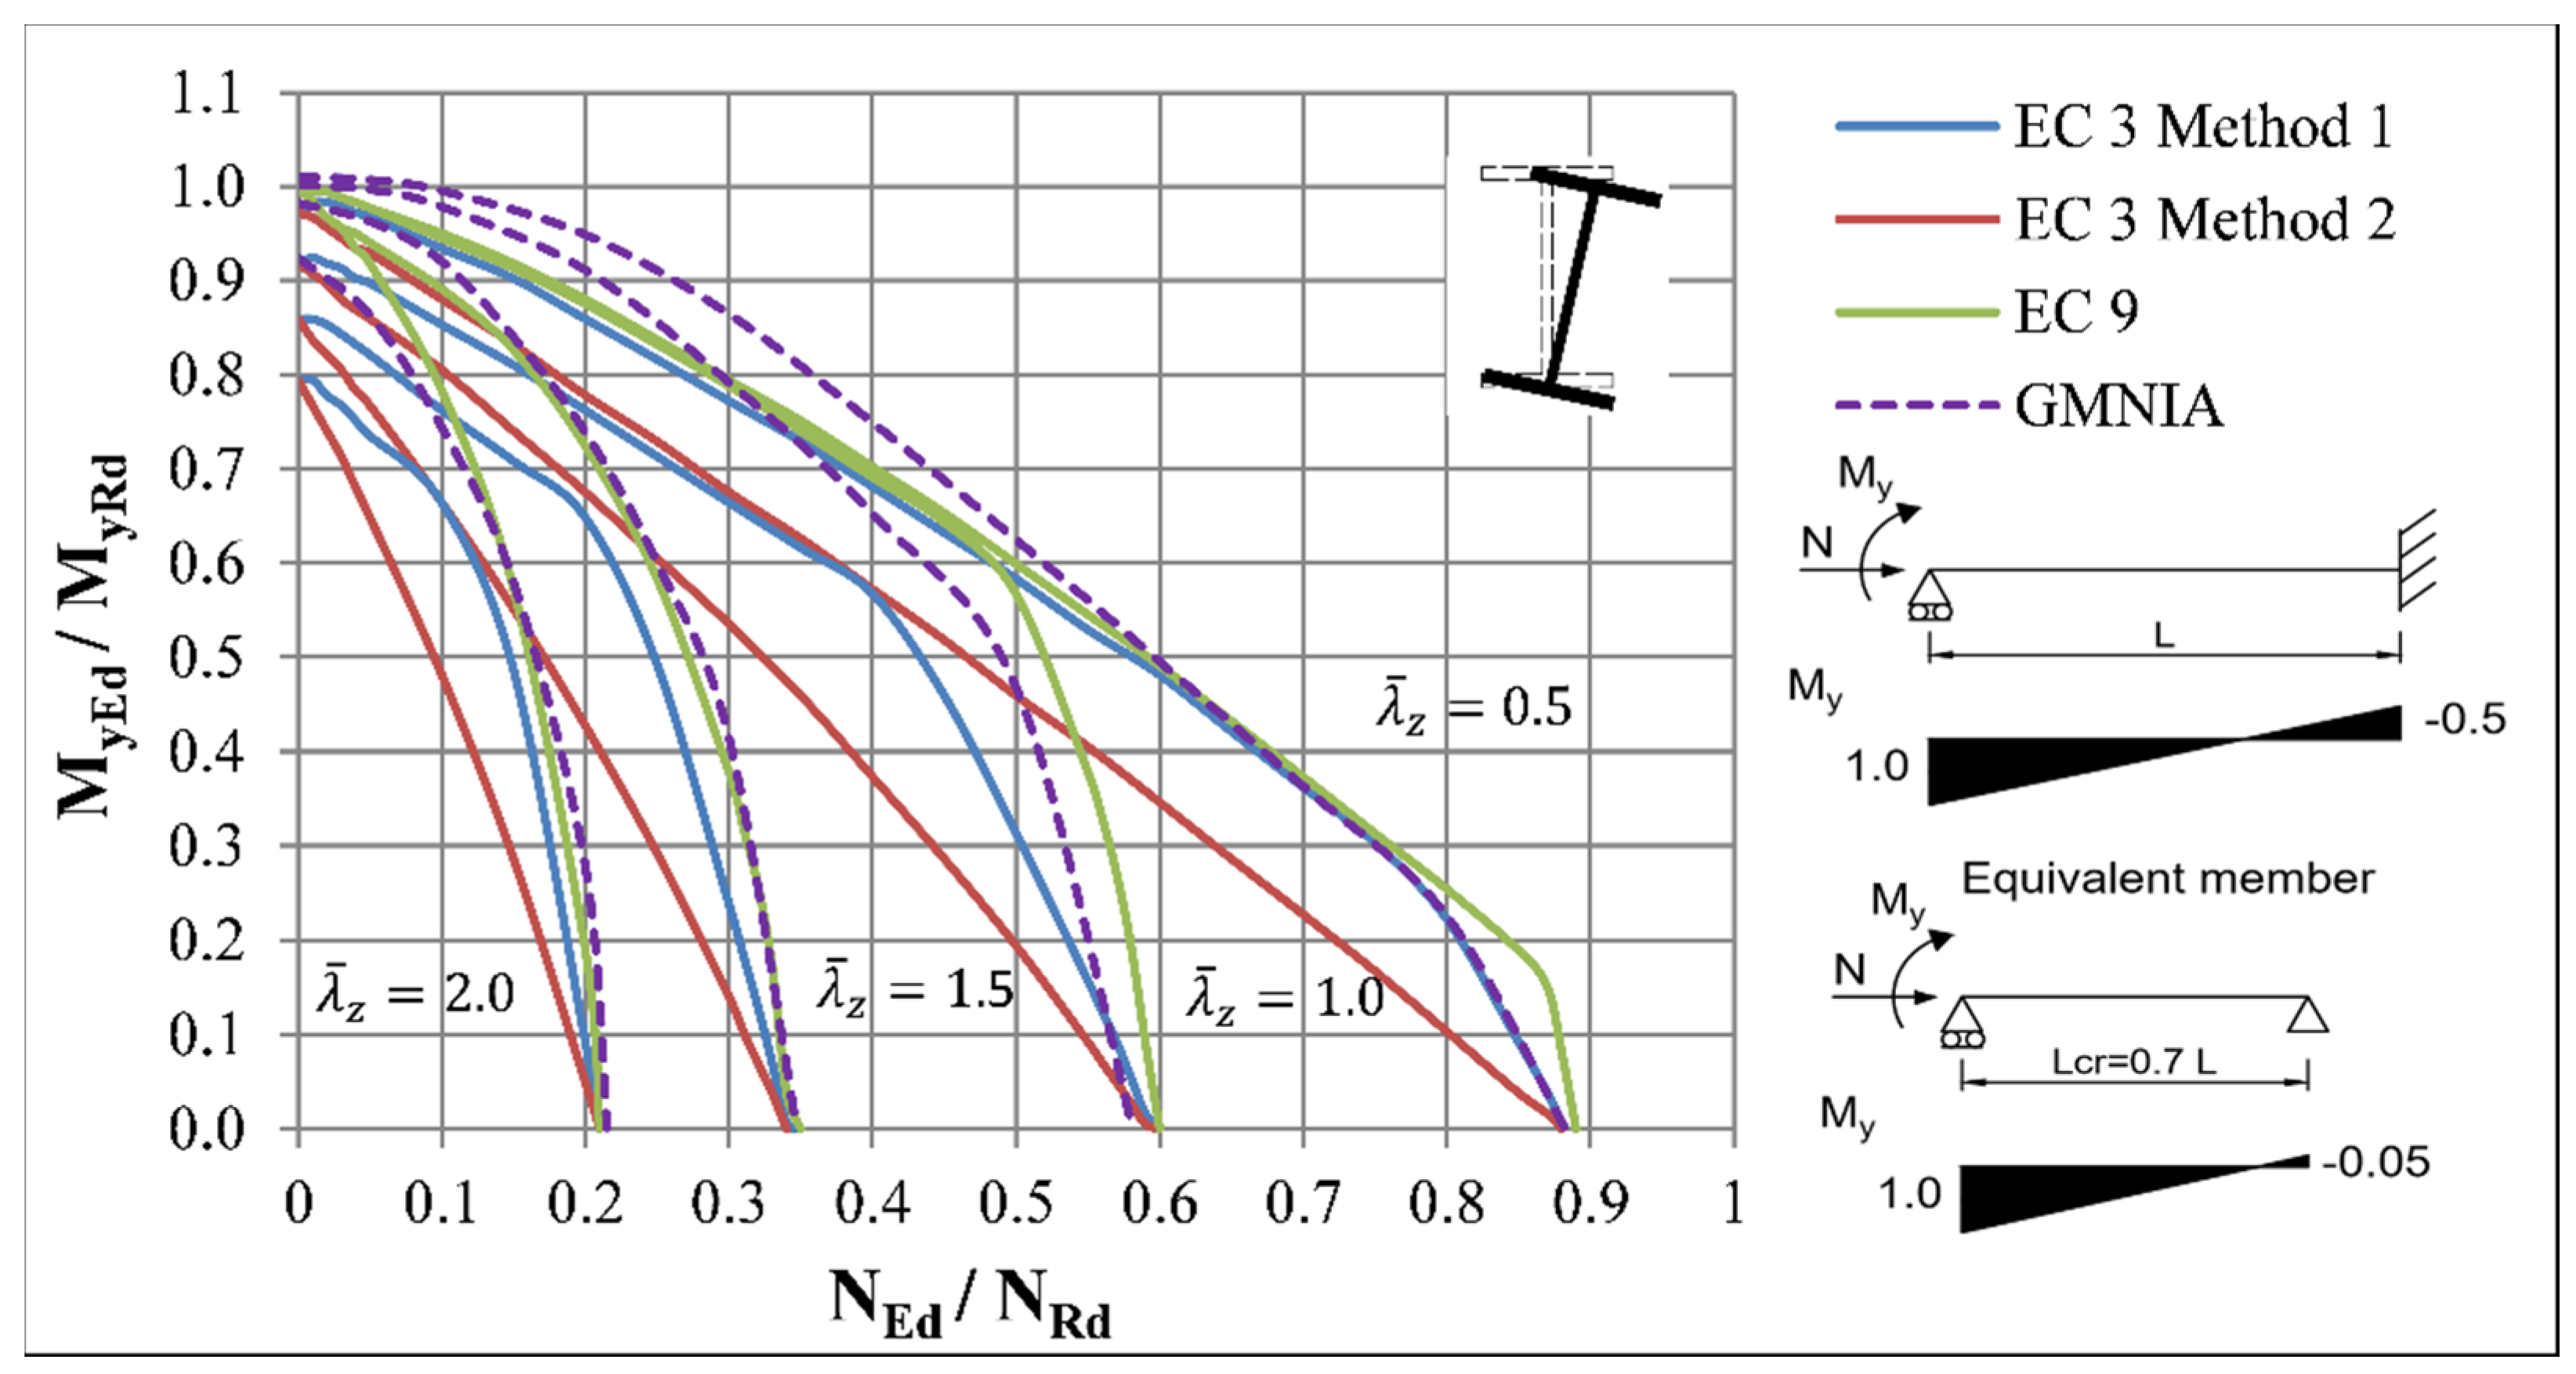
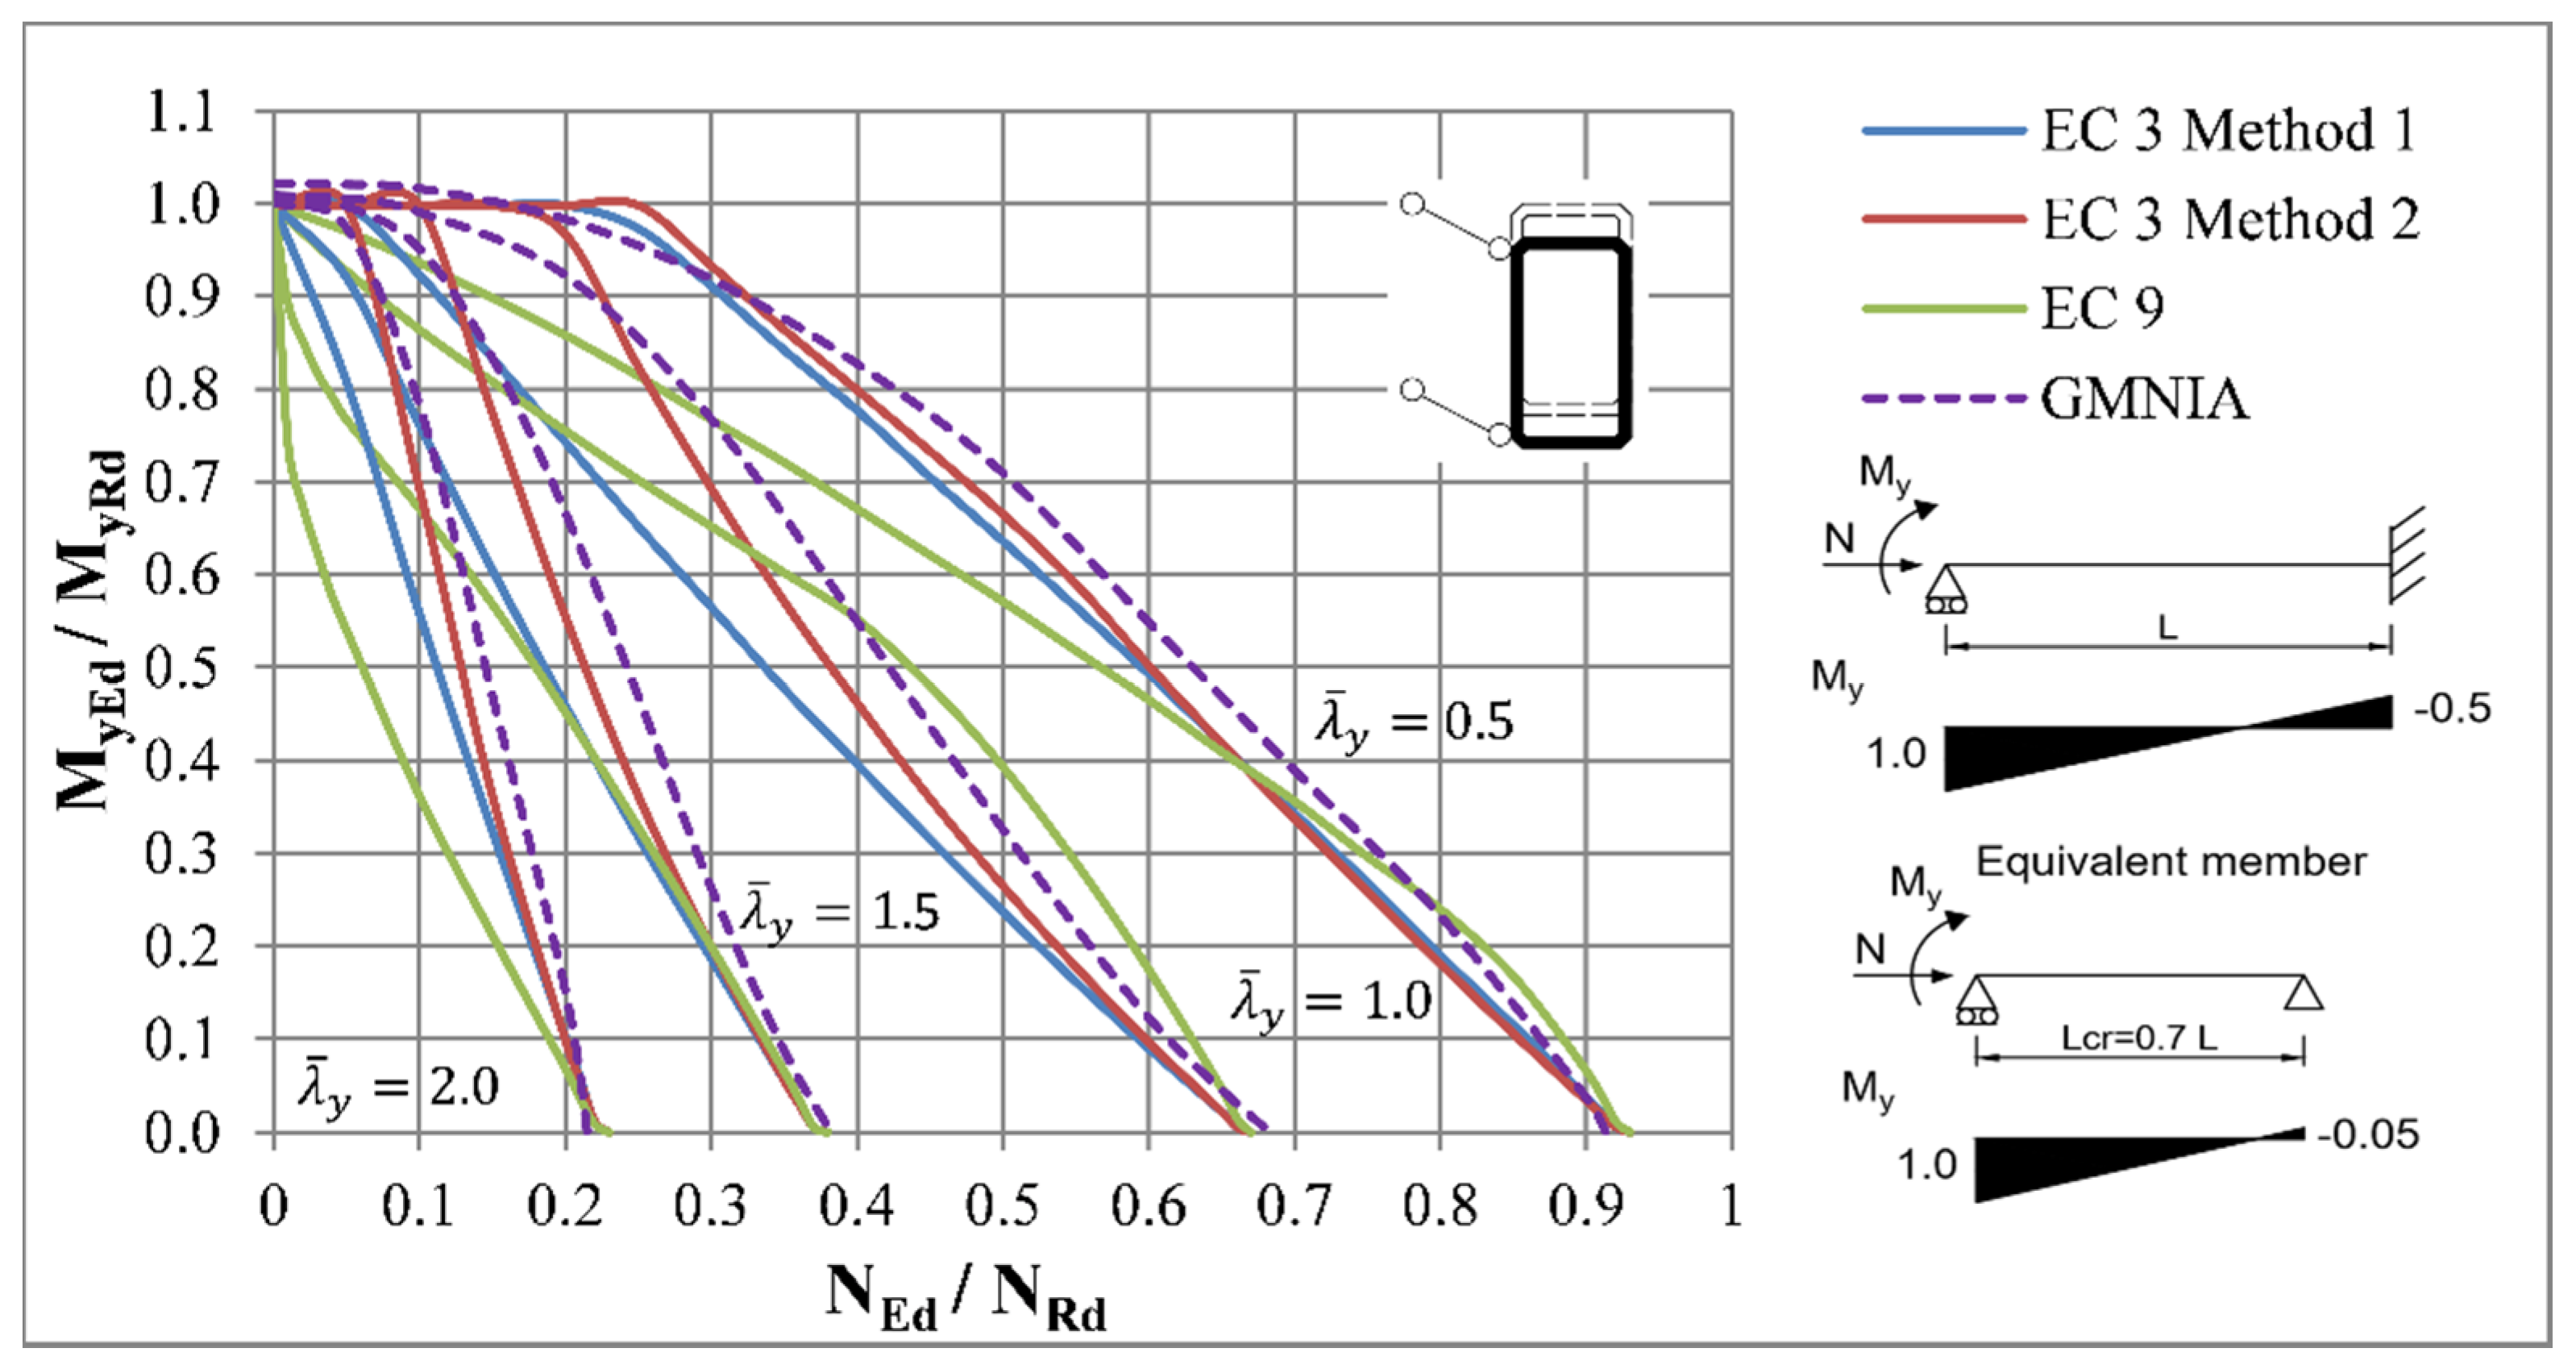
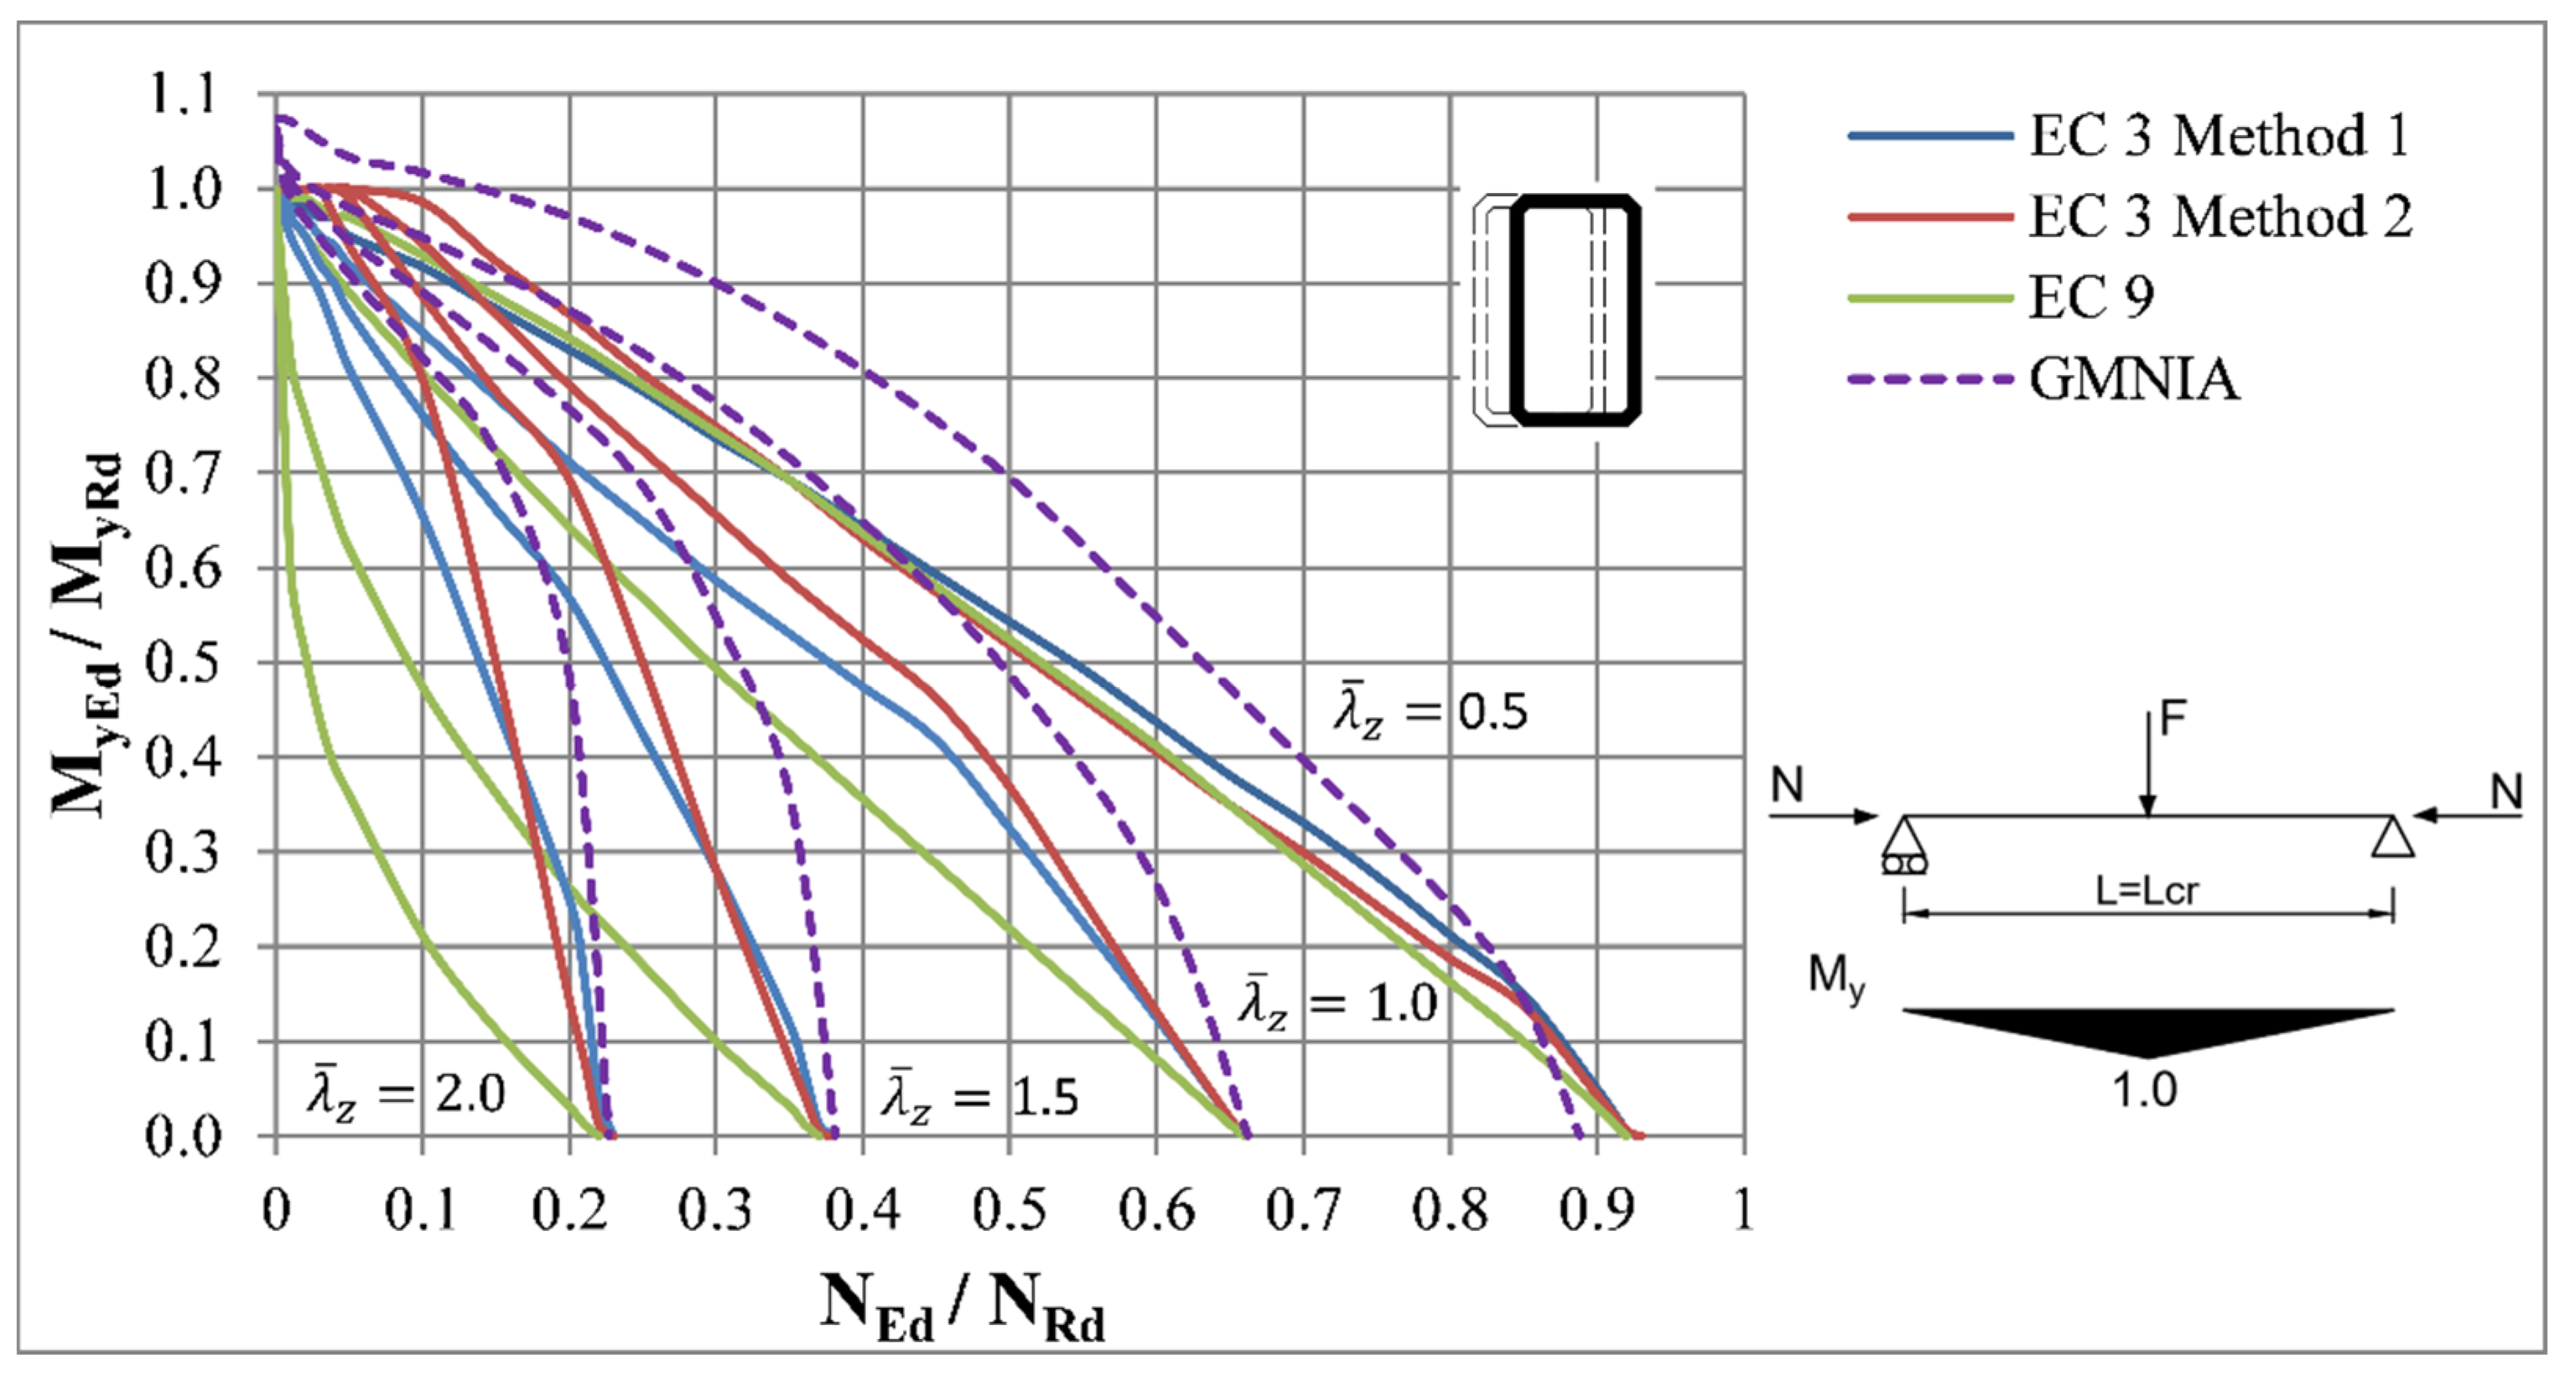
As can be seen, in the case of pin ended beam-column Methods 1 and 2 of Eurocode 3 are calibrated correctly. The interaction curves have the same tendencies as the curves obtained by the numerical analysis, especially in the high levels of axial force. Moreover, Methods 1 and 2 generally provide conservative resistances for all load cases. The difference in these methods is in the case of the pinned-fixed beam column being higher, but the results are always on the safe side compared to numerical analysis. The accuracy of these methods is highly dependent on the kij interaction factors, which for both methods evaluated in a different way. The differences in resistances between these two methods are also the consequence of different values of interaction factors.
The interaction curves according to the method of Eurocode 9 are generally unsafe for all load cases. The resistances are on the safe side mostly for beam columns with relative slenderness . Despite these results, it can be seen that interaction curves have the same character as the curves acquired by the numerical analysis.
The beneficial effect of the bending moment diagram on the beam-column resistance can be seen from the comparison of the numerical curves for different load cases, as it plays a role in the extent of yielding at the ultimate limit state [4]. This is most notable for the slenderness ratio , where the beam-columns subjected to concentrated load in the middle of the span reached the highest values of resistance. This effect is accounted in the Eurocode 3 by means of the Cm factor. However, it can be seen that this effect is not included in the interaction formulae for the method of Eurocode 9, as this method provided the same values of resistances for all load cases.
3.1.2. Axial Compression and Major-Axis Bending without Lateral Restraints
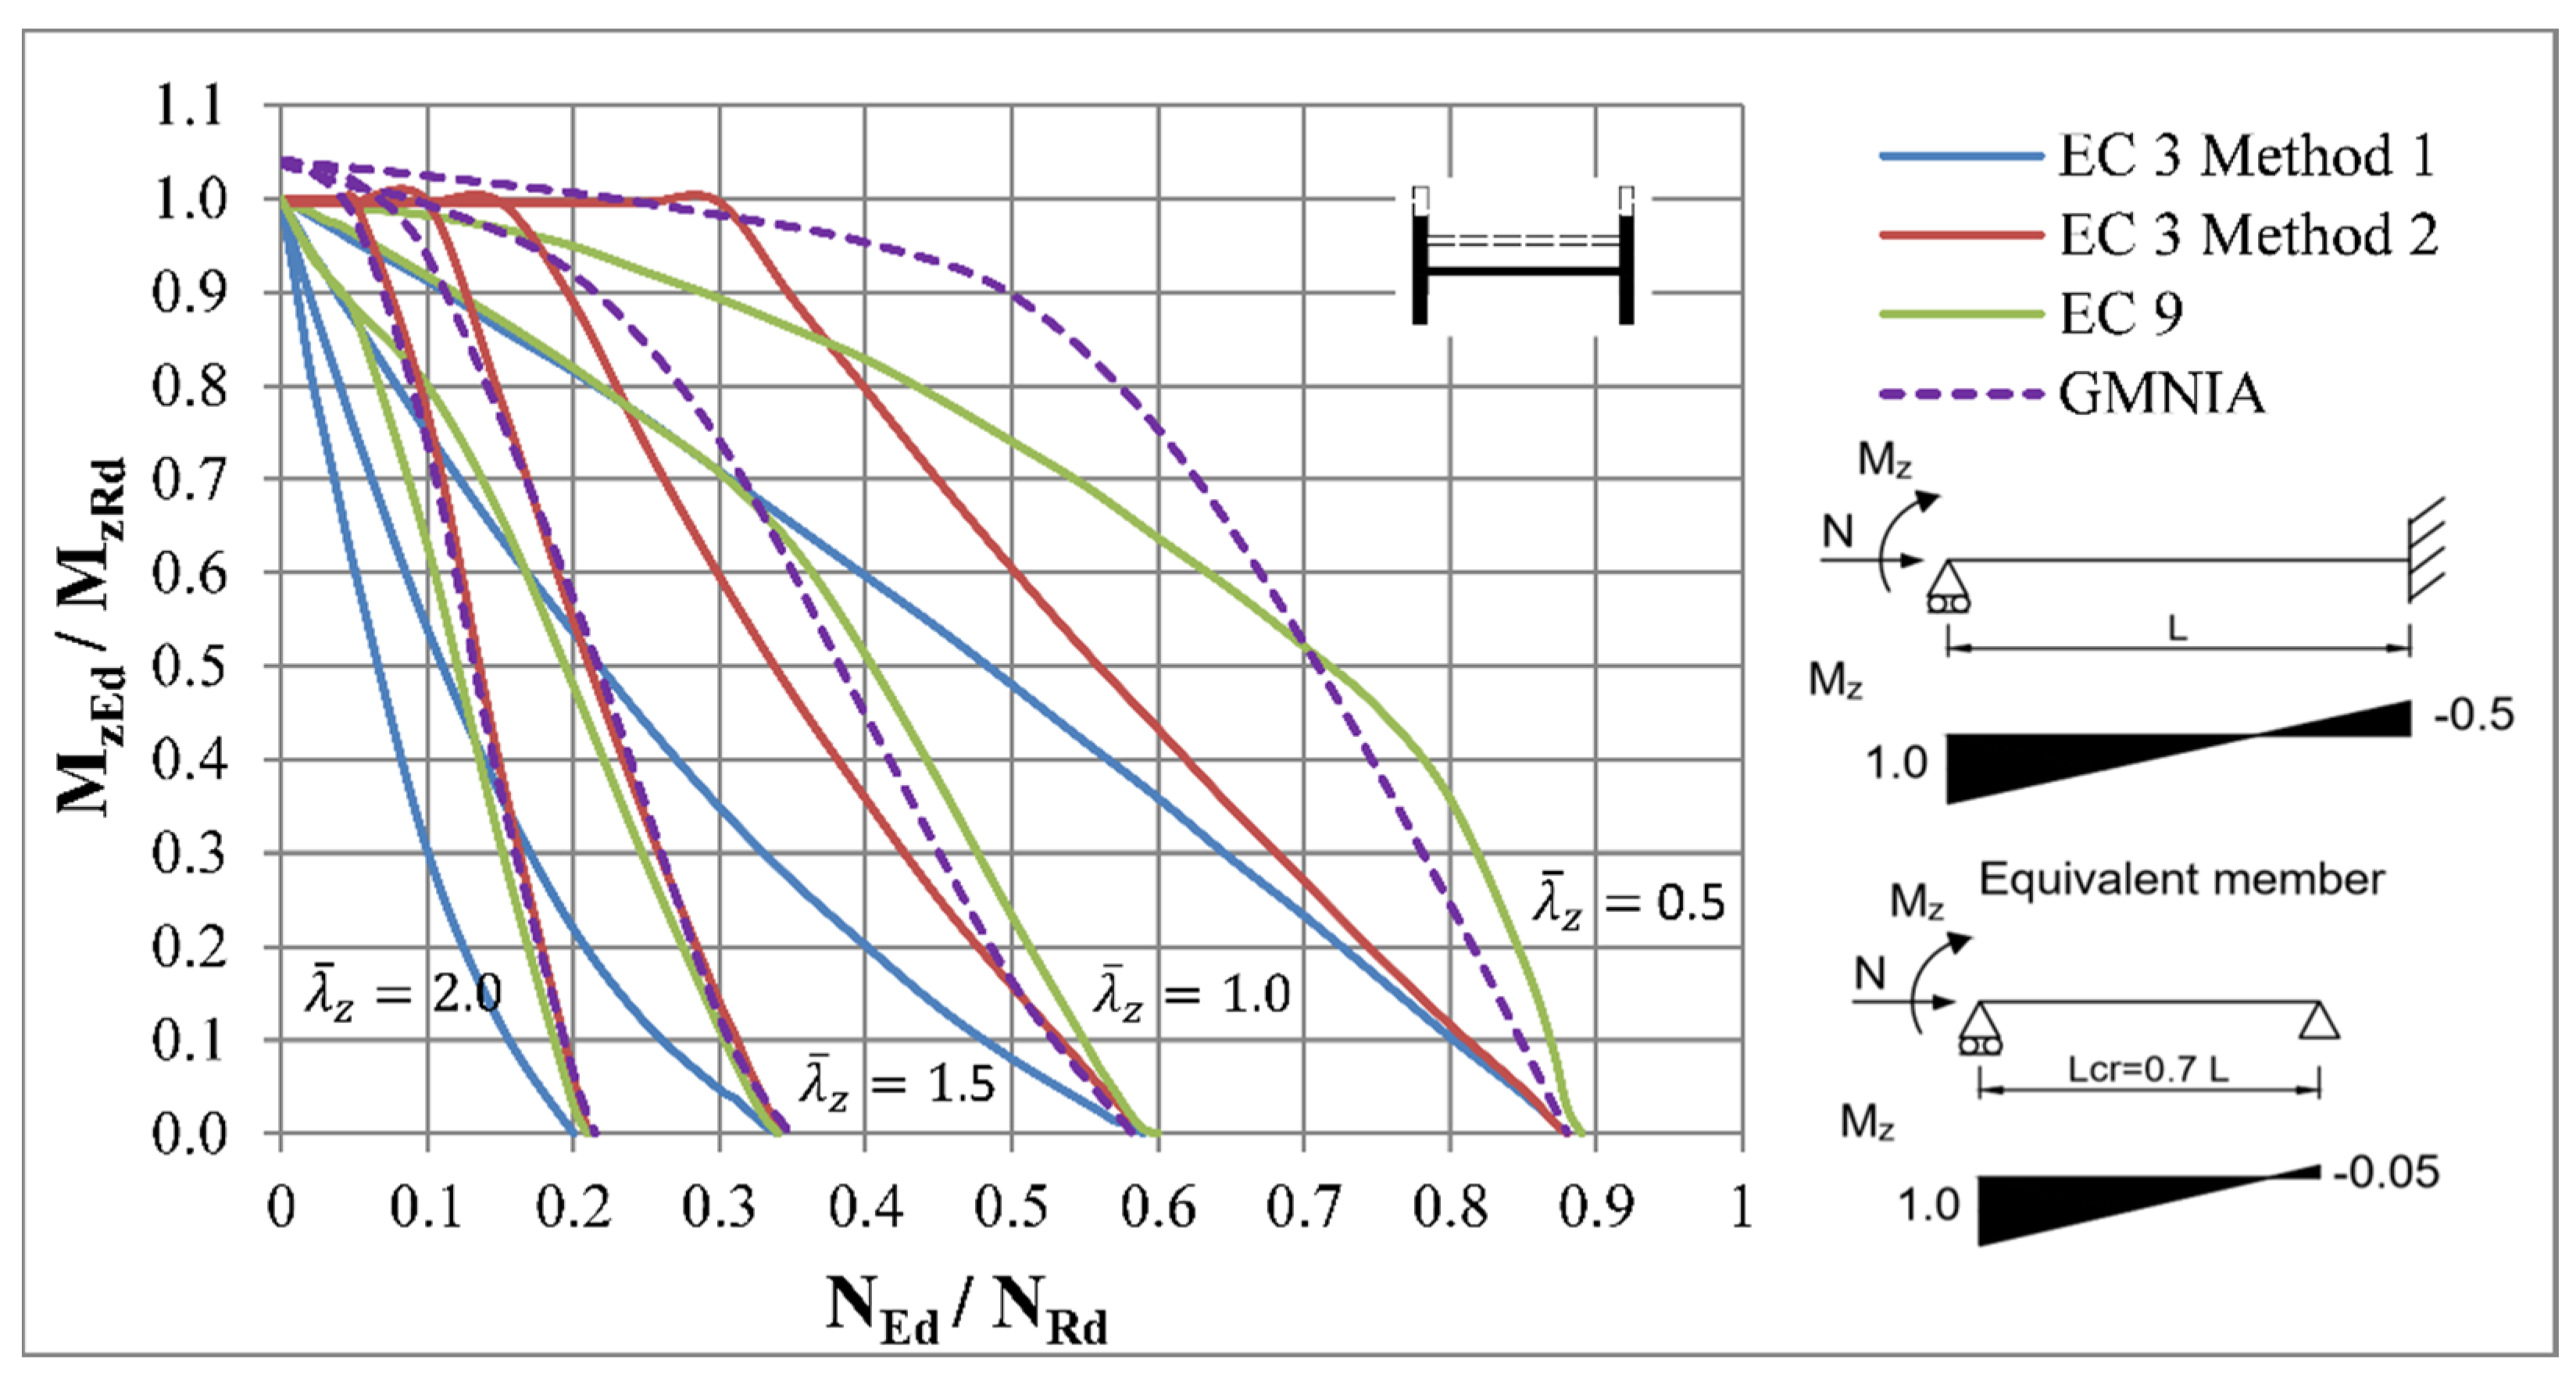
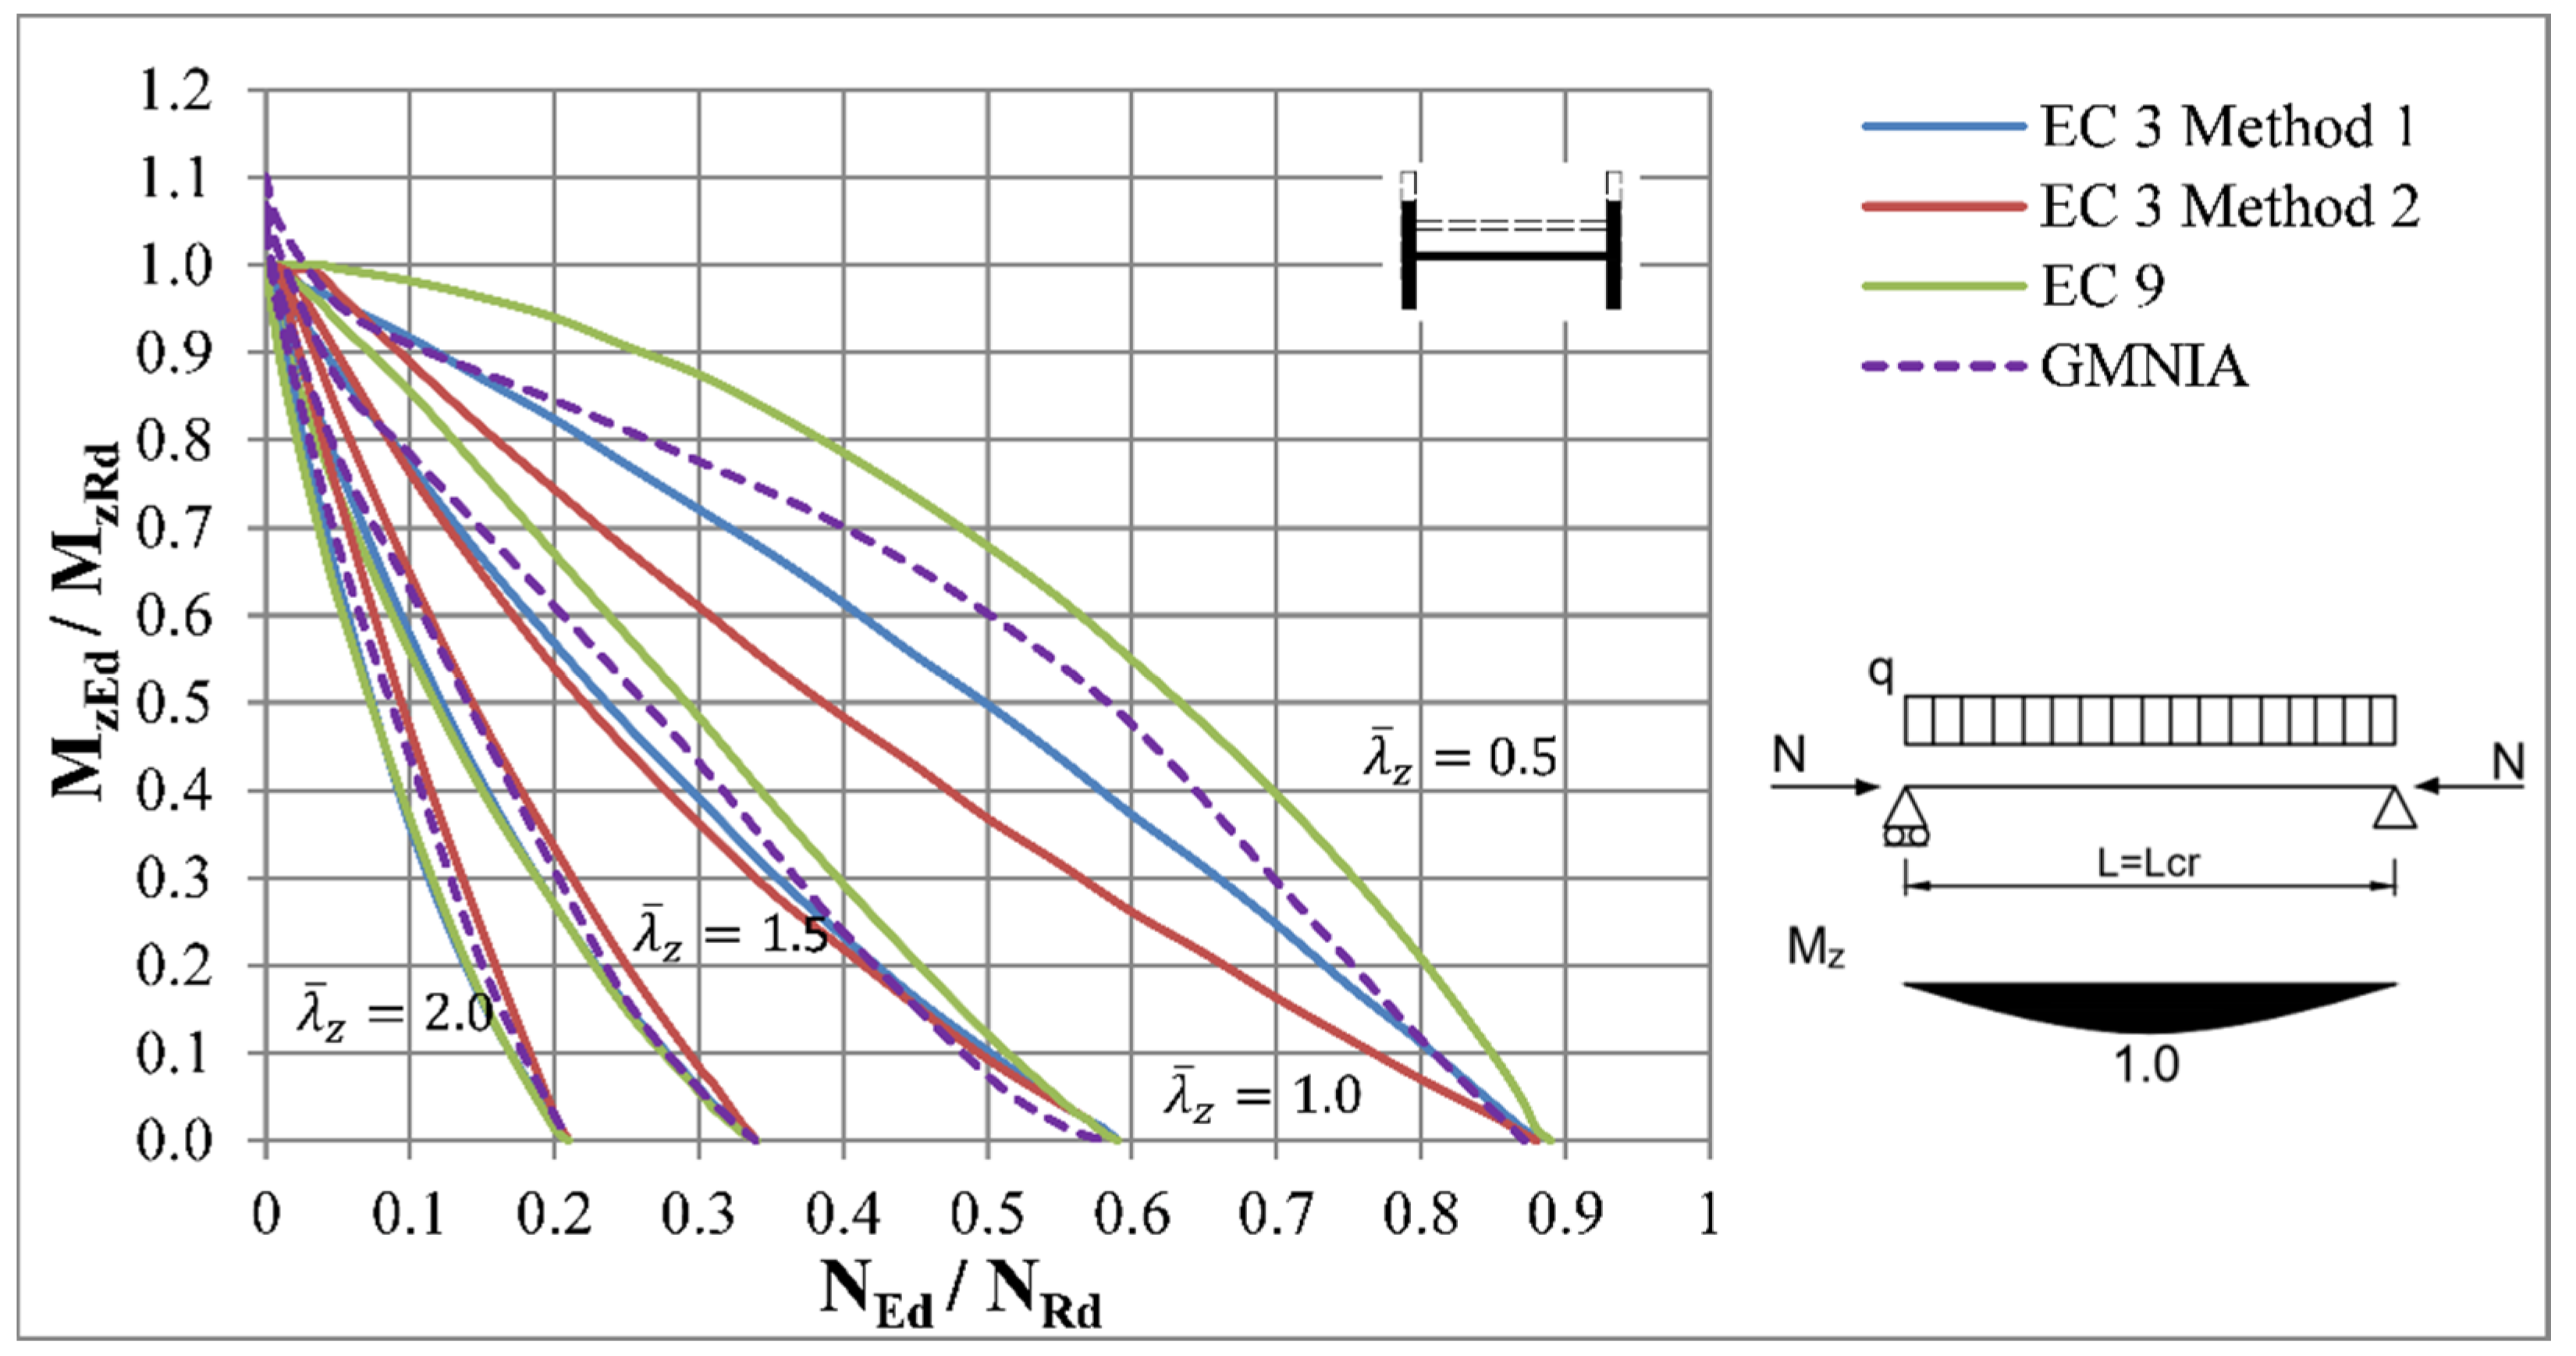
In the case of beam-columns without sufficient lateral restraints, lateral deflections may occur due to the action of an axial compressive force; therefore, the behaviour of such restrained members is different compared to previous loading conditions. Moreover, twisting can also occur to members with cross-sections prone to torsional deformations subjected to bending moments, which generates additional normal stresses in the flanges. However, warping is often restrained in design practice by end plates, which affect the distribution of normal stresses and warping torsion. Therefore, two loading conditions were observed in this section, with restrained and free warping member ends. A loading condition with restrained warping is presented first, as the modelling technique of end cross-sections remains the same. Reduction factors for lateral-torsional buckling for all methods were calculated according to clause 6.3.2.2 of Eurocode 3 [8].
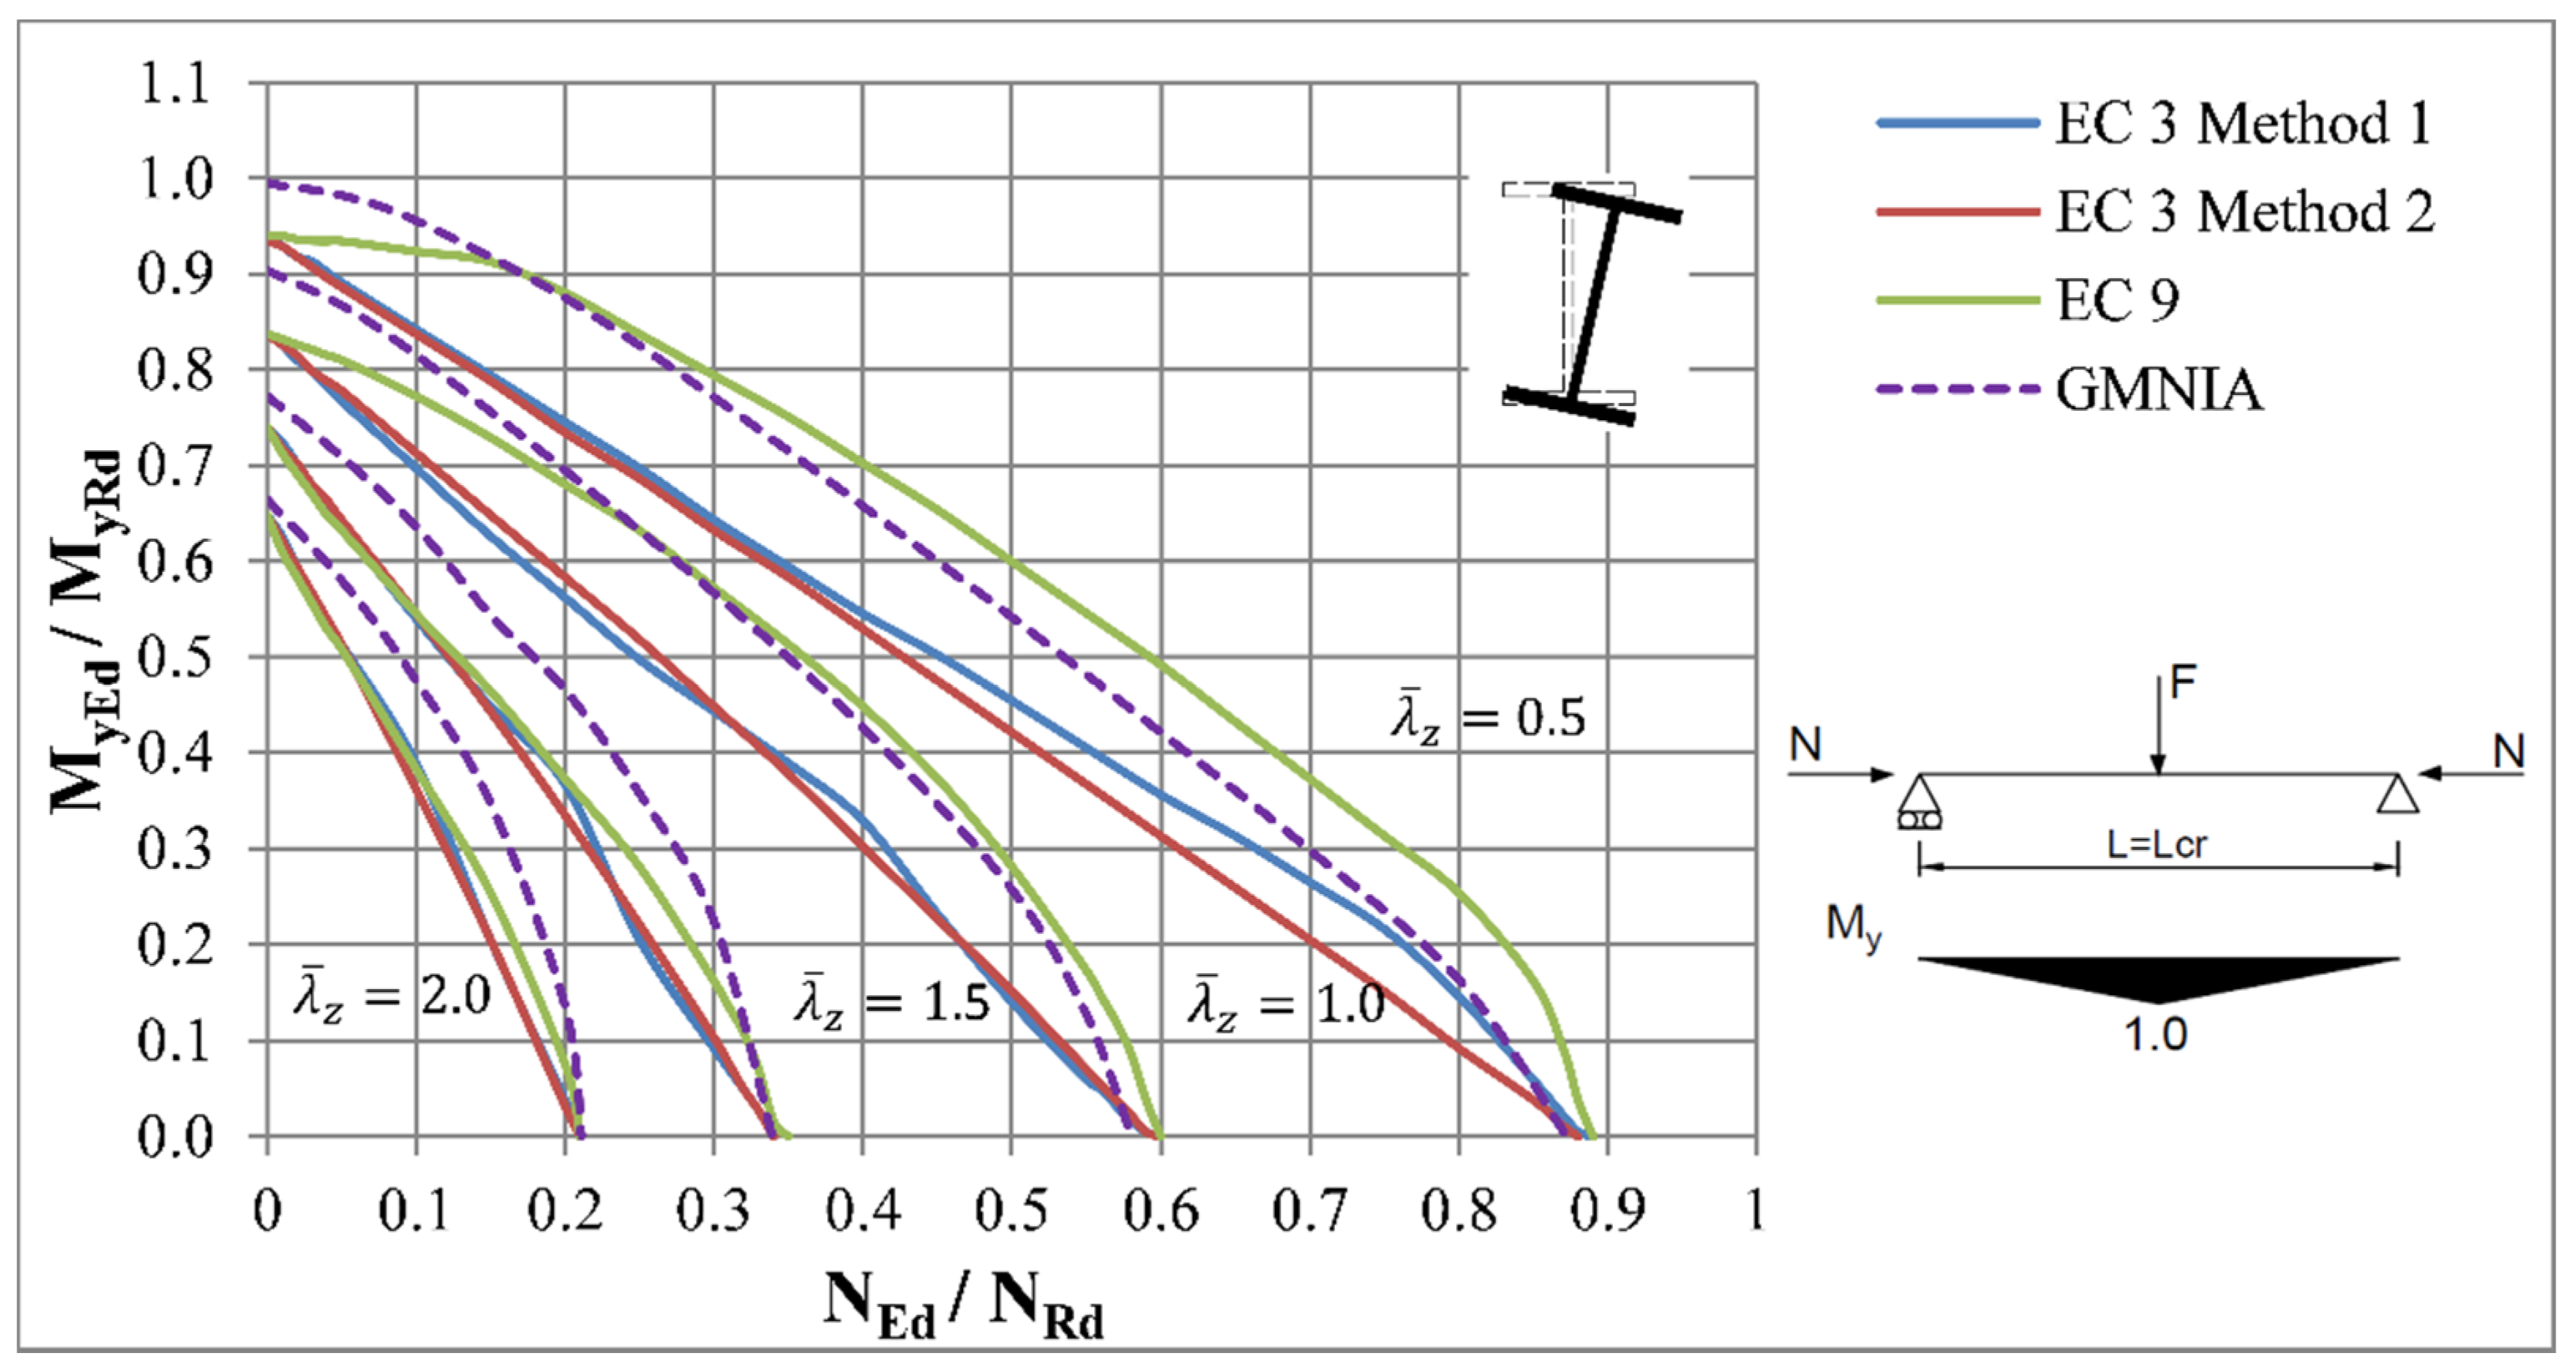
However, another adjustment was needed in the case of members loaded by concentrated force in the middle of the span with relative slenderness . Due to the member lengths, the forces which created high bending moments had to be so high that they also trigger local instabilities in the web beneath. Therefore, one approach about how to treat this effect is to consider a web stiffener (Figure 13), which was also used in the study performed by Boissonnade [32].
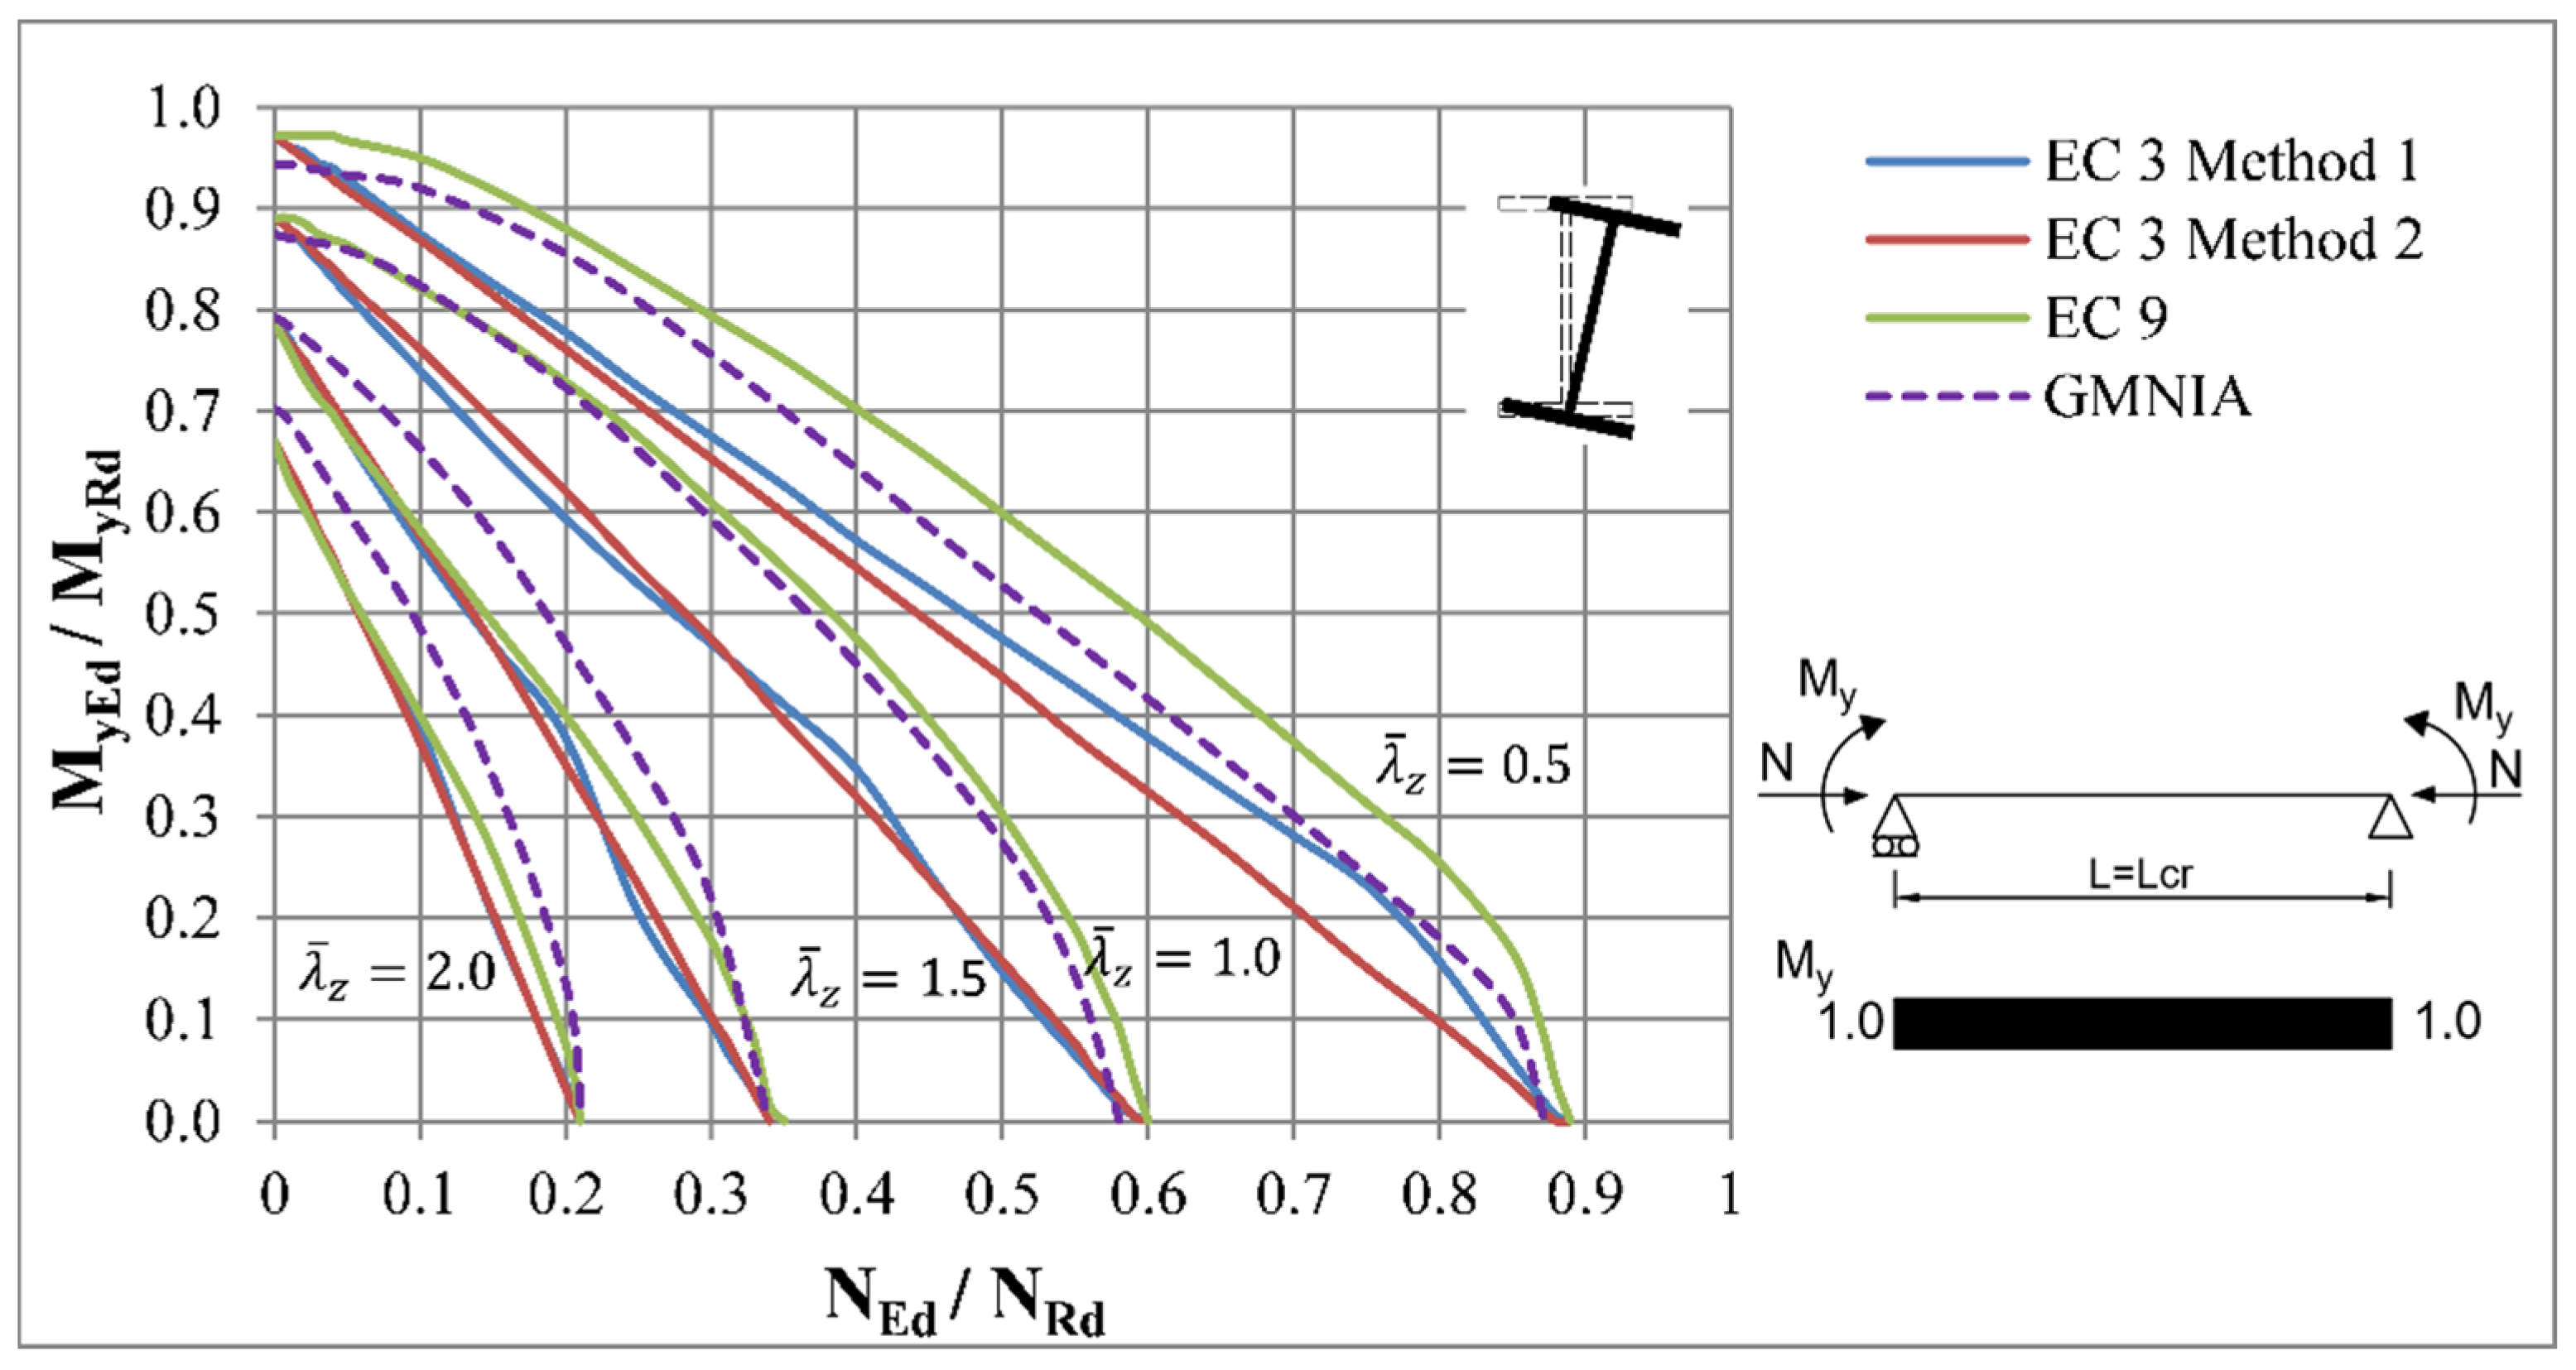
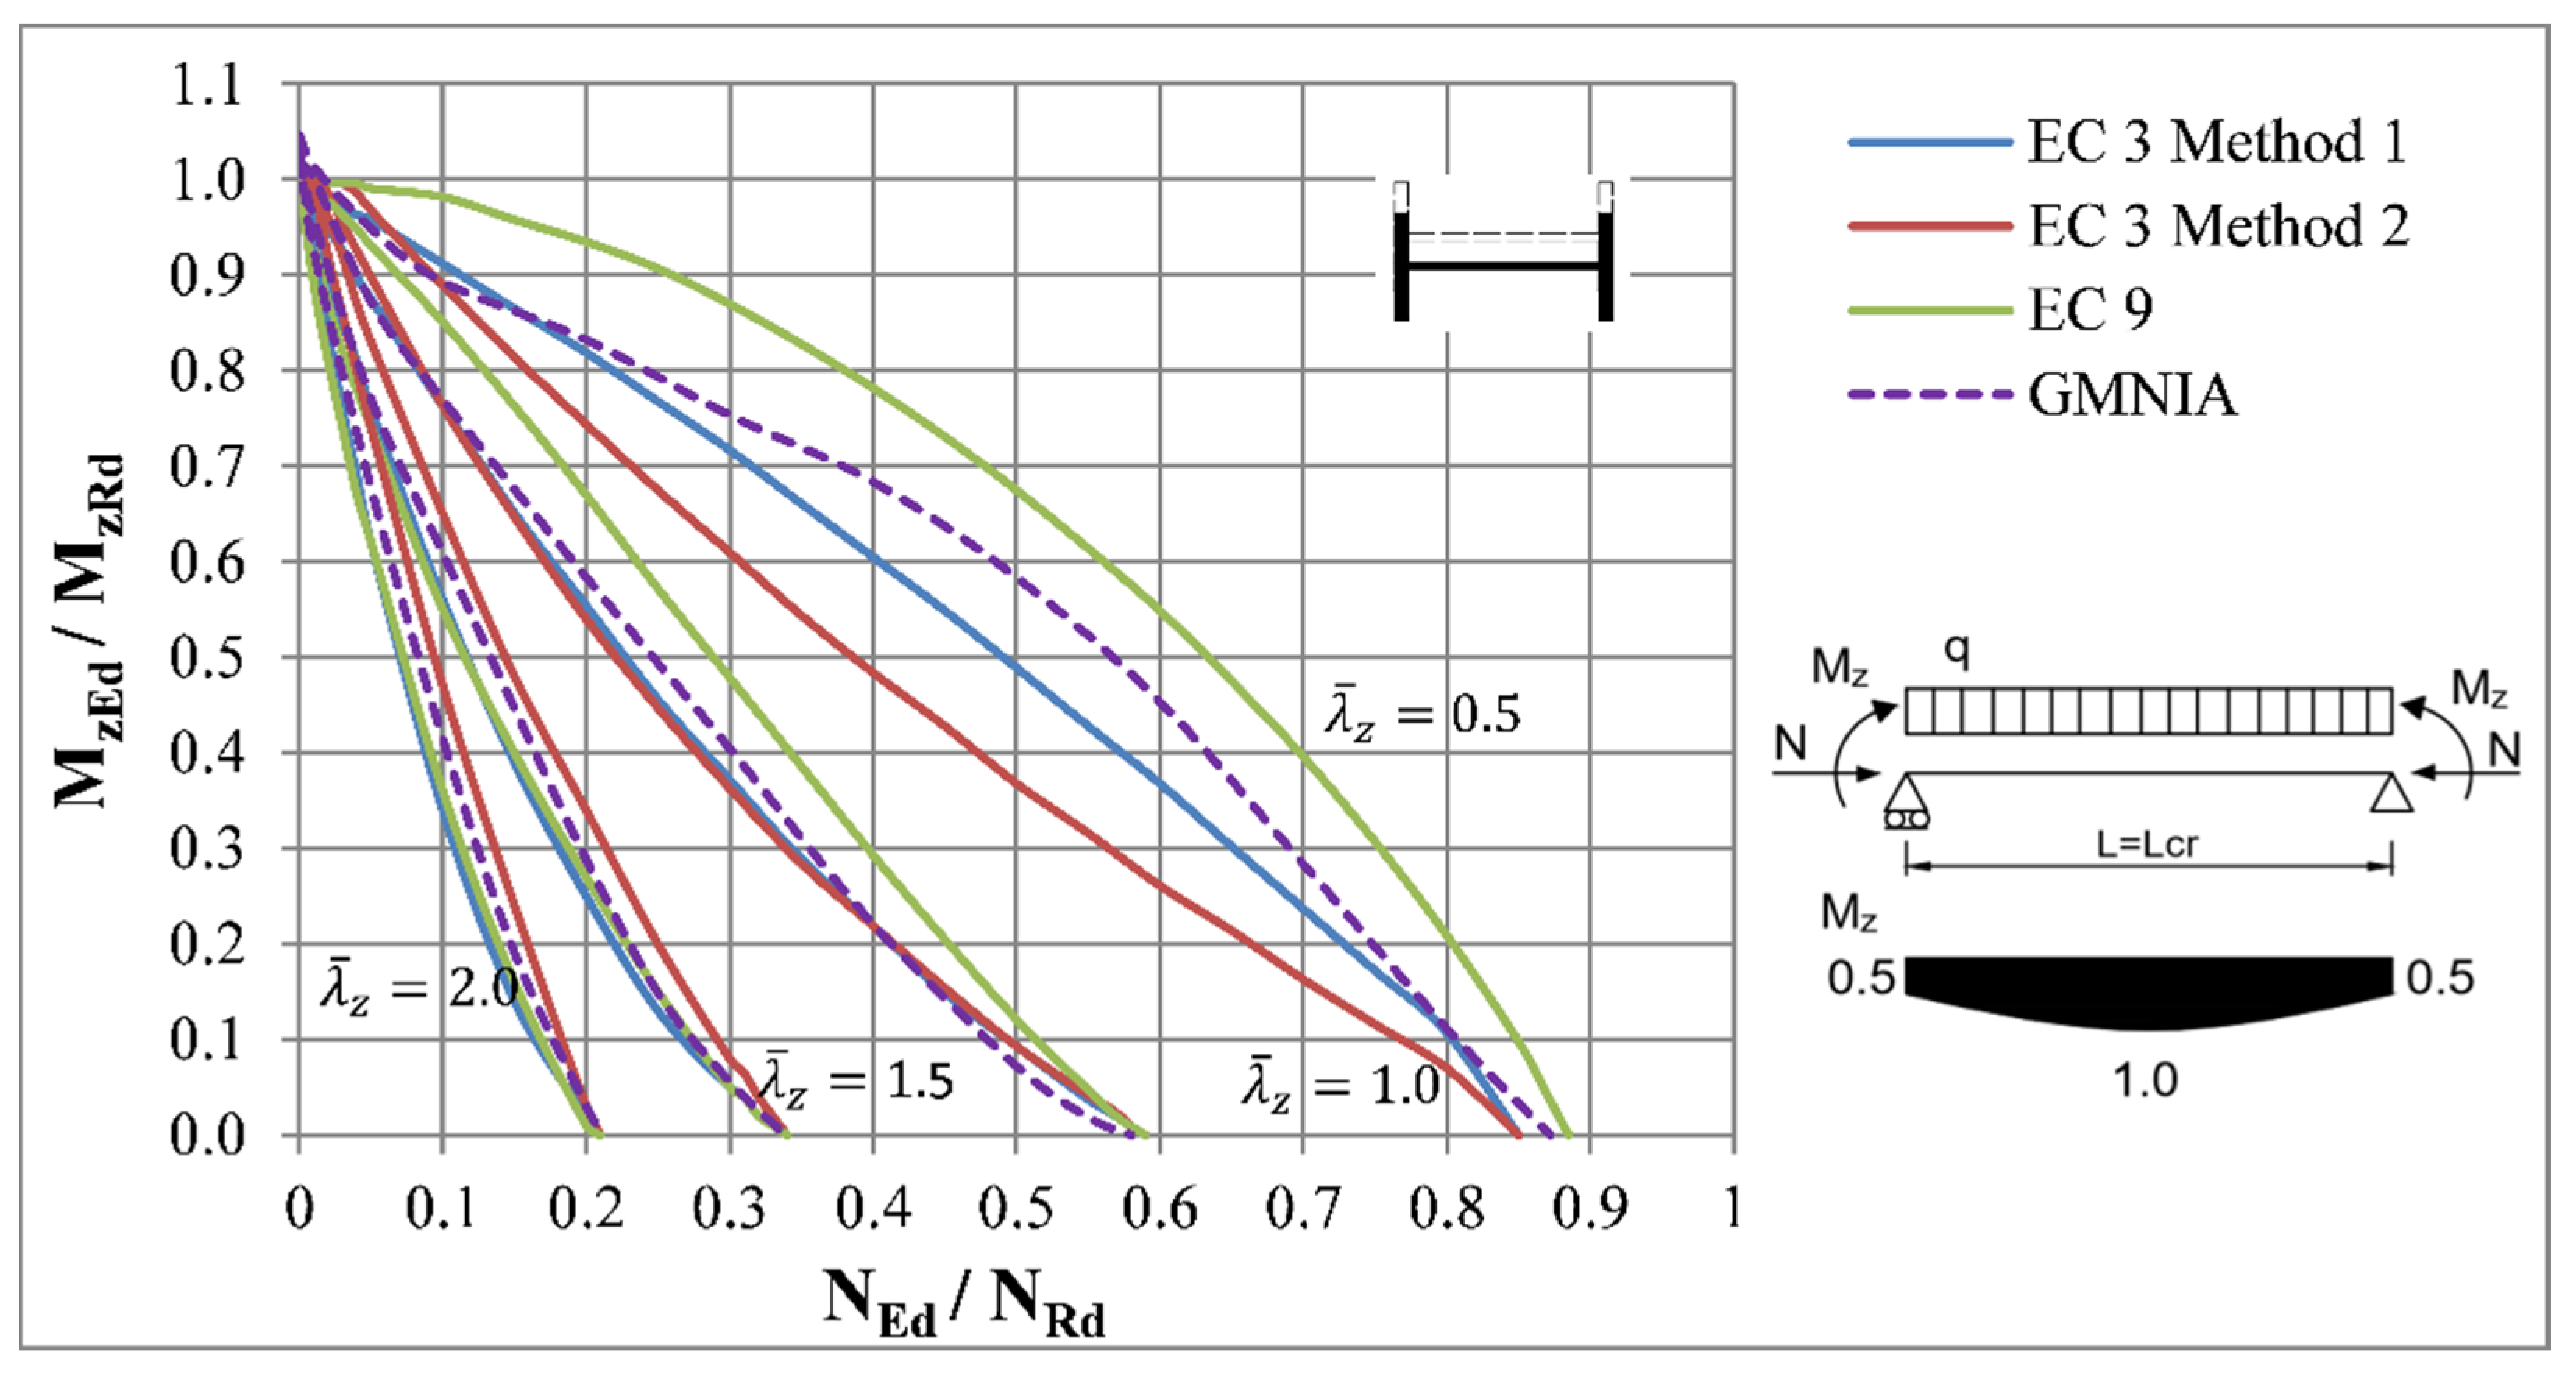
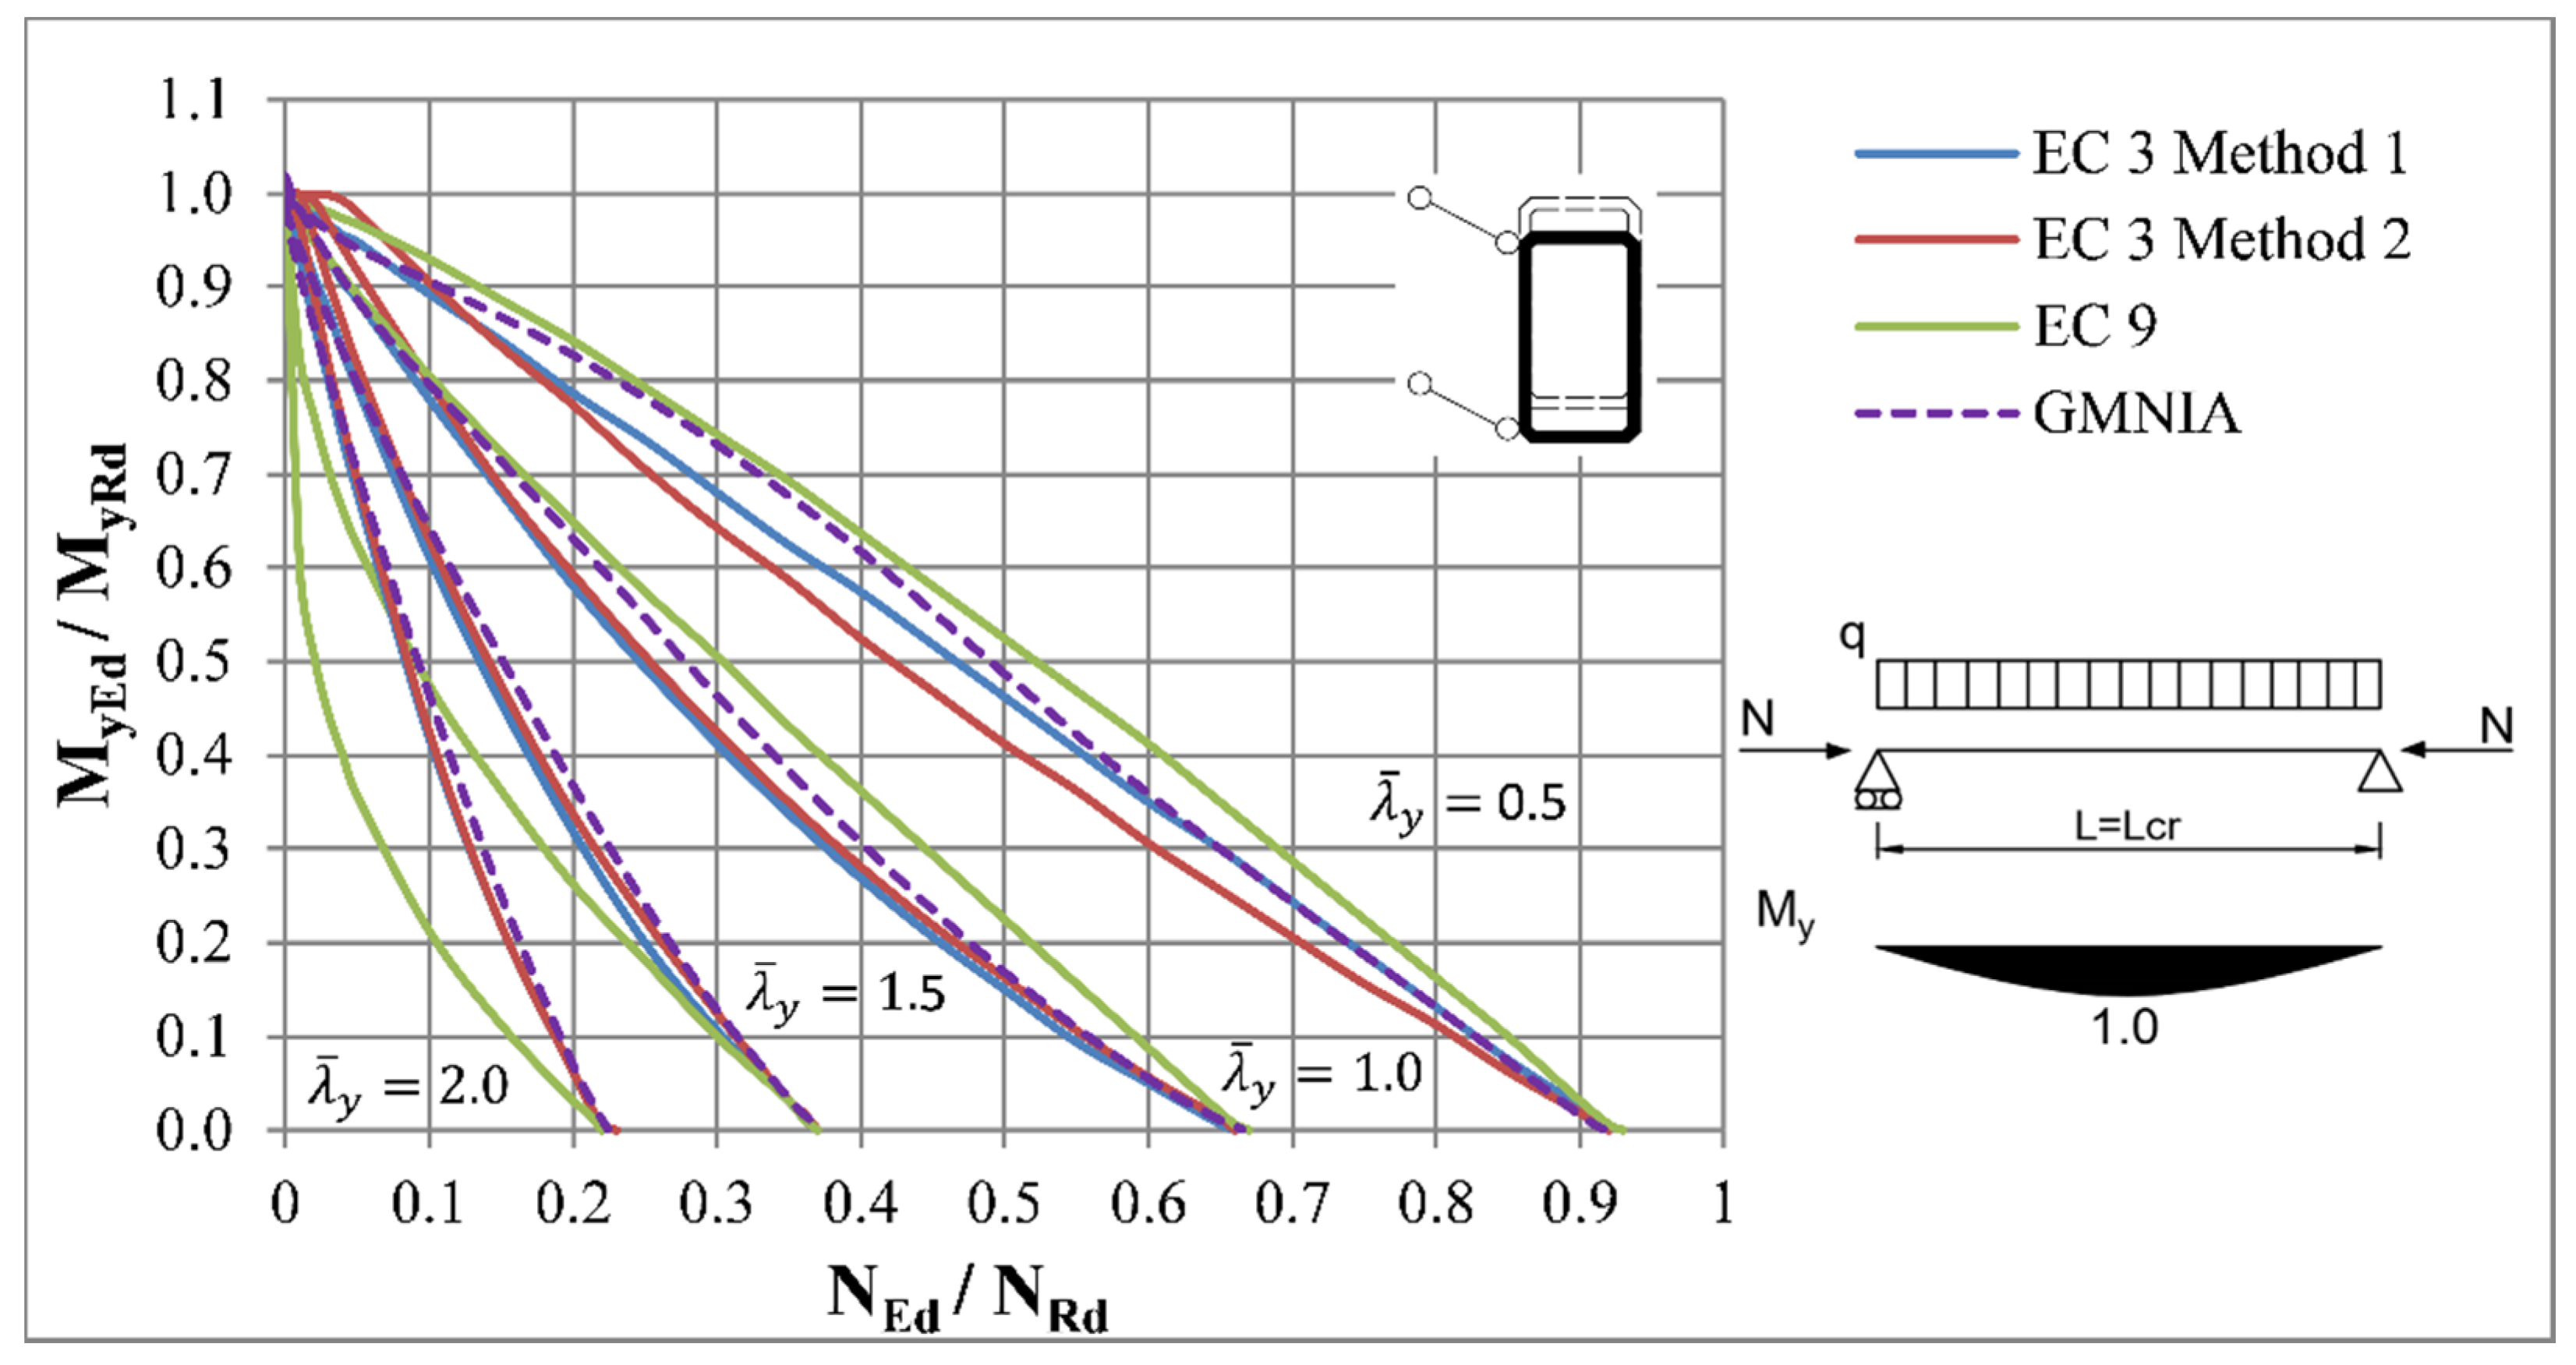
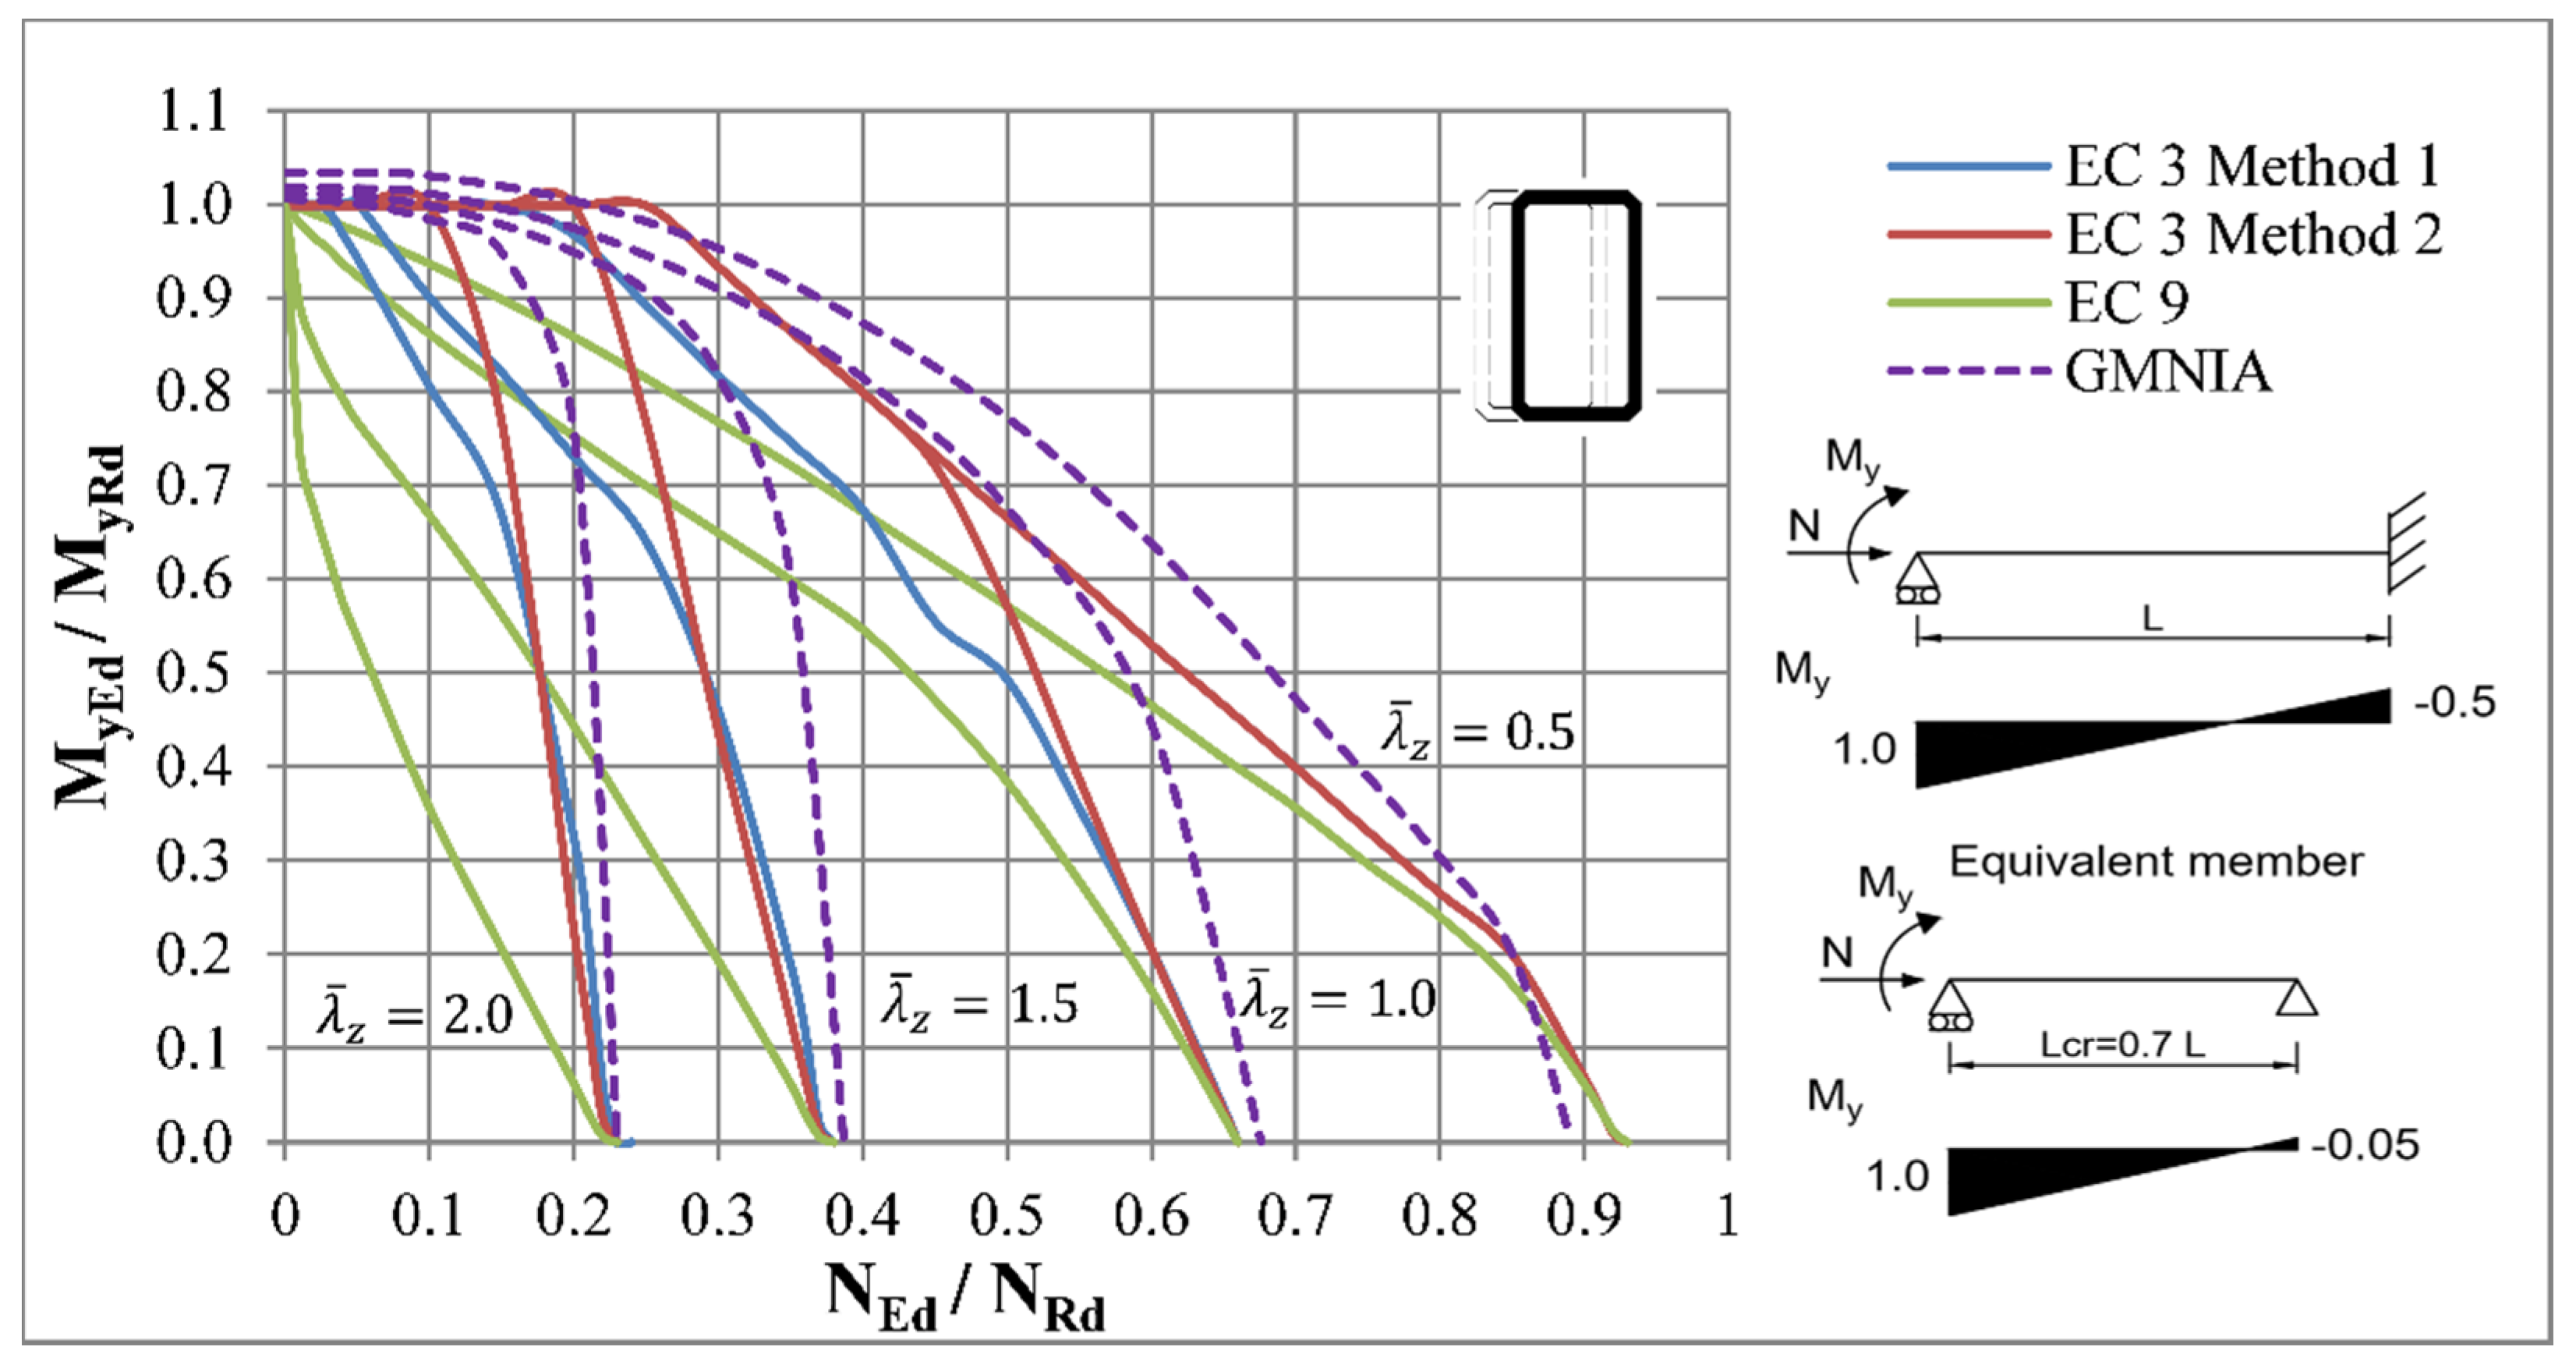
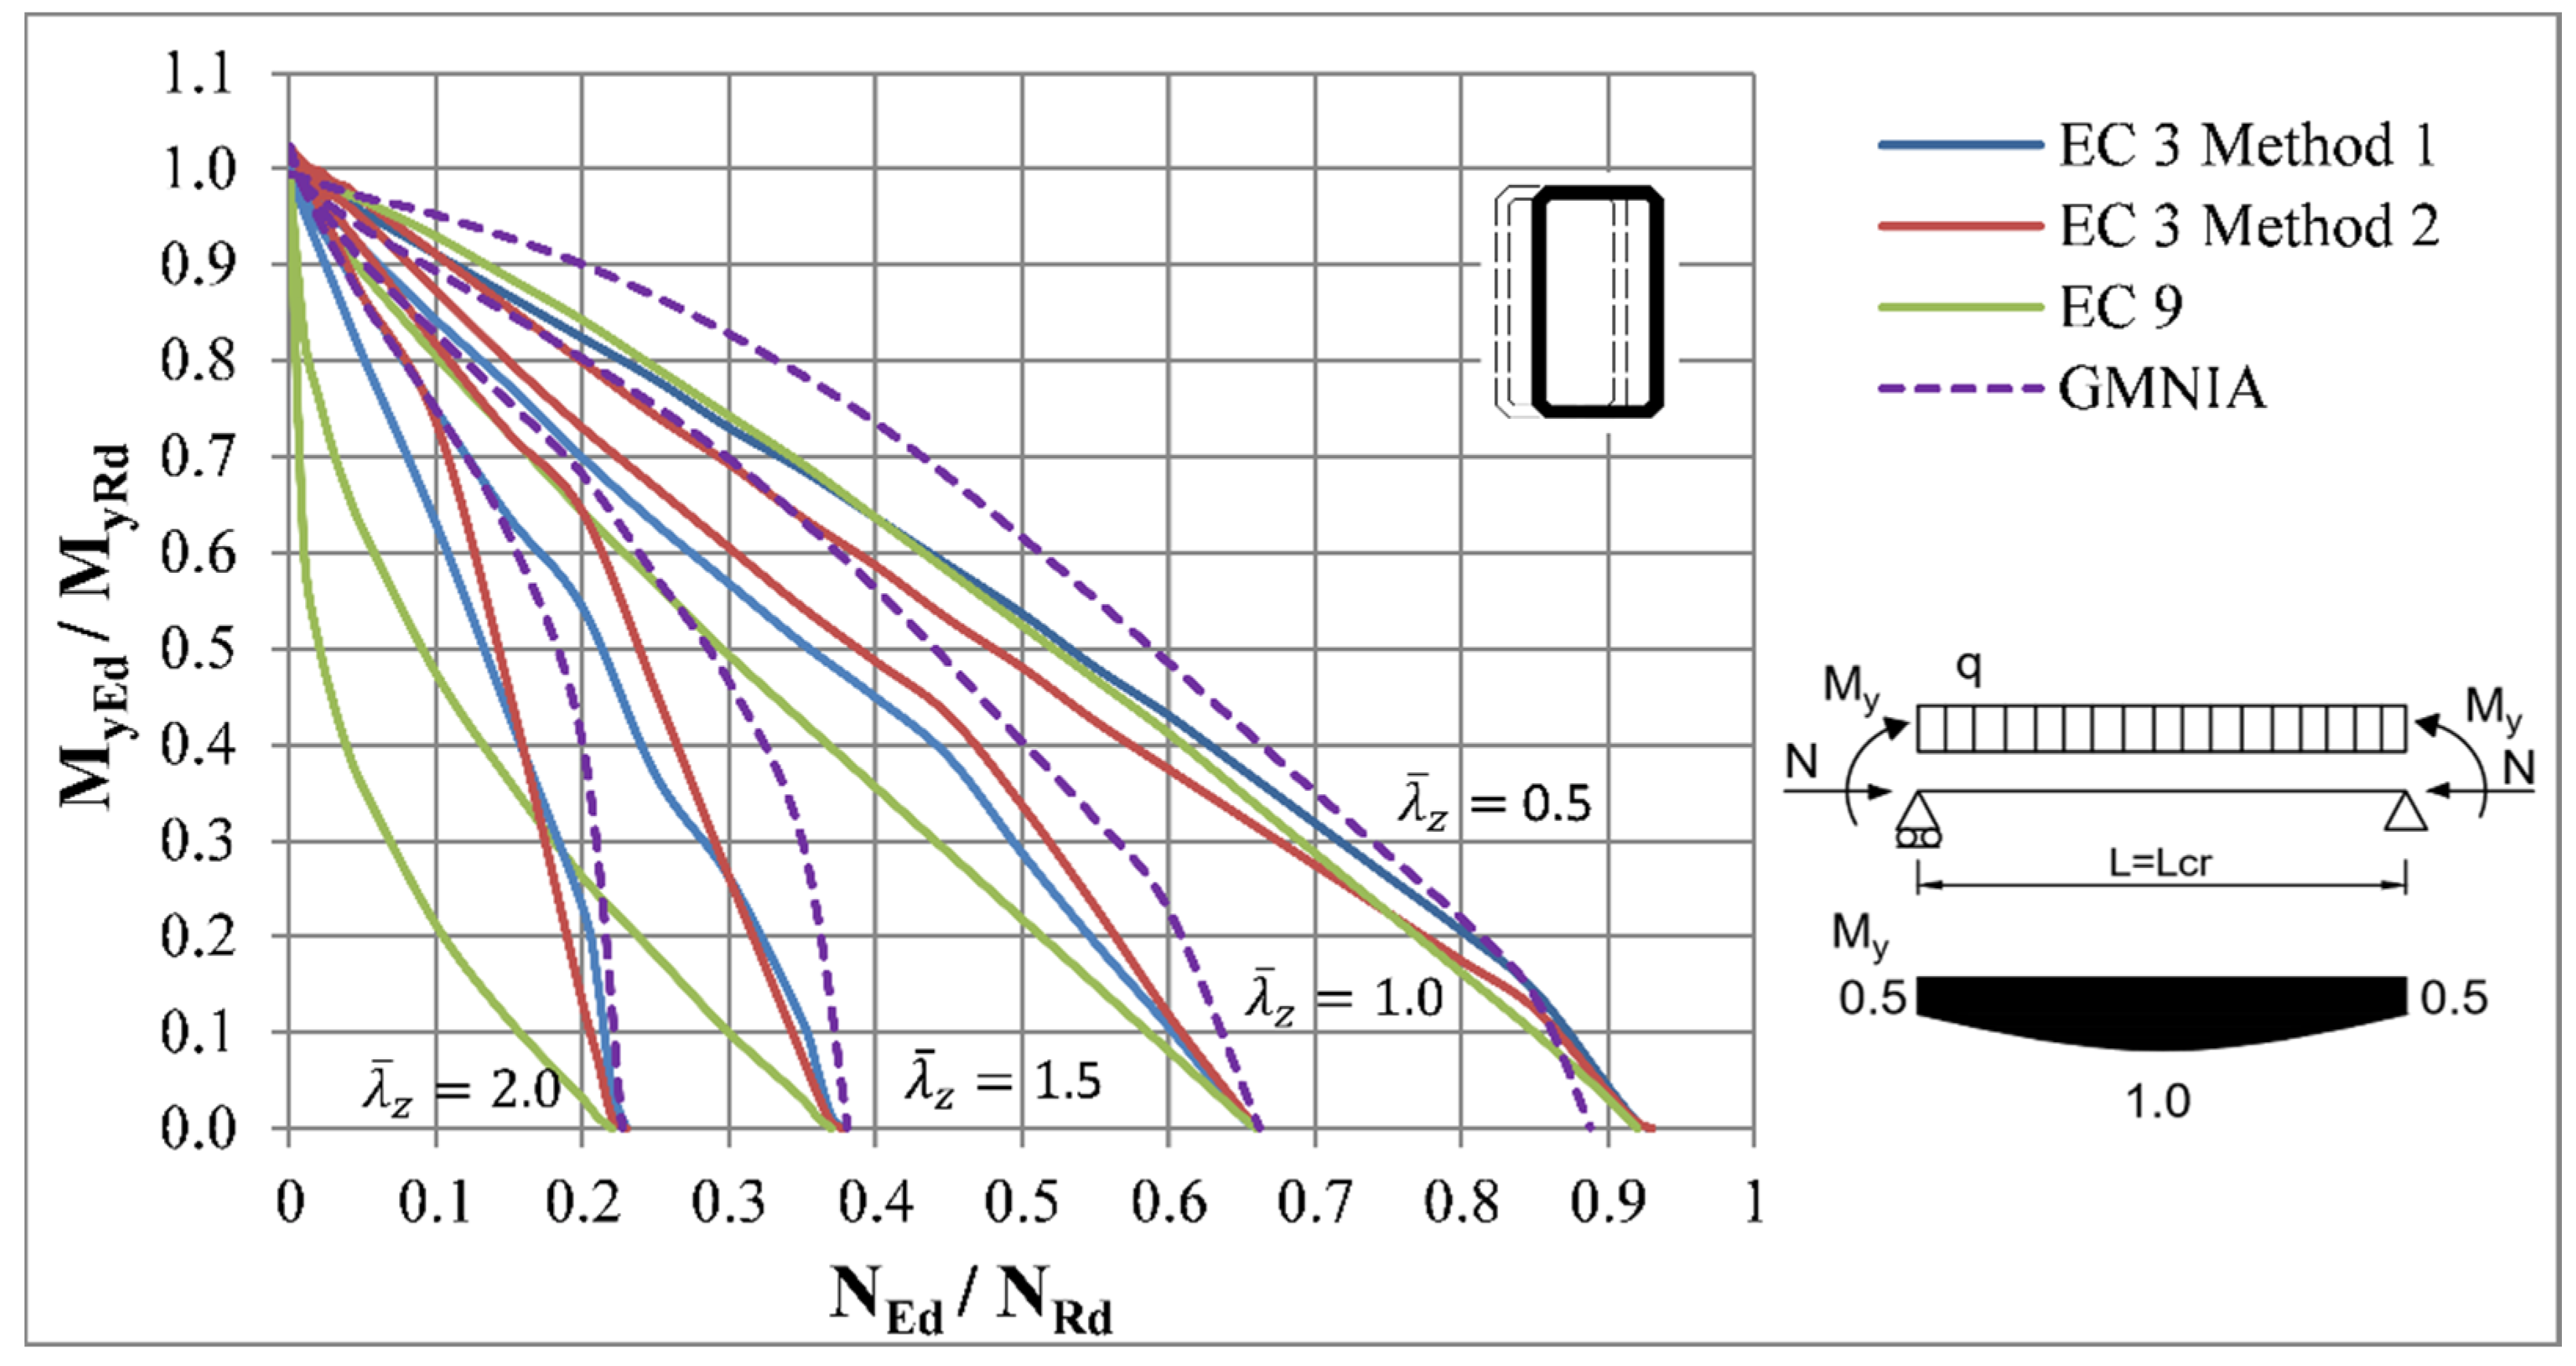
Both concentrated transverse load and uniformly distributed load acted at a location where the upper flange and web were connected. The resistances of beam-columns with rigid warping restraints in the end cross sections are presented on the Figure 14, Figure 15, Figure 16, Figure 17 and Figure 18.
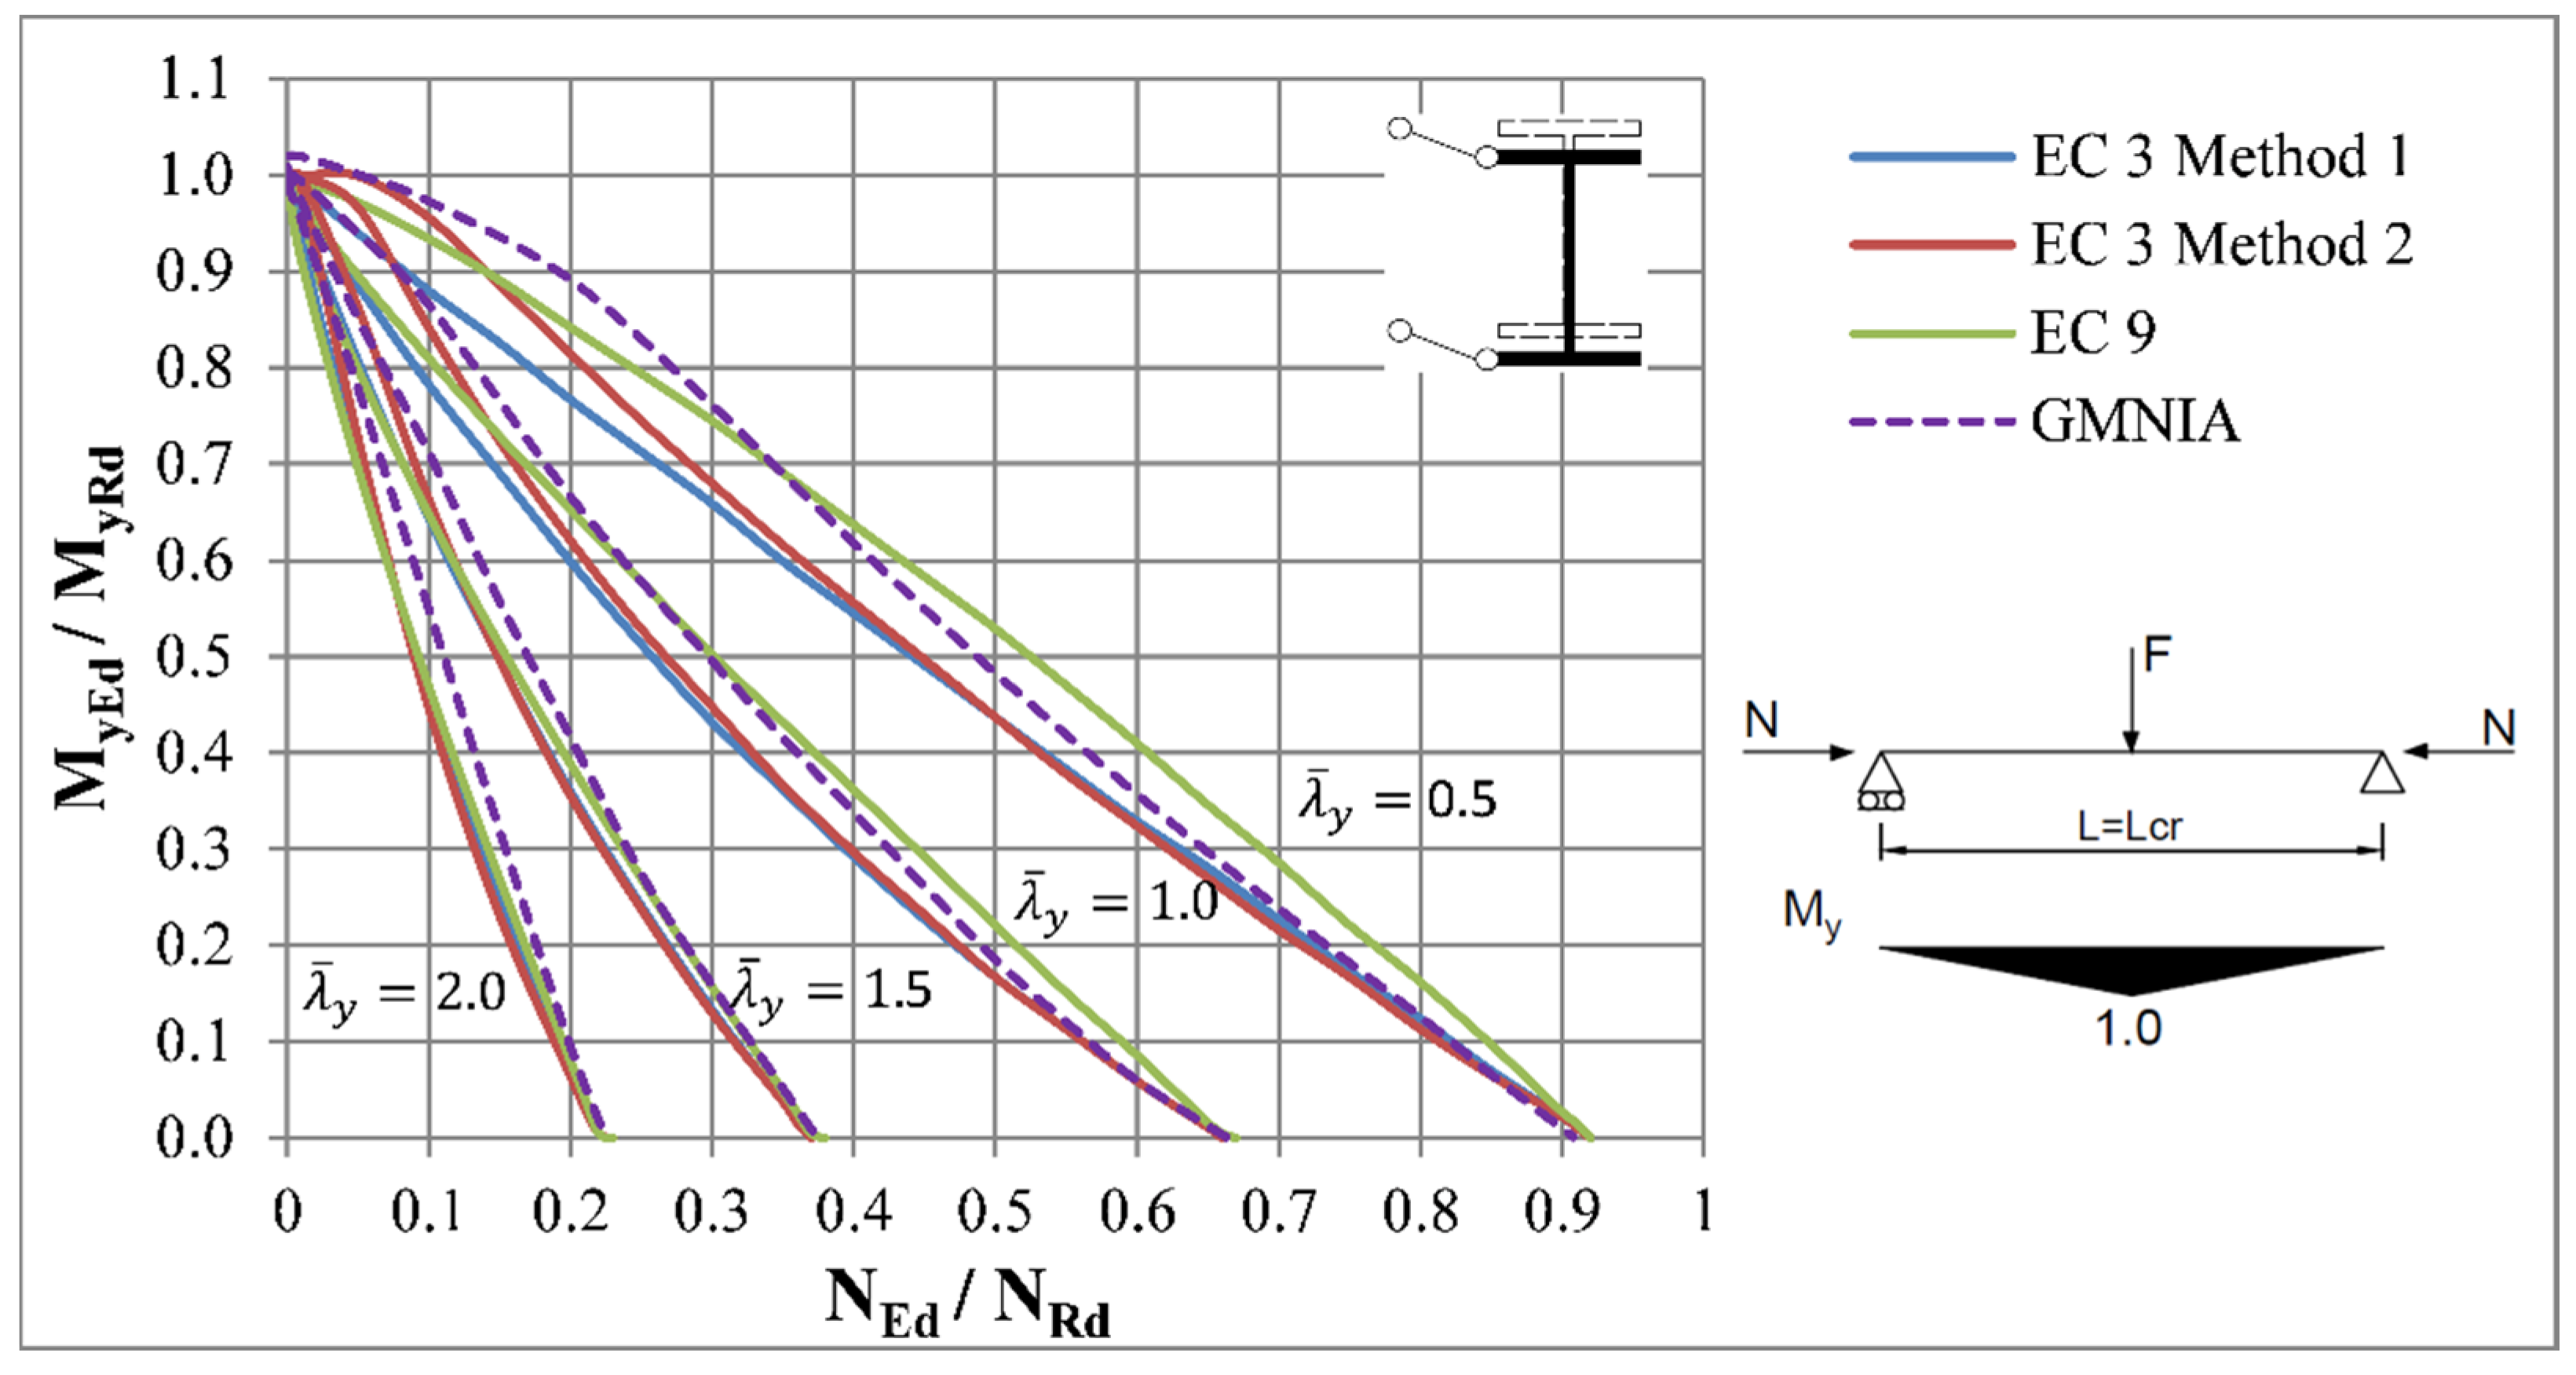
In the case of the pin ended beam-column, the resistances according to Methods 1 and 2 were significantly lower than resistances predicted by the FEM model, especially for the lower slenderness ratios where the differences were up to 20%. For these loading conditions Method 1 seems to be more accurate than Method 2, although the relevant differences were visible only for slenderness . In the case of the pinned-fixed beam-column, Method 1 provided far more accurate results, even though the accuracy was lower with the rising value of bending moment. This is because in this distribution of first-order bending moment the resistance of the cross-section governs, and these methods cannot handle such situations.
It can be seen that the accuracy of Eurocode 9 method was significantly better than for methods of Eurocode 3. In cases of pin-ended beam columns, the method according to Eurocode 9 provided generally lower resistances compared to the numerical simulations. The unsafe values of resistances are provided for members with relative slenderness . Hovewer, it can be seen that the curves according to method of Eurocode 9 have the same behaviour compared to the FEM curves. This is most visible for members with constant bending moment and slenderness . This method also provided more accurate results in the case of pinned-fixed beam-columns, especially for the lower values of bending moments. This is because the coefficients and modified the effect of reduction factors for flexural and lateral-torsional buckling at the places, where they do not have reasonable impact and, therefore, the formulas for stability verification change to cross-sectional verification formulas.
Finally, it has to be mentioned that the accuracy of the compared design methods was highly dependent on the accurate determination of the limiting cases for the pure compression and bending. Whereas the reduction factors for flexural bending were found to be in a good agreement with the FEM simulations, the values of reduction factors for lateral-torsional buckling were, for most cases, more conservative. Findings were identical to results presented in [23,33]. However, this issue is assumed to be solved in the new version of Eurocodes [34].
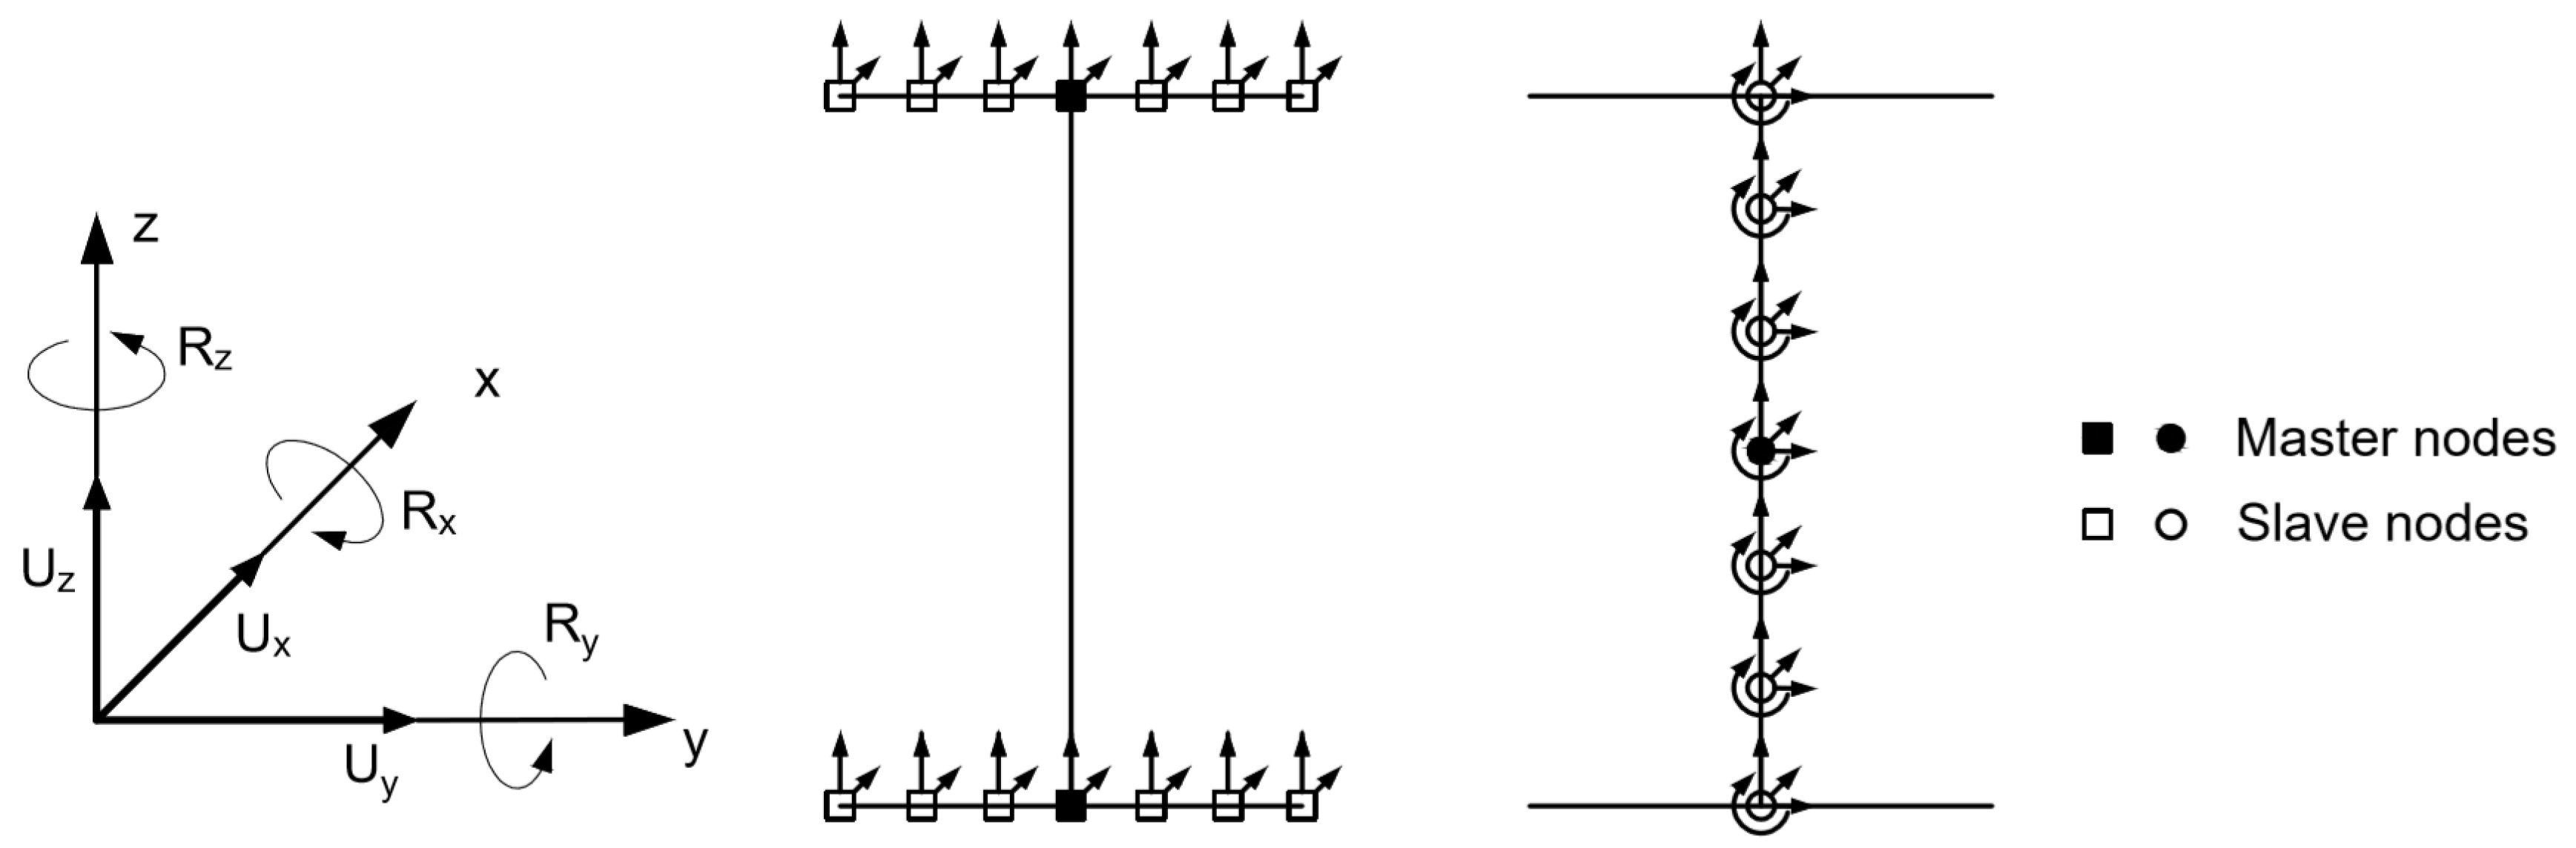
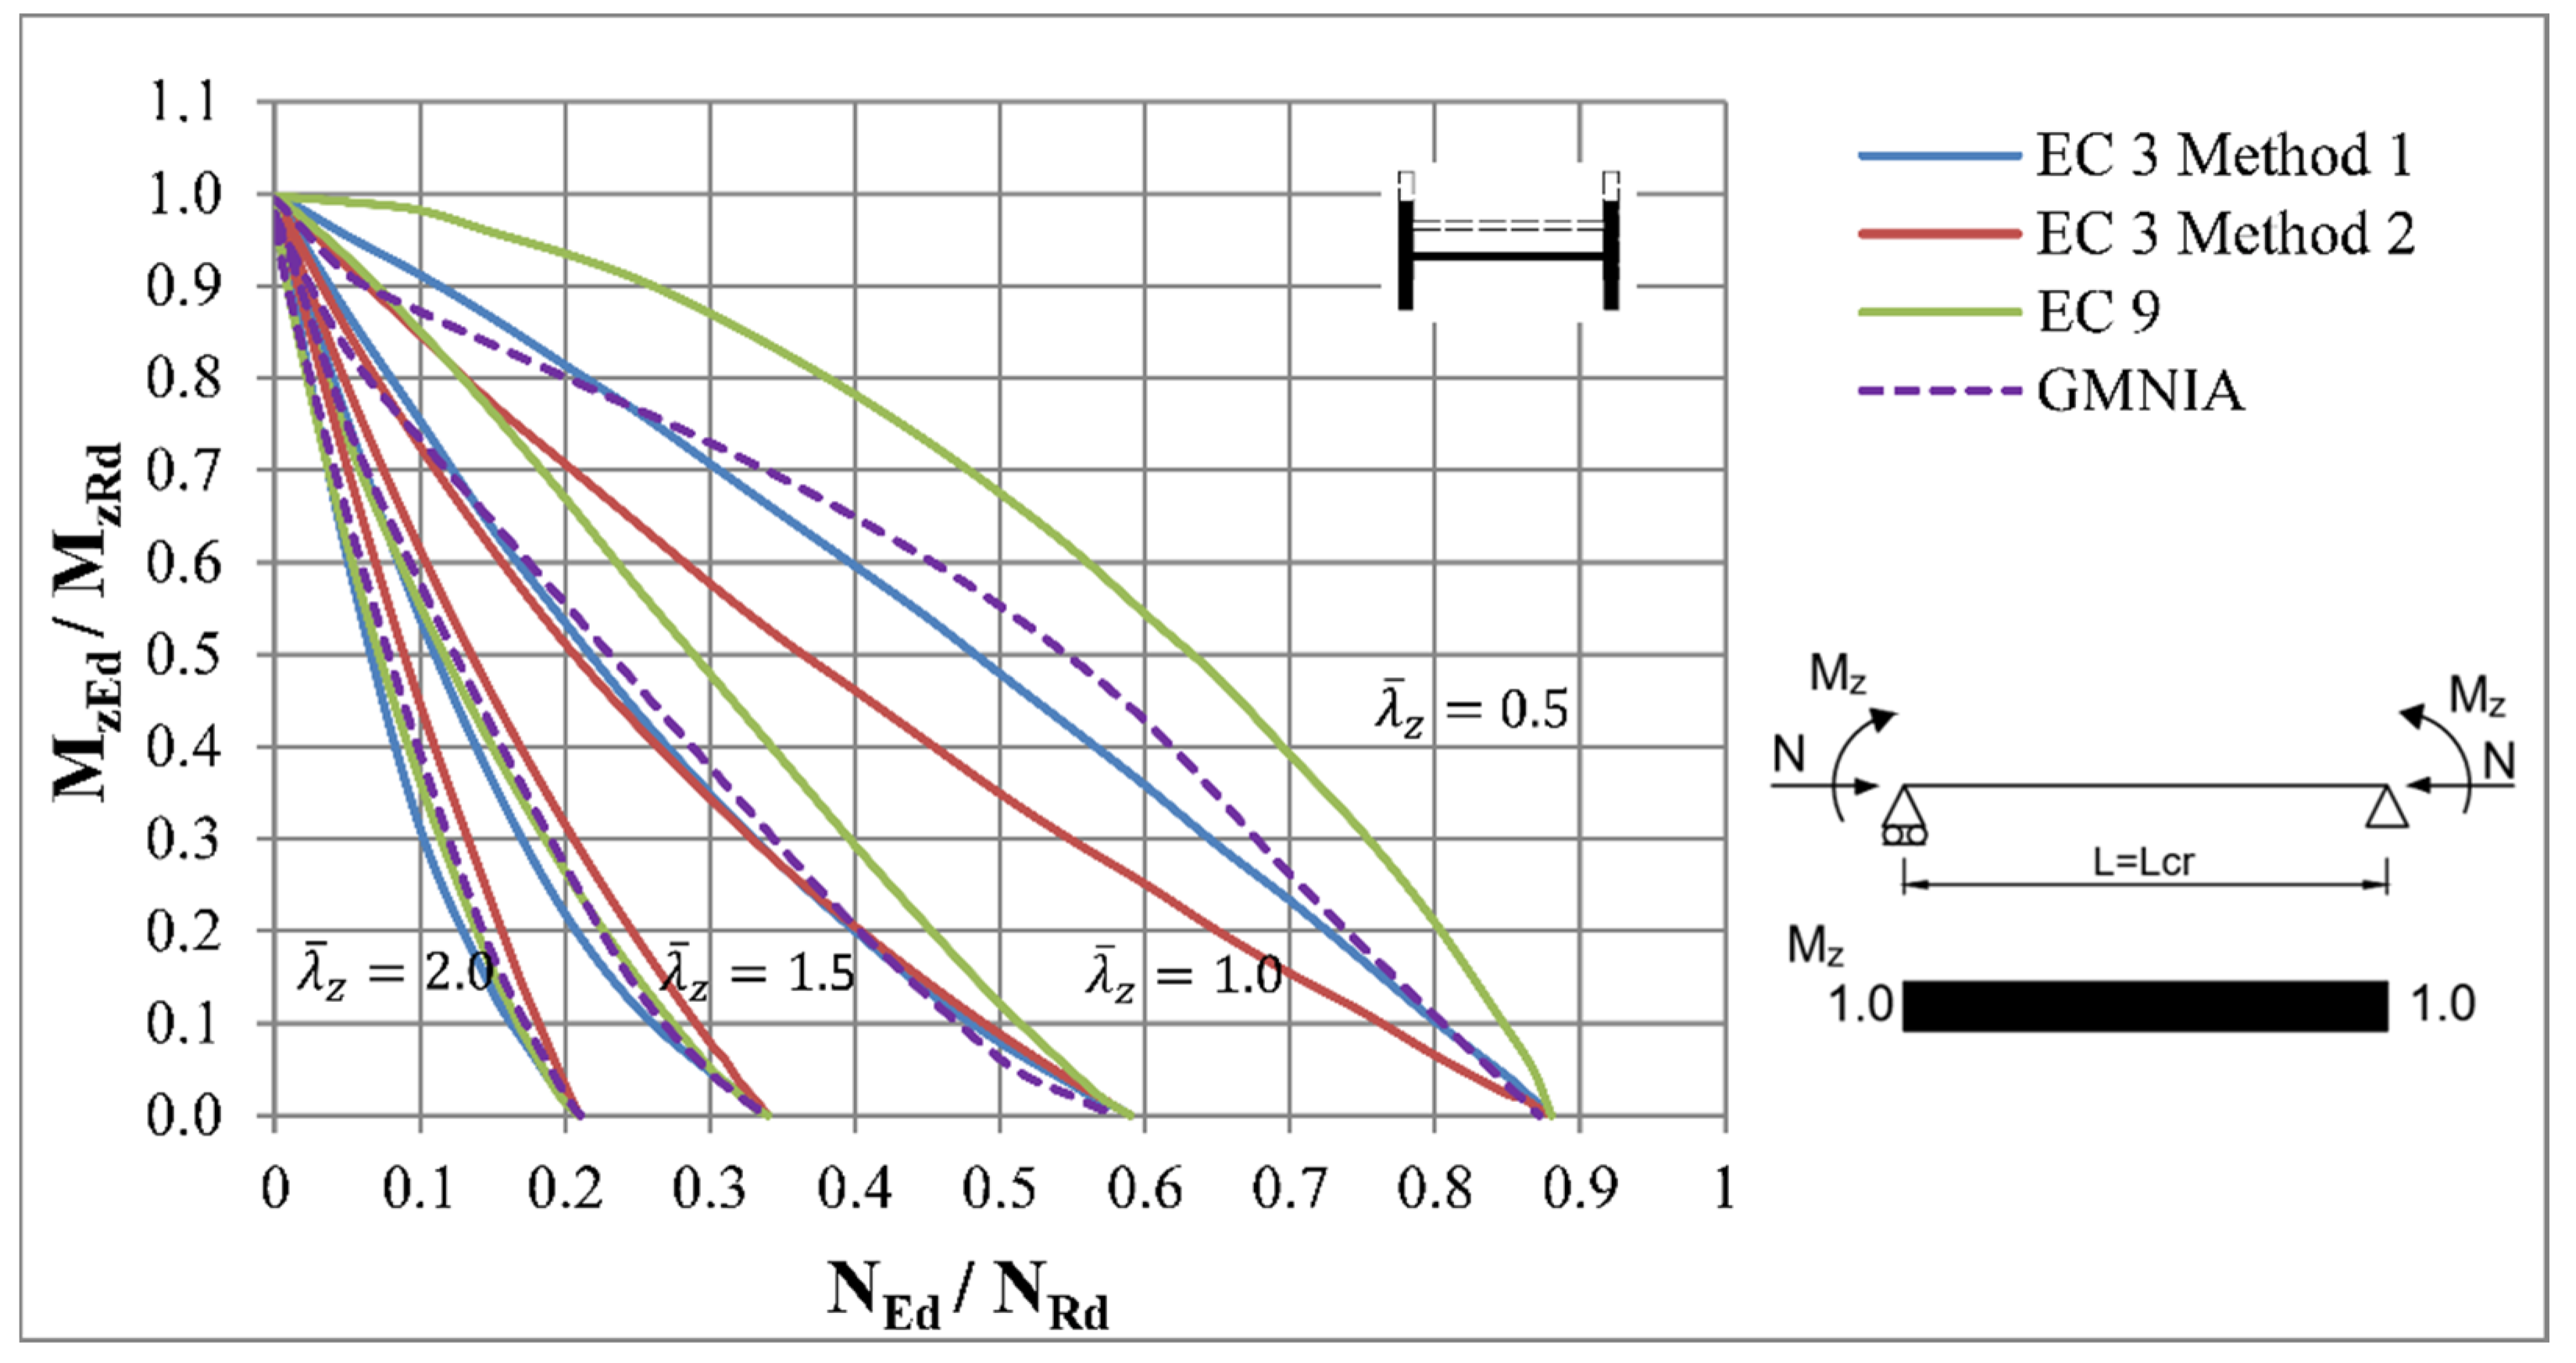
The analysis of beam-columns with free warping of end cross-sections is further presented. As was mentioned, to allow a free warping of the end cross-sections the modelling of boundary conditions had to be modified. Therefore, a similar approach to the modelling concept applied in the studies performed by Jönsson or Boissonnade was adopted. [2,24]. The deformation of such restrained member can be seen in Figure 19.
The displacements Ux and Uz of the end nodes of the flanges were coupled by constraint equations to the “master” nodes at the web-flange intersections. This means that the nodes remained on a straight line and the displacements of the slave nodes were dependent on the displacements of the chosen master node (Figure 20). A similar approach was used to couple the displacements Ux, Uy, Uz and Rx of the web nodes to the master node, which was located at the centre of gravity and shifted 1 mm away from the end cross-section. In the case of a pined-fixed beam-column, such boundary conditions were modelled only at the pinned end, whereas at the fixed end no adjustment was needed.
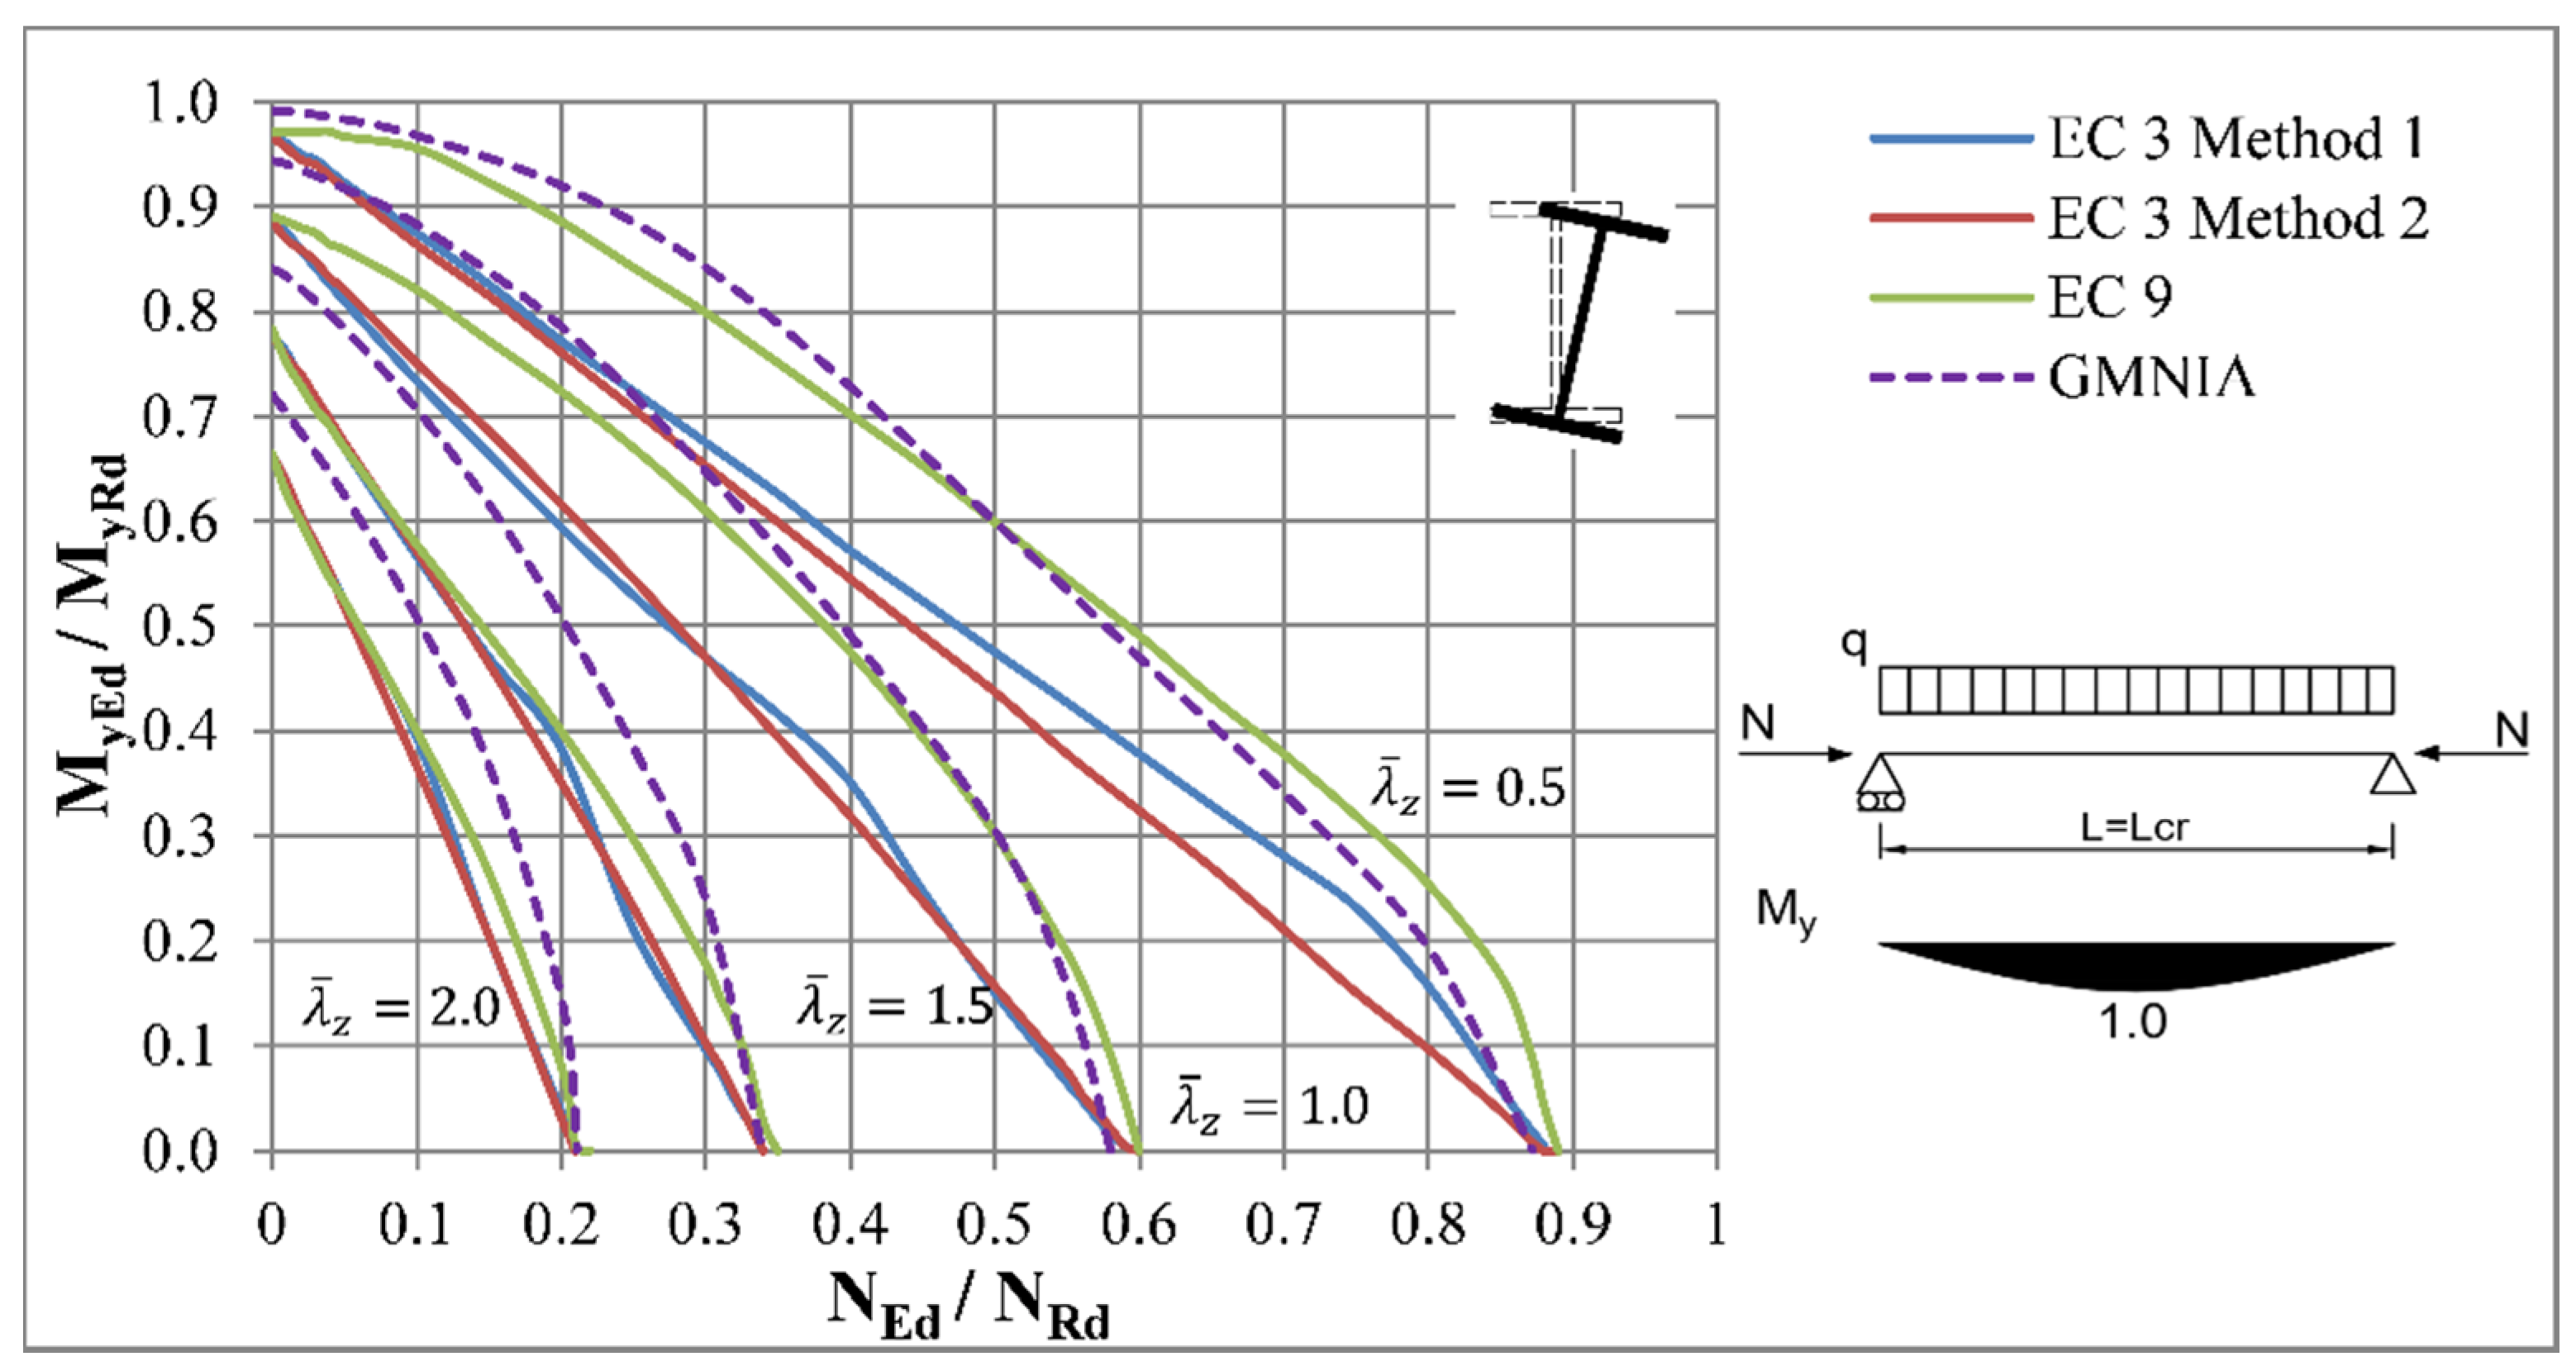
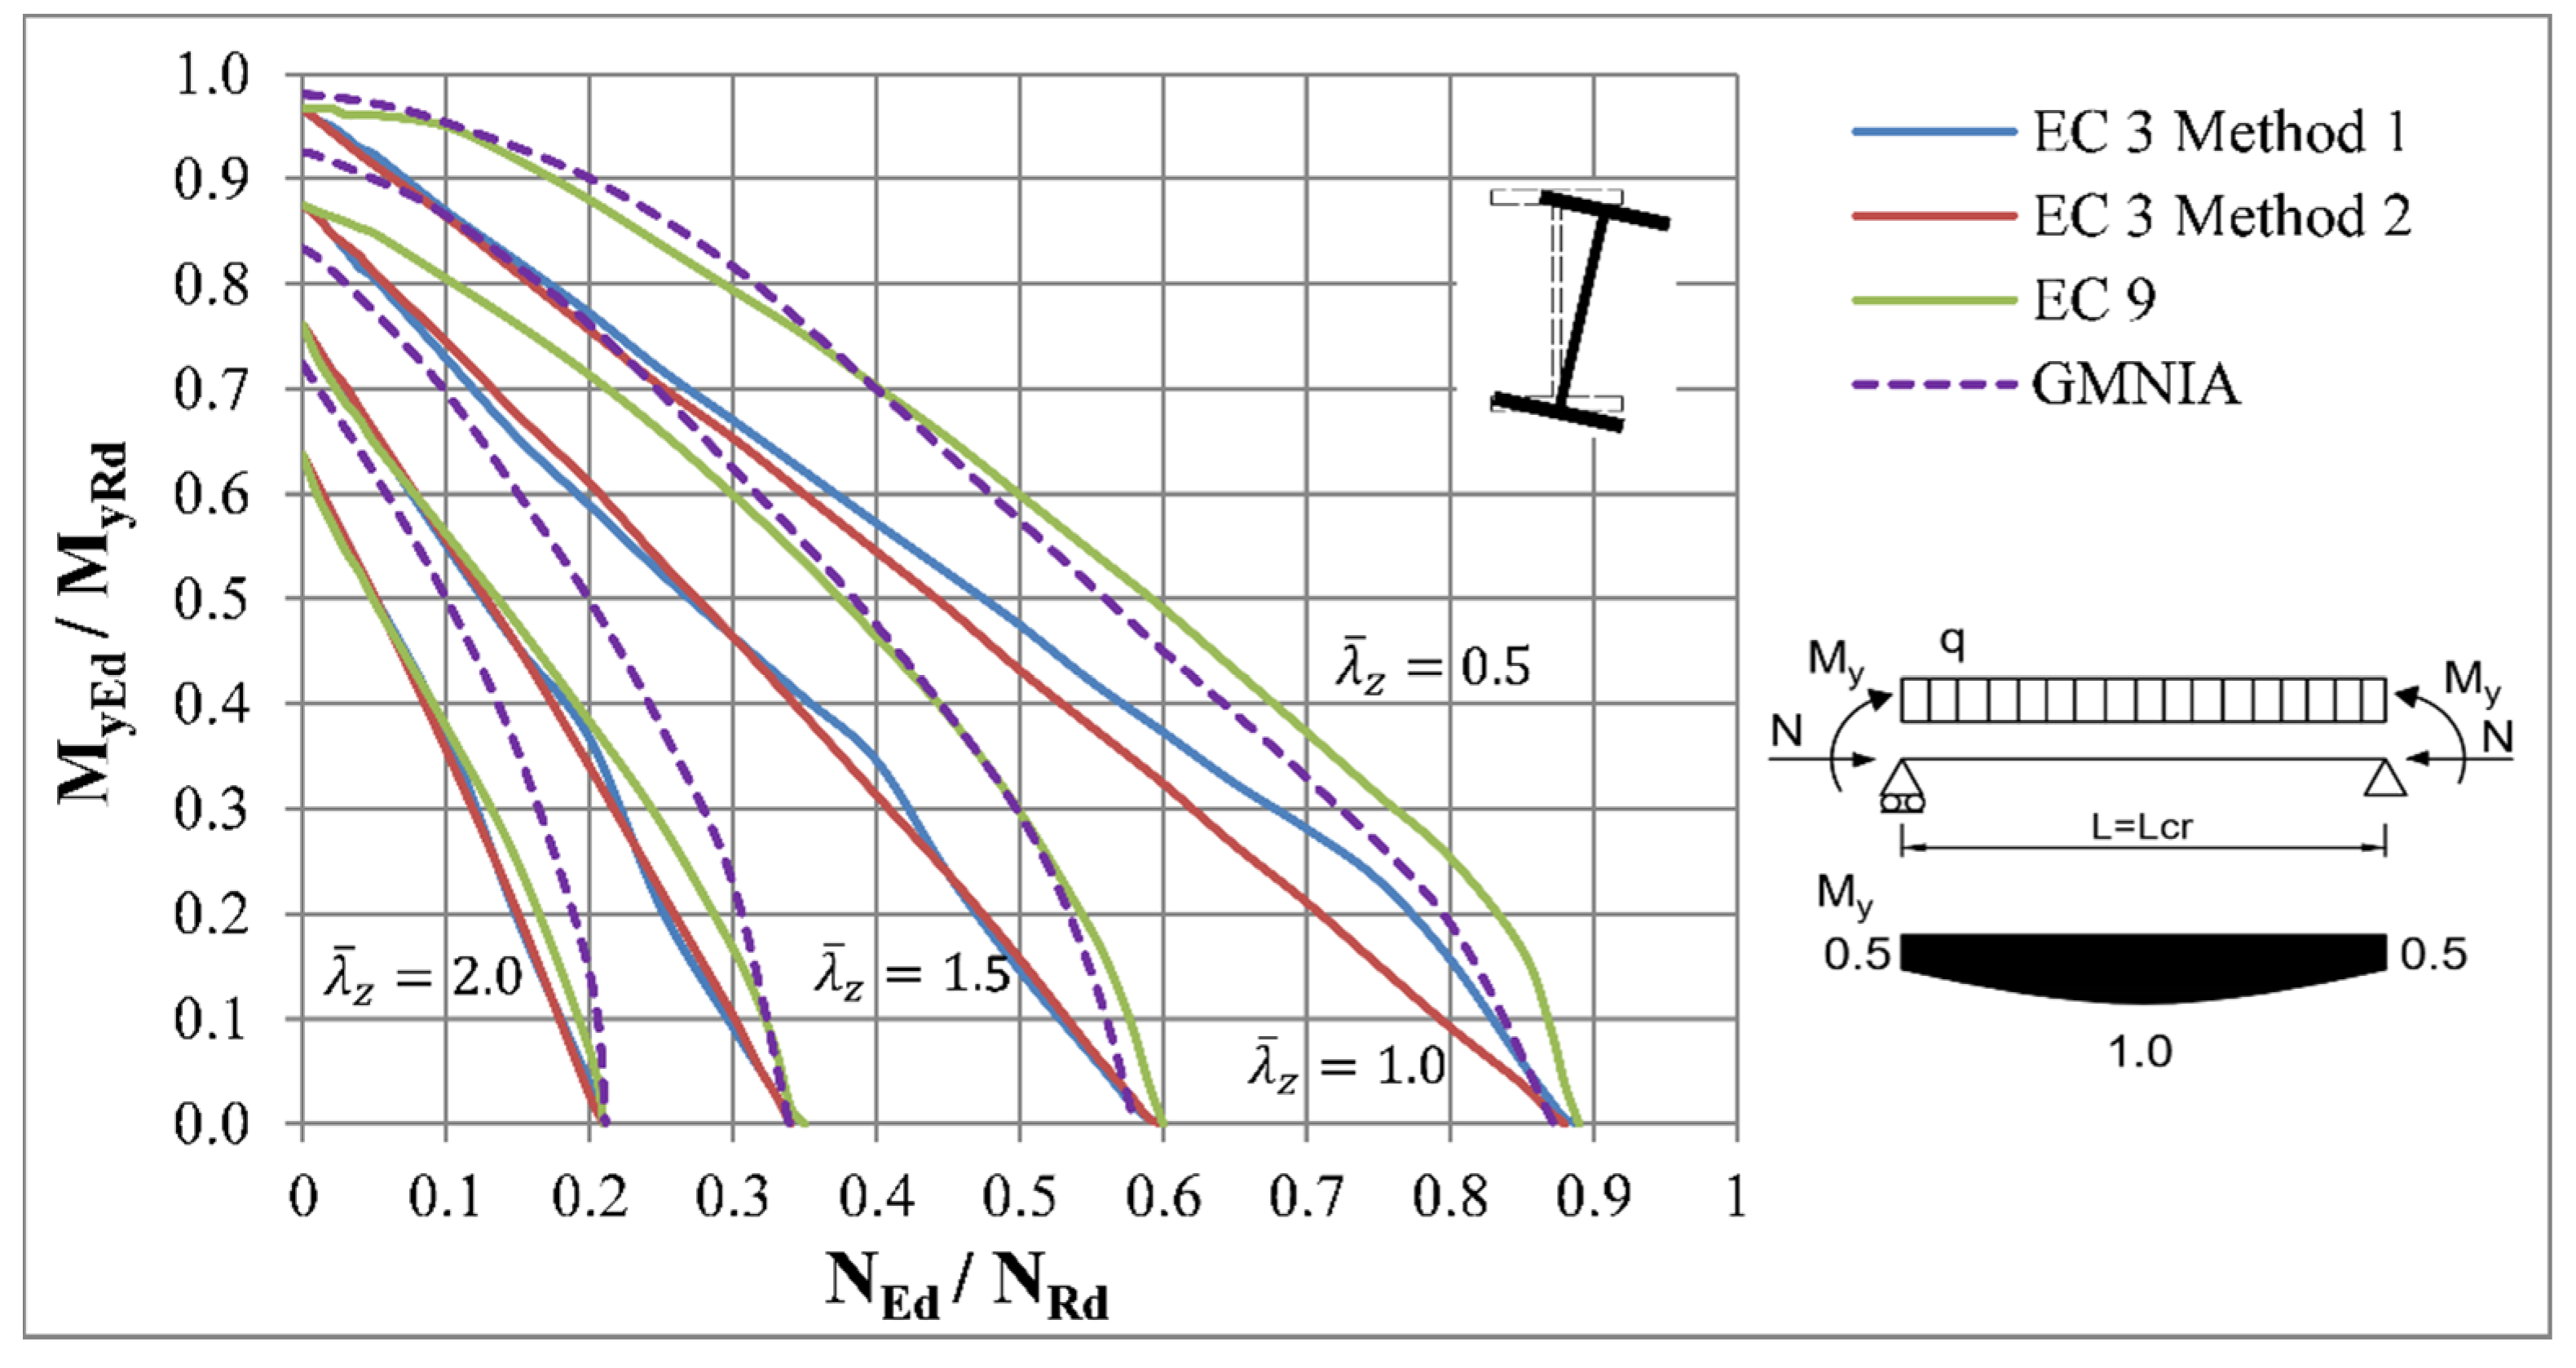
Comparison of the results using design methods and results of the numerical analysis for these loading conditions is presented on the Figure 21, Figure 22, Figure 23, Figure 24 and Figure 25.
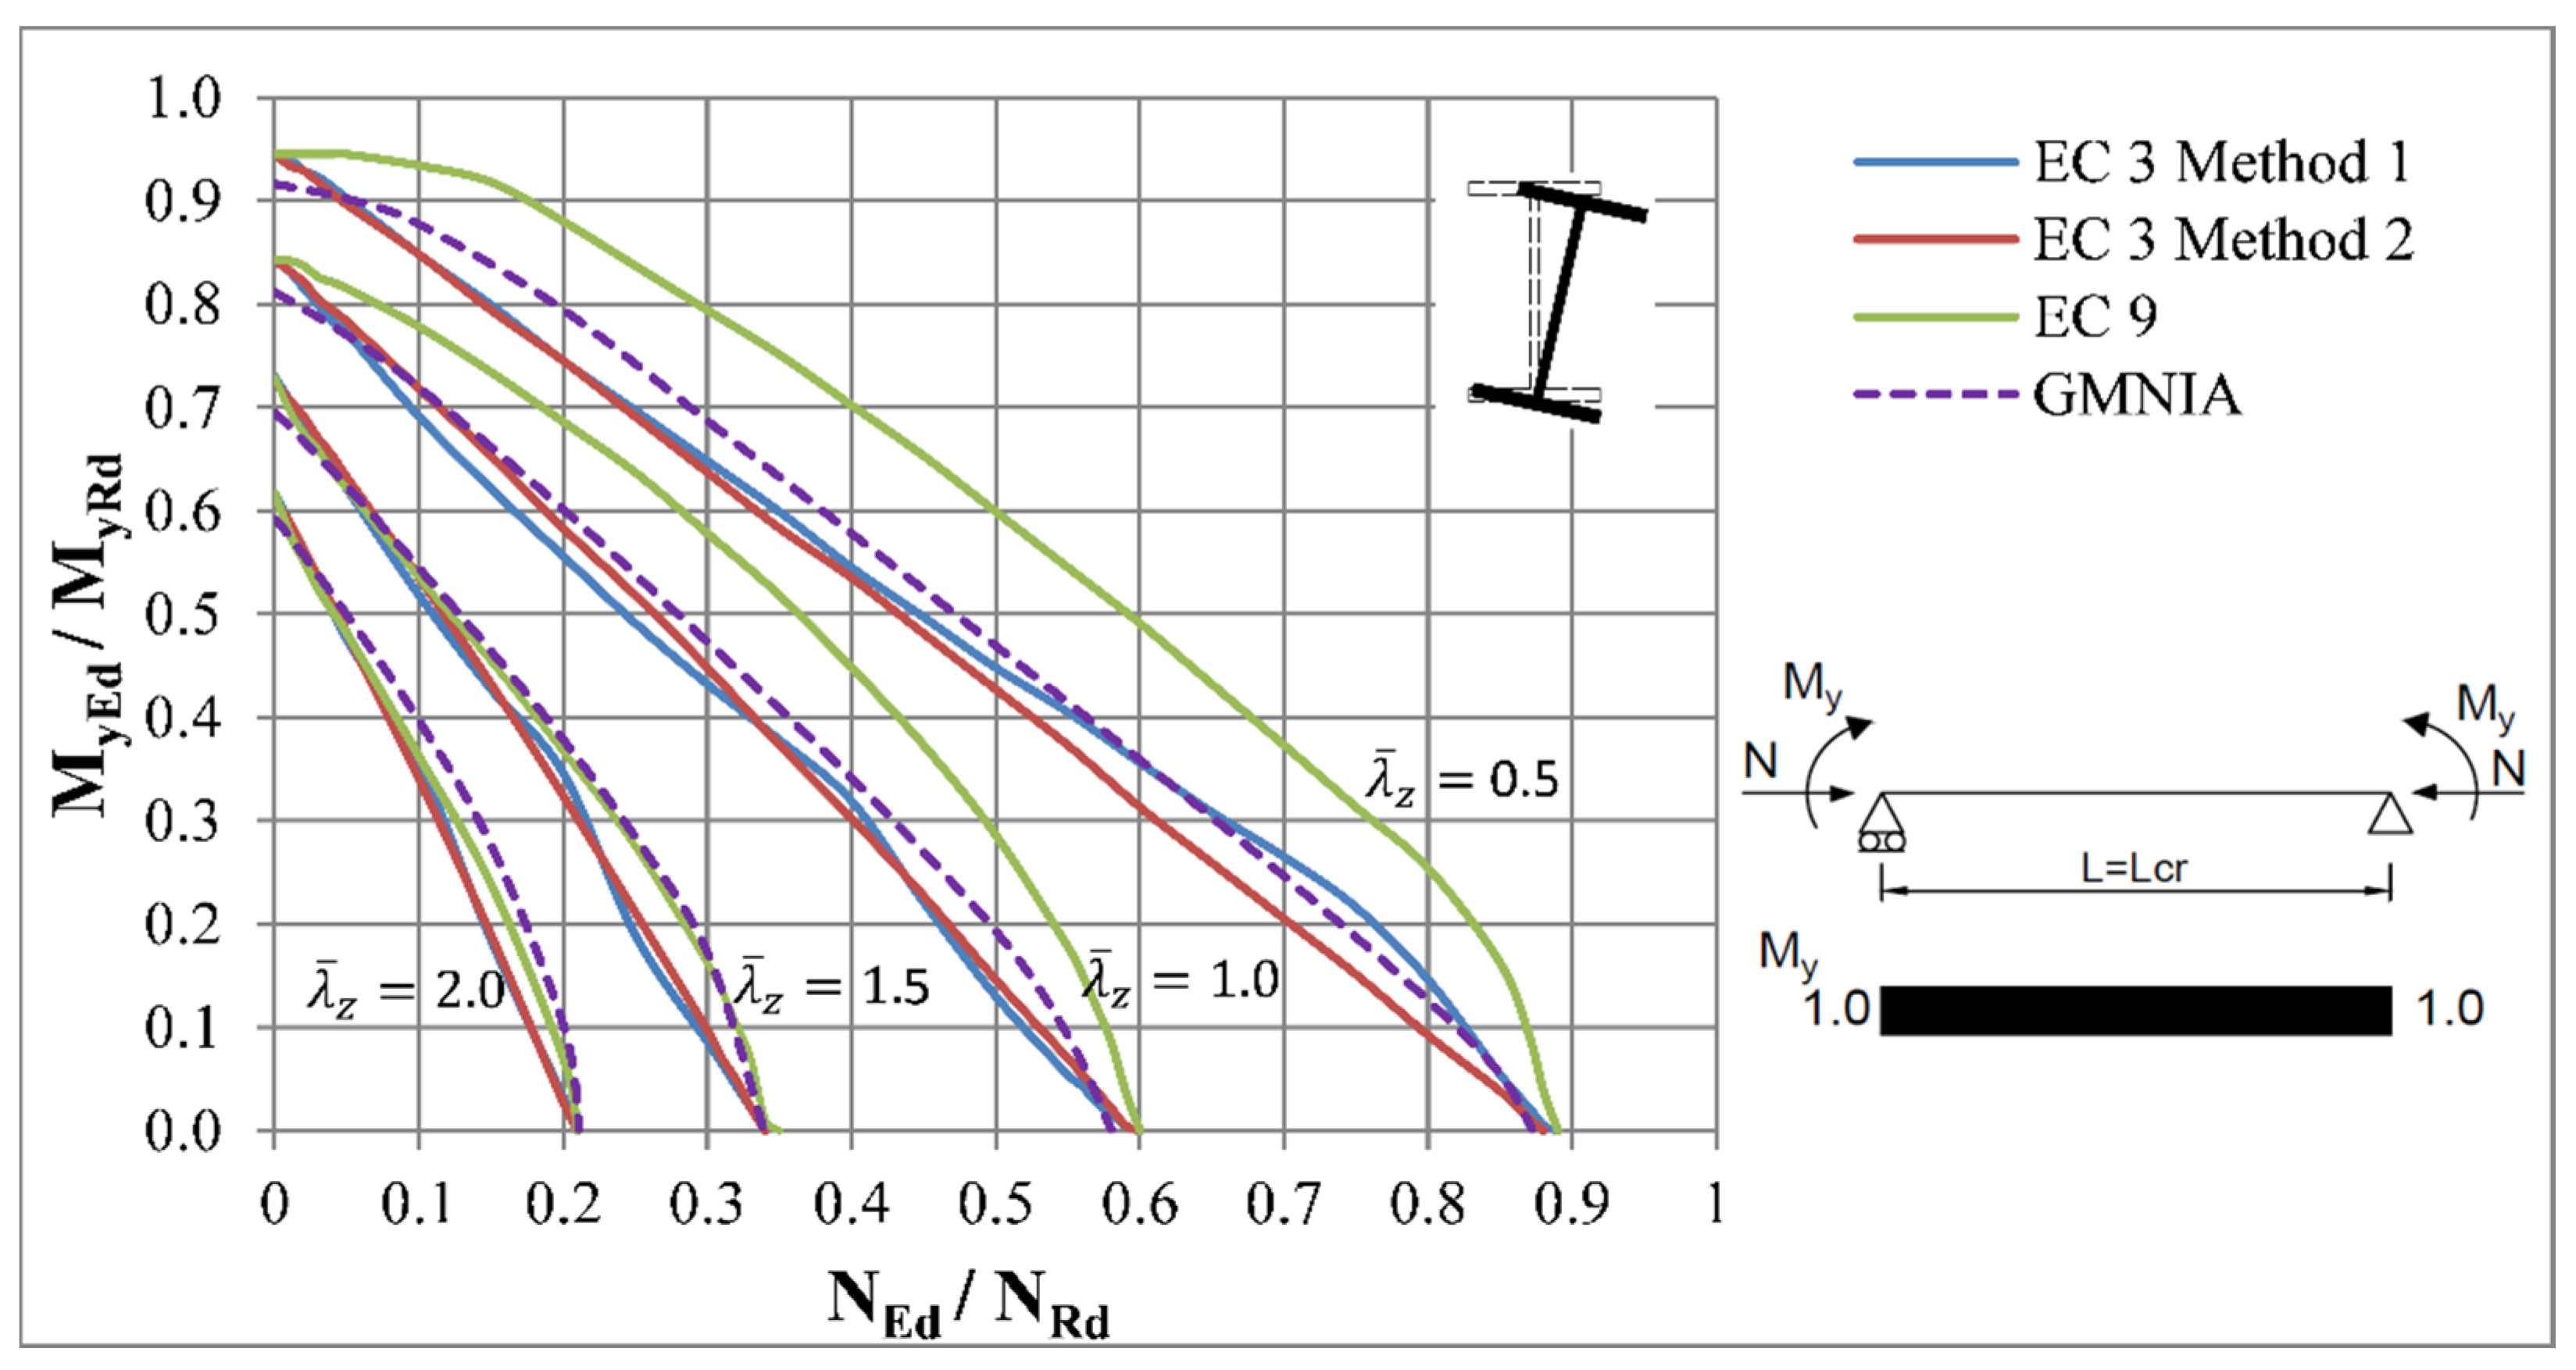
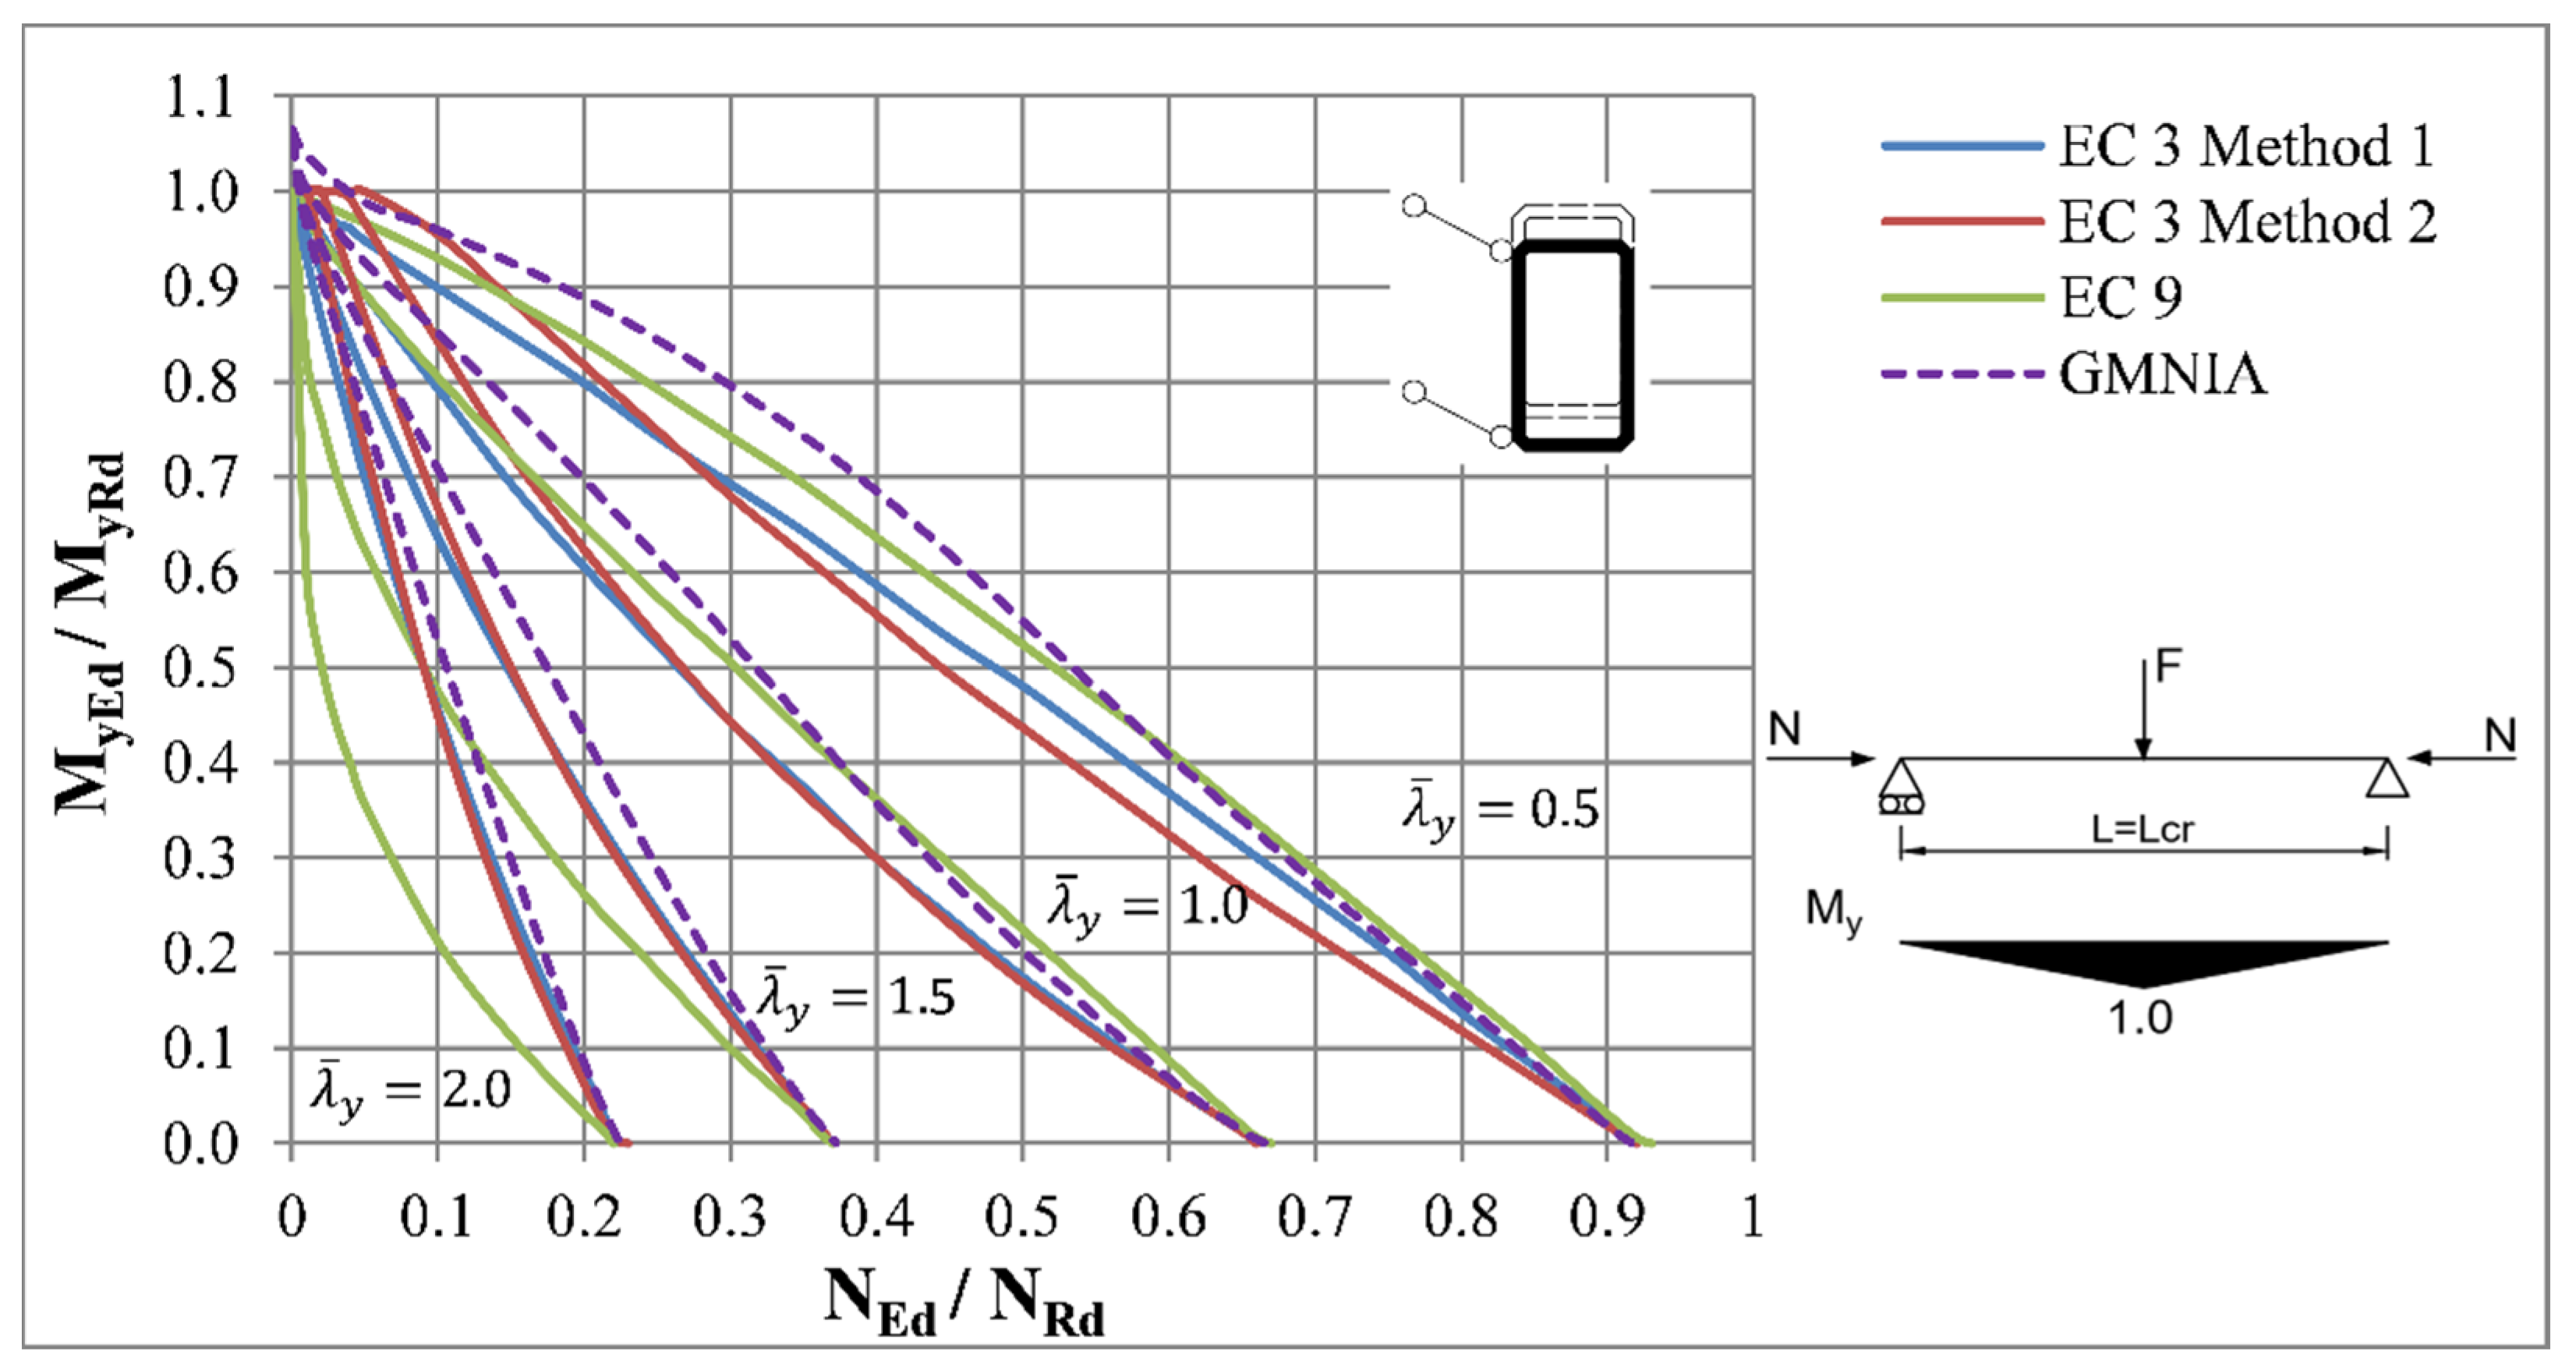
A noticeable reduction of bending resistance can be seen compared to beam-columns with restrained warping in the member ends. This is due to the bigger impact of warping torsion at the most stressed cross-section. This difference increases with higher slenderness and is almost 13% in the case of a member with a parabolic bending moment diagram and relative slenderness . Moreover, the plasticity effects due to the higher impact of warping torsion were less significant, as the curves of members with lower slenderness had more linear behaviour. It should be noted that the method of Eurocode 9 doesn’t consider this effect explicitly, as was not accounted in the calculation of exponents in the interaction formulae. Therefore, the methods of Eurocode 3 were more accurate for lower slenderness ratios, as they are based on the linear interaction formula.
3.1.3. Axial Compression and Minor-Axis Bending
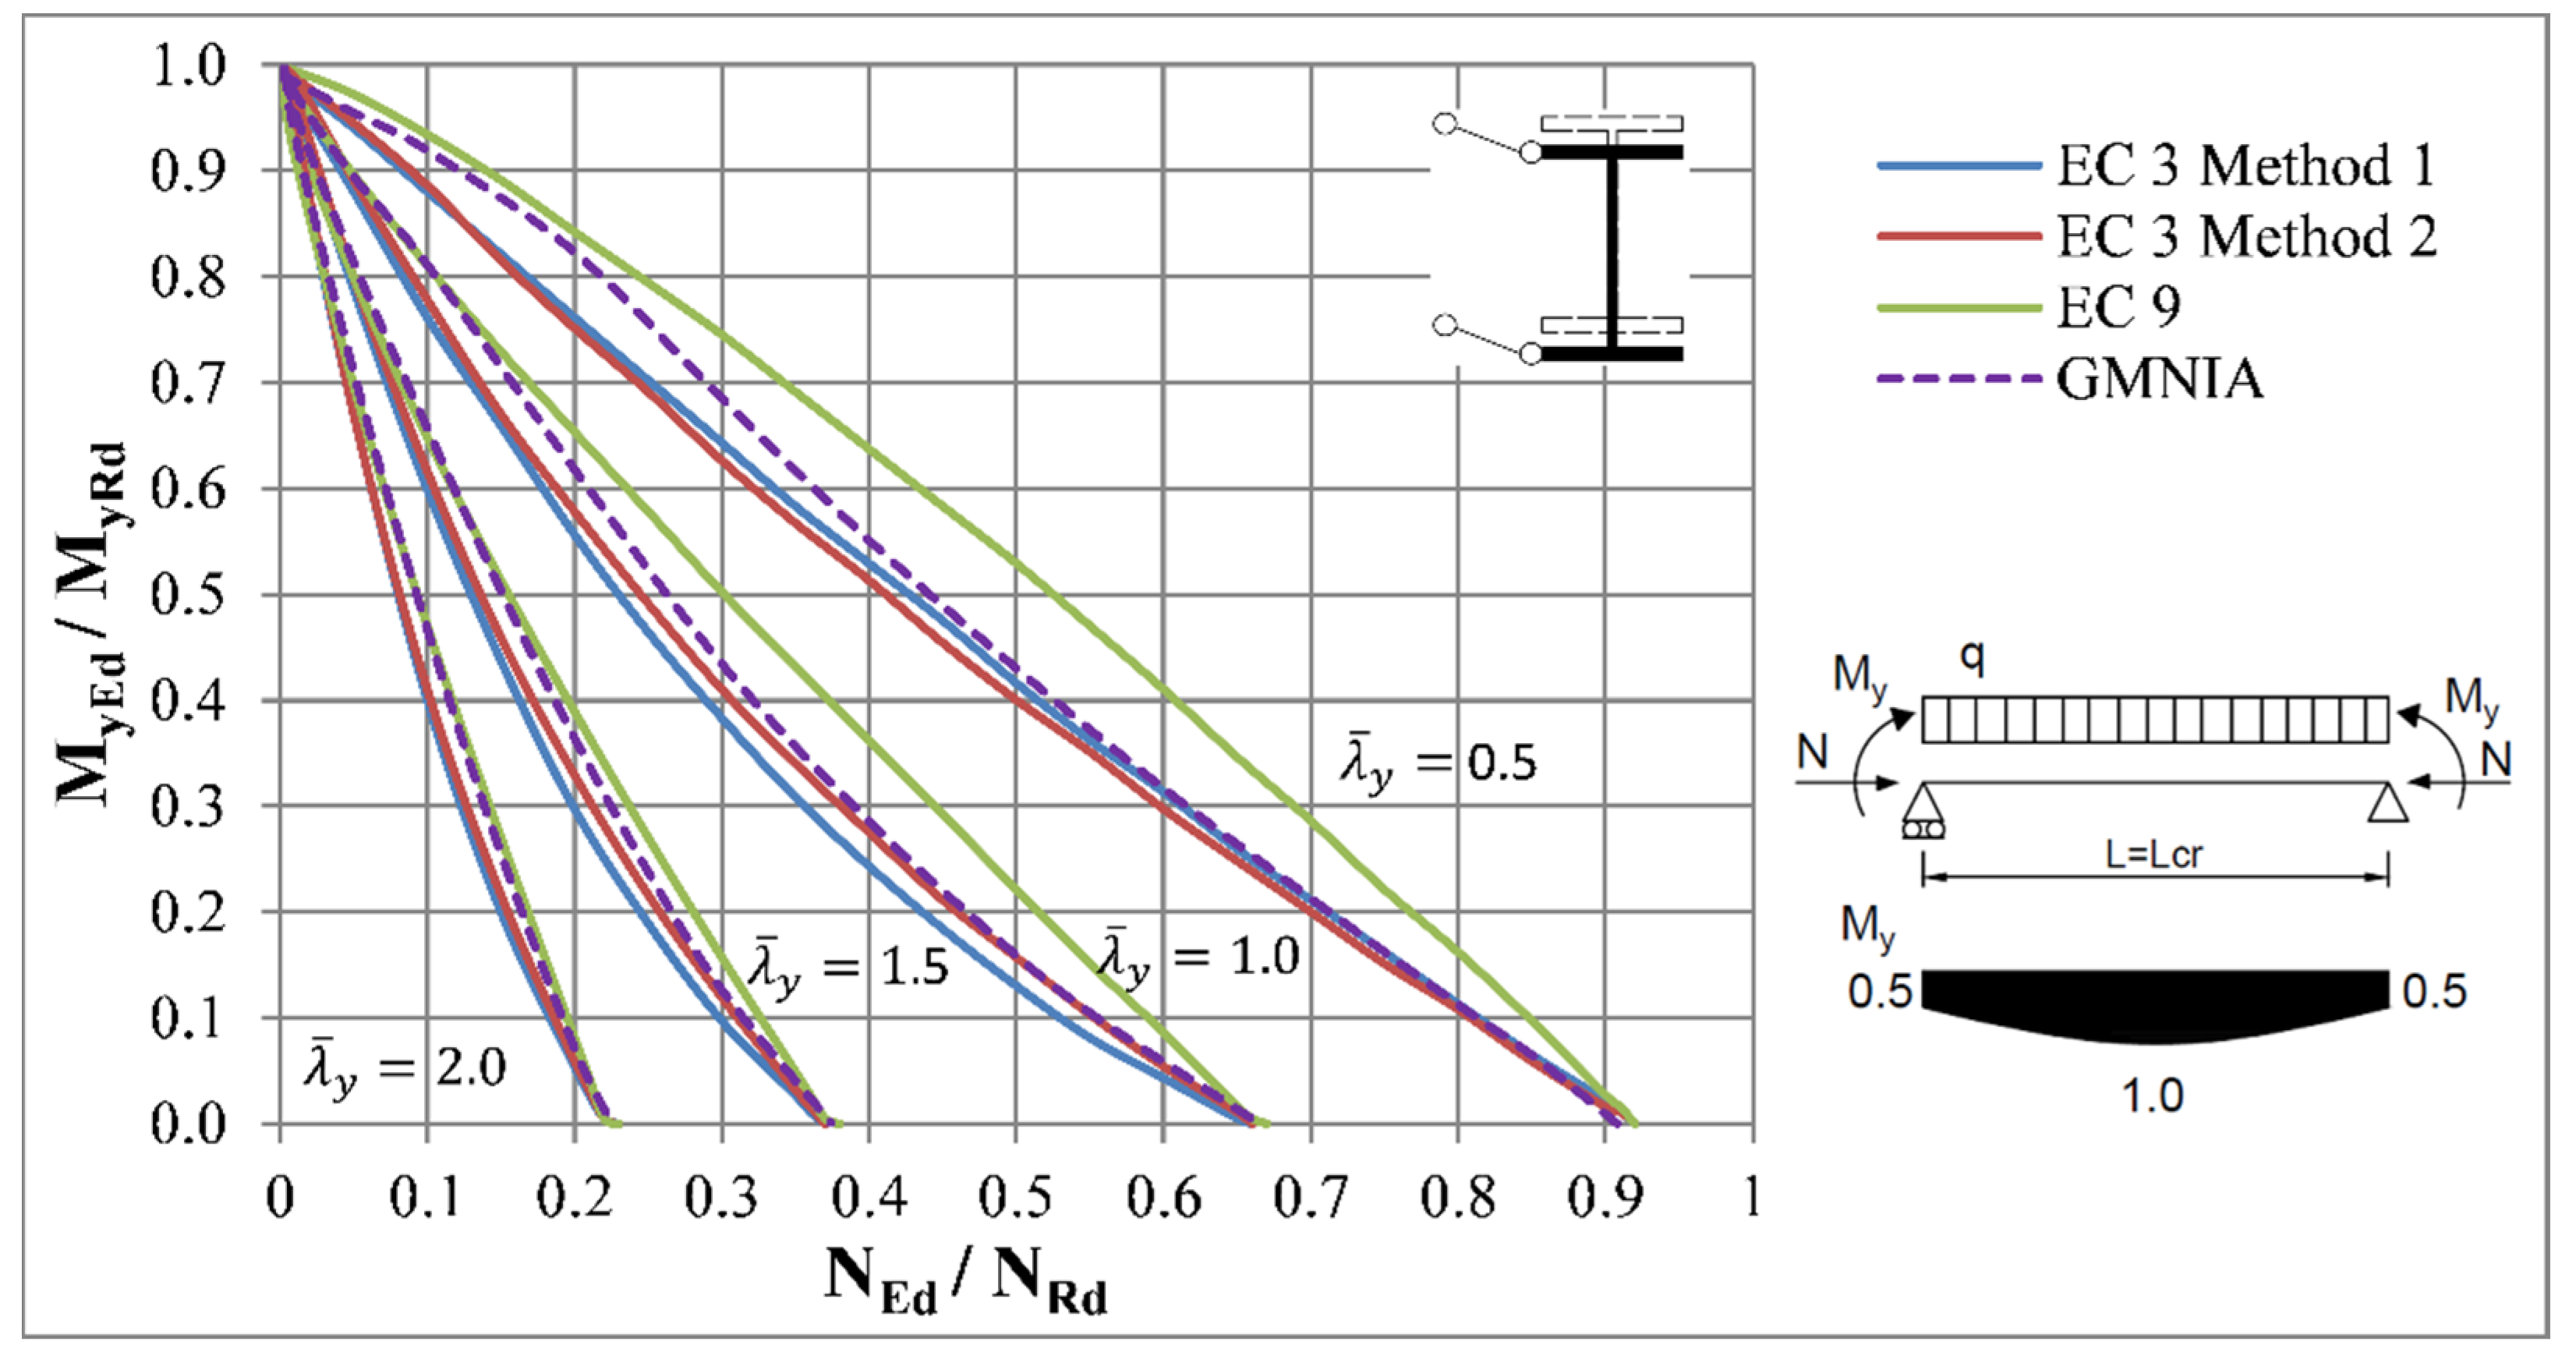
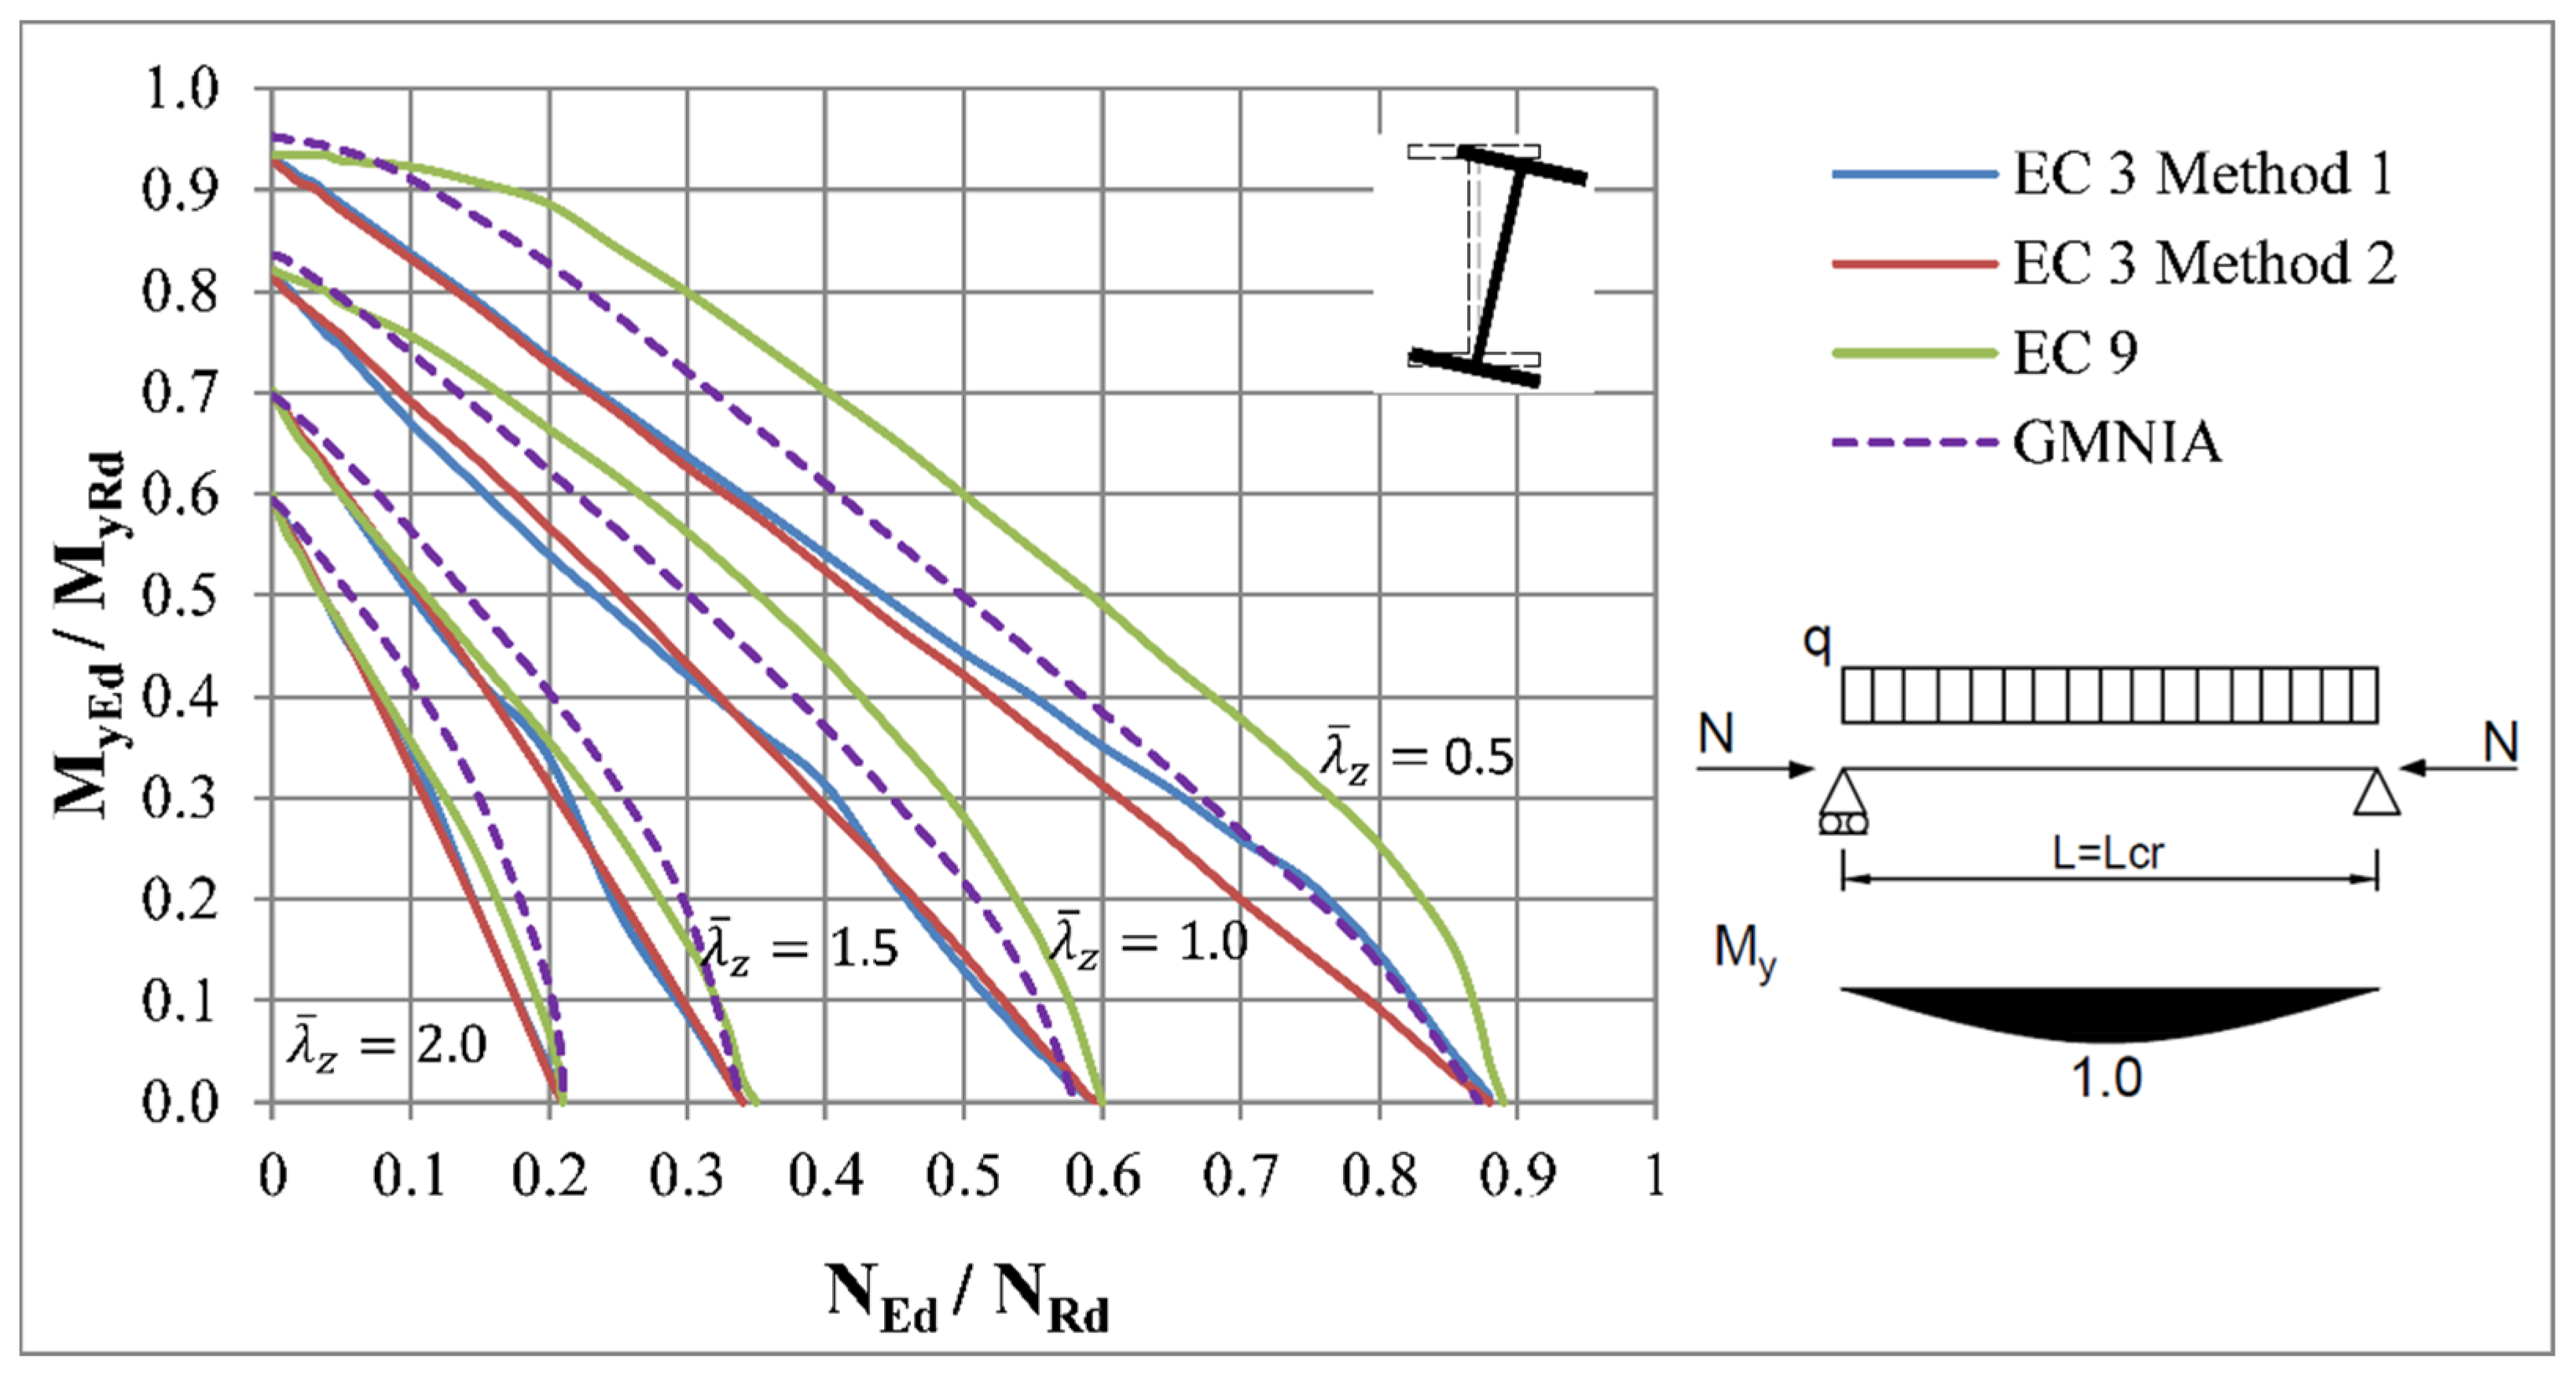
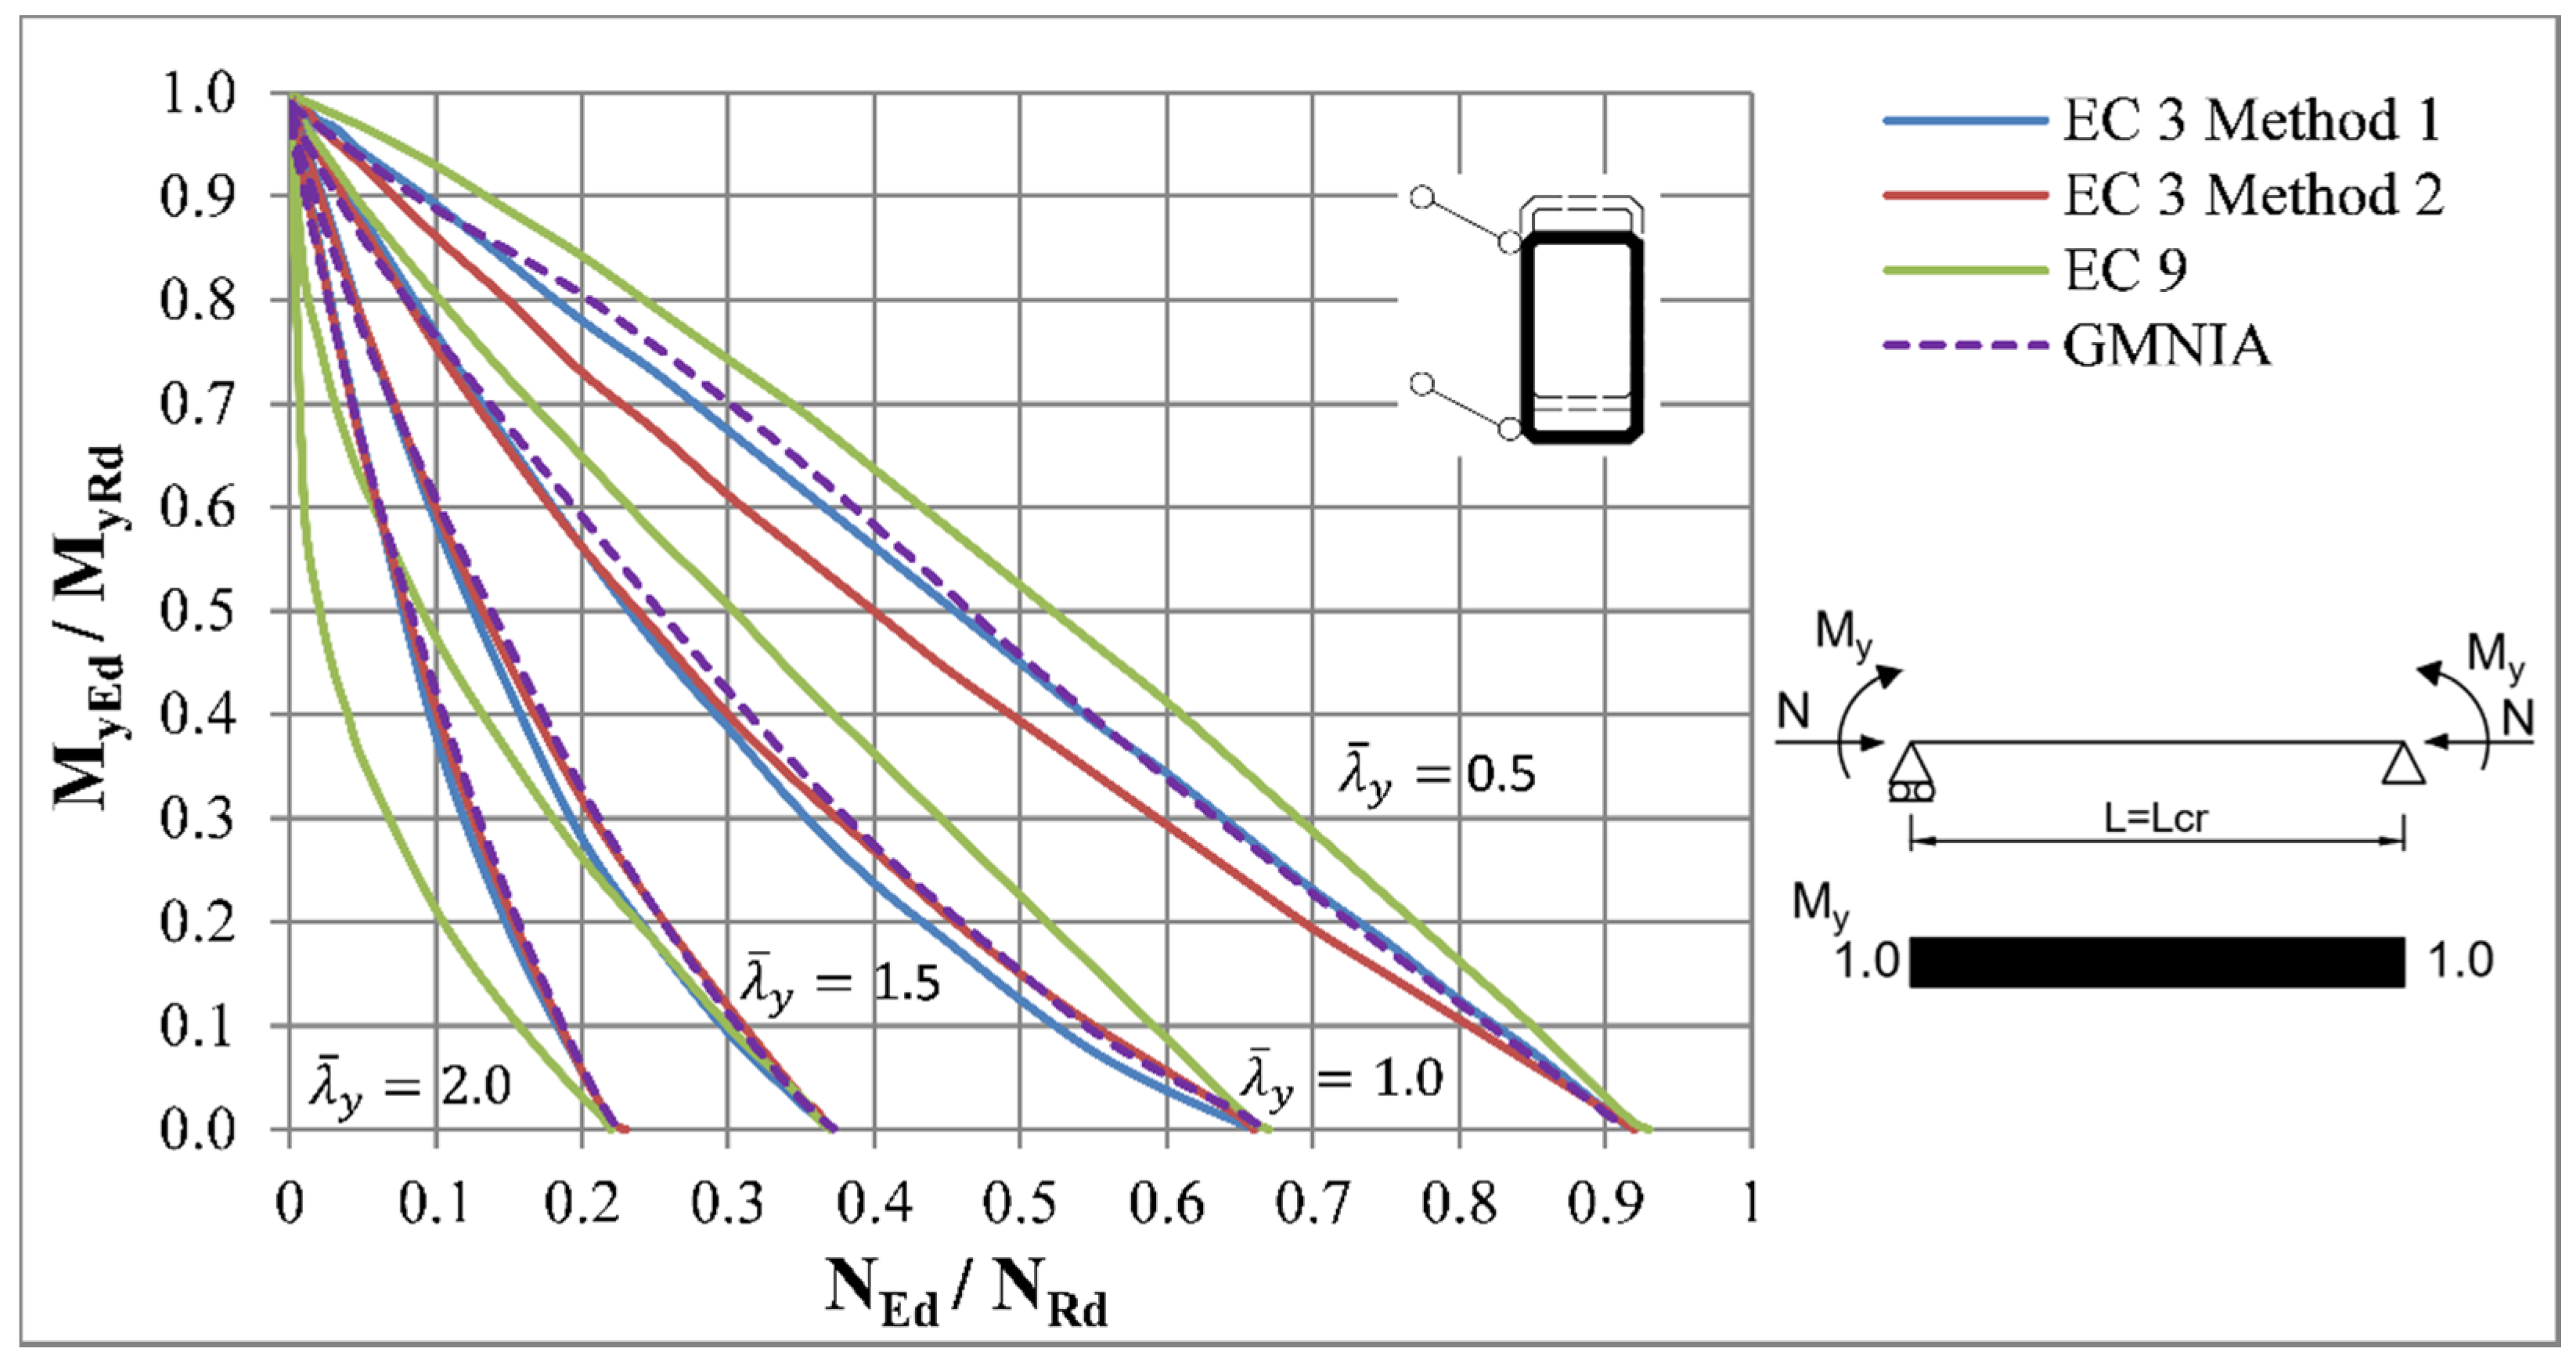
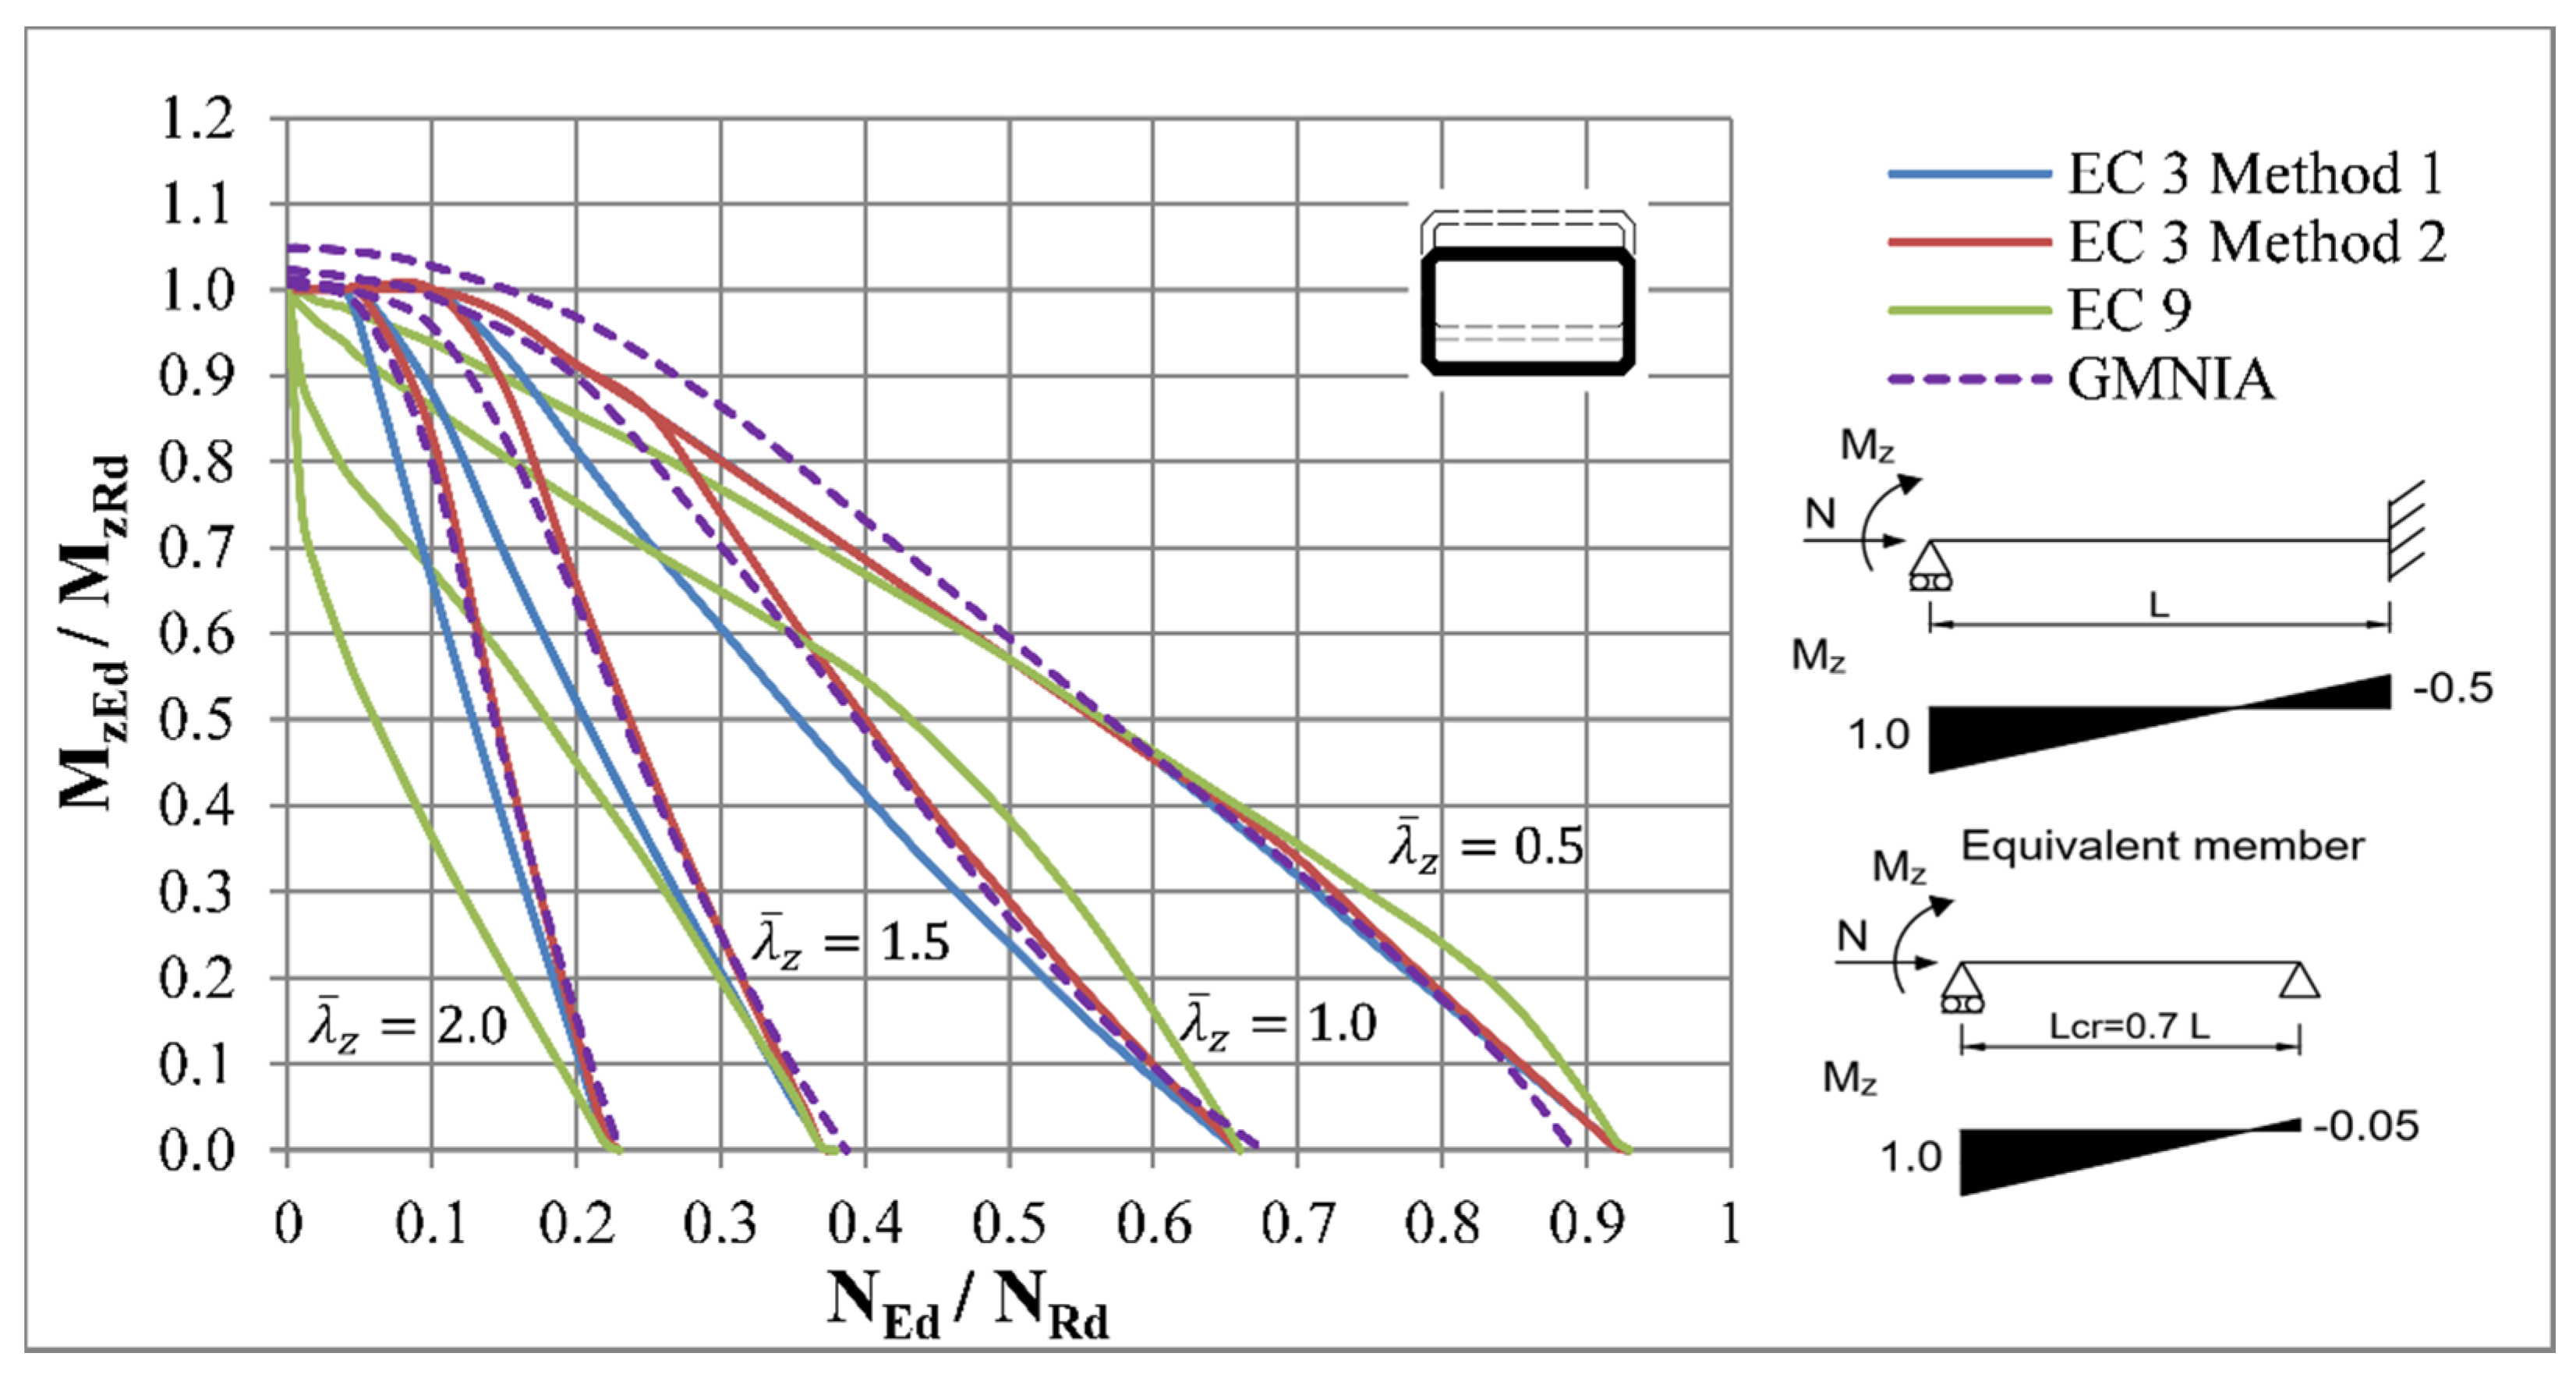
The resistance of beam-columns with an IPE type of cross-section with out-of-plane flexural buckling is presented in this section. Warping torsion does not occur in this loading combination, so the boundary conditions were modelled with the method of rigid plates in the end cross-sections. The lower lateral rigidity of members with this type of section induces lateral deformations in the same direction as the bending moment, so no additional adjustments were needed in the model. The Figure 26, Figure 27, Figure 28, Figure 29 and Figure 30. presents the interaction curves for out-of-plane buckling mode with an IPE type of cross-section.
From the presented diagrams it can be concluded that with relative slenderness the methods of Eurocode 3 provided similar results in case of pin-ended beam-columns. The deviations seem to be much higher for pinned-fixed beam-columns, where the Method A provided too conservative results.
The accuracy of the method of Eurocode 9 was higher with increased slenderness, similar to methods of Eurocode 3. However, unlike the previous methods, the resistances were mostly on the unsafe side for lower slenderness ratios. The positive effect of coefficients and in the case of the pinned-fixed beam column showed up again, as the accuracy was higher for stockier members.
On another note, the more convex behaviour of the interaction curve for slenderness can be a consequence of the higher plastic capacity of the weak axis of an IPE cross-section.
3.2. Resistance of Beam-Columns with RHS 200/100/10 Cross-Section
Rectangular hollow sections are cross-sections which are not susceptible to torsional deformations and, therefore, exhibit different behaviour under loading. The RHS 200/100/10 cross-section was chosen for analysis presented in the following sections, as this cross-section was used for verification of design methods according to Eurocode 3 [4]. The model was created from shell elements and the boundary conditions were modelled using a rigid plate technique, as described in Section 2.1.
The tabular cross-sectional dimensions were used for analytical determination of resistances. The radius zones at the plate intersections were replaced by skewed fillets. The wider plate of cross-section was built up from twenty elements; ten elements were used for the narrow plates and three for fillets.
The magnitude and distribution of residual stresses, which were adopted from the work of Ofner [35], are presented Figure 31. The other input parameters remained the same as described in Section 2.1.
3.2.1. Axial Compression and Major-Axis Bending Laterally Restrained
The purpose of these loading conditions was to study the flexural buckling behaviour about the major axis (y-y). Therefore, to prevent possible lateral deflections, the lateral restraints were also applied at the centre of top and bottom flanges along the whole member, as shown in Figure 32.
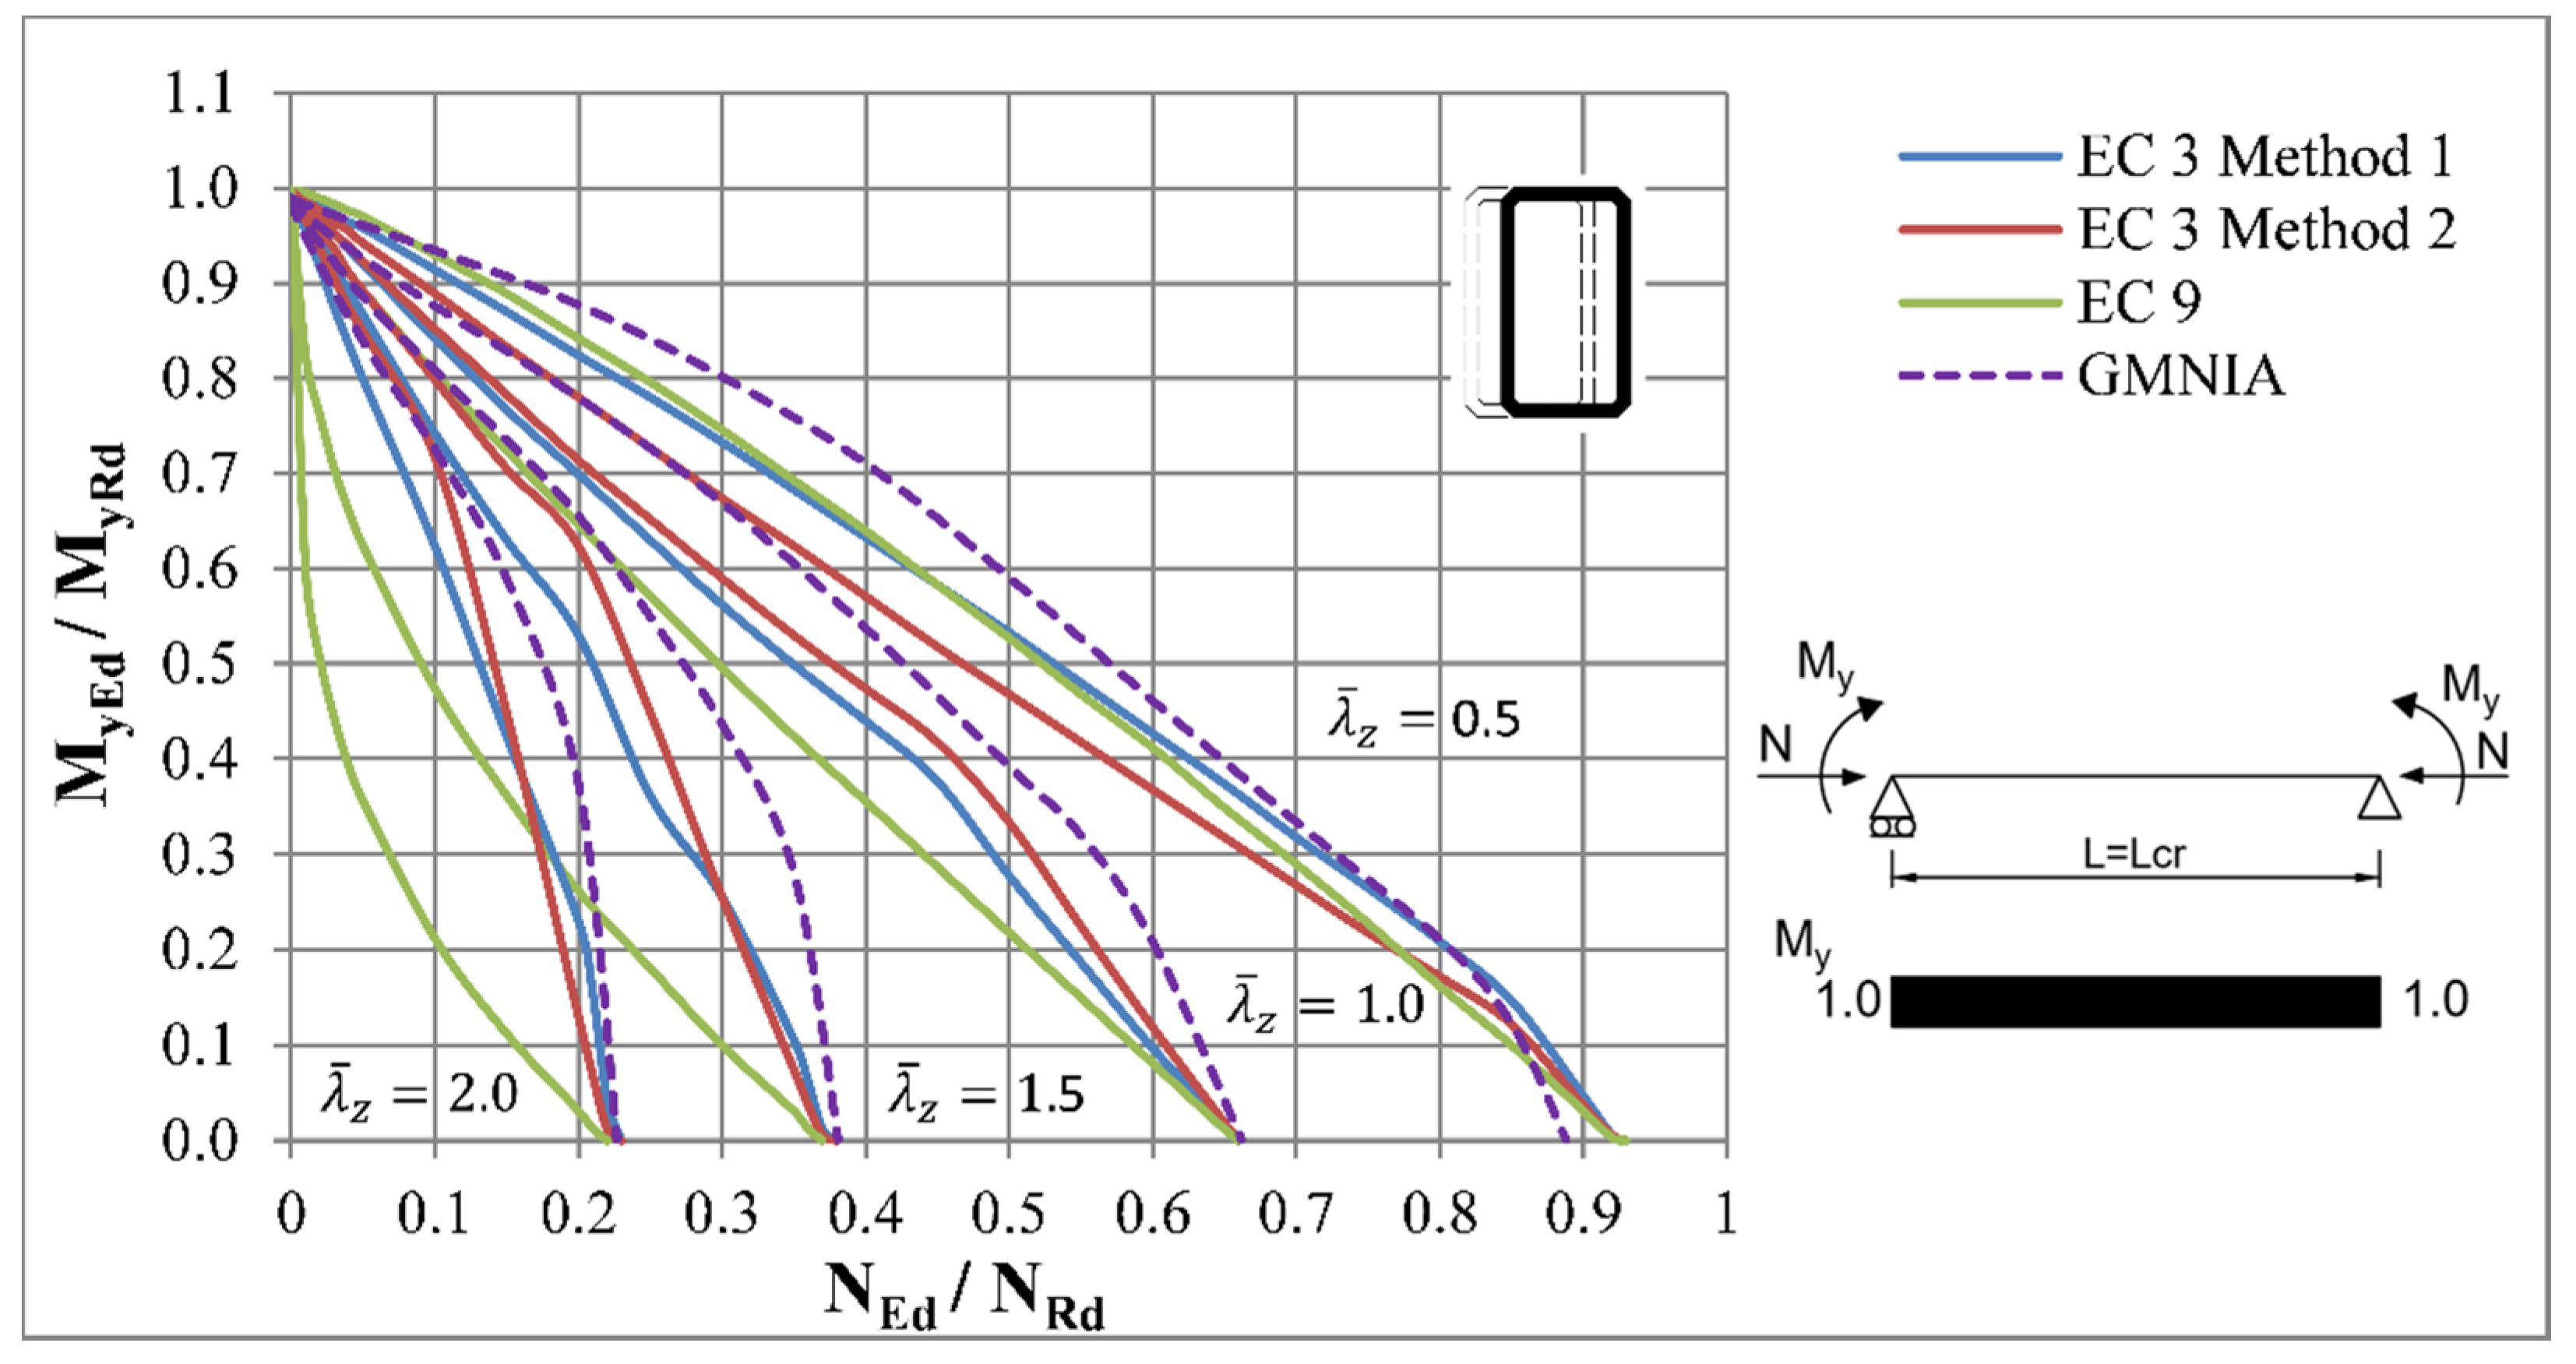
The interaction curves extracted from the analytical and numerical results are presented on the Figure 33, Figure 34, Figure 35, Figure 36 and Figure 37.
In the case of pin ended beam-columns, the curves according to Method 1 and 2 of Eurocode 3 were found to be in a good agreement with the results from the numerical simulations. The differences seem to be larger only for lower slenderness ratios, but they seem to be smaller than in the case of the IPE cross-section. Moreover, the interaction curves of these two methods were mostly on the safe side, the only exception being for Method 2 in the case of a member subjected to concentrated force in the middle of the span and low values of axial force. The higher deviations of these methods compared to FEM simulations can be seen in the case of pinned-fixed beam-columns.
It can be seen that the accuracy of interaction curves obtained by the method of Eurocode 9 was significantly lower. The results were on the unsafe side for slenderness ratios and , whereas for the slenderness ratios and the results were noticeably lower. However, the interaction curves obtained by this method had the same behaviour as the curves obtained by numerical analysis.
3.2.2. Axial Compression and Major-Axis Bending without Lateral Restraints
The behaviour of beam-columns subjected to bending moments about the major axis and susceptible to flexural buckling about the perpendicular axis (minor axis) was also observed. Therefore, no lateral restraints were modelled. Moreover, no local instabilities were caused by transversal loads and no stiffeners were needed.
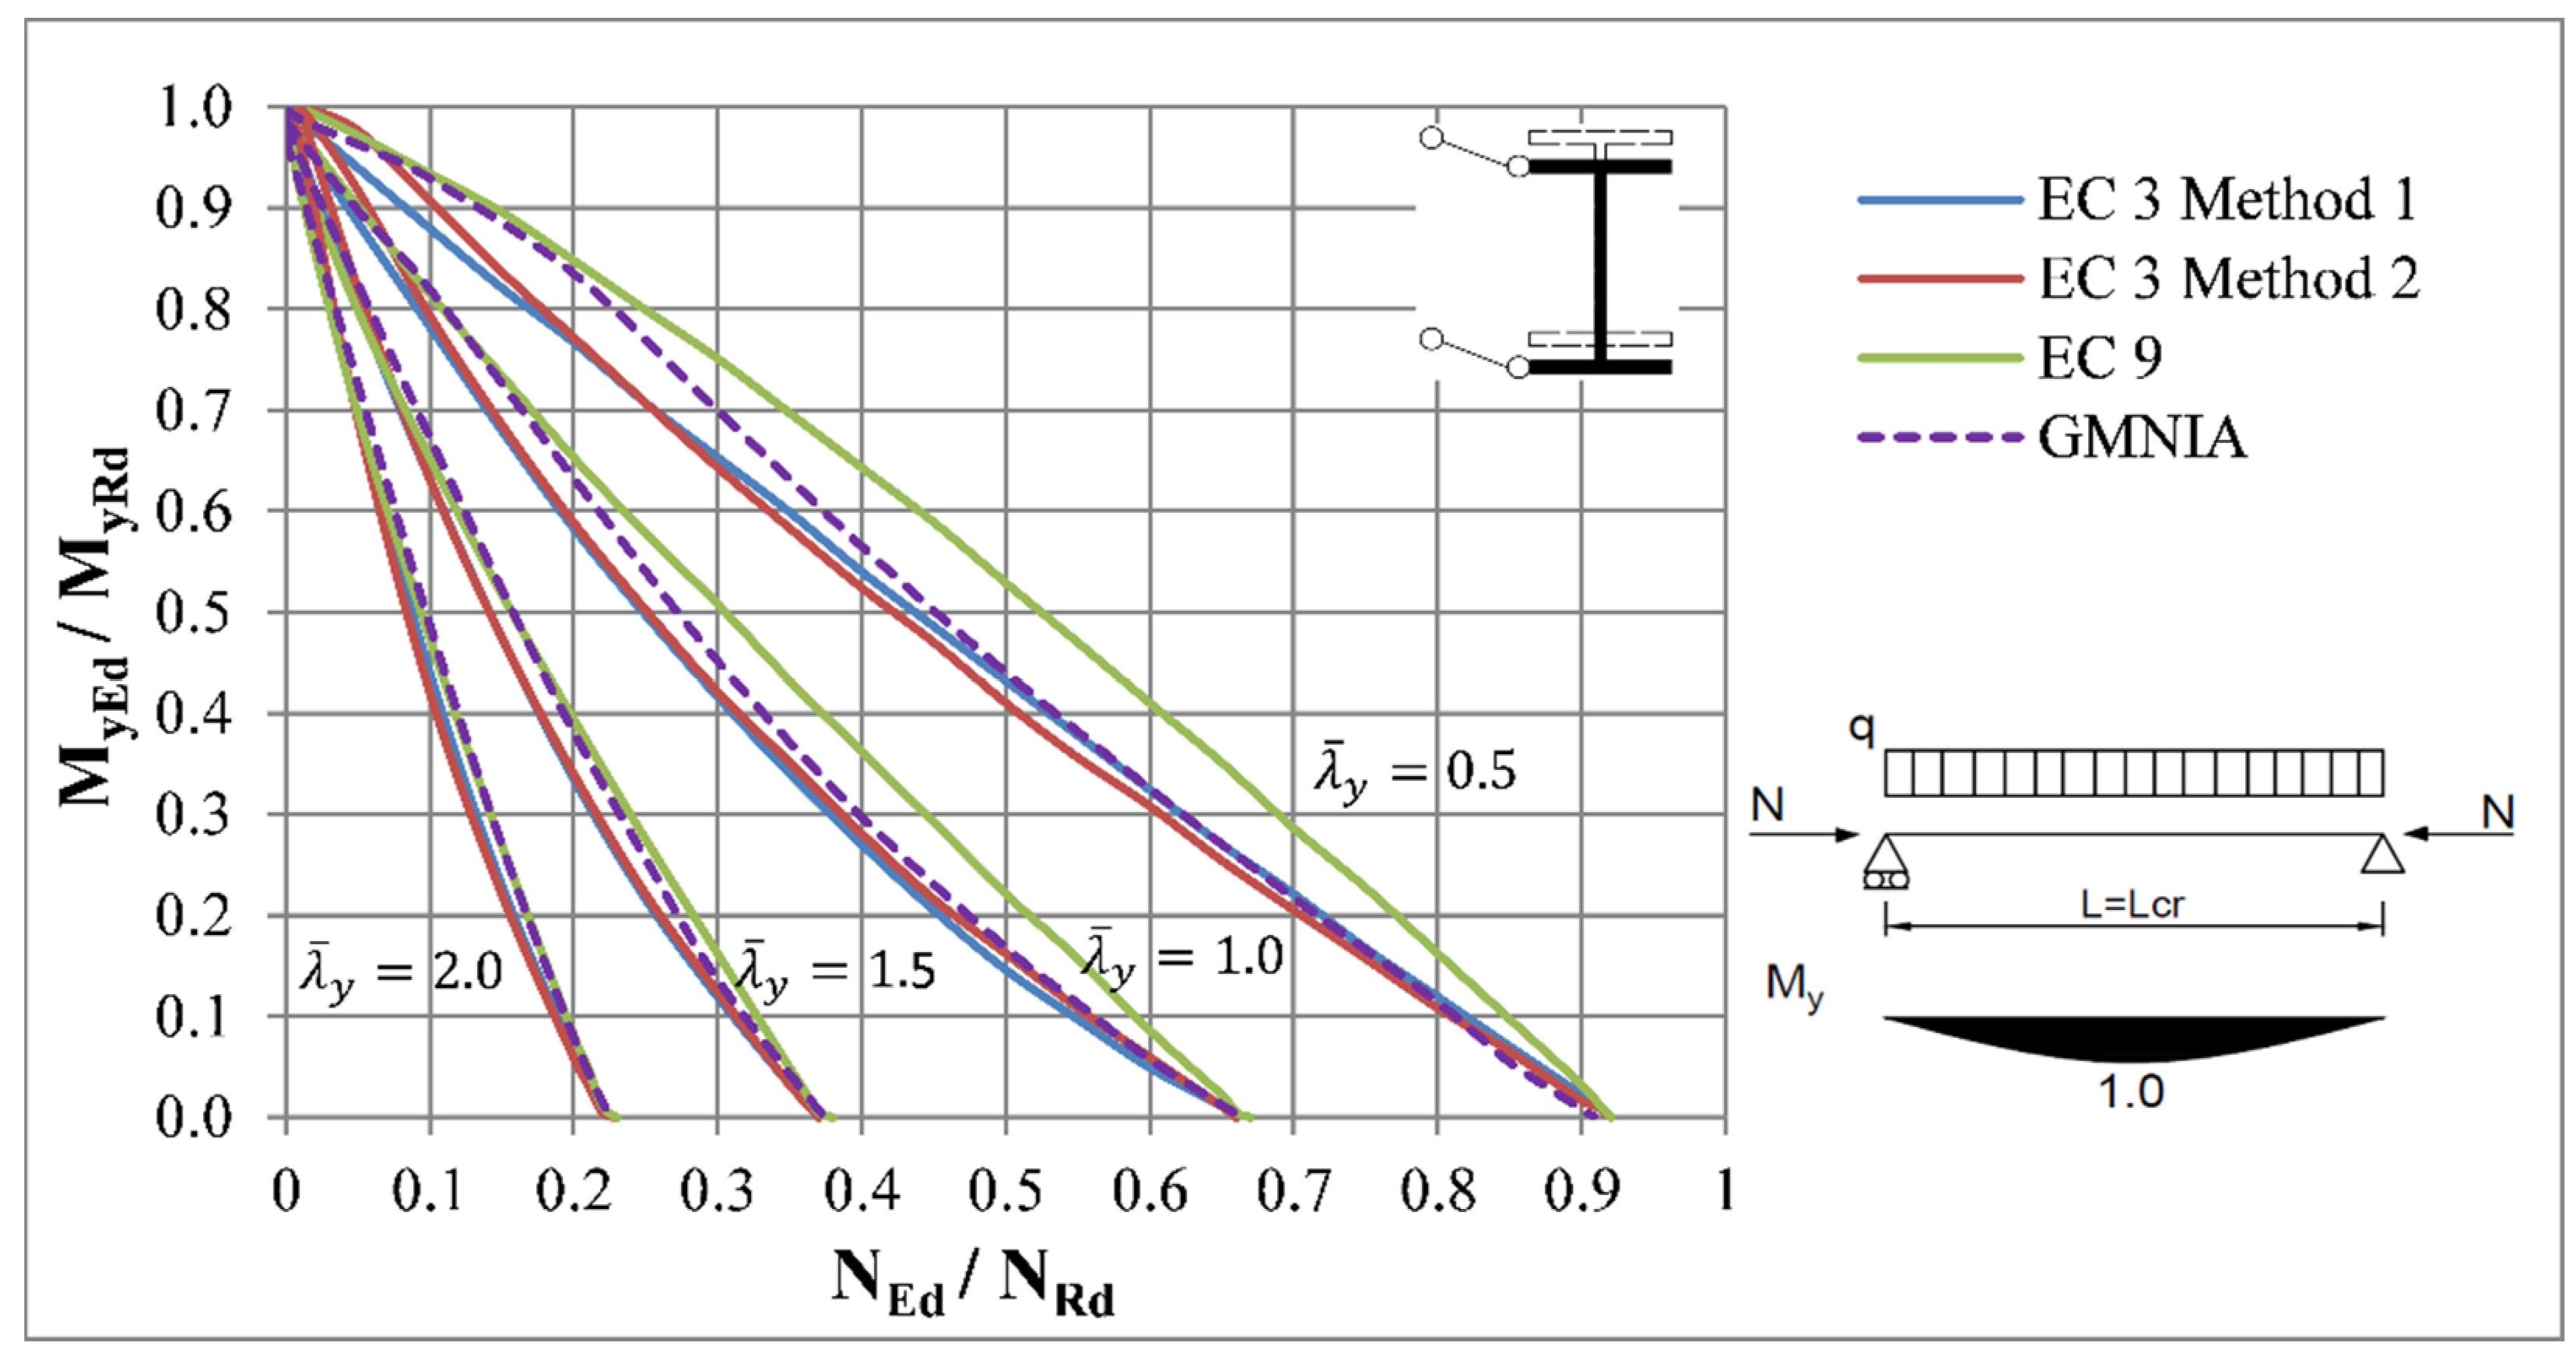
The comparison of analytical methods and FEM simulations is presented on the Figure 38, Figure 39, Figure 40, Figure 41 and Figure 42.
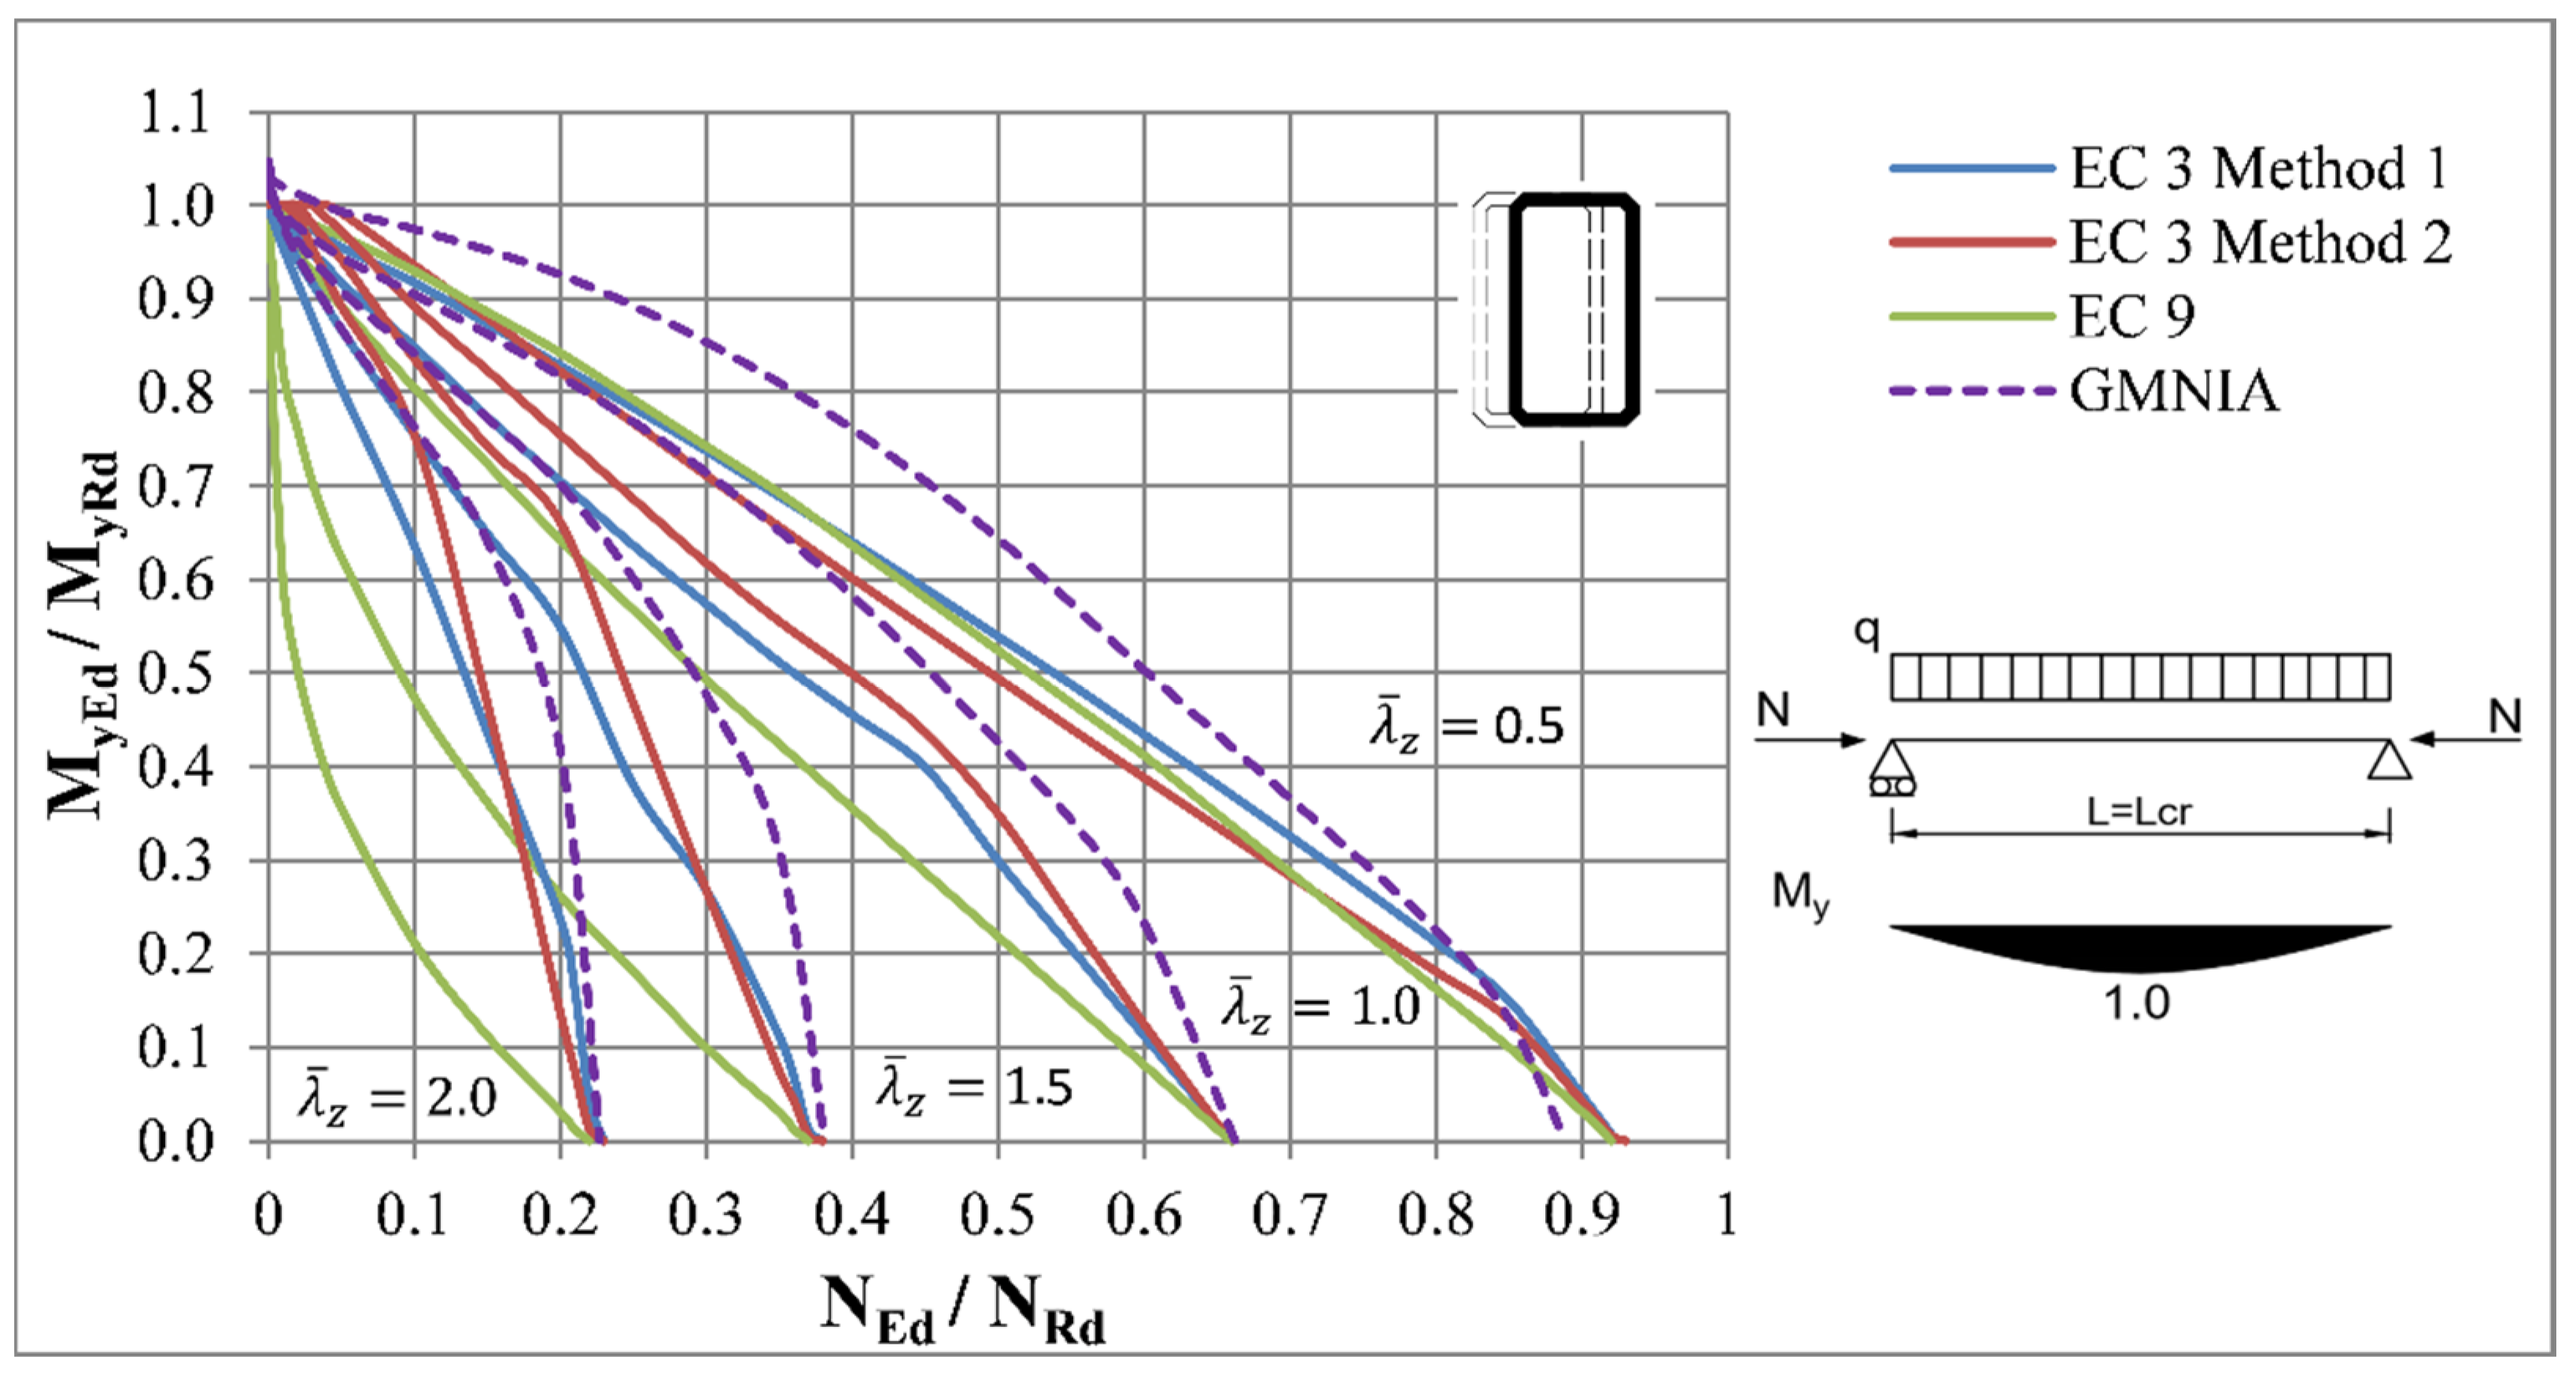
The methods of Eurocode 3 were not able to provide such accurate results, as in the previous case of the IPE-profile. The resistances according to these methods were lower compared to the FEM curves.
The method for verification of beam-columns according to Eurocode 9 provided too conservative values of resistances for these loading conditions. The deviations increased with growing slenderness ratio and were significantly lower than deviations according to the methods of Eurocode 3.
3.2.3. Axial Compression and Minor-Axis Bending
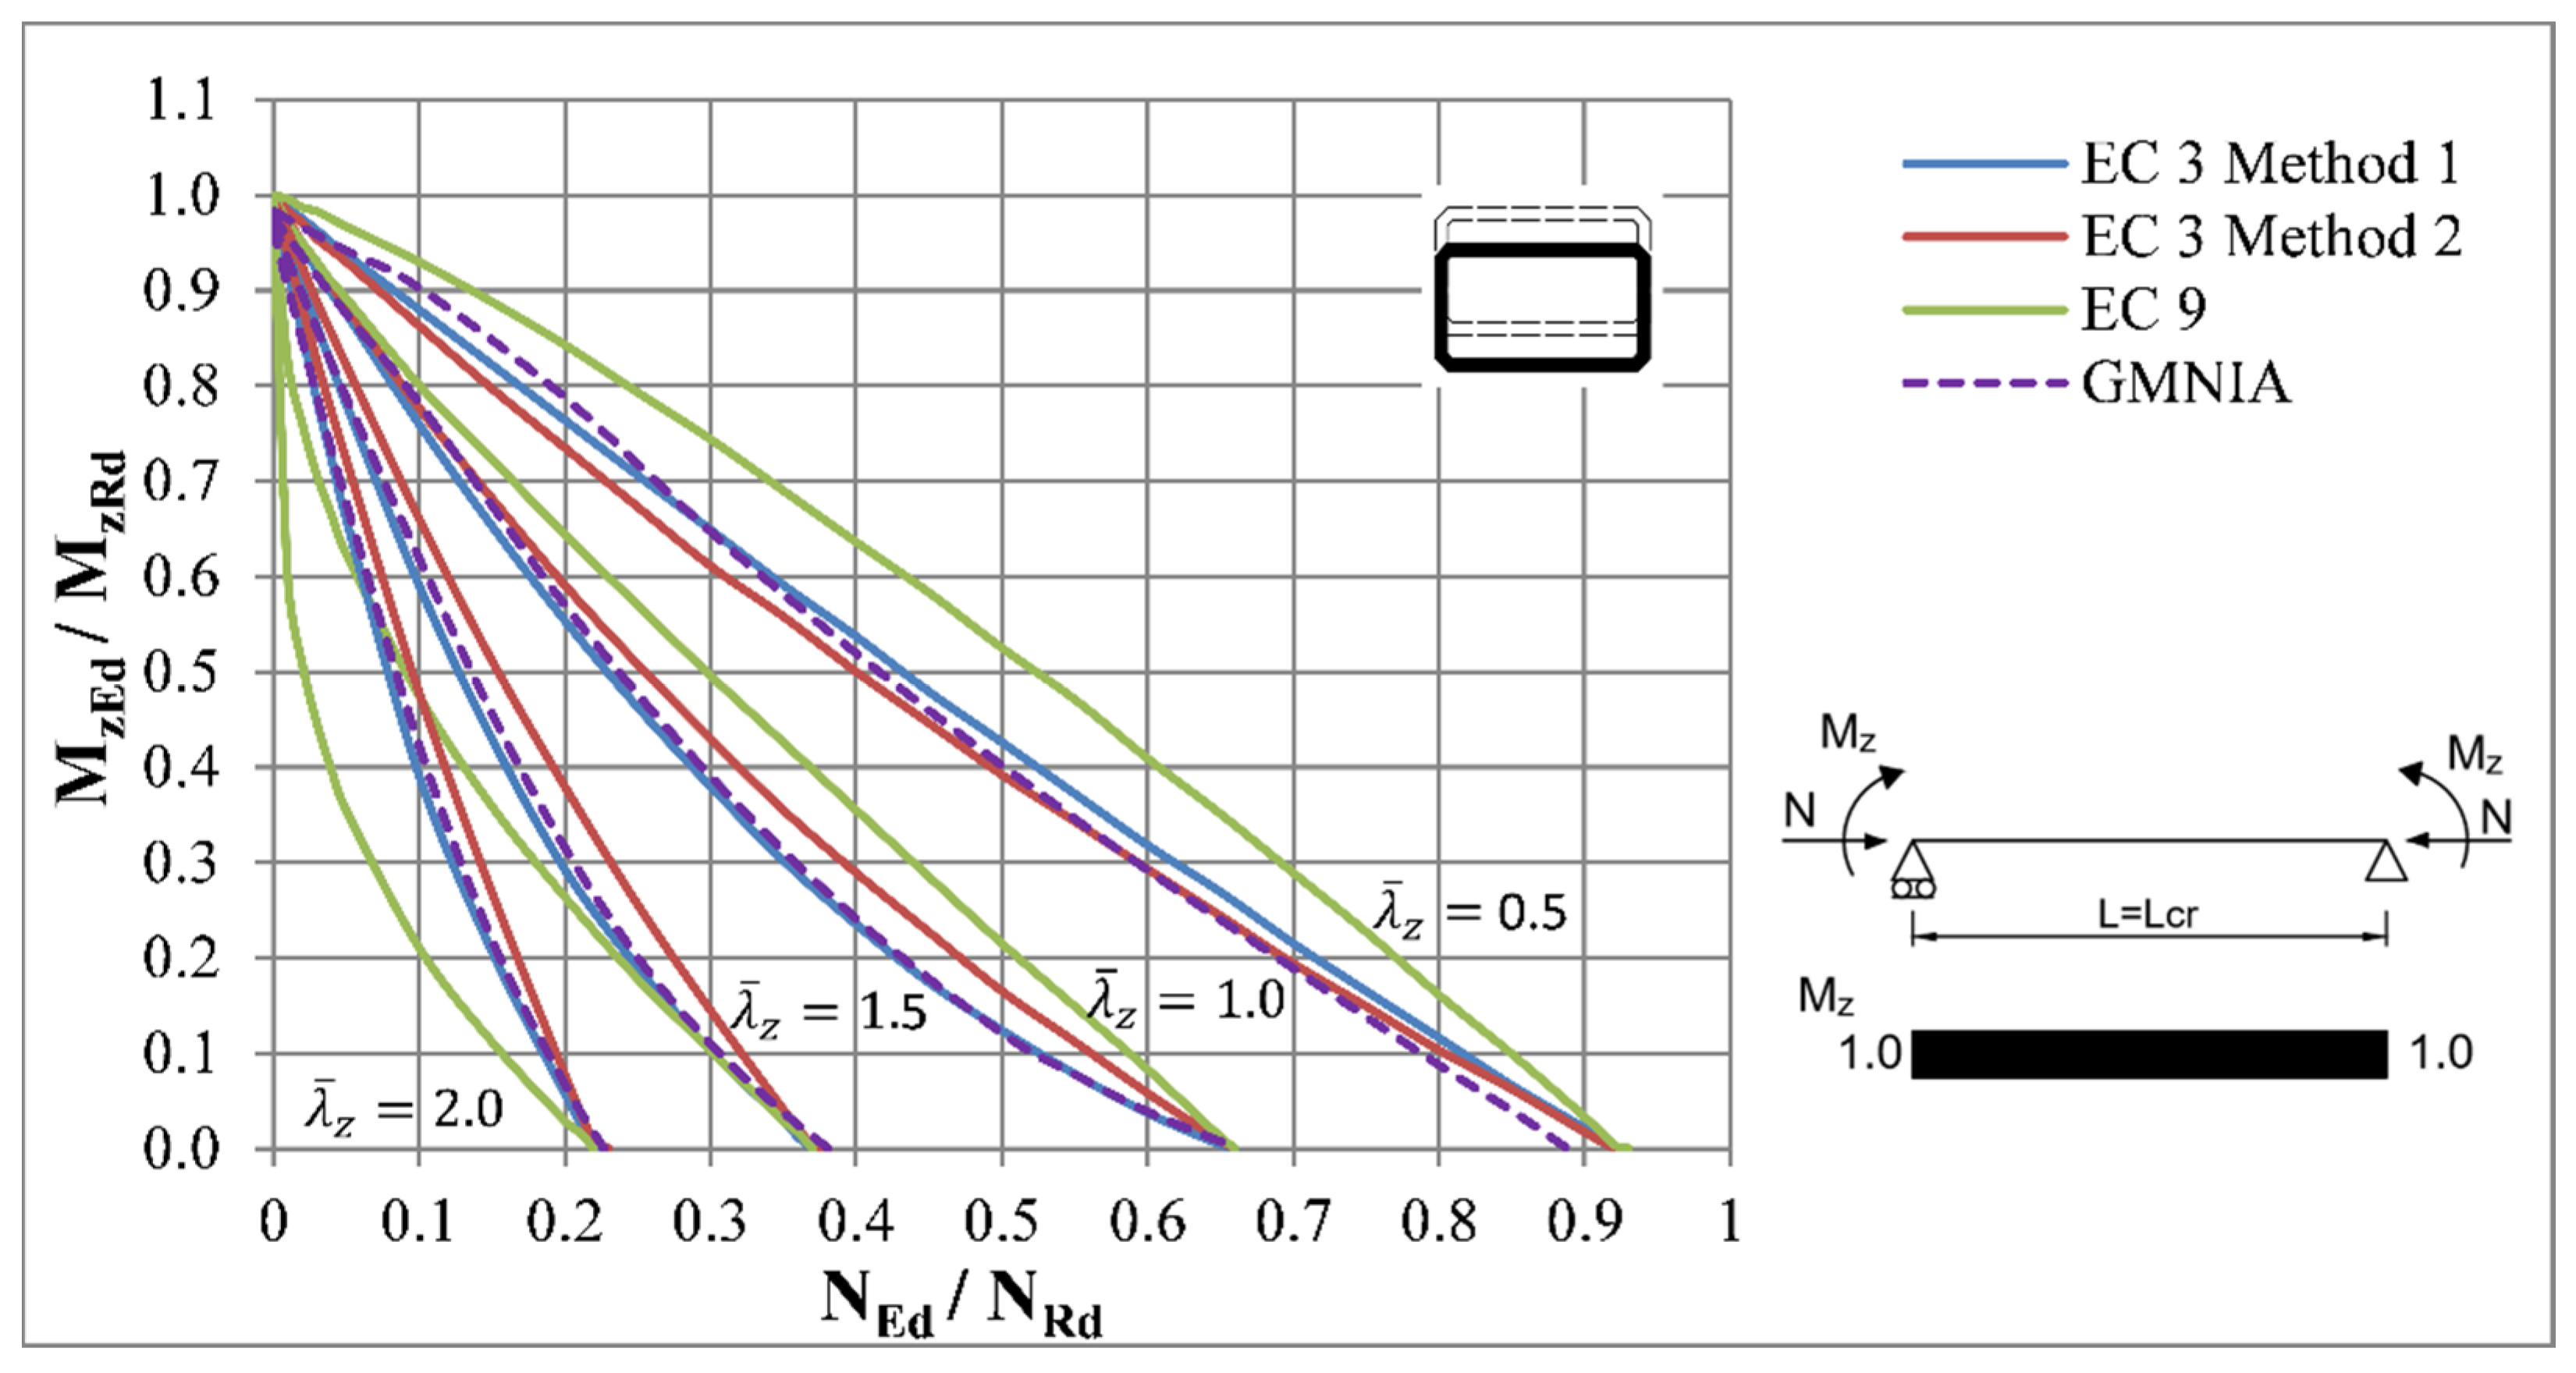
In the case of a weak axis bending scenario, similar behaviour to flexural buckling about the major axis was expected for double symmetric rectangular hollow sections. This is due to the fact that the shape of the cross-section and, therefore, cross-sectional properties remain similar for both axes. The best examples of such cross-sections are circular hollow sections (CHS) or square hollow sections (SHS) sections. To make this analysis complete, a comparison of design methods for weak axis flexural buckling is also presented. Therefore the Figure 43, Figure 44, Figure 45, Figure 46 and Figure 47 presents the interaction curves for out-of-plane buckling mode with a RHS type of cross-section.
It can be seen that in case of beam-columns with RHS cross-sections subjected to the axial force and bending moment acting in the same direction as the buckling mode, the GMNIA interaction curves had similar behaviour. However, the GMNIA curves showed lower plastic capacity, as the interaction curves were slightly concave for lower slenderness ratios. Therefore, the accuracy of design methods was different for lower slenderness ratios. This was particularly visible for Method 2 of Eurocode 3, which used the same value of ky and kz factors for both axes. The resistances provided by Eurocode 9 for higher slenderness ratios remained too conservative, as in the previous loading conditions.
4. Results and Discussion
The comparison of design methods according to European standards for steel beam-columns with IPE and RHS types of cross-sections is presented in the previous sections. In and out-of plane buckling behaviour was the objective of the study. As was presented on the interaction diagrams, the accuracy of Methods 1 and 2 of Eurocode 3 was generally sufficient for loading conditions where the bending plane was the same as the buckling plane for both cross-sections. On the other hand, the accuracy of these design methods was lower for the combination of strong axis bending moment and out-of-plane buckling mode, especially for the IPE cross-section with warping restraints on the member ends. The reason seems to be in the linear interaction formulae and interaction factors kij, whose values don’t allow development of full plastic resistance. Moreover, the different values of the kij interaction factors were the reason of different resistance values between these two methods, as they were developed on different principles. The interaction factors according to Method 1 were derived, as far as possible, on theoretical aspects to provide a general and transparent design procedure where each coefficient represented a single phenomenon. On the contrary, Method 2 provided a design procedure with a reduced number of coefficients to minimize the amount of calculation work. The interaction factors were, therefore, determined on the basis of numerical simulations, although they were still dependent on physical parameters [4]. The example of the pinned-fixed beam column illustrates that the accuracy of these methods was lower in cases of loading conditions where the maximum values of primary and secondary moments did not occur in the same place. This was due to the fact that the resistance of cross-sections is the governing factor, and these methods can’t handle such situations. Therefore, a cross-section check is also needed. The accuracy of these methods changed with the buckling modes, loading cases, or slenderness ratio; therefore, it was difficult to decide which method was more accurate.
The design method according to Eurocode 9 for aluminium structures was also compared to the numerical analysis. This method also provides various degree of accuracy for different loading conditions. The resistances were mostly higher for lower slenderness ratios but, on the other hand, the resistances were lower than the resistances acquired by numerical simulations for higher slenderness ratios. This similarity was seen for all loading conditions and for both types of cross-section. In of this, in the case of lateral-torsional buckling of beam-columns with an IPE type of cross-section (strong axis bending and out-of-plane buckling mode) with restrained warping at the member ends, the accuracy seemed to be higher compared to the methods of Eurocode 3, although the resistances were found to be also on unsafe side for slenderness . However, the most specific was the out-of-plane buckling case with strong axis bending moment and an RHS cross-section, where the resistances were lower than the FEM resistances for all observed slenderness ratios. With rising slenderness, the differences were in order of tens of percents.
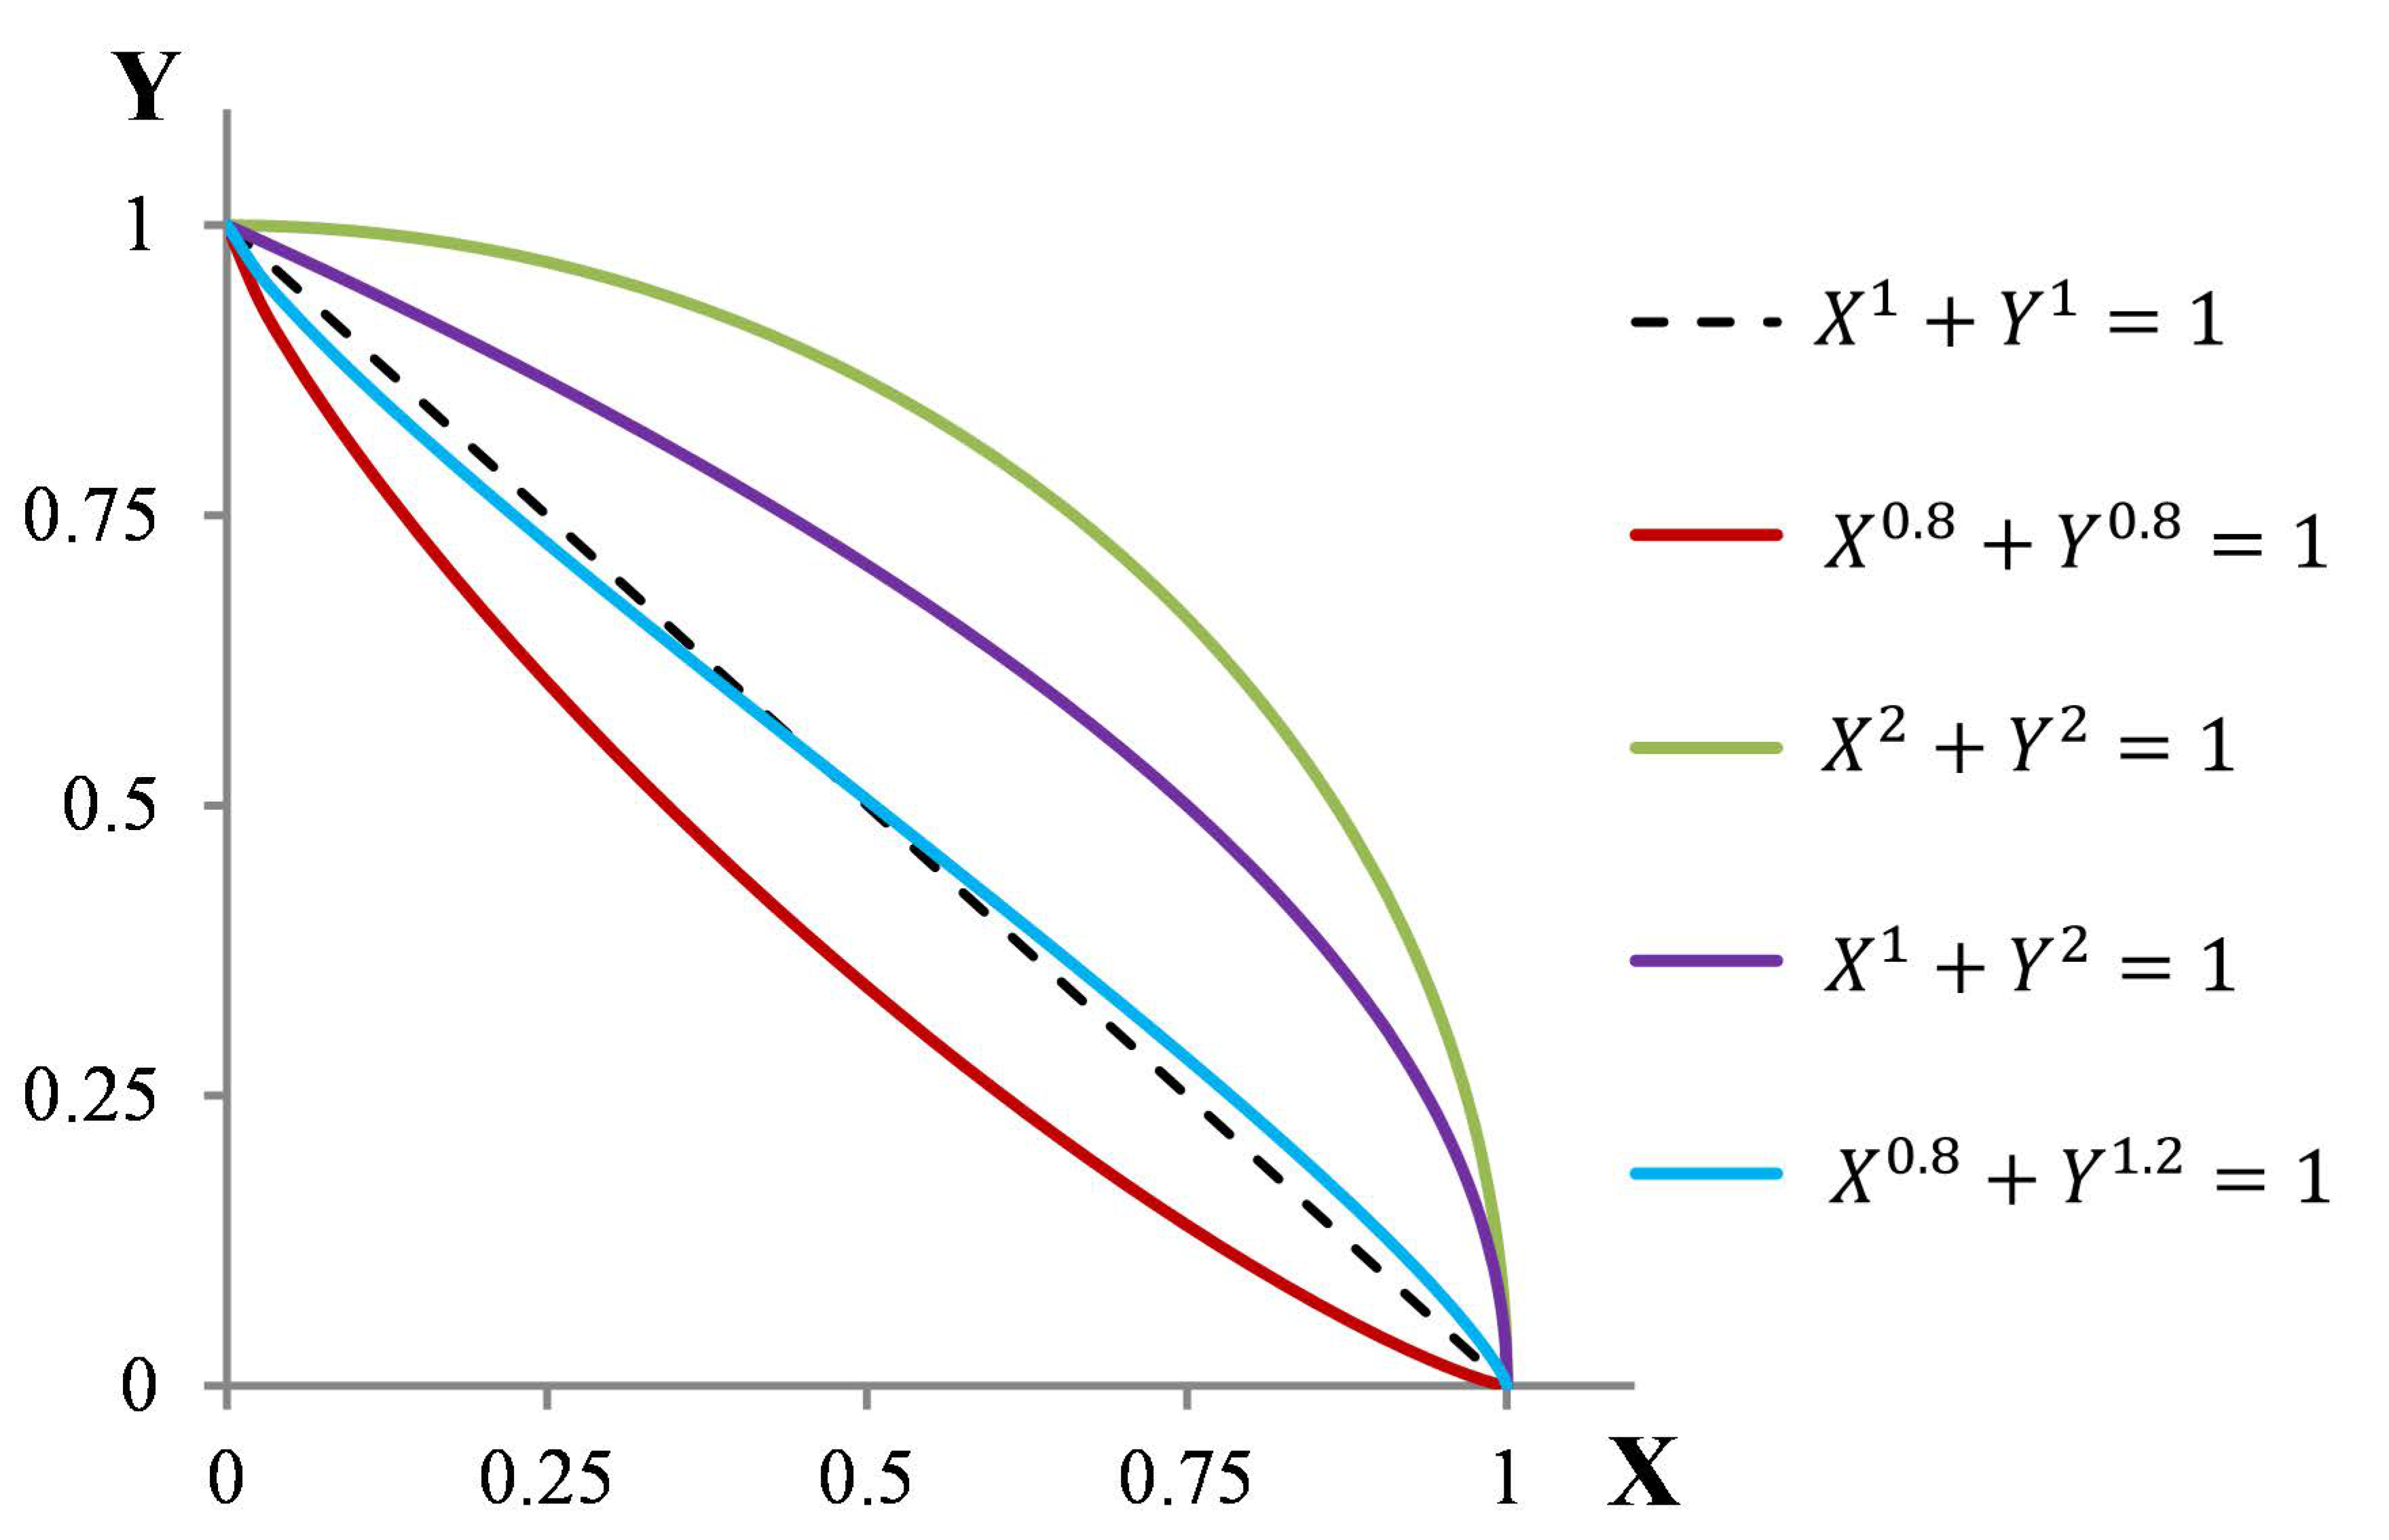
Nevertheless, as was already mentioned, the interaction curves provided by this method had the same parabolic behaviour as the interaction curves gathered by GMNIA analysis for all slendernesses and both types of cross-section. This was especially visible in the example of lateral-torsional buckling of an IPE member subjected to constant bending moment diagram with relative slenderness ratio (Figure 15), as the interaction curve was almost identical to the curve acquired by numerical analysis. This is possibly due to the exponential form of the interaction formula, which was based on the plastic cross-sectional criterion. Therefore, it can be concluded that a suitable design method could be developed by an appropriate modification of the exponents in the interaction formula. The effect of the exponents on the behaviour of the interaction curves is illustrated in Figure 48. If the exponents are higher than one the curve is convex, and if the exponents are lower than one the curves are concave. However, as was mentioned, additional effects have to be accounted for in the calculation of the exponents, such as the primary bending moment diagram.
In addition, in load cases where the stability failure doesn’t occur and the cross-section resistance is the governing criterion, the design method of Eurocode 9 can provide more accurate resistances compared to design methods of Eurocode 3. The coefficients and are used to reduce the effect of flexural or lateral-torsional buckling reduction factors in places where the second order bending moments don’t have the maximum impact, and the interaction formulae, therefore, change to cross-section resistance formulae. The cross-section resistance verification is therefore not necessary, as it is included in the member resistance verification.
The biggest advantage of this design method is its simplicity. It is also less liable to mechanical mistakes due to its simple physical principles, universal utilization for a wide range of cross-section shapes and loading conditions, as well as reduced number of coefficients involved in the interaction formulae.
Finally, it has to be noted that this analysis was developed only for two cross-section sizes, which both belong to the first class of cross-section classification. The results for members with cross-sections belonging to the third and fourth class of cross-section classification can be different and, therefore, should be verified.
5. Conclusions
In this paper, a comparison of the design approaches according to Eurocode 3 and Eurocode 9 is presented. Beam-columns subjected to a combination of axial force and bending moment were investigated. Members with two types of cross-section were used: with an IPE 100 type of cross-section and with an RHS 200/100/100 type of cross-section. Five different load cases were investigated: the pinned-fixed beam column and four simply supported members with different bending moment diagrams along the member. To accomplish this objective, numerical analysis was performed to compare results to analytical results.
It was seen that, in principle, the method of Eurocode 9 was not more accurate than the Methods 1 and 2 according to Eurocode 3. Nevertheless, it can be more accurate in cases where the place of maximum impact of the first order bending moment differs from the place of the maximum impact of the second order bending moment. Moreover, this method provides very similar interaction curves compared to numerical analysis for a member with IPE type of cross section and with warping restraints in both member ends of the member assuming minor axis buckling mode. As was mentioned in Section 4, the accuracy was highly dependent on the value of the exponents in the interaction formulae. Therefore, it can be assumed that it is possible to obtain improved accuracy by calibrating the exponents for the quotients in the interaction formulae. Nevertheless, the formulation of the method according to Eurocode 9 reduces the amount of calculation work, is easier to understand and still remains general compared to methods established in Eurocode 3.
Author Contributions
Conceptualization, J.P. and J.V.; methodology, J.P.; software, J.J.; validation, J.P., J.V. and J.J.; formal analysis, J.P. and J.J.; investigation J.J.; resources, J.V.; data curation, J.V.; writing—original draft preparation, J.P.; writing—review and editing, J.V.; visualization, J.J.; supervision, J.P. and J.V.; project administration, J.V.; funding acquisition, J.V. All authors have read and agreed to the published version of the manuscript.
Funding
The paper presents the results of the research project No. 1/0336/18 supported by the Slovak Grant Agency.
Institutional Review Board Statement
Not applicable.
Informed Consent Statement
Not applicable.
Data Availability Statement
Data sharing not applicable.
Conflicts of Interest
The authors declare no conflict of interest.
References
- Euler, L. Methodus Inveniendi Lineas Curvas Maximi Minimive Proprietate Gaudentes, 1st ed.; Marcum-Michaelem Bousquet & Socios: Lausanne, Switzerland; Geneva, Switzerland, 1743; pp. 1–322. [Google Scholar]
- Jönsson, J.; Stan, T.C. European column buckling curves and finite element modelling including high strength steels. J. Constr. Steel Res. 2017, 128, 136–151. [Google Scholar] [CrossRef] [Green Version]
- Tankova, T.; Silva, L.S.; Marques, L. Buckling resistance of non-uniform steel members based on stress utilization: General formulation. J. Constr. Steel Res. 2018, 149, 239–256. [Google Scholar] [CrossRef]
- Boissonnade, N. Rules for Member Stability in EN 1993-1-1, Background Documentation and Design Guidelines; ECCS: Brussels, Belgium, 2006; 259p. [Google Scholar]
- Tankova, T.; Marques, L.; Andrade, A.; da Silva, L.S. A consistent methodology for the out-of-plane buckling resistance of prismatic steel beamcolumns. J. Constr. Steel Res. 2017, 128, 839–852. [Google Scholar] [CrossRef]
- Tankova, T.; Marques, L.; Andrade, A.; da Silva, L.S. Proposal of an Ayrton-Perry design methodology for the verification of flexural and lateral-torsional buckling of prismatic beam columns. In Proceedings of the 8th International Conference on Advances in Steel Structures, Lisbon, Portugal, 21–24 July 2015. [Google Scholar]
- Szalai, J.; Papp, F. On the theoretical background of the generalization of Ayrton-Perry type resistance formulas. J. Constr. Steel Res. 2010, 66, 670–679. [Google Scholar] [CrossRef]
- Boissonnade, N.; Hayeck, M.; Saloumy, E.; Nseir, J. An Overall Interaction Concept for an alternative approach to steel members design. J. Constr. Steel Res. 2017, 135, 199–212. [Google Scholar] [CrossRef]
- Schafer, B.W. Advances in the direct strength method of thin-walled steel design. In Proceedings of the Eighth International Conference on Thin-Walled Structures (ICTWS), Lisbon, Portugal, 24–27 July 2018. [Google Scholar]
- Arrayago, I.; Real, E.; Mirambell, E.; Gardner, L. The Continuous Strength Method for the design of stainless steel hollow section columns. Thin-Walled Struct. 2020, 154, 106825. [Google Scholar] [CrossRef]
- EN 1993-1-1. Eurocode 3: Design of Steel Structures, Part 1—1: General Rules and Rules for Buildings; CEN: Brussels, Belgium, 2005.
- Chladný, E.; Štujberová, M. Frames with unique global and local imperfection in the shape of the elastic buckling mode (Part 1). Stahlbau 2013, 83. [Google Scholar] [CrossRef]
- Chladný, E.; Štujberová, M. Frames with unique global and local imperfection in the shape of the elastic buckling mode (Part 2). Stahlbau 2013, 83. [Google Scholar] [CrossRef]
- Odrobiňák, J.; Farbák, M.; Chromčák, J.; Kortiš, J.; Gocál, J. Real Geometrical Imperfection of Bow-String Arches—Measurement and Global Analysis. Appl. Sci. 2020, 10, 4530. [Google Scholar] [CrossRef]
- EN 1999-1-1, 2007 + A1 + A2, Eurocode 9, Design of Aluminium Structures, Part 1—1, General Structural Rules; CEN: Brussels, Belgium, 2009.
- Höglund, T. A unified method for the design of steel beam-columns. Background document to Amendment to EN 1993-1-3. Steel Constr. Des. Res. 2014, 7, 230–245. [Google Scholar] [CrossRef]
- Gago, F.; Mužík, J.; Bulko, R. The slope stability solution using meshless local petrov-galerkin method. Transp. Res. Procedia 2019, 40, 686–693. [Google Scholar] [CrossRef]
- Moravčík, M.; Kotula, P.; Bahleda, F. Experimental and FEM analysis of hybrid composite structures with GFRP elements. Procedia Eng. 2012, 40, 268–273. [Google Scholar] [CrossRef] [Green Version]
- Gocál, J.; Odrobiňák, J. On the influence of Corrosion on the load-carrying capacity of Old Riveted Bridges. Materials 2020, 13, 717. [Google Scholar] [CrossRef] [PubMed] [Green Version]
- Koteš, P. Influence of Corrosion on Crack Width and Pattern in an RC Beam. Procedia Eng. 2013, 65, 311–320. [Google Scholar] [CrossRef] [Green Version]
- ANSYS, Inc. Release 17.2. Documentation for ANSYS; SAS IP, Inc.: Cannonsburg, PA, USA, 2016. [Google Scholar]
- Boissonnade, N.; Somja, H. Influence of imperfections in FEM modeling of lateral-torsional buckling. In Proceedings of the Annual Stability Conference; Structural Stability Research Council, Houston, TX, USA, 18–21 April 2012. [Google Scholar]
- Badari, B.; Papp, F. On Design Method of Lateral-torsional Buckling of Beams: State of the Art and a New Proposal for a General Type Design Method. Proc. Period. Polytech. Civ. Eng. 2015, 59. [Google Scholar] [CrossRef] [Green Version]
- Gardner, L.; Boissonnade, N.; Yun, X. Ultimate capacity of I—sections under combined loading—Part 1: Experiments and FE model validation. J. Constr. Steel Res. 2018. [Google Scholar] [CrossRef]
- Kaim, P. Spatial Buckling Behaviour of Steel Members under Bending and Compression. Ph.D. Thesis, Graz University of Technology, Grax, Austria, 2004. [Google Scholar]
- EN 1993-1-5:2006, Eurocode 3: Design of Steel Structures—Part 1.5: Plated Structural Elements; CEN—European Committee for Standardization: Brussels, Belgium, 2006.
- Valeš, J. Sensitivity Analysis of Stability Problems of Steel Structures. Ph.D. Thesis, Brno University of Technology, Brno, Czech Republic, 2017. [Google Scholar]
- Jönsson, J.; Müller, M.S.; Gamst, C.; Valeš, J.; Kala, Z. Investigation of European flexural and lateral torsional buckling interaction. J. Constr. Steel Res. 2019, 156, 105–121. [Google Scholar] [CrossRef]
- Valeš, J. Sensitivity Analysis of Static resistance of Slender Beam under Bending. AIP Conf. Proc. 2016, 1738, 380008-1–380008-4. [Google Scholar]
- Galambos, T.V.; Van Kuren, R.C. Beam-Column Experiments. Proc. ASCE, 1964, Vol. 90 (ST2), (64–23); Lehigh University: Betlehem, PA, USA, 1964; p. 1342. Available online: http://preserve.lehigh.edu/engr-civil-environmental-fritz-lab-reports/1342 (accessed on 29 March 2021).
- Kucukler, M.; Gardner, L.; Macorini, L. Flexural-torsional buckling assessment of steel beam-columns through a stiffness reduction method. Eng. Struct. 2015, 101, 662–676. [Google Scholar] [CrossRef] [Green Version]
- Beyer, A.; Boissonnade, N.; Abdelouahab, K.; Boissonnade, N. Influence of geometric member imperfection on the ultimate resistance of U-shaped members. In Proceedings of the 7th International Conference on Coupled Instabilities in Metal Structures, Baltimore, MD, USA, 7–8 November 2016. [Google Scholar]
- Rebelo, C.; Lopes, N.; Da Silva, L.S.; Nethercot, D.; Real, P.V. Statistical evaluation of the lateral-torsional buckling resistance of steel Ibeams, Part 1: Variability of the Eurocode 3 resistance model. J. Constr. Steel Res. 2009, 65, 818–831. [Google Scholar] [CrossRef]
- Knobloch, M.; Bureau, A.; Kuhlmann, U.; da Silva, L.S.; Snijder, H.H.; Taras, A.; Bours, A.-L.; Jorg, F. Structural member stability verification in the new Part 1-1 of the second generation of Eurocode 3. Steel Constr. 2020, 13. [Google Scholar] [CrossRef]
- Ofner, R. Traglasten Von Stäben aus Stahl bei Druck und Bieging. Ph.D. Thesis, Institut fr Stahlbau, Holzbau und Fläschenwerke, TU Graz, Graz, Austria, 1997. [Google Scholar]
Figure 1.
Definition of the internal forces and cross-sectional axes of the members.

Figure 2.
Load cases investigated in the numerical analysis.

Figure 3.
Material overlap using Shell elements.

Figure 4.
Initial geometrical imperfection.

Figure 5.
Distribution of residual stresses for hot rolled I and H profiles.

Figure 6.
Load cases investigated by Kuren and Galambos; simply supported beam-column with unequal end moments (a); pinned-fixed beam-column (b); simply supported beam-column with equal end moments (c); simply supported beam-column with linear bending moment distribution (d); centrically loaded beam-column (e).

Figure 7.
Lateral restraints of beam-columns.

Figure 8.
Interaction curves for laterally restrained beam-columns with IPE 100 cross-section.

Figure 9.
Interaction curves for laterally restrained beam-columns with IPE 100 cross-section.

Figure 10.
Interaction curves for laterally restrained beam-columns with IPE 100 cross-section.

Figure 11.
Interaction curves for laterally restrained beam-columns with IPE 100 cross-section.

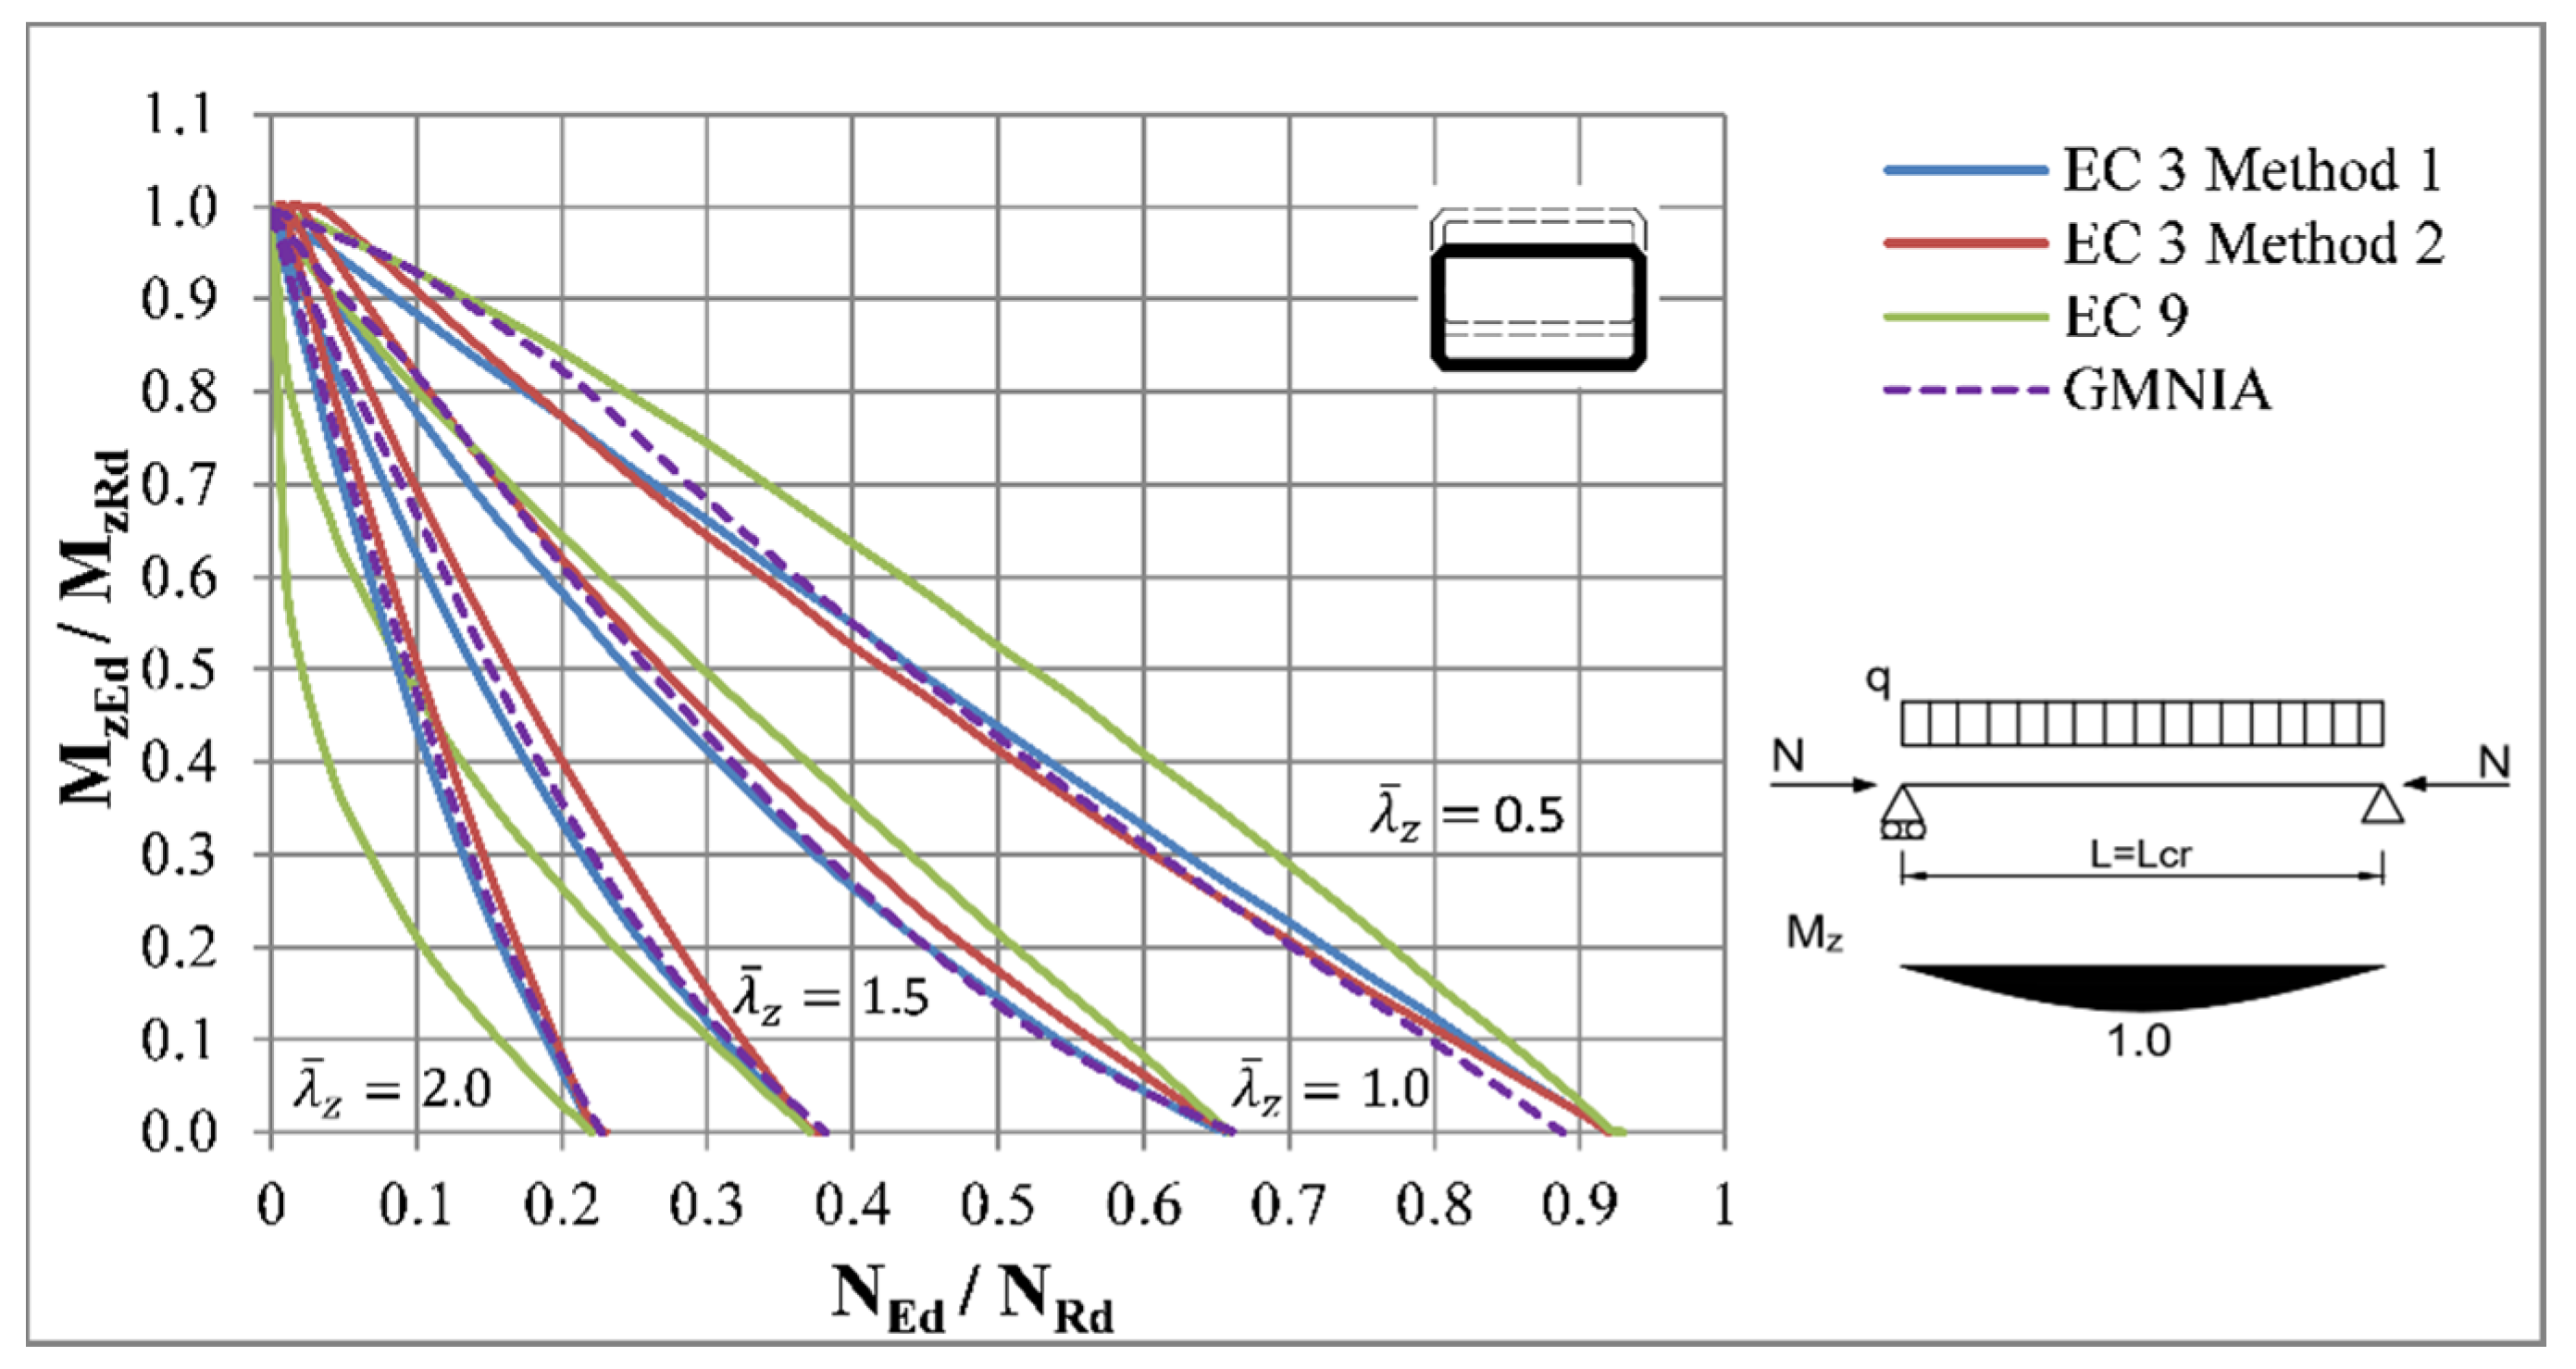
Figure 12.
Interaction curves for laterally restrained beam-columns with IPE 100 cross-section. Nomenclature: —slenderness ratio for the appropriate buckling axis, NRd, My,Rd, Mz,Rd—design values of compression and plastic bending moment resistances, NEd, My,Ed, Mz,Ed—design values of axial compressive force and bending moments.

Figure 13.
Detail of the web stiffener.

Figure 14.
Interaction curves for laterally unrestrained beam-columns with IPE 100 cross-section with restrained warping.
Figure 14.
Interaction curves for laterally unrestrained beam-columns with IPE 100 cross-section with restrained warping.

Figure 15.
Interaction curves for laterally unrestrained beam-columns with IPE 100 cross-section with restrained warping.
Figure 15.
Interaction curves for laterally unrestrained beam-columns with IPE 100 cross-section with restrained warping.

Figure 16.
Interaction curves for laterally unrestrained beam-columns with IPE 100 cross-section with restrained warping.
Figure 16.
Interaction curves for laterally unrestrained beam-columns with IPE 100 cross-section with restrained warping.

Figure 17.
Interaction curves for laterally unrestrained beam-columns with IPE 100 cross-section with restrained warping.
Figure 17.
Interaction curves for laterally unrestrained beam-columns with IPE 100 cross-section with restrained warping.

Figure 18.
Interaction curves for laterally unrestrained beam-columns with IPE 100 cross-section with restrained warping.
Figure 18.
Interaction curves for laterally unrestrained beam-columns with IPE 100 cross-section with restrained warping.

Figure 19.
The deformation of the beam-column without warping restraints at failure (scale factor = 12).
Figure 19.
The deformation of the beam-column without warping restraints at failure (scale factor = 12).

Figure 20.
Modelling technique of boundary conditions.

Figure 21.
Interaction curves for laterally unrestrained beam-columns with IPE 100 cross-section with free warping.
Figure 21.
Interaction curves for laterally unrestrained beam-columns with IPE 100 cross-section with free warping.

Figure 22.
Interaction curves for laterally unrestrained beam-columns with IPE 100 cross-section with free warping.
Figure 22.
Interaction curves for laterally unrestrained beam-columns with IPE 100 cross-section with free warping.

Figure 23.
Interaction curves for laterally unrestrained beam-columns with IPE 100 cross-section with free warping.
Figure 23.
Interaction curves for laterally unrestrained beam-columns with IPE 100 cross-section with free warping.

Figure 24.
Interaction curves for laterally unrestrained beam-columns with IPE 100 cross-section with free warping.
Figure 24.
Interaction curves for laterally unrestrained beam-columns with IPE 100 cross-section with free warping.

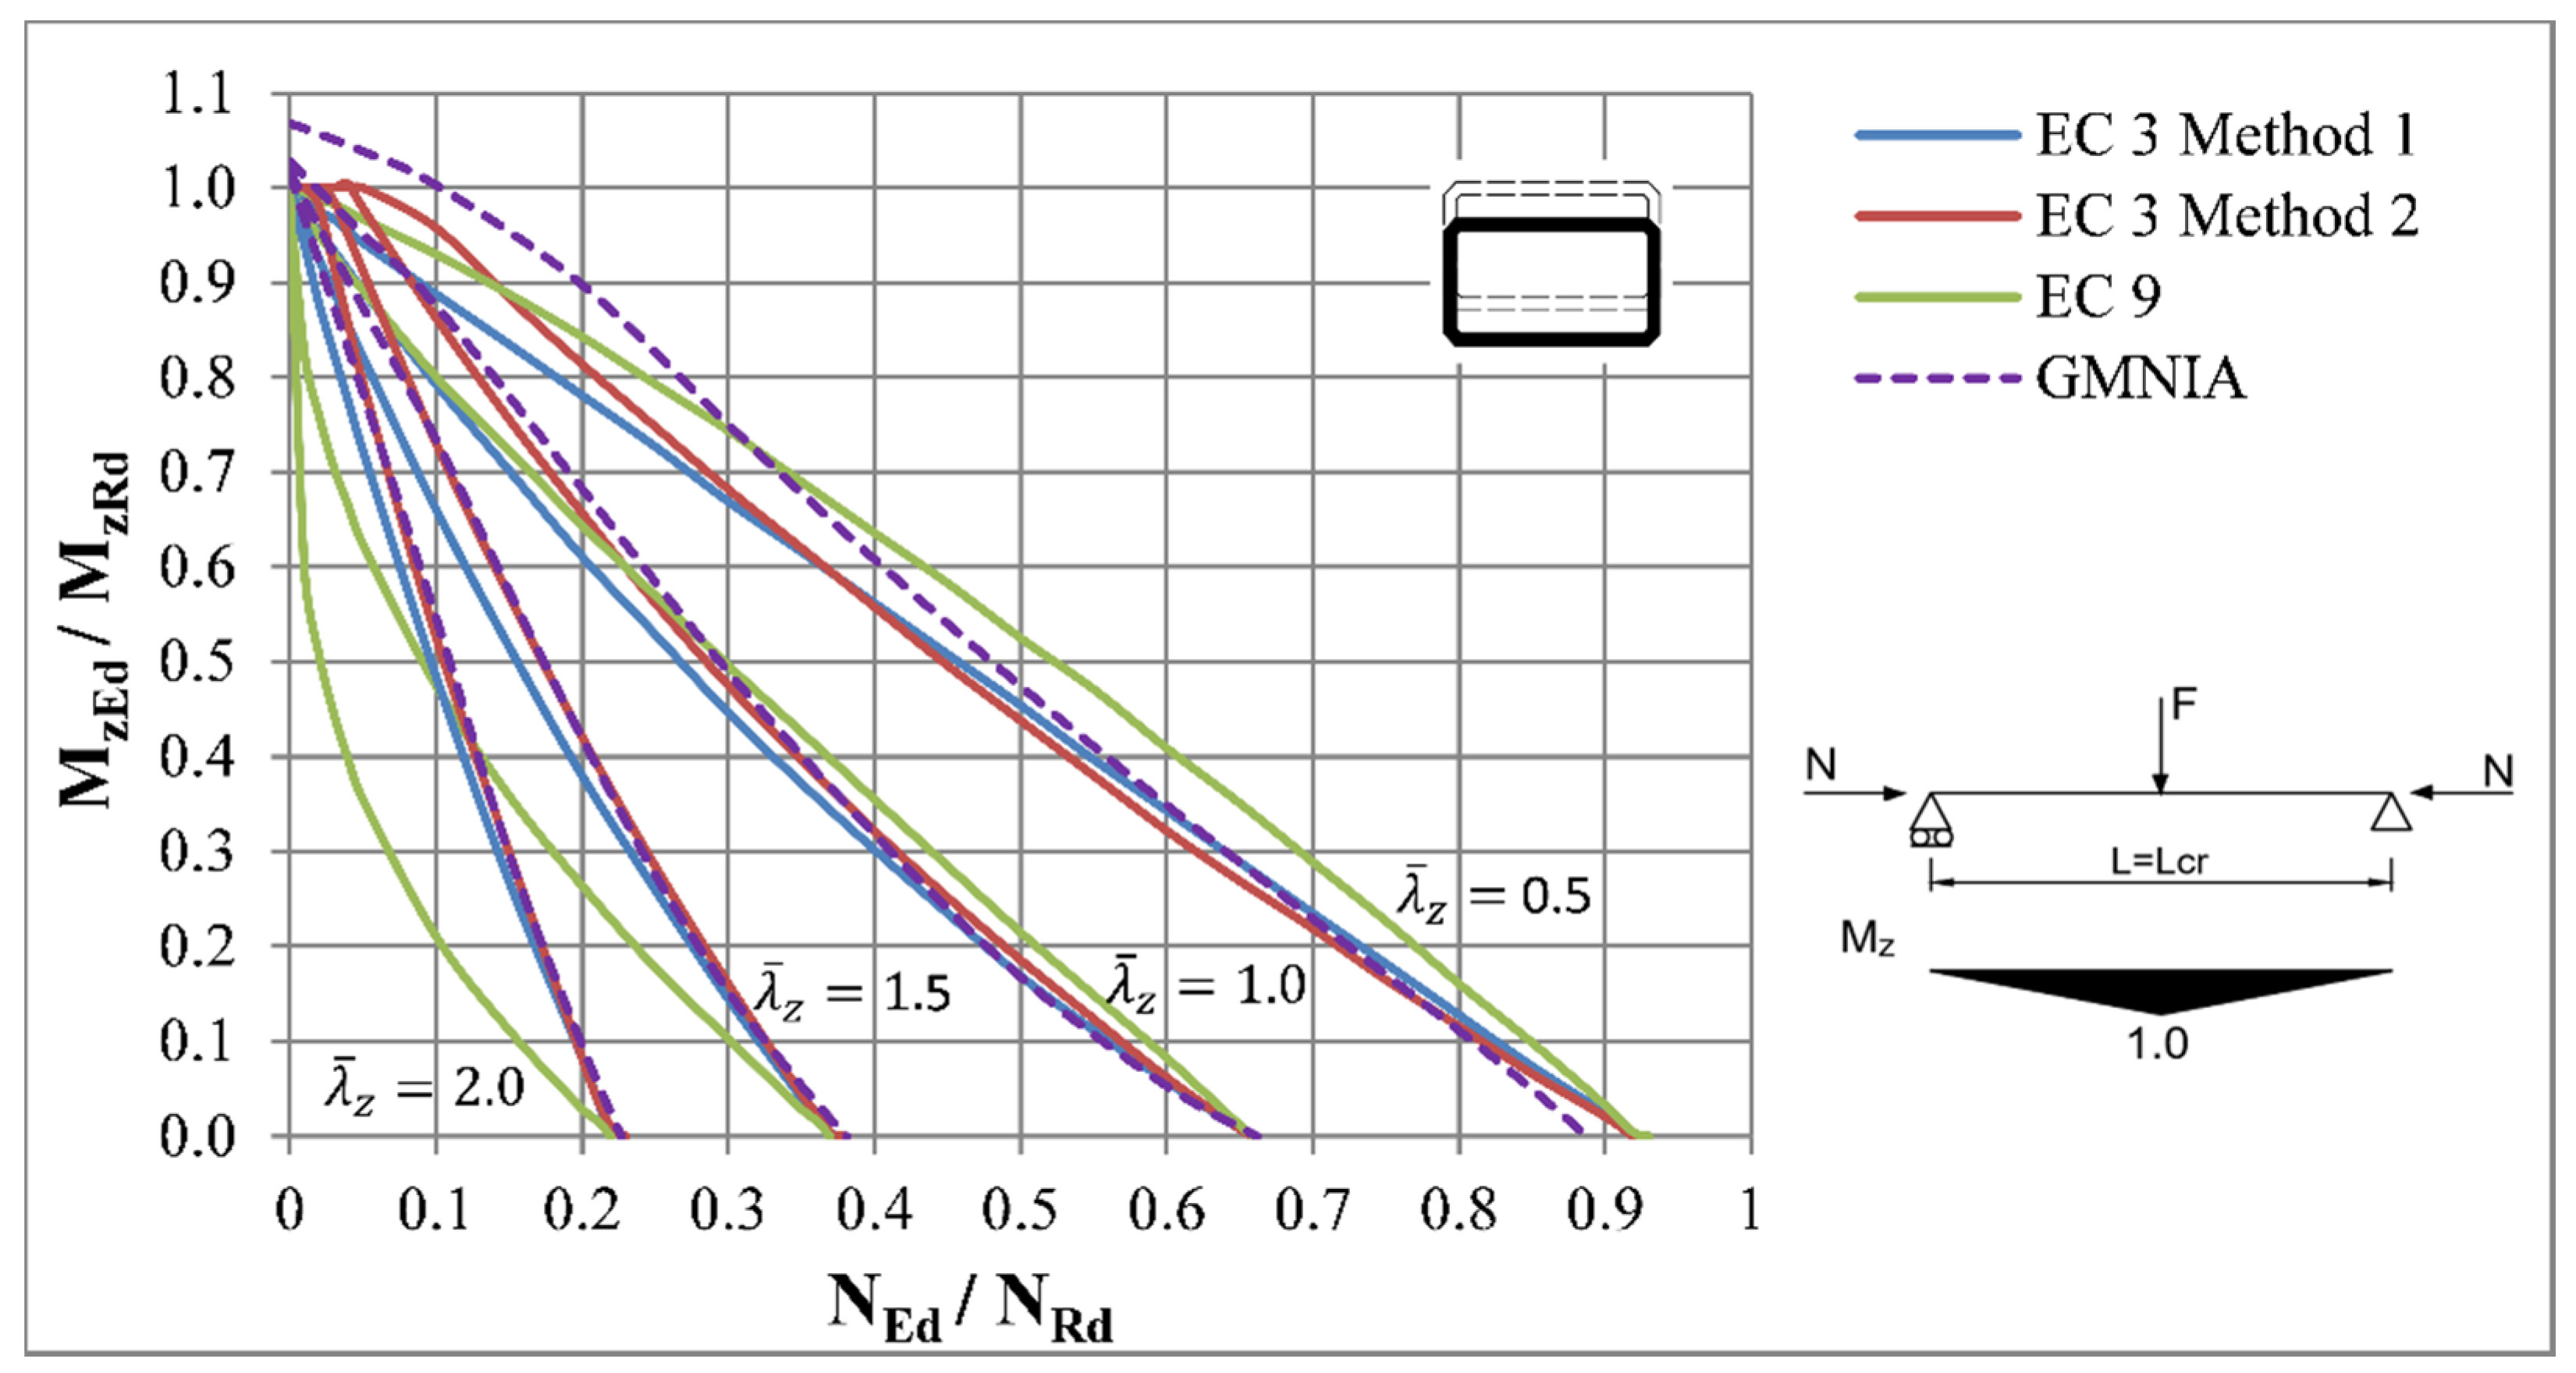
Figure 25.
Interaction curves for laterally unrestrained beam-columns with IPE 100 cross-section with free warping.
Figure 25.
Interaction curves for laterally unrestrained beam-columns with IPE 100 cross-section with free warping.

Figure 26.
Interaction curves for weak axis flexural buckling of beam-columns with IPE 100 cross-section.
Figure 26.
Interaction curves for weak axis flexural buckling of beam-columns with IPE 100 cross-section.

Figure 27.
Interaction curves for weak axis flexural buckling of beam-columns with IPE 100 cross-section.
Figure 27.
Interaction curves for weak axis flexural buckling of beam-columns with IPE 100 cross-section.

Figure 28.
Interaction curves for weak axis flexural buckling of beam-columns with IPE 100 cross-section.
Figure 28.
Interaction curves for weak axis flexural buckling of beam-columns with IPE 100 cross-section.

Figure 29.
Interaction curves for weak axis flexural buckling of beam-columns with IPE 100 cross-section.
Figure 29.
Interaction curves for weak axis flexural buckling of beam-columns with IPE 100 cross-section.

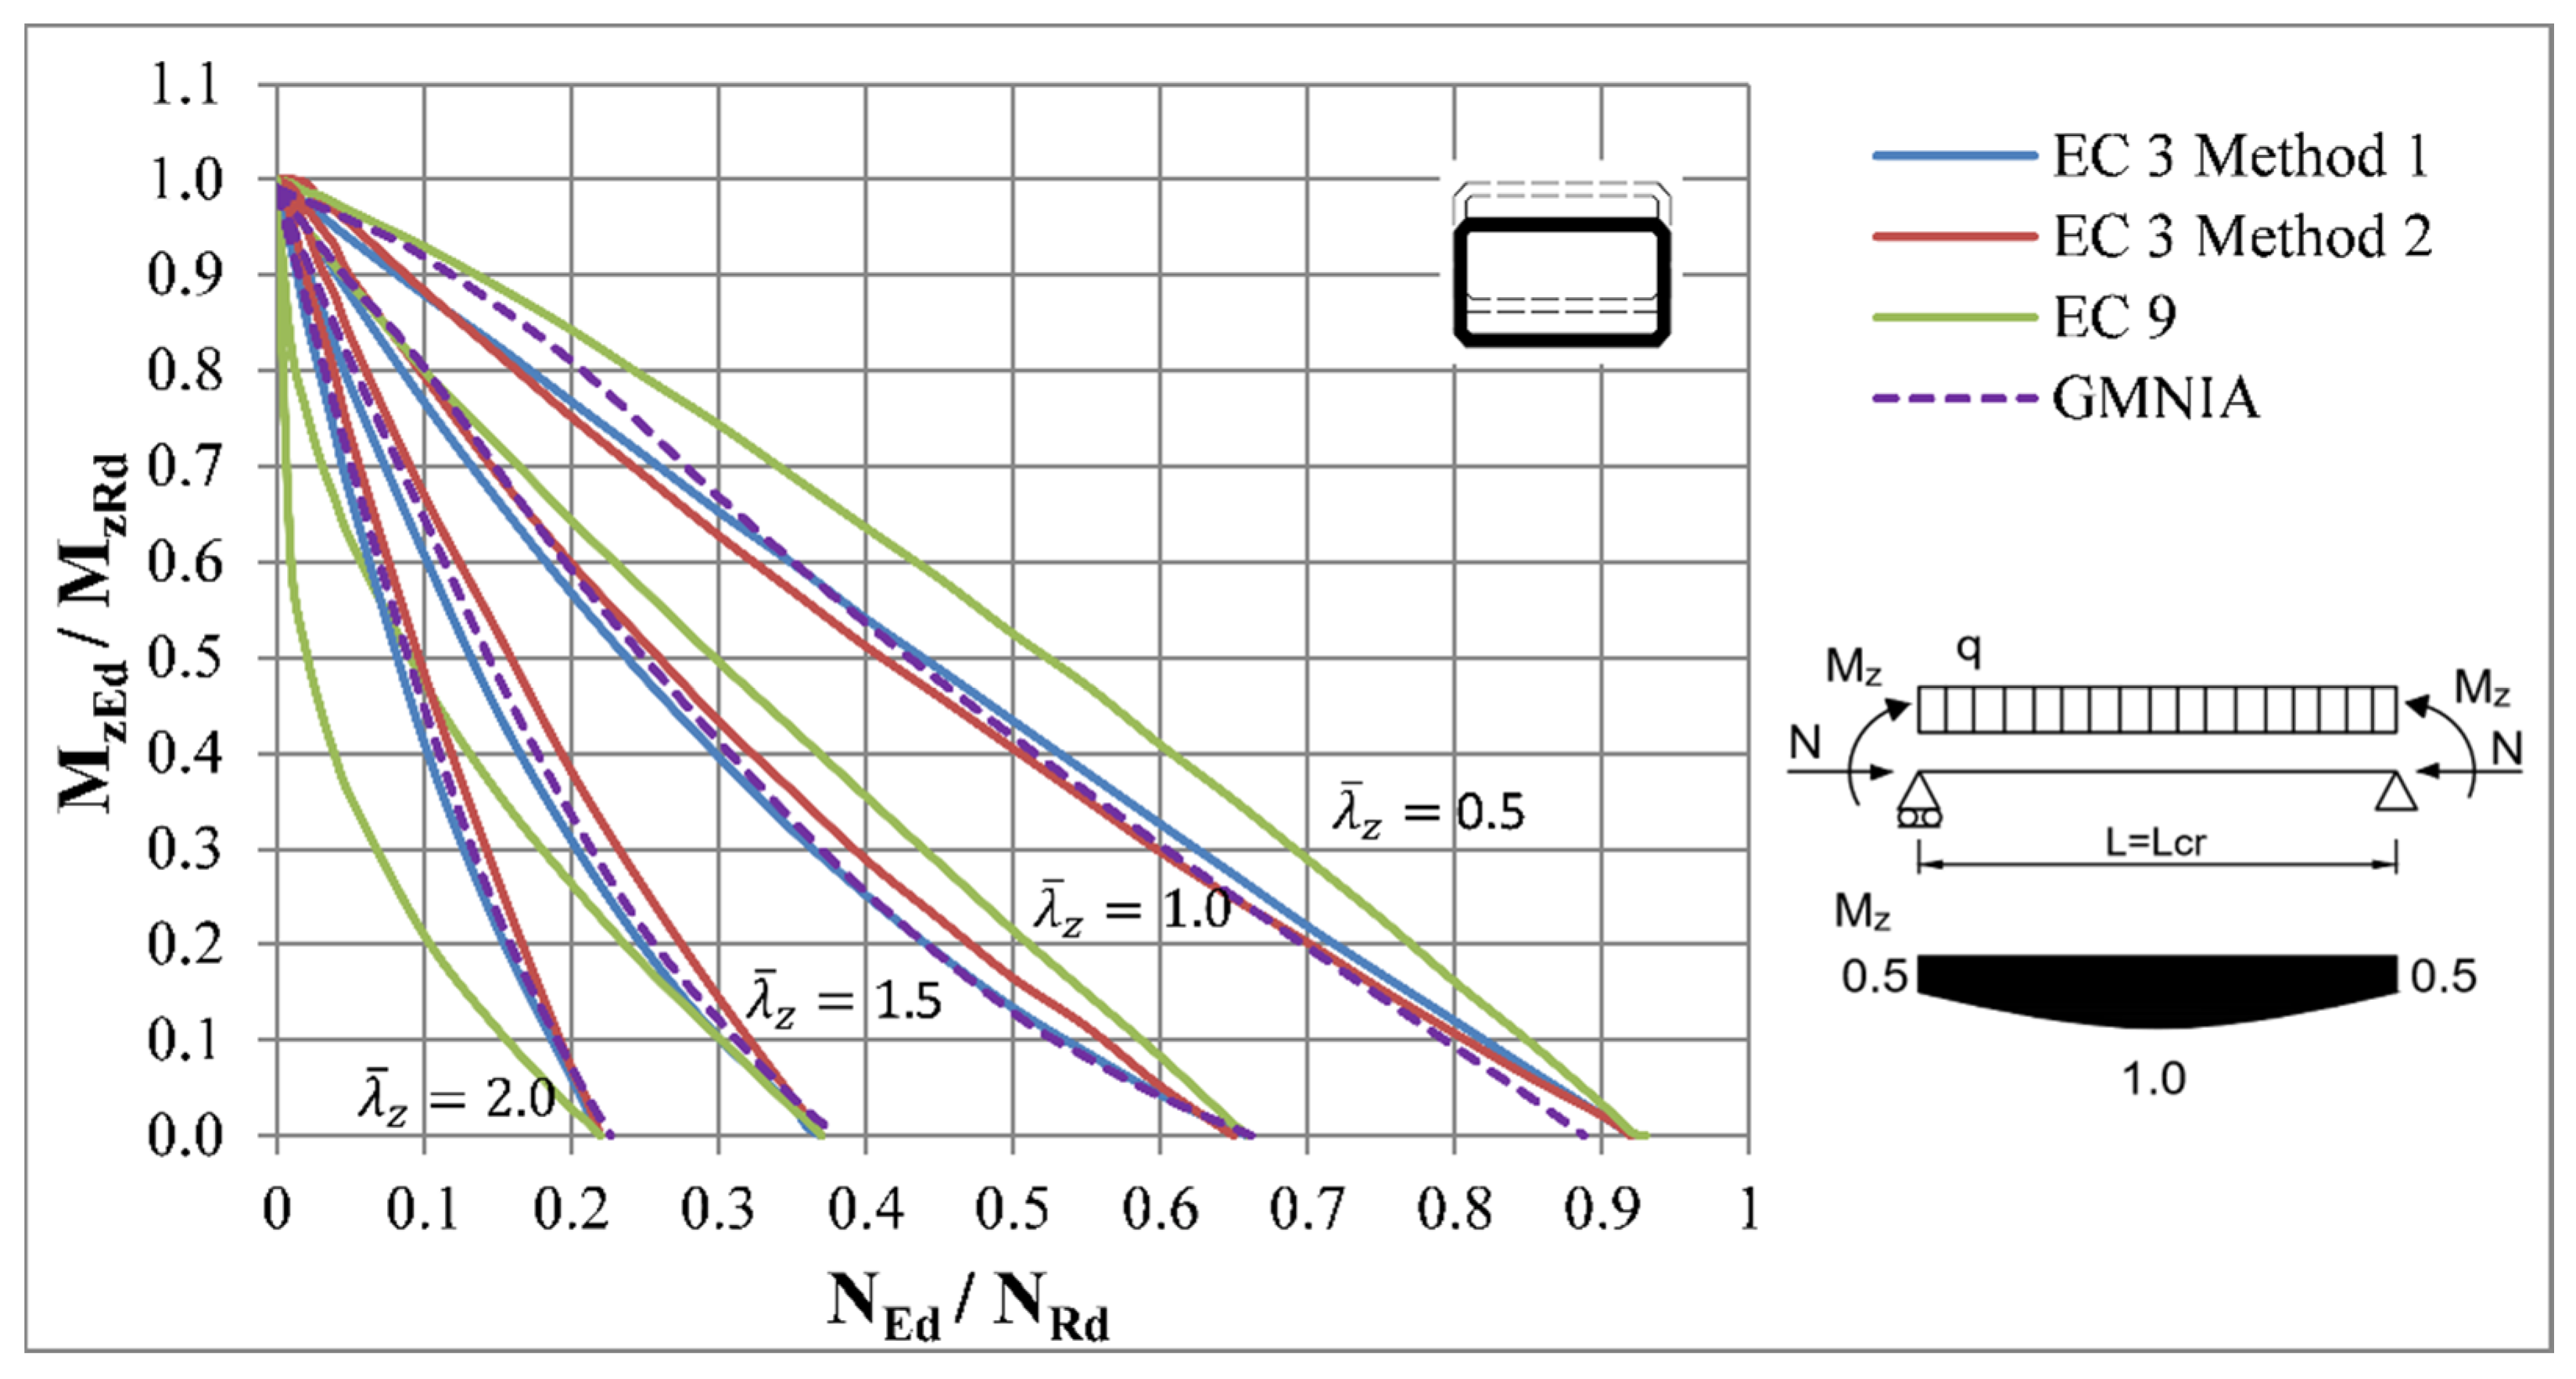
Figure 30.
Interaction curves for weak axis flexural buckling of beam-columns with IPE 100 cross-section.
Figure 30.
Interaction curves for weak axis flexural buckling of beam-columns with IPE 100 cross-section.

Figure 31.
The distribution of residual stresses for members with RHS cross-section, fy = 235 MPa.

Figure 32.
Lateral restraints of beam-columns with RHS cross-section.

Figure 33.
Interaction curves for laterally restrained beam-columns with RHS cross-section.

Figure 34.
Interaction curves for laterally restrained beam-columns with RHS cross-section.

Figure 35.
Interaction curves for laterally restrained beam-columns with RHS cross-section.

Figure 36.
Interaction curves for laterally restrained beam-columns with RHS cross-section.

Figure 37.
Interaction curves for laterally restrained beam-columns with RHS cross-section.

Figure 38.
Interaction curves for beam-columns with RHS cross-section without lateral restraints.

Figure 39.
Interaction curves for beam-columns with RHS cross-section without lateral restraints.

Figure 40.
Interaction curves for beam-columns with RHS cross-section without lateral restraints.

Figure 41.
Interaction curves for beam-columns with RHS cross-section without lateral restraints.

Figure 42.
Interaction curves for beam-columns with RHS cross-section without lateral restraints.

Figure 43.
Interaction curves for weak axis flexural buckling of beam-columns with RHS cross-section.
Figure 43.
Interaction curves for weak axis flexural buckling of beam-columns with RHS cross-section.

Figure 44.
Interaction curves for weak axis flexural buckling of beam-columns with RHS cross-section.
Figure 44.
Interaction curves for weak axis flexural buckling of beam-columns with RHS cross-section.

Figure 45.
Interaction curves for weak axis flexural buckling of beam-columns with RHS cross-section.
Figure 45.
Interaction curves for weak axis flexural buckling of beam-columns with RHS cross-section.

Figure 46.
Interaction curves for weak axis flexural buckling of beam-columns with RHS cross-section.
Figure 46.
Interaction curves for weak axis flexural buckling of beam-columns with RHS cross-section.

Figure 47.
Interaction curves for weak axis flexural buckling of beam-columns with RHS cross-section.
Figure 47.
Interaction curves for weak axis flexural buckling of beam-columns with RHS cross-section.

Figure 48.
Influence of the exponents on the shape of the interaction curves.


Table 1.
Comparison of ultimate resistance of beam-columns determined by numerical and experimental analysis.
Table 1.
Comparison of ultimate resistance of beam-columns determined by numerical and experimental analysis.
| Specimen | Section | Load Case | Ned,exp/Npl | Ned,FEM/Npl | Mult,exp/Mpl | Mult,FEM/Mpl | ζ | |
|---|---|---|---|---|---|---|---|---|
| T1 | 8 WF 31 | d | 0.4 | 0.130 | 0.130 | 1.03 | 1.01 | 0.98 |
| T2 | 8 WF 40 | d | 0.23 | 0.148 | 0.148 | 1.13 | 1.03 | 0.91 |
| T3 | 8 WF 31 | b | 0.45 | 0.496 | 0.496 | 0.59 | 0.58 | 0.98 |
| T8 * | 8 WF 31 | c | 0.63 | 0.588 | 0.665 | 0.16 | 0.16 | 1.13 |
| T11 * | 8 WF 31 | e | 0.64 | 0.862 | 0.836 | - | - | 0.97 |
| T12 | 8 WF 31 | c | 0.64 | 0.122 | 0.122 | 0.76 | 0.79 | 1.04 |
| T13 | 8 WF 31 | d | 0.63 | 0.122 | 0.122 | 1.02 | 0.97 | 0.95 |
| T14 | 8 WF 31 | a | 0.64 | 0.230 | 0.230 | 0.88 | 0.93 | 1.06 |
| T16 | 8 WF 31 | c | 0.48 | 0.123 | 0.123 | 0.75 | 0.85 | 1.13 |
| T18 * | 8 WF 31 | e | 0.32 | 0.882 | 0.933 | - | - | 1.06 |
| T19 | 8 WF 31 | c | 0.32 | 0.121 | 0.121 | 0.78 | 0.88 | 1.13 |
| T23 | 4 WF 13 | d | 0.96 | 0.114 | 0.114 | 0.93 | 0.93 | 1.00 |
| T25z * | 8 WF 31 | e | 0.88 | 0.696 | 0.631 | - | - | 0.91 |
| T26 | 4 WF 13 | c | 0.96 | 0.122 | 0.122 | 0.72 | 0.76 | 1.05 |
| T27z | 8 WF 31 | c | 0.825 | 0.503 | 0.503 | 0.21 | 0.20 | 0.94 |
| T32 | 4 WF 13 | c | 1.29 | 0.122 | 0.122 | 0.64 | 0.63 | 0.98 |
| = | 1.01 | |||||||
| σ = | 0.073 | |||||||
| ζmax = | 1.13 | |||||||
| ζmin = | 0.91 |
* Nomenclature: —slenderness ratio of the appropriate buckling axis, Npl, Mpl—the cross-section resistance in compression/bending, Ned,exp, Mult,exp—the ultimate resistances in compression/bending acquired by the experiment, Ned,FEM, Mult,FEM—the ultimate resistances in compression/bending acquired by the numerical analysis, ζ—the ratio of the experimentally acquired ultimate compression/bending resistances to the resistance obtained by numerical analysis.
Publisher’s Note: MDPI stays neutral with regard to jurisdictional claims in published maps and institutional affiliations. |
© 2021 by the authors. Licensee MDPI, Basel, Switzerland. This article is an open access article distributed under the terms and conditions of the Creative Commons Attribution (CC BY) license (http://creativecommons.org/licenses/by/4.0/).
Share and Cite
MDPI and ACS Style
Prokop, J.; Vičan, J.; Jošt, J. Numerical Analysis of the Beam-Column Resistance Compared to Methods by European Standards. Appl. Sci. 2021, 11, 3269. https://0-doi-org.brum.beds.ac.uk/10.3390/app11073269
AMA Style
Prokop J, Vičan J, Jošt J. Numerical Analysis of the Beam-Column Resistance Compared to Methods by European Standards. Applied Sciences. 2021; 11(7):3269. https://0-doi-org.brum.beds.ac.uk/10.3390/app11073269
Chicago/Turabian StyleProkop, Jozef, Josef Vičan, and Jozef Jošt. 2021. "Numerical Analysis of the Beam-Column Resistance Compared to Methods by European Standards" Applied Sciences 11, no. 7: 3269. https://0-doi-org.brum.beds.ac.uk/10.3390/app11073269
Note that from the first issue of 2016, this journal uses article numbers instead of page numbers. See further details here.