
Machine Learning and Feature Selection Methods for EGFR Mutation Status Prediction in Lung Cancer

 ,
,  , , , , , , and
Abstract
:1. Introduction
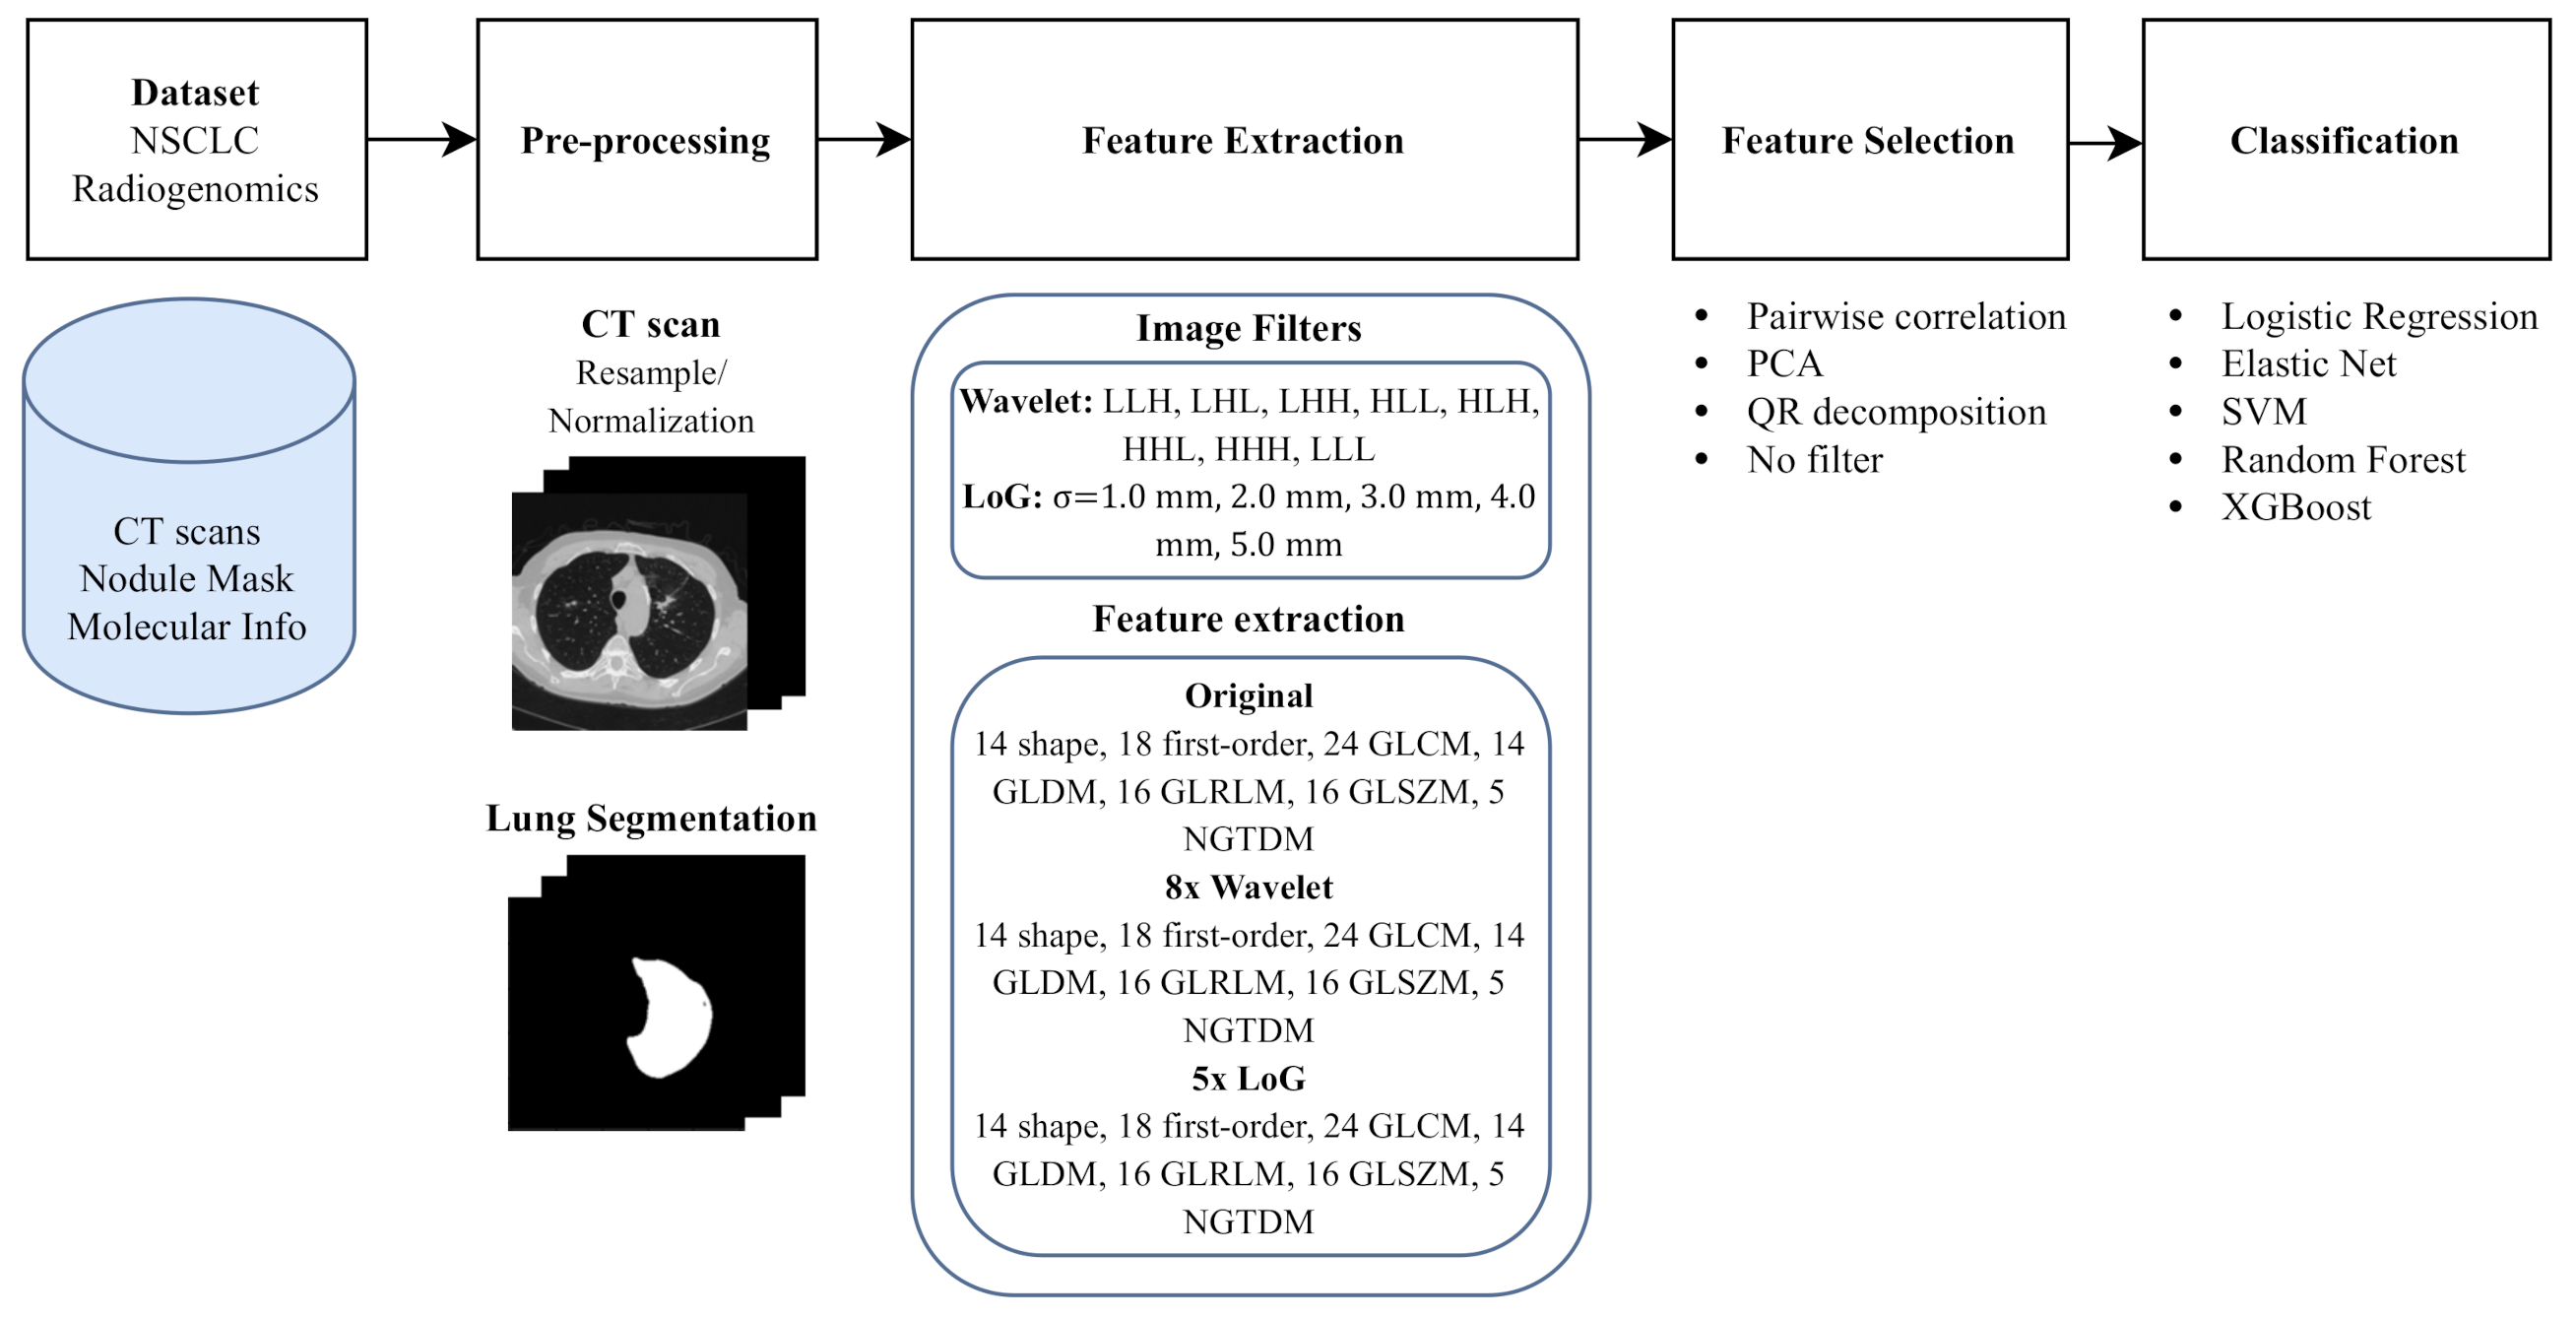
2. Materials and Methods
2.1. Dataset
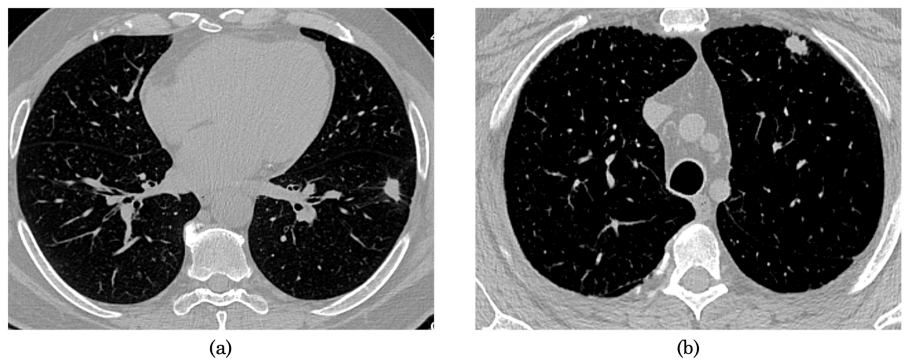
2.2. Pre-Processing
2.3. Feature Extraction
2.4. Feature Selection Methods
2.5. Learning Models
2.6. Training
2.7. Performance Metrics
3. Results
4. Discussion
5. Conclusions
Supplementary Materials
Author Contributions
Funding
Institutional Review Board Statement
Informed Consent Statement
Data Availability Statement
Conflicts of Interest
References
- Ferlay, J.; Soerjomataram, I.; Dikshit, R.; Eser, S.; Mathers, C.; Rebelo, M.; Parkin, D.M.; Forman, D.; Bray, F. Cancer incidence and mortality worldwide: Sources, methods and major patterns in GLOBOCAN 2012. Int. J. Cancer 2015, 136, E359–E386. [Google Scholar] [CrossRef]
- Janssen-Heijnen, M.L.; Coebergh, J.W.W. Trends in incidence and prognosis of the histological subtypes of lung cancer in North America, Australia, New Zealand and Europe. Lung Cancer 2001, 31, 123–137. [Google Scholar] [CrossRef] [Green Version]
- Molina, J.R.; Yang, P.; Cassivi, S.D.; Schild, S.E.; Adjei, A.A. Non-small cell lung cancer: Epidemiology, risk factors, treatment, and survivorship. In Mayo Clinic Proceedings; Elsevier: Amsterdam, The Netherlands, 2008; Volume 83, pp. 584–594. [Google Scholar]
- Pinheiro, G.; Pereira, T.; Dias, C.; Freitas, C.; Hespanhol, V.; Costa, J.L.; Cunha, A.; Oliveira, H.P. Identifying relationships between imaging phenotypes and lung cancer-related mutation status: EGFR and KRAS. Sci. Rep. 2020, 10, 1–9. [Google Scholar] [CrossRef] [PubMed]
- Gevaert, O.; Echegaray, S.; Khuong, A.; Hoang, C.D.; Shrager, J.B.; Jensen, K.C.; Berry, G.J.; Guo, H.H.; Lau, C.; Plevritis, S.K.; et al. Predictive radiogenomics modeling of EGFR mutation status in lung cancer. Sci. Rep. 2017, 7, 1–8. [Google Scholar] [CrossRef] [PubMed]
- Purba, E.R.; Saita, E.i.; Maruyama, I.N. Activation of the EGF receptor by ligand binding and oncogenic mutations: The “rotation model”. Cells 2017, 6, 13. [Google Scholar] [CrossRef] [Green Version]
- Jiang, W.; Cai, G.; Hu, P.C.; Wang, Y. Personalized medicine in non-small cell lung cancer: A review from a pharmacogenomics perspective. Acta Pharm. Sin. B 2018, 8, 530–538. [Google Scholar] [CrossRef]
- Wang, Y.; Liu, S.; Wang, Z.; Fan, Y.; Huang, J.; Huang, L.; Li, Z.; Li, X.; Jin, M.; Yu, Q.; et al. A Machine Learning-Based Investigation of Gender-Specific Prognosis of Lung Cancers. Medicina 2021, 57, 99. [Google Scholar] [CrossRef]
- Ostridge, K.; Wilkinson, T.M. Present and future utility of computed tomography scanning in the assessment and management of COPD. Eur. Respir. J. 2016, 48, 216–228. [Google Scholar] [CrossRef]
- Wang, S.; Shi, J.; Ye, Z.; Dong, D.; Yu, D.; Zhou, M.; Liu, Y.; Gevaert, O.; Wang, K.; Zhu, Y.; et al. Predicting EGFR mutation status in lung adenocarcinoma on computed tomography image using deep learning. Eur. Respir. J. 2019, 53, 1–9. [Google Scholar] [CrossRef]
- Bodalal, Z.; Trebeschi, S.; Nguyen-Kim, T.D.L.; Schats, W.; Beets-Tan, R. Radiogenomics: Bridging imaging and genomics. Abdom. Radiol. 2019, 44, 1960–1984. [Google Scholar] [CrossRef] [Green Version]
- Digumarthy, S.R.; Padole, A.M.; Gullo, R.L.; Sequist, L.V.; Kalra, M.K. Can CT radiomic analysis in NSCLC predict histology and EGFR mutation status? Medicine 2019, 98, 1–8. [Google Scholar] [CrossRef]
- Mei, D.; Luo, Y.; Wang, Y.; Gong, J. CT texture analysis of lung adenocarcinoma: Can Radiomic features be surrogate biomarkers for EGFR mutation statuses. Cancer Imaging 2018, 18, 1–9. [Google Scholar] [CrossRef] [Green Version]
- Liu, Y.; Kim, J.; Balagurunathan, Y.; Li, Q.; Garcia, A.L.; Stringfield, O.; Ye, Z.; Gillies, R.J. Radiomic features are associated with EGFR mutation status in lung adenocarcinomas. Clin. Lung Cancer 2016, 17, 441–448. [Google Scholar] [CrossRef] [Green Version]
- Liu, Y.; Kim, J.; Qu, F.; Liu, S.; Wang, H.; Balagurunathan, Y.; Ye, Z.; Gillies, R.J. CT features associated with epidermal growth factor receptor mutation status in patients with lung adenocarcinoma. Radiology 2016, 280, 271–280. [Google Scholar] [CrossRef] [Green Version]
- Velazquez, E.R.; Parmar, C.; Liu, Y.; Coroller, T.P.; Cruz, G.; Stringfield, O.; Ye, Z.; Makrigiorgos, M.; Fennessy, F.; Mak, R.H.; et al. Somatic mutations drive distinct imaging phenotypes in lung cancer. Cancer Res. 2017, 77, 3922–3930. [Google Scholar] [CrossRef] [Green Version]
- MacMahon, H.; Naidich, D.P.; Goo, J.M.; Lee, K.S.; Leung, A.N.; Mayo, J.R.; Mehta, A.C.; Ohno, Y.; Powell, C.A.; Prokop, M.; et al. Guidelines for management of incidental pulmonary nodules detected on CT images: From the Fleischner Society 2017. Radiology 2017, 284, 228–243. [Google Scholar] [CrossRef] [Green Version]
- Martin, M.D.; Kanne, J.P.; Broderick, L.S.; Kazerooni, E.A.; Meyer, C.A. Lung-RADS: Pushing the limits. Radiographics 2017, 37, 1975–1993. [Google Scholar] [CrossRef]
- Dias, C.; Pinheiro, G.; Cunha, A.; Oliveira, H.P. Radiogenomics: Lung Cancer-Related Genes Mutation Status Prediction. In Proceedings of the Iberian Conference on Pattern Recognition and Image Analysis, Madrid, Spain, 1–4 July 2019; Springer: New York, NY, USA, 2019; pp. 335–345. [Google Scholar]
- Zhang, H.; Cai, W.; Wang, Y.; Liao, M.; Tian, S. CT and clinical characteristics that predict risk of EGFR mutation in non-small cell lung cancer: A systematic review and meta-analysis. Int. J. Clin. Oncol. 2019, 24, 649–659. [Google Scholar] [CrossRef]
- Pereira, T.; Freitas, C.; Costa, J.L.; Morgado, J.; Silva, F.; Negrão, E.; de Lima, B.F.; da Silva, M.C.; Madureira, A.J.; Ramos, I.; et al. Comprehensive Perspective for Lung Cancer Characterisation Based on AI Solutions Using CT Images. J. Clin. Med. 2021, 10, 118. [Google Scholar] [CrossRef]
- Van Griethuysen, J.J.; Fedorov, A.; Parmar, C.; Hosny, A.; Aucoin, N.; Narayan, V.; Beets-Tan, R.G.; Fillion-Robin, J.C.; Pieper, S.; Aerts, H.J. Computational radiomics system to decode the radiographic phenotype. Cancer Res. 2017, 77, e104–e107. [Google Scholar] [CrossRef] [Green Version]
- Bakr, S.; Gevaert, O.; Echegaray, S.; Ayers, K.; Zhou, M.; Shafiq, M.; Zheng, H.; Benson, J.A.; Zhang, W.; Leung, A.N.; et al. A radiogenomic dataset of non-small cell lung cancer. Sci. Data 2018, 5, 1–9. [Google Scholar] [CrossRef] [PubMed] [Green Version]
- Limkin, E.J.; Reuzé, S.; Carré, A.; Sun, R.; Schernberg, A.; Alexis, A.; Deutsch, E.; Ferté, C.; Robert, C. The complexity of tumor shape, spiculatedness, correlates with tumor radiomic shape features. Sci. Rep. 2019, 9, 1–12. [Google Scholar] [CrossRef] [PubMed] [Green Version]
- Silva, F.; Pereira, T.; Frade, J.; Mendes, J.; Freitas, C.; Hespanhol, V.; Costa, J.L.; Cunha, A.; Oliveira, H.P. The Impact of Interstitial Diseases Patterns on Lung CT Segmentation. In Proceedings of the 43rd Annual International Conference of the IEEE Engineering in Medicine and Biology Society, Guadalajara, Mexico, 31 October–4 November 2021. [Google Scholar]
- Meijer, K. Accuracy and Stability of Radiomic Features for Characterising Tumour Heterogeneity Using Multimodality Imaging: A Phantom Study. Master’s Thesis, University of Twente, Twente, The Netherlands, 2019. [Google Scholar]
- Procházka, A.; Gráfová, L.; Vyšata, O.; Caregroup, N. Three-dimensional wavelet transform in multi-dimensional biomedical volume processing. In Proceedings of the of the IASTED International Conference on Graphics and Virtual Reality, Cambridge, UK, 11–13 July 2011; Volume 263, p. 268. [Google Scholar]
- Fotin, S.V.; Reeves, A.P.; Biancardi, A.M.; Yankelevitz, D.F.; Henschke, C.I. A multiscale Laplacian of Gaussian filtering approach to automated pulmonary nodule detection from whole-lung low-dose CT scans. In Medical Imaging 2009: Computer-Aided Diagnosis; International Society for Optics and Photonics: Lake Buena Vista, FL, USA, 7–12 February 2009; Volume 7260, p. 72601Q. [Google Scholar]
- Cai, J.; Luo, J.; Wang, S.; Yang, S. Feature selection in machine learning: A new perspective. Neurocomputing 2018, 300, 70–79. [Google Scholar] [CrossRef]
- Hall, M.A. Correlation-Based Feature Selection of Discrete and Numeric Class Machine Learning. In Proceedings of the Seventeenth International Conference on Machine Learning (ICML 2000), Stanford, CA, USA, 29 June–2 July 2000; pp. 359–366. [Google Scholar]
- Wold, S.; Esbensen, K.; Geladi, P. Principal component analysis. Chemom. Intell. Lab. Syst. 1987, 2, 37–52. [Google Scholar] [CrossRef]
- Chakroborty, S.; Saha, G. Feature selection using singular value decomposition and QR factorization with column pivoting for text-independent speaker identification. Speech Commun. 2010, 52, 693–709. [Google Scholar] [CrossRef]
- Bishop, C.M. Pattern Recognition and Machine Learning; Springer: New York, NY, USA, 2006. [Google Scholar]
- Zou, H.; Hastie, T. Regularization and variable selection via the elastic net. J. R. Stat. Soc. Ser. B (Stat. Methodol.) 2005, 67, 301–320. [Google Scholar] [CrossRef] [Green Version]
- Bersimis, F.G.; Varlamis, I. Use of health-related indices and classification methods in medical data. In Classification Techniques for Medical Image Analysis and Computer Aided Diagnosis; Elsevier: Amsterdam, The Netherlands, 2019; pp. 31–66. [Google Scholar]
- Sweilam, N.H.; Tharwat, A.; Moniem, N.A. Support vector machine for diagnosis cancer disease: A comparative study. Egypt. Inform. J. 2010, 11, 81–92. [Google Scholar] [CrossRef] [Green Version]
- Wang, H.; Huang, G. Application of support vector machine in cancer diagnosis. Med. Oncol. 2011, 28, 613–618. [Google Scholar] [CrossRef]
- Cascio, D.; Taormina, V.; Cipolla, M.; Bruno, S.; Fauci, F.; Raso, G. A multi-process system for HEp-2 cells classification based on SVM. Pattern Recognit. Lett. 2016, 82, 56–63. [Google Scholar] [CrossRef]
- Cascio, D.; Taormina, V.; Raso, G. Deep convolutional neural network for HEp-2 fluorescence intensity classification. Appl. Sci. 2019, 9, 408. [Google Scholar] [CrossRef] [Green Version]
- Cascio, D.; Taormina, V.; Raso, G. Deep CNN for IIF images classification in autoimmune diagnostics. Appl. Sci. 2019, 9, 1618. [Google Scholar] [CrossRef] [Green Version]
- Konukoglu, E.; Glocker, B. Random forests in medical image computing. In Handbook of Medical Image Computing and Computer Assisted Intervention; Elsevier: Amsterdam, The Netherlands, 2020; pp. 457–480. [Google Scholar]
- Nishio, M.; Nishizawa, M.; Sugiyama, O.; Kojima, R.; Yakami, M.; Kuroda, T.; Togashi, K. Computer-aided diagnosis of lung nodule using gradient tree boosting and Bayesian optimization. PLoS ONE 2018, 13, e0195875. [Google Scholar] [CrossRef] [Green Version]
- Zhang, X.; Li, T.; Wang, J.; Li, J.; Chen, L.; Liu, C. Identification of cancer-related long non-coding RNAs using XGBoost with high accuracy. Front. Genet. 2019, 10, 735. [Google Scholar] [CrossRef] [PubMed] [Green Version]
- Xie, Y.; Meng, W.Y.; Li, R.Z.; Wang, Y.W.; Qian, X.; Chan, C.; Yu, Z.F.; Fan, X.X.; Pan, H.D.; Xie, C.; et al. Early lung cancer diagnostic biomarker discovery by machine learning methods. Transl. Oncol. 2021, 14, 100907. [Google Scholar] [CrossRef]
- Chen, T.; Guestrin, C. Xgboost: A scalable tree boosting system. In Proceedings of the 22nd ACM Sigkdd International Conference on Knowledge Discovery and Data Mining, San Francisco, CA, USA, 13–17 August 2016; pp. 785–794. [Google Scholar]
- Chawla, N.V.; Bowyer, K.W.; Hall, L.O.; Kegelmeyer, W.P. SMOTE: Synthetic minority over-sampling technique. J. Artif. Intell. Res. 2002, 16, 321–357. [Google Scholar] [CrossRef]
- Delzell, D.A.; Magnuson, S.; Peter, T.; Smith, M.; Smith, B.J. Machine learning and feature selection methods for disease classification with application to lung cancer screening image data. Front. Oncol. 2019, 9, 1393. [Google Scholar] [CrossRef] [Green Version]
- Parmar, C.; Grossmann, P.; Bussink, J.; Lambin, P.; Aerts, H.J. Machine learning methods for quantitative radiomic biomarkers. Sci. Rep. 2015, 5, 1–11. [Google Scholar] [CrossRef]
- Zhang, Y.; Oikonomou, A.; Wong, A.; Haider, M.A.; Khalvati, F. Radiomics-based prognosis analysis for non-small cell lung cancer. Sci. Rep. 2017, 7, 1–8. [Google Scholar] [CrossRef]
- Sun, T.; Wang, J.; Li, X.; Lv, P.; Liu, F.; Luo, Y.; Gao, Q.; Zhu, H.; Guo, X. Comparative evaluation of support vector machines for computer aided diagnosis of lung cancer in CT based on a multi-dimensional data set. Comput. Methods Programs Biomed. 2013, 111, 519–524. [Google Scholar] [CrossRef] [PubMed]
- El-Baz, A.; Beache, G.M.; Gimel’farb, G.; Suzuki, K.; Okada, K.; Elnakib, A.; Soliman, A.; Abdollahi, B. Computer-aided diagnosis systems for lung cancer: Challenges and methodologies. Int. J. Biomed. Imaging 2013, 2013, 1–31. [Google Scholar] [CrossRef] [Green Version]
- Clark, K.; Vendt, B.; Smith, K.; Freymann, J.; Kirby, J.; Koppel, P.; Moore, S.; Phillips, S.; Maffitt, D.; Pringle, M.; et al. The Cancer Imaging Archive (TCIA): Maintaining and operating a public information repository. J. Digit. Imaging 2013, 26, 1045–1057. [Google Scholar] [CrossRef] [Green Version]


| Feature Selection Method | Number of Removed Features | Number of Retained Features |
|---|---|---|
| Pairwise correlation filter | 1223 | 93 |
| PCA 65% | 1312 | 4 |
| PCA 70% | 1311 | 5 |
| PCA 75% | 1310 | 6 |
| PCA 80% | 1309 | 7 |
| PCA 85% | 1306 | 10 |
| PCA 90% | 1301 | 15 |
| PCA 95% | 1290 | 26 |
| QR decomposition | 988 | 328 |
| Classifier | Feature Selection | AUC | Precision | Sensitivity | Specificity |
|---|---|---|---|---|---|
| SVM (linear kernel) | PCA 70% | 0.737 ± 0.018 | 0.644 ± 0.012 | 0.615 ± 0.010 | 0.685 ± 0.095 |
| Elastic Net | PCA 70% | 0.733 ± 0.011 | 0.585 ± 0.048 | 0.611 ± 0.033 | 0.715 ± 0.013 |
| Logistic Regression | PCA 70% | 0.725 ± 0.012 | 0.682 ± 0.099 | 0.699 ± 0.039 | 0.743 ± 0.079 |
| XGBoost | PCA 70% | 0.697 ± 0.032 | 0.640 ± 0.036 | 0.632 ± 0.040 | 0.767 ± 0.017 |
| Random Forest | No filter | 0.696 ± 0.011 | 0.683 ± 0.090 | 0.688 ± 0.029 | 0.721 ± 0.012 |
| SVM (RBF kernel) | PCA 75% | 0.583 ± 0.014 | 0.601 ± 0.008 | 0.530 ± 0.017 | 0.623 ± 0.009 |
Publisher’s Note: MDPI stays neutral with regard to jurisdictional claims in published maps and institutional affiliations. |
© 2021 by the authors. Licensee MDPI, Basel, Switzerland. This article is an open access article distributed under the terms and conditions of the Creative Commons Attribution (CC BY) license (https://creativecommons.org/licenses/by/4.0/).
Share and Cite
Morgado, J.; Pereira, T.; Silva, F.; Freitas, C.; Negrão, E.; de Lima, B.F.; da Silva, M.C.; Madureira, A.J.; Ramos, I.; Hespanhol, V.; et al. Machine Learning and Feature Selection Methods for EGFR Mutation Status Prediction in Lung Cancer. Appl. Sci. 2021, 11, 3273. https://0-doi-org.brum.beds.ac.uk/10.3390/app11073273
Morgado J, Pereira T, Silva F, Freitas C, Negrão E, de Lima BF, da Silva MC, Madureira AJ, Ramos I, Hespanhol V, et al. Machine Learning and Feature Selection Methods for EGFR Mutation Status Prediction in Lung Cancer. Applied Sciences. 2021; 11(7):3273. https://0-doi-org.brum.beds.ac.uk/10.3390/app11073273
Chicago/Turabian StyleMorgado, Joana, Tania Pereira, Francisco Silva, Cláudia Freitas, Eduardo Negrão, Beatriz Flor de Lima, Miguel Correia da Silva, António J. Madureira, Isabel Ramos, Venceslau Hespanhol, and et al. 2021. "Machine Learning and Feature Selection Methods for EGFR Mutation Status Prediction in Lung Cancer" Applied Sciences 11, no. 7: 3273. https://0-doi-org.brum.beds.ac.uk/10.3390/app11073273