
Class-Imbalanced Voice Pathology Detection and Classification Using Fuzzy Cluster Oversampling Method


School of Optoelectronic Science and Engineering, Soochow University, Suzhou 215000, China
*
Authors to whom correspondence should be addressed.
Appl. Sci. 2021, 11(8), 3450; https://0-doi-org.brum.beds.ac.uk/10.3390/app11083450
Submission received: 23 March 2021
/
Revised: 8 April 2021
/
Accepted: 9 April 2021
/
Published: 12 April 2021
(This article belongs to the Section Computing and Artificial Intelligence)
Abstract
:The Massachusetts Eye and Ear Infirmary (MEEI) database is an international-standard training database for voice pathology detection (VPD) systems. However, there is a class-imbalanced distribution in normal and pathological voice samples and different types of pathological voice samples in the MEEI database. This study aimed to develop a VPD system that uses the fuzzy clustering synthetic minority oversampling technique algorithm (FC-SMOTE) to automatically detect and classify four types of pathological voices in a multi-class imbalanced database. The proposed FC-SMOTE algorithm processes the initial class-imbalanced dataset. A set of machine learning models was evaluated and validated using the resulting class-balanced dataset as an input. The effectiveness of the VPD system with FC-SMOTE was further verified by an external validation set and another pathological voice database (Saarbruecken Voice Database (SVD)). The experimental results show that, in the multi-classification of pathological voice for the class-imbalanced dataset, the method we propose can significantly improve the diagnostic accuracy. Meanwhile, FC-SMOTE outperforms the traditional imbalanced data oversampling algorithms, and it is preferred for imbalanced voice diagnosis in practical applications.
1. Introduction
Traditional pathological voice detection mainly depends on experienced clinicians or laryngoscopes to observe the vocal cord structure [1], which is subjective and invasive. In recent years, we have witnessed the success of artificial intelligence in medical applications [2,3,4]. A voice pathology detection (VPD) system based on machine learning algorithms and well-established features has become a hot topic in research. In biomedical engineering, different features are extracted from signals to build VPD systems that automatically detect pathological voices. Most of these studies have experimented with the Massachusetts Eye and Ear Infirmary (MEEI) database [5], which has become one of the standard databases for VPD systems [6]. Nevertheless, in the past studies on voice pathology detection, many researchers ignored the class-imbalanced distribution of voice samples in the MEEI database. The MEEI database contains 657 pathological voice samples but only 53 normal voice samples from healthy speakers. Thus, taking the Acc as the evaluation result of the classifier makes the pathological voice detection model’s performance better than it actually is. This is because learning with imbalanced datasets usually results in a biased classifier that obtains a higher detection accuracy in majority classes and a lower one in minority classes [7]. For example, given a dataset with 95% of the samples labelled as positive, if all negative samples are misclassified and positive samples are all classified correctly, we can obtain an Acc = 95%. However, the accuracy rate for negative samples is 0. Obviously, this is too optimistic regarding the performance of the classifier when the data are imbalanced [8,9]. In practical applications, the class-imbalanced data result from the insufficient number of samples in the pathological voice database, which also makes it difficult for the traditional VPD system to classify multiple pathological types. Given its importance, pathological voice diagnoses with imbalanced data have attracted the interest of researchers [10,11].
Due to the high class-imbalanced ratio in the MEEI database, is not suitable for researchers to use Acc as the primary model evaluation measure. Thus, it is necessary to consider imbalanced learning to model the VPD system based on the class-imbalanced pathological voice database.
1.1. Imbalanced Learning
The class-imbalanced problem is found in many real-world applications, including fraud detection [12], medical diagnosis [13,14], bioinformatics [15], and so forth. Obtaining class-balanced datasets is very difficult in medical diagnosis because it requires the expensive endoscopy (e.g., laryngoscopy) of patients and labelling with manual supervision. Classifiers trained on imbalanced datasets will reduce their robustness and generalization performance, which is also one of the main challenges of machine learning.
Existing solutions to solve class-imbalanced problems can be divided into internal methods and external methods. The internal method [16,17,18] uses a variety of cost adjustment techniques in the learning algorithm and makes full use of the initial class-imbalanced dataset during the training process. The external method [19,20,21] refers to rebalancing the external training data while keeping the learning algorithm unchanged. Current research [22] shows that external methods are more popular than other methods and are universally applied in various fields. The external method includes oversampling; undersampling; and hybrid undersampling, which combines oversampling and undersampling. The majority of classes are usually undersampled to reduce the number of samples to balance each class’s sample distribution. Minority classes are usually oversampled to generate new samples by duplicating or synthesizing the samples to decrease the classes’ imbalance ratio. The synthetic minority oversampling technique (SMOTE) [23] is one of the main oversampling methods used to handle imbalanced data. SMOTE is a method to improve Random OverSampling (ROS), reducing the risk of overfitting, but it may cause overgeneralization, is susceptible to generating noise in samples, and causes increased overlapping between different classes [24]. Due to the generation of wrong minority samples, this problem generalizes the minority class region to the majority class region. Therefore, in the current research on imbalanced learning algorithms, SMOTE has multiple variations intended to solve the original algorithm’s weaknesses. Many researchers have focused on improving the SMOTE algorithm. The variants of SMOTE that have been proposed are Borderline-SMOTE [25], adaptive synthetic sampling (ADASYN) [26], Random-SMOTE [27], among others.
The oversampling algorithm based on clustering works better for imbalanced learning with a large number of unknown samples. On the one hand, clustering algorithms are based on unsupervised learning and are vital elements of machine learning in general. On the other hand, as a soft clustering algorithm, the usefulness of the fuzzy clustering algorithm has been confirmed in existing work [28]. However, in the recent research and application of fuzzy clustering [29,30], the algorithm has mainly been used as a classification technique. Especially for the pathological voice dataset, which has fuzzy boundaries and overlaps between clusters, fuzzy clustering algorithms can be useful [31]. In imbalanced learning, the indistinct boundaries and overlaps between the clusters affect the sampling technique’s performance, resulting in the generation of noisy samples with no information value. Thus, we used this particularity of fuzzy clustering for imbalanced learning as a consolidation technique for oversampling operations. Some imbalanced learning algorithms based on clustering have been proposed in [32,33]. They can omit the steps of labelling all samples in a set and are more suitable for the imbalanced learning of unknown samples in medical diagnosis. Nonetheless, clustering-based SMOTE algorithms ignore the imbalanced distribution within the sample class [34], which may lead to the generation of non-differentiated minority samples underfitting the classifier. Furthermore, the related research [35] is mainly based on the k-means clustering algorithm, but it is limited to the k-means hard clustering principle, which is easily affected by abnormal points and is not suitable for too-discrete classification. The fuzzy clustering synthetic minority oversampling technique algorithm (FC-SMOTE) used in this paper overcomes the influence of noise points and abnormal points and the imbalanced distribution between and within classes at the same time. Finally, it is necessary to generate as many differentiated and representative minority samples as possible to improve the pathological voice classification model’s performance.
1.2. Objective
Researchers usually use the MEEI database as the standard training database for VPD systems in the research on pathological voice detection and intelligent diagnosis, but ignore the imbalance between normal and pathological classes of this database. As a model evaluation measure, Acc is not suitable for class-imbalanced data, leading to inaccurate model results. The current classification studies of pathological voices only focus on binary classification between normal and pathological voices or binary classification between one pathological voice type and other pathological voices; there are few studies on the multi-classification of pathological voices.
To tackle these issues, we propose a VPD system that combines the data oversampling-based fuzzy c-means clustering SMOTE method and machine learning models to resolve the multi-classification of pathological voices with imbalanced datasets. Mel-Frequency Cepstral Coefficients (MFCCs) are some of the most effective feature parameters in speech recognition [36,37,38] and were proposed based on the human auditory perception structure [39]. Recent studies have shown that the feature extraction of MFCCs has been widely used in VPD systems. Thus, this paper selects MFCCs as the input parameters of the model. Considering the issue of class-imbalance in the MEEI database, we conjunct the c-means clustering algorithm with SMOTE and propose a VPD system in the class-imbalanced pathological voice database called FC-SMOTE. FC-SMOTE finds safe areas where minority class samples are located by the c-means clustering algorithm and oversamples minority class samples in safe areas according to the density of the minority sample distribution. Ultimately, more samples will be generated in sparse minority areas to solve the imbalance within the class. Moreover, FC-SMOTE can detect safe oversampled areas without considering all sample class labels. In the modeling of the VPD system, a set of machine learning models are evaluated and validated using the resulting class-balanced dataset as an input. Some reasonable metrics [40] include Recall, Specificity, G value, value, and AUC/PRC as evaluation metrics for the classifier model. The FC-SMOTE algorithm is used to select minority and majority classes, and a class-balanced training dataset is constructed to train machine learning models. The results show that the VPD system with FC-SMOTE has shown good results in the detection and multi-classification of pathological voices, which helps in the pathological diagnosis of voices in practical clinical use. For the selected model evaluation measures, FC-SMOTE outperforms other traditional oversampling algorithms, which include SMOTE, Borderline-SMOTE, and ADASYN.
2. Methodology
2.1. Overview of the Framework
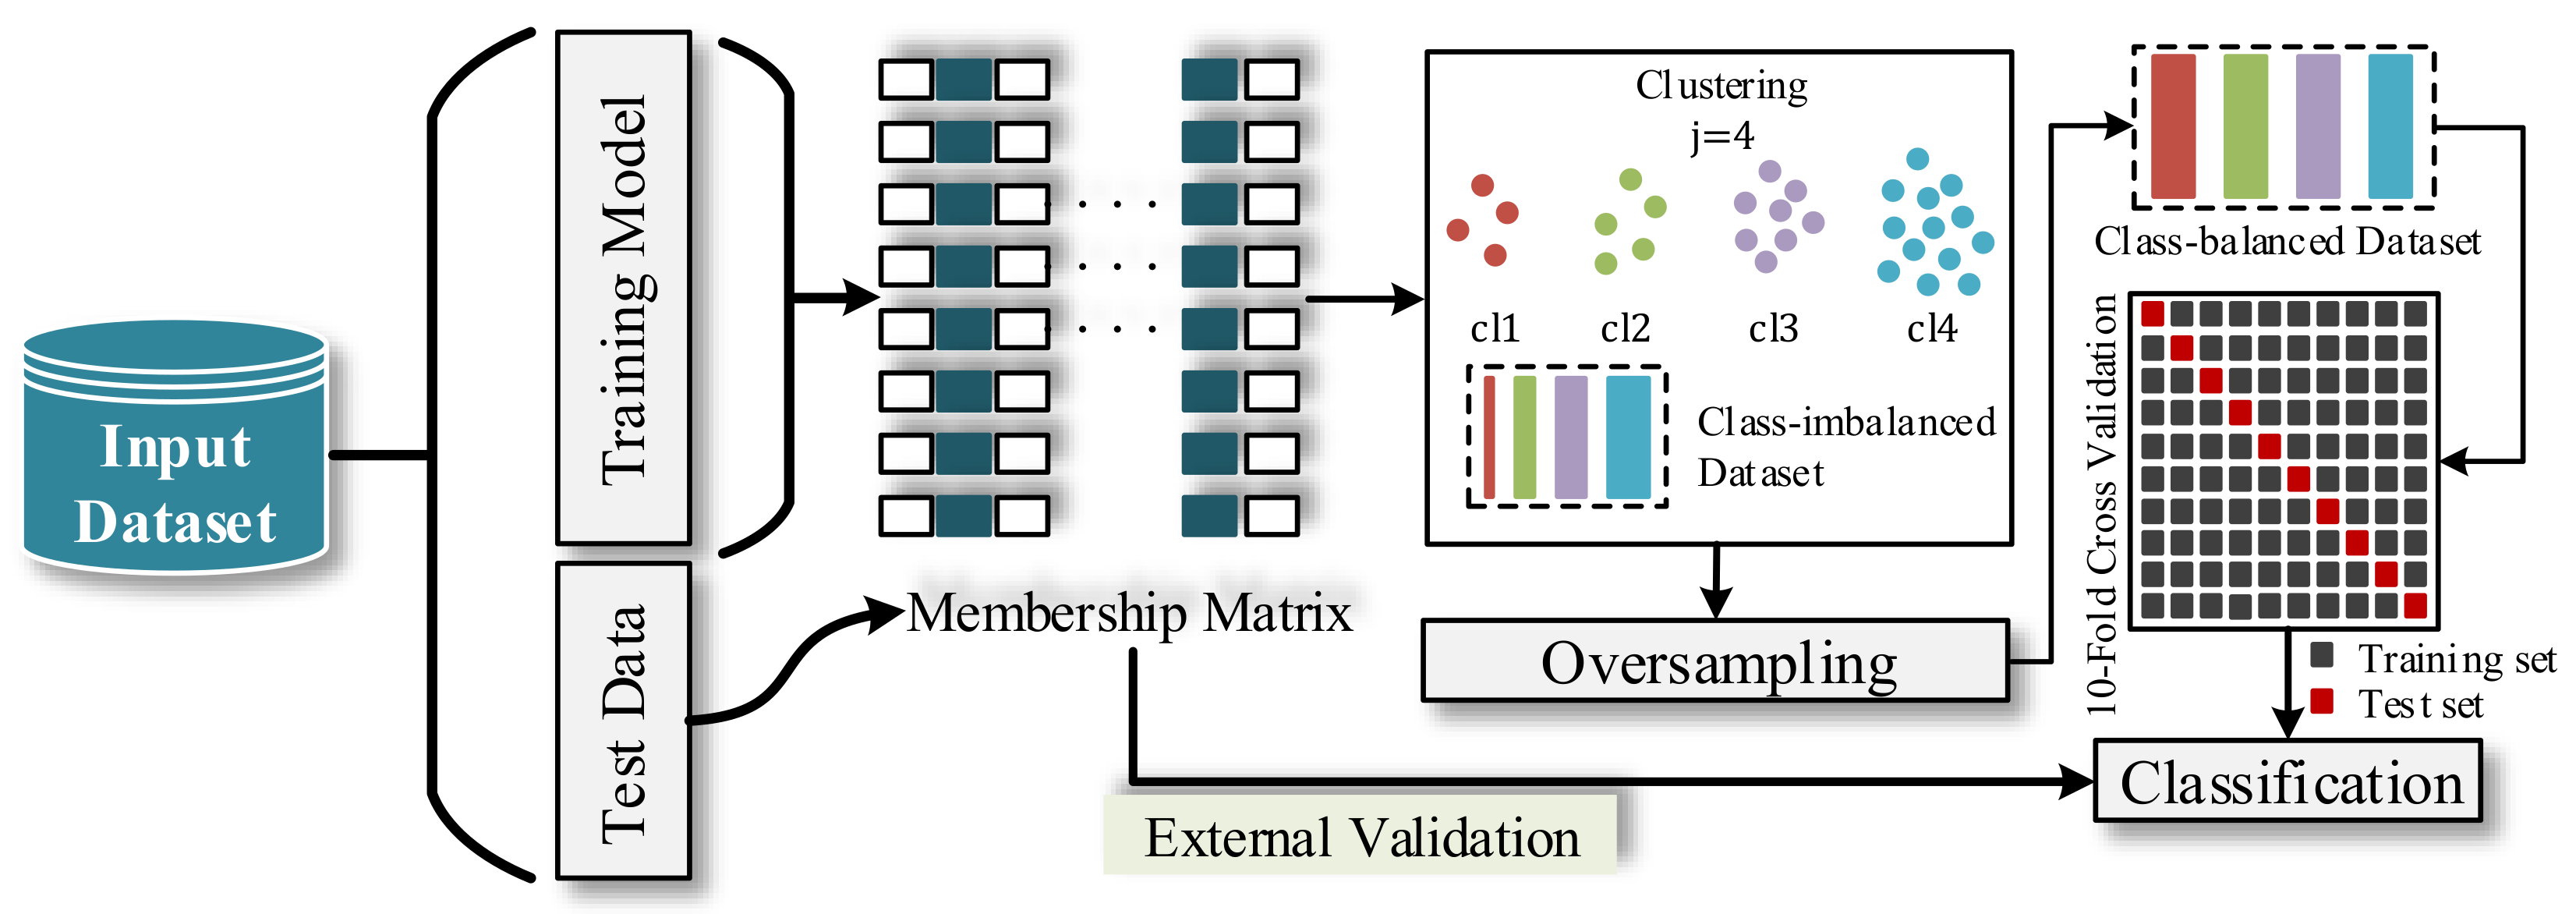
In this paper, we develop a VPD multiple classification system for class-imbalanced data in the pathological voice database and provide a framework to solve the problem, which is shown in Figure 1, including three steps—feature extraction, FC-SMOTE algorithm handing, and model validation and evaluation. The theoretical background of the MFCC feature parameters is briefly described. We use FC-SMOTE to generate new minority samples to obtain a balanced dataset from the initial dataset. Finally, we evaluate and validate a set of machine learning models using the resulting class-balanced dataset as an input.
2.2. Feature Extraction
MFCC is one of the most common feature extraction techniques used in automatic VPD systems. The steps are as follows: (1) Preprocessing: the pre-emphasis, framing, and windowing of the voice signal. (2) Fast Fourier Transform: a short-time Fourier analysis is performed to obtain the magnitude spectrum. (3) Mel filter: The magnitude spectrum is wrapped as a Mel spectrum using 24 overlapping triangular windows with an equal distribution of centre frequencies of the Mel scale windows. (4) Log power: calculates each filter bank output’s log power, which is the square of the Mel spectrum. (5) Discrete Cosine Transform (DCT): The 13th-order MFCC coefficients are obtained by log power to apply DCT. (6) Perform cepstral liftering: extract the first and second-order differences of MFCCs.
In the feature extraction step, we can compute a set of MFCCs for each speech frame of one-second audio to obtain approximately 64 MFCC samples (window size = 32 ms, frame overlapping rate = 50%). Finally, we use their multi-frame averaging as the MFCC vector for a voice. A total of thirty-six MFCC parameters includes MFCCs’ original feature parameters and their first-order and second-order derivatives.
2.3. FC-SMOTE Algorithm Handing
As one of the standard oversampling methods used to deal with class-imbalanced datasets, SMOTE artificially generates new minority class samples. It combines the generated samples with the initial training set to balance the training dataset. SMOTE generates synthetic samples in three steps. Firstly, it selects a random minority sample for observation. Then, it selects the sample among its k nearest minority sample neighbours. Finally, it creates a new sample by randomly interpolating two samples. The function is shown in Formula (1).
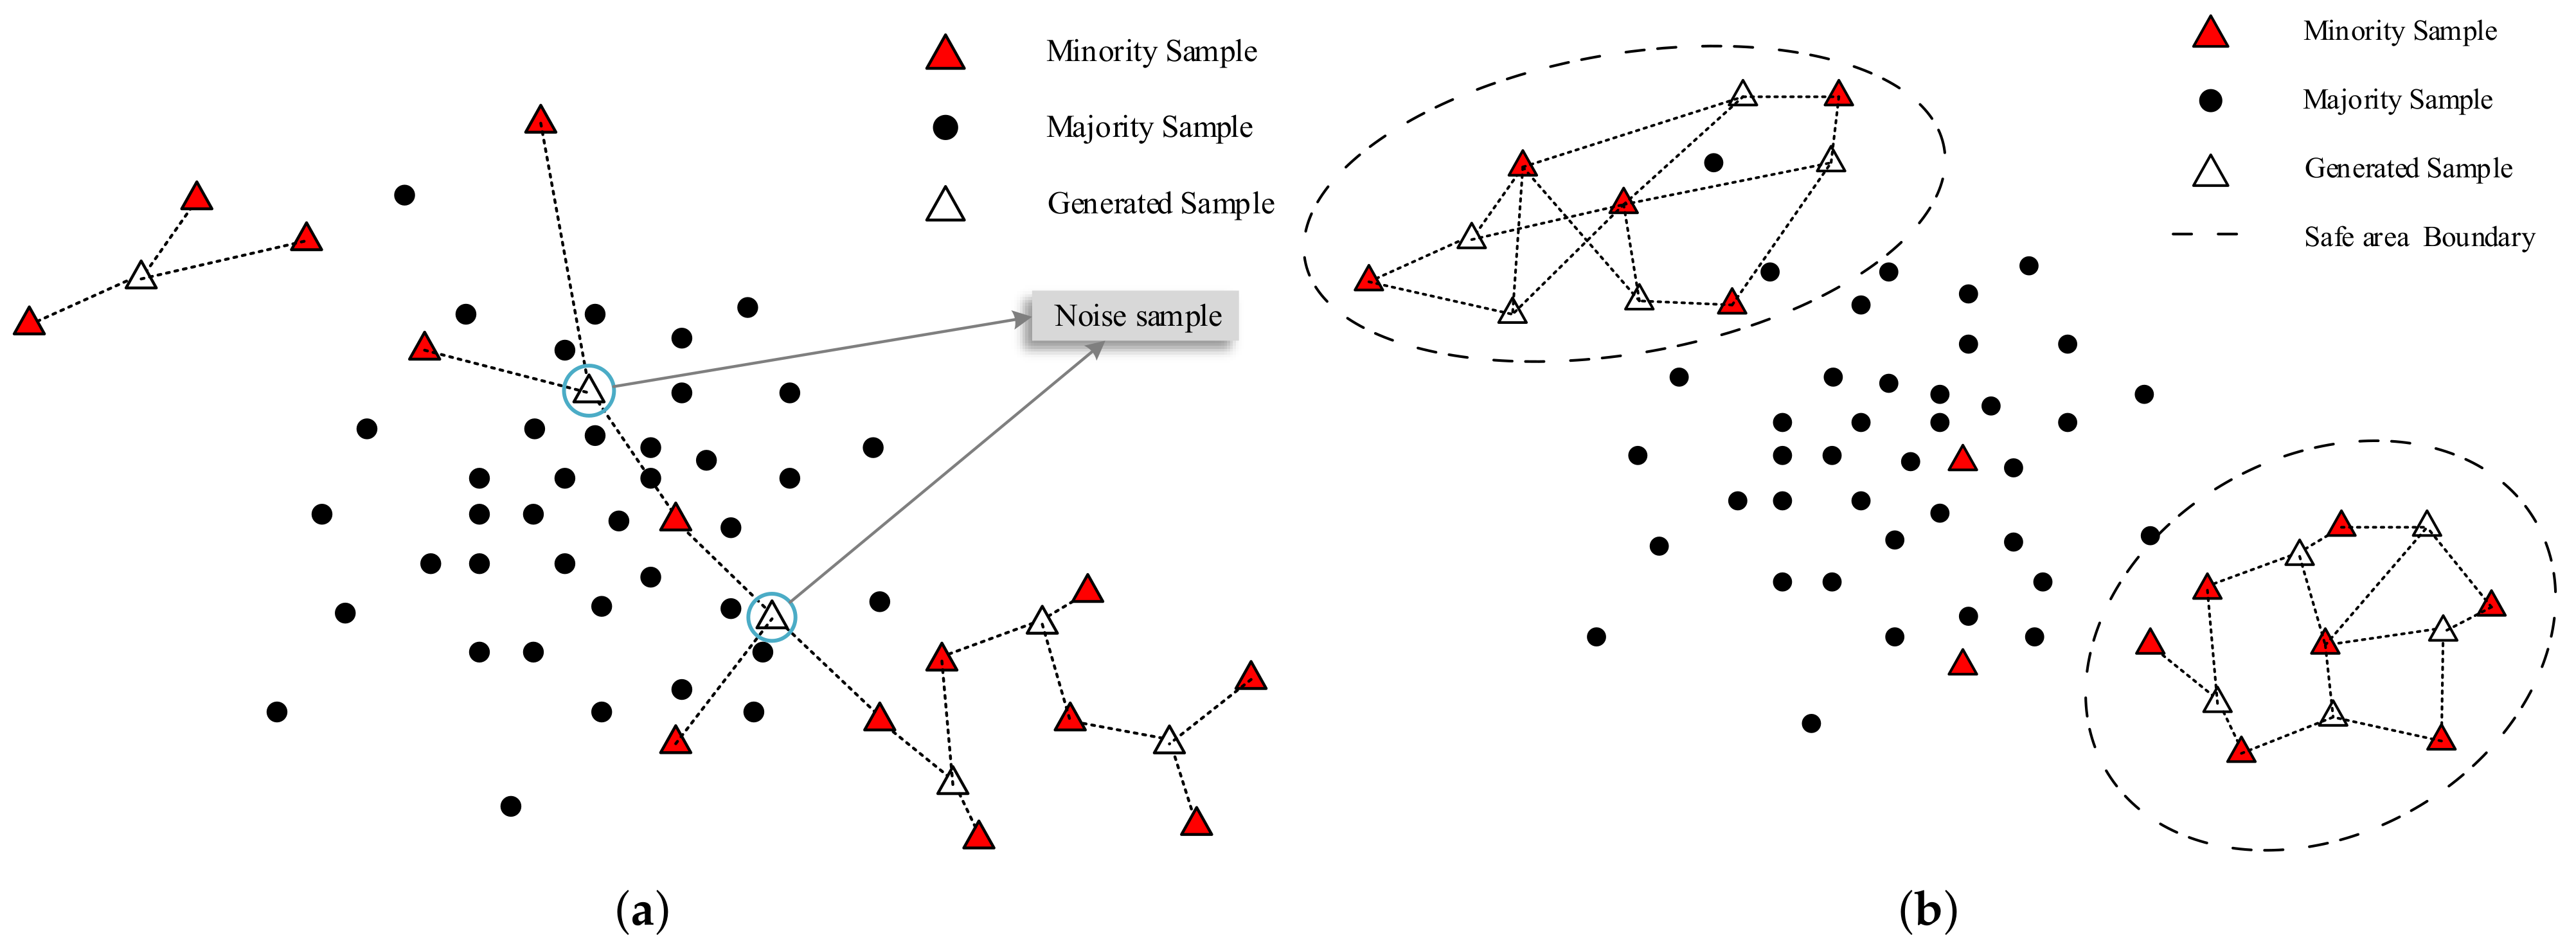
where w is the random weight in [0, 1]. However, SMOTE randomly selects a minority sample to oversample, which may generate minority class samples in majority regions in the presence of noise, as shown in Figure 2a.
The cluster-based SMOTE can avoid the generation of noise by oversampling only in safe areas, as shown in Figure 2b. Besides, when considering the clinically imbalanced dataset dealing with the pathological voice, FC-SMOTE focuses on within-class imbalance by expanding the sparse minority areas to generate more differentiated minority samples to avoid underfitting the classifier. Thus, it can generate as many differentiated and representative minority samples as possible to improve the VPD system performance.
FC-SMOTE consists of three steps—clustering, filtering, and oversampling. In the clustering step, after setting the number of clusters to be divided according to the number of categories, the fuzzy c-means (FCM) clustering algorithm is used to cluster the input samples to specify the number of clusters. The FCM algorithm is one of the most widely used fuzzy clustering algorithms and a popular iterative method for finding groups. It first selects the number of clusters. Then, it assigns coefficients between [0, 1] randomly to initialize the membership matrix. The centroid of the cluster is calculated as the average of all points and weighted according to the degree of the cluster to which they belong. The position of the centroids for each cluster and coefficient in the clusters for each data point is updated. Repeat until the algorithm has converged. In the filtering step, the safe area for oversampling was selected based on the fuzzy set’s spatial distribution. In the safe area, the Euclidean matrix of the membership degree of the minority samples and the centroid of a cluster is calculated to obtain the density distribution matrix to perform the next step of oversampling. Therefore, the filtering step allocates more generated samples to the sparse minority samples space in the safe area rather than in the dense minority sample space in order to generate as many minority samples with significant differences as possible to overcome the underfitting problem of the classifier caused by oversampling. Finally, in the oversampling step SMOTE is used in each selected cluster based on sampling weight to balance the number of samples in the minority and majority classes.
The safe areas used for oversampling are selected based on a fuzzy set. A fuzzy set is a set that has degrees of membership between 0 and 1. In the following formula, the fuzzy set is represented with a tilde character(∼). We define the safe area as shown in Formula (2).
In Formula (2), j is the class number of minority samples and is the membership matrix universal set. In the safe area, the Euclidean matrix of the membership degree of the minority samples and the membership degree of the cluster center is calculated according to Formulas (3)–(5).
In Formula (3), n is the number of minority samples. The distance matrix means that each row of is subtracted by each row of , and its Euclidean distance is calculated. The Euclidean distance matrix of each selected cluster is calculated based on the above formulas, and the majority of samples are ignored. The mean minority distance within each safe area is obtained by dividing all non-diagonal elements of the distance matrix by the number of non-diagonal elements. The density of each safe area is defined as the distance matrix of the safe area divided by the mean minority distance raised to the membership matrix’s dimension root. Sampling weight is defined as the inversion of the density. The sampling weight can be calculated according to Formulas (6) and (7).
For the initial class-imbalanced dataset, c is the membership matrix dimension and and are used to represent the sample number of the majority class and the minority class, respectively, and their difference equals the total number of new minority samples that need to be synthesized. Therefore, the sample number of the synthetic minority classes around each minority sample can be calculated using Formula (8).
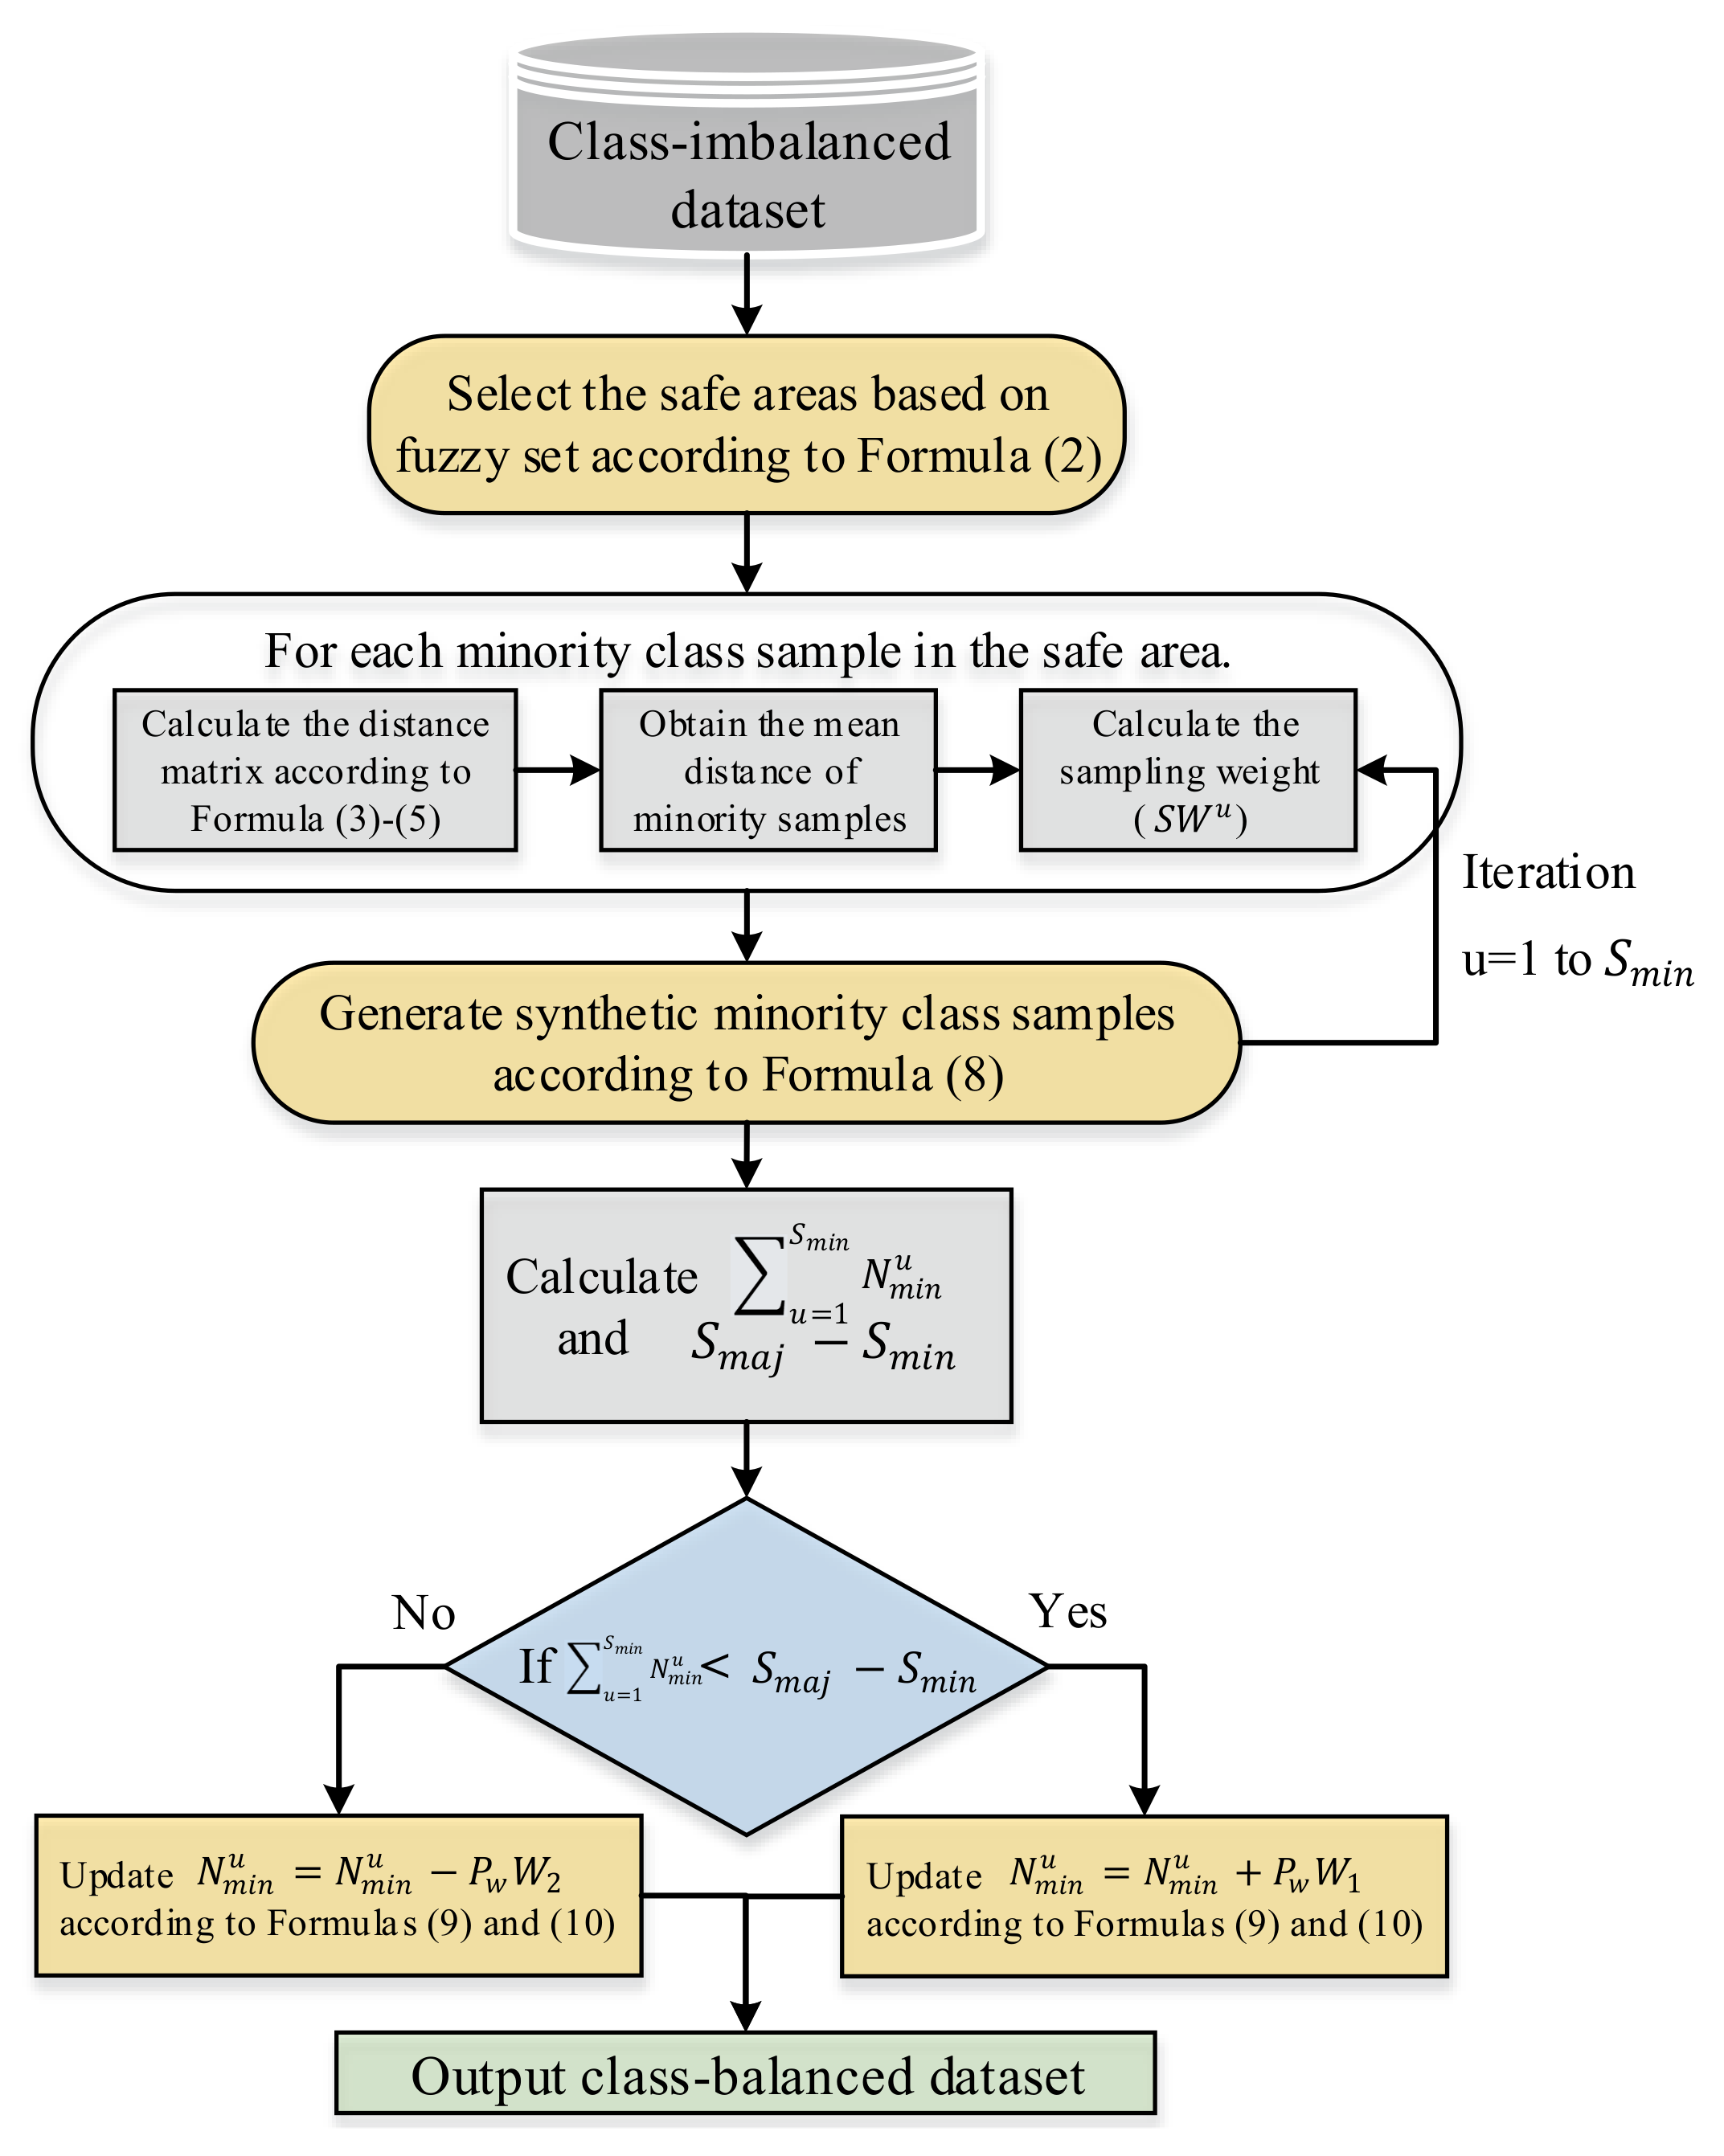
In Formula (8), the function round(·) represents rounding a number down or up according to the decimals. Thus, represents the number of new minority samples that need to be generated by SMOTE around the uth minority sample. The distribution of samples generated in oversampling depends on the sampling weight—that is, high and low sampling weights correspond to minority samples of low density and high density, respectively. In Formula (10), . When , each sample of the first nine initial minority samples with a higher corresponds to the weight in in turn, and increases synthetic samples around it. When , each sample of the last nine initial minority samples with a lower correspond to the weight in in turn and decrease synthetic samples around them. If is bigger than the number of synthetic samples around the minority sample, we skip this minority sample without deleting the generated sample and assign the weight to the next minority sample. The steps of FC-SMOTE are shown in Algorithm 1, and the flowchart is as follows in Figure 3.
2.4. Model Validation and Evaluation
After processing the imbalanced algorithm FC-SMOTE, four types of pathological voice class-balanced datasets and normal and pathological voice samples are obtained from the initial class-imbalanced dataset. In this process, in order to ensure that our results are not biased towards specific machine learning models and reduce the risk of overfitting, we validated and evaluated a set of standard representative machine learning classifiers (logistic regression(LR), naive Bayes (NB), decision tree (DT), support vector machine (SVM), K nearest neighbours (KNN), random forest (RF), XGBoost, and gradient tree boosting (GBDT)), as well as a deep-learning-based classification model (multi-layer perceptron (MLP) and convolutional neural network (CNN)).
| Algorithm 1 The algorithm of the FC-SMOTE |
| Input:}, j(a specify a number of clusters), k(number of nearest neighbors to be found by SMOTE), c(membership matrix dimensions). |
| Output: a class-balanced dataset. |
| Step 1: The input elements is clustered into j clusters by Fuzzy C-means. |
| Step 2: Select the safe areas used for oversampling based on fuzzy set, according to Formula (2). |
| Step 3: |
| for safe areas do |
| (a): Calculate the distance matrix between the membership value of each minority sample point and the cluster center point, according to Formulas (3)–(5). |
| (b): Obtain the mean distance of minority samples. |
| , |
| (c): Calculate the sampling weight. |
| , |
| (d): Calculate the number of new minority samples that need to be generated by SMOTE around each minority sample, according to the sampling weight. |
| , |
| (e): Combine and to construct a class-balanced dataset, according to Formulas (9) and (10). |
| end for |
3. Experiment
3.1. Database
The database we used was developed by the Massachusetts Eye and Ear Infirmary (MEEI) Voice and Speech Lab. The speakers in the MEEI database samples are native English speakers. The MEEI database is the most widely used international commercial database in voice pathology detection, but it has the defect of a class-imbalanced distribution of samples. The MEEI database contains more than 1400 voiced samples of the sustained vowel /a/, but only 53 normal voice samples. In this study, all available 53 normal samples and four pathology types—vocal cord nodules, vocal cord polyps, vocal cord edema, and vocal cord paralysis—were chosen because these four are common in clinical diagnosis. Table 1 summarizes the primary information of the MEEI database samples used.
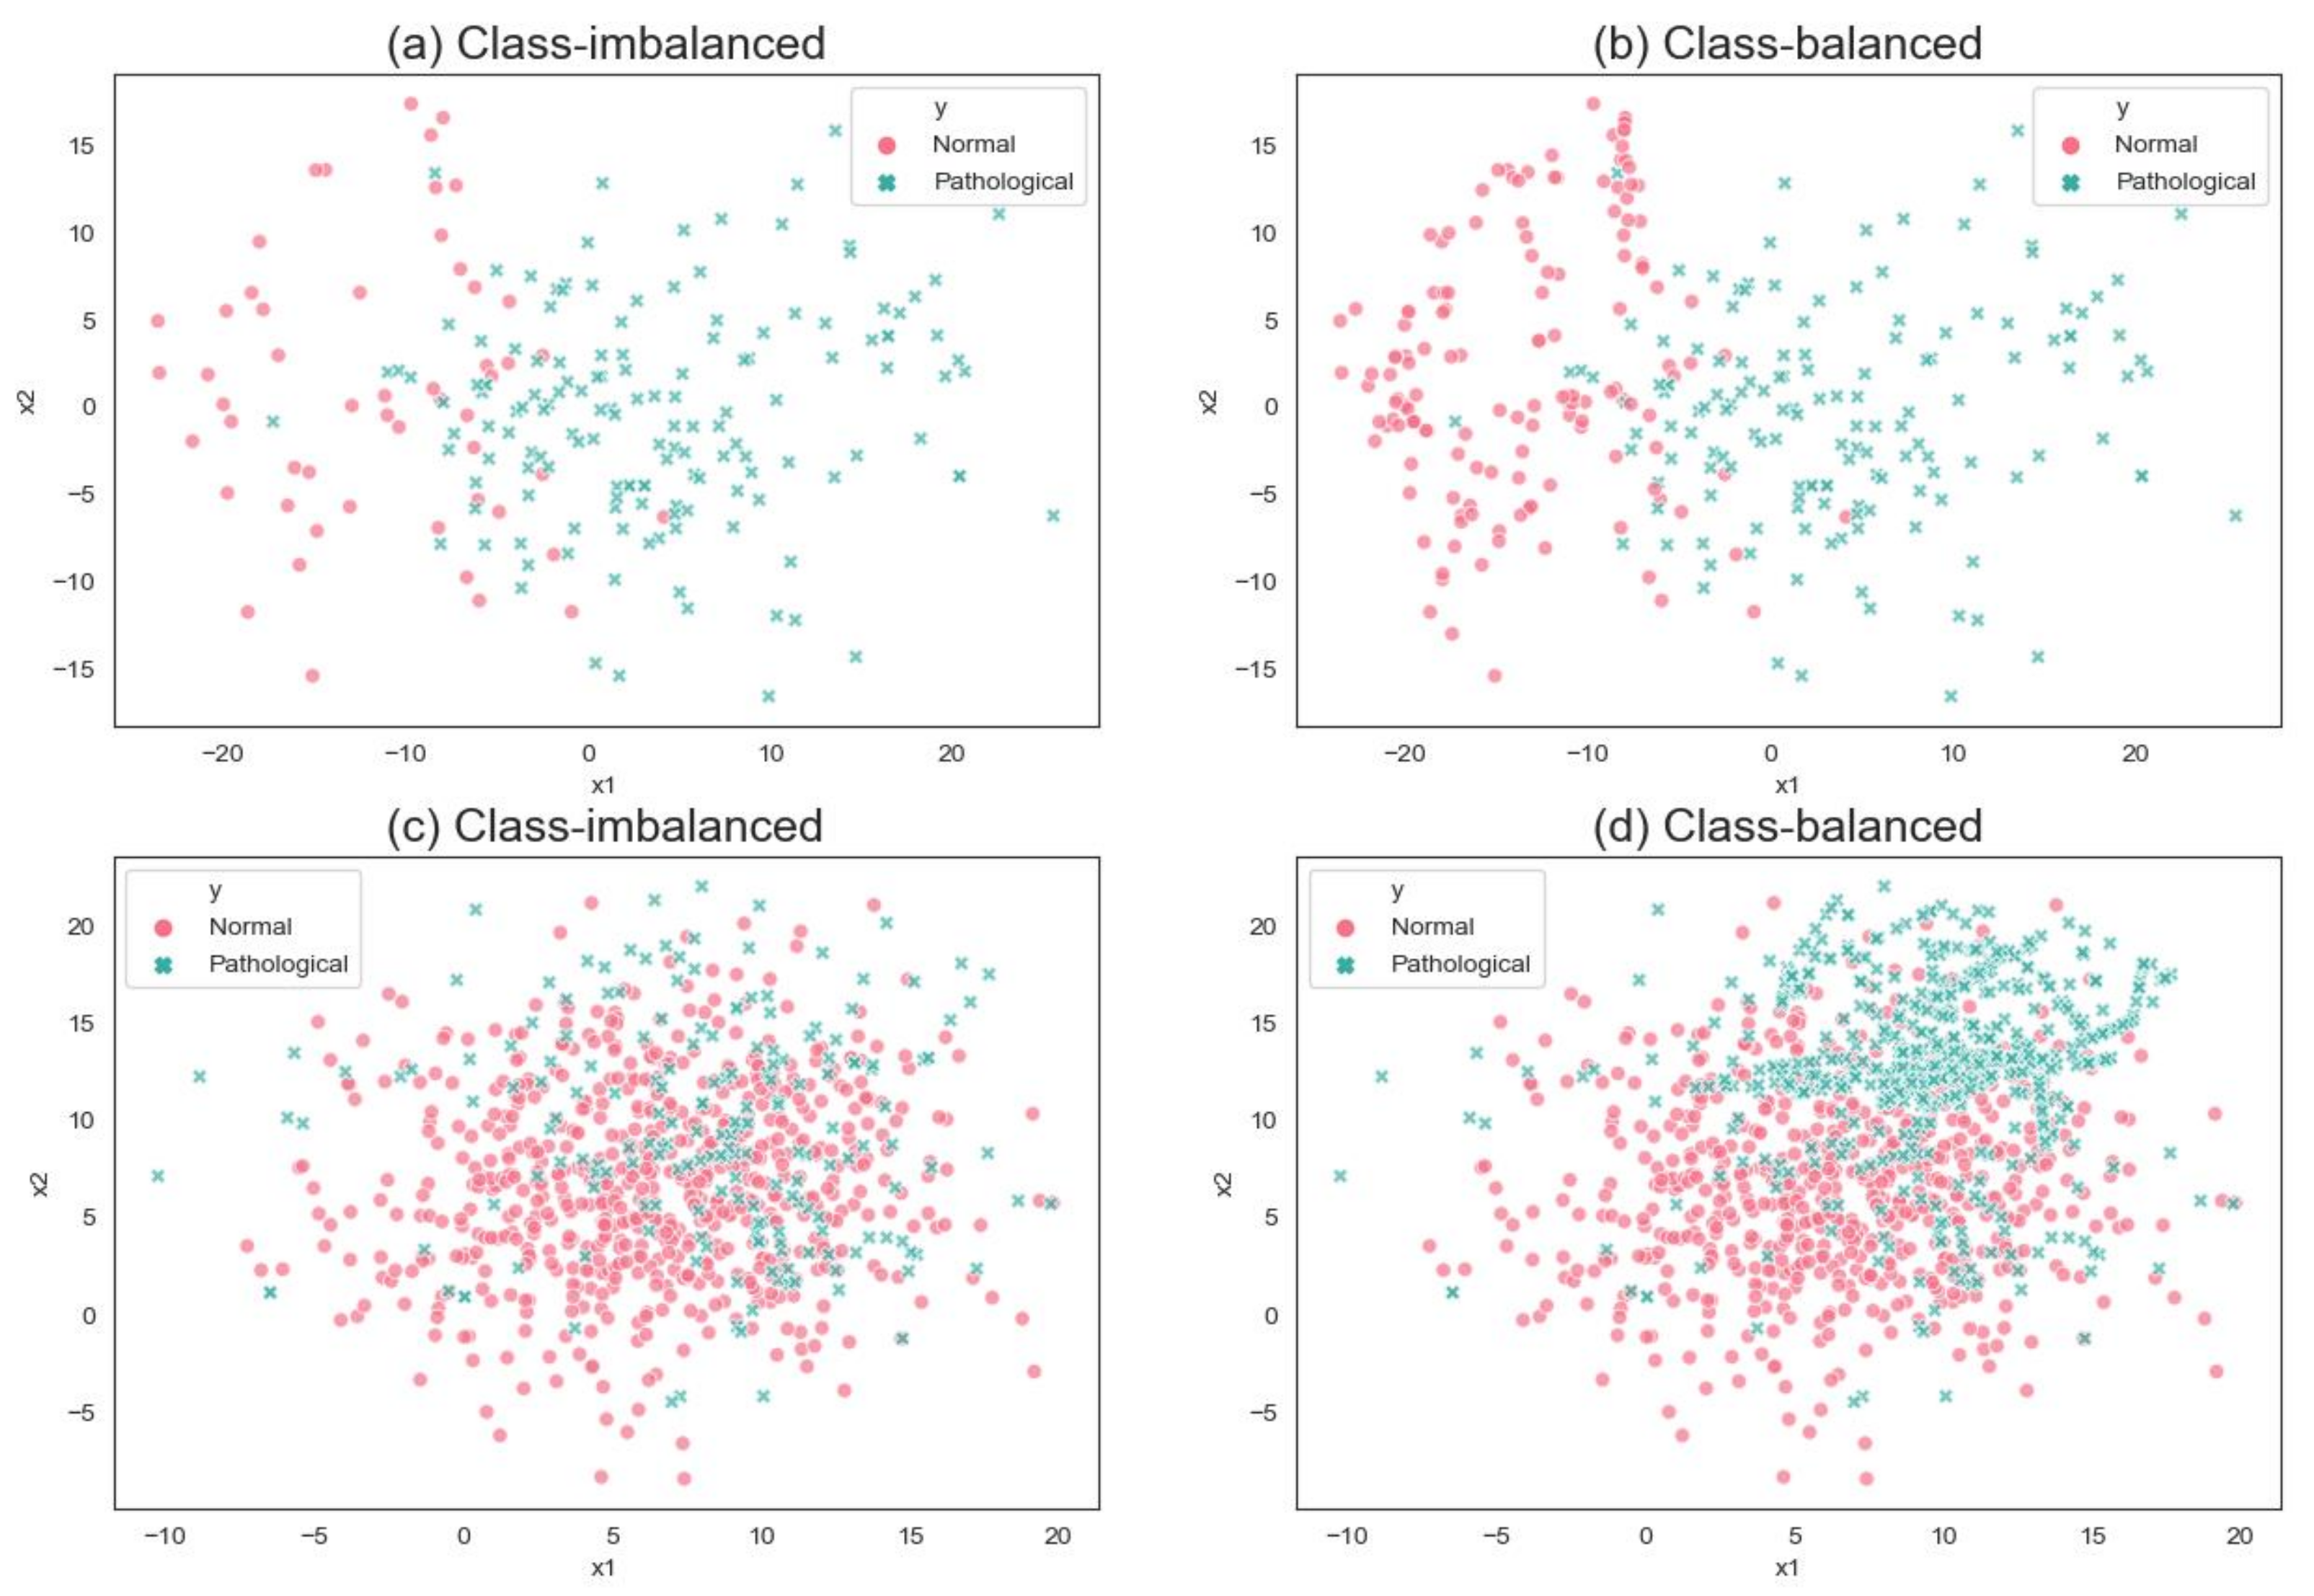
It can be seen that in the MEEI database, there is a class-imbalanced distribution between normal and pathological voice samples, as well as each type of pathological voice sample. The class-imbalanced distribution of samples will lead to the poor performance of a classifier, which many researchers have ignored. To better illustrate this problem of imbalanced characteristics and the difficulties of example distribution in the attribute space, we visualized them in a two-dimensional space using Principal Component Analysis (PCA). Figure 4a,b show the data distribution of the normal and pathological samples before and after using FC-SMOTE in the MEEI database.
In this work, we first focus on modeling VPD systems in the class-imbalanced MEEI database, which can mislead the diagnosis results. Therefore, an improved SMOTE technique based on the fuzzy c-means clustering algorithm is proposed for balancing the dataset. In order to broaden the scope of the problem and maximize the applicability of the proposed method, we selected vowel /a/ samples with vocal cord nodules, vocal cord polyps, vocal cord edema, and vocal cord paralysis from another voice pathology database (Saarbruecken Voice Database (SVD) [41]) and conducted the same experiment using the proposed method. The SVD database is German, and is a collection of voice recordings and EGG signals from more than 2000 persons. It contains recordings of 687 healthy persons and 1356 patients with one or more of 71 different pathologies. Table 2 summarizes the primary information of the SVD database samples used. Figure 4c,d shows the sample point distribution before and after using FC-SMOTE in the SVD database.
3.2. Parameter Settings
All 50 kHz files were downsampled to 25 kHz to ensure that all voice files had the same sampling frequency. All 3-second files were edited to include only the first second of phonation. The 36-dimensional MFCC parameters and their first and second derivatives were extracted from each file in the database. The parameters for extracting the MFCC features were set as follows: frame size = 32 ms, frame overlapping rate = 50%, Mel filter order = 24. For FC-SMOTE, the 3 nearest neighbours SMOTE algorithm was used (k = 3), four clusters needed to be found by c-means for an imbalanced class of four pathology types (), and two clusters needed to be found by c-means for an imbalanced class of normal and pathological voices (). This work focused on the robustness of the method to generate minority class samples rather than adjusting the classifier hyperparameters to obtain the classifier’s optimal performance. Therefore, Bayesian Optimization [42] was used to find the relatively optimal hyperparameters so that the machine learning classifier’s performance was in a good performance range. Table 3 lists the main hyperparameter search space of each model. For the experimental verification of the deep learning model CNN, we refer to the method proposed in [2] to construct the network. Experiment results were obtained by 10-fold cross-validation to sure that each fold of the training or testing contained at least one sample of the minority class. To illustrate the generated data’s reliability, we randomly isolated 10% of the dataset not used for oversampling from the initial dataset as external validation. Table 4 presents the training and test data distribution information of the experimental database. In the experiment based on the MEEI database, we set up an external dataset to prove the effectiveness of the FC-SMOTE algorithm in generating samples. Therefore, in the SVD database experiment no external dataset was set to repeat this verification experiment. The calculations and models were implemented by Python 3.7 with the Imbalanced-learn, Scikit-learn, and TensorFlow 2.0 libraries.
3.3. Model Evaluation Measure
Traditionally, the metric most commonly used to measure classifier performance has been Acc. However, in imbalanced datasets the common measure of classifier performance is inappropriate because its results can be misleading. If the wrong metric is chosen to evaluate models, it is likely to choose a flawed model, or, in the worst case, be misled about the model’s expected performance. Thus, this study adopts some reasonable evaluation measures, including recall, specificity, G value, value, and AUC/PRC, to measure the model’s performance in a class-imbalanced dataset. Recall can represent the minority class accuracy rate. Specificity can represent the majority class accuracy rate. G value and F1 value also consider the classification performance for the minority class. When dealing with imbalanced datasets, precision—recall curves (PRC) give a more informative picture of an algorithm’s performance. In short, these evaluation measures will not be affected by the number of samples in different classes, so they are usually considered “unbiased” and can be used in scenarios where classes are imbalanced. Relevant model evaluation measures are calculated according to Formula (9) through to Formula (14). In the formulae, the meanings of , , , and are shown in Table 5. is the number of accurate positive samples (actual minority and predicted as a minority), is the number of false-negative samples (actual minority, but predicted as a majority), is the number of false-positive samples (actual majority, but predicted as a minority), and is the number of accurate positive samples (actual majority, and predicted as a majority).
where n is the number of samples. For multi-class models, the macro average rule is used to calculate the above model evaluation measures.
3.4. Experimental Results and Analysis
In the construction part of the multi-classification system, the classification problem is extended to four exact types of pathological voice: vocal cord nodules, vocal cord polyps, vocal cord edema, and vocal cord paralysis. The model evaluation measure is obtained by recall, specificity, G value, and value through 10-fold cross-validation. Meanwhile, each classifier training time is also presented to evaluate the data complexity.
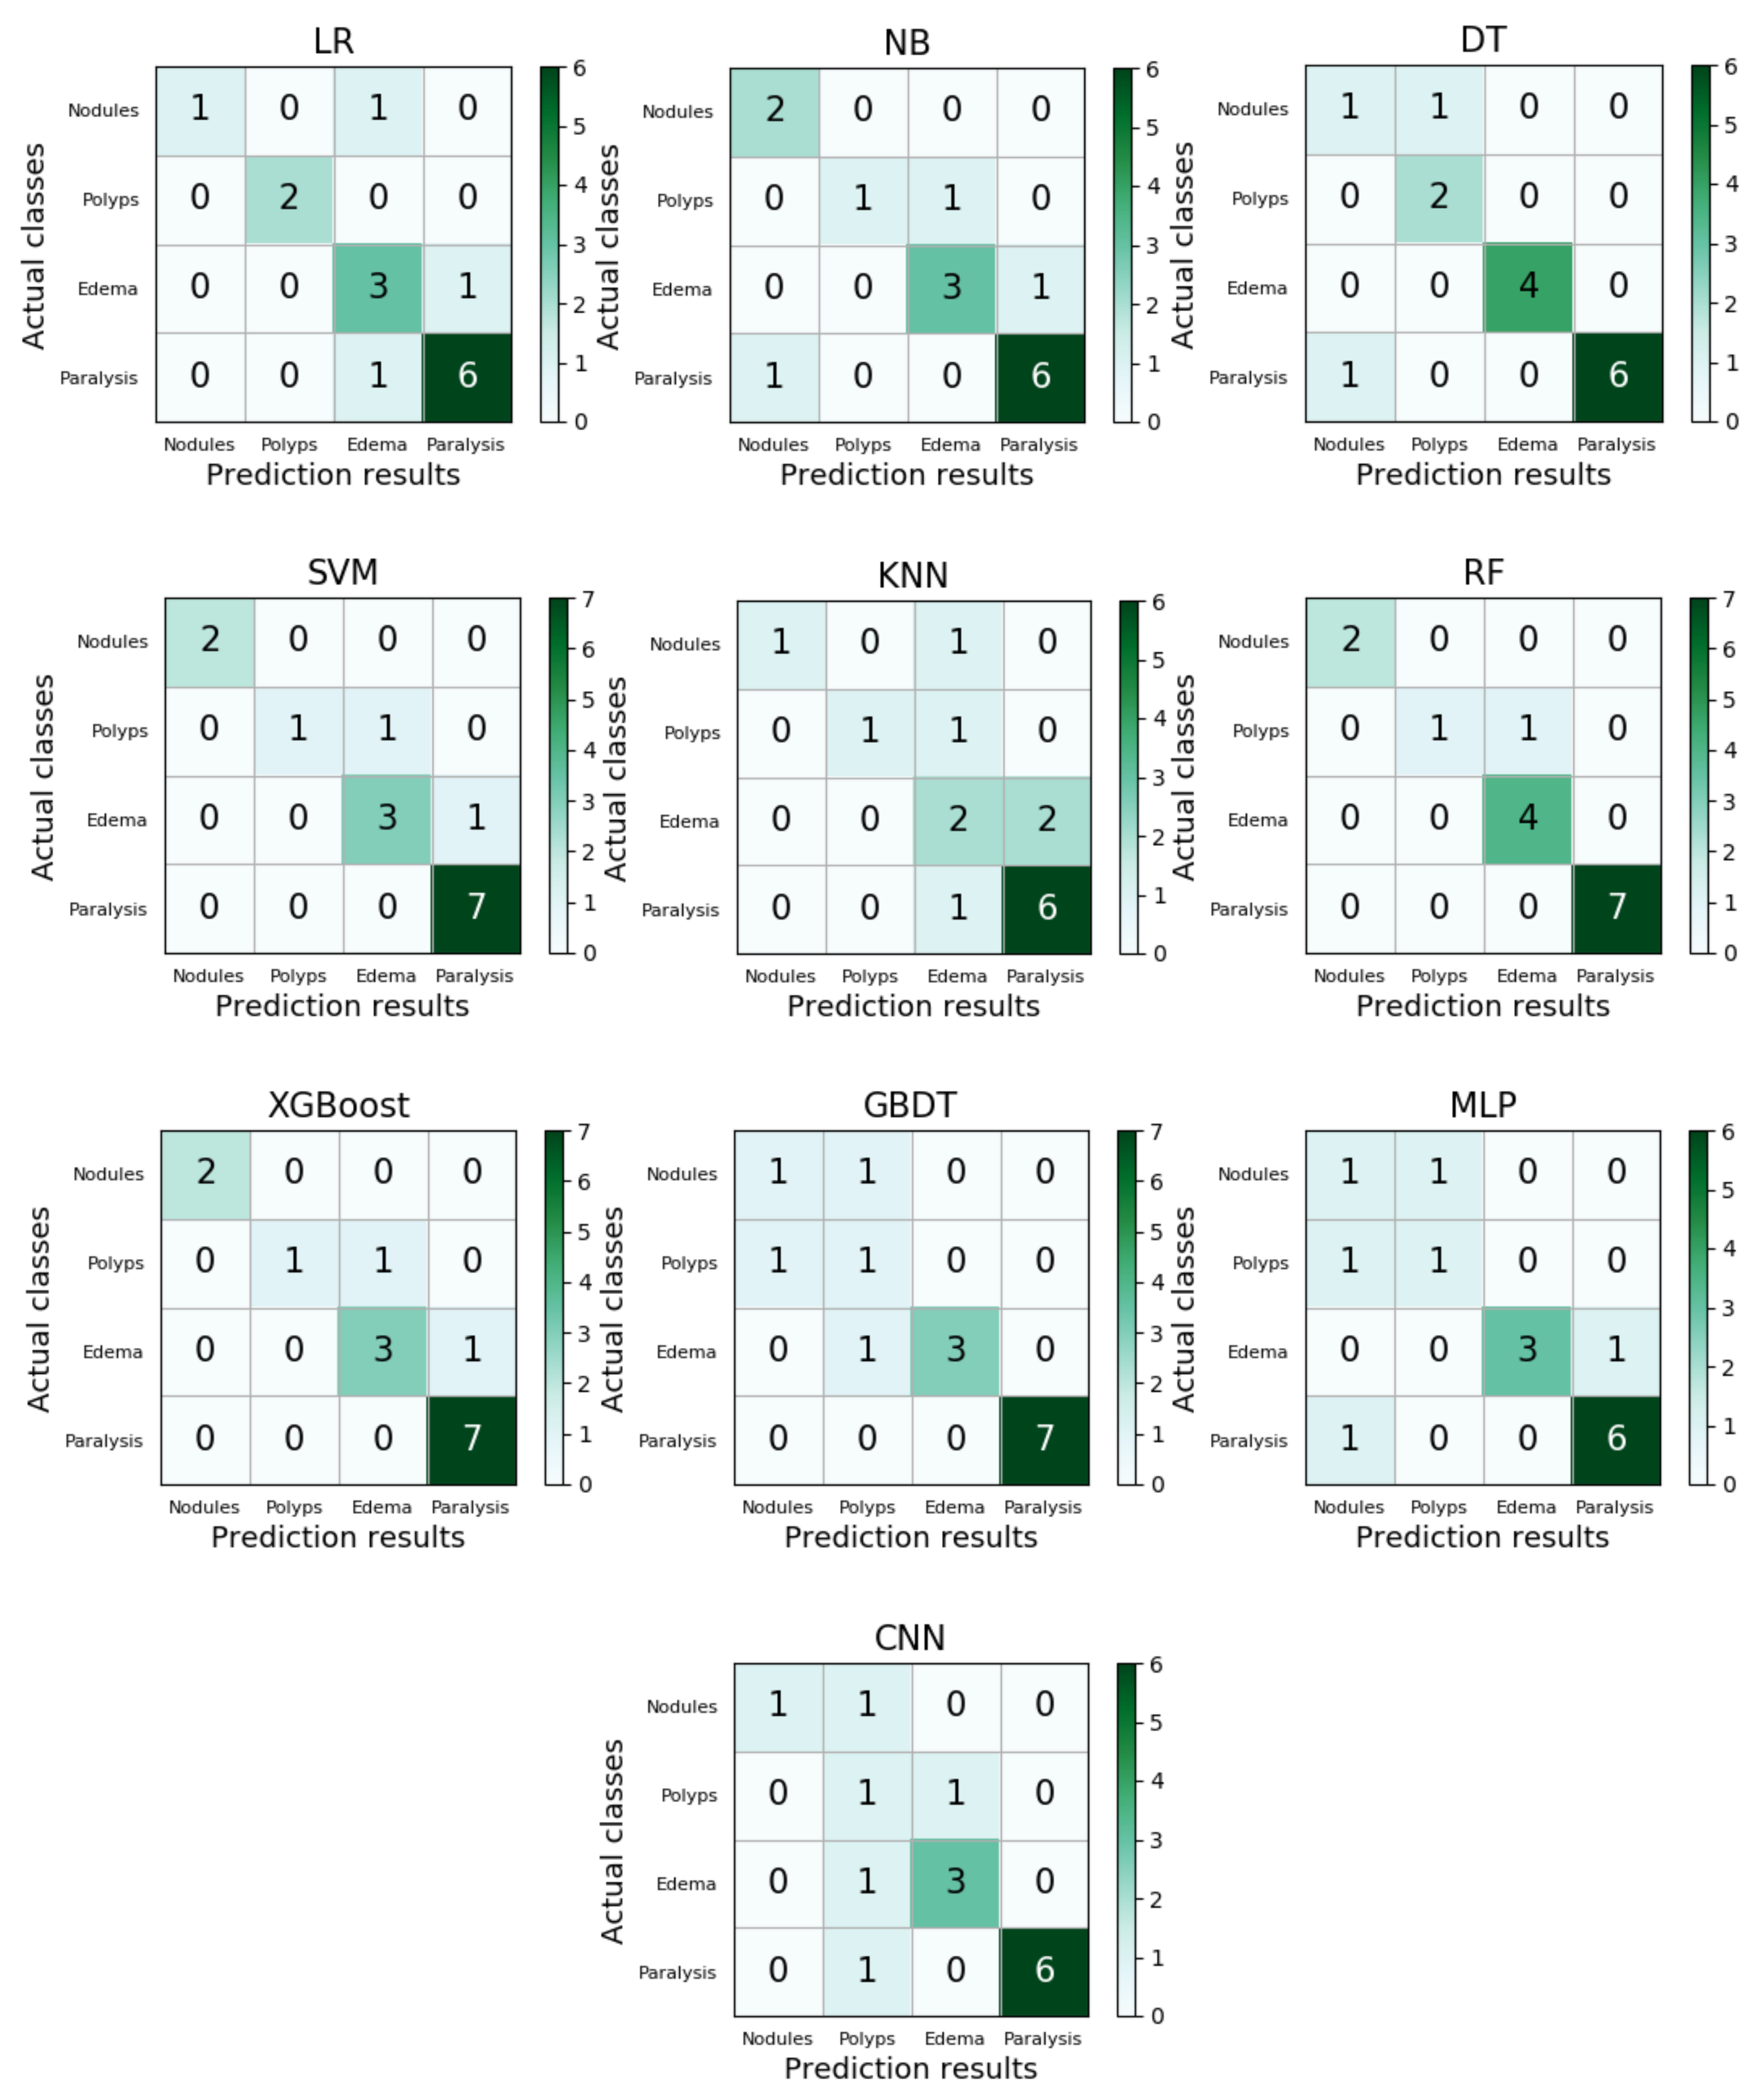
Table 6 shows the results of ten machine learning models before using FC-SMOTE to balance the dataset. The predictive ability of all models is inferior. Due to the class-imbalanced distribution of the sample in the MEEI database, most of the model evaluation measures are lower than 0.5, which may also be due to the current lack of work on the multi-classification of pathological voices. The model evaluation measures of each classifier after imbalanced handing using the FC-SMOTE algorithm are shown in Table 7. Additionally, the results of external validation are shown by a multi-class confusion matrix in Figure 5.
It can be seen from the comprehensive model evaluation measures of the ten classifiers in Table 7 that the VPD system with FC-SMOTE performs better in terms of the recall, specificity, G value, and value. Compared with the single model and the neural network model, the three ensemble models (RF, XGboost, GBDT) have the most significant improvement and have the best overall performance in model evaluation measures after the FC-SMOTE algorithm handing. The optimal classifier RF increases the recall to 0.83, the specificity to 0.95, the G value to 0.88, and the value to 0.86. As an ensemble learning model, RF performs better than single classifiers in pathological voice classification, which is also reflected in the latest review paper [6]. Meanwhile, the same effect is shown in two other typical ensemble learning models (GBDT, XGBoost). The external validation set samples are regarded as independent data and do not participate in the imbalanced algorithm handing. From the multi-class confusion matrix of the ten models, it can be seen that the method we proposed has an excellent overall effect on the number of correct predictions for each class. Such results indicate that the FC-SMOTE processing is an effective method to build a multi-classification model of pathological voices, which means that the VPD system can learn minority classes better to improve performance in multi-classification. Since MFCC is a well-established feature in the field of speech recognition, the VPD system can also show promising results in binary classification detection in imbalanced datasets, as confirmed in a recent research work [43,44]. Therefore, in the class-imbalanced binary classification, we focus on the correct recognition of minority samples by models in binary classification. In addition, to respond to the experimental results after using the FC-SMOTE algorithm, an external validation set composed of the same samples was used to generate a confusion matrix. The confusion matrix gives the class-imbalanced binary classification results of external validation in Figure 6.
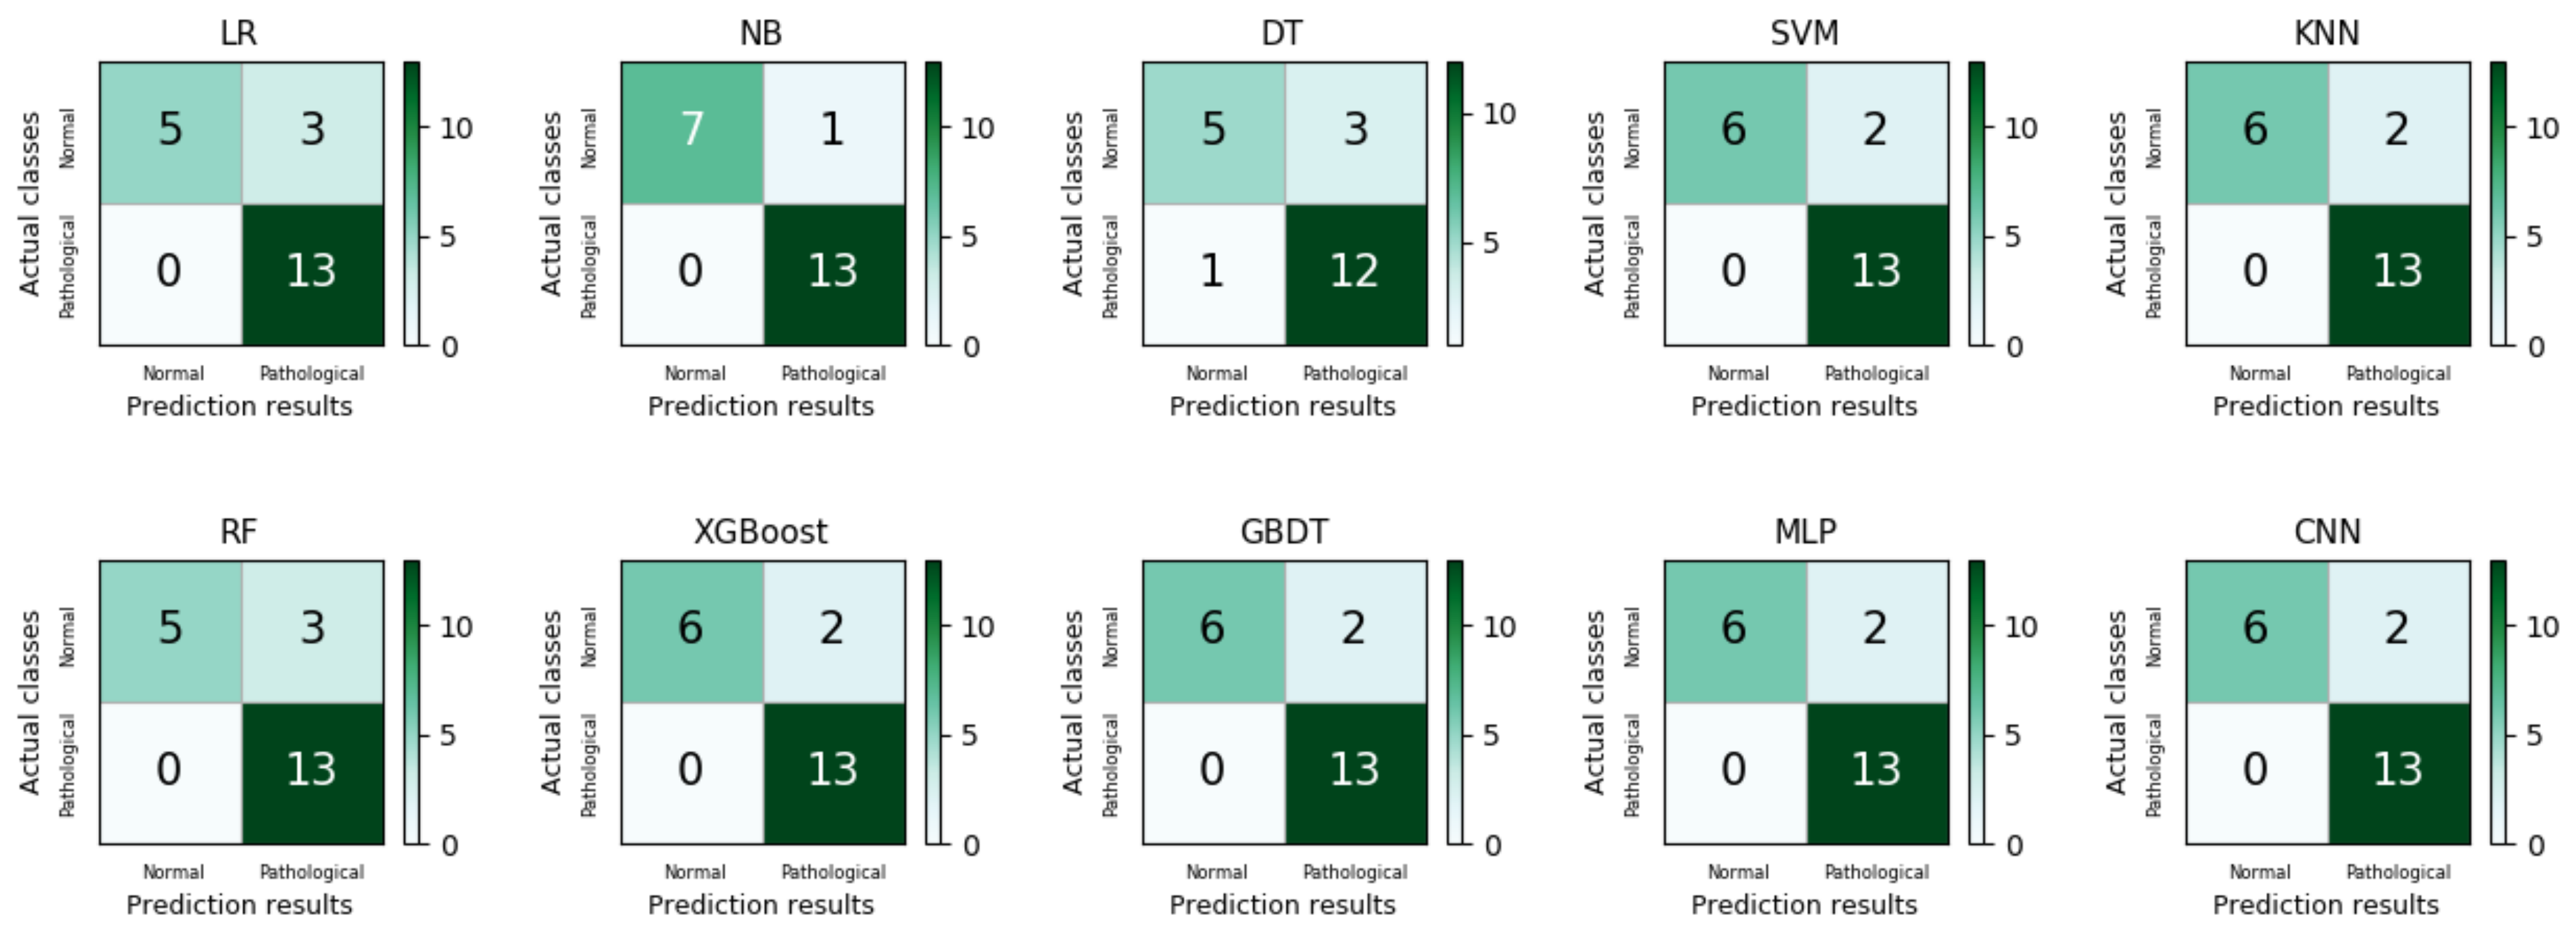
Figure 6 shows the confusion matrix of each machine learning model for detecting normal and pathological voices in the initial class-imbalanced dataset. As can be observed, the classifier’s recognition ability is obviously biased towards the majority class samples (pathological type), while the recognition ability of the minority class samples (normal type) is lacking. Therefore, the model has misleading results for the overall accuracy (). Meanwhile, the binary classification results of the class-balanced dataset are shown in Table 8. Similarly, in the binary classification our experiment focuses on the confusion matrix of the external dataset, as shown in Figure 7.
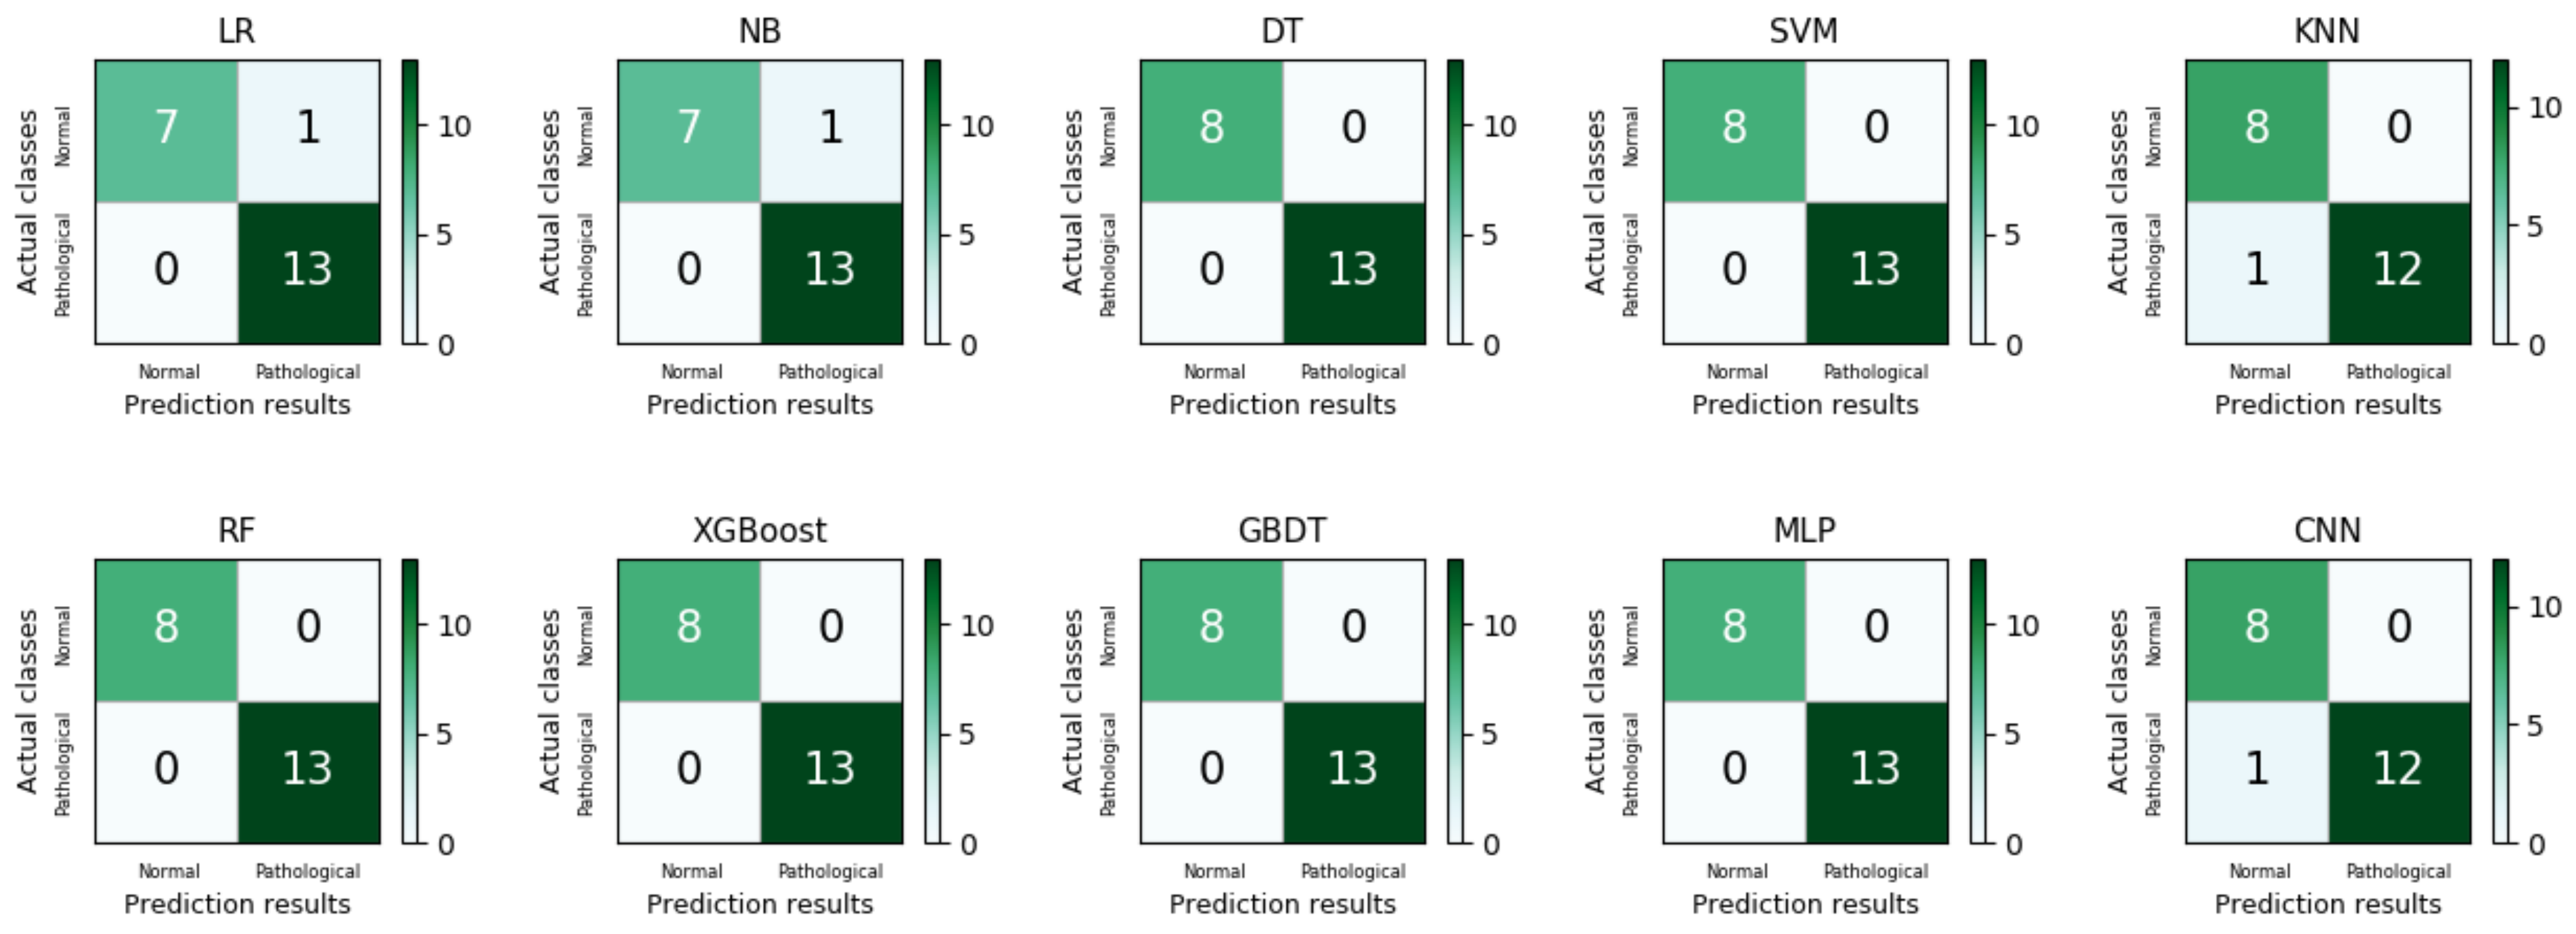
All the models exhibit good predictive capabilities for the binary classification results of normal and pathological voices with FC-SMOTE. Similarly, the ensemble learning model showed the best performance overall. RF performs better than the other models in all model evaluation measures for recall (1.00), specificity (1.00), G value (0.99), and value (1.00). When comparing the distribution of the confusion matrix in the scenarios of Figure 6 and Figure 7, it can be seen although the VPD system with the FC-SMOTE algorithm sacrifices some degree of recognition capability for majority class samples (pathological voice), it significantly improves it for the minority class samples (normal voice). For the time consumption of the machine learning model, the training time of a single classifier is the shortest, and the training time of the deep learning model is the longest. In contrast, the ensemble learning model reflects the best performance in the pathological voice detection and classification experiments of the MEEI database.
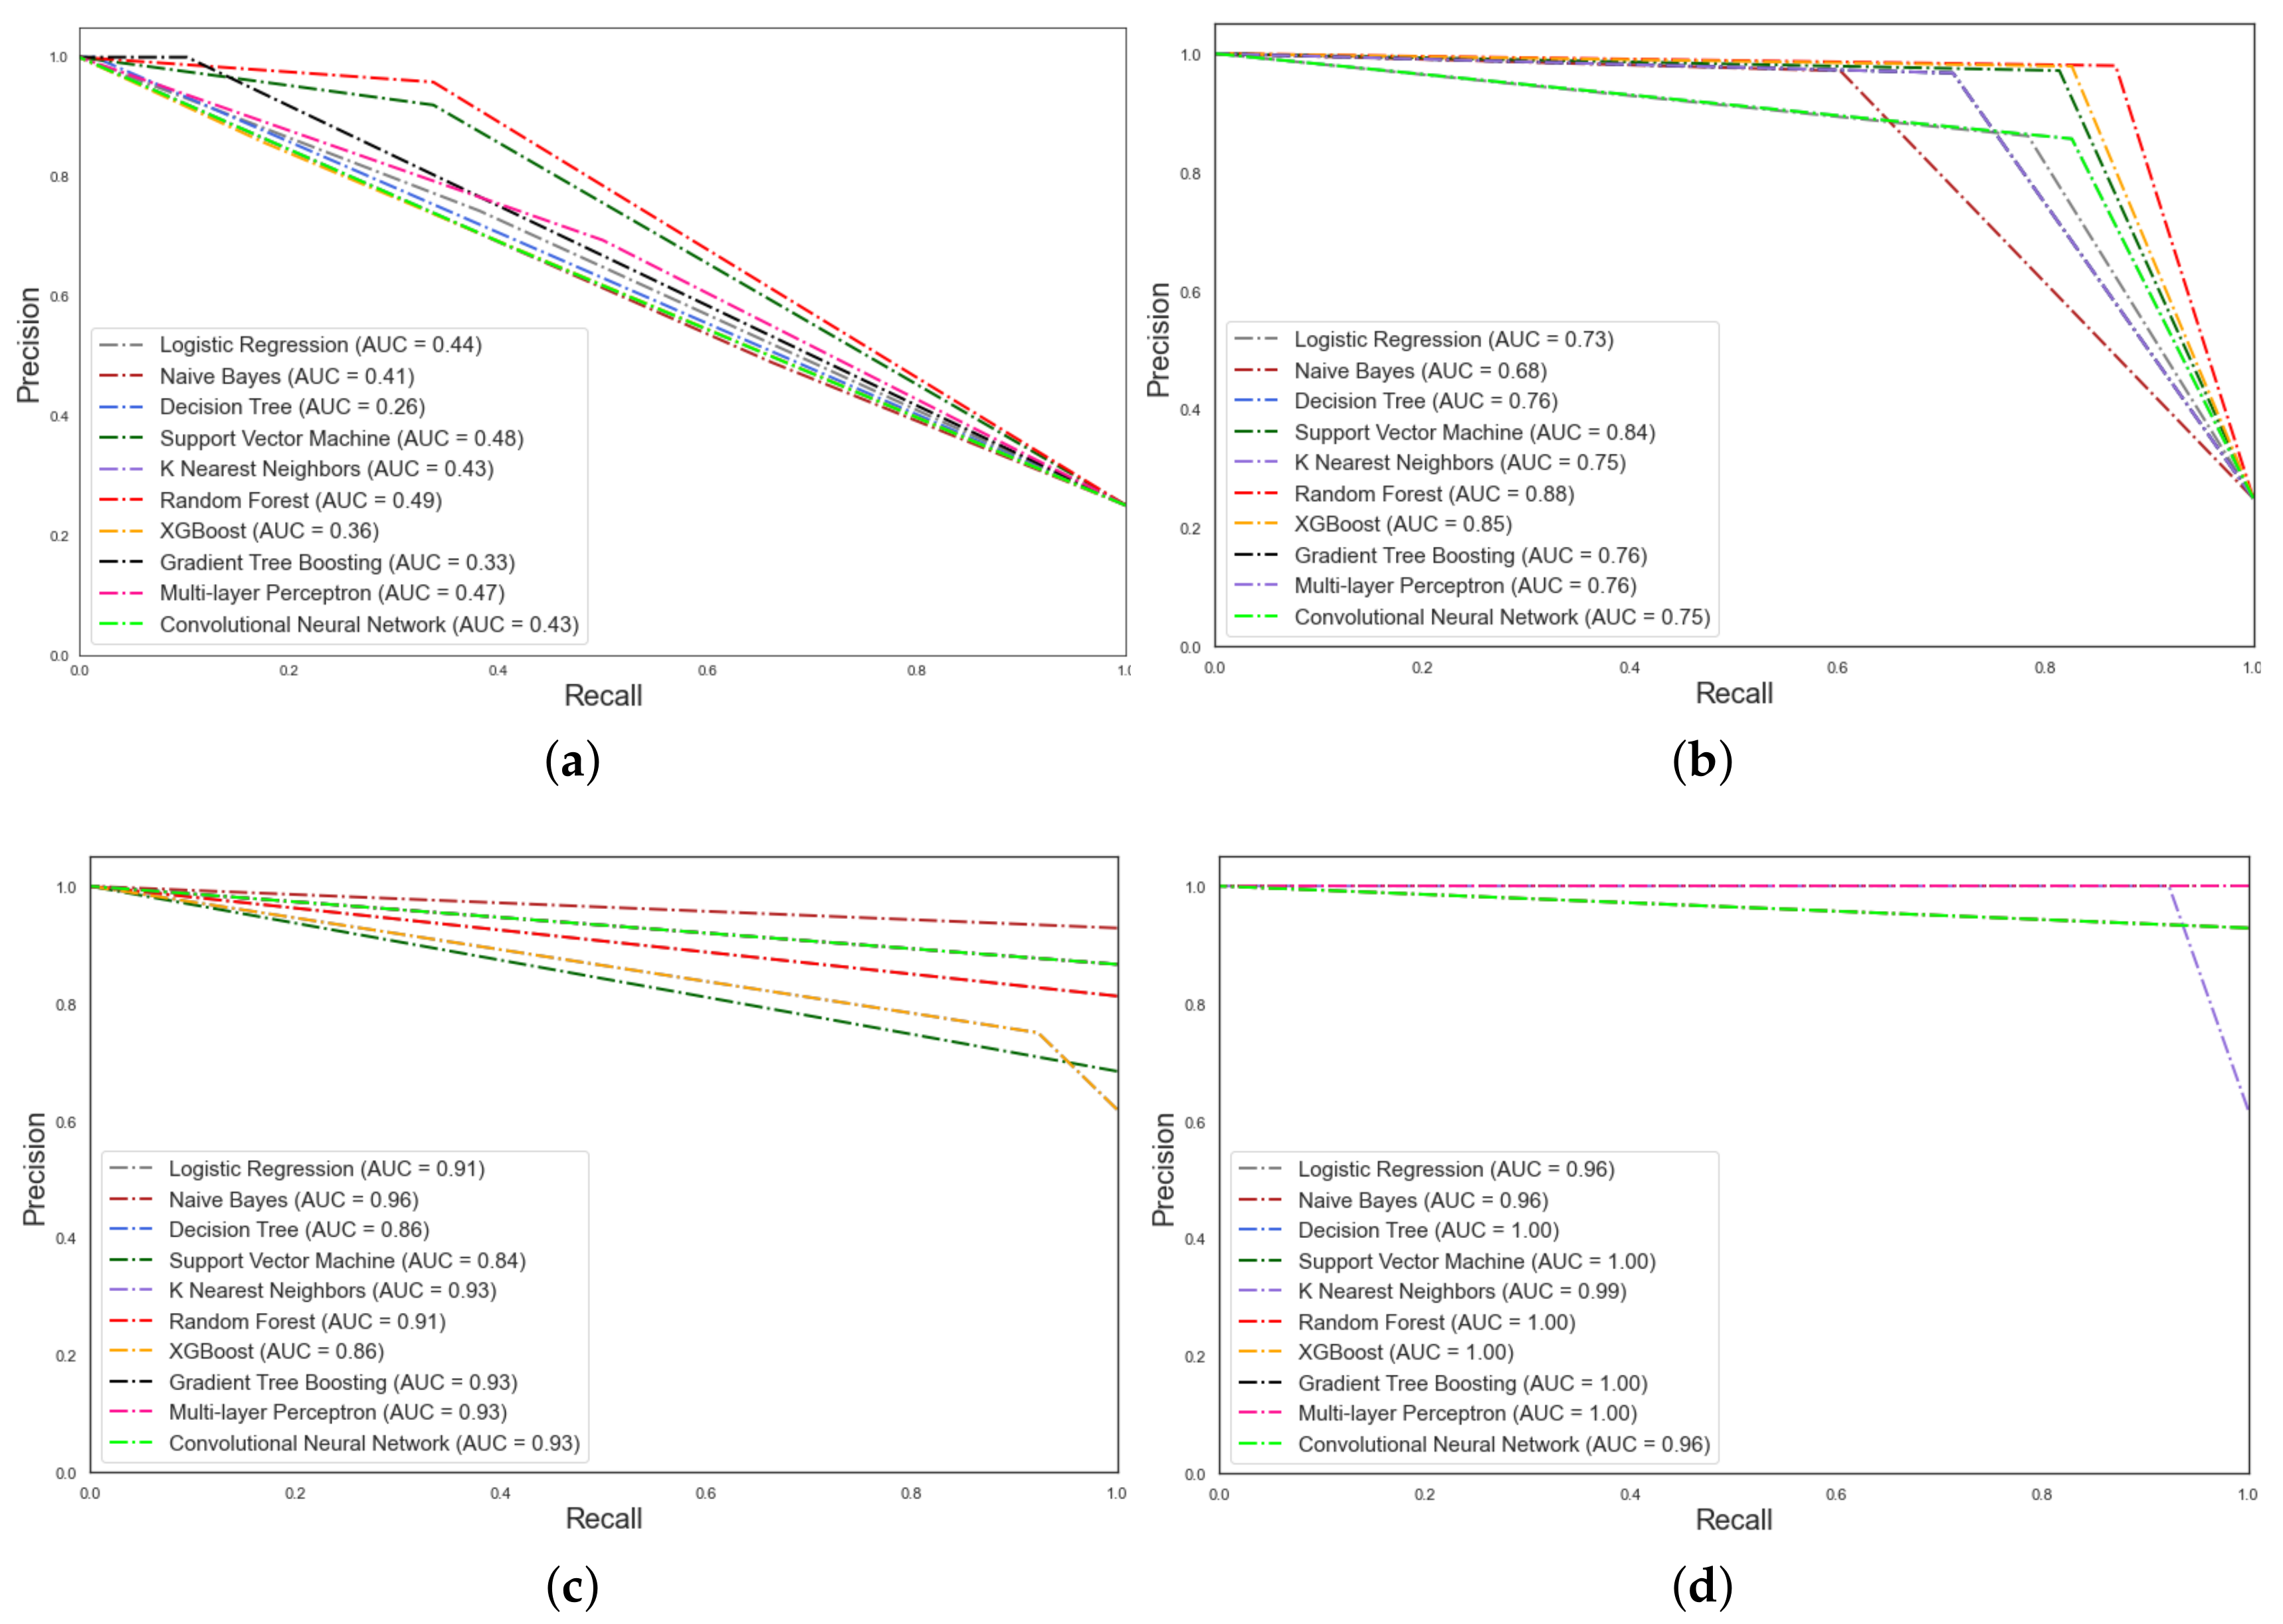
Furthermore, the area under the curve (AUC) of pathological voice multi-classification and binary classification in the external validation dataset corresponding to each model is shown by the corresponding PRC curve diagram. Figure 8a,b show the PRC curves of each model without and with the FC-SMOTE algorithm, respectively, in the multi-classification. Figure 8c,d show the binary classification PRC curves of the class-imbalanced and class-balanced datasets, respectively, which are graphed as curves.
The commonly used model evaluation measure AUC/ROC is a biased metric. Although it is commonly used to summarize the ROC curve and is widely used in medical applications, it is too optimistic regarding the performance of the classifier when the data are imbalanced [8]. Both precision and recall are helpful in cases where there is a class-imbalance in the observations. The precision and recall are focused on the positive class (the minority class) and are unconcerned with the true negatives (majority class). Therefore, the PRC was not impacted by the addition of majority classes. Compared with the AUC value of multi-classification in the initial class-imbalanced dataset, the VPD system with FC-SMOTE improves all the models’ AUC values. Our method increases the AUC values of LR, NB, DT, SVM, KNN, RF, XGBoost, GBDT, MLP, and CNN in multi-classification from 0.44, 0.41, 0.26, 0.48, 0.43, 0.49, 0.36, 0.33, 0.47, and 0.43, respectively, to 0.73, 0.68, 0.76, 0.84, 0.75, 0.88, 0.85, 0.76, 0.76, and 0.75. The perfect test will have a PRC that passes through the upper right corner (corresponding to 100% precision and 100% recall). Generally, the closer a PRC is to the upper right corner, the better the test is. Figure 8 reports the comparison results of the AUC, showing that the use of the FC-SMOTE algorithm can greatly improve the machine learning model’s ability to detect the minority class voice samples. Meanwhile, the PRCs demonstrate that the VPD system with FC-SMOTE has a good multi-class classification ability for pathological voices and illustrates that FC-SMOTE has a high ability to improve the multi-classification efficiency. Furthermore, the PRC curve in Figure 8d shows the AUC for the binary classification with FC-SMOTE. It can be seen that the AUC can reach 1.00 in most models. Additionally, this indicates that the VPD system with the FC-SMOTE algorithm used in this paper can achieve excellent results in the diagnosis of pathological voice.
Subsequently, to widen the problem scope and verify the applicability of the proposed method, we experimented with the same scenario in the SVD database. For the multi-classification system, Table 9 and Table 10 present the model evaluation measures of each classifier without and with the C-SMOTE algorithm by 10-fold cross-validation in the SVD database. In the experiment based on the MEEI database, we set up an external dataset to prove the effectiveness of the FC-SMOTE algorithm in generating samples. Therefore, in the SVD database experiment no external dataset was set to repeat this verification experiment.
The results in Table 9 show that pathological voice classification with a class-imbalanced dataset cannot obtain good results in these typical machine learning models. This problem also exists in the SVD database. As can be seen from Table 9 and Table 10 regarding the time consumption of the machine learning model of the SVD database, although the performance of the deep model obtained the best results, the training time was also significantly extended compared to that of the other two types of models. Therefore, in our opinion, the ensemble learning model with a sub-optimal performance is still a preferred choice for pathological voice detection and classification. Besides this, the overall performance of the machine learning model in the SVD database is lower than that in the MEEI database, which may be due to the higher complexity of the data in the SVD database. This is because there are multiple types of speech disorders in the same voice sample in the SVD database, resulting in classifiers that do not classify well. The data complexity of the two databases can be shown indirectly through the sample point distribution in Figure 4. Thus, in the result of the SVD database, the model based on deep learning is better than the other learning models, and MLP yields good results for recall (0.75), specificity (0.94), G value (0.84), and value (0.76), which are better than those of the other models. However, it is worth noting that compared with the result of non-sampling, the performance of the VPD system constructed by the FC-SMOTE algorithm was significantly improved.
Similarly, the binary classification results of the 10-fold cross-validation before and after the FC-SMOTE treatment are shown in Table 10 and Table 11, respectively. Table 11 and Table 12 show that the ten machine learning models with the FC-SMOTE algorithm in the SVD database perform better than the non-sampling models. The model evaluation measures produced by CNN are all 0.90, which is a little higher than that of other models. Thus, it can be concluded that the proposed method can effectively improve the performance of the pathological voice diagnosis model.
To further demonstrate the effectiveness of FC-SMOTE in solving the problem of a class-imbalanced database, a comparison is made with SMOTE and two typical SMOTE-based extension approaches: Borderline-SMOTE and ADASYN. Table 13 shows the performance of SMOTE, Borderline-SMOTE, ADASYN, and the proposed FC-SMOTE with the optimal classifier in binary and multi-class pathological voice classification in the MEEI and SVD databases. The results show that our proposed FC-SMOTE method outperforms the other three methods by 0.02–0.17 and 0.03–0.14 in terms of the model evaluation measure in the MEEI and SVD databases, respectively. Thus, it can be concluded that the proposed method outperforms SMOTE, Borderline-SMOTE, and ADASYN in class-imbalanced pathological voice detection and classification.
4. Discussion
We considered the serious class-imbalance in the MEEI database, an international standardized database for pathological voice detection research. Researchers have ignored this problem in the past. Therefore, using Acc as the main model evaluation measure in most research on modeling VPD systems is misleading. This paper proposed a fuzzy clustering algorithm-based SMOTE oversampling technology to balance classes for a pathological voice database with a class-imbalance. The FC-SMOTE algorithm improves the SMOTE technique, which avoids unnecessary noise and classifier underfitting and overcomes the imbalanced data distribution between and within classes. FC-SMOTE has shown a good performance in processing class-imbalanced datasets with a high overlap density, such as in pathological voice samples.
In the research on pathological voice detection, most current works have regarded pathological voice detection as a binary classification whose results are only output as normal and pathological voice, and there is less research on multi-classification between different pathologies. Table 14 presents some of the performances in existing works on pathological voice detection based on cross-validation in the MEEI database. In Table 14, recall and specificity indicate the recognition ability of the classifier for the minority class and the majority class, respectively. These works were conducted in an imbalanced dataset, with notable deviations between recall and specificity ranging from 0.20 to 0.64. Our proposed method improves the recall and specificity by 0.04–0.65 and 0.00–0.07, respectively, compared to the performance in existing works.
In summary, our VPD system used the FC-SMOTE algorithm to handle the multi-class imbalanced data in the MEEI database and verified the generalization ability of the algorithm through a set of standard machine learning classifiers. In the multi-classification of vocal cord nodules, vocal cord polyps, vocal cord edema, and vocal cord paralysis, compared with a VPD system without FC-SMOTE algorithm, all the performance measures of our VPD system with the FC-SMOTE algorithm in terms of recall, specificity, G value, value, and AUC/PRC are higher than the former. This justifies our claim that the proposed method is a promising strategy for voice pathological multi-class classification. Additionally, biomedical engineering is applied to pathological voice detection to solve class-imbalances in limited pathological voice databases.
5. Conclusions
This paper proposes a VPD system combined with an FC-SMOTE imbalanced learning algorithm. The FC-SMOTE combines the fuzzy c-means clustering algorithm with SMOTE. By analyzing the distribution between and within classes of the samples, different oversampling treatments are applied to minority class samples. The empirical experiment is firstly carried out in the MEEI database. A set of machine learning models are evaluated and validated using the resulting class-balanced dataset as an input, and a set of reasonable metrics is selected for model evaluation measures. Meanwhile, the effectiveness of FC-SMOTE is tested on an external validation set of the MEEI database. The experiment results are evaluated by the model evaluation measures recall, specificity, G value, value, and AUC/PRC, which are reasonable metrics for class-imbalanced learning. The experimental results show that the VPD system without the FC-SMOTE algorithm has a very poor performance in recognizing minority classes and can hardly multi-classify pathological voices types. The VPD system with FC-SMOTE is an effective method to build a multi-classification model of pathological voice, which means that the VPD model can learn minority classes better to improve the VPD system’s performance. Subsequently, to broaden the scope of the problem and maximize the applicability of the proposed method, the same experiment using the proposed method was conducted in the SVD database. The results again verify the effectiveness of our proposed method. Finally, the performance of FC-SMOTE and traditional oversampling algorithms are discussed. In pathological voice detection and classification, FC-SMOTE shows a better performance than traditional oversampling methods.
In future research, our method can be applied to assist clinicians in diagnosing pathological voices, solving the problem of insufficient medical resources and shortening the diagnosis time for patients. Besides this, FC-SMOTE can further learn more pathological voice types to propose an effective VPD system for more types of class-imbalanced pathological voice multi-classification problems.
Author Contributions
Conceptualization, Z.F. and X.Z.; methodology, Z.F.; software, Z.F.; validation, Y.W., C.Z. and Z.T.; data curation, Y.W., C.Z.; writing—original draft preparation, Z.F.; writing—review and editing, Z.F.; visualization, Z.F; supervision, X.Z. and Z.T.; project administration, Z.T.; funding acquisition, Z.T. All authors have read and agreed to the published version of the manuscript.
Funding
This research was funded by the National Natural Science Foundation of China under Grant No. 61271359.
Institutional Review Board Statement
Not applicable.
Informed Consent Statement
Not applicable.
Data Availability Statement
The MEEI database is commercialized and not publicly available. The SVD database, Available online: http://www.stimmdatenbank.coli.uni-saarland.de (accessed on 12 April 2021).
Conflicts of Interest
The authors declare no conflict of interest.
References
- Gerratt, B.R.; Kreiman, J. Measuring vocal quality with speech synthesis. J. Acoust. Soc. Am. 2000, 110, 2560–2566. [Google Scholar] [CrossRef] [Green Version]
- Miliaresi, I.; Poutos, K.; Pikrakis, A. Combining acoustic features and medical data in deep learning networks for voice pathology classification. In Proceedings of the 2020 28th European Signal Processing Conference (EUSIPCO), Amsterdam, The Netherlands, 18–22 January 2021; pp. 1190–1194. [Google Scholar]
- Khan, M.A.; Kim, J. Toward Developing Efficient Conv-AE-Based Intrusion Detection System Using Heterogeneous Dataset. Electronics 2020, 9, 1771. [Google Scholar] [CrossRef]
- Mukherjee, H.; Ghosh, S.; Dhar, A.; Obaidullah, S.M.; Roy, K. Shallow Convolutional Neural Network for COVID-19 Outbreak Screening Using Chest X-rays. Cogn. Comput. 2021, 1–14. [Google Scholar] [CrossRef]
- Eye, M.; Infirmary, E. Voice Disorders Database; Version. 1.03 (cd-rom); Kay Elemetrics Corporation: Lincoln Park, NJ, USA, 1994. [Google Scholar]
- Islam, R.; Tarique, M.; Abdel-Raheem, E. A Survey on Signal Processing Based Pathological Voice Detection Techniques. IEEE Access 2020, 8, 66749–66776. [Google Scholar] [CrossRef]
- Chicco, D.; Jurman, G. The advantages of the Matthews correlation coefficient (MCC) over F1 score and accuracy in binary classification evaluation. BMC Genom. 2020, 21, 1–13. [Google Scholar] [CrossRef] [PubMed] [Green Version]
- Vandewiele, G.; Dehaene, I.; Kovács, G.; Sterckx, L.; Demeester, T. Overly optimistic prediction results on imbalanced data: A case study of flaws and benefits when applying over-sampling. Artif. Intell. Med. 2021, 111, 101987. [Google Scholar] [CrossRef]
- Jing, X.Y.; Zhang, X.; Zhu, X.; Wu, F.; You, X.; Gao, Y.; Shan, S.; Yang, J.Y. Multiset feature learning for highly imbalanced data classification. IEEE Trans. Pattern Anal. Mach. Intell. 2019, 43, 139–156. [Google Scholar] [CrossRef] [PubMed]
- Chui, K.T.; Lytras, M.; Vasant, P. Combined Generative Adversarial Network and Fuzzy C-Means Clustering for MultiClass Voice Disorder Detection with an Imbalanced Dataset. Appl. Sci. 2020, 10, 4571. [Google Scholar] [CrossRef]
- Fan, Z.; Qian, J.; Sun, B.; Wu, D.; Xu, Y.; Tao, Z. Modeling Voice Pathology Detection Using Imbalanced Learning. In Proceedings of the 2020 International Conference on Sensing, Measurement and Data Analytics in the era of Artificial Intelligence (ICSMD), Xi’an, China, 15–17 October 2020; pp. 330–334. [Google Scholar]
- Sun, J.A.; Li, H.B.; Fh, C.; Fu, B.D.; Ai, W.E. Class-imbalanced dynamic financial distress prediction based on Adaboost-SVM ensemble combined with SMOTE and time weighting. Inf. Fusion 2020, 54, 128–144. [Google Scholar] [CrossRef]
- Han, W.; Huang, Z.; Li, S.; Jia, Y. Distribution-Sensitive Unbalanced Data Oversampling Method for Medical Diagnosis. J. Med. Syst. 2019, 43, 39. [Google Scholar] [CrossRef]
- Kemal, P. imilarity-based attribute weighting methods via clustering algorithms in the classification of imbalanced medical datasets. Neural Comput. Appl. 2018, 30, 987–1013. [Google Scholar] [CrossRef]
- Zhang, Y.; Qiao, S.; Nan, R.; Han, D.; Liu, J. How to balance the bioinformatics data: Pseudo-negative sampling. BMC Bioinform. 2019, 20, 695. [Google Scholar] [CrossRef] [PubMed]
- Wang, Q.; Tian, Y.; Liu, D. Adaptive FH-SVM for Imbalanced Classification. IEEE Access 2019, 7, 130410–130422. [Google Scholar] [CrossRef]
- Maeda, K.; Takahashi, S.; Ogawa, T.; Haseyama, M. Distress classification of class-imbalanced inspection data via correlation-maximizing weighted extreme learning machine. Adv. Eng. Inform. 2018, 37, 79–87. [Google Scholar] [CrossRef]
- Gan, D.; Shen, J.; An, B.; Xu, M.; Liu, N. Integrating TANBN with cost sensitive classification algorithm for imbalanced data in medical diagnosis. Comput. Ind. Eng. 2020, 140, 106266. [Google Scholar] [CrossRef]
- Zhang, T.; Li, Y.; Wang, X. Gaussian prior based adaptive synthetic sampling with non-linear sample space for imbalanced learning. Knowl. Based Syst. 2019, 191, 105231. [Google Scholar] [CrossRef]
- Tao, X.; Li, Q.; Ren, C.; Guo, W.; Li, C.; He, Q.; Liu, R.; Zou, J. Real-value negative selection over-sampling for imbalanced data set learning. Expert Syst. Appl. 2019, 129, 118–134. [Google Scholar] [CrossRef]
- Lu, W.A.; Chong, W.B. Dynamic imbalanced business credit evaluation based on Learn++ with sliding time window and weight sampling and FCM with multiple kernels. Inf. Sci. 2020, 520, 305–323. [Google Scholar]
- Guo, H.; Li, Y.; Shang, J.; Mingyun, G.; Yuanyue, H.; Bing, G. Learning from class-imbalanced data: Review of methods and applications. Expert Syst. Appl. 2017, 73, 220–239. [Google Scholar]
- Chawla, N.V.; Bowyer, K.W.; Hall, L.O.; Kegelmeyer, W.P. SMOTE: Synthetic minority over-sampling technique. J. Artif. Intell. Res. 2002, 16, 321–357. [Google Scholar] [CrossRef]
- Fernández, A.; Garcia, S.; Herrera, F.; Chawla, N.V. SMOTE for learning from imbalanced data: Progress and challenges, marking the 15-year anniversary. J. Artif. Intell. Res. 2018, 61, 863–905. [Google Scholar] [CrossRef]
- Hui, H.; Wang, W.Y.; Mao, B.H. Borderline-SMOTE: A New Over-Sampling Method in Imbalanced Data Sets Learning. In Proceedings of the 2005 International Conference on Advances in Intelligent Computing, Hefei, China, 23–26 August 2005; Volume Part I. [Google Scholar]
- He, H.; Bai, Y.; Garcia, E.A.; Li, S. ADASYN: Adaptive synthetic sampling approach for imbalanced learning. In Proceedings of the 2008 IEEE International Joint Conference on Neural Networks (IEEE World Congress on Computational Intelligence), Hong Kong, China, 1–8 June 2008; pp. 1322–1328. [Google Scholar]
- Dong, Y.; Wang, X. A New Over-Sampling Approach: Random-SMOTE for Learning from Imbalanced Data Sets. In Proceedings of the International Conference on Knowledge Science, Engineering and Management, Dalian, China, 10–12 August 2011. [Google Scholar]
- Ryoo, J.H.; Park, S.; Kim, S.; Ryoo, H.S. Efficiency of Cluster Validity Indexes in Fuzzy Clusterwise Generalized Structured Component Analysis. Symmetry 2020, 12, 1514. [Google Scholar] [CrossRef]
- Mahmoudi, M.R.; Baleanu, D.; Qasem, S.N.; Mosavi, A.; Band, S.S. Fuzzy clustering to classify several time series models with fractional Brownian motion errors. Alex. Eng. J. 2021, 60, 1137–1145. [Google Scholar] [CrossRef]
- Postorino, M.N.; Versaci, M. A Geometric Fuzzy-Based Approach for Airport Clustering. Adv. Fuzzy Syst. 2014, 2014, 201243.1–201243.12. [Google Scholar] [CrossRef] [Green Version]
- Askari, S. Fuzzy C-Means clustering algorithm for data with unequal cluster sizes and contaminated with noise and outliers: Review and development. Expert Syst. Appl. 2020, 165, 113856. [Google Scholar]
- Zhao, J.; Liu, N. Semi-supervised Classification Based Mixed Sampling for Imbalanced Data. Open Phys. 2019, 17, 975–983. [Google Scholar] [CrossRef]
- Tao, X.; Li, Q.; Guo, W.; Ren, C.; He, Q.; Liu, R.; Zou, J.R. Adaptive weighted over-sampling for imbalanced datasets based on density peaks clustering with heuristic filtering. Inf. Sci. 2020, 519, 43–73. [Google Scholar] [CrossRef]
- Jia, S.; Huang, X.; Qin, S.; Song, Q. A bi-directional sampling based on K-means method for imbalance text classification. In Proceedings of the 2016 IEEE/ACIS 15th International Conference on Computer and Information Science (ICIS), Okayama, Japan, 26–29 June 2016. [Google Scholar]
- Georgios, D.; Fernando, B.; Felix, L. Improving imbalanced learning through a heuristic oversampling method based on k-means and SMOTE. Inf. Ences 2018, 465, 1–20. [Google Scholar]
- Li, Q.; Yang, Y.; Lan, T.; Zhu, H.; Yang, H. MSP-MFCC: Energy-Efficient MFCC Feature Extraction Method with Mixed-Signal Processing Architecture for Wearable Speech Recognition Applications. IEEE Access 2020. [Google Scholar] [CrossRef]
- Fang, S.H.; Tsao, Y.; Hsiao, M.J.; Chen, J.Y.; Lai, Y.H.; Lin, F.C.; Wang, C.T. Detection of Pathological Voice Using Cepstrum Vectors: A Deep Learning Approach. J. Voice 2018, 33, 634–641. [Google Scholar] [CrossRef]
- Mukherjee, H.; Obaidullah, S.M.; Santosh, K.C.; Phadikar, S.; Roy, K. A lazy learning-based language identification from speech using MFCC-2 features. Int. J. Mach. Learn. Cybern. 2019, 33, 634–641. [Google Scholar] [CrossRef]
- Davis, S.; Mermelstein, P. Comparison of parametric representations for monosyllabic word recognition in continuously spoken sentences. Acoust. Speech Signal Process. IEEE Trans. 1980, 28, 357–366. [Google Scholar] [CrossRef] [Green Version]
- Gautheron, L.; Habrard, A.; Morvant, E.; Sebban, M. Metric Learning from Imbalanced Data with Generalization Guarantees. Pattern Recognit. Lett. 2020, 133, 298–304. [Google Scholar] [CrossRef]
- Barry, J.; Püutzer, M. Saarbrucken Voice Database. Institute of Phonetics, Univ. of Saarland. Available online: http://www.stimmdatenbank.coli.uni-saarland.de/ (accessed on 4 April 2021).
- Snoek, J.; Larochelle, H.; Adams, R.P. Practical bayesian optimization of machine learning algorithms. arXiv 2012, arXiv:1206.2944. [Google Scholar]
- Kadiri, S.R.; Alku, P. Analysis and Detection of Pathological Voice Using Glottal Source Features. IEEE J. Sel. Top. Signal Process. 2020, 14, 367–379. [Google Scholar] [CrossRef] [Green Version]
- Amami, R.; Smiti, A. An incremental method combining density clustering and support vector machines for voice pathology detection. Comput. Electr. Eng. 2017, 57, 257–265. [Google Scholar] [CrossRef]
- Arias-Londoño, J.D.; Godino-Llorente, J.I.; Sáenz-Lechón, N.; Osma-Ruiz, V.; Castellanos-Domínguez, G. Automatic detection of pathological voices using complexity measures, noise parameters, and mel-cepstral coefficients. IEEE Trans. Biomed. Eng. 2010, 58, 370–379. [Google Scholar] [CrossRef]
- Al-Nasheri, A.; Muhammad, G.; Alsulaiman, M.; Ali, Z.; Mesallam, T.A.; Farahat, M.; Malki, K.H.; Bencherif, M.A. An investigation of multidimensional voice program parameters in three different databases for voice pathology detection and classification. J. Voice 2017, 31, 113-e9. [Google Scholar] [CrossRef] [PubMed]
- Nasheri, A.A.; Muhammad, G.; Alsulaiman, M.; Ali, Z.; Malki, K.; Mesallam, T.; Farahat, M. Voice Pathology Detection and Classification using Auto-correlation and entropy features in Different Frequency Regions. IEEE Access 2017. [Google Scholar] [CrossRef]
- Barreira, R.; Ling, L.L. Kullback–Leibler divergence and sample skewness for pathological voice quality assessment. Biomed. Signal Process. Control 2020, 57, 101697. [Google Scholar] [CrossRef]
- Cordeiro, H.T.; Fonseca, J.M.; Guimares, I.C.R.P.; Meneses, C. Voice pathologies identification speech signals, features and classifiers evaluation. In Proceedings of the Signal Processing: Algorithms, Architectures, Arrangements, and Applications (SPA), Poznan, Poland, 23–25 September 2015. [Google Scholar]
Figure 1.
The architecture of the voice pathology detection (VPD) system using machine learning.

Figure 2.
(a) SMOTE may generate noise sample (k = 2). (b) fuzzy clustering synthetic minority oversampling technique algorithm (FC-SMOTE) synthesizes new minority samples in safe areas.
Figure 2.
(a) SMOTE may generate noise sample (k = 2). (b) fuzzy clustering synthetic minority oversampling technique algorithm (FC-SMOTE) synthesizes new minority samples in safe areas.

Figure 3.
The flowchart of FC-SMOTE.

Figure 4.
Sample point distribution (a) before and (b) after using FC-SMOTE in the database; sample point distribution (c) before and (d) after using FC-SMOTE in the Saarbruecken Voice Database (SVD) database.
Figure 4.
Sample point distribution (a) before and (b) after using FC-SMOTE in the database; sample point distribution (c) before and (d) after using FC-SMOTE in the Saarbruecken Voice Database (SVD) database.

Figure 5.
The multi-class confusion matrices of logistic regression(LR), naive Bayes (NB), decision tree (DT), support vector machine (SVM), K nearest neighbours (KNN), multi-layer perceptron (MLP) and random forest (RF) after FC-SMOTE processing.
Figure 5.
The multi-class confusion matrices of logistic regression(LR), naive Bayes (NB), decision tree (DT), support vector machine (SVM), K nearest neighbours (KNN), multi-layer perceptron (MLP) and random forest (RF) after FC-SMOTE processing.

Figure 6.
The binary classification confusion matrices of LR, NB, DT, SVM, KNN, MLP, and RF in the initial class-imbalanced dataset.
Figure 6.
The binary classification confusion matrices of LR, NB, DT, SVM, KNN, MLP, and RF in the initial class-imbalanced dataset.

Figure 7.
The binary classification confusion matrices of LR, NB, DT, SVM, KNN, MLP, and RF in the class-balanced dataset.
Figure 7.
The binary classification confusion matrices of LR, NB, DT, SVM, KNN, MLP, and RF in the class-balanced dataset.

Figure 8.
(a) Precision-recall curves for multi-class without FC-SMOTE. (b) Precision—recall curves for multi-class with FC-SMOTE. (c) Precision–recall curves for binary classification without FC-SMOTE. (d) Precision–recall curves for binary classification with FC-SMOTE.
Figure 8.
(a) Precision-recall curves for multi-class without FC-SMOTE. (b) Precision—recall curves for multi-class with FC-SMOTE. (c) Precision–recall curves for binary classification without FC-SMOTE. (d) Precision–recall curves for binary classification with FC-SMOTE.


Table 1.
The primary information in the Massachusetts Eye and Ear Infirmary (MEEI) database.
| Signal Characteristics | Information Included | Binary Classification | Multiple Classification |
|---|---|---|---|
| 1–3 s recording time, 25 or 50 kHz sampling frequency | Gender, Age, Clinical diagnosis | 53 normal samples, 149 pathological samples | 19 vocal cord nodules samples, 20 vocal cord polyps samples, 43 vocal cord edema samples, 67 vocal cord paralysis samples |
Table 2.
The primary information in the SVD database.
| Signal Characteristics | Information Included | Binary Classification | Multiple Classification |
|---|---|---|---|
| 16-bits resolution, 50 kHz sampling frequency | Gender, Age, Clinical diagnosis | 687 normal samples, 194 pathological samples | 17 vocal cord nodules samples, 45 vocal cord polyps samples, 68 vocal cord edema samples, 64 vocal cord paralysis samples |
Table 3.
The main hyperparameters of each model (except for the convolutional neural network (CNN), other parameters of the model are the default values in Scikit-learn).
Table 3.
The main hyperparameters of each model (except for the convolutional neural network (CNN), other parameters of the model are the default values in Scikit-learn).
| Model | Main Hyperparameters | Search Area |
|---|---|---|
| LR | L2-norm parameter | [0.001, 0.1] |
| NB | Smoothing parameter | [0, 2.0] |
| DT | Number of estimators Maximum depth | [10, 100] [2, 20] |
| SVM | Penalty parameter Kernel parameter | [10, 10] [0.1, 3.0] |
| KNN | Number of neighbors | [1, 10] |
| RF | Number of estimators Maximum depth | [10, 500] [2, 30] |
| XGBoost | Number of trees estimators Maximum depth L1-norm parameter L2-norm parameter | [10, 300] [2, 20] [0.001, 0.1] [0.001, 0.1] |
| GBDT | Number of estimators Maximum depth Minimum samples in the leaf node | [10, 100] [2, 30] [10, 100] |
| MLP | Three hidden layers with relu activation functions (50 neurons for each layer); The weight optimization with lbfgs optimizer; The learning rate is 0.001; The maximum number of iterations is 700 | |
| CNN | Four consecutively convolutional layers with ReLu activation functions (64, 64, 32, 32 convolutional masks for each layer, each convolutional masks with a kernel of size 3 × 3); Four max pooling layers with size 2 × 2; One dense layer with 1024 nodes (each node with ReLu activation function); One softmax output layer with four neurons | |
Table 4.
Number of samples of the experimental dataset.
| Database | Case | 10-Fold Cross-Validation (Class-Imbalanced/Class-Balanced) | External Validation Tarining/Test Set |
|---|---|---|---|
| MEEI | Binary | Normal: 47/136 Pathological: 136/136 | Normal: 136/8 Pathological: 136/13 |
| Multi-class | Nodules: 17/60, Polyps: 18/60 Edema: 39/60, Paralysis: 60/60 | Nodules: 60/2, Polyps: 60/2 Edema: 60/4, Paralysis: 60/7 | |
| SVD | Binary | Normal: 687/687 Pathological: 194/687 | |
| Multi-class | Nodules: 17/68, Polyps: 45/68 Edema: 68/68, Paralysis: 64/68 |
Table 5.
The confusion matrix.
| Actual Classes | Prediction Results | |
|---|---|---|
| Positive Class | Negative Class | |
| Positive class | ||
| Negative class | ||
Table 6.
Evaluation measures of each machine learning model in the multi-imbalanced MEEI dataset.
| LR | NB | DT | SVM | KNN | RF | XGBoost | GBDT | MLP | CNN | |
|---|---|---|---|---|---|---|---|---|---|---|
| Recall | 0.31 | 0.41 | 0.25 | 0.28 | 0.33 | 0.30 | 0.27 | 0.33 | 0.30 | 0.33 |
| Specificity | 0.78 | 0.82 | 0.77 | 0.76 | 0.79 | 0.77 | 0.78 | 0.79 | 0.78 | 0.78 |
| G value | 0.48 | 0.58 | 0.44 | 0.46 | 0.51 | 0.46 | 0.45 | 0.50 | 0.48 | 0.47 |
| value | 0.41 | 0.41 | 0.29 | 0.48 | 0.42 | 0.44 | 0.40 | 0.34 | 0.42 | 0.41 |
| Time(s) | 0.45 | 0.23 | 0.44 | 0.32 | 0.27 | 7.81 | 6.25 | 11.29 | 19.25 | 25.49 |
Table 7.
Evaluation measures of each machine learning model in the multi-class balanced MEEI dataset.
Table 7.
Evaluation measures of each machine learning model in the multi-class balanced MEEI dataset.
| LR | NB | DT | SVM | KNN | RF | XGBoost | GBDT | MLP | CNN | |
|---|---|---|---|---|---|---|---|---|---|---|
| Recall | 0.72 | 0.70 | 0.78 | 0.82 | 0.72 | 0.83 | 0.82 | 0.74 | 0.72 | 0.73 |
| Specificity | 0.92 | 0.90 | 0.93 | 0.95 | 0.92 | 0.95 | 0.95 | 0.93 | 0.92 | 0.90 |
| G value | 0.81 | 0.79 | 0.85 | 0.88 | 0.80 | 0.88 | 0.88 | 0.83 | 0.82 | 0.81 |
| value | 0.76 | 0.68 | 0.79 | 0.85 | 0.76 | 0.86 | 0.85 | 0.80 | 0.77 | 0.77 |
| Time(s) | 0.73 | 0.12 | 0.38 | 0.39 | 1.29 | 18.72 | 19.29 | 16.16 | 27.77 | 54.60 |
Table 8.
Evaluation measures of each machine learning model in the normal and pathological voice class-balanced MEEI dataset.
Table 8.
Evaluation measures of each machine learning model in the normal and pathological voice class-balanced MEEI dataset.
| LR | NB | DT | SVM | KNN | RF | XGBoost | GBDT | MLP | CNN | |
|---|---|---|---|---|---|---|---|---|---|---|
| Recall | 0.96 | 0.97 | 0.98 | 0.99 | 0.98 | 1.00 | 0.98 | 0.98 | 0.99 | 0.97 |
| Specificity | 0.96 | 0.98 | 0.99 | 0.98 | 0.99 | 1.00 | 0.98 | 0.98 | 0.98 | 0.97 |
| G value | 0.96 | 0.98 | 0.99 | 0.99 | 0.98 | 0.99 | 0.98 | 0.99 | 0.99 | 0.97 |
| value | 0.95 | 0.97 | 0.98 | 0.98 | 0.98 | 1.00 | 0.98 | 0.99 | 0.99 | 0.96 |
| Time(s) | 0.35 | 0.23 | 0.42 | 0.41 | 0.34 | 8.32 | 5.76 | 7.52 | 15.32 | 34.17 |
Table 9.
Evaluation measures of each machine learning model in the multi-class imbalanced SVD dataset.
Table 9.
Evaluation measures of each machine learning model in the multi-class imbalanced SVD dataset.
| LR | NB | DT | SVM | KNN | RF | XGBoost | GBDT | MLP | CNN | |
|---|---|---|---|---|---|---|---|---|---|---|
| Recall | 0.47 | 0.33 | 0.28 | 0.41 | 0.37 | 0.45 | 0.31 | 0.33 | 0.31 | 0.37 |
| Specificity | 0.82 | 0.79 | 0.75 | 0.79 | 0.80 | 0.79 | 0.78 | 0.80 | 0.78 | 0.84 |
| G value | 0.61 | 0.49 | 0.45 | 0.56 | 0.54 | 0.53 | 0.48 | 0.51 | 0.48 | 0.55 |
| value | 0.43 | 0.31 | 0.32 | 0.49 | 0.45 | 0.42 | 0.40 | 0.42 | 0.40 | 0.42 |
| Time(s) | 0.69 | 0.24 | 0.49 | 0.34 | 0.30 | 8.25 | 13.70 | 8.35 | 8.41 | 31.27 |
Table 10.
Evaluation measures of each machine learning model in the multi-class balanced SVD dataset.
Table 10.
Evaluation measures of each machine learning model in the multi-class balanced SVD dataset.
| LR | NB | DT | SVM | KNN | RF | XGBoost | GBDT | MLP | CNN | |
|---|---|---|---|---|---|---|---|---|---|---|
| Recall | 0.67 | 0.64 | 0.67 | 0.64 | 0.64 | 0.68 | 0.67 | 0.61 | 0.75 | 0.74 |
| Specificity | 0.92 | 0.89 | 0.93 | 0.88 | 0.88 | 0.93 | 0.89 | 0.87 | 0.94 | 0.91 |
| G value | 0.78 | 0.74 | 0.78 | 0.74 | 0.75 | 0.78 | 0.74 | 0.70 | 0.84 | 0.80 |
| value | 0.69 | 0.63 | 0.69 | 0.64 | 0.64 | 0.70 | 0.63 | 0.60 | 0.76 | 0.72 |
| Time(s) | 1.03 | 0.23 | 0.45 | 0.38 | 0.31 | 15.42 | 19.26 | 19.81 | 24.20 | 49.72 |
Table 11.
Evaluation measures of each machine learning model in the normal and pathological voice class-imbalanced SVD dataset.
Table 11.
Evaluation measures of each machine learning model in the normal and pathological voice class-imbalanced SVD dataset.
| LR | NB | DT | SVM | KNN | RF | XGBoost | GBDT | MLP | CNN | |
|---|---|---|---|---|---|---|---|---|---|---|
| Recall | 0.83 | 0.75 | 0.77 | 0.85 | 0.82 | 0.84 | 0.82 | 0.83 | 0.84 | 0.85 |
| Specificity | 0.51 | 0.50 | 0.58 | 0.53 | 0.53 | 0.52 | 0.52 | 0.56 | 0.63 | 0.65 |
| G value | 0.65 | 0.61 | 0.67 | 0.67 | 0.66 | 0.67 | 0.66 | 0.68 | 0.72 | 0.73 |
| value | 0.67 | 0.62 | 0.66 | 0.66 | 0.65 | 0.70 | 0.70 | 0.71 | 0.70 | 0.75 |
| Time(s) | 1.10 | 0.24 | 1.61 | 1.11 | 0.63 | 17.97 | 14.67 | 20.59 | 73.29 | 99.47 |
Table 12.
Evaluation measures of each machine learning model in the normal and pathological voice class-balanced SVD dataset.
Table 12.
Evaluation measures of each machine learning model in the normal and pathological voice class-balanced SVD dataset.
| LR | NB | DT | SVM | KNN | RF | XGBoost | GBDT | MLP | CNN | |
|---|---|---|---|---|---|---|---|---|---|---|
| Recall | 0.89 | 0.86 | 0.85 | 0.88 | 0.88 | 0.90 | 0.88 | 0.89 | 0.89 | 0.90 |
| Specificity | 0.89 | 0.86 | 0.85 | 0.87 | 0.88 | 0.90 | 0.86 | 0.89 | 0.89 | 0.90 |
| G value | 0.89 | 0.86 | 0.85 | 0.88 | 0.88 | 0.90 | 0.88 | 0.89 | 0.89 | 0.90 |
| value | 0.87 | 0.83 | 0.85 | 0.87 | 0.85 | 0.87 | 0.87 | 0.87 | 0.88 | 0.90 |
| Time(s) | 3.24 | 0.26 | 1.94 | 1.51 | 0.81 | 18.84 | 21.61 | 25.96 | 96.40 | 179.72 |
Table 13.
Performance comparison between SMOTE, Borderline-SMOTE, ADASYN, and the proposed FC-SMOTE in the MEEI database.
Table 13.
Performance comparison between SMOTE, Borderline-SMOTE, ADASYN, and the proposed FC-SMOTE in the MEEI database.
| Database | Case | SMOTE | Borderlin -SMOTE | ADASYN | The Proposed FC-SMOTE | Performance Improvement by Proposed Work |
|---|---|---|---|---|---|---|
| Model Evaluation Measure (Recall/Specificity/G Value/ Value) | ||||||
| MEEI | Binary | 0.97/0.97 /0.97/0.97 | 0.94/0.95 /0.94/0.94 | 0.96/0.97 /0.96/0.96 | 1.00/1.00 /0.99/1.00 | (0.03∼0.06)/(0.03∼0.05) /(0.02∼0.05)/(0.03∼0.06) |
| Multi-class | 0.74/0.89 /0.80/0.75 | 0.67/0.84 /0.71/0.69 | 0.74/0.89 /0.78/0.70 | 0.82/0.96 /0.88/0.86 | (0.08∼0.15)/(0.07∼0.12) (0.08∼0.17)/(0.11∼0.17) | |
| SVD | Binary | 0.86/0.87 /0.87/0.87 | 0.84/0.85 /0.84/0.84 | 0.85/0.82 /0.84/0.83 | 0.90/0.90 /0.90/0.90 | (0.04∼0.06)/(0.03∼0.08) /(0.03∼0.06)/(0.03∼0.07) |
| Multi-class | 0.72/0.86 /0.78/0.70 | 0.69/0.80 /0.74/0.69 | 0.71/0.85 /0.77/0.70 | 0.75/0.94 /0.84/0.76 | (0.03∼0.06)/(0.09∼0.14) (0.06∼0.10)/(0.06∼0.07) | |
Table 14.
Results of the methods in the MEEI database (binary classification).
| Method | Features Extraction | Pathological Samples | Normal Samples | Types of Cross-Validation | Classifier | Performance (Recall/Specificity/Acc) |
|---|---|---|---|---|---|---|
| [45] | LLE +CD | 173 | 53 | 10 folds | GMM | 0.88/0.98/0.90 |
| [46] | MDVP | 95 | 53 | 10 folds | FDR | 0.45/0.93/0.76 |
| [47] | Entropy | 101 | 53 | 10 folds | SVM | 0.86/0.95/0.91% |
| [48] | MFCC +Skeweness | 173 | 53 | 10 folds | GMM | 0.96/0.98/0.98 |
| [34] | MMTLS | 657 | 53 | 10 folds | SVM | 0.35/0.99/0.95 |
| [49] | MFCC | 118 | 36 | 4 folds | SVM | ∼/1.00/0.77 |
| Proposed Method | MFCC | 136 | 136 | 10 folds | RF | 1.00/1.00/1.00 |
Publisher’s Note: MDPI stays neutral with regard to jurisdictional claims in published maps and institutional affiliations. |
© 2021 by the authors. Licensee MDPI, Basel, Switzerland. This article is an open access article distributed under the terms and conditions of the Creative Commons Attribution (CC BY) license (https://creativecommons.org/licenses/by/4.0/).
Share and Cite
MDPI and ACS Style
Fan, Z.; Wu, Y.; Zhou, C.; Zhang, X.; Tao, Z. Class-Imbalanced Voice Pathology Detection and Classification Using Fuzzy Cluster Oversampling Method. Appl. Sci. 2021, 11, 3450. https://0-doi-org.brum.beds.ac.uk/10.3390/app11083450
AMA Style
Fan Z, Wu Y, Zhou C, Zhang X, Tao Z. Class-Imbalanced Voice Pathology Detection and Classification Using Fuzzy Cluster Oversampling Method. Applied Sciences. 2021; 11(8):3450. https://0-doi-org.brum.beds.ac.uk/10.3390/app11083450
Chicago/Turabian StyleFan, Ziqi, Yuanbo Wu, Changwei Zhou, Xiaojun Zhang, and Zhi Tao. 2021. "Class-Imbalanced Voice Pathology Detection and Classification Using Fuzzy Cluster Oversampling Method" Applied Sciences 11, no. 8: 3450. https://0-doi-org.brum.beds.ac.uk/10.3390/app11083450
Note that from the first issue of 2016, this journal uses article numbers instead of page numbers. See further details here.