Next Article in Journal
Polyisocyanurate Foam Pyrolysis and Flame Spread Modeling
Next Article in Special Issue
A Review of X-ray Microcalorimeters Based on Superconducting Transition Edge Sensors for Astrophysics and Particle Physics
Previous Article in Journal
Extended Evolutionary Algorithms with Stagnation-Based Extinction Protocol
Previous Article in Special Issue
Applications for Microwave Kinetic Induction Detectors in Advanced Instrumentation
 
 
applsci-logo
Article Menu

Article Menu

Review

Detectors and Cultural Heritage: The INFN-CHNet Experience

by
Lorenzo Giuntini
1,2,*,
Lisa Castelli
1,*,
Mirko Massi
1,*,
Mariaelena Fedi
1,
Caroline Czelusniak
1,
Nicla Gelli
1,
Lucia Liccioli
1,
Francesca Giambi
1,
Chiara Ruberto
1,2,
Anna Mazzinghi
1,2,
Serena Barone
1,2,
Francesca Marchegiani
3,
Stefano Nisi
3,
Carmine Lubritto
4,
Simona Altieri
4,
Luca Tortora
5,6,
Paolo Branchini
5,
Andrea Fabbri
5,
Valerio Graziani
5,
Sergio Barcellos Lins
5,
Laura Guidorzi
7,8,
Alessandro Lo Giudice
7,8,
Alessandro Re
7,8,
Leandro Sottili
7,8,
Antonella Balerna
9,
Mariangela Cestelli Guidi
9,
Lucilla Pronti
9,
Martina Romani
9,
Fauzia Albertin
10,11,12,
Matteo Bettuzzi
11,12,
Rosa Brancaccio
11,12,
Maria Pia Morigi
11,12,
Daniele Alloni
13,14,
Andrea Salvini
13,14,
Barbara Smilgys
13,14,
Michele Prata
13,14,
Saverio Altieri
13,15,
Maurizio Bonesini
16,17,
Daniela Di Martino
16,17,
Massimiliano Clemenza
16,17,
Massimo Carpinelli
18,
Piernicola Oliva
18,
Valeria Sipala
18,
Anna Maria Gueli
19,
Stefania Pasquale
20,
Giuseppe Stella
20,
Giancarlo Pepponi
21,
Francesco Grazzi
1,22 and
Francesco Taccetti
1
add Show full author list remove Hide full author list
1
Istituto Nazionale di Fisica Nucleare (INFN), Sezione di Firenze, Via G. Sansone 1, 50019 Firenze, Italy
2
Dipartimento di Fisica e Astronomia, Università di Firenze, Via G. Sansone 1, 50019 Firenze, Italy
3
Laboratori Nazionali del Gran Sasso, Istituto Nazionale di Fisica Nucleare (INFN), Via G. Acitelli 22, 67100 L’Aquila, Italy
4
Università degli Studi della Campania Luigi Vanvitelli Via Vivaldi 43, 81100 Caserta e Istituto Nazionale di Fisica Nucleare (INFN), Sezione di Napoli, Via C. Cintia, 80126 Naples, Italy
5
Istituto Nazionale di Fisica Nucleare (INFN), Sezione di Roma Tre, Via della Vasca Navale 84, 00146 Rome, Italy
6
Department of Sciences, Roma Tre University, Via della Vasca Navale 84, 00146 Rome, Italy
7
Dipartimento di Fisica, Università degli Studi di Torino, Via Pietro Giuria 1, 10125 Torino, Italy
8
INFN—Sezione di Torino, Via Pietro Giuria 1, 10125 Torino, Italy
9
Laboratori Nazionali di Frascati, Istituto Nazionale di Fisica Nucleare, Via Enrico Fermi 54 (già 40), 00044 Frascati, Italy
10
Museo Storico della Fisica e Centro Studi e Ricerche Enrico Fermi, Via Panisperna 89a, 00184 Rome, Italy
11
Dipartimento di Fisica e Astronomia “Augusto Righi”, Università di Bologna, Viale Berti Pichat 6/2, 40127 Bologna, Italy
12
Istituto Nazionale di Fisica Nucleare (INFN), Sezione di Bologna, Viale Berti Pichat 6/2, 40127 Bologna, Italy
13
Istituto Nazionale di Fisica Nucleare (INFN), Sezione di Pavia, Via A. Bassi 6, 27100 Pavia, Italy
14
Laboratorio Energia Nucleare Applicata—LENA, Università degli Studi di Pavia, Via Aselli 41, 27100 Pavia, Italy
15
Dipartimento di Fisica, Università degli Studi di Pavia, Via Bassi 6, 27100 Pavia, Italy
16
Dipartimento di Fisica “G. Occhialini”, Università degli Studi di Milano Bicocca, Piazza della Scienza 3, 20126 Milan, Italy
17
Istituto Nazionale di Fisica Nucleare (INFN), Sezione di Milano Bicocca, Piazza della Scienza, 3, 20126 Milan, Italy
18
Department of Chemistry and Pharmacy, Università degli Studi di Sassari, Piazza della Scienza, 3, 20126 Sassari, Italy
19
INFN Sezione di Catania, Via S. Sofia 64, 95123 Catania, Italy
20
Dipartimento di Fisica e Astronomia “Ettore Majorana”, Università degli Studi di Catania & INFN Sezione di Catania, Via S. Sofia 64, 95123 Catania, Italy
21
Fondazione Bruno Kessler, Via Sommarive, 18, 38123 Trento, Italy
22
Consiglio Nazionale delle Ricerche, Istituto di Fisica Applicata “Nello Carrara”, Via Madonna del Piano, 10, 50019 Sesto Fiorentino, Italy
*
Authors to whom correspondence should be addressed.
Submission received: 5 February 2021 / Revised: 22 March 2021 / Accepted: 27 March 2021 / Published: 12 April 2021
(This article belongs to the Special Issue Development and Application of Particle Detectors)

Abstract

:
Detectors are a key feature of the contemporary scientific approach to cultural heritage (CH), both for diagnostics and conservation. INFN-CHNet is the network of the Italian National Institute of Nuclear Physics that develops and applies new instrumentation for the study of CH. This process results in both optimized traditional state-of-the-art and highly innovative detection setups for spectrometric techniques. Examples of the former are X-rays, gamma-rays, visible-light and particles spectrometers tailored for CH applications, with optimized performances, reliability, weight, transportability, cost, absorbed power, and complementarity with other techniques. Regarding the latter, examples are ARDESIA, the array of detectors at the DAΦNE-Light facility, the MAXRS detection setup at the Riken-RAL muon beamline and the imaging facilities at the LENA Laboratory. Paths for next-generation instruments have been suggested, as in the case of the X-ray Superconductive Detectors and X-ray Microcalorimeter Spectrometers, allowing astonishing improvement in energy resolution. Many issues in CH can now be addressed thanks to scientific techniques exploiting the existing detectors, while many others are still to be addressed and require the development of new approaches and detectors.

Graphical Abstract

1. Introduction

A scientific approach to cultural heritage (CH) has led to the development and use of non-destructive or micro-destructive techniques to characterize the object under study. All these techniques are based on the detection of radiation, either emitted, transmitted, or diffracted by the sample material, which carries the information about the sample itself. Thus, analytical techniques need detectors, which are therefore the pillars of the scientific approach to CH. Over the years, detectors have undergone extraordinary improvements in terms of the type and energy of detected radiation, performances, portability, cost reduction, ease of use, and applications. This evolution has gone so far that it is now possible to have restoration laboratories where detector-based techniques are routinely used.
INFN-CHNet (https://chnet.infn.it, accessed on 31 March 2012), the Cultural Heritage Network of the Italian National Institute for Nuclear Physics (INFN), has the mission of harmonizing and enhancing the expertise of the Institute in the development and application of analytical techniques for the study and diagnostics of CH. This expertise is distributed in many of the INFN structures throughout the country. INFN-CHNet is composed of approximately twenty INFN laboratories and also includes institutions with complementary skills to those of INFN, such as restoration centers, university departments and associations. Some international research centers (currently in the United Arab Emirates, Iran, Myanmar, and Argentina) are also part of the network, making it an international infrastructure. The laboratories of INFN-CHNet have been developing and using new detectors in order to address the many questions raised by CH researchers, regarding, e.g., the correct procedures for restoration/conservation, materials and manufacturing techniques, provenance of the raw materials and material authenticity.
INFN-CHNet can now offer a wide set of analytical techniques, ranging from the most consolidated to the most innovative. This paper gives an overview of the most used techniques in the INFN-CHNet network, with special focus on the detection systems and on the choice of the solutions that best fit our needs.

2. X-ray Detectors

X-ray detectors can be divided into two main categories, photon counters and spectroscopic (energy dispersive, ED) detectors.
Photon counters are typically used in scattering experiments (e.g., XRD) or X-ray absorption measurements (number of photons impinging on the sample and transmitted photons), whereas energy dispersive detectors are most often used for X-ray emission spectrometry techniques (e.g., XRF and PIXE). Photon counters are typically gas ionization or scintillation detectors, where the photons generated in scintillating material are converted in an electrical signal by a photomultiplier (either in more conventional PM tube or in more innovative Si PM), or solid-state semiconductor detectors such as strip-detectors or hybrid pixel detectors, where the number of pixel can extend up to Mpixel and the lateral resolutions can go down to 50 μm.
Spectroscopic ED semiconductor detectors are generally based on a P-I-N diode structure. When the diode is reverse biased, a large, depleted region is formed where charges, created upon interaction with the photons, are collected by the electrodes. Designs differ mainly for the geometry of the electrodes which define the charge collection scheme. Thick P-I-N structures can be obtained by lithium diffusion into p-type silicon (SiLi detector) or germanium (GeLi detector). High-purity germanium (HPGe detector) can also be used to have thick intrinsic regions. High-resistivity silicon wafers may be used to produce P-I-N detectors up to a thickness of 1 mm. In typical designs of P-I-N-based detectors, charge travels mostly perpendicularly to the electrodes. A breakthrough in ED detectors has been the development of silicon drift detectors (SDDs). Silicon drift detectors adopt a design scheme where electrons travel laterally to reach a very small anode, compared to the sensitive area, with a great advantage in terms of capacitance and the associated noise term. The P-I-N structure is also the basis of semiconductor strip and pixel detectors, where one or both sides are segmented to obtain isolated contacts allowing the collection of charge only from a limited portion of the sensor and achieve laterally resolved detection. Every channel has then to be read independently from the others and hence independently connected to the read-out ASIC. In pixelated detectors with a high density of pixels, wire bonding becomes impossible and flip-chip (bump bonding) technologies are adopted; such detectors, called hybrid pixel or hybrid photon-counting detectors, are ideal for imaging and scattering applications. Well-known detectors in this category are those combined in ASICs, developed by the Medipix collaboration, and the detectors based on chips, developed at the Paul Scherrer Institut (PSI), which will be presented in the following Section 2.4. For a review on readout ASICs for hybrid pixel detectors, see [1].
Two parameters of crucial importance for detectors are the intrinsic detection efficiency (DE) and energy resolution (ER). The intrinsic DE is defined as DE = (number of pulses recorded)/(number of radiation quanta incident on detector). For X-rays, ER is normally defined as the full width at half maximum (FWHM) of the MnKα (5.9 keV) line of the 55Fe X source. The Fano limit for energy resolution at Mn (5.9 keV) for Ge is approximately 100 eV and it is approximately 115 eV for Si. Better energy resolutions can be obtained in superconducting detectors (transition-edge-sensor bolometer (TES), kinetic inductance detector (KID), and superconducting tunnel junction detector (STJ)). The energy of the pairing in Cooper Pairs is in the meV range and energy resolutions down to a few eVs at Mn can be obtained.
Beyond ER and DE, key performance indicators for X-ray detectors are sensitive area, spectral range (low energies, high energies), count rate capability, ‘cleanliness’ of the detector response function (peak to background or peak to tale), stability versus temperature, durability, and toughness to different environmental conditions. Depending on the application, one of the parameters may be deemed more important than others.
For energy dispersive X-ray detection, only solid-state devices are now used. Si(Li) detectors were normally exploited in the past; high-purity Ge (HPGe) detectors are still sometimes used because of the higher detection efficiency for high-energy X-rays, due to the higher Z of the active element with respect to Si detectors. Both need to be LN (Liquid Nitrogen) cooled. Si-PIN detectors are also used, but are generally less interesting, due to their globally worse performances.
Presently, the state-of-the-art detectors for X-ray spectroscopy are SDDs, which have become the typical choice in low-cost to high-end spectrometers for X-ray based analyses. They are characterized by a very low output capacitance (order of few hundreds of fF), which does not depend on the active area of the device [2]. This feature enables SDDs to have lower electronic noise with respect to conventional silicon diodes of equivalent area and thickness. Technological advancements contributed to a substantial decrease in the detectors leakage current and to design highly customized ultra-low-noise front-end electronics [3,4]. It is thus possible to obtain good energy resolution even at high counting rates and low energies. SDDs offer excellent energy resolutions (even down to 120–130 eV at 5.9 keV) at short shaping times (1 µs or less) and now even wide active areas (up to 150 mm2) are available. Maximum affordable count rates can be as high as 105 counts s−1 and above [5].
SDDs are normally Peltier cooled (operational temperature down to −30 °C/−50 °C), thus no liquid-nitrogen (LN) cooling is required, a big advantage over conventional solid-state detectors in terms of ease of use, weight, and compactness. With respect to SDDs, Si(Li)s have higher cost and lower maximum count rate, lower energy resolution and need LN cooling. However, they can feature higher efficiency for high-energy X-rays than SDDs, due to the thickness, which can reach some mm instead of the ~0.5 mm typical thickness of SDDs (1 mm thick SDDs are now also commercially available). Si-PINs are used in low-end XRF spectrometers, especially for their low cost but have low performances. HP-Ges need LN cooling. In addition, as Ge lines have higher energies than the corresponding Si lines, Ge-K escape lines (Peak Energy—9.89 keV) are much more intense than Si-K escape lines (Peak energy—1.74 keV), thus worsening the spectral response when working at excitation energies above the Ge K-edge. HpGe detectors have not been very popular, due to the higher background with respect to Si detectors, caused by to the Compton scattering in the detector active element (Compton scattering cross section is proportional to Z, the atomic number of the crossed medium, where ZSi = 14. ZGe = 32). Furthermore, they are typically bulkier, heavier, and more expensive. However, they are characterized by higher detection efficiency for higher energy radiation, due to the higher Z with respect to Si.
SDD arrays allow reducing the probability of detecting multiple photons at once i.e., they are good for high-intensity applications. Two configurations are possible: multi-channel SDD arrays, where arrays of independent detectors are assembled in a single device, and single or multiple SDD arrays, where each array is built on a single silicon wafer [6]. Multi-channel SDD arrays have been presented in a commercially available solution. Each element of the array is equipped with independent preamplifiers and digital pulse processors. These systems can reach active areas as large as 500 mm2 [7]. This solution, however, leaves some dead space between detector elements and has a quite large diameter (45 mm) without a passage for the beam. This configuration does not allow the optimization of the detector solid angle and makes it necessary to have the detector far from the beam impact point on sample. On the other side, single or multiple SDD arrays allow covering wide solid angles, much wider than in the previous configuration, minimizing dead space between detector elements. In addition, these detectors have dedicated electronics for each element and thus allow achieving high statistics in a short acquisition time with a very-high count rate. To give an example, using a 0.9 µs peaking time, while conventional SDDs typically afford a maximum output count rate (OCR) of approcimately 100 kcounts/s, a complete multi-element SDD array can result in an OCR as high as 8 Mcounts/s [8], while maximizing the collection solid angle. However, at present, they are not as widespread as expected, due to their high cost. In this regard, it is worth mentioning MAIA, a sensor array of 384 diodes, 1 × 1 mm2, built on high-resistivity silicon, which is 400 μm thick, arranged symmetrically around a central (with a diameter of 2.4 mm) hole for the beam, which has been developed mainly for earth sciences problems [9,10]. Large spectroscopic detector arrays based on the pn-CCD (Charge Coupled Device) architecture are also available, offering hundreds of thousand 75 μm pixels with energy resolution as good as 145 eV at Mn [11].
As already mentioned, SDDs have excellent energy resolution when compared to all the other ED detectors. However, there are cases where lines overlap, thus limiting the capacity of the X-ray based analytical techniques; see, e.g., the S K lines (2308 eV) and the Pb M lines (2346 eV). X-ray Superconductive Detectors (SD) may allow overcoming many of these problems, due to their superior energy resolution, typically below 20 eV and which can be as low as few eV [12]. These systems are very expensive, cumbersome, heavy and of big dimensions, but are nevertheless appealing for their high resolution. SDs are not very common in the community working with techniques exploiting X-ray detection, but they have started to be used. Since 2010, some applications of high-resolution PIXE have been presented [13,14,15,16]. Very recently, an application to a problem of interest in CH has been presented. Quantitative speciation of chemical elements in cultural heritage samples is a challenging issue, of great interest for example for unravelling forgeries. In PIXE with SDDs, the determination of chemical species is in principle not possible, due to insufficient energy resolution, but high-resolution PIXE, based on state-of-the-art X-ray Microcalorimeter Spectrometers (XMSs), has demonstrated to be able to study chemical speciation [17]. SDDs allow for simultaneous detection of all the elements from Na (Z = 11) up. Element detection is accomplished using either K or L lines, depending on energy. SDDs active elements have a typical thickness of approximately 500 μm, which corresponds to 100% detection efficiency for X-ray energies below 10 keV (~1.5 10−7 transmission). The efficiency decrease for high-energy X-ray detection is due to the decrease in the X-ray absorption with increasing energy. However, quite recently (see below for example the Ardesia description), 100% detection efficiency beyond 10 keV has been achieved, thanks to the development of innovative SDD detectors with thickness increased up to 1000 μm (~1.5 10−7 transmission).
The decrease in detection efficiency below 1 keV is due to the absorption of low-energy X-rays in the path from the emission point to the detector active area. Absorption in the entrance window in front of the detector active element is the critical issue for low Z elements detection in vacuum and also for external detection setups its effect cannot be typically neglected. The window must provide high mechanical robustness and gas tightness, in addition to low absorption of low-energy X-rays. The standard solution to meet all these requirements is provided by coated (e.g., Paralyne coated), passivated, thin (from 7–8 μm up) Beryllium foils [18,19].
However, thin Be windows are highly toxic and extremely brittle, a feature strongly limiting their use. Alternatives have been proposed and are also commercially available. High-performance polymers allow for low Z element detection down to Be [20,21]. Diamond membranes are also used. Silicon nitride Si3N4 windows have been introduced [22,23]. Recently, the use of light-tight, ultra-thin graphene windows supported by a silicon grid has been demonstrated [24]. A study where the performances of graphenic, Si3N4 and polymeric windows are compared is reported in [25].
As a whole, available SDD detectors are now easily able to detect elements down to C and, in special cases, even to lower Z elements. However, although having a good transmission of low-energy X-rays is also of high interest for CH, it has to be remembered that X-ray absorption takes place also in the sample, normally thick, and in the atmosphere from sample to detector, two effects which make of limited interest further reducing the window thickness.

2.1. X-ray Detectors—PIXE

Based on the detection of characteristic X-rays induced in the target material by MeV particle beams, Particle-Induced X-ray Emission (PIXE) is an analytical technique that enables detecting/quantifying elemental composition of sample [26,27]. PIXE is possibly the most used ion beam analysis technique for CH. Easy to setup and to use, ion beam analysis can detect all the elements from Na onwards. PIXE can provide qualitative/quantitative results and is characterized by high sensitivity and accuracy. Analyses can be performed in relatively short times, in a non-destructive and non-invasive way. This last feature is mainly due to the adoption of external beam setup, where both detectors and sample are maintained out of vacuum, thus avoiding/limiting effects such as heating, selective sublimation/evaporation, charging etc. This technique has been used for CH to study many different samples, such as paintings [28,29,30,31,32,33,34], metal point drawings [35,36], precious [37,38,39,40] and semi-precious stones [41,42,43,44,45], ancient coins [46,47,48], precious metals [49,50,51,52], ancient bronze statues [53,54], terracotta, pottery, and clay [55,56,57,58,59], and ancient manuscripts [60,61,62,63].
In the PIXE technique, X-rays produced by low Z elements, and thus with low energy, can escape from the sample only if they are produced in the shallower layers of the sample. On the contrary, the higher the atomic number of the emitting element, the higher the energy and thus the depth from which they can escape. To sum, low Z elements can be detected only in the shallower part of the sample and heavy elements also in deeper layers (just to give a few examples, in a SiO2 matrix, 3 MeV protons have a range of 80 μm. Transmission of the X-rays produced at this depth, for different elements, are: Na (~1 keV)⟶10−10, K(~3.3 keV)⟶10−4, Fe(~6.4 keV)⟶0.25, Pb(~10.6 keV)⟶0.76.
PIXE has limits of detection which can be easily down to the tens of ppm or even better, in favorable conditions. This noticeable result can be obtained by optimizing the detector setup. This point is not a trivial task, due to the different production cross sections of the diverse lines of the elements. If in the sample to analyze, both light elements (low Z, thus higher X-ray production cross sections) and heavy elements (high Z, therefore lower cross section) are present, especially in the case of a light matrix with a low amount of heavy elements, as is most often the case in CH, the detection count rate will be dominated by low-energy X-rays and high Z element identification can become challenging, if not impossible [64]. To solve this problem, typically a two-detector setup is used, where one detector (SMALL, optimized for low-energy X-rays) has a small active area crystal and a small solid angle, while the other (BIG, optimized for high-energy X-rays) covers the largest possible solid angle, to compensate the low X-ray production cross section, and has a thin absorber(s) installed in front of the entrance window, to limit the count rate of low-energy X-rays.
Absorbers are usually made of organic material (e.g., Mylar, Kapton) or of light-element metal foils (Be and Al). Using these absorbers, detectors are not sensitive to low-energy X-rays, which are instead counted by the other detector. For the detector optimized for low-energy X-rays, on the contrary, X-ray absorption is minimized, normally by creating a He atmosphere along the X-ray path from sample to detector, while the acceptance solid angle is small, to reduce the number of X-rays impinging on the active elements and thus reducing the count rate. With this solution, the count rate can be roughly the same for low- and high-energy X-ray detectors. Two-detector PIXE setup has become very popular; see, for example, [65,66,67,68,69,70,71,72,73,74,75]. This is the adopted solution also at INFN-LABEC, within the INFN-CHNet network. The two-detector setup will also be exploited for the MACHINA accelerator, the first transportable accelerator, purposely developed for IBA analysis in CH [76]. Over time, this idea has been further developed, and now three-detector [77,78,79], four-detector [80], and five-detector [81] PIXE setups have been introduced.
Instead of using several detectors, optimized for the different energy ranges, a less expensive solution is given by a single detector in front of which an absorber with a pinhole (funny filter in the PIXE community) is placed. The pinhole enables a small fraction (e.g., a few per cent) of the low-energy X-rays to reach the detector [82]; this part of the detector, with smaller solid angle, acts as the SMALL detector in the two-detectors setup, while the part with the absorber in front of it is the equivalent of the BIG.

2.2. X-ray Detectors—Conventional XRF

Similar to PIXE, as concerns the detected radiation, X-ray fluorescence (XRF) is an analytical technique based on the detection of characteristic X-rays induced in the target material by primary X-ray beams, with typical energy spectrum ranges of hundreds of eVs to tens of keVs. XRF is an analytical technique that enables detecting/quantifying elemental composition of the sample under investigation.
XRF [83,84,85,86,87] can be carried out with handheld instruments, laboratory spectrometers or large facilities. In XRF applied to CH, many applications now exploit macro-XRF (MA-XRF) scanners to provide both elemental imaging and point analyses and we will limit our discussion to them, being the most advanced and best-performing instruments, preferred because they allow for a better understanding of sample composition and structure [88]. Many custom and commercial MA-XRF scanners have been presented and are currently used, most of them based on a single SDD detector; see, for example, [89,90,91,92,93,94]. A custom ultra-portable MA-XRF scanner was developed also within INFN-CHNet, exploiting a single SDD detector and battery powered [95,96,97].
Actually, differently from the particle X-ray production cross sections, which have a decreasing behavior with increasing atomic number (Z) of target atom, when ionization is induced by a given X-ray beam, both the ionization cross sections and the fluorescence yields increase with increasing Z of target atoms, so increasing the number of detectors does not help to balance the detection count rates of low and high energy. However, multi-detector instruments are very appealing also in XRF applied to CH, where analyses are normally carried out in the imaging mode. In this way, it is possible to reduce the measurement time, which can easily be of several hours or even more when big samples are studied, such as paintings of great dimensions. Moreover, increasing the number of detectors is of great interest when high-intensity radiation sources are available, because while a single large-area detector would be affected by noticeable pile-up and saturation effects, adopting multi-element detectors of the same area, these effects can be avoided, reducing the collection solid angle, and so the data throughput of each single element of the detector. Two-SDD detector MA-XRF scanners have been recently developed; see, for example, [98,99,100].
A three-SDD detector MA-XRF scanner has been developed within the INFN-CHNet in the framework of the Mu.S.A. (Multi-Channel Scanner for Artworks) project, which involved INFN Roma Tre in collaboration with Ars Mensurae, an enterprise working in the field of diagnostics. The energy resolution is approximately 127 eV at the Mn energy, and the image resolution is approximately 1 mm2 per pixel. The use of three SDD detectors enables faster measurements, maintaining a good S/N ratio (2 mm/s, using a 100 μA X-ray tube). In 2020, the three-detector MA-XRF scanner was used for the first time on the famous masterpiece “La Fornarina’’ painted by Raffaello (manuscript in preparation); see Figure 1.
The previous two-detector version of the scanner was tested on a variety of different materials and samples [101,102,103].
It is also worth mentioning an approach based on a conventional CCD detector, the Full Field X-ray Pinhole Camera, not widely used yet, but promising [104]. It consists of a CCD detector coupled to a pinhole collimator of small diameter, with the X-ray fluorescence induced on the samples by an external X-ray tube. This approach enables good energy resolution (133 eV @ 5.9 keV Mn line) and makes possible the acquisition of two-dimensional elemental maps of the irradiated samples. Depending on the pin-hole diameter, two configurations have been presented, where larger (up to 4 × 4 cm2) and smaller area samples (up 2.5 × 2.5 mm2) are studied with spatial resolutions down to 140 and 30 µm, respectively.

2.3. X-ray Detectors—Synchrotron-Based Techniques—XRF and XAS

It is worth mentioning here that third- and fourth-generation synchrotron light sources have revolutionized scientific and technological research in many fields. Projects have been presented to develop new energy resolving imaging systems based on SDD, able to cope with the high photon count rates provided by the new light sources [105].
Synchrotron radiation sources offer brilliance which is orders of magnitude higher than X-ray tubes. XRF end stations are typically equipped with monochromators which grant tunable monochromatic primary beams, important to perform selective excitation of the elements to be studied, maximizing the sensitivity of detection, in particular for light elements which are more difficult to detect. The energy tunability achievable with synchrotron radiation gives the possibility to also gain information on the local atomic coordination, thanks to the use of X-ray Absorption Spectroscopy (XAS) (see [106] for a summary of the XAS technique and the XAS experimental setup at the DAΦNE-Light experimental facility). XAS studies the valence states but can also monitor the chemical transformation to which original materials, constituting CH artifacts, were subjected. XAS spectra, that are element-specific, can be studied finely varying the X-ray beam energy in detail around the X-ray absorption edges of the atomic elements to be studied. Depending on the sample nature, measurements can be performed in transmission the mode, detecting the incoming and the transmitted X-ray beams; otherwise, e.g., in the presence of diluted or supported samples in the fluorescence mode, monitoring the incoming X-ray beam and the fluorescence signal, using a detector set at 90 degrees with respect to the incoming beam to reduce contributions due to elastic scattering.
Within INFN-CHNet, at the DAΦNE-Light synchrotron radiation facility of the Frascati National Laboratory (INFN-LNF), there is a soft X-ray beamline, DXR1, used to study all elements with X-ray absorption edges in the energy range between 900 eV and 3000 eV. Some XAS spectra of samples containing Si, S, Cl, that have a relevant interest in the CH field, have been measured. As an example, in Figure 2 we report the XAS spectrum at the S K-edge of a reference lazurite sample [107], a mineral used for ages to produce the most famous blue pigment, the ultramarine blue. This spectrum was acquired during an ongoing study on ultramarine pigments.
In order to decrease the XAS spectra scan times and collect measurements with high signal to noise ratios, a four-channel silicon drift detector, ARDESIA, financed by INFN and developed by INFN, the Politecnico di Milano and Fondazione Bruno Kessler (FBK) [108] has been installed at the DXR1 beamline in 2019. ARDESIA is very useful when dealing with low and high count rates (>1 Mcps per channel) due to all the elements present in the sample, contributing to the total XRF signal and when good energy resolution (e.g., below 150 eV of full width at half maximum at peaking times faster than 200 ns) is needed. The ARDESIA detector is composed of a monolithic array of SDDs, with a squared geometry of 5 mm × 5 mm each and each one collimated to an area of 20.3 mm2. The standard thickness of the SDDs is approximately 450 μm. ARDESIA has been engineered in a finger-like structure that gives the possibility to place it very near to the sample using a specific vacuum-tight translating system. The ARDESIA finger can be closed with different vacuum windows as a function of the energy range of interest and in the soft X-ray region a thin polymer window insures the needed high X-ray transmission [109,110]. Using ARDESIA with this configuration, many XAS measurements were performed, not only at the DAΦNE-Light facility but also at the LISA CRG beamline at ESRF (Grenoble, France) and at the P65 beamline at PETRA (DESY, Hamburg, Germany), as shown in Figure 3 (see all the above references in this paragraph and [111]).
ARDESIA has also been tested for XRF measurements at the DXR1 beamline. As an example, in Figure 4 is reported the XRF spectrum acquired on a graphite sample using for the detector the thin polymer window. Besides C, ARDESIA was able to detect the presence of trace elements such as O, Na, Mg and Al in a test sample.
In order to improve the performances of the ARDESIA detector, new developments were carried out in 2019. The detection efficiency at high energies (over 10 keV) was improved and tested increasing SDD thickness from the standard 450 μm to 800 μm and 1 mm, the first thicker SDDs developed at the FBK. To maximize the signal to noise ratio, with the possibility to measure more than 4 spectra at the same time, the design and implementation of a new prototype based on an array of 16 SDDs, instead of 4, obtaining a four-fold increase in the maximum output count rate, was implemented and characterized in terms of energy resolution. Hopefully, it will soon be possible to also test this new prototype with XAS measurements at synchrotron radiation beamlines including the INFN DAΦNE-Light DXR1. A detector based on 64 SDDs (9 mm2 active area each) has been built in a joint effort led by INFN within the ReDSoX collaboration for the XAS beamline of Synchrotron-light for Experimental Science and Application in the Middle East (SESAME).
Among the large detector arrays for XRF installed worldwide, very recently, a MAIA detector (the abovementioned array of 384 detectors) has been used for CH. MAIA, installed at a synchrotron facility, has been exploited to study a landscape present underneath a painting (the “Exit from the Theater” attributed to Honoré Daumier) [112].

2.4. X-ray Detectors (XRDs)

X-ray diffraction is a scattering-based technique aimed at the characterization of crystalline phases. XRD exploits Bragg’s law to measure interplanar crystal distances and hence it needs the simultaneous and well-resolved determination/knowledge of radiation wavelength (or energy) and angle of scattering. In CH, XRD is used for qualitative and quantitative phase determination. Similarly to XRF, basic setups provide an averaged measurement over ‘large’ areas, but the development of X-ray optics has enabled micro X-ray diffraction typically combined with a scanning stage to perform X-ray diffraction imaging. Applications encompass paintings, manuscripts, ceramics, metallic alloys, fossils, studied to understand origin, counterfeiting, realization processes or degradation phenomena. A review on the application of XRD imaging for CH studies has recently been published by V. Gonzalezet al. [113].
Standard XRD setups use monochromators (or Kb filters) to perform angle scattering measurements at a well-defined known wavelength. When using single-element (0D) detectors, the monochromator is usually preferred on the diffracted beam to remove X-ray fluorescence, which is a source of background for XRD. For segmented detectors (1D: strips, 2D: pixels), a monochromator on the diffracted beam cannot be implemented and monochromatic sources are typically used. Hence, for XRD detectors, energy discrimination is not really necessary and X-ray counters are used. As single-element detectors, scintillation detectors are often used. They may offer counting capabilities up to 1 Mcounts/s. Position-sensitive detectors are most often based on solid-state semiconductor detectors segmented to define the point of detection. The advances in CMOS technology have allowed the fabrication of dedicated Application-Specific Integrated Circuits (ASICs) to analyze the charge collected by the sensors and convert the signal into the corresponding number of photons and in some cases energy. Preamplification of the signals, which used to be performed by either integrated or external JFET charge amplifiers, is now often accomplished by CMOS charge preamplifier ASICs. Charge preamplification can also be combined in a single ASIC. The coupling of segmented semiconductor sensors with multi-channel ASICs with matching pitch constitutes hybrid (pixel) detectors. Integration of a full signal analysis chain enabling energy resolution is not trivial and typically these detectors are used as photon counters (hybrid photon-counting detectors, HPCDs). Nowadays, they are the most used in XRD and, depending on the instrumental range, can go from 1D strips with only tens of channels to 2D detectors with 16 M pixels. Well known in this category are detectors based on the Medipix readout chips (the latest is Medipix3) developed under the auspices of CERN by the Medipix collaboration [114] and detectors based on chips developed at the Paul Scherrer Institut (PSI) [115].
A curved position-sensitive detector based on a (curved) gas ionization chamber is commercially available and has recently been used to characterize Mayan green stones [116]. Recently, FBK fabricated a Si strip sensor for the development of a spectroscopic 1D detector, specifically designed for the combined analysis of X-ray diffraction and X-ray fluorescence. The paired-X project consortium has proposed this strip detector with spectroscopic capability and a novel concept of data analysis based on Rietveld refinement of an angle-energy map [117]. This methodology, developed for mineralogical characterization (EIT RawMaterials consortium funds), can be exploited for the characterization of CH artifacts, and in particular when scanning µ-XRD measurements are required and the XRD patterns have to be collected as quickly as possible.

2.5. X-ray Detectors—XCT

Until recently, computed X-ray tomography (XCT) was confined to the medical and industrial field, but nowadays its application is expanding in several other fields, including CH. The high penetration power of X-rays and their safety for non-living items make this imaging technique the optimal approach to analyze the entire volume of works of art and archaeological findings in a non-invasive and non-destructive way. XCT imaging reveals crucial information about artifacts, such as inner morphological features, conservation status, manufacturing technique and constituent materials [118,119,120,121].
Radiographs are commonly acquired using indirect-conversion detectors, exploiting suitable scintillator screens to convert photons from X-rays to Visible light and then collect them by optical systems and CCD cameras.
X-ray tomography is achieved by acquiring multiple radiographic projections of the item over 360 (or 180) degrees. The elaboration and reconstruction of the projections with ad hoc algorithms result in a set of cross-sectional images, the so-called slices, from which a rendering software re-creates a complete 3D imaging of the object, from the outside morphology to the inner details.
Similarly to the other techniques borrowed from more traditional research fields, the setups, the instrumentations, and especially the detectors, have been optimized for the new scope. In medicine, the XCT facilities are generally designed to acquire the projections rotating the source–detector system over 360 degrees around the patient. In this configuration, the source–detector distance is fixed, resulting in an optimized but limited space available for the patient, and different acquisition procedures can be used, from circular acquisition to a spiral path with the use of single or multi-slice detectors [122,123]. Being the patient safety of primary importance, to avoid any unnecessary dose, the X-ray beams are generally highly collimated. Additionally, the energy ranges are optimized for the human body and the spatial resolution commonly achievable with this kind of apparatus is quite limited—generally 0.5 mm. For specific anatomical investigations, such as dental XCT or head XCT, systems with a higher resolution are used, typically 0.2–0.3 mm [124].
These characteristics are the result of decades of design to optimize the XCT for the human body and, as can be easily understood, the use of these instruments for CH investigations poses severe limitations. The large variety of sizes and compositions that is typical of CH objects—from tiny jewels to 2 m high wooden statues, from canvas to ceramics and metals—needs peculiar designs.
In these investigations, similarly to industrial XCT, the dose requirements are less stringent than in the medical field, but, more crucially, the availability of an in situ diagnostic technique is requested, which can be applied directly inside museums or restoration laboratories, in order to avoid the transfer of precious and fragile artifacts to an external laboratory.
For these reasons, the facilities devoted to CH are generally designed with flexible mechanics. Ideally un-bounded, these structures are more easily transportable on-site and with the possibility to vary the source–detector and the object–detector distances to fit a large variety of objects and to accord the voxel size to the object peculiarities.
Figure 5 shows two examples of the transportable facilities for CH investigation developed by the INFN-CHNet X-ray tomography laboratory of Bologna, especially designed for medium-size (Figure 5a) [125], and large-size (Figure 5b) [126] works of art. In this case, the projections are acquired rotating the investigated objects and several are the possible configurations and detectors.
The CCD-based detector systems, quite widespread some years ago, consist of a CCD camera optically coupled, through a lens and a 45° mirror, with a scintillator screen (columnar CsI(Tl), or Gadolinium Oxysulfide Gd2O2S:Tb), positioned in a light-tight box [127]. In this configuration, X-rays interact with the scintillator, producing visible-light photons, deflected by the mirror and directed on the CCD. This design avoids the direct irradiation of the CCD—ideal configuration for high-energy X-ray imaging [128]—and for this reason similar systems are still in use in Neutron tomography [129].
Nowadays, most of the systems for XCT adopt an in-line configuration, with CCD and flat-panel detectors [130].
The CCDs exploited are generally coupled with a scintillator plate for an indirect conversion and can be small-size detectors, with an area of some square centimeters and a pixel size of few microns, for high-resolution imaging such as micro-XCT [131], or linear detectors. The latter are bigger detectors, with a length of some tens of centimeters and a pixel size from tens to hundreds of microns and are commonly used for in-line inspections. However, thanks to their large dimension and their fast acquisition, they have been successfully applied in a XCT facility for investigations of large CH objects [132,133].
Indubitably, flat-panel detectors are the most common detectors for works of art investigations. Characterized by a large detection area, up to 45 × 45 cm2, and good spatial resolution, with a pixel size from tens to a few hundred microns, these detectors generally exploit a CMOS or an Amorphous Silicon technology and take advantage of scintillator plates (CsI(Tl) or GOS (Gd2O2S:Tb) for indirect conversion [134]). Direct conversion FDPs are also available, which exploit an amorphous Se layer to directly convert X-rays to charge. The use of this kind of detector can overcome the intermediate step of X-ray conversion into visible light and generally enables achieving better spatial resolution than indirect FDPs for the same pixel size.
The emerging technique of the dual-energy XCT is opening new perspectives to X-ray imaging: the use of two carefully chosen irradiating spectra of the primary X-rays—or acquired energy ranges—enables the enhancement of the small differences in absorption of two or more materials, such as human tissue and a contrast agent in medical imaging. This can be achieved using several configurations, from the use of two orthogonal source–detector systems to acquire simultaneously two XCT datasets with different spectra, to the acquisition of two successive CTs by switching the voltage of one X-ray tube [135].
For its applications in the CH field, where the investigated materials are disparate and the acquisition of two spectra can be reductive, the most promising setup involves the use of large-area hybrid photon-counting detectors (HPCDs). Similarly to detectors used for X-ray spectroscopy, these solid-state detectors allow the simultaneous readout of X-ray fluxes and spectral energies, enabling the acquisition of an energy resolved tomography, the so-called spectroscopic or “color” tomography.
In recent years, some large-area HPCDs have been developed, with a high spatial resolution and fully spectroscopic capabilities [136] or with spectral discrimination achieved using two/four energy thresholds to be opportunely set [137,138]. Moreover, different sensor configurations and materials have been developed, from a more standard thickness of the Si sensor for low–medium X-ray energies to thicker Si or CdTe sensors, for higher X-ray energies, such as those required by XCT for CH investigations. Although some commercial instruments mounting photon-counting detectors are available on the market [139], the cost of this powerful technology is nowadays an obstacle to its large diffusion. However, thanks to its appealing features, in the near future, an impressive expansion of its applications in new fields such as CH is expected.

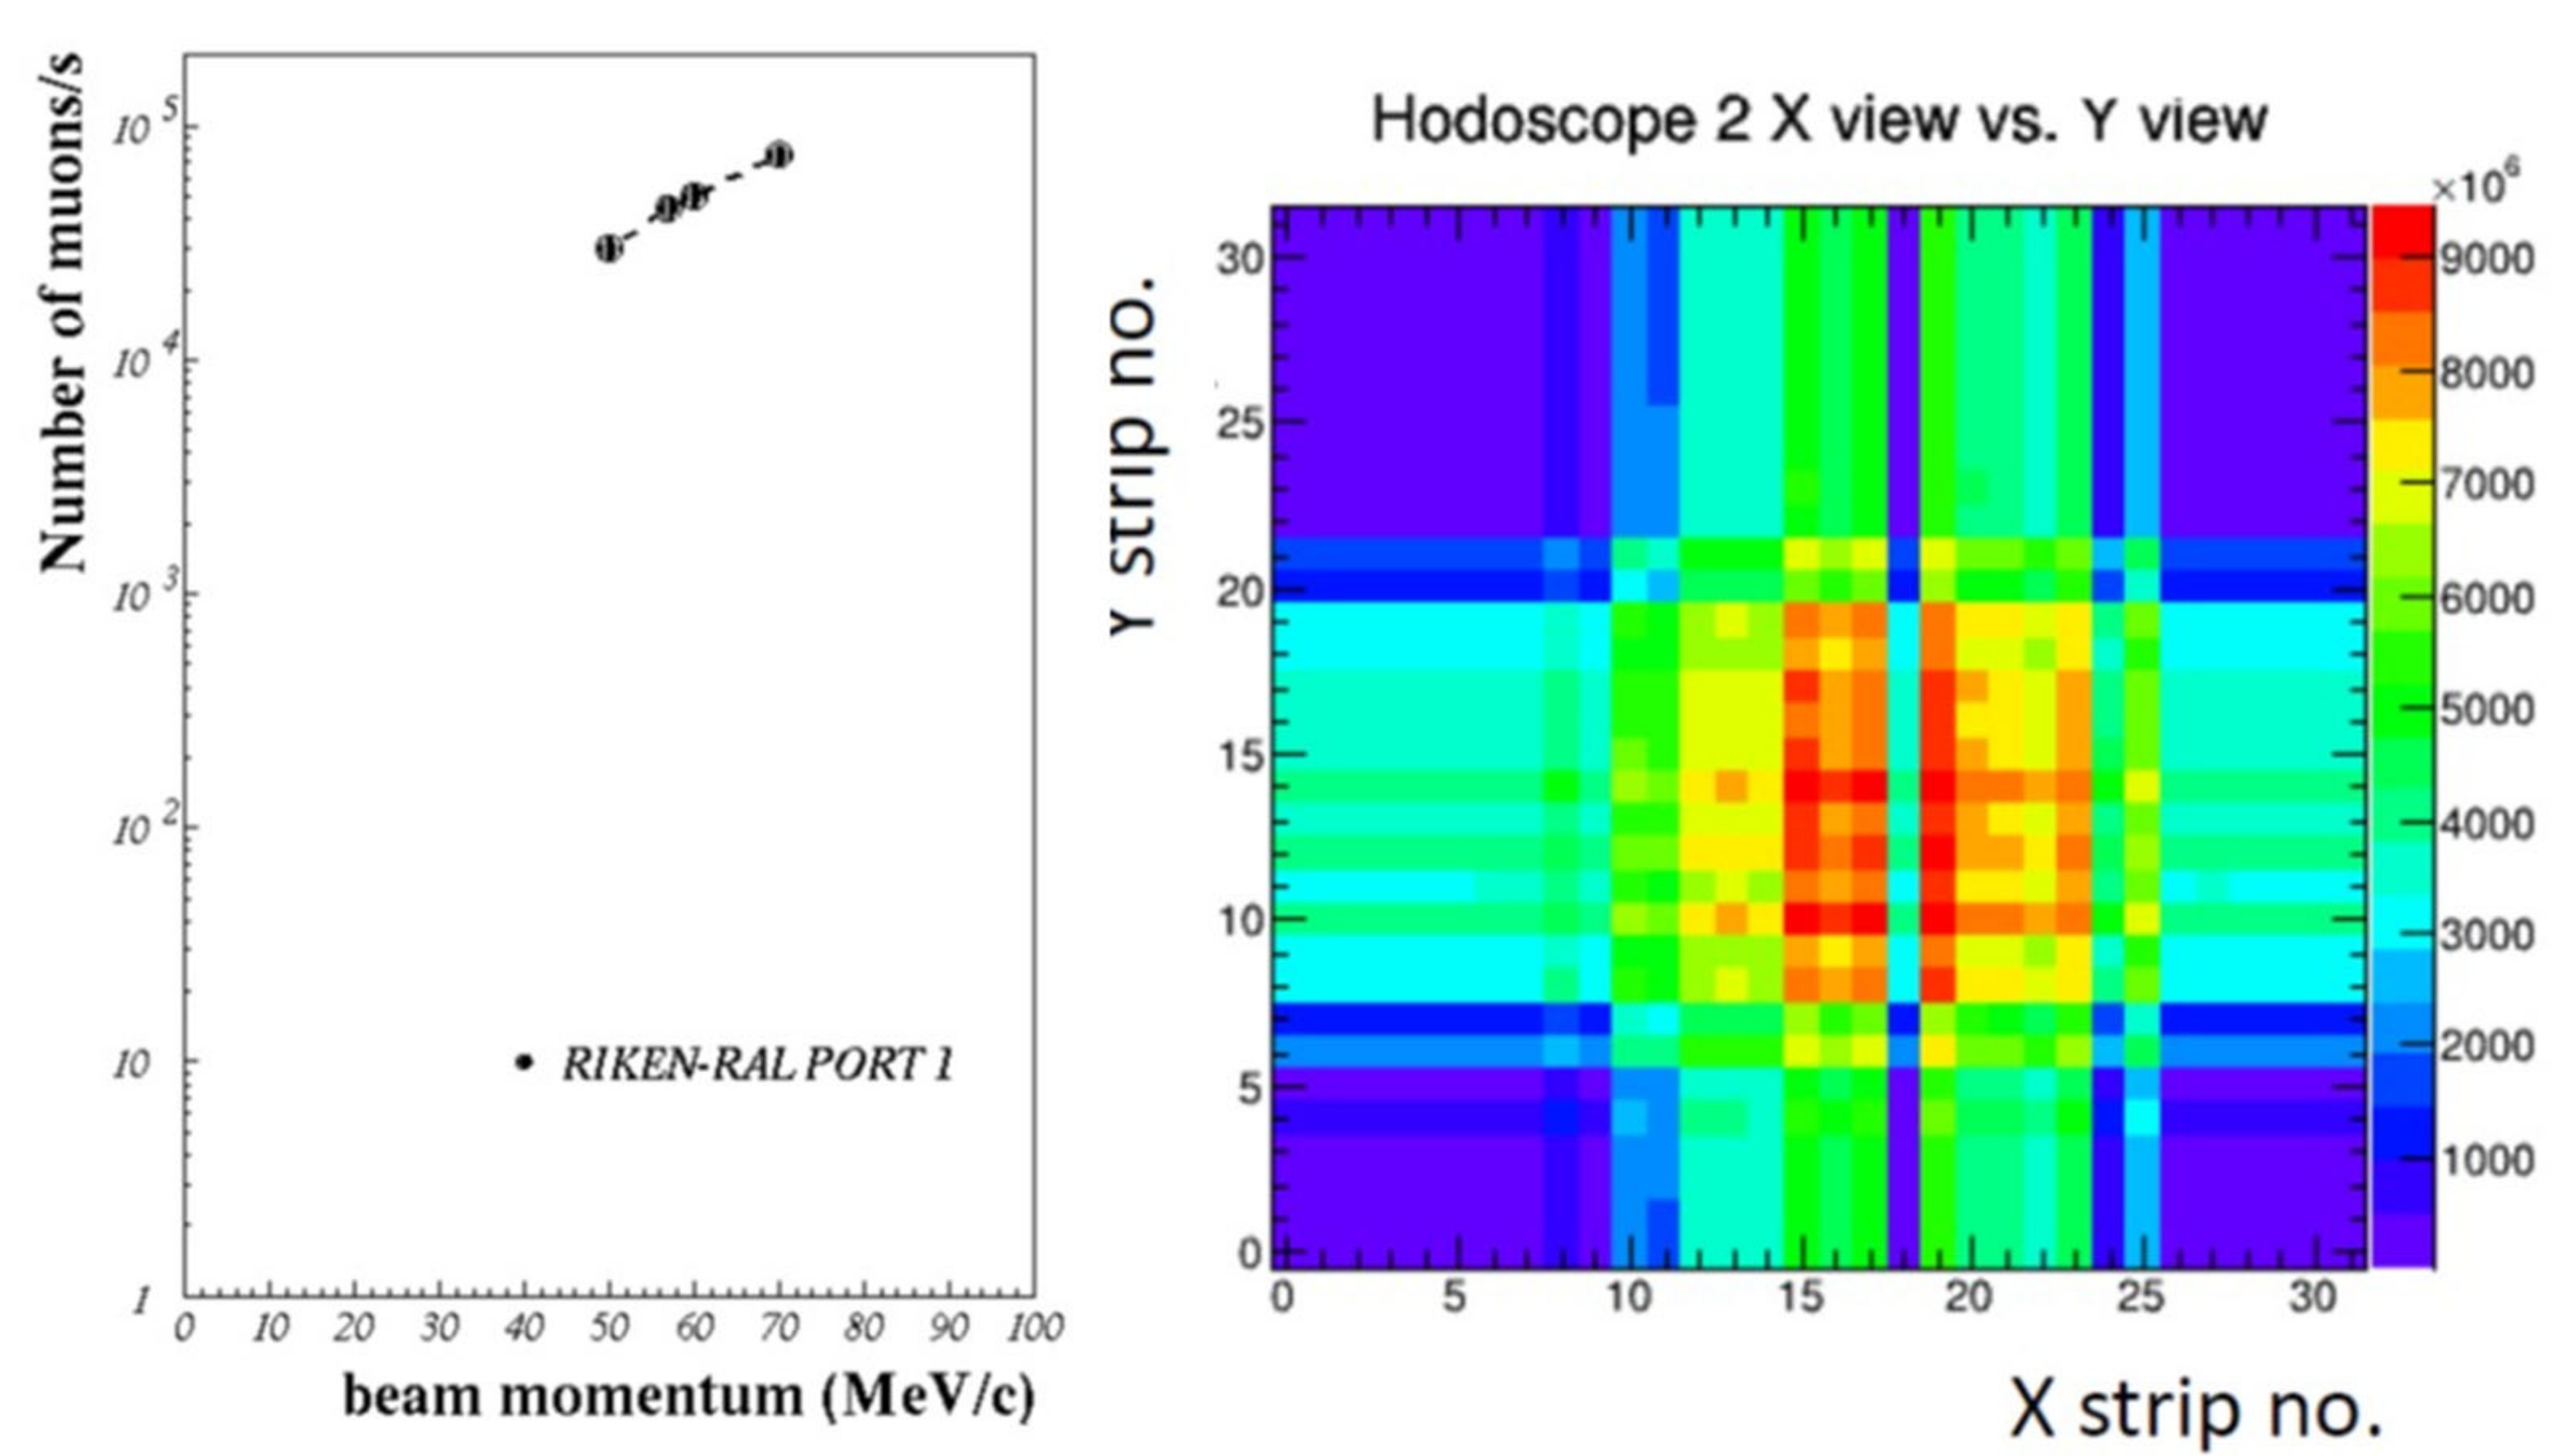
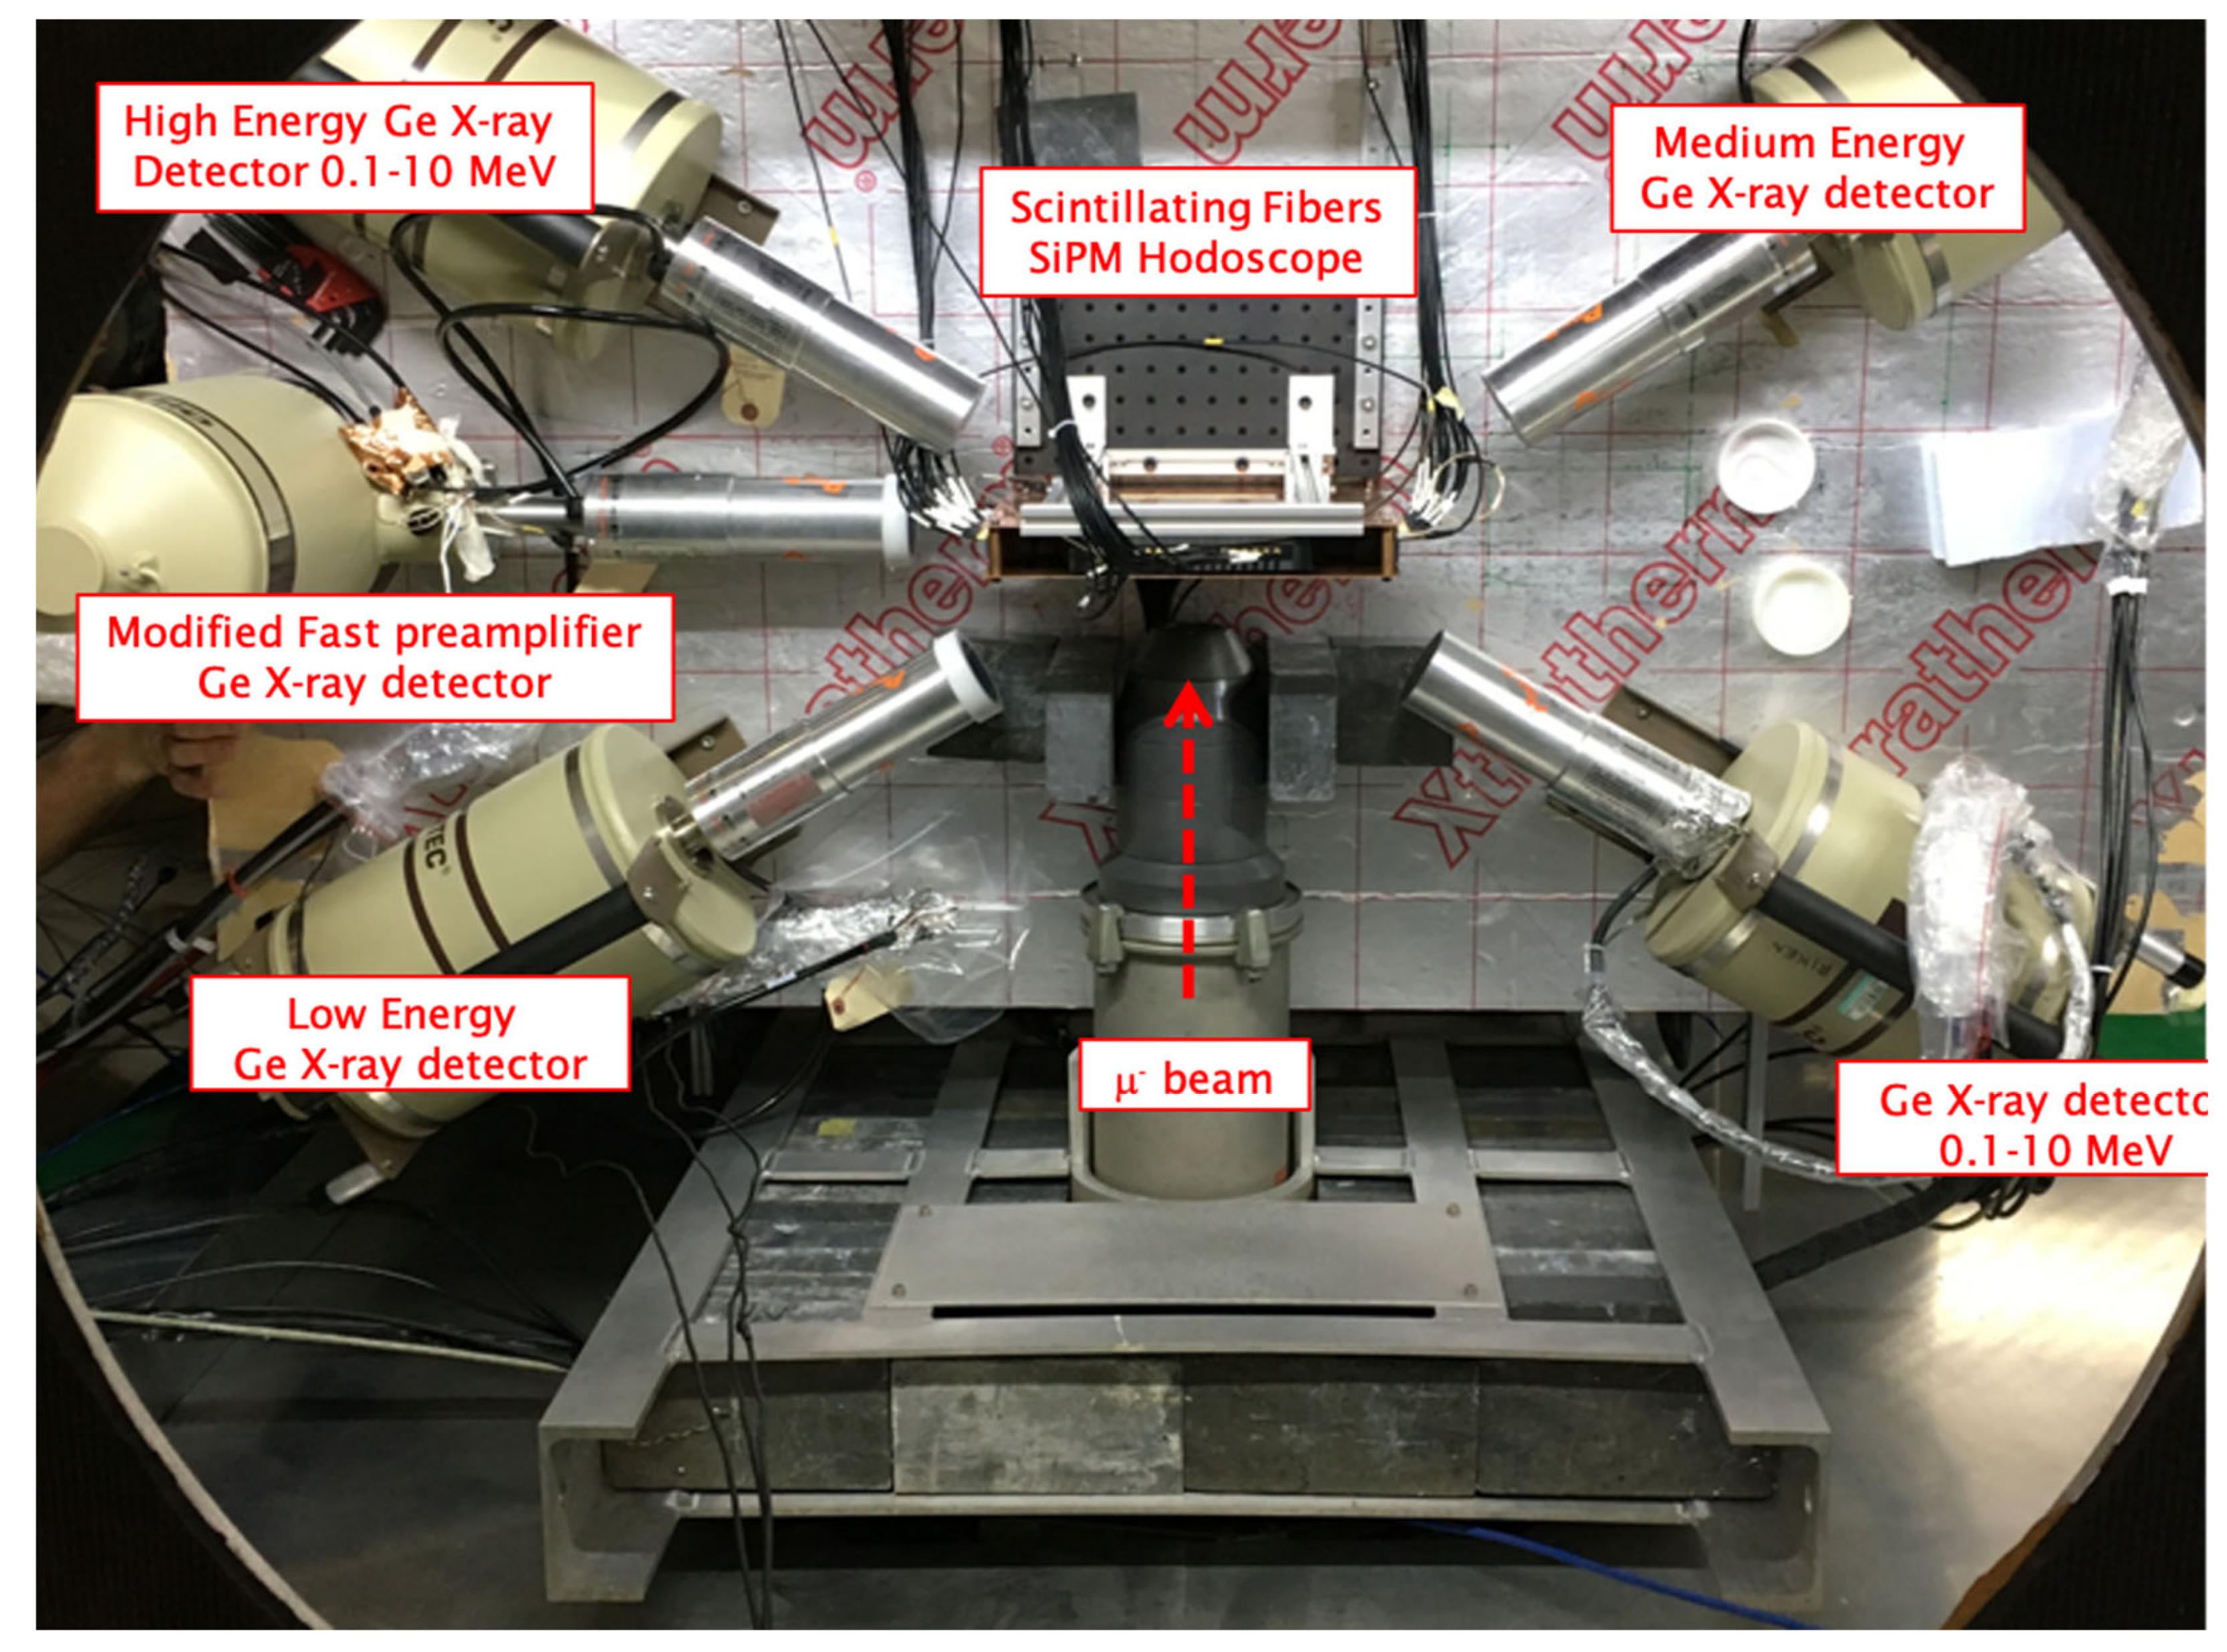
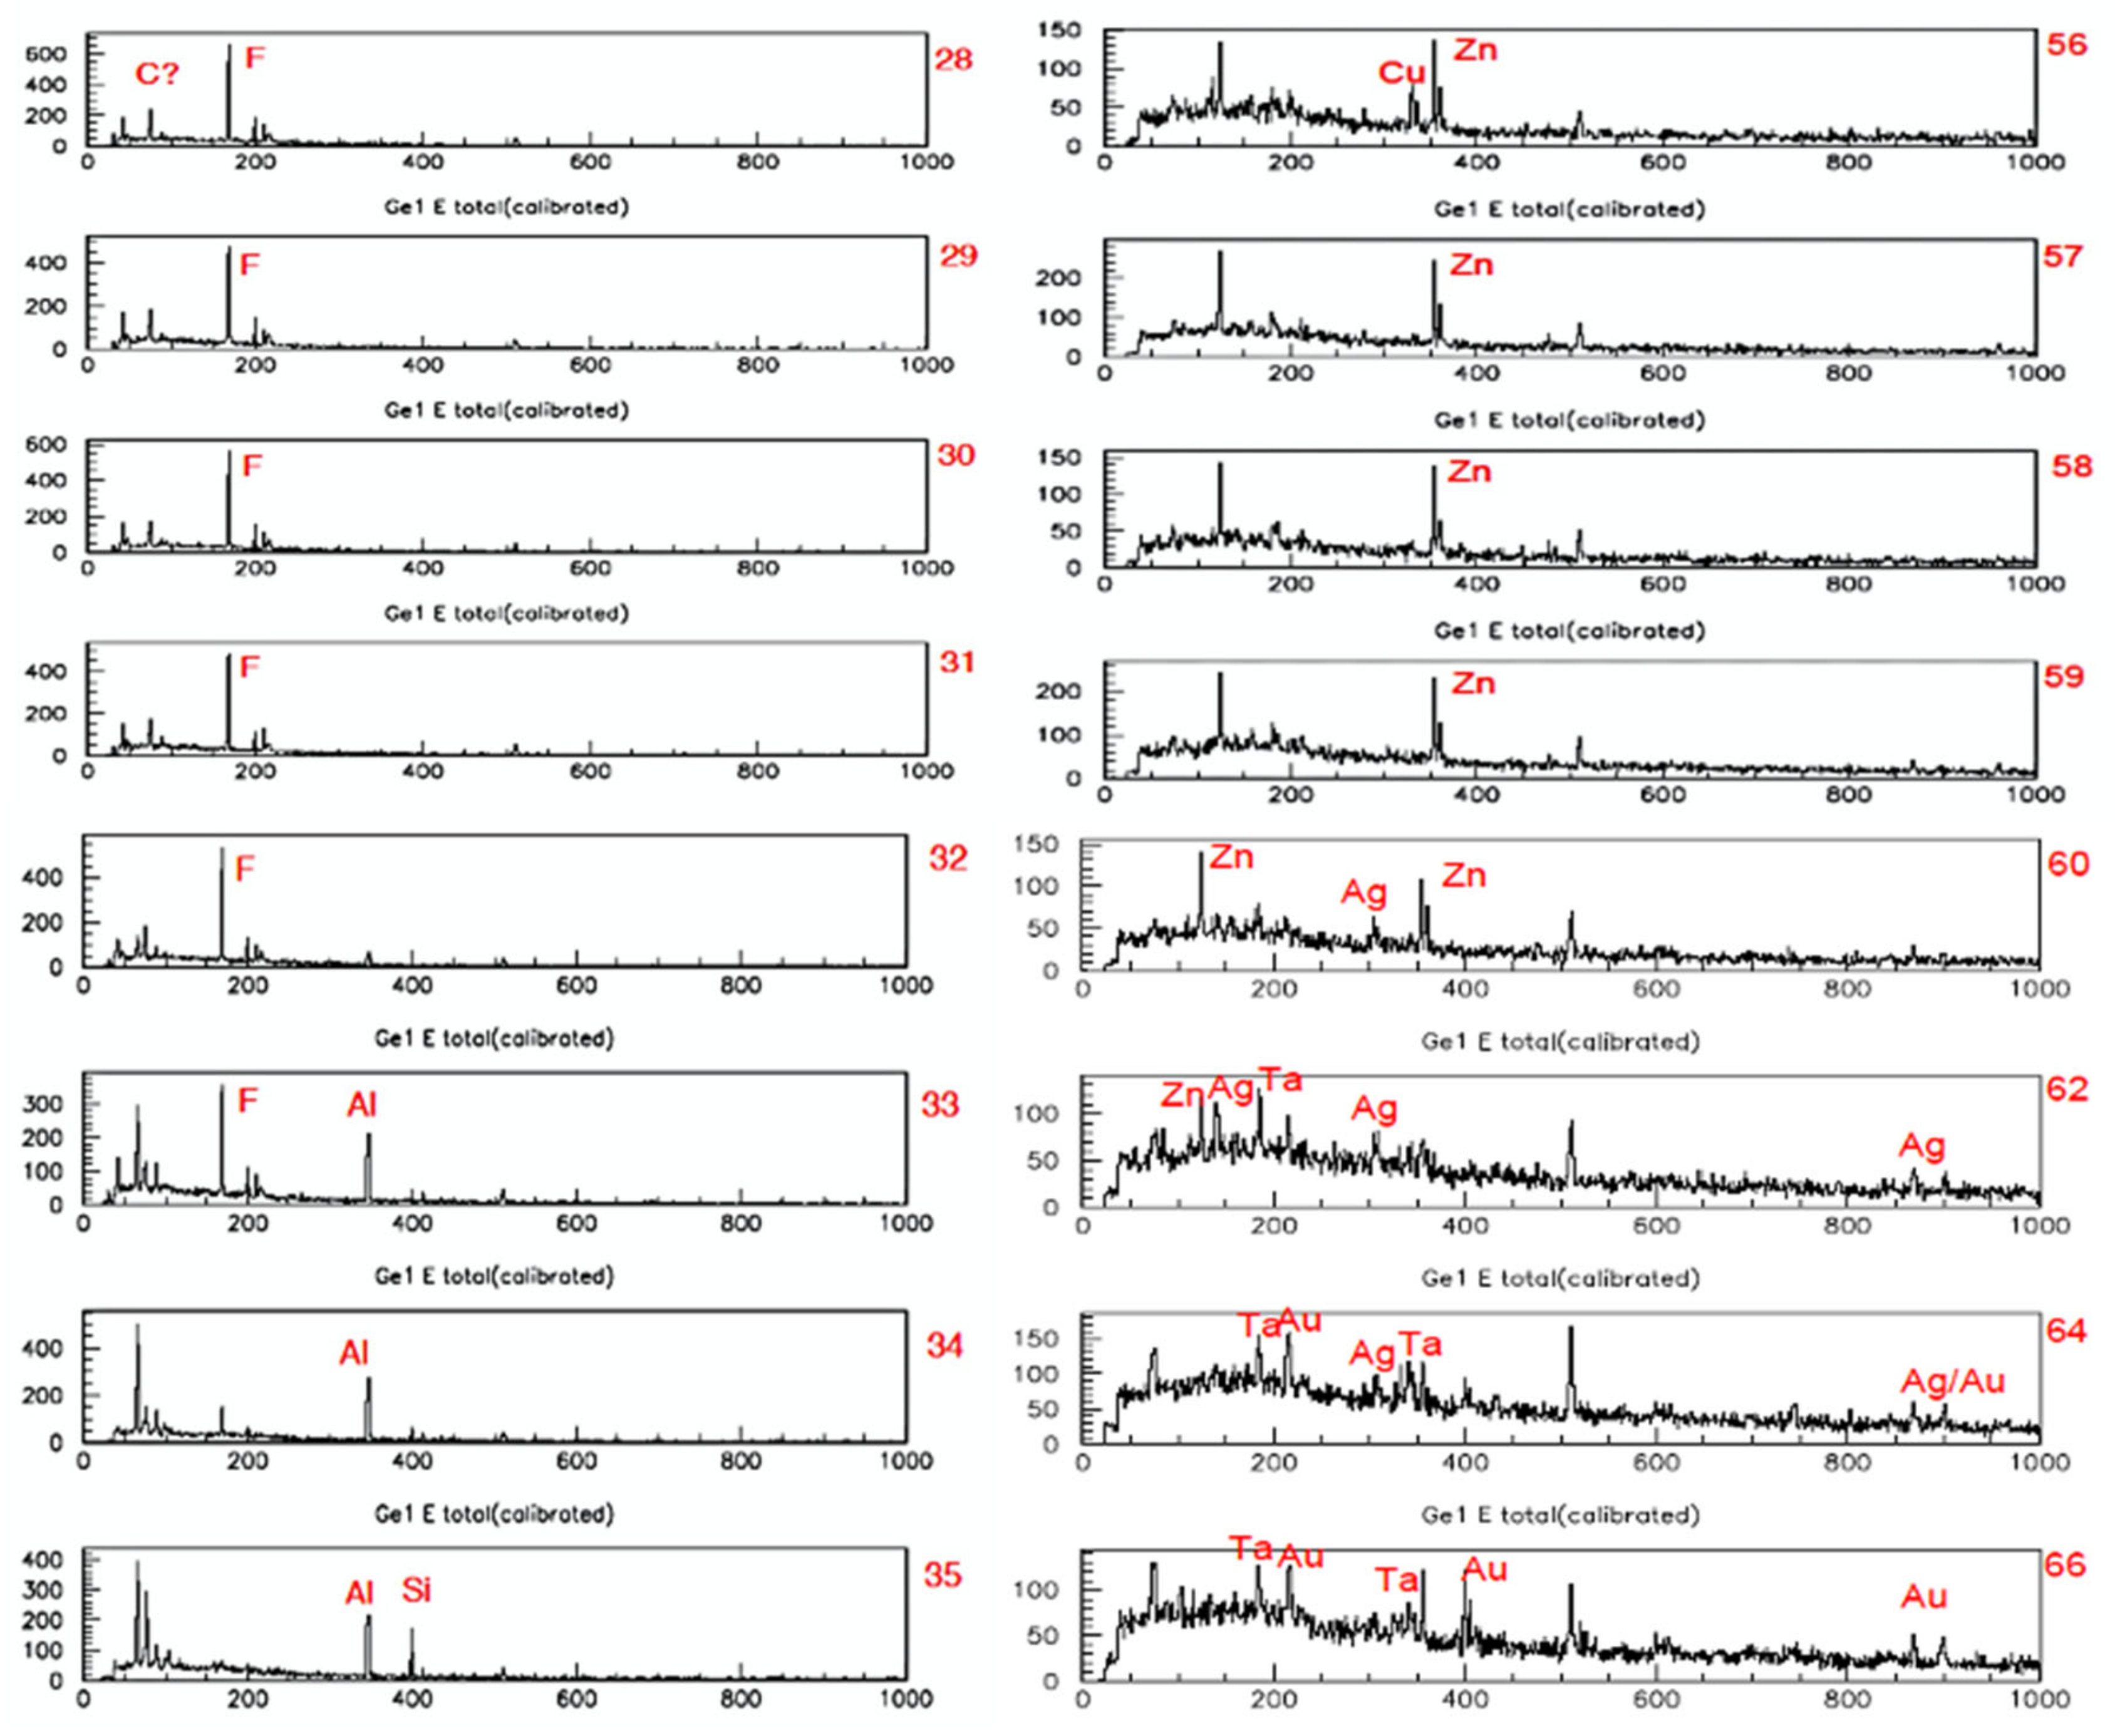
2.6. Muonic Atom X-ray Spectroscopy (MAXRS)

Muonic atom X-ray spectroscopy (MAXRS) is based on sample exposure to a collimated muon beam and the detection of characteristic X-rays, emitted following the implantation/formation of muonic atoms inside the target.
Muon mass is 200 times bigger than electron mass, thus characteristic muonic X-rays have energies much higher than those of the corresponding characteristic X-rays generated in electronic transitions. Although they are referred to as muonic X-rays, they actually have energies detectable by detectors normally used for γ-ray spectroscopy. Thus, by using high-energy muon beams, we can probe elements well inside the sample (up to several millimeters depth) and the EM radiation generated even deeply inside the sample can easily emerge out thanks to its higher energy (i.e., less self-absorption). Elements can be detected inside the samples with very limited (if any) sample activation, differently from what happens with neutron irradiations for PGNAA analysis, where materials can be probed in depth, thanks to the use of neutrons, but with remarkable indeed activation. The MAXRS technique can be used for CH applications as it enables non-destructive analyses. Using intense double pulsed muon beams at the RIKEN-RAL facility, MAXRS can be used to discover the provenance of raw materials, the manufacturing processes, the past trading patterns and/or the persistence of particular past cultural traditions.
The main features of the MAXRS technique are:
  • Non-invasive, simultaneous, multi-elemental analytical technique;
  • High-energy characteristic X-rays emission (small autoabsorption also for low Z elements);
  • Potentially applicable for all elements (from Li to U);
  • External analyses possible (no vacuum system required);
  • Suitable for a wide variety of samples;
  • Depth profiling possible by changing muon beam momentum/energy;
  • 2D mapping;
  • Very high specificity (energy and temporal signatures);
  • Negligible radioactivation;
  • Complementary technique to other non-invasive analytical techniques for bulk (PGNAA) or surface analysis (PIXE, XRF, …).
This technique, still under development, has already been employed on a wide range of materials, including Japanese coins [140], different animal tissues ([141,142,143] and ancient Chinese mirrors [144]. Very recently, the negative muons at J-PARC were used to examine extra-terrestrial material and meteorites [145]. In a proof-in-principle experiment [146], a new instrument was setup, built, and installed on port 4 of the RIKEN-RAL facility. After detector calibration, standard samples (Au standards, Bronze Standards, and pure elements) were measured. Since then, this instrument has been upgraded to look at archaeological artifacts, such as Roman and Islamic coins, Bronze Age artifacts and ancient swords [147] and, within INFN-CHNet, for the in-depth analysis of archaeological finds (fragments of votive bronze boats from the Nuragic age). Results have pointed out the use of lead as an additive in the Cu and Sn alloy, especially in some particular junction areas (bow of the ships) [148].
The MAXRS detection setup of INFN-CHNet makes use of two beam hodoscopes, originally developed for the FAMU experiment at RAL. These detectors are based on single-clad square 1 mm or 3 mm PMMA Bicron BCF scintillating fibers, arranged along x/y coordinates, and read at one extreme by ASD RGB SiPM from Advansid or S12752-025P SiPM from Hamamatsu. They are designed to deliver position, shape, and timing information for the low-energy Riken-RAL muon beam, with a fiducial area of 96 × 96 mm2 and 32 × 32 mm2, respectively. A picture of the 1 mm pitch detector is shown in Figure 6 [149,150].
Considering that the used SiPMs have been selected in order to have similar breakdown voltages as shown in Figure 7, a simple readout scheme was developed, giving the same supply voltage to all SiPMs.
For the readout, CAEN V1742 digitizers are used, one for each detector, providing both amplitude/charge and timing information for each channel. No amplification for the SiPM signal is needed. More details are presented in references [151,152].
The beam hodoscope is used to estimate the impinging muon rate per second and the X–Y beam profile; see Figure 8 for an example.
In the 2018 data taken for CHNET-FAMU, the first hodoscope was used for defining the beam spot for the sample under study, and the second for determining the beam focus position and the beam direction. This muon beam characterization is essential for the implementation of the Monte Carlo simulation used in the sample quantitative analysis.
As shown in Figure 9, the experimental setup exploits 5 HpGe detectors for the detection of the (low-, medium- and high-energy X-ray) characteristic muonic X-rays generated by the objects irradiated with the negative muon beams.
In Figure 10, typical spectra obtained with the setup shown in Figure 9 on the abovementioned standard samples are reported.
These detectors are typically used for the analysis of high-energy EM radiation and are described in the next paragraph.

3. Gamma-Ray Detectors

Similarly to X-ray detectors, for gamma ray detectors, a crucial feature is ER, normally defined for gamma rays as the ratio of full width at half maximum (FWHM) to the peak energy, typically at 662 keV line of the 137Cs gamma source. Additionally, intrinsic detection efficiency (DE) (which has the same definition used for X-rays, i.e., the ratio of the number of interactions registered by the detector to the number of photons incident on the detector) is normally of crucial importance for detector characterization, but, for CH studies, it is most often not as critical as in other fields, due to the typically limited energies of the gamma rays of interest (a few MeV), and thus it will only be touched upon below. In addition to these two parameters, there are many other features, such as timing resolution, which are important for detector characterization, but they are normally not critical for our topic and will not be discussed here.
For gamma ray detection [153] in CH, scintillators are typically exploited for depth profiling studies, thanks to their higher efficiency and because energy resolution in these applications is not critical. Solid-state detectors are instead preferred for bulk analysis, where high-energy resolution is a plus.
ER in contemporary scintillation detectors may vary from 2% to approximately 4% [154]. To the best of our knowledge, the best ever recorded energy resolution with a scintillation detector has been obtained with a small Sr2+ co-doped LaBr3:5%Ce3+ scintillator, which showed a 2.04% energy resolution [155].
ER in solid-state detectors is typically much better than in scintillators and is reported even down to 0.2%. Among solid-state detectors, HPGe normally display the best ER values (~0.2%@662 keV) [156] but can only be used at cryogenic temperature (liquid nitrogen). On the contrary, Cadmium Zinc Telluride (CZT), Cadmium Manganese Telluride (CMT), Cadmium Telluride (CdTe) and Thallium Bromide (TlBr) are all solid-state detectors which can be used at room temperature, although normally they are scarcely used in CH. They are characterized by good ER [157,158], although not as good as HPGe. CdTe detectors, in particular, have shown interesting ER, down to 0.42% [159]. CdTe present appealing features for CH applications, especially for mobile instrumentation, where HPGe detectors are normally not feasible, due to cost, fragility, dimensions, cooling, and weight.

3.1. Gamma-Ray Detectors—PIGE

The Particle-Induced Gamma Ray Emission (PIGE) technique is based on the detection of the prompt gamma rays emitted by the nuclei of the target atoms in nuclear reactions caused by ion beams. With MeV ion beams (typically protons with energies in the (1–3 MeV) energy range for IBA analyses), PIGE is typically limited to Z < 15–20, because heavier elements need higher beam energies for the projectiles to interact with the target nuclei. For a given atom/nucleus, gamma rays have higher energies than X-rays and absorption in the target depth probed by the beam particles is normally negligible, which makes the PIGE technique ideally suited for detection/quantification of low Z elements [160].
In CH applications, PIGE often complements PIXE, because it enables obtaining information about the low Z elements, non-detectable by PIXE because their X-rays have too low energy to be detected or are absorbed before reaching the detector(s).
Examples of the complementary use of the PIXE and PIGE techniques are quite common; see, for example, [161,162]. However, production cross sections for gamma rays are much smaller than those for X-rays, which makes the sensitivity of PIGE generally worse than that of PIXE [163,164,165,166,167].
A recent development, interesting for PIGE measurements, has been proposed in [168]. Following this approach, considering the detailed angular dependence of the gamma ray production cross sections, when a specific element is under study, the detector is set in the position where the gamma-ray yield has its maximum. In this way, a gain in the intensity up to 70% can be achieved. This approach enables lowering the limit of detection, minimizing the measurement time and the radiation dose delivered to the sample.
In PIGE measurements, semiconductors detectors are normally used, and, though the first application in the CH field exploited Ge(Li) for obsidian characterization [169], recently only HPGe are applied [170]. Additionally, CdTe detectors are used for high-energy X-ray/low-energy gamma-ray detection, thanks to their compactness and low weight. CdTe detectors with the same configuration (form factor, footprint, and front-end electronics) of SDDs have been presented. They can be used both for low-energy gamma rays (e.g., F gamma rays) and for high-energy X-rays. For example, a 3 × 3 mm2 CdTe detector with FWHM = 850 eV@122 keV line of 57Co and FWHM = 290 [email protected] keV line of 55Fe is commercially available (to be compared with ER down to 480 eV and 165 eV respectively for the most performing low-energy HPGe detectors). Their DE is higher than that of HPGe, for the same thickness, due to the higher Z of both Cd and Te with respect to Ge. However, being typically available in small dimensions and thickness, CdTe detectors have good DE only for photons with energies up to a few hundreds of keV (10% DE @ 300 keV).
These CdTe detectors can be configured to use the same power supply, preamplifier, cooling, and mechanics of SDDs. A detection setup based on SDDs and CdTe detectors in the same configuration described above is going to be installed on the abovementioned MACHINA beamline, thus enabling an extremely compact, lightweight, and low-cost detection system, of crucial importance for a transportable apparatus.
In CH applications, the PIGE technique is most often applied for the study of glasses [171,172,173,174]. Interesting studies concerning rock and minerals have also been reported [175,176], as well as about ivory and bones [177,178,179].
Most often the exploited reaction is based on the inelastic scattering, typically (p,p′γ). The elements more frequently detected by the PIGE techniques are F (exploiting the 19F(p,p′γ)19F reaction where gamma rays at 110 and 197 keV are emitted) and Na (23Na(p,p′γ)23Na reaction where 440 keV gamma rays are produced). However, also Mg (975 keV gamma rays from the 25Mg(p,p′γ)25Mg reaction), Al (1014 keV gamma rays from the 27Al(p,p’γ)27Al reaction), Si (28Si(p,p′γ)28Si reaction, gamma rays at 1778 keV) and P (31P(p,p′γ)31P reaction, gamma line at 1266 keV) have been evidenced thanks to the use of the PIGE techniques in CH studies, as reported in the above papers.

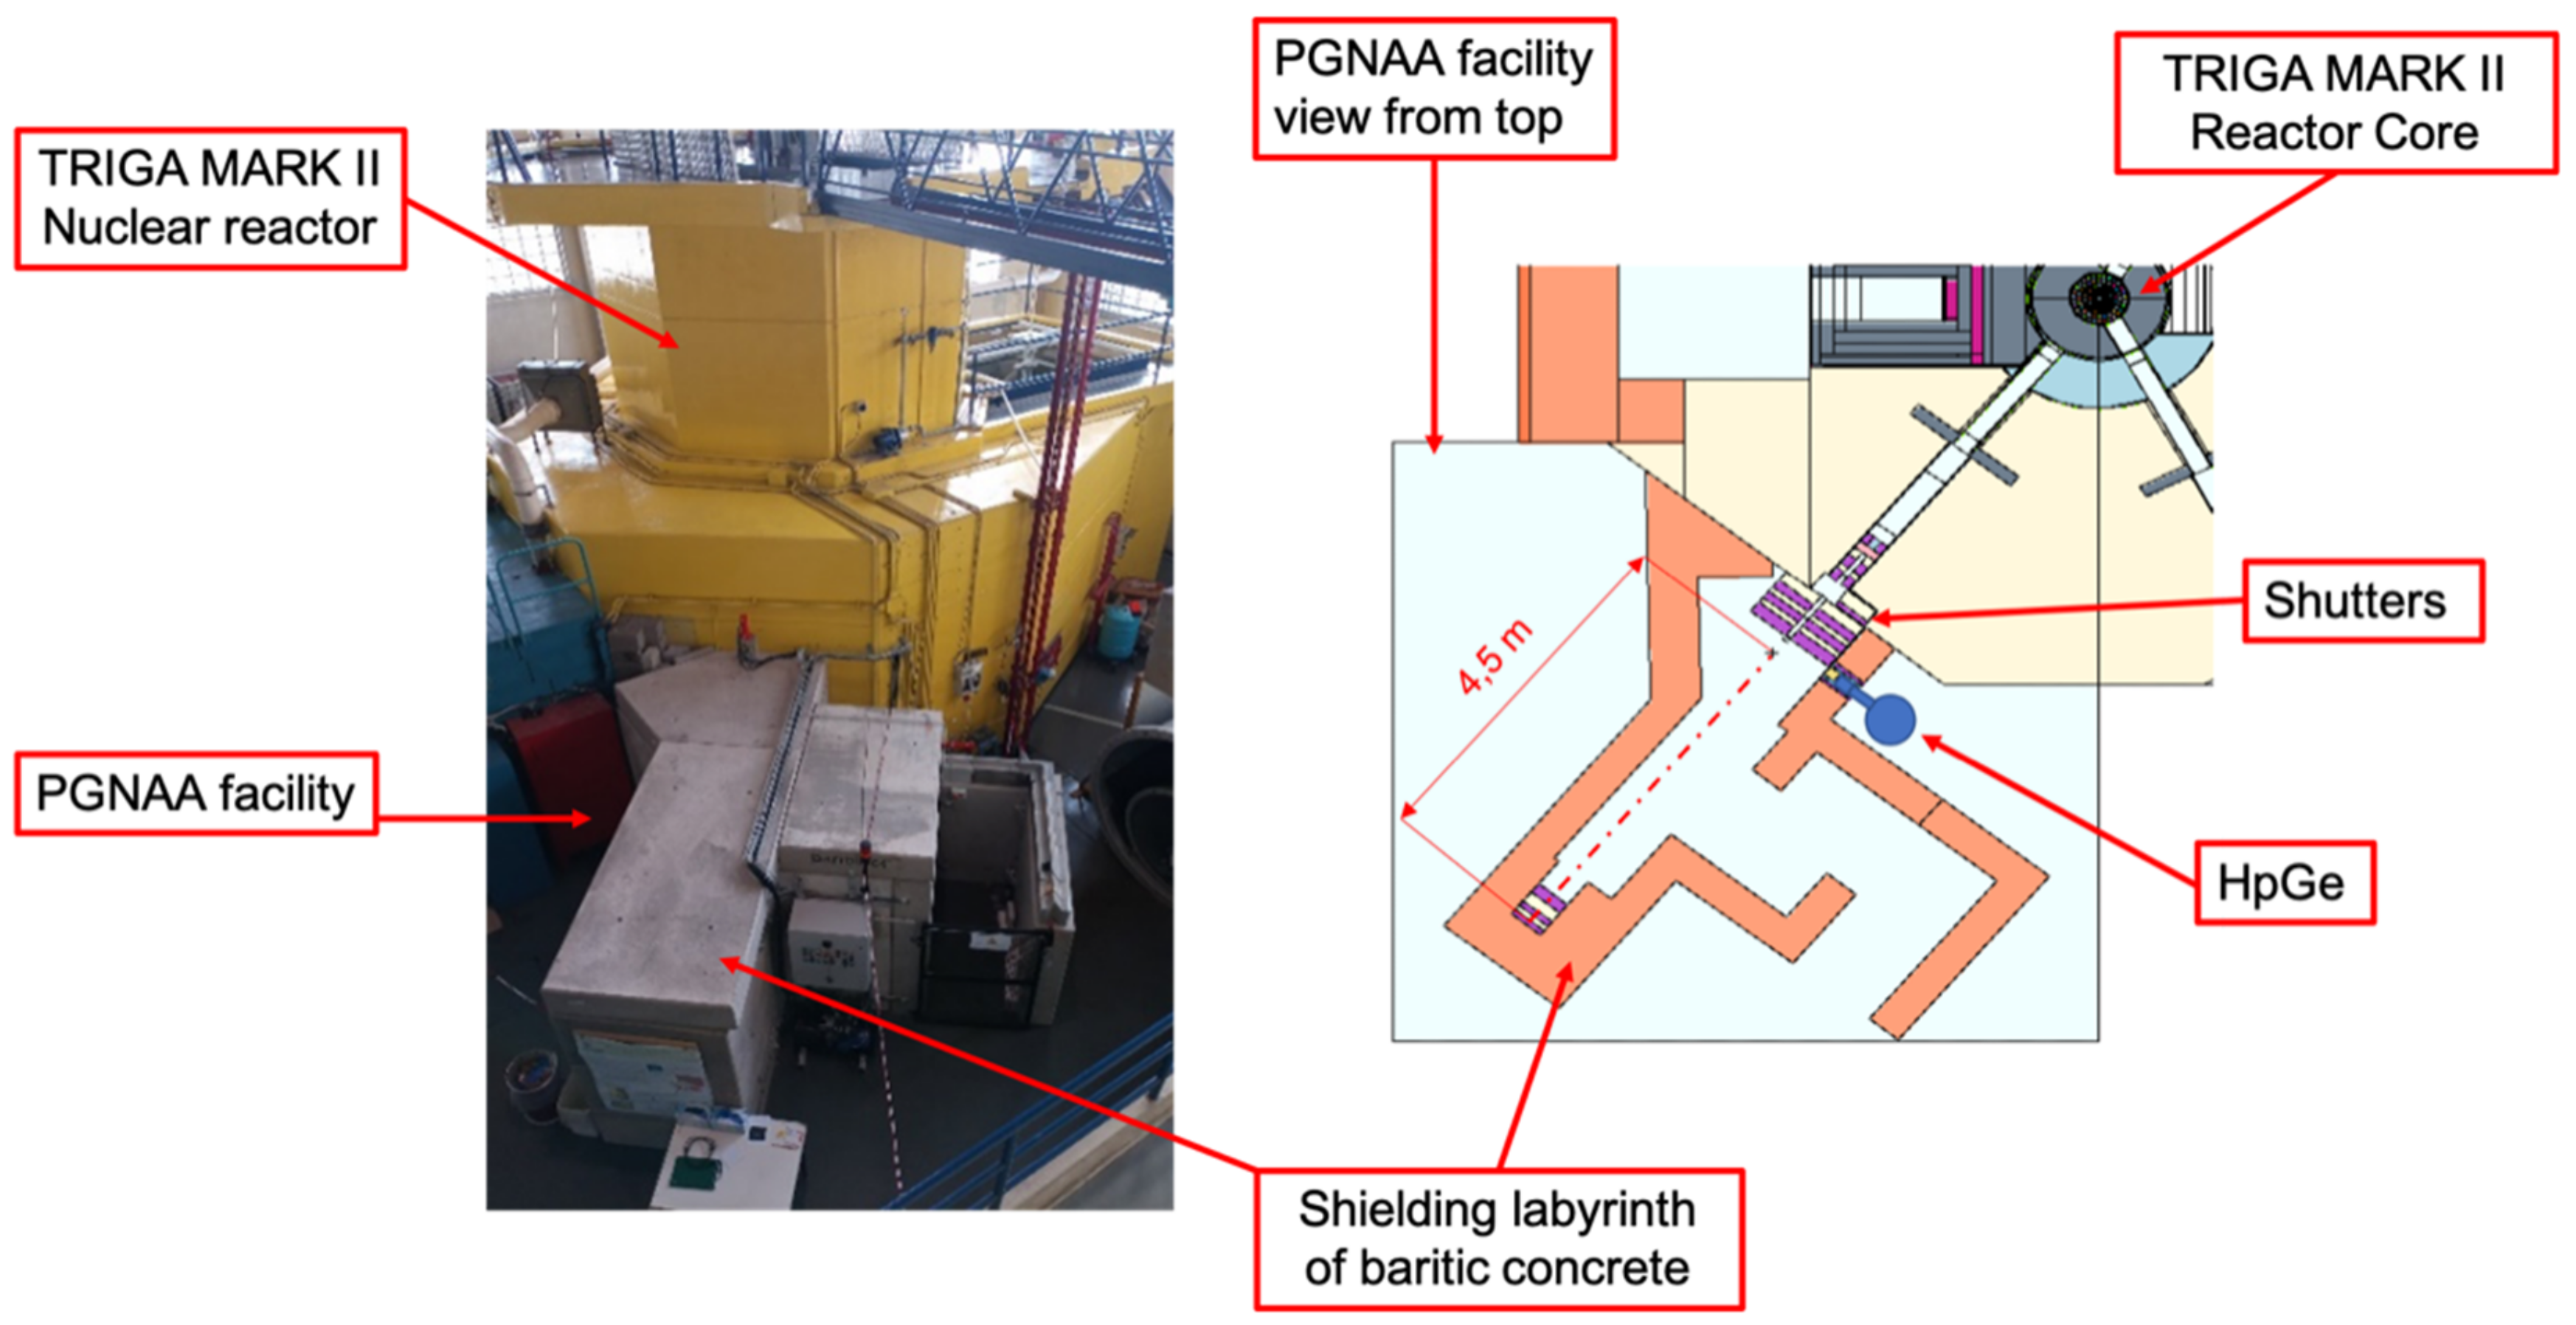
3.2. Gamma-Ray Detectors-PGNAA

The Prompt Gamma Neutron Activation Analysis is based on the detection of prompt emissions of nuclear electromagnetic radiation (nuclear de-excitation), following the radiative capture of a neutron by a nucleus. PGNAA enables both qualitative and quantitative analysis, the former consisting in the identification of the elements present in a sample, the latter aiming at determining the concentration (or, equivalently, the mass) of each of the elements traced. A very appealing feature of PGNAA is the possibility to carry out simultaneous non-destructive and non-invasive bulk analysis, without sample preparation. PGNAA enables potentially detecting all the elements of the periodic table and in particular the elements with low Z and those with a high neutron capture cross section, such as B, Cd, Sm and Gd. It has allowed the analysis of a wide range of materials, such as metals, rocks and minerals, ceramics and glass, stone objects (obsidian, flint, porphyry, metabasic rocks, etc.).
The PGNAA facility installed at the LENA Laboratory of the University of Pavia, devoted to studies in CH, is a unique installation in the national scenario and was funded and developed within the CHNET_TANDEM project, a collaboration between INFN-CHNet and LENA. The horizontal channel B of the TRIGA Mark II nuclear research reactor was selected, due to higher thermal-to-fast neutron flux ratio with respect to other channels. For the PGNAA facility construction, a campaign of Monte Carlo simulations was performed with the MCNP code using a complete model of the TRIGA MARK II nuclear reactor of LENA. The model was implemented adding the geometry and materials of the PGNAA facility, shown in Figure 11.
Two groups of calculations were performed: one to optimize the collimators and to characterize the neutron beam, and another to evaluate the shielding of the facility for radioprotection purposes.
The main components of the facility are the collimators and the filters inserted in the beam hole, two shutters, the shielding labyrinth made of baritic concrete, the HPGe detector (n-type) and the data acquisition system in a separate room. The thermal flux available at the irradiation position is approximately 5 × 106 cm−2 s−1. The detector is a hyper-pure germanium (HPGe) n-type detector, i.e., with a reverse electrode in coaxial geometry. The main characteristic of this HPGe is that the positive electrode is on the outer surface of the Ge crystal and consists of a thin layer of Ge with implanted boron ions (thickness: 0.3 μm). The negative electrode is on the surface of the internal cavity of the crystal and consists of a thin layer of Ge with diffused lithium ions (thickness: 700 μm). The reverse configuration enables a much longer detector life in the presence of high neutron fluxes, indeed the external contact consisting of implanted boron ions, has not only the function of guaranteeing the low-energy (up to 3 keV) photons detection, but also of protecting the crystal from the effects of radiation damage, that causes hole trapping in Ge. Unlike the case of p-type coaxial detectors, holes are collected by the external electrode of the n-type detector and thus they have less distance to travel. With less distance to travel, they are less probable to be trapped in the detector material damaged by irradiation. The consequence is an extension of the life-time of the detector. Of course, the resistance to radiation damage depends also on other factors, but experimental evidence suggests that the n-type detectors are approxi[mately ten times more resistant to damage with respect to conventional Coaxial Ge detectors.
Detector signals are fed to a Canberra 2002 CS preamplifier, whose gain has been reduced from 500 mV/MeV down to 100 mV/MeV. While the former value allowed handling signals corresponding to energies in the [0–3.2 MeV] range, the latter enables expanding this range up to 15.7 MeV, as needed to use the PGNAA technique, where most (approximately 75%) of the prompt photons do not have energies limited to 3 MeV but which extend up to 15 MeV [180,181,182,183].

4. UV-VIS-IR Radiation Detectors

4.1. Luminescence Induced by Electrons, Ions and X-rays

The emission of photons in the UV-VIS-IR range can be induced by different probes (e.g., electrons, ions, X-rays), and it is not uncommon to find the acquisition of the luminescence signal coupled with the simultaneous acquisition of signals of other type of radiation. The properties of the constitutive materials in the CH field can be investigated also by means of their induced luminescence. At present, many experimental configurations for luminescence measurements can be used, depending on many parameters, such as the desired wavelength or wavelength range, kind of result provided (map, spectrum, etc.), efficiency, time required for a measurement, dimensions and weight of the instrumentation, portability, need to darken the room, ease of use and costs. In the following discussion we will focus only on the setups used in the CH field. Cathodoluminescence (CL) is the emission of a luminous signal from a target hit by an electron beam. This technique finds frequent application in the geological field but can be as well used in the art market for the authentication of gems, such as yellow diamonds [184], or in provenance studies for gems and stones [185,186,187].
As luminescence can be a fingerprint of the compound and its structural state, CL has also been employed in the characterization of mineral crusts developed on cave painting [188] or for distinguishing original and restoration material in marble façades. The electron beam is accelerated in vacuum, in a dedicated cold cathode stage [189] or directly in the chamber of a Scanning Electron Microscope (SEM), where microprobe elemental analysis can also be performed [190].
Imaging is the most common output for CL analysis, as the different wavelengths of the emitted light may allow for a rapid identification of minerals. For the acquisition of CL images, a digital camera is usually coupled with an optical microscope (in some cases equipped with a polarizer). In some studies, CL is collected both as photograph and spectrum, arranging on the same SEM a CCD camera and a spectrometer that can range from 200 to 900 nm.
Differently from CL, ionoluminescence (IL) exploits MeV ion beams to induce light emission. It offers two important advantages over CL: a deeper region of analysis and a higher sensitivity [191]. This allows, for example, the use of features such as trace element which act as light emission activators for provenance purposes [192,193].
In addition, taking advantage of the sensitivity of IL to small changes in the material structure, IL is a good monitor of radiation damage for pigments and varnish in paintings [194,195] (no IL spectrum change → no or negligible damage). IL can be applied for authentication studies of gemstones [196], characterization and correct assignment of ceramic productions [197]. Moreover, external beam IL enables non-invasive measurements in air or in controlled atmosphere (usually He), that better meet the needs for archaeological and artistic samples. IL imaging is not particularly common: when applied, the setup is similar to the one for CL, combining a microscope and a CCD camera. Definitely more frequent is the acquisition of the IL spectrum [198]: an example is shown in Figure 12.
The basic setup consists of an optical fiber (or a bundle of them) which leads the signal to a spectrometer; the fiber has a diameter that varies between 400 µm and 1 mm. In some cases, a collimating lens can be added at the entrance of the fiber, to maximize the captured luminescence. In most studies, IL and PIXE are used simultaneously. In the application of IL, there is a wide use of cooled spectrometers (thermoelectrically or nitrogen cooled): this option enables obtaining a better signal-to-noise ratio, with sharp peaks that facilitate their attribution. The use of a CCD detector enables collecting the full spectrum at once, decreasing the acquisition time. This feature offers a great advantage over measurements with a monochromator, scanning one wavelength at a time, and in addition, enables avoiding spectral distortions due to the creation of luminescence centers during irradiation in small areas in some materials. The detected wavelength range frequently extends up to 1000–1100 nm, to reveal the features in the NIR region (typically with a 1 nm resolution). The implementation of an IL setup on a scanning apparatus gives the opportunity to acquire wavelength-selective bidimensional IL maps, similar to the PIXE elemental maps, a feature which enhances the complementarity of the two techniques.
Considering that X-ray based analytical techniques are very popular in the archaeometric community, especially X-ray fluorescence (XRF) for elemental analysis and Radiography (RX) or X-ray Computed Tomography (XCT) for structural information, the use of X-rays also as source of luminescence excitation is starting to take hold. X-ray luminescence (XRL) can be recorded as image, for example as an easy tool, complementary to RX, for discriminating saltwater and freshwater cultivated pearls [199]; otherwise an XRL spectrum can be acquired with a setup similar to IL one, composed by an optical fiber system for signal collection and transportation to the spectrometer.
Very few applications to CH items have been performed so far, finding some examples in lapis lazuli characterization [200,201].
The INFN-CHNet network instrumentation covers most of the techniques presented above. For IL, in particular, several setups have been developed, to exploit both the broad- and the micro-beams available at the INFN accelerators. IL microscopy and imaging can be performed at INFN-LABEC, where, working in air with a broad beam (with ~6 mm2 area, obtained defocusing a micro-beam), the image is captured by a Prosilica GC2450C CCD color camera equipped with a zoom lens set at a 45° angle with the beam direction. The objective, a TECHSPEC VZM 1000 Zoom Imaging Lens, enables magnifications from 2.5× to 10×, with a working distance of 35 mm [202]. The components employed to implement this setup have been selected in order to obtain information of the same kind of that provided by in-vacuum CL microscopy, but with the great advantage of performing the analysis in air without any sample pre-treatment. This setup has already proven its potential in the study of lapis lazuli provenance, both on semi-thin sections (approximately 100 μm) and on artworks. On the same external scanning microbeam line, μ-IL spectroscopy has also been developed. The optical system is based on a collimating lens set at ~60° with respect to the incident beam while the collected photons are focused on the common end of a Y-shape optical fiber with diameter of 200 µm. The luminescent signal is then split in two different paths: the 85% of the signal reaches a CCD based OO USB2000 spectrometer (bandwidth 200–900 nm, spectral resolution 2 nm) for spectra acquisition, whereas the remaining 15% follows the other branch of the fiber to a PMT HAMAMATSU R376 photomultiplier, connected to the microbeam acquisition system. This second setup can produce panchromatic IL maps, or monochromatic ones if wavelength-selective filters are interposed between the fiber and the PMT [203,204].
The versatility of this system is the main reason that drove the design of the instrument: all the luminescence outputs can be collected, depending on which aspect has to be highlighted; if a complete characterization of a point is needed, the whole luminescence spectrum of a single point can be recorded; if the luminescence characteristics of the sample are already known and only the distribution of the different luminescent phases is needed, then a mono or pan-chromatic maps can be quickly acquired.
A simpler removable apparatus for luminescence has been developed by the Turin node in collaboration with the INFN-LNL, where it is usually setup at the AN2000 accelerator microbeam line in a μ-IL version. An Ocean Optics 74-UV collimating lens is fixed inside the high-vacuum chamber and connected to a spectrometer through two optical fibers, one inside and one outside the chamber (both with diameter of 600 µm), linked by a vacuum feed-through [205]. The spectrometer currently in use is a thermoelectrically cooled Ocean Optics QEPro, with a bandwidth from 300 to 1000 nm and interchangeable entrance slits, that provides spectra with an optimal signal to noise ratio that can be calibrated in efficiency [206].
At both INFN-LABEC and INFN-LNL facilities, IL can be coupled with PIXE analysis, as well as RBS and PIGE. Additionally, first attempts to exploit non-continuous ion beams have been performed applying time-resolved ion beam-induced luminescence (TRIBIL) [207] at DEFEL [208], the pulsed beam facility of INFN-LABEC. These measurements, carried out in vacuum, enable studying the time evolution of IL, revealing diverse average decay time for different dose rates, and thus resolving in some cases overlapping features that would be indistinguishable using a continuous beam. Since the acquisition has to be fast and synchronized with the ion beam, the whole spectrum is not acquired at once, but the luminescence signal is detected using a photomultiplier tube (PMT, Electron Tubes/9256 KB) with a spectral range between 290 and 680 nm and enhanced green sensitivity. Additionally, in this case, optical filters can be used for wavelength selection before the PMT output is sent to a sampling digitizer VME module (CAEN/V1720).
Aiming at investigating the potential of XRL technique in the CH field, the Turin node also designed and implemented two different setups, one for laboratory measurements and the second dedicated to in situ analysis. In laboratory, XRL signal is collected through a modified Ocean Optics ISP-REF integrating sphere and led to the spectrometer (Ocean Optics USB4000 fitted with a 600 L/mm grating blazed at 500 nm) through a 1 m long optical fiber with a diameter of 600 μm. For the portable apparatus, the setup is exactly the same used for μ-IL at LNL, except for the vacuum feed-through, not needed in air: signals are gathered by an Ocean Optics 74-UV collimating lens, at ~105° with respect to the beam direction, linked to the Ocean Optics QEPro spectrometer through the same optical fiber of the previously described setup. The possibility to use the same setup for different kinds of measurements is really useful, both for the direct comparison of data acquired with different probes and in the speed-up of the intensity calibration process.
The research on XRL for archaeometry is still at its very beginning and one of the next steps might be the application of the time-resolved mode, using a pulsed X-ray source.

4.2. Photometric and Colorimetric Detectors

Photometric and colorimetric techniques are widely used in diagnostic studies and in conservation and restoration programs. The most performed measurements are light characterization and color specification, which use the luminous efficiency function, V(λ), as a weight function, that describes the average spectral sensitivity of human visual perception of brightness [209].
Photometric techniques (limited to the visible range, 380–780 nm) are of great importance in terms of fruition and valorization of works of art, because they allow for the characterization of the emission spectrum of light sources and thus the evaluation of chromatic light rendering. Photometric measurements consist in the characterization of light sources in terms of illuminance (lx), light intensity (cd) and luminance (cd/m2) and are made by illuminometers and spectroradiometers.
Colorimetric techniques are crucial for conservation because they allow for evaluating changes in the optical properties of polychrome artworks, such as paintings. As is well known, the color of an object depends on its ability to reflect, transmit and absorb light.
The knowledge of the spectrum of reflected light, acquired under the standard conditions defined by the Commission Internationale de l’Eclairage (CIE) [210,211,212], enables the color specification and the quantification of the color differences. In color measurements, both colorimeters and spectrophotometers are used to acquire optical information in terms of Spectral Reflectance Factor (SRF%) and color coordinates, useful to the color specification and the color difference quantification [213,214].
The instruments listed in Table 1 are equipped with silicon photon counters. In photodiodes, the measured current is proportional to the radiant power of the incident light. Recently, PIN photodiodes are also used to increase the speed of response, the responsivity, and the linearity over the pn ones. In photometric applications, photodiodes operating in the photovoltaic mode are the most used because they ensure lower noise signal and are less sensitive to changes in environment temperature. Their spectral response, based on human eye perception, is in the range 380–780 nm, the peak sensitivity wavelength is set at 550 nm and the photosensitivity at approximately 0.24 A/W considering a photosensitive area size of max 3.6 nm × 3.6 nm [215,216].
The color measurements, performed by colorimeters, are carried out by RGB color sensors that are three-element silicon photodiodes specifically designed for red (590–720 nm), green (480–600 nm) and blue (400–540 nm) spectral regions. The peak sensitivity wavelengths are, respectively, set at 620 nm for Red, 540 nm for green and 460 nm for blue with a photosensitivity between 0.2 to 0.5 A/W [217]. Colorimeters are designed to automatically provide the chromaticity coordinates in different color spaces codified by CIE. Colorimeters are generally constituted by a light source, an optical device for illuminating the sample and detecting the emitted light under standard geometries according to CIE recommendations. An optoelectronic device is also present in order to analyze the light signals [218].
Portable spectrophotometers and spectroradiometers for CH applications make use of spectrometers equipped by fixed diffraction gratings, that allow detection of light signals at different wavelengths using different elements of the photodiode array. The silicon photodiode array consists of multiple elements of the same size, formed at equal spacing in one package. In particular, the recent models of spectrophotometers mount dual 40-elements while spectroradiometers have generally a photodetector composed of 512 linear image sensor elements. Only in the spectrophotometers is the lighting system, generally a xenon-flash lamp, integrated on the instrument together with an optical apparatus to illuminate and to collect the reflected light according to CIE standard geometries. In the spectroradiometer measurements, instead, the CIE standard geometries must be set by the user.
The Catania section currently uses silicon photodetectors embedded in commercial instrumentations that are satisfactorily precise, easy to operate and fast enough to measure many samples a day, an important requirement in CH, especially for in situ measurements. All the instrumentations are portable and, thanks to non-destructive and non- invasive methodologies, are applied in a lot of diagnostic campaigns and conservation and restoration programs on many types of archeomaterials and works of art, in association to other techniques in interdisciplinary and multidisciplinary studies.
The perspectives of the photometric and colorimetric techniques and the related instrumentations concern the development of new systems allowing, at the same time and possibly in remote use, the lighting control also in terms of emission spectrum, and the color specification in order to monitor the conservation state of the artifacts.

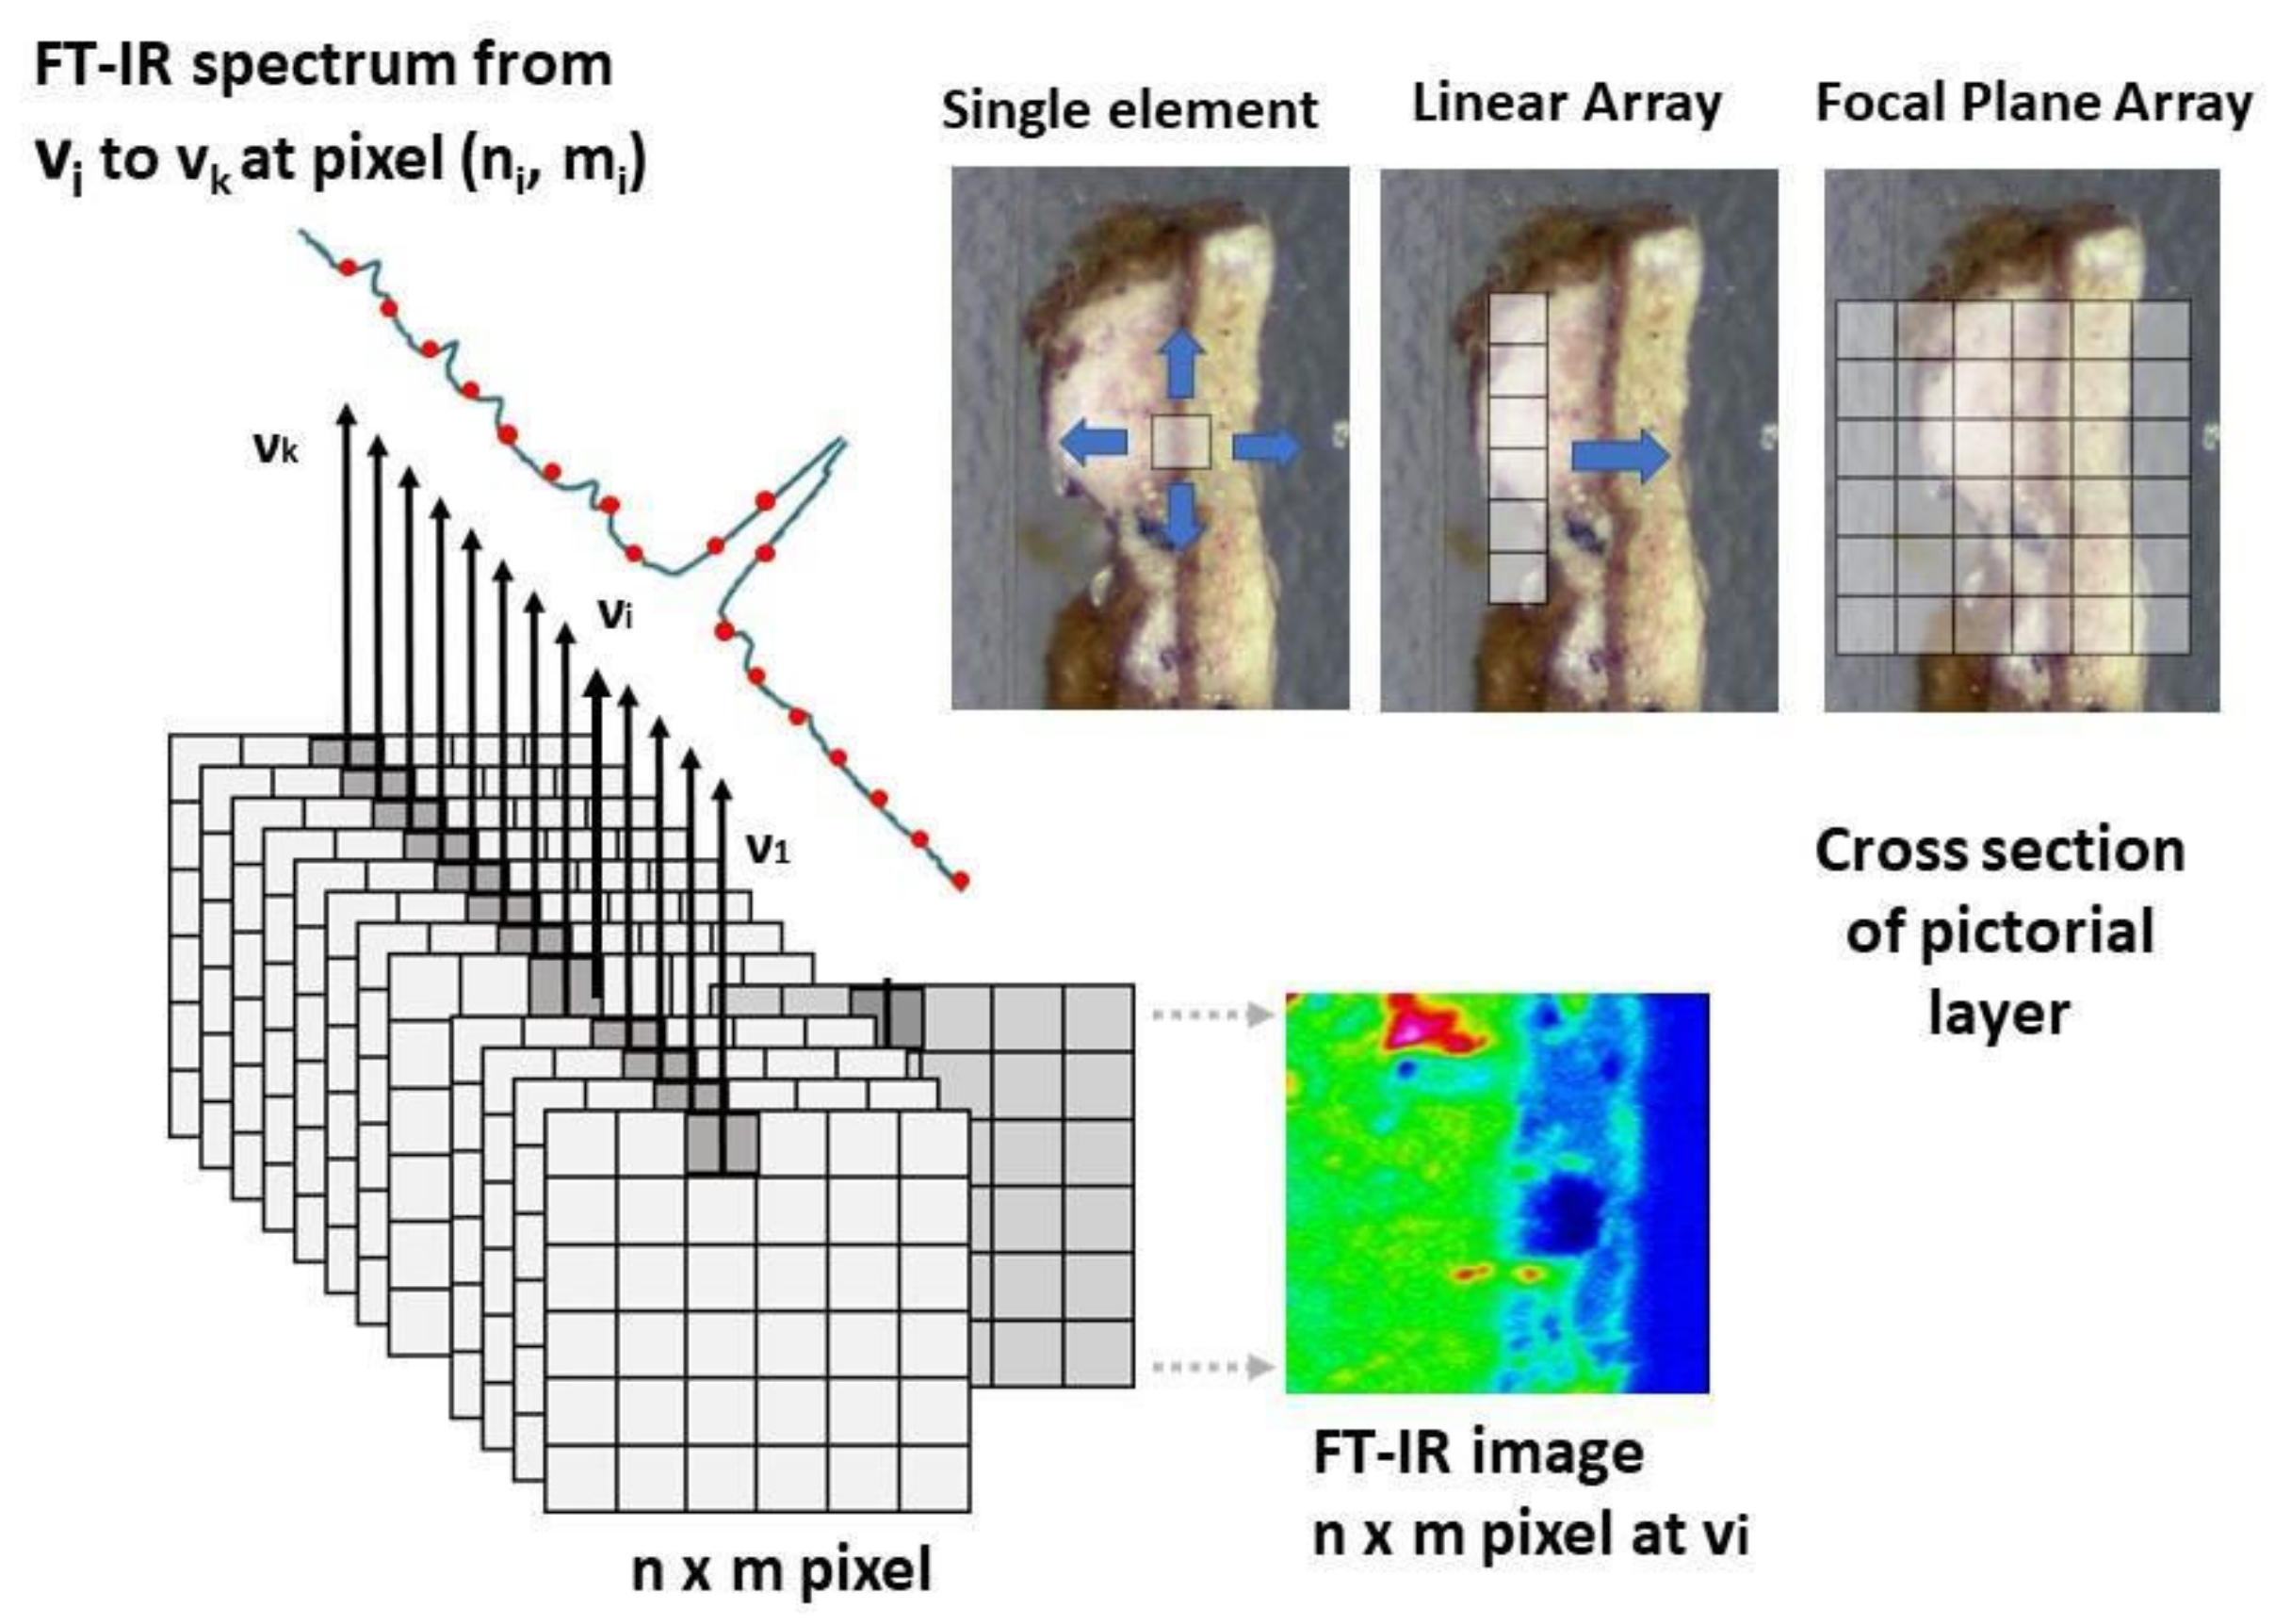
4.3. Infrared Detectors for Fourier-Transform Infrared (FT-IR) Spectroscopy

Fourier-transform infrared spectroscopy (FT-IR) is a molecular technique that exploits the interaction of IR radiation with matter by absorption, emission, or reflection. It is used to study and identify in a solid, liquid, or gas. Absorption of IR radiation results in small energy differences in the vibrational and rotational states of molecules. Typical frequency units used in IR spectra are reciprocal centimeters (wave numbers), with the symbol cm−1. IR wavelength units are commonly given in micrometers, symbol μm, which are related to wave numbers in a reciprocal way.
Molecular bonds with an electric dipole moment that can change due to atomic displacement are IR active. These vibrational modes are quantitatively measurable by IR spectroscopy, providing a unique, label-free tool for studying molecular composition and dynamics without perturbing the sample. The IR region of the electromagnetic spectrum is conventionally divided into three regions: near infrared (NIR: 14000–4000 cm−1), to study the harmonic and combined modes of molecular vibrations; mid-Infrared (MIR: 4000–400 cm−1), the region most used to detect fundamental vibrations; finally, the far infrared (FIR: 400–10 cm−1), to study low-frequency vibrations.
The infrared sources used for FT-IR analysis are generally thermal sources, electrically heated (between 1500–2200 K) inert solid filaments. For example, Globar sources (silicon carbide filament, SiC) have a spectrum of approximately 4000 cm−1 in the mid-IR, while mercury arc lamps emit in the far-IR region. In addition to the abovementioned conventional sources, synchrotron radiation (SR) sources are used to analyze samples offering huge advantages in terms of brilliance, spectral quality (signal/noise ratio, lateral resolution) and extended spectral range from NIR to FIR [219,220,221,222,223].
The INFN DaΦne-Light synchrotron radiation IR source [224] offers beam time to users from different disciplines, including cultural heritage material analyses.
FT-IR spectroscopy is usually used in the field of CH for the characterization of the main constituents of works of art, such as pigments, binders, degradation products and synthetic materials due to restoration treatments. [225,226]. The IR region of the electromagnetic spectrum is conventionally divided into near infrared (NIR: 14000–4000 cm−1) to to study the harmonic and combined modes of molecular vibrations; mid-infrared (MIR: 4000–400 cm−1), the region most used in the field of CH to detect fundamental vibrations; finally, the far infrared (FIR: 400–10 cm−1), to study low-frequency vibrations.
FT-IR spectroscopy can be performed in different modalities, depending on the shape and size of the sample: macro-FT-IR, single point micro-FT-IR and mapping or imaging. Different detectors are used depending on the acquisition mode. Therefore, each configuration of the FT-IR experiment, and consequently the choice of the detector, is strictly dependent on several factors: the characteristics of the analyzed sample (shape, size, etc.), the spectral range of the analyses, the spectral resolution, and the optical throughput (percentage of the beam reaching the detector) [227,228].
Infrared detectors can be classified into two classes: thermal detectors and photonic (quantum) detectors [229]. The former uses the infrared energy as heat and their photosensitivity is independent from wavelength; they do not require cooling but have the disadvantage that response time is slow, and the detection capability is low. On the contrary, quantum detectors offer higher detection performance and a faster response speed (ms) although their photosensitivity is dependent on wavelength. In general, quantum detectors must be nitrogen cooled for accurate measurement, except for detectors used in the NIR range [230]. A wide variety of detector materials have been adopted for the fabrication of photon- and thermal detectors. Traditional materials for cooled detectors are InSb for MIR and HgCdTe for MIR and NIR. Extrinsic doped and deeply cooled semiconductors, such as Si and Ge, are operated in the far-infrared spectral region.
The most significant figure of merit used to compare detectors is the detectivity (D*), a figure of merit used to characterize performance, equal to the reciprocal of noise-equivalent power (NEP), normalized per square root of sensor area and frequency bandwidth (reciprocal of twice the integration time)
D* = [cm × Hz1/2/W]
A is the area of the photosensitive region of the detector, f is the bandwidth and Noise Equivalent Power (NEP) is the quantity of incident light equal to the intrinsic noise level of a detector.
Pyroelectric detectors such as Deuterated Triglycine Sulfate (DTGS) are widely used in analyzing CH materials, despite their low D*, due to several advantages such as the capability to work at room temperature, without the need for cryogenic cooling. This can overcome difficulties related to operator safety and enables installation on portable instruments for in situ measurements. In addition, the possibility to cover a wide spectral range (10000–100 cm−1) in one shot enables the identification of some inorganic compounds that are not active in the MIR range (i.e., oxides or sulfides) [231,232,233].
Some issues related to the high signal/noise ratio can be avoided by increasing acquisition time and opening the field aperture, in order to increase the light flux to the detector element.
When dealing with micrometric-size samples, higher D* detectors are required. HgCdTe (MCT) is a photoconductive detector, the spectral response of which changes with detector element temperatures: as the temperature increases, the D* decreases and the spectral response shifts to the shorter wavelength region. The D* of MCT is inversely proportional to the amplitude of the band and it is therefore possible to compare detectors of the same type, but with different areas, from their D* values [234], as shown in Table 2:
A wide-band MCT detector offers approximately four times higher sensitivity than a DTGS, while the narrow-band MCT detectors has the highest mid-IR sensitivity and is ideal for low throughput analysis when high sampling rates are required [10]. Using a MCT, the spatial resolution cannot be smaller than the theoretical diffraction limit of approximately 10 µm, leading to a low signal/noise ratio for beam aperture dimensions of 10 × 10 µm2 [235].
In recent years, the development of scanning systems or imaging devices has enabled obtaining chemical maps at a micrometric scale. Single-element detectors are used to obtain point by point maps by using a motorized stage (X,Y,Z) and apertures to select the spatial resolution; alternatively, 1-D or 2-D imaging systems are much faster thanks to the use of multiple element detectors arranged in an array, with a linear or a rectangular/square format (Linear Array (LA) and Focal Plane Array (FPA), respectively) (Figure 13).
Chemical imaging enables a detailed and spatially resolved chemical analysis, based on the sample spectroscopic properties, where each pixel of the image detects an entire FT-IR spectrum. FT-IR imaging systems have been largely employed in CH by using FPA detectors that collect typically 64 × 64 infrared spectra simultaneously, significantly reducing the acquisition times [236,237].
Despite the very appealing features of FPA detectors, the obtained spectra are affected by thermal noise and show lower signal/noise ratio, especially in the reflection mode and in the presence of poorly reflective sample surfaces. Moreover, the 900 cm−1 cut-off of FPA detectors does not allow for the identification of substances that show characteristic absorption bands below this wavenumber.
Future development of IR detector arrays regards the improvement of pixel sensitivity, the increase in pixel density, the cost reduction in IR imaging array systems through the use of less cooling sensor technology combined with integration of detectors and signal-processing functions. Finally, the improvement in the functionality of IR imaging systems passes through the development of multispectral and hyperspectral sensors.
In the framework of the INFN-CHNet network, the DAΦNE-Light synchrotron radiation laboratory is a facility open to external users, able to provide chemical analyses on cultural heritage materials, namely pigments, binders, and degradation products. A Vertex70 V FT-IR interferometer is coupled with an Hyperion3000 IR microscope equipped with a 64 × 64 pixel Focal Plane Array MCT detector, giving access to micro and macro analyses, mapping, and imaging on different materials.
A portable FT-IR spectrometer, equipped with a room-temperature DTGS detector, is as well available for in situ analyses.

5. Particle Detectors

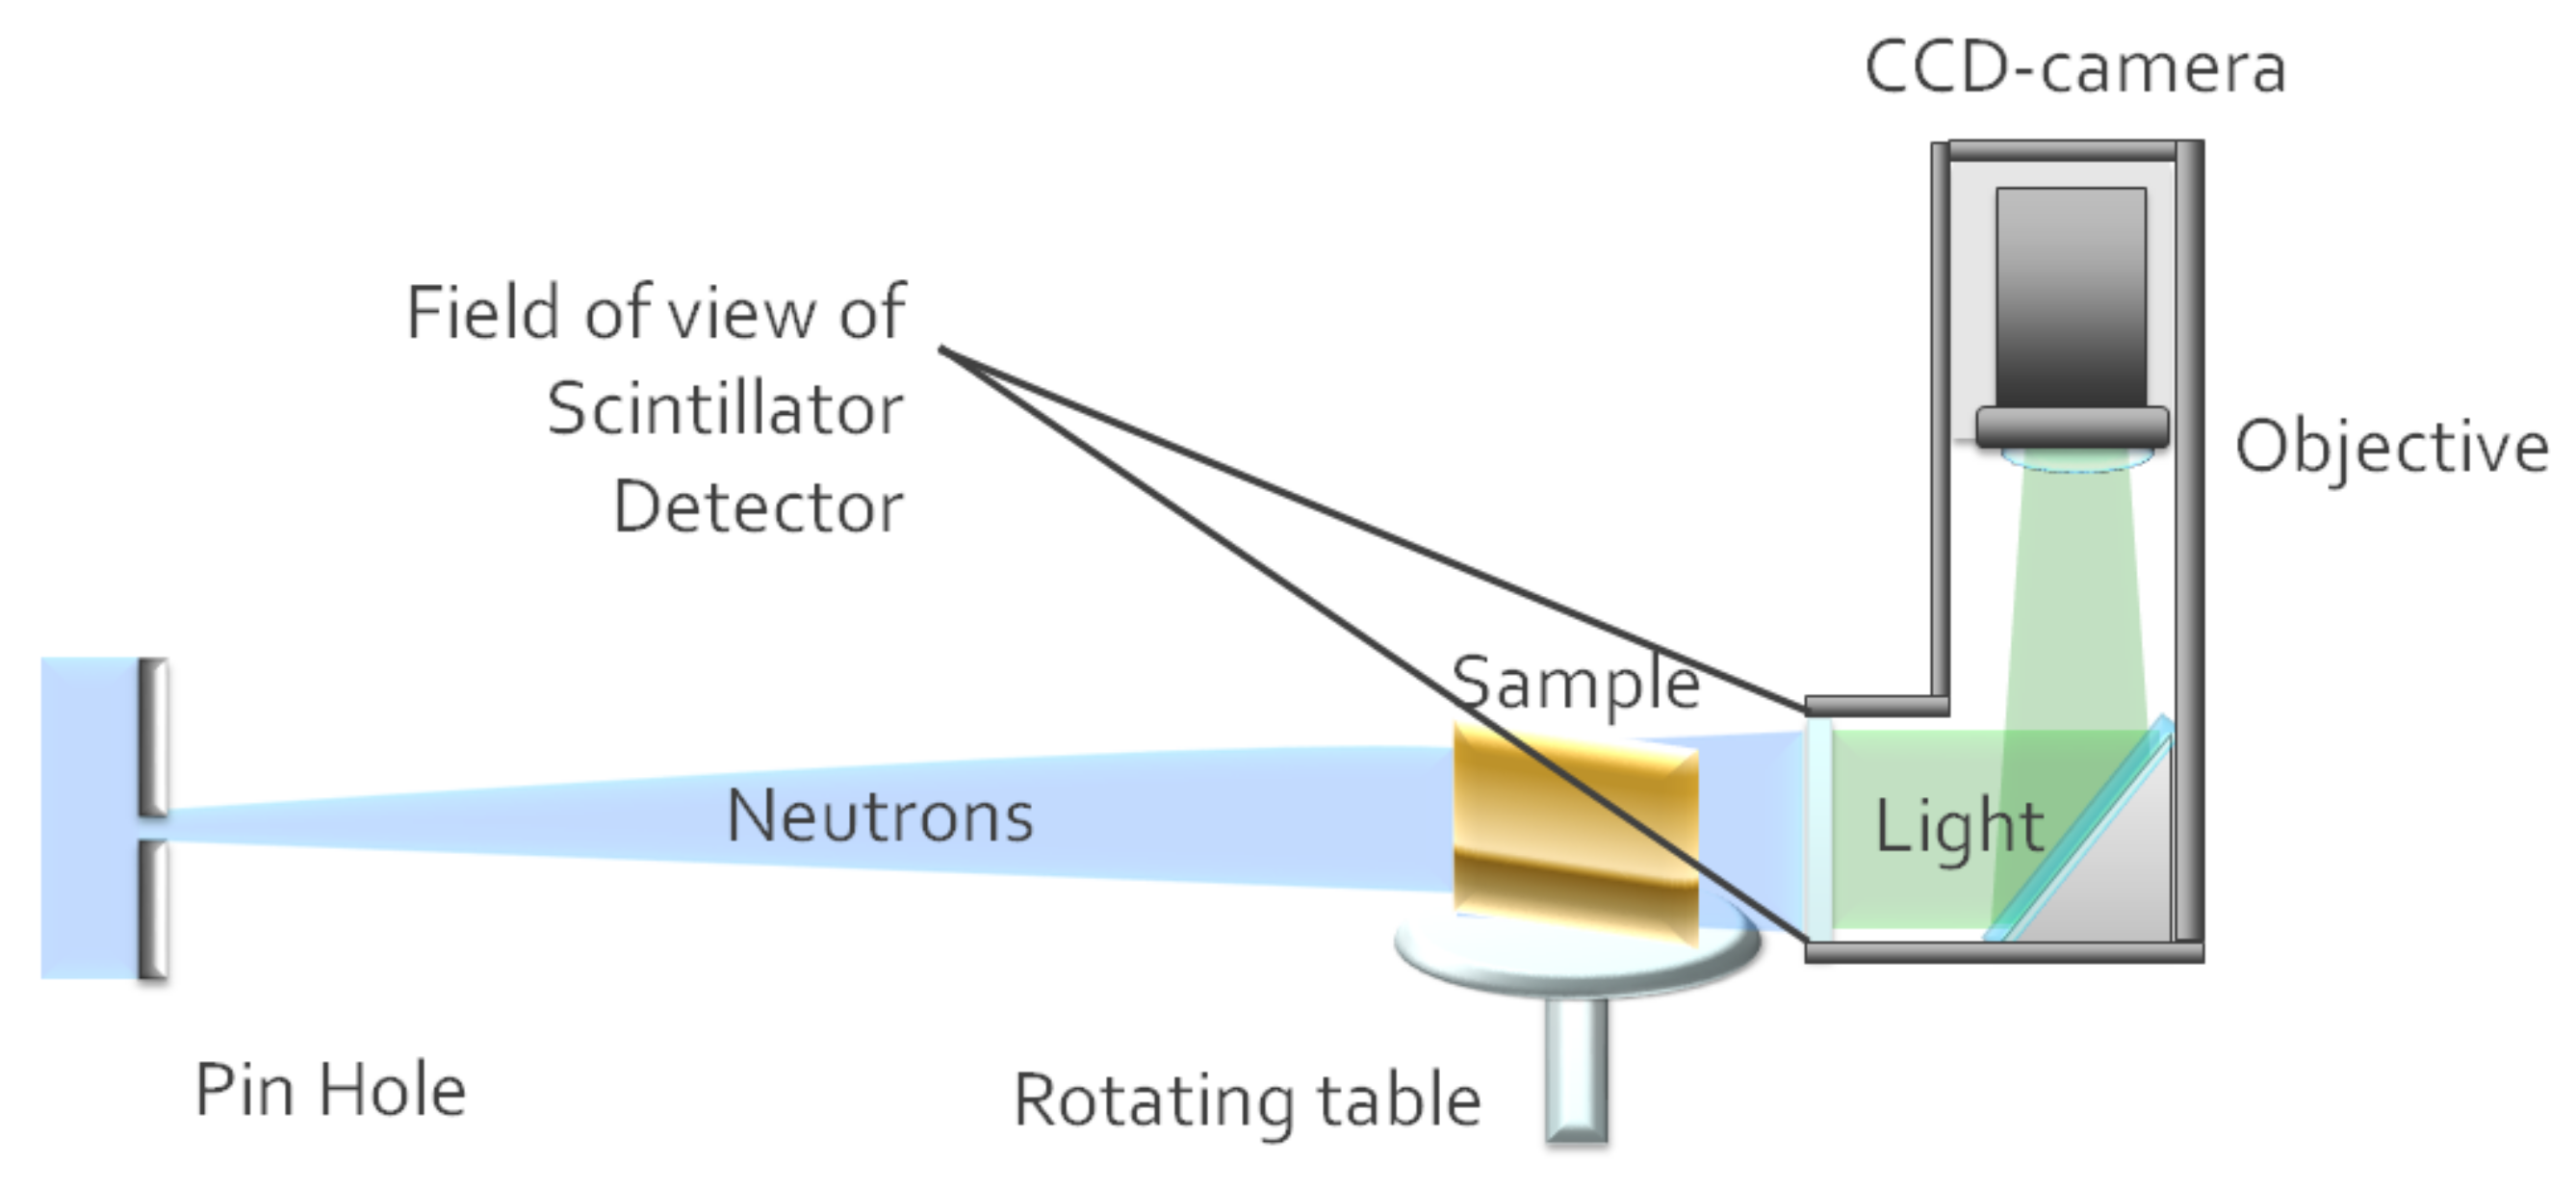
5.1. Neutron Detectors

Thermal- and cold-neutron scattering and adsorption methods are widely used in all material science fields since they can characterize structural, compositional, and dynamic properties of matter. Among the several techniques, some of them exhibit high potential in the application to CH: neutron diffraction and neutron imaging [238]. They are both non-invasive techniques, able to provide quantitative and morphological information on the bulk of the analyzed samples.
Neutron diffraction is based on the elastic (Bragg) scattering phenomenon and provides quantitative multiphase analysis of selected gauge volumes in different types of samples, without sample preparation. Polycrystalline phases generate a diffraction pattern with a peak position that is related to the sample structure and the intensity of which is proportional to the scattering power, depending on the nature and relative position of the constituting atomic species. The scattering power is known, and it is then possible to determine the relative concentration of the different crystalline phases via Rietveld refinement [239]. The neutron signal in diffraction instruments is revealed by the use of neutron detectors located at ad hoc angular orientation and distance with respect to the primary neutron beam and the sample position.
Neutron diffraction is a quantitatively reliable method and can be exploited in CH applications for investigative and conservative diagnostics. Investigation of the different phases and their relative concentration in the sample under study can provide useful information about manufacturing procedures. This is particularly effective in metal artifacts analysis for Cu alloys and steel artifacts. In the former, it is possible to determine the alloy composition and its microstructure (dendrites, segregation, etc.,…) [240]; and in the latter, it is possible to determine the C content and the thermal treatments of steel [241]. It has also been successfully applied to determine the elemental content in ancient coins made in Ag–Cu alloys [242]. Regarding conservative diagnostics, neutron diffraction enables quantification and localization in the bulk material of crystalline mineralization phases, giving hunts about correct conservation treatments [243].
Neutron imaging is based on the radiographic analysis of samples by measuring the intensity of the transmitted neutron beam passing through a sample. The beam attenuation will be generated by the different thickness, nature, and microstructure of the components within a sample, so that morphological characterization will be provided. Neutrons interact quite weakly with the different atoms and structures into the sample so that it is possible to obtain neutron radiographies also when a specimen is composed of heavy elements and has thickness of some cm. Radiographies are obtained by using detection systems with imaging capability, located behind the samples, and connected to an optic imaging system. Neutron imaging provides morphological and microstructural characterization of dense materials whenever X-ray radiography fails because either of the size or of the high Z number of the atomic species involved. Furthermore, neutrons can penetrate most metals while creating high contrast for many light elements, thus showing a behavior often the opposite of that of X-rays. For example, using neutrons, hydrogen (and thus organic materials) can be evidenced even when buried in ceramics or metals, fossilized bones in chalk rock or in ferrous “red” beds. Similarly, neutrons are often able to put into evidence the difference between very similar materials, such as enamel and dentine in fossil teeth. Even isotopes of the same element can be distinguished using neutrons. An overview about neutron methods in CH is given in [244].
A typical neutron imaging system is represented in Figure 14, where a scintillator screen is positioned perpendicular to the neutron beam and the light emitted is brought, via a 45° tilted mirror, to a lens, which focuses the scintillator image on a CCD camera. The mirror is necessary for easy positioning the camera out of the primary beam, so that a reduced amount of soft error or pixel damage occurs.
Neutron detectors are based on the conversion of neutrons into other charged particles through nuclear reactions, followed by their direct detection or by their conversion into photons with wavelength in the visible range. The first category of detectors is well represented by gas detectors, as 3He detectors. They are widely used in scattering experiments as neutron diffraction. 3He has a very high absorption cross section for thermal and cold neutrons (5333 barn at 25 meV neutron energy). This nuclear reaction is characterized by the emission of charged particles:
n + 3He → 3H + 1H + 0.764 MeV
The assembly typically consists of a grounded steel chamber filled with pressurized 3He gas with anode wire along the axis of the tube, at high gas pressure (10–50 bar). Between the wire and the chamber walls, a high voltage (few thousands of Volts) is applied. When a neutron enters the chamber and undergoes a nuclear reaction, a proton and a triton are produced and cause further ionization. The produced electrons are accelerated towards the anode by the potential difference between the anode and the external wall and generate an electron avalanche, which produces a high signal gain and enables the detection of single neutrons. 3He detectors have the highest efficiency among neutron-to-charged particle conversion processes, but, due to the rarity of this isotope, many alternatives have been studied and used, such as boron-based detectors or GEM gas electron multiplier (GEM) detectors [245].
The other category of thermal- and cold-neutron detectors is based on the use of scintillators, being the elements which undergo nuclear reaction with neutrons in direct contact with the fluorescent material, so that light signals are generated. Beyond being used in scattering experiments, scintillator detectors are the preferred detectors in neutron imaging. Usually the double conversion, neutron to charged particle to light, is performed using a chemical vapor deposition (CVD) of a mixture of a neutron-absorbing component (e.g., LiF) and a fluorescent compound (e.g., ZnS). Although the use of self-supporting neutron detectors would be definitely preferable, the present detectors need a substrate. Typically, a thin (order of 1 mm or less) Al sheet is used, which results quite transparent to thermal neutrons (Al attenuation coefficient 0.1 cm−1), minimizing the unavoidable spatial resolution worsening, due to neutron scattering in between sample and scintillator. The neutron absorption takes place thanks to the 6Li nuclei present (isotopic abundance is approximately 7.5%), according to the reaction:
n + 6Li → 3H + 4He + 4.79 MeV
The thickness of this compound is a compromise between the need to increase the light output (which would suggest increasing the thickness of the fluorescent compound) and the requirement to improve the light transmission (for which it would be better to reduce the thickness of the compound). Optimizing the detection system is thus carried out by optimizing the thickness of the scintillator screen and tailoring the neutron-sensitive element composition and its relative concentration with respect to the fluorescent one. If necessary/useful, it is also possible to add dopant elements to the fluorescent material, in order to shift the wavelength of the light output towards the maximum sensitivity range of the imaging system.
The typical scintillator screen, providing the best performances, can be composed using the following:
  • A neutron-absorbing component: LiF (6Li is a high neutron absorber, 940 barn of absorption cross section);
  • A scintillation component: ZnS;
  • A dopant: Ag, Cu (moving maximum light output wavelength to approximately 550 nm);
  • A composition ratio of LiF:ZnS ranging from 1:1 to 1:2;
  • A scintillator thickness range of 50–250 µm;
  • The substrate material and thickness: aluminium 0.5–1 mm.
Imaging applications sometimes need higher spatial resolutions than those provided by LiF/ZnS scintillators; it is thus necessary to reduce the thickness. As such, it is possible to use gadolinium oxide, both as a neutron absorber and scintillator material. By decreasing the thickness down to 15 µm, a 3-fold increase in terms of resolution with respect to the thinnest LiF/ZnS scintillators can be obtained. In general, the neutron-absorbing efficiency per unit volume is also increased with Gd, but light conversion is heavily hindered, so that the light output per absorbed neutron is 2–3-fold lower than the LiF-ZnS scintillator (at the same thickness). Consequently, Gadox is only used when high resolution is the most critical parameter. It is important to underline that spatial resolution in neutron imaging is limited not only by the detectors, but it often depends also on the limited neutron flux and especially by the fact that neutron optics is virtually non-existent, so that image blurring of the beam limits the resolution of neutron imaging. Another issue is the presence of gamma radiation in almost all neutron imaging facilities, making it difficult to obtain very good contrast images at very high spatial resolution.
In the reference frame of INFN-CHNet, the NICHE experiment is developing a neutron imaging station at the gate B of the TRIGA reactor of the LENA Laboratory in Pavia. NICHE aims at creating the first imaging system (radiography and neutron tomography) in Italy, specifically designed for the diagnostics of CH, to provide important information in many case studies, in particular in the archaeological and artistic fields.
Detector development in neutron imaging applications, thanks to the increased intensity of the new neutron sources, goes into the direction of spatial resolution improvement and energy/wavelength discrimination for microstructure analysis of crystalline systems. For example, Gadolinium oxysulfide (GOS) is indicated as a novel scintillator for ultra-high spatial resolution detectors in neutron imaging, with the perspective of achieving spatial resolution down to the micron level. The drawback of this system is an extremely reduced light output (~100 times lower than that of ZnS/LiF:Ag scintillators), which requires highly increasing the neutron flux to reduce the exposure time to reasonable levels [246].

5.2. Mass Spectrometry

Mass spectrometry (MS) is a set of analytical techniques used to discriminate charged particles, based on their different mass-to-charge ratios, which result in different trajectories in EM fields [247]. It is possible to discriminate different masses and measure relative concentrations of isotopes, atoms, or molecules, so, as a whole, mass spectrometers can be considered as versatile and highly sensitive detectors. A mass spectrometer is basically composed of three main modules:
  • An ion source (e.g., inductively coupled plasma source, thermal ionization source, glow discharge source, CS sputter source) to produce ions from the sample to be analyzed,
  • A mass analyzer (e.g., quadrupole mass filter, magnetic sector field, a combination of magnetic and electrostatic sector fields) to separate ions of different types, and
  • A detector (e.g., electron multipliers in general used for single collector instruments, or Faraday cups/combination of electron multipliers and Faraday cups for multi-collector devices) for the transmitted ions.
Mass spectrometry is widely used in several fields of science and technology. In particular, the elemental fingerprinting and the isotopic composition of archaeological materials and artifacts offer scientists information about the origin, provenance, use, chronology, authenticity, and manufacture [248,249,250,251,252,253]. MS analytical techniques are destructive, since the sample needs to be converted in the most appropriate chemical form for the analysis, and for this reason are bulk analytical methods. However, only a very small amount of sample, typically from a few to a few hundred mg, is required, and thus, in many cases, destructivity is not a real obstacle for the application of MS techniques in CH.
Within INFN-CHNet, the mass spectrometric techniques used are high-resolution inductively coupled plasma mass spectrometry (HR-ICP-MS) for elemental analysis at trace level, and thermal ionization mass spectrometry (TIMS) and stable isotope ratio mass spectrometry (IRMS) for the determination of isotope ratios of heavy (Sr, Pb, Nd,…) and light (C, N, O, S) elements, respectively. A surface analysis mass spectrometric technique, time of flight-secondary ion mass spectrometry (ToF-SIMS), is also available, enabling the detection of all organic and inorganic species, with their relative isotopes, in the mass range from 1 to 10,000 AMU. In addition, a particle accelerator is routinely used for accelerator mass spectrometry (AMS), which enables measuring rare isotopes in ultra-low concentrations and is mainly used for 14C dating.

5.2.1. HR-ICP-MS

High-resolution inductively coupled plasma mass spectrometry (HR-ICP-MS) is considered the most versatile technique for fast, sensitive, and multi-elemental analysis at trace and ultra-trace levels [254]. The inductively coupled plasma (ICP) is an effective ion source for elemental mass spectrometry operating at atmospheric pressure [255].
Normally, all commercially available instruments operate with Ar plasma obtained applying a radiofrequency of 27 MHz and a plasma temperature of approximately 8000 K. This setup enables the decomposition of the chemical compounds contained in the sample solution into their atomic constituents that are immediately and efficiently ionized in the plasma. In general, all elements with a first ionization potential below 8 eV are ionized more than 90%, while those with a first ionization potential between 8 and 12 eV are ionized by more than 10%. The ICP involves a ‘hard’ ionization because most molecules in the sample are completely atomized [256]. During the ionization process singly and doubly charged atomic ions as well as polyatomic ions are formed in the ion source. So, in addition to the singly charged atomic ions of the analyte of interest, other atomic and molecular ions are formed, thus resulting in potentially interfering species. Although quadrupole-based ICP-MS equipped with a collision/reaction cell is the most used worldwide, the development of high-resolution mass spectrometers, such as double-focusing sector field ICP-MS with single or multiple ion collectors, has been necessary to overcome limitations caused by spectral interferences (isobaric overlap, polyatomic ion interferences and double charged ions). By using an HR-ICP-MS operating in the high resolution mode (m/Δm = 10000), most target elements may be resolved from polyatomic interferences. However, the enhanced mass resolution results in a reduced ion transmission and, therefore, the improvement in selectivity comes along with a loss of sensitivity [257].
A typical HR-ICP-MS system is as follows: the sample, previously digested, thus having an acidic aqueous solution, is aspirated by a peristaltic pump, converted to an aerosol by a nebulizer in a cyclonic spray chamber and transported to the plasma torch through an Ar gas stream. Here, desolvation, vaporization, atomization and subsequent ionization occur. The positively charged ions are extracted from the plasma at atmospheric pressure and focused into the high vacuum of the double-focusing analyzer via the ion transfer optics, which accelerates sampled ions to 8 keV kinetic energy, while shaping and focusing the ion beam on the entrance slit. The system is designed for maximum ion transmission efficiency, stability, low mass bias and low background. Among all available geometries coming from the different exploited combination of the magnetic with the electrostatic sector, Mattauch–Herzog and Nier–Johnson geometries are the most important to mention here [258]. The combination of the magnetic and electrostatic fields results in the high-resolution properties of the HR-ICP-MS. These instruments can operate at a mass resolution of approximately m/Δm = 10000, sufficient to resolve many interferences.
Within INFN-CHNet, a HR-ICP-MS setup is installed at INFN-LNGS, based on a Thermo Element 2 double-focusing sector field, with a magnet designed for maximum speed measurements. Less than 150 ms is required for a 7Li–238U–7Li switch. The magnet coils are water cooled, for maximum mass stability. Element 2 combines a small magnetic sector with a radius of 16 cm and a 10.5 cm radius toroidal electrostatic sector in a reverse Nier–Johnson geometry. The magnetic sector field is employed for a directional focusing and the electrostatic one for energy focusing of ion beams respectively [259,260]. A schematic of Element 2 high-resolution double-focusing ICP-MS is reported in Figure 15.
The instrument is equipped with a guard electrode inserted between the torch and load coil in order to eliminate secondary discharge in the plasma and to decrease the ion energy spread, thus increasing ion transmission. This and the high acceleration voltage both contribute to the enhancement of the overall sensitivity. The guard electrode is particularly useful to perform cold plasma measurements. The computer controlled slit system of Element 2 consists of a single slit holder with three fixed slits. Therefore, according to the mass resolution settings and thus using different slit systems, measurements can be carried out at low mass resolution (m/Δm = 300), medium mass resolution (m/Δm = 4000) and/or high mass resolution (m/Δm = 10000) guaranteeing unambiguous elemental spectra. An electron multiplier is commonly used as a collector and detector of the ions. It consists of a series of electrodes in cascade. When an ion arrives on the first electrode, the emitted electrons hit the second electrode, which in turn emits a greater quantity of electrons and so on, resulting in a strong amplification of the signal. The signal is then digitized and organized in the mass spectrum.
Element 2 is equipped with a discrete dynode detection system, enabling both trace- and major element quantification in a single analysis. The ion beam does not directly strike the detector to initiate the electron cascade. In Element 2, the secondary electron multiplier uses a conversion dynode at −8 kV, which produces a uniform response across the mass range, operating in both the counting and analog modes according to the signal intensity. The detector switches from the counting to the analog mode. The high acceleration to −8 kV results in a mass-independent detector response, enabling fully automatic cross calibration between the counting and analog modes. The automatic cross calibration ensures a constantly updated detector response, allowing the linear dynamic range to be extended to 10 orders of magnitude. The dark noise measured with this instrument is less than 0.2 cps and the sensitivity achieved in the low mass resolution mode is greater than 106 cps/ppb (injecting a solution containing indium at 1 ngml−1 with a standard inlet system). This enables quantification from 10−6 to less than 10−15 (from ppm to sub-ppq concentrations).
HR-ICP-MS has the advantage to provide a rapid multi-elemental analysis, in addition to a high sample throughput, excellent sensitivity, precision and accuracy. Several studies in the CH field have been performed on metals and alloys, such as coins and lead ingots, to investigate particular aspects concerning the coin production, to reconstruct mining activities or to discover the origin of the lead used in a specific mint as well as to identify the geographical origin of raw materials and ancient trade routes [261,262].
Gomes et al. analyzed a set of lead artifacts [263] using quadrupole-based ICP-MS to determine minor and trace element composition and lead isotope ratios to establish the geological origin of the raw materials and the metallurgical technique used on the lead production. The elemental compositions and lead isotope ratios have been used to assess the degree of standardization and the question of source of brass ingots by Merkel [264]. At INFN-LNGS, HR-ICP-MS has been applied to CH findings to determine major, minor, trace and ultra-trace elements, thus providing their elemental fingerprint. These data, together with Pb and/or Sr isotope ratios, provide a useful method to discriminate between samples of different origin.

5.2.2. TIMS

Thermal ionization mass spectrometry (TIMS) is a highly sensitive mass spectrometric technique able to perform very precise isotope ratio measurements despite a time-consuming sample preparation and analysis. Its main application is the measurement of isotope ratios of stable isotopes and radioisotopes, especially for heavy elements such as U, Sr, Th or Pb, which vary within small ranges and thus require high-sensitivity, precise and accurate measurements. Precision values of 0.005% or better are routinely measured.
Thermal ionization is the process whereby ionization occurs on the surface of heated metal filaments (typical temperature in the range 1000–2000 K). They are usually made of refractory metals with relatively high work functions and high melting points; due to the necessary purity and mechanical properties Pt, Rh, Ta or W filaments are the most used. All elements with first ionization potentials below 7 eV may be efficiently evaporated and ionized, otherwise special ion-emitting reagents such as silica gel and H3PO4 and/or H3BO3 are used to make the formation of ions possible, in order that an enhancement of ionization by at least one order of magnitude is achieved. Both positive and negative thermal ionization can be applied. The ion source operates in high-vacuum conditions and it consists of the filaments, the acceleration voltage supply and the focusing plates. The ion source is separated by the analyzer flight tube and the detector units by means of the isolation valve to ensure a continuous high vacuum in the analyzer during the installation of the sample holder. The thermal surface ions formed in the ion source, characterized by low initial energies of approximately 0.1–0.2 eV, are accelerated towards the single magnetic sector field mass spectrometer using the extraction electrode together with the beam-focusing electrostatic lenses. Subsequently, accelerated ions enter the magnetic field through the flight tube and they are separated according to their mass to charge ratios. Along the focal plane, whereon ions of each m/z ratio are focused, multiple Faraday cups are arrayed in order to measure all isotopes of interest simultaneously. The flight tube and the detector units are kept under vacuum by means of two ion getter pumps. Each Faraday cup, connected to an amplifier, collects its own isotope and the resulting current measured is directly proportional to the number of ions hitting the cup.
As TIMS makes use of multiple detectors, it can simultaneously measure different isotopes, which is not possible for example with HR-ICP-MS. In addition, TIMS uses Faraday detectors, in contrast to single-collector ICP-MS, typically fitted with a single secondary electron multiplier (SEM) detector. SEM detectors have worse long-term stability, compared to Faraday detectors, and also suffer from other issues, such as dead time, which can heavily affect measurements (e.g., when used to measure ratios for elements with very different isotopic abundances [265]).
The strengths of the TIMS compared to ICP-MS include its high sensitivities for elements that ionize easily (in this case TIMS is able to analyze smaller sample size without affecting precision, for instance an isotope ratio precisions better than 0.1% can be obtained for Pb with few pg sample), the limited energy spread of the ions produced, the relatively low production of molecular interferences and doubly charged ions. In addition, the cross contamination from sample to sample is negligible, thus the limiting factor comes from potential contaminants introduced during the chemical separation of the element of interest from the matrix. On the other hand, the main disadvantages of TIMS include the need for extensive sample preparation prior to analysis, very low sensitivities for elements that do not thermally ionize efficiently, and particularly, the isotopic mass fractionation. The use of isotopic standard reference material is essential to obtain accurate results considering the inherent effects as mass discrimination related to ion optical system or ion detector and mass fractionation effects caused during the evaporation of the sample [266,267].
The use of isotope ratios of certain elements such as Sr, Pb and Nd is a well-established tool in geochemistry, to date and trace the origin of rocks and minerals, as well as in CH studies to trace the provenance of ancient findings.
Some elements show very small variations in the isotope composition, depending on the mineral origin from which they were extracted. This peculiarity can be explained by the radiogenic contribution on at least one of their isotopes which affects the primordial isotope composition. For instance, 87Sr is affected by the radiogenic contribution due to the radioactive decay of the nuclide 87Rb as well as three of the four stable isotopes of lead (206Pb, 207Pb, 208Pb) are the final products of the 238U, 235U and 232Th decay chains, respectively. The variations of the isotope ratio due to radiogenic origin depends on the geological age of the mineral and the concentration of the relative precursors in the mineral itself. The naturally occurring variations of the isotope ratios are very small because of the long half-life time of involved radionuclides (billions of years), therefore, very precise, and accurate measurements are needed. In order to investigate the origin of ancient findings, the measured isotope ratios have to be compared with a database containing the isotope marker of the mines or geographical area expected to be the source of the related mineral. Moreover, this information needs to be integrated with historical evaluations about the place of finding as well as possible trade routes.
Pb is present in metal objects such as coins and bronze artifacts as well as pigments. Pb isotope has been measured on different Pb ingots of Roman age to establish their origin. Sr isotope ratio measurements in bone and teeth have been used to study the migration of ancient populations. Strontium is chemically related to calcium and therefore, it partially replaces Ca in biomineralization processes such as those occurring during human bone and teeth formation. Furthermore, Sr isotope analysis in provenance studies of ancient ceramics and Chinese glazes has been examined by Makarona et al. [268] and Ma et. al. [269] respectively.
At the Laboratory for Isotope Mass Spectrometry (LIMS) facility located at the INFN-LNGS (Gran Sasso National Laboratory), prior to analysis, a small volume of sample solution containing few micrograms of the analyte is loaded on a “zone refined” Rh filament and evaporated to dryness. Concerning lead isotope ratio measurements, single filament and silica gel techniques are adopted for sample loading (approximately 1 µg of Pb loaded on each filament). The detection system for isotope analysis consists of a Thermo Finnigan 262 VMC mass spectrometer, with updated electronics. The entire old electronics has been replaced by the TI-Box supplied by Spectromat as well as the dedicated software used for data acquisition and analysis. Thirteen filaments can be placed in one rotational block called “barrel”, that is housed into the source under vacuum and then thermally heated by the passage of an electric current. The instrument is equipped with 5 Faraday cups in a variable multi-collector, with extensive optical geometry, but corresponding to a system that has a conventional geometry, with a 64 cm deflection radius. Normally, six blocks of ten replicates are acquired for each measurement with an associated average internal precision ≤ 30 ppm. Mass calibration and gain calibration are performed before each set of analyses.

5.2.3. IRMS

Isotope ratio mass spectrometry (IRMS) enables the measurement of natural isotopic abundance of stable elements in solid, liquid, and gaseous samples, with high degree of accuracy and precision, and is particularly well-suited for light isotopes (C, N, H, O, and S). The typical sensitivity of this technique is in the order of 10−4 and the sample mass required is very small, in the order of hundreds of milligrams. The potential of this methodology lies in its ability to determine the origin and the pathway of a given substance in the environment, exploiting the natural effect of fractionation. Fractionation is the discrimination between the isotopes of an element as a consequence of the chemical-physical processes of translocation and transformation of the compounds of the element itself, from one environmental compartment to another one. As a result of fractionation, there may be an enrichment or decrease in a heavier isotope in the compound of interest, compared to a lighter one (normally the more abundant in nature) [270]. A typical example where fractionation takes place is the process of water evaporation: the lighter isotopes of H2O (1H e 16O) go preferentially into the vapor phase, while the heavier isotopes (2H and 18O) remain in liquid water.
Since the differences in isotope abundance are typically very small in nature, by convention, the isotope ratio of a sample to a standard is measured in units per thousand (delta notion δ), where the ratio R refers to that of the heavier isotope with respect to the lighter isotope; the most frequently measured isotopes are 13C/12C (carbon), 15N/14N (nitrogen), 34S/32S (sulfur), 18O/16O (oxygen) and 2H/1H (hydrogen). Therefore, the delta notion is: δ(‰) = (Rs/Rstd − 1) × 1000, where Rs is the isotopic ratio of the sample and Rstd is that of the reference standard. All isotope ratios are referred to in terms of a primary standard.
In the CH field, IRMS is widely exploited, as it provides new information about the diet and migrations of ancient populations, as well as the provenance of the raw materials used in archeological artifacts. Measurements of δ13C and δ15N [271,272] on bone collagen have allowed reconstructing the type of diet followed by the ancient populations, thus providing a contribution to the social study of our ancestors (for example, it has been possible to establish which individuals had easier access to more valuable foods, with a high protein content, and to identify the different social classes) [273,274]. The analysis of 13C in fatty acids (C16:0 and C18:0) in the cooking residues of archaeological ceramic finds enables tracing the type of food used by the ancients, distinguishing between vegetable and animal fats [275,276]. δ13C and δ18O on marbles enable tracing their origin, and, further, the quarries from which they were extracted. Again, the carbon isotopic characterization of the mortars is used to identify the carbon source origin [277] and the analysis of the oxygen isotopes can be useful to study the inorganic phase of bones, thanks to the link between the O isotopes relative abundances and the water drunk by an individual, making it possible to trace back its origin [278,279].
IRMS instrumentation is equipped with a multi-collector detection system, which enables continuous and simultaneous measurements. The advantage lies in the measurement of multiple isotopes in a single sample and in a single run.
In the framework of INFN-CHNet, at the iCONa lab (isotopic C, O and N analysis laboratory) of the Distabif (Department of Environmental, Biological and Pharmaceutical Sciences and Technologies), University of Campania “Luigi Vanvitelli”, an Isotopic Ratio Mass Spectrometer (IRMS Delta V Advantage, Thermo Scientific) enables measuring very small samples, with a typical sensitivity of 10−4. Depending on the type of sample to be analyzed and the isotopic ratio to be measured, a different device is connected to the spectrometer, so that the sample can arrive to the instrument in the gaseous state:
-
For δ15N and δ13C analysis, an Elemental Analyzer is used (CN Flash EA 1112 Series, Thermo Scientific, Finningan), where a flash combustion occurs at 1020 °C, in oxygen presence. Solid samples are combusted and subject to red-ox reactions to produce CO2 and N2, chromatographically separated.
-
For δ18O analysis, a High Temperature Conversion/Elemental Analyzer (TC/EA, Thermo Scientific, Finningan) is used, where a pyrolysis occurs at 1350–1450 °C. The reaction takes place on glassy carbon substrates, in complete absence of oxygen.
-
For compound-specific δ15N and δ13C analysis, gas chromatography (GC Isolink II, Thermo Scientific, Finningan) is adopted, which enables the measurements of isotopic ratio on specific molecules, isolated and separated upstream from organic material (i.e., fatty acids).
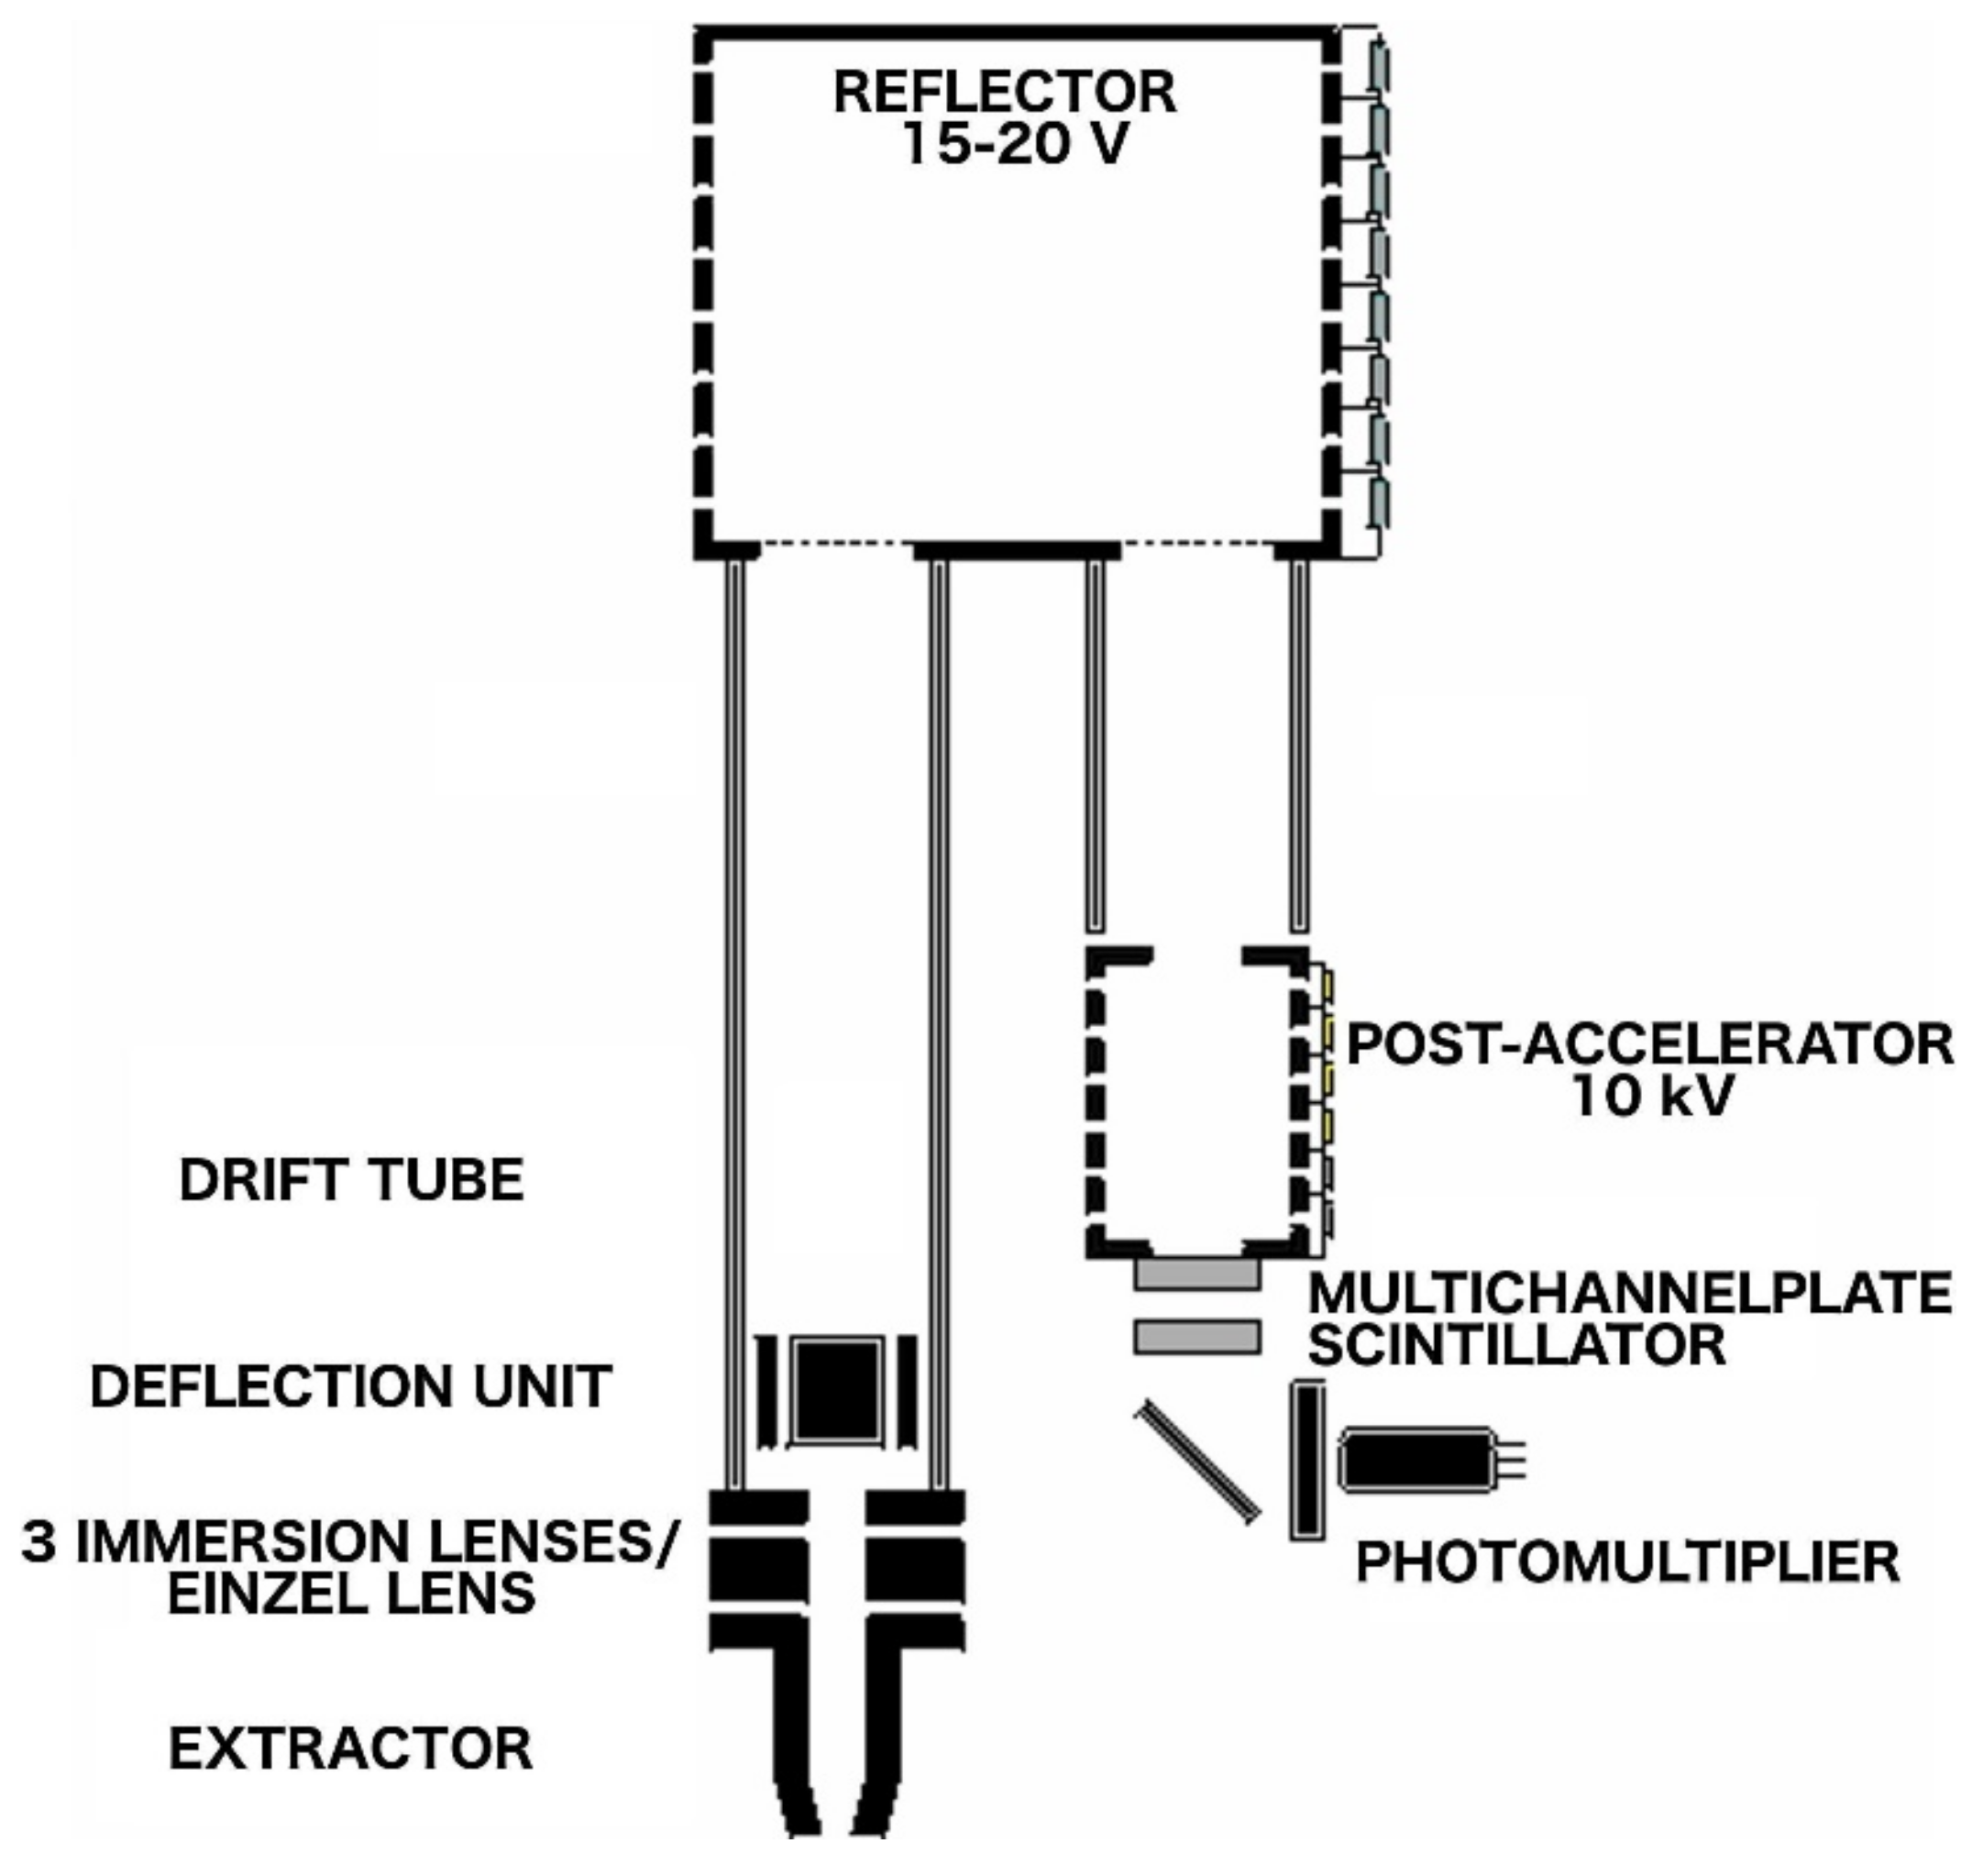
All of the peripherals are connected to the spectrometer via a ConFlo IV (Continuous-Flow Interface, Thermo Scientific, Finningan), which modulates sample- and standard-gas flows, enabling autodilution of the different flows and an easy switching between applications.
After ionization, the ions are accelerated by an electric field and deflected by a magnetic field, where the different masses are separated, in order to be then collected in the Faraday cups of the IRMS detecting system. A multi-collector detection system enables continuous and simultaneous measurements of multiple isotopes in a single run. Faraday cups measure the current intensity of the ion beams. Our IRMS spectrometer is equipped with a triple collector (3 Faraday cups) for N2, CO, NO, O2, CO2, N2O and SO2, able to detect masses 46 and 30 (cup 2), 45 and 29 (cup3), 44 and 28 (cup 4). Every cup is connected to its own amplifier, each of which has a gain such that ion ratios at natural abundance levels produce similar signals. Signals from each amplifier are recorded simultaneously, typically every tenth of a second, digitized and recorded by the IRMS data system. This creates a “chromatogram” for ions of given M/Z, where the peak areas are proportional to the number of ions detected and the cups signals are represented as voltage signals in a range from 0 to 50 V, with typical optimal values of approximately 20–30 V. This instrument has a high sensitivity, which enables measurement on very small mass samples, down to the order of 50 μg. Typical standard deviations, at iCONa lab, are: 0.1‰ for δ13C, 0.2‰ for δ15N and 0.4‰ for δ18O analysis [280].

5.2.4. ToF-SIMS

Time of flight-secondary ion mass spectrometry (ToF-SIMS) is a surface-sensitive technique providing elemental and molecular information from the uppermost one or two monolayers of solid surfaces, with limits of detection down to 10−12 and less (in the ppb- sub ppb range). It enables the detection and localization of all elements, molecules, and their isotopes in the mass range 1–12,000 AMU. This is obtained by raster scanning a nano-focused primary ion beam over the surface of the sample. The impact of the primary ions of some keV energy (30 keV with a Bi Liquid Metal Ion Gun) on the target atoms generates a collision cascade, with the consequent emission of particles; most of them are neutral, only a very low percentage (1–3%) is positively or negatively charged (secondary ions). These charged particles can then be extracted, collected, and identified by a ToF detector. In the case of TOF.SIMS5 (IONTOF,Munster, Germany) operating at the LASR3 Surface Laboratory Roma Tre (INFN-CHNet and Roma Tre University), the voltage for the secondary ion extraction is 2 ÷ 3 kV. The ToF detection system exploits the combination of a linear drift path and an ion mirror. The latter, a non-linear field reflectron doubling the pathlength run by the extracted ions and curving the trajectory, enables reaching a mass resolution M/∆M > 30,000. At the end of the flight path, the secondary ions are then post-accelerated using a 10 kV voltage onto a Multichannel Plate, where a scintillator and a photomultiplier are located. The scheme of the instrument is reported in Figure 16.
Chemical maps with a lateral resolution of less than 50 nm can be obtained, correlating mass spectra to each pixel of the image as a function of position. Combining the primary ion beam with a sputter ion beam (dual-beam mode) in repeated cycles, the in-depth distribution of elements and molecules can be also determined, with a nominal lateral resolution of less than 1 nm along the z-axis. In the last decade, ToF-SIMS technique was used in both the non-destructive (static) and destructive (dynamic) modes, taking advantage of the possibility of obtaining chemical maps of organic [281] and inorganic [282,283] materials with high lateral resolution. In the INFN-CHNet experience, ToF-SIMS was employed to investigate dyes and pigments, metal layers and plates, corrosion phenomena and degradation products on both inorganic and organic samples [284,285,286,287,288,289,290,291,292]. Very recently, ToF-SIMS has also been used to identify biomarkers and reveal their spatial localization in organic archaeological remains.

5.2.5. AMS

A great breakthrough in detection capabilities in MS has been the development of accelerator-based systems, which enabled overcoming the limits of conventional spectrometers when detecting rare isotopes in ultra-low concentrations [293,294]. With the expression of rare isotopes, we indicate those radioactive isotopes that are characterized by long, or medium-long, half-lives and by a very low abundance. Indeed, the combination of both the long half-life and the low concentration makes their measurement by traditional spectroscopic methods (such as beta counting) not as efficient and sensitive as needed. Accelerator mass spectrometry (AMS) enables obtaining very good sensitivity, keeping sample mass very small (normally, a few tens of milligrams, considering the mass of the collected sample) and, at the same time, keeping measurement time quite short (30 min per sample for the AMS measurement are enough).
Among all the possible isotopes for which concentration can be measured by AMS, the most well known is 14C, or radiocarbon, used in dating and environmental applications. 14C measurements can be carried out coupling the magnetic and electrostatic elements, which are common also to mass spectrometry, to a small particle accelerator, most often a tandem electrostatic one, as the 3 MV tandem accelerator installed in Florence [295], where radiocarbon measurements are routinely performed in the framework of the INFN-CHNet network. A tandem accelerator is necessary to obtain the required high sensitivity (typically down to 10−15): the most important and abundant isobars are suppressed either in the source, through extraction of negative ions, or at the high-voltage terminal of the accelerator, thanks to the stripping process and its capability to contribute to the breakup of molecules. After acceleration, while the more abundant stable isotopes (e.g., 12C and 13C in the case of radiocarbon measurements) are collected through Faraday cups, the rare isotope ions (14C in radiocarbon) are counted via a particle detector. In our 14C experimental setup in Florence, typical count rates for modern samples are of the order of few tens of Hz, with the required counts statistics (approximately 40,000 counts at least for each of the certified concentration standard samples) acquired in approximately 30 min. In some cases, when isobars cannot be fully suppressed along the beam line, for instance in the case of 10Be, the final detector is also used as a further discrimination element [296].
Even though, in the early times, measurements were performed with terminal voltages of few tens of MV, research has moved to smaller and smaller accelerator machines, with terminal voltages even as low as 200 kV, now 0.5–3 MV, the typical voltage range. In such conditions, the most probable charge states after stripping are relatively low, with the consequence of an accelerated beam on the high-energy side consisting of very low MeV/AMU ions. The ideal detector is thus a device with a very thin entrance interface, so that energy loss and straggling of impinging ions are minimized, able to withstand the direct irradiation of the incoming rare-isotope beam. Typically, gas ionization detectors are used (see, e.g., [297]), possibly with a segmented anode to allow for the measurement of both dE/dx and the residual E, to discriminate the ions with respect to their atomic number. Typical filling gas is isobutane. An entrance window, a material which can withstand high pressure differences, even when arranged in very thin foils, is used: in higher terminal voltage setups, 1 μm thick Mylar was normally chosen; in recent times, with the typical terminal voltage being lower, new silicon nitride windows of few tens of nm thickness have been introduced, minimizing energy straggling and thus improving energy resolution.
When the typical MeV/AMU of accelerated ions is not so low as in the most recent 200 kV tandem machines, considering that in AMS the expected counting rate is in the order of some tens of Hz, solid-state detectors can be used as an alternative to gas ionization chambers. Energy resolution and timing response can clearly suffer for radiation damage: using a solid-state detector in front of a stable ion beam would not be possible. The detector is thus installed on a retractable arm in order to be inserted on the beam axis only when the rare isotope beam is injected (the detector is also protected by a beam stopper when not in use). An example is represented by the setup installed at the aforementioned laboratory in Florence, where a simple and low-cost 10 × 10 mm Hamamatsu nude photodiode is installed on a bellows to count the 14C ions.
When residual interferences are somehow expected in the final detector, a Time-of-Flight (ToF) system [298] can be used. The basic idea of ToF is relatively simple: different ions with the same energy but different masses have different speeds and thus travel the same distance in different amounts of time. Measuring these intervals can allow us to discriminate the type of the particles. A better and further criterium can be added while also measuring the residual ion energies. What is challenging in a ToF setup for AMS is the required timing resolution; in particular, the START signal has to be generated without affecting too much the energy loss and energy straggling of the beam (a deterioration of these characteristics would result in a broadening of the measured times of flight, with the consequence of worsening the timing resolution). As an example, we report the Florence setup, where the START signal is generated by secondary electrons produced by the ion beam impinging on a 50 nm thick carbon foil and amplified by a microchannel plate. The STOP signal is given by the same mechanism or, as an alternative, by the silicon diode already mentioned. The overall timing resolution achieved is 0.7 ns with a 10 MeV C beam, on a flight path of 1.75 m, and the system enables easy discrimination of the 14C ions from the unwanted 12C and 13C contaminants present even after the very last filter, the electrostatic analyzer [299].
The AMS feature of working with very low-intensity rare-isotope beams can be the key to exploit particle detectors not only as the final detectors or counters, but also to monitor the transmission of the beam itself. Indeed, optimizing the beam transport is highly mandatory in AMS, since the count rate in the final detector is expected to be relatively low if compared to other nuclear setup. Nevertheless, some of the typical monitoring devices installed along a tandem beam line, e.g., the beam profile monitors based on the measurement on the induced current on two oscillating filaments, do not have enough sensitivity. In this context, position-sensitive particle detectors can be used to monitor the spread of the beam in the transversal plane and its relative position with respect to the beam reference trajectory. Of course, such detectors should be either as much transparent as possible or mounted on a retractable arm, just not to interfere with the detection of the rare isotope particles during the “real” acquisition time. The latter is for instance the path followed by the Florence group, where both gas and solid-state detectors have been used as 14C beam profile monitors.
In [300], the use of a multiwire gas proportional chamber allowed us to monitor both the dimension of the beam spot and its position. The device consisted of a central cathode made of a double-sided aluminized Mylar foil placed between 2 grids of anode wires, oriented perpendicular one to each other. In each plane, 40 gold-plated tungsten wires, with a pitch of 1 mm, were mounted. Entrance and exit windows were 40 × 40 mm2, 1.3 μm thick Mylar foils. The detector was filled with heptane, continuously flowing, and kept at a constant pressure of approximately 3.5 mbar. The identification of the “switched on” wire or wires was based on the measurement of the delay of the collected electrical signals. In fact, each wire of the 2 grids was connected to a delay-line chain: the impact point was derived for example by measuring the timing difference between collection of signal at cathode and collection of the signal at one end of the delay line.
Concerning solid-state detectors as beam profile monitors, the possible use of a 50 × 50 mm2, 300 μm thick silicon photodiode as a position-sensitive devices, is reported in [301]. This detector was divided into four independent sectors: the comparison among the four independent spectra allowed us to identify the possible centering of the beam with respect to the system axis.
In the framework of INFN-CHNet, we exploit 14C both in archaeometric and environmental contexts. As far as CH applications are concerned, measurement campaigns span from archaeological sites (see, e.g., [302]) to historical issues (see, e.g., [303]), including authenticity applications [304]. Radiocarbon dating is also applied in environmental problems, for example to date sediments and accumulation rates by dating organic materials that can be found within them (see, e.g., [305,306]).

6. Conclusions

Detectors are a key issue of the contemporary scientific approach to CH, both for diagnostics and conservation. INFN has always been developing detectors and instrumentation and INFN-CHNet, which has inherited this philosophy, keeps developing and applying new instrumentation to the study of CH. In the paper, an overview of the most used detector-based techniques in the INFN-CHNet network has been provided. As described above, the research activity carried by INFN-CHNet aims at developing optimized setups for spectrometric techniques, which use both traditional state-of-the-art and highly innovative detectors.
As for the former, examples are PIXE, XRF, XRD, XCT (X-rays), PIGE, PGNAA (gamma rays), UV-VIS-IR (light), and MS spectrometers (particles). For these techniques, measurement setups have been tailored for CH applications optimizing performances, reliability, weight, transportability, cost, absorbed power, integrability and complementarity with other techniques. So, focusing on the INFN-CHNet laboratories, we now find instruments purposely optimized/designed for CH measurements, such as multi-detector PIXE setups, little and easily transportable MA-XRF scanners for elemental imaging, μ-X-ray Diffractometers, transportable X-ray tomographs, very compact and light CdTe detectors, with interesting performances in high-energy X-ray/low-energy gamma-ray detection, portable XRL spectrometers, spectrophotometers and spectroradiometers, macro-FT-IR/single point micro-FT-IR/mapping-IR spectrometers, MS and AMS systems.
Regarding innovative detectors, we can remember highly innovative detectors specifically developed within INFN-CHNet, such as ARDESIA, the monolithic array of SDD detectors for XAS studies at the INFN-LNF DAΦNE-Light synchrotron radiation facility, the MAXRS detection setup at the low-energy Riken-RAL muon beam and the PGNAA/neutron-imaging facilities at the LENA Laboratory.
Together with the description of the used experimental setups, paths for next-generation instruments have been suggested, when possible, as in the case of X-ray Superconductive Detectors and X-ray Microcalorimeter Spectrometers, which open up new, exciting perspectives, as they enable exploring CH with astonishing improvement in energy resolution with respect to the values of standard X-ray detectors.
As we have shown in this review, the study, characterization, and conservation of CH are closely interlaced with detector design, implementation, and use. Many issues in CH can now be addressed thanks to scientific techniques exploiting the existing detectors. However, several questions still remain unresolved; R&D of new techniques/new detectors and the optimization of the existing devices is driven by the necessity to answer those questions.

Author Contributions

Conceptualization, L.G. (Lorenzo Giuntini), L.C., F.T. and M.M.; methodology and writing—original draft preparation, F.T., L.G. (Lorenzo Giuntini), L.C., N.G., and M.M.; PIXE-PIGE, L.T., P.B., A.F., S.B.L., C.R., A.M., C.C., G.P. and F.T.; XRF, A.B. and M.C.G.; XRF-synchrotron; G.P., XRD; F.A., M.B. (Matteo Bettuzzi), R.B., and M.P.M.; XCT, M.B. (Maurizio Bonesini), M.C. (Massimiliano Clemenza), D.D.M., M.C.( Massimo Carpinelli), V.S., P.O., MAXRS; D.A. and M.C. (Massimiliano Clemenza), A.S., B.S., M.P., S.A. (Simona Altieri), PGNAA; L.G. (Laura Guidorzi), A.L.G., A.R., and L.S., luminescence; A.M.G., S.P., G.S., photometry and colorimetry; M.C.G., L.P., M.R., FT-IR; F.G. (Francesco Grazzi) and N.G., neutrons; F.M. and S.N., HR-ICP-MS; F.M. and S.N.,TIMS; C.L. and S.A. (Saverio Altieri), IRMS; L.T., and V.G., ToF SIMS; M.F., L.L., S.B., and F.T., AMS; Writing—review and editing, L.C., L.G. (Lorenzo Giuntini), N.G., F.G. (Francesca Giambi) and M.M.; supervision, L.G. (Francesca Giambi), L.C. and M.M. All authors have read and agreed to the published version of the manuscript.

Funding

This research did not receive any external funding.

Institutional Review Board Statement

Not applicable.

Informed Consent Statement

Not applicable.

Data Availability Statement

Not applicable.

Acknowledgments

Marco Manetti is warmly acknowledged for his significant technical contributions and suggestions.

Conflicts of Interest

The authors declare no conflict of interest.

Appendix A

Table A1. Summary of techniques presented in the paper along with obtained information.
Detected RadiationPrimary RadiationAnalytical TechniqueAnalysable ObjectsObtained Information and ProsLimitationsTypical detector
X-raysIon beam (MeV)PIXEPaintings, manuscripts, metal point drawings, metal objects, stones, metals, pottery, ...Qualitative/quantitative elemental composition
Good sensitivity for light elements, high sensitivity for heavy elements
Possibility of imaging
No info on compounds
No info on organic materials
Z ≥ 11
Not portable (normally), need of large-scale facility
SDD
Si(Li)
X-ray beam (tube)Conventional XRFPaintings, manuscripts, metal point drawings, metal objects, stones, metals, pottery, ...Mainly qualitative elemental composition
Excellent sensitivity for heavy elements
Possibility of imaging
Portable
No info on compounds
No info on organic materials
Z ≥ 11
Low sensitivity for light elements
SDD
X-ray beam (synchrotron)Synchrotron XRFPaintings, manuscripts, metal point drawings, metal objects, stones, metals, pottery, ...Qualitative/semi-quantitative
elemental composition Possibility of imaging
Energy tunability and higher brightness than conventional XRF
No info on compounds
No info on organic materials
Z ≥ 11
Low sensitivity for light elements
Not portable, need of large-scale facility
SDD
X-ray beam (synchrotron)Synchrotron XASPaintings, manuscripts, metal point drawings, metal objects, stones, metals, pottery, ...Qualitative/semi-quantitative element selective and local atomic structure information Info on chemical stateNot portable, need of large--scale facilitySDD
X-ray beamXRDPigments, stones, metal objects, ...Crystal structure
Portable instrumentation available
SDD
XCT3D objects: panel paintings, manuscripts, wooden statues, pottery, bones, fossils, stones, jewelry, metal works of art (bronze statues, coins, nails, ...Sections and complete 3D imaging of the object, from the outside surface to the inner details
Portable instrumentation available (energy and power limited)
Large and bulky medium-high-Z materials (e.g. large marble or metal statues) require expensive high energy X-ray sources, like 450kV X-ray tubes or LINACs, and special scanning procedures.Flat-panels, photodiode linear arrays, CCDs, photon counting 2D detectors, image intensifiers.
Muon beamMAXRSPaintings, manuscripts, metal point drawings, metal objects, stones, metals, pottery, ...Qualitative and
quantitative elemental composition
Possibility of 3D imaging
Very limited (if any) sample activation
No info on compounds
No info on organic materials
Z ≥ 3
Not portable, need of large-scale facility
HPGe
Gamma raysIon beam (MeV)PIGEPaintings, manuscripts, metal point drawings, metal objects, stones, metals, pottery, ...Qualitative and quantitative elemental and isotopic composition
Low Z elements
Possibility of imaging
No info on compounds
No info on organic materials
Not portable, need of large-scale facility
HPGe, CdTe
Neutron beamPGNAAPaintings, manuscripts, metal point drawings, metal objects, stones, metals, pottery, ...Qualitative and quantitative elemental composition
All the elements ( in particular low-Z and high neutron capture cross section: B, Cd, Sm and Gd)
Not portable, need of large scale facility
Sample activation
HPGe
UV-VIS-IR radiationElectron beamCLGems, stonesIdentification of minerals, gem authentication, provenance of gems and stones
Fast, possibility of imaging
Shallower region of analysis and lower sensitivity with respect to IL
Not portable, samples in vacuum
CCD (camera/spectrometer)
Ion beam (MeV)ILGems, stones, ceramicsCharacterisation of minerals and ceramic productions, gem authentication, provenance of gems and stones, radiation damage for pigments and varnish in paintings, …
Possibility of imaging and measurements in air
Not portable, need of large-scale facilityCCD (camera/spectrometer)
X-ray beamXRLGems, stonesCharacterisation of minerals, saltwater pearl authentication
Portable, possibility of imaging and measurement in air
Longer acquisition timeCCD (camera/spectrometer)
VIS radiationLight characterisationLight sourcesCharacterization of light sources in terms of illuminance, light intensity and luminance
Portable
Interference of environment lightSilicon photocell
Silicon photodiode array
Colour specificationColoured surfacesColour specification, monitoring of changes in the optical properties of polychrome artworks
Portable
Large measurement area with a diameter from 3 to 8 mmRGB sensors
Silicon photodiode array
MIR radiationMacro FT-IRPigments, binders, varnishes, degradation products and synthetic materials due to restoration treatmentsMolecular characterization
Portable
Room temperature
No info on several oxides and sulphides
Spot size: from 1.4 to 0.6 cm
DTGS
Single point micro FT-IRPigments, binders, varnishes, degradation products and synthetic materials due to restoration treatmentsMolecular characterizationNo info on several oxides and sulphides
Not portable
Liquid nitrogen cooled
MCT
FT-IR mapping and imagingPigments, binders, varnishes, degradation products and synthetic materials due to restoration treatmentsMolecular characterization and localization within the sampleNo info on several oxides and sulphides
For micro FT-IR mapping and imaging, polished surfaces (i.e resin-embedded samples) are required
Not portable and nitrogen cooled in micro configuration
MCT (micro-mapping), FPA (micro-imaging)
DTGS (macro-mapping)
NeutronsNeutron beamNeutron diffractionMetal artifacts, crystalline systems in generalAlloy composition and its microstructure, manufacturing procedures, crystalline mineralization phases quantification and localizationNeed of large scale facility
Sample activation
Gas detectors (3He detectors)
Neutron tomographyMetal artifacts, organic materials buried in ceramics or metals, fossilized bones in chalk rock or in ferrous “red” bedsMorphological and microstructural characterization of dense materials;
Difference between very similar materials or isotopes
Need of large-scale facility
Sample activation
Scintillators for imaging (ZnS/LiF:Ag)
Charged particles from the sampleAr plasma as ion sourceHR-ICP-MSMetal artifacts, organic materials, bones and teeth, ceramics, rocks, pigmentsElemental analysis at trace levelMicro-destructive
Not portable
Secondary Electron Multiplier (SEM) detector
Thermal ionisation as ion sourceTIMSPb-containing materials (coins, bronze artifacts, pigments), rocks and minerals, bones and teeth, ceramics, glazesIsotope ratios of heavy (Sr, Pb, Nd,…) elements: date and trace the origin of rocks and minerals used in ancient findings or study the migration of ancient populationsMicro-destructive
Not portable
Need for extensive sample preparation
Very low sensitivities for elements that do not thermally ionize efficiently;
Mass fractionation during sample evaporation
Multiple Faraday cups
Charged particles from the sampleIRMSBones, organic residues in archaeological ceramics, marblesIsotope ratios of light (C, N, O, S) elements: info on diet and migrations of ancient populations and provenance of the raw materials used in archeological artifactsMicro-destructive
Not portable
Multiple Faraday cups
Ion beam
(tenths—tens of keV)
ToF-SIMSSurfaces and in-depth: dyes and pigments, organic and biological binding media, restoration products, metals, polymers, paper, leather, and glassDetection of all organic and inorganic species, with isotope sensitivity (1–10,000 uma). Sub-ppm sensitivity. Chemical mapping with high lateral resolution < 100 nm and depth resolution: <1 nm.Not portable,
Samples in UHV
Time of Flight detector, Multichannel Plate, Scintillator, Photomultiplier
Sputtering keV ionsAMS for radiocarbon datingOrganic materials14C rare isotope in ultra-low concentrationsMicro-destructive
Not portable, need of large-scale facility
Gas ionization chambers/
SS detectors

Appendix B. List of Acronyms

AMSAccelerator Mass Spectrometry
ASICApplication Specific Integrated Circuit
CCDCharge Coupled Device
CHCultural Heritage
CHNetCultural Heritage Network
CIECommission Internationale de l’Eclairage
CLCathodoluminescence
CMOSComplementary Metal-Oxide Semiconductor
CZTCadmium Zinc Telluride
CMTCadmium Manganese Telluride
CVDChemical Vapour Deposition
DEDetection Efficiency
DTGSDeuterated Triglycine Sulphate
EDEnergy Dispersive
EREnergy Resolution
FIRFar Infrared
FT-IRFourier-Transform InfraRed spectroscopy
FPAFocal Plane Array
FWHMFull Width Half Maximum
GEMGas Electron Multiplier
GOSGadolinium oxysulfide
HPCDsHybrid Photon Counting Detectors
HPGeHigh Purity Germanium
HR-ICP-MSHigh Resolution Inductively Coupled Plasma Mass Spectrometry
IBAIon Beam Analysis
ILIonoluminescence
INFNIstituto Nazionale di Fisica Nucleare
INFN-LABECLaboratorio per l’Ambiente e i BEni Culturali
INFN-LNFLaboratori Nazionali di Frascati
INFN-LNGSLaboratori Nazionali del Gran Sasso
INFN-LNLLaboratori Nazionali di Legnaro
IRInfrared
IRMSIsotope Ratio Mass Spectrometry
JFETJunction gate Field-Effect Transistor
KIDKinetic Inductance Detector
LALinear Array
LNLiquid Nitrogen
MA-XRFMacro-XRF
MAXRSMuonic Atom X-Rays Spectroscopy
MCTMercury Cadmium Telluride
MIRMid Infrared
MSMass Spectrometry
NEPnoise-equivalent power
NIRNear Infrared
OCRoutput count-rate
PCBPrinted Circuit Board
PGNAAPrompt Gamma Neutron Activation Analysis
PINP-type, Intrinsic, N-type
PIXEParticle Induced X-ray Emission
PMPhotomultiplier
PMTPhotomultiplier Tube
PMMAPolymethylmethacrylate
RBSRutherford Back Scattering
RXRadiography
SDSuperconductive Detectors
SDDsSilicon Drift Detectors
SEMScanning Electron Microscope
SEMSecondary Electron Multiplier
SiPMSilicon Photomultiplier
STJSuperconducting Tunnel Junction detector
TESTransition-Edge-Sensor
TIMSThermal Ionization Mass Spectrometry
ToF-SIMSTime of Flight-Secondary Ion Mass Spectrometry
UV-vis-IRUltraViolet-visible-InfraRed
XASX-ray Absorption Spectroscopy
XCTComputed X-ray Tomography
XRDX-Ray Diffraction
XRFX-Ray Fluorescence
XRLX-ray luminescence

References

  1. Ballabriga, R.; Alozy, J.; Campbell, M.; Frojdh, E.; Heijne, E.H.M.; Koenig, T.; Llopart, X.; Marchal, J.; Pennicard, D.; Poikela, T.; et al. Review of hybrid pixel detector readout ASICs for spectroscopic X-ray imaging. JINST 2016, 11, P01007. [Google Scholar] [CrossRef]
  2. Alberti, R.; Grassi, N.; Guazzoni, C.; Klatka, T. Optimized readout configuration for PIXE spectrometers based on Silicon Drift Detectors: Architecture and performance. Nucl. Instrum. Methods Phys. Res. A 2009, 607, 458–462. [Google Scholar] [CrossRef]
  3. Bertuccio, G.; Ahangarianabhari, M.; Graziani, C.; Macera, D.; Shi, Y.; Rachevski, A.; Rashevskaya, I.; Vacchi, A.; Zampa, G.; Zampa, N.; et al. A Silicon Drift Detector-CMOS front-end system for high resolution X-ray spectroscopy up to room temperature. J. Instrum. 2015, 10, P01002. [Google Scholar] [CrossRef]
  4. Bertuccio, G.; Macera, D.; Graziani, C.; Ahangarianabhari, M. X-ray Silicon Drift Detector–CMOS Front-End System with High Energy Resolution at Room Temperature. IEEE Trans. Nucl. Sci. 2016, 63, 400–406. [Google Scholar] [CrossRef]
  5. Pahlke, A.; Dams, F.; Fojt, R.; Fraczek, M.; Knobloch, J.; Luckey, C.; Miyakawa, N.; Willems, N. Latest Generation of Silicon Drift Detectors and Readout Electronics. Microsc. Microanal. 2019, 25 (Suppl. 2), 558–559. [Google Scholar] [CrossRef] [Green Version]
  6. Bufon, J.; Schillani, S.; Altissimo, M.; Bellutti, P.; Bertuccio, G.; Billè, F.; Borghes, R.; Borghi, G.; Cautero, G.; Cirrincione, D.; et al. A new large solid angle multi-element silicon drift detector system for low energy X-ray fluorescence spectroscopy. J. Instrum. 2018, 13, C03032. [Google Scholar] [CrossRef]
  7. Large Area 7-Channel Silicon Drift Detector Array. Available online: https://www.ketek.net/wp-content/uploads/2017/01/KETEK_VA560_7-Channel_Product_Information.pdf (accessed on 31 March 2021).
  8. Rachevski, A.; Ahangarianabhari, M.; Aquilanti, G.; Bellutti, P.; Bertuccio, G.; Borghi, G.; Bufon, J.; Cautero, G.; Ciano, S.; Cicuttin, A.; et al. The XAFS fluorescence detector system based on 64 silicon drift detectors for the SESAME synchrotron light source. Nucl. Instrum. Methods Phys. Res. Sect. A 2019, 936, 719. [Google Scholar] [CrossRef]
  9. Kirkham, R.; Dunn, P.A.; Kuczewski, A.J.; Siddons, D.P.; Dodanwela, R.; Moorhead, G.F.; Ryan, C.G.; de Geronimo, G.; Beuttenmuller, R.; Pinelli, D.; et al. The Maia spectroscopy detector system: Engineering for integrated pulse capture, low-latency scanning and real-time processing. AIP Conf. Proc. 2010, 1234, 240–243. [Google Scholar] [CrossRef]
  10. Ryan, C.; Kirkham, R.; Hough, R.; Moorhead, G.; Siddons, D.; de Jonge, M.; Paterson, D.; de Geronimo, G.; Howard, D.; Cleverley, J. Elemental X-ray imaging using the Maia detector array: The benefits and challenges of large solid-angle. Nucl. Instrum. Methods Phys. Res. Sect. A 2010, 619, 37–43. [Google Scholar] [CrossRef]
  11. Scharf, S.; Ihle, I.; Ordavo, V.; Arkadiev, A.; Bjeoumikhov, S.; Bjeoumikhova, G.; Buzanich, R.; Gubzhokov, A.; Günther, R.; Hartmann, M.; et al. Compact pnCCD-Based X-ray Camera with High Spatial and Energy Resolution: A Color X-ray Camera. Anal. Chem. 2011, 83, 2532–2538. [Google Scholar] [CrossRef] [PubMed]
  12. Yang, C.; Si, M.; You, L. Superconducting X-ray detectors. Sci. China Inf. Sci. 2020, 63, 180502. [Google Scholar] [CrossRef]
  13. Reis, M.A.; Alves, L.C.; Barradas, N.P.; Chaves, P.C.; Nunes, B.; Taborda, A.; Surendran, K.P.; Wu, A.; Vilarinho, P.M.; Alves, E. High Resolution and Differential PIXE combined with RBS, EBS and AFM analysis of magnesium titanate (MgTiO3) multilayer structures. Nucl. Instrum. Methods Phys. Res. B 2010, 268, 1980–1985. [Google Scholar] [CrossRef]
  14. Chaves, P.C.; Taborda, A.; Marques, J.P.; Reis, M.A. N to K Uranium PIXE spectra obtained at the high resolution high energy PIXE setup. Nucl. Instrum. Methods Phys. Res. B 2014, 318, 60–64. [Google Scholar] [CrossRef]
  15. Reis, M.A.; Chaves, P.C.; Taborda, A. Review and perspectives on energy dispersive high resolution PIXE and RYIED. Appl. Spectrosc. Rev. 2017, 52, 231–248. [Google Scholar] [CrossRef]
  16. Palosaari, M.R.J.; Kinnunen, K.M.; Julin, J.; Laitinen, M.; Napari, M.; Sajavaara, T.; Doriese, W.B.; Fowler, J.; Reintsema, C.; Swetz, D.; et al. Transition-edge sensors for particle induced X-ray emission measurements. J. Low Temp. Phys. 2014, 176, 285–290. [Google Scholar] [CrossRef] [Green Version]
  17. Reis, M.A.; Pessanh, S.; Chaves, P.C.; Carvalho, M.L. Reaching for copper pigments speciation with High Resolution Energy Dispersive PIXE. Nucl. Instrum. Methods Phys. Res. B 2020, 477, 73–76. [Google Scholar] [CrossRef]
  18. Torma, P.; Sipila, H. Ultra-thin silicon nitride X-ray windows. IEEE Trans. Nucl. Sci. 2013, 60, 1311–1314. [Google Scholar] [CrossRef]
  19. Campbell, J.L.; Boyd, N.I.; Grassi, N.; Bonnick, P.; Maxwell, J.A. The Guelph PIXE software package IV. Nucl. Instrum. Methods Phys. Res. Sect. B Beam Interact. Mater. At. 2010, 268, 3356–3363. [Google Scholar] [CrossRef]
  20. Roberts, M.C.; Anderson, E.C. Light rejection evaluation of ultrathin polymer EDS windows. Microsc. Microanal. 2004, 10, 924–925. [Google Scholar] [CrossRef]
  21. Scholze, F.; Procop, M. Detection efficiency of energy-dispersive detectors with low-energy windows. X-ray Spectrom. 2005, 34, 473–476. [Google Scholar] [CrossRef]
  22. Ying, X.; Xu, X. CVD diamond thin film for IR optics and X-ray optics. Thin Solid Film. 2000, 368, 297–299. [Google Scholar] [CrossRef]
  23. Reinhard, D.K.; Grotjohn, T.A.; Becker, M.; Yaran, M.K.; Schuelke, T.; Asmussen, J. Fabrication and properties of ultranano, nano, and microcrystalline diamond membranes and sheets. J. Vac. Sci. Technol. B Microelectron. Nanometer Struct. 2004, 22, 2811. [Google Scholar] [CrossRef]
  24. Huebner, S.; Miyakawa, N.; Kapser, S.; Pahlke, A.; Kreupl, F. High Performance X-ray Transmission Windows Based on Graphenic Carbon. IEEE Trans. Nucl. Sci. 2015, 62, 588–593. [Google Scholar] [CrossRef] [Green Version]
  25. Törmä, P.T.; Sipilä, H.J.; Koskinen, T.; Mattila, M. Technology development for soft X-ray spectroscopy. Spectrochim. Acta Part B 2016, 119, 36–40. [Google Scholar] [CrossRef]
  26. Johansson, T.B.; Akselsson, R.; Johansson, S.A.E. X-ray analysis: Elemental trace analysis at the 10-12 g level. Nucl. Instrum. Methods. B 1970, 84, 141–143. [Google Scholar] [CrossRef]
  27. Ahlberg, M.; Akselsson, R.; Forkman, B. Analysis of wedge-shaped pendants by proton-induced X-ray emission (PIXE). Archaeometry 1976, 18, 42–46. [Google Scholar] [CrossRef]
  28. Neelmeijer, C.; Wagner, W.; Schramm, H.P. Depth resolved ion beam analysis of objects of art. Nucl. Instrum. Methods 1996, 118, 338. [Google Scholar] [CrossRef]
  29. Andalò, C.; Bicchieri, M.; Bocchini, P.; Casu, G.; Galletti, G.C.; Mandò, P.A.; Nardone, M.; Sodo, A.; Zappalà, M.P. The beautiful “Trionfo d’Amore” attributed to Botticelli: A chemical characterisation by proton-induced X-ray emission and micro-Raman spectroscopy. Anal. Chim. Acta 2001, 429, 279. [Google Scholar] [CrossRef]
  30. Neelmeijer, C.; Mäder, M. The merits of particle induced X-ray emission in revealing painting techniques. Nucl. Instrum. Methods 2002, 189, 293. [Google Scholar] [CrossRef]
  31. Denker, A.; Opitz-Coutureau, J. Paintings—high-energy protons detect pigments and paint-layers. Nucl. Instrum. Methods 2004, 118, 677. [Google Scholar] [CrossRef]
  32. Mandò, P.A.; Fedi, M.E.; Grassi, N.; Migliori, A. Differential PIXE for investigating the layer structure of paintings. Nucl. Instrum. Methods 2005, 239, 71. [Google Scholar] [CrossRef]
  33. Grassi, N. Differential and scanning-mode external PIXE for the analysis of the painting “Ritratto Trivulzio” by Antonello da Messina. Nucl. Instrum. Methods 2009, 267, 825. [Google Scholar] [CrossRef]
  34. Beck, L.; de Viguerie, L.; Walter, P.; Pichon, L.; Gutiérrez, P.C.; Salomon, J.; Menu, M.; Sorieul, S. New approaches for investigating paintings by ion beam techniques. Nucl. Instrum. Methods Phys. Res. B 2010, 268, 2086–2091. [Google Scholar] [CrossRef]
  35. Duval, A.; Guicharnaud, H.; Dran, J.C. Particle induced X-ray emission: A valuable tool for the analysis of metal point drawings. Nucl. Instrum. Meth. B 2004, 226, 60–74. [Google Scholar] [CrossRef]
  36. Milota, P.; Reiche, I.; Duval, A.; Forstner, O.; Guicharnaud, H.; Kutschera, W.; Merchel, S.; Priller, A.; Schreiner, M.; Steier, P. PIXE measurements of Renaissance silverpoint drawings at VERA. Nucl. Instrum. Meth. B 2008, 266, 2279–2285. [Google Scholar] [CrossRef]
  37. Calligaro, T.; Mossmann, A.; Poirot, J.-P.; Querré, G. Provenance study of rubies from a Parthian statuette by PIXE analysis. Nucl. Instrum. Methods Phys. Res. Sect. B Beam Interact. Mater. At. 1998, 136–138, 846–850. [Google Scholar] [CrossRef]
  38. Calligaro, T.; Poirot, J.-P.; Querré, G. Trace element fingerprinting of jewellery rubies by external beam PIXE. Nucl. Instrum. Methods Phys. Res. Sect. B Beam Interact. Mater. At. 1999, 150, 628–634. [Google Scholar] [CrossRef]
  39. Sanchez, J.L.; Osipowicz, T.; Tang, S.M.; Tay, T.S.; Win, T.T. Micro-PIXE analysis of trace element concentrations of natural rubies from different locations in Myanmar. Nucl. Instrum. Methods Phys. Res. Sect. B Beam Interact. Mater. At. 1997, 130, 682–686. [Google Scholar] [CrossRef]
  40. Bugoi, R.; Oanţă-Marghitu, R.; Calligaro, T. IBA investigations of loose garnets from Pietroasa, Apahida and Cluj-Someşeni treasures (5th century AD). Nucl. Instrum. Methods Phys. Res. Sect. B Beam Interact. Mater. At. 2016, 37115, 401–406. [Google Scholar] [CrossRef]
  41. Re, A.; Angelici, D.; Lo Giudice, A.; Maupas, E.; Giuntini, L.; Calusi, S.; Gelli, N.; Massi, M.; Borghi, A.; Gallo, L.M.; et al. New markers to identify the provenance of lapis lazuli: Trace elements in pyrite by means of micro-PIXE. Appl. Phys. A Mater. Sci. Process. 2013, 111, 69–74. [Google Scholar] [CrossRef]
  42. Giudice, A.L.; Angelici, D.; Re, A.; Gariani, G.; Borghi, A.; Calusi, S.; Giuntini, L.; Massi, M.; Castelli, L.; Taccetti, F.; et al. Protocol for lapis lazuli provenance determination: Evidence for an Afghan origin of the stones used for ancient carved artifacts kept at the Egyptian Museum of Florence (Italy). Archaeol. Anthropol. Sci. 2017, 9, 637–651. [Google Scholar] [CrossRef] [Green Version]
  43. Tenorio, D.; Jiménez-Reyes, M.; Esparza-López, J.R.; Calligaro, T.F.; Grave-Tirado, L.A. The obsidian of Southern Sinaloa: New evidence of Aztatlan networks through PIXE. J. Archaeol. Sci. Rep. 2015, 4, 106–110. [Google Scholar] [CrossRef]
  44. Constantinescu, B.; Cristea-Stan, D.; Kovács, I.; Szőkefalvi-Nagy, Z. Provenance studies of Central European Neolithic obsidians using external beam milli-PIXE spectroscopy. Nucl. Instrum. Methods Phys. Res. Sect. B Beam Interact. Mater. At. 2014, 318, 145–148. [Google Scholar] [CrossRef]
  45. Poupeau, G.; le Bourdonnec, F.-X.; Carter, T.; Delerue, S.; Kobayashilapis, K. The use of SEM-EDS, PIXE and EDXRF for obsidian provenance studies in the Near East: A case study from Neolithic Çatalhöyük (central Anatolia). J. Archaeol. Sci. 2010, 37, 2705–2720. [Google Scholar] [CrossRef]
  46. Cruz, J.; Manso, M.; Corregidor, V.; Silva, R.J.C.; Alves, L.C. Surface analysis of corroded XV–XVI century copper coins by μ-XRF and μ-PIXE/μ-EBS self-consistent analysis. Mater. Charact. 2020, 161, 110170. [Google Scholar] [CrossRef]
  47. Alinezhad, Z.; Dehpahlavan, M.; Rashti, M.L.; Oliaiy, P. Elemental analysis of Seleucid’s silver coins from Hamadan Museum by PIXE technique. Radiat. Phys. Chem. 2019, 158, 165–174. [Google Scholar] [CrossRef]
  48. Vadrucci, M.; Mazzinghi, A.; Gorghinian, A.; Picardi, L.; Chiari, M. Analysis of Roman Imperial coins by combined PIXE, HE-PIXE and μ-XRF. Appl. Radiat. Isot. 2019, 143, 35–40. [Google Scholar] [CrossRef]
  49. Salamanca, M.Á.O.; Tubío, B.G.; de la Bandera, M.L.; Respaldiza, M.Á. PIXE–PIGE analysis of a Visigothic gold cross. Nucl. Instrum. Methods Phys. Res. Sect. B Beam Interact. Mater. At. 2004, 226, 199–207. [Google Scholar] [CrossRef]
  50. Perea, A.; Climent-Font, A.; Fernández-Jiménez, M.; Enguita, O.; Montero, I. The Visigothic treasure of Torredonjimeno (Jaén, Spain): A study with IBA techniques. Nucl. Instrum. Methods Phys. Res. Sect. B Beam Interact. Mater. At. 2006, 249, 638–641. [Google Scholar] [CrossRef]
  51. Lemasson, Q.; Moignard, B.; Pacheco, C.; Pichon, L.; Guerra, M.F. Fast mapping of gold jewellery from ancient Egypt with PIXE: Searching for hard-solders and PIGE inclusions. Talanta 2015, 1431, 279–286. [Google Scholar] [CrossRef]
  52. Bugoi, R.; Cojocaru, V.; Constantinescu, B.; Calligaro, T.; Salomon, J. Compositional studies on Transylvanian gold nuggets: Advantages and limitations of PIXE–PIGE analysis. Nucl. Instrum. Methods Phys. Res. Sect. B Beam Interact. Mater. At. 2008, 266, 2316–2319. [Google Scholar] [CrossRef]
  53. Mudronja, D.; Jakšić, M.; Fazinić, S.; Božičević, I.; Desnica, V.; Woodhead, J.; Stos-Gale, Z.A. Croatian Appoxiomenos alloy composition and lead provenance study. J. Archaeol. Sci. 2010, 37, 1396. [Google Scholar] [CrossRef]
  54. Šatovića, D.; Desnica, V.; Fazinić, S.; Mičetić, M. Studies of bronze corrosion phenomena by EBS and complementary techniques. Nucl. Instrum. Methods Phys. Res. Sect. B Beam Interact. Mater. At. 2019, 461, 154–158. [Google Scholar] [CrossRef]
  55. Zucchiatti, A.; Bouquillon, A.; Lanterna, G.; Lucarelli, F.; Mandó, P.A.; Prati, P.; Salomon, J.; Vaccari, M.G. PIXE and micro-PIXE analysis of glazes from terracotta sculptures of the della Robbia workshop. Nucl. Instrum. Meth. B 2002, 189, 358–363. [Google Scholar] [CrossRef]
  56. Pappalardo, G.; Costa, E.; Marchetta, C.; Pappalardo, L.; Romano, F.P.; Zucchiatti, A.; Prati, P.; Mandó, P.A.; Migliori, A.; Palombo, L. Non-destructive characterization of Della Robbia sculptures at the Bargello museum in Florence by the combined use of PIXE and XRF portable systems. J. Cult. Herit. 2004, 5, 183–188. [Google Scholar] [CrossRef]
  57. Roumie, M.; Oggiano, I.; Reslan, A.; Srour, A.; El-Morra, Z.; Castiglione, M.; Tabbal, M.; Korek, M.; Nsouli, B. PIXE contribution for a database of Phoenician pottery in Lebanon. Nucl. Instrum. Methods Phys. Res. Sect. B Beam Interact. Mater. At. 2019, 4501, 299–303. [Google Scholar] [CrossRef]
  58. Laitinen, M.; Käyhkö, M.; Hahn, G.; von Uexküll-Güldenband, N.; Sajavaara, T. Tang dynasty (618–907) bowl measured with PIXE. Nucl. Instrum. Methods Phys. Res. Sect. B Beam Interact. Mater. At. 2017, 406, 329–333. [Google Scholar] [CrossRef] [Green Version]
  59. Xia, C.D.; Ge, L.J.; Liu, M.T.; Zhu, J.J.; Bai, B. Elemental analyses on porcelains of Tang and Song Dynasties excavated from Yongjinwan zone at Jinsha site. Nucl. Instrum. Methods Phys. Res. Sect. B Beam Interact. Mater. At. 2018, 4161, 55–61. [Google Scholar] [CrossRef]
  60. Zucchiatti, A.; Climent-Font, A.; Enguita, O.; Fernandez-Jimenez, M.T.; Finaldi, G.; Garrido, C.; Matillas, J.M. PIXE analysis of Italian ink drawings of the XVI century. Nucl. Instrum. Meth. B 2005, 240, 520–526. [Google Scholar] [CrossRef]
  61. Zucchiatti, A.; Climent-Font, A.; Galassi, M.C. PIXE and IRR analysis of sixteenth-century ink drawings by Luca Cambiaso and his school. Stud. Conserv. 2012, 57, 131–141. [Google Scholar] [CrossRef]
  62. Giuntini, L.; Lucarelli, F.; Mandò, P.A.; Hooper, W.; Barker, P.H. Galileo’s writings: Chronology by PIXE. Nucl. Instrum. Methods Phys. Res. Sect. B Beam Interact. Mater. At. 1995, 95, 389–392. [Google Scholar] [CrossRef]
  63. del Carmine, P.; Giuntini, L.; Hooper, W.; Lucarelli, F.; Mandò, P.A. Further results from PIXE analysis of inks in Galileo’s notes on motion. Nucl. Instrum. Methods Phys. Res. Sect. B Beam Interact. Mater. At. 1996, 113, 354–358. [Google Scholar] [CrossRef]
  64. Carmine, P.D.; Lucarelli, F.; Mandò, P.; Pecchioli, A. The external PIXE setup for the analysis of manuscripts at the Florence university. Nucl. Instrum. Methods Phys. Res. B 1993, 75, 480–484. [Google Scholar] [CrossRef]
  65. Manrique-Ortega, M.D.; Casanova-González, E.; Mitrani, A.; González-Cruz, A.; Cuevas-García, M.; Ruvalcaba-Sil, J.L. Spectroscopic examination of Red Queen’s funerary mask and her green stone offering from the Mayan site of Palenque, Mexico. Spectrochim. Acta Part A Mol. Biomol. Spectrosc. 2020, 234, 118205. [Google Scholar] [CrossRef]
  66. Silva, T.F.; Rodrigues, C.L.; Added, N.; Rizzutto, M.A.; Tabacniks, M.H.; Mangiarotti, A.; Curado, J.F.; Aguirre, F.R.; Aguero, N.F.; Allegro, P.R.P.; et al. Elemental mapping of large samples by external ion beam analysis with sub-millimeter resolution and its applications. Nucl. Instrum. Methods Phys. Res. B 2018, 422, 68–77. [Google Scholar] [CrossRef]
  67. Zucchiatti, A.; Climent-Font, A.; Gutiérrez-Neiraa, P.C.; Montero-Ruiz, I.; Fuenlabrada, J.M.; Galindo, C. Amorphous glass fragments from archaeological surface surveys: Potential chronological use of ion beam and isotopic analytical characterization. J. Archaeol. Sci. Rep. 2018, 19, 439–453. [Google Scholar] [CrossRef]
  68. Schwarz, J.; Cusack, M.; Karban, J.; Chalupníčková, E.; Havránek, V.; Smolík, J.; Ždímal, V. PM2.5 chemical composition at a rural background site in Central Europe, including correlation and air mass back trajectory analysis. Atmos. Res. 2016, 176–177, 108–120. [Google Scholar] [CrossRef]
  69. Török, Z.; Huszánk, R.; Csedreki, L.; Dani, J.; Szoboszlai, Z.; Kertész, Z. Development of a new in-air micro-PIXE set-up with in-vacuum charge measurements in Atomki. Nucl. Instrum. Methods Phys. Res. B 2015, 362, 167–171. [Google Scholar] [CrossRef]
  70. Bugoi, R.; Poll, I.; Mănucu-Adameşteanu, G.; Neelmeijer, C.; Eder, F. Investigations of Byzantine glass bracelets from Nufăru, Romania using external PIXE-PIGE methods. J. Archaeol. Sci. 2013, 40, 2881–2891. [Google Scholar] [CrossRef]
  71. Beck, L.; Pichon, L.; Moignard, B.; Guillou, T.; Walter, P. IBA techniques: Examples of useful combinations for the characterisation of cultural heritage materials. Nucl. Instrum. Methods Phys. Res. Sect. B 2011, 269, 2999. [Google Scholar] [CrossRef]
  72. Sokaras, D.; Bistekos, E.; Georgiou, L.; Salomon, J.; Bogovac, M.; Aloupi-Siotis, E.; Paschalis, V.; Aslani, I.; Karabagia, S.; Lagoyannis, A.; et al. The new external ion beam analysis setup at the Demokritos tandem accelerator and first applications in cultural heritage. Nucl. Instrum. Methods Phys. Res. B 2011, 269, 519–527. [Google Scholar] [CrossRef]
  73. Mathis, F.; Othmane, G.; Vrielynck, O.; del Castillo, H.C.; Chene, G.; Dupuis, T.; Strivay, D. Combined PIXE/PIGE and IBIL with external beam applied to the analysis of Merovingian glass beads. Nucl. Instr. Meth. B 2010, 268, 2078–2082. [Google Scholar] [CrossRef]
  74. Pichon, L.; Beck, L.; Walter, P.; Moignard, B.; Guillou, T. A new mapping acquisition and processing system for simultaneous PIXE-RBS analysis with external beam. Nucl. Instr. Meth. B 2010, 268, 2028–2033. [Google Scholar] [CrossRef]
  75. Salamanca, M.Á.O.; Gómez-Tubío, B.; Ortega-Feliu, I.; Respaldiza, M.Á.; de la Bandera, M.L.; Zappino, G.O.; Bouzas, A.; Gómez-Morón, A. External-beam PIXE spectrometry for the study of Punic jewellery (SW Spain): The geographical provenance of the palladium-bearing gold. Nucl. Instrum. Methods Phys. Res. B 2006, 249, 622–627. [Google Scholar] [CrossRef]
  76. Mathot, S.; Mathot, S.; Anelli, G.; Atieh, S.; Bulat, B.; Callamand, T.; Calvo, S.; Favre, G.; Geisser, J.M.; Gerardin, A.; et al. The CERN PIXE-RFQ, a transportable proton accelerator for the machina project. Nucl. Instrum. Methods Phys. Res. Sect. B Beam Interact. Mater. At. 2019, 459, 153–157. [Google Scholar] [CrossRef]
  77. Käyhkö, M.; Laitinen, M.; Arstila, K.; Maasilta, I.J.; Sajavaara, T. A new beamline for energy-dispersive high-resolution pixe analysis using polycapillary optics. Nucl. Instrum. Methods Phys. Res. B 2019, 447, 59–67. [Google Scholar] [CrossRef]
  78. Ikeoka, R.A.; Appoloni, C.R.; Rizzutto, M.A.; Bandeira, A.M. Computed Radiography, PIXE and XRF Analysis of Pre-colonial Pottery from Maranhão, Brazil. Microchem. J. 2018, 138, 384–389. [Google Scholar] [CrossRef]
  79. Radepont, M.; Pichon, L.; Lemasson, Q.; Moignard, B.; Pacheco, C. Towards a sharpest interpretation of analytical results assessing the uncertainty of PIXE/RBS data at the AGLAE facility. Measurement 2018, 114, 501–507. [Google Scholar] [CrossRef]
  80. Matjačić, L.; Palitsin, V.; Grime, G.W.; Abdul-Karim, N.; Webb, R.P. Simultaneous molecular and elemental mapping under ambient conditions by coupling AP MeV SIMS and HIPIXE. Nucl. Instrum. Methods Phys. Res. Sect. B 2019, 450, 353–356. [Google Scholar] [CrossRef]
  81. Pichon, L.; Moignard, B.; Lemasson, Q.; Pacheco, C.; Walter, P. Development of a multi-detector and a systematic imaging system on the AGLAE external beam. Nucl. Instrum. Methods Phys. Res. B 2014, 318, 27–31. [Google Scholar] [CrossRef]
  82. Maenhaut, W. (Ed.) Chemistry, Molecular Sciences and Chemical Engineering, Encyclopedia of Analytical Science, 3rd ed.; Elsevier: Amsterdam, The Netherlands, 2019; pp. 432–442. [Google Scholar] [CrossRef]
  83. Moseley, H.G.J. XCIII. The high-frequency spectra of the elements. Lond. Edinb. Dublin Philos. Mag. J. Sci. 1913, 26, 1024–1034. [Google Scholar] [CrossRef] [Green Version]
  84. Friedman, H.; Birks, L.S. A Geiger Counter Spectrometer for X-ray Fluorescence Analysis. Rev. Sci. Instrum. 1948, 19, 323. [Google Scholar] [CrossRef]
  85. Hall, E.T. X-ray fluorescent analysis applied to archaeology. Archaeometry 1960, 3, 29–37. [Google Scholar] [CrossRef]
  86. de Castro, M.D.L.; Jurado-López, A. The role of analytical chemists in the research on the CH. Talanta 2019, 205, 120106. [Google Scholar] [CrossRef]
  87. Liss, B.; Stout, S. Materials Characterization for CH: XRF Case Studies in Archaeology and Art. In Heritage and Archaeology in the Digital Age; Springer: Berlin/Heidelberg, Germany, 2017; pp. 49–65. [Google Scholar] [CrossRef]
  88. Alfeld, M.; de Viguerie, L. Recent developments in spectroscopic imaging techniques for historical paintings—A review. Spectrochim. Acta Part B 2017, 136, 81–105. [Google Scholar] [CrossRef]
  89. Pouyet, E.; Barbi, N.; Chopp, H.; Healy, O.; Katsaggelos, A.; Moak, S.; Mott, R.; Vermeulen, M.; Walton, M. Development of a highly mobile and versatile large MA-XRF scanner for in situ analyses of painted work of arts. X-ray Spectrom. 2020, 1–9. [Google Scholar] [CrossRef]
  90. Watteeuw, L.; van Bos, M.; Gersten, T.; Hameeuw, B.V.H. An applied complementary use of macro X-ray fluorescence scanning and multi-light reflectance imaging to study Medieval Illuminated Manuscripts. The Rijmbijbel of Jacob van Maerlant. Microchem. J. 2020, 155, 104582. [Google Scholar] [CrossRef]
  91. Ravaud, E.; Pichon, L.; Laval, E.; Gonzalez, V.; Eveno, M.; Calligaro, T. Development of a versatile XRF scanner for the elemental imaging of paintworks. Microchem. J. 2018, 137, 277–284. [Google Scholar] [CrossRef]
  92. Sciutto, G.; Frizzi, T.; Catelli, E.; Aresi, N.; Prati, S.; Alberti, R.; Mazzeo, R. From macro to micro: An advanced macro X-ray fluorescence (MA-XRF) imaging approach for the study of painted surfaces. Microchem. J. 2018, 137, 277–284. [Google Scholar] [CrossRef]
  93. Defeyt, C.; Walter, P.; Rousselière, H.; Vandenabeele, P.; Vekemans, B.; Samain, L.; Strivay, D. New Insights on Picasso’s Blue Period Painting La famille Soler. Stud. Conserv. 2018, 63, 24–35. [Google Scholar] [CrossRef]
  94. Alfeld, M.; Pedroso, J.; Hommes, M.; van der Snickt, G.; Tauber, G.; Blaas, J.; Haschke, M.; Erler, K.; Dik, J.; Janssens, K. A mobile instrument for in situ scanning macro-XRF investigation of historical paintings. J. Anal. At. Spectrom. 2013, 28, 760–767. [Google Scholar] [CrossRef]
  95. Taccetti, F.; Castelli, L.; Czelusniak, C.; Gelli, N.; Mazzinghi, A.; Palla, L.; Ruberto, C.; Censori, C.; Lo Giudice, A.; Re, A.; et al. A multipurpose X-ray fluorescence scanner developed for in situ analysis. Rend. Lincei Sci. Fis. Nat. 2019, 30, 307–322. [Google Scholar] [CrossRef]
  96. Sottili, L.; Guidorzi, L.; Mazzinghi, A.; Ruberto, C.; Castelli, L.; Czelusniak, C.; Giuntini, L.; Massi, M.; Taccetti, F.; Nervo, M.; et al. The Importance of Being Versatile: INFN-CHNet MA-XRF Scanner on Forniture at the CCR “La Venaria Reale”. Appl. Sci. 2021, 11, 1197. [Google Scholar] [CrossRef]
  97. Ruberto, C.; Mazzinghi, A.; Massi, M.; Castelli, L.; Czelusniak, C.; Palla, L.; Gelli, N.; Raffaelli, M. Imaging study of Raffaello’s “La Muta” by a portable XRF spectrometer. Microchem. J. 2016, 126, 63–69. [Google Scholar] [CrossRef]
  98. Romano, F.P.; Caliri, C.; Nicotra, P.; di Martino, S.; Pappalardo, L.; Rizzo, F.; Santos, H.C. Real-time elemental imaging of large dimension paintings with a novel mobile macro X-ray fluorescence (MA-XRF) scanning technique. J. Anal. At. Spectrom. 2017, 32, 773–781. [Google Scholar] [CrossRef]
  99. Alfeld, M.; Janssens, K.; Dik, J.; de Nolf, W.; van der Snickt, G. Optimization of mobile scanning macro-XRF systems for the in situ investigation of historical paintings. J. Anal. Spectrom. 2011, 26, 899–909. [Google Scholar] [CrossRef]
  100. Arneodo, F.; di Giovanni, A.; Torres, R.; Castelli, L.; Czelusniak, C.; Giuntini, L.; Mazzinghi, A.; Ruberto, C.; Taccetti, F. A Portable X-ray Fluorescence Scanner For In Situ Analysis. In Proceedings of the TECHNART Conference, Bruges, Belgium, 7–10 May 2019. [Google Scholar] [CrossRef]
  101. Iorio, M.; Graziani, V.; Lins, S.; Ridolfi, S.; Branchini, P.; Fabbri, A.; Ingo, G.M.; Di Carlo, G.; Tortora, L. Exploring Manufacturing Process and Degradation Products of Gilt and Painted Leather. Appl. Sci. 2019, 9, 3016. Available online: https://0-www-mdpi-com.brum.beds.ac.uk/2076-3417/9/15/3016 (accessed on 31 March 2021). [CrossRef] [Green Version]
  102. Lins, S.; Ridolfi, S.; Gigante, G.E.; Cesareo, R.; Albini, M.; Riccucci, C.; Di Carlo, G.; Fabbri, A.; Branchini, P.; Tortora, L. Differential X-ray Attenuation in MA-XRF Analysis for a Non-invasive Determination of Gilding Thickness. Front. Chem. 2020, 8, 175. Available online: https://www.frontiersin.org/articles/10.3389/fchem.2020.00175/full (accessed on 31 March 2021). [CrossRef]
  103. Lins, S.A.B.; Manso, M.; Gigante, G.E.; Cesareo, R.; Tortora, L.; Branchini, P.; Ridolfi, S. Modular MA-XRF scanner potentialities and further advances. In Proceedings of the 2020 IMEKO TC-4 International Conference on Metrology for Archaeology and Cultural Heritage, Trento, Italy, 22–24 October 2020; Available online: https://www.imeko.org/publications/tc4-Archaeo-2020/IMEKO-TC4-MetroArchaeo2020-094.pdf (accessed on 31 March 2021).
  104. Romano, F.P.; Caliri, C.; Cosentino, L.; Gammino, S.; Giuntini, L.; Mascali, D.; Neri, L.; Pappalardo, L.; Rizzo, F.; Taccetti, F. Macro and Micro Full Field X-ray Fluorescence with an X-ray Pinhole Camera Presenting High Energy and High Spatial Resolution. Anal. Chem. 2014, 86, 10892–10899. [Google Scholar] [CrossRef] [PubMed]
  105. Bufon, J.; Altissimo, M.; Aquilanti, G.; Bellutti, P.; Bertuccio, G.; Billè, F.; Borghes, R.; Borghi, G.; Cautero, G.; Ciano, S.; et al. Large solid angle and high detection efficiency multi-element silicon drift detectors (SDD) for synchrotron based X-ray spectroscopy. AIP Conf. Proc. 2019, 2054, 060061. [Google Scholar] [CrossRef]
  106. Balerna, A. DAFNE-Light DXR1 Soft X-ray Synchrotron Radiation Beamline: Characteristics and XAFS Applications. Condens. Matter 2019, 4, 7. Available online: https://0-www-mdpi-com.brum.beds.ac.uk/2410-3896/4/1/7/htm (accessed on 31 March 2021). [CrossRef] [Green Version]
  107. Fleet, M.E.; Liu, X.; Harmer, S.L.; Nesbit, H.W. Chemical state of sulfur in natural and synthetic lazurite by S K-edge XANES and X-ray photoelectron spectroscopy. Can. Mineral. 2005, 43, 1589–1603. [Google Scholar] [CrossRef] [Green Version]
  108. Bellotti, G.; Butt, A.D.; Carminati, M.; Fiorini, C.; Bombelli, L.; Borghi, G.; Piemonte, C.; Zorzi, N.; Balerna, A. ARDESIA Detection Module: A Four-Channel Array of SDDs for Mcps X-ray Spectroscopy in Synchrotron Radiation Applications. IEEE Trans Nucl. Sci. 2018, 65, 1355–1364. [Google Scholar] [CrossRef]
  109. Hafizh, I.; Bellotti, G.; Carminati, M.; Utica, G.; Gugiatti, M.; Balerna, A.; Tullio, V.; Borghi, G.; Picciotto, A.; Ficorella, F.; et al. ARDESIA: A fast silicon drift detector X-ray spectrometer for synchrotron applications. X-ray Spectrom. 2019, 48, 382–386. [Google Scholar] [CrossRef]
  110. Hafizh, I.; Bellotti, G.; Carminati, M.; Utica, G.; Gugiatti, M.; Balerna, A.; Tullio, V.; Lepore, G.O.; Borghi, G.; Ficorella, F.; et al. Characterization of ARDESIA: A 4-channel SDD x-ray spectrometer for synchrotron measurements at high count rates. JINST 2019, 14, P06027. [Google Scholar] [CrossRef]
  111. Utica, G.; Gugiatti, M.; Carminati, M.; Fabbrica, E.; Hafizh, I.; Balerna, A.; Borghi, G.; Ficorella, F.; Picciotto, A.; Zorzi, N.; et al. Towards Efficiency and Count-Rate Enhancement of X-ray ARDESIA Spectrometer. In Proceedings of the IEEE Nuclear Science Symposium and Medical Imaging Conference (NSS/MIC) 2019, Manchester, UK, 26 October–2 November 2019; pp. 1–4. [Google Scholar] [CrossRef]
  112. Smieska, L.M.; Twilley, J.; Woll, A.R.; Schafer, M.; DeGalan, A.M. Energy-optimized synchrotron XRF mapping of an obscured painting beneath Exit from the Theater, attributed to Honoré Daumier. Microchem. J. 2019, 146, 679–691. [Google Scholar] [CrossRef]
  113. Gonzalez, V.; Cotte, M.; Vanmeert, F.; de Nolf, W.; Janssens, K. X-ray Diffraction Mapping for Cultural Heritage Science: A Review of Experimental Configurations and Applications. Chem. Eur. J. 2020, 26, 1703. [Google Scholar] [CrossRef] [PubMed]
  114. Ballabriga, R.; Campbell, M.; Heijne, E.; Llopart, X.; Tlustos, L.; Wong, W. Medipix3: A 64k pixel detector readout chip working in single photon counting mode with improved spectrometric performance. Nucl. Instrum. Methods Phys. Res. Sect. A Accel. Spectrometers Detect. Assoc. Equip. 2011, 633 (Suppl. 1), S15–S18. [Google Scholar] [CrossRef]
  115. Förster, A.; Brandstetter, S.; Schulze-Briese, C. Transforming X-ray detection with hybrid photon counting detectors. Philos. Trans. A Math. Phys. Eng. Sci. 2019, 377, 20180241. [Google Scholar] [CrossRef]
  116. Aguilar-Melo, V.; Mitrani, A.; Casanova-Gonzalez, E.; Manrique-Ortega, M.D.; Pérez-Ireta, G.; Ruvalcaba-Sil, J.L.; Tovalin-Ahumada, A.; Moscoso-Rincón, J.L.; Sesheña-Hernández, A.; Lozada-Toledo, J. Molecular and X-ray Spectroscopies for Non-invasive Characterization of Mayan Green Stones from Bonampak, Chiapas. Appl. Spectrosc. 2019, 73, 1074–1086. [Google Scholar] [CrossRef]
  117. Carminati, M.; Amirkhani, A.; Gugiatti, M.; Ferrara, E.; Fiorini, C.; Demenev, E.; Pepponi, G.; Ronchin, S.; Ficorella, F.; Borghi, G.; et al. 32-Channel Detection Unit for Combined XRF-XRD in Mining Transportable Applications. In Proceedings of the 2019 IEEE Nuclear Science Symposium and Medical Imaging Conference (NSS/MIC), Manchester, UK, 26 October–2 November 2019; pp. 1–3, ISBN 978-1-7281-4164-0. [Google Scholar] [CrossRef]
  118. Morigi, M.P.; Casali, F. Radiography and Computed Tomography for Works of Art. In Handbook of X-ray Imaging: Physics and Technology; Russo, P., Ed.; CRC Press: Boca Raton, FL, USA, 2018; pp. 1185–1210. [Google Scholar]
  119. Bernardini, F.; Leghissa, E.; Prokop, D.; Velušček, A.; De Min, A.; Dreossi, D.; Donato, S.; Tuniz, C.; Princivalle, F.; Montagnari Kokelj, M. X-ray computed microtomography of Late Copper Age decorated bowls with cross-shaped foots from central Slovenia and the Trieste Karst (North-Eastern Italy): Technology and paste characterisation. Archaeol. Anthropol. Sci. 2019, 11, 4711–4728. [Google Scholar] [CrossRef]
  120. van den Bulcke, J.; van Loo, D.; Dierick, M.; Masschaele, B.; van Hoorebeke, L.; van Acker, J. Non-destructive research on wooden musical instruments: From macro-to microscale imaging with lab-based X-ray CT systems. J. Cult. Herit. 2017, 27S, S78–S87. [Google Scholar] [CrossRef]
  121. Re, A.; Albertin, F.; Avataneo, C.; Brancaccio, R.; Corsi, J.; Cotto, G.; de Blasi, S.; Dughera, G.; Durisi, E.; Ferrarese, W.; et al. X-ray tomography of large wooden artworks: The case study of “Doppio Corpo” by Pietro Piffeti. Herit. Sci. 2014, 2, 19. [Google Scholar] [CrossRef] [Green Version]
  122. Goldman, L.W. Principles of CT and CT technology. J. Nucl. Med. Technol. 2007, 35, 115–128. [Google Scholar] [CrossRef] [PubMed] [Green Version]
  123. Goldman, L.W. Principles of CT: Multislice CT. J. Nucl. Med. Technol. 2008, 36, 57–68. [Google Scholar] [CrossRef] [Green Version]
  124. Logan, H.; Wolfaardt, J.; Boulanger, P.; Hodgetts, B.; Seikaly, H. Evaluation of the accuracy of Cone Beam Computerized Tomography (CBCT): Medical imaging technology in head and neck reconstruction. J. Otolaryngol. Head Neck Surg. 2013, 42, 25–32. [Google Scholar] [CrossRef] [PubMed] [Green Version]
  125. Albertin, F.; Bettuzzi, M.; Brancaccio, R.; Morigi, M.P.; Casali, F. X-ray Computed Tomography In Situ: An Opportunity for Museums and Restoration Laboratories. Heritage 2019, 2, 2028–2038. [Google Scholar] [CrossRef] [Green Version]
  126. Albertin, F.; Bettuzzi, M.; Brancaccio, R.; Toth, M.B.; Baldan, M.; Morigi, M.P.; Casali, F. Inside the construction techniques of the Master globe-maker Vincenzo Coronelli. Microchem. J. 2020, 158, 105203. [Google Scholar] [CrossRef]
  127. Morigi, M.P.; Casali, F.; Bettuzzi, M.; Brancaccio, R.; d’Errico, V. Application of X-ray computed tomography to cultural heritage diagnostics. Appl. Phys. A 2010, 100, 653–661. [Google Scholar] [CrossRef]
  128. Bettuzzi, M.; Casali, F.; Morigi, M.P.; Brancaccio, R.; Carson, D.; Chiari, G.; Maish, J. Computed tomography of a medium size Roman bronze statue of Cupid. Appl. Phys. A 2015, 118, 1161–1169. [Google Scholar] [CrossRef]
  129. Kardjilov, N.; Dawson, M.; Hilger, A.; Manke, I.; Strobl, M.; Penumadu, D.; Kim, F.H.; Garcia-Moreno, F.; Banhart, J. A highly adaptive detector system for high resolution neutron imaging. Nucl. Instrum. Methods Phys. Res. Sect. A Accel. Spectrometers Detect. Assoc. Equip. 2011, 651, 95–99. [Google Scholar] [CrossRef]
  130. Kotter, E.; Langer, M. Digital radiography with large-area flat-panel detectors. Eur. Radiol. 2002, 12, 2562–2570. [Google Scholar] [CrossRef] [PubMed]
  131. Spani, F.; Morigi, M.P.; Bettuzzi, M.; Scalici, M.; Carosi, M. A 3D journey on virtual surfaces and inner structure of ossa genitalia in Primates by means of a non-invasive imaging tool. PLoS ONE 2020, 15, e0228131. [Google Scholar] [CrossRef] [Green Version]
  132. Re, A.; Corsi, J.; Demmelbauer, M.; Martini, M.; Mila, G.; Ricci, C. X-ray tomography of a soil block: A useful tool for the restoration of archaeological finds. Herit. Sci. 2015, 3, 4. [Google Scholar] [CrossRef] [Green Version]
  133. Re, A.; Giudice, A.L.; Nervo, M.; Buscaglia, P.; Luciani, P.; Borla, M.; Greco, C. The importance of tomography studying wooden artifacts: A comparison with radiography in the case of a coffin lid from Ancient Egypt. Int. J. Conserv. Sci. 2016, 7, 935–944. [Google Scholar]
  134. Tuniz, C.; Bernardini, F.; Cicuttin, A.; Crespo, M.L.; Dreossi, D.; Gianoncelli, A.; Mancini, L.; Mendoza Cuevas, A.; Sodini, N.; Tromba, G.; et al. The ICTP-Elettra X-ray laboratory for cultural heritage and archaeology. Nucl. Instrum. Methods Phys. Res. Sect. A Accel. Spectrometers Detect. Assoc. Equip. 2013, 711, 106–110. [Google Scholar] [CrossRef]
  135. Johnson, T.R.C. Dual-energy CT: General principles. AJR Am. J. Roentgenol. 2012, 199, 3–8. [Google Scholar] [CrossRef]
  136. Procz, S.; Avila, C.; Fey, J.; Roque, G.; Schuetz, M.; Hamann, E. X-ray and gamma imaging with Medipix and Timepix detectors in medical research. Radiat. Meas. 2019, 127, 106104. [Google Scholar] [CrossRef]
  137. Dectris. Available online: https://www.dectris.com (accessed on 1 April 2021).
  138. Medipix. Available online: https://medipix.web.cern.ch (accessed on 1 April 2021).
  139. Mars. Available online: https://www.marsbioimaging.com (accessed on 1 April 2021).
  140. Ninomiya, K.; Nagatomo, T.; Kubo, K.M.; Strasser, P.; Kawamura, N.; Shimomura, K.; Miyake, Y.; Saito, T.; Higemoto, W. Development of elemental analysis by muonic X-ray measurement in J-PARC. J. Phys. Conf. Ser. 2010, 225, 012040. [Google Scholar] [CrossRef]
  141. Hosoi, Y.; Watanabe, Y.; Sugita, R.; Tanaka, Y.; Nagamine, K.; Ono, T.; and Sakamoto, K. Non-destructive elemental analysis of vertebral body trabecular bone using muonic X-rays. Br. J. Radiol. 1995, 68, 1325. [Google Scholar] [CrossRef] [PubMed]
  142. Hutson, R.L.; Reidy, J.J.; Springer, K.; Daniel, H.; Knowles, H.B. Tissue Chemical Analysis with Muonic X Rays. Radiology 1976, 120, 193. [Google Scholar] [CrossRef]
  143. Reidy, J.J.; Hutson, R.L.; Springer, K. Use of Muonic X Rays for Tissue Analysis. IEEE Trans. Nucl. Sci. 1975, 22, 1780–1783. [Google Scholar] [CrossRef]
  144. Kubo, M.K.; Moriyama, H.; Tsuruoka, Y.; Sakamoto, S.; Koseto, E.; Saito, T.; Nishiyama, K. Non-destructive elemental depth-profiling with muonic X-rays. J. Radioanal. Nucl. Chem. 2008, 278, 777. [Google Scholar] [CrossRef]
  145. Terada, K.; Ninomiya, K.; Osawa, T.; Tachibana, S.; Miyake, Y.; Kubo, M.K.; Kawamura, N.; Higemoto, W.; Tsuchiyama, A.; Ebihara, M.; et al. A new X-ray fluorescence spectroscopy for extraterrestrial materials using a muon beam. Sci. Rep. 2014, 4, 5072. [Google Scholar] [CrossRef] [Green Version]
  146. Hillier, A.D.; Paul, D.; Ishida, K. Probing beneath the surface without a scratch — Bulk non-destructive elemental analysis using negative muons. Microchem. J. 2016, 125, 203–207. [Google Scholar] [CrossRef]
  147. Wilson, A.I. The metal supply of the Roman Empire. In Supplying Rome: The Proceedings of an International Seminar Held at Siena-Certosa Di Pontignano on May 2-4, 2004, on Rome, the Provinces, Production and Distribution; Papi, E., Scardigli, B., Eds.; Journal of Roman Archaeology: Portsmouth, RI, USA, 2007. [Google Scholar]
  148. Clemenza, M.; Baldazzi, G.; Ballerini, G.; Bonesini, M.; Carpinelli, M.; Cremonesi, O.; Di Stefano, E.; Fiorini, E.; Gorini, G.; Hillier, A.; et al. CHNET-TANDEM experiment: Use of negative muons at RIKEN-RAL Port4 for elemental characterization of “Nuragic votive ship” samples. Nucl. Instrum. Methods Phys. Res. Sect. A 2019, 936, 27–28. [Google Scholar] [CrossRef] [Green Version]
  149. Adamczak, A.; Baccolo, G.; Bakalov, D.; Baldazzi, G.; Bertoni, R.; Bonesini, M.; Bonvicini, V.; Campana, R.; Carbone, R.; Cervi, T.; et al. Measurement of the Muon Transfer Rate from Proton to Heavier Nuclei at Epithermal Energies; Proposal P484 at Riken-RAL; RAL: Didcot, UK. [CrossRef] [Green Version]
  150. Vacchi, A.; Adamczak, A.; Andreson, B.; Bakalov, D.; Stoilov, M.; Battistoni, G.; Bhattacharya, N.; Urbach, P.; Boezio, M.; Bonvicini, W.; et al. Measuring the Size of the Proton; SPIE Newsroom: Bellingham, WA, USA, 2012. [Google Scholar] [CrossRef]
  151. Bonesini, M.; Bertoni, R.; Chignoli, F.; Mazza, R.; Cervi, T.; deBari, A.; Menegolli, A.; Prata, M.C.; Rossella, M.; Tortora, L.; et al. The construction of the Fiber-SiPM beam monitor system of the R484 and R582 experiments at the RIKEN-RAL muon facility. JINST 2017, 12, C03035. [Google Scholar] [CrossRef] [Green Version]
  152. Bonesini, M.; Benocci, R.; Bertoni, R.; Mazza, R.; deBari, A.; Menegolli, A.; Prata, M.C.; Rossella, M.; Mocchiutti, E.; Vacchi, A.; et al. The upgraded beam monitor system of the FAMU experiment at RIKEN-RAL. NIM A 2019, 936, 592. [Google Scholar] [CrossRef]
  153. Kumar, K.A.P.; Sundaram, G.A.S.; Sharma, B.K.; Venkatesh, S.; Thiruvengadathan, R. Advances in gamma radiation detection systems for emergency radiation monitoring. Nucl. Eng. Technol. 2020, 52, 2151–2161. [Google Scholar] [CrossRef]
  154. Naydenov, S.V.; Ryzhikov, V.D. Theoretical analysis of physical limits of energy resolution for detectors of scintillator-photodiode type and ways to improve their spectrometric characteristics. In Hard X-ray Gamma-Ray Detector Physics V; SPIE: Bellingham, WA, USA, 2004; pp. 261–271. [Google Scholar] [CrossRef]
  155. Dorenbos, P. The quest for high resolution γ-ray scintillators. Opt. Mater. X 2019, 1, 100021. [Google Scholar] [CrossRef]
  156. Milbrath, B.D.; Peurrung, A.J.; Bliss, M.; Weber, W.J. Radiation detector materials: An overview. J. Mater. Res. 2008, 23, 2561–2581. [Google Scholar] [CrossRef]
  157. Bolotnikov, A.E.; Babalola, S.; Camarda, G.S.; Cui, Y.; Egarievwe, S.U.; Hawrami, R.; Hossain, A.; Yang, G.; James, R.B. Te inclusions in CZT detectors: New method for correcting their adverse effects. IEEE Trans. Nucl. Sci. 2010, 57, 910–919. [Google Scholar] [CrossRef] [Green Version]
  158. Bolotnikov, A.E.; Abdul-Jabbar, N.M.; Babalola, S.; Camarda, G.S.; Cui, Y.; Hossain, A.; Jackson, E.; Jackson, H.; James, J.R.; Luryi, A.L. Optimization of virtual Frisch-grid CdZnTe detector designs for imaging and spectroscopy of gamma rays. In Hard X-ray Gamma-Ray Detector Physics IX; SPIE: Bellingham, WA, USA, 2007; p. 670603. [Google Scholar] [CrossRef] [Green Version]
  159. Kosyachenko, V.L.A.; Aoki, T.; Lambropoulos, C.P.; Gnatyuk, V.A.; Grushko, E.V.; Sklyarchuk, V.M.; Maslyanchuk, O.L.; Sklyarchuk, O.F.; Koike, A. High energy resolution CdTe Schottky diode gamma-ray detectors. Nucl. Sci. Symp. Med. Imaging Conf. (Nss/Mic) 2012, 2012, 4156–4164. [Google Scholar] [CrossRef]
  160. Zucchiatti, A.; Corvisiero, P. PIGE: A useful technique for the study of innovative energy related materials. Technical note on the measurement of gamma-ray production cross sections. Energy Procedia 2013, 41, 110–118. [Google Scholar] [CrossRef] [Green Version]
  161. Carmona, N.; Ortega-Feliu, I.; Gómez-Tubío, B.; Villegas, M.A. Advantages and disadvantages of PIXE/PIGE, XRF and EDX spectrometries applied to archaeometric characterisation of glasses. Mater. Characterisation 2010, 61, 257–267. [Google Scholar] [CrossRef]
  162. Quarta, G.; Calcagnile, L.; D’Elia, M.; Maruccio, L.; Gaballo, V.; Caramia, A. A combined PIXE–PIGE approach for the assessment of the diagenetic state of cremated bones submitted to AMS radiocarbon dating. Nucl. Instrum. Methods Phys. Res. B 2013, 294, 221–225. [Google Scholar] [CrossRef]
  163. Phillips, J.A.; Kroger, P.G. The energy of gamma-rays emitted during the reaction F(p, α)O. Phys. Rev. 1947, 72, 164. [Google Scholar] [CrossRef]
  164. Goldhaber, G. The gamma-ray spectrum of F19+H using photographic emulsions containing D2O. Phys. Rev. 1948, 74, 1725–1726. [Google Scholar] [CrossRef]
  165. Sippel, R.F.; Glover, E.D. Sedimental rock analysis by charged particle bombardment. Nucl. Instrum. Meth. 1960, 9, 37–48. [Google Scholar] [CrossRef]
  166. Rajta, I.; Vajda, I.; Gyürky, G.; Csedreki, L.; Kiss, Á.Z.; Biri, S.; van Oosterhout, H.A.P.; Podaru, N.C.; Mous, D.J.W. Accelerator characterization of the new ion beam facility at MTA Atomki in Debrecen, Hungary. Nucl. Instrum. Methods Phys. Res. A 2018, 880, 125–130. [Google Scholar] [CrossRef]
  167. Bugoi, R.; Măgureanu, A.; Măgureanu, D.; Lemasson, Q. IBA analyses on glass beads from the Migration Period. Nucl. Instrum. Methods Phys. Res. B 2020, 478, 150–157. [Google Scholar] [CrossRef]
  168. Allegro, P.R.P.; Rizzutto, M.d.; Medina, N.H. Improvements in the PIGE technique via gamma-ray angular distribution. Microchem. J. 2016, 126, 287–295. [Google Scholar] [CrossRef]
  169. Coote, G.E.; Whitehead, N.E.; McCallum, G.J. A rapid method of obsidian characterisation by inelastic scattering of protons. J. Radioanal. Chem. 1972, 12, 491–496. [Google Scholar] [CrossRef]
  170. Iperion HS. Available online: http://www.iperionhs.eu/catalogue/ (accessed on 2 April 2021).
  171. Hunault, M.O.J.Y.; Bauchau, F.; Boulanger, K.; Hérold, M.; Calas, G.; Lemasson, Q.; Pichon, L.; Pacheco, C.; Loisel, C. Thirteenth-century stained glass windows of the Sainte-Chapelle in Paris: An insight into medieval glazing work practices. J. Archaeol. Sci. Rep. 2021, 35, 102753. [Google Scholar] [CrossRef]
  172. Bugoi, R.; Poll, I.; Mănucu-Adameşteanu, G.; Pacheco, C.; Lehuédé, P. Compositional study of Byzantine glass bracelets discovered at the Lower Danube. Microchem. J. 2018, 137, 223–230. [Google Scholar] [CrossRef]
  173. Meek, A. Ion beam analysis of glass inlays from the Staffordshire Anglo-Saxon Hoard. J. Archaeol. Sci. Rep. 2016, 7, 324–329. [Google Scholar] [CrossRef]
  174. Neri, E.; Verità, M.; Biron, I.; Guerra, M.F. Glass and gold: Analyses of 4th–12th centuries Levantine mosaic tesserae. A contribution to technological and chronological knowledge. J. Archaeol. Sci. 2016, 70, 158–171. [Google Scholar] [CrossRef]
  175. Calligaro, T.; Coquinot, Y.; Pichon, L.; Moignard, B. Advances in elemental imaging of rocks using the AGLAE external microbeam. Nucl. Instrum. Methods Phys. Res. Sect. B Beam Interact. Mater. At. 2011, 269, 2364–2372. [Google Scholar] [CrossRef]
  176. Calligaro, T.; Dran, J.-C.; Poirot, J.-P.; Querré, G.; Salomon, J.; Zwaan, J.C. PIXE/PIGE characterisation of emeralds using an external micro-beam. Nucl. Instrum. Methods Phys. Res. Sect. B Beam Interact. Mater. At 2000, 161–163, 769–774. [Google Scholar] [CrossRef]
  177. Heckel, C.; Müller, K.; White, R.; Floss, H.; Conard, N.J.; Reiche, I. Micro-PIXE/PIGE analysis of Palaeolithic mammoth ivory: Potential chemical markers of provenance and relative dating. Palaeogeogr. Palaeoclimatol. Palaeoecol. 2014, 416, 133–141. [Google Scholar] [CrossRef]
  178. Müller, K.; Reiche, I. Differentiation of archaeological ivory and bone materials by micro-PIXE/PIGE with emphasis on two Upper Palaeolithic key sites: Abri Pataud and Isturitz, France. J. Archaeol. Sci. 2011, 38, 3234–3243. [Google Scholar] [CrossRef]
  179. Quarta, G.; Butalag, K.; Calcagnile, L.; D’Elia, M.; Arthur, P.; Tinelli, M.; Caramia, A. IBA analyses and lead concentration measurements of AMS-14C dated bones from two medieval sites in Italy. Nucl. Instrum. Methods Phys. Res. Sect. B Beam Interact. Mater. At. 2008, 266, 2343–2347. [Google Scholar] [CrossRef]
  180. Kasztovszky, Z.; Biró, K.T.; Markó, A.; Dobosi, V. Cold neutron prompt gamma activation analysis—a non-destructive method for characterization of high silica content chipped stone tools and raw materials. Archaeometry 2008, 50, 12–29. [Google Scholar] [CrossRef]
  181. Chu, W. The Danube Corridor Hypothesis and the Carpathian Basin: Geological, Environmental and Archaeological Approaches to Characterizing Aurignacian Dynamics. J. World Prehistory 2018, 31, 117–178. [Google Scholar] [CrossRef] [Green Version]
  182. Watkinson, D.; Rimmer, M.; Kasztovszky, Z.; Kis, Z.; Maróti, B.; Szentmiklósi, L. The Use of Neutron Analysis Techniques for Detecting The Concentration And Distribution of Chloride Ions in Archaeological Iron. Archaeometry 2013, 56, 841–859. [Google Scholar] [CrossRef] [PubMed]
  183. Bernardini, F.; de Min, A.; Lenaz, D.; Kasztovszky, Z.; Turk, P.; Velušček, A.; Szilágyi, V.; Tuniz, C.; Kokelj, E.M. Mineralogical and Chemical Constraints on the Provenance of Copper Age Polished Stone Axes of ‘Ljubljana Type’ from Caput Adriae. Archaeometry 2012, 56, 175–202. [Google Scholar] [CrossRef]
  184. Kitawaki, H.; Abduriyim, A.; Okano, M. Identification of melee-size synthetic yellow diamonds in jewelry. Gems Gemol. 2008, 44, 202–213. [Google Scholar] [CrossRef]
  185. Lo Giudice, A.; Re, A.; Calusi, S.; Giuntini, L.; Massi, M.; Olivero, P.; Pratesi, G.; Albonico, M.; Conz, E. Multitechnique characterization of lapis lazuli for provenance study. Anal. Bioanal. Chem. 2009, 395, 2211–2217. [Google Scholar] [CrossRef] [Green Version]
  186. Wielgosz-Rondolino, D.; Antonelli, F.; Bojanowski, M.J.; Gładki, M.; Göncüoğlu, M.C.; Lazzarini, L. Improved methodology for identification of Göktepe white marble and the understanding of its use: A comparison with Carrara marble. J. Archaeol. Sci. 2020, 113, 105059. [Google Scholar] [CrossRef]
  187. Kuchařová, A.; Götze, J.; Šachlová, Š.; Pertold, Z.; Přikryl, R. Microscopy and Cathodoluminescence Spectroscopy Characterization of Quartz Exhibiting Different Alkali–Silica Reaction Potential. Microsc. Microanal. 2016, 22, 189–198. [Google Scholar] [CrossRef]
  188. Chapoulie, R.; Bassel, L.; Mauran, G.; Ferrier, C.; Queffelec, A.; Lacanette, D.; Malaurent, P.; Bousquet, B.; Motto-Ros, V.; Trichard, F.; et al. Photons and electrons for the study of a white veil covering some walls in prehistoric caves. Acta IMEKO 2017, 6, 82–86. [Google Scholar] [CrossRef] [Green Version]
  189. Gambino, F.; Borghi, A.; d’Atri, A.; Martire, L.; Cavallo, M.; Appolonia, L.; Croveri, P. Minero-petrographic characterization of Chianocco marble employed for Palazzo Madama façade in Turin (Northwest Italy). Sustainability 2019, 11, 4229. [Google Scholar] [CrossRef] [Green Version]
  190. Garnier, V.; Ohnenstetter, D.; Giuliani, G.; Blanc, P.; Schwarz, D. Trace-element contents and cathodoluminescence of “trapiche” rubies from Mong Hsu, Myanmar (Burma): Geological significance. Mineral. Petrol. 2002, 76, 179–193. [Google Scholar] [CrossRef]
  191. Corazza, M.; Pratesi, G.; Cipriani, C.; Giudice, A.L.; Rossi, P.; Vittone, E.; Manfredotti, C.; Pecchioni, E.; del Fà, C.M.; Fratini, F. Ionoluminescence and cathodoluminescence in marbles of historic and architectural interest. Archaeometry 2001, 43, 439–446. [Google Scholar] [CrossRef]
  192. Nikbakht, T.; Kakuee, O.; Lamehi-Rachti, M. Ionoluminescence spectroscopy and microscopy of lapis lazuli. J. Lumin. 2017, 181, 246–251. [Google Scholar] [CrossRef]
  193. Pichon, L.; Calligaro, T.; Gonzalez, V.; Lemasson, Q.; Moignard, B.; Pacheco, C. Implementation of ionoluminescence in the AGLAE scanning external microprobe. Nucl. Instrum. Methods Phys. Res. B. 2015, 348, 68–72. [Google Scholar] [CrossRef]
  194. Quaranta, A.; Salomon, J.; Dran, J.C.; Tonezzer, M.; della Mea, G. Ion beam induced luminescence analysis of painting pigments. Nucl. Instrum. Methods Phys. Res. Sect. B Beam Interact. Mater. At. 2007, 254, 289–294. [Google Scholar] [CrossRef]
  195. Enguita, O.; Calderón, T.; Fernández-Jiménez, M.T.; Beneitez, P.; Millan, A.; García, G. Damage induced by proton irradiation in carbonate based natural painting pigments. Nucl. Instrum. Methods Phys. Res. Sect. B Beam Interact. Mater. At. 2004, 219–220, 53–56. [Google Scholar] [CrossRef]
  196. Calderón, T. Ionoluminescence and minerals: The state of the art. Rev. Mex. Física 2008, 54, 21–28. [Google Scholar]
  197. Zucchiatti, A.; Jiménez-Rey, D.; Climent-Font, A.; Martina, S.; Faieta, R.; Maggi, M.; Giuntini, L.; Calusi, S. PIXE and IL analysis of an archeologically problematic XIII century ceramic production. Nucl. Instrum. Methods Phys. Res. Sect. B Beam Interact. Mater. At. 2015, 363, 144–149. [Google Scholar] [CrossRef]
  198. Calligaro, T.; Coquinot, Y.; Pichon, L.; Pierrat-Bonnefois, G.; de Campos, P.; Re, A.; Angelici, D. Characterization of the lapis lazuli from the Egyptian treasure of Tôd and its alteration using external μ-PIXE and μ-IBIL. Nucl. Instrum. Methods Phys. Res. Sect. B Beam Interact. Mater. At. 2014, 318, 139–144. [Google Scholar] [CrossRef]
  199. Hanni, H.A.; Kiefert, L.; Giese, P. X-ray luminescence, a valuable test in pearl identification. J. Gemmol. 2005, 29, 325–329. [Google Scholar] [CrossRef]
  200. Re, A.; Zangirolami, M.; Angelici, D.; Borghi, A.; Costa, E.; Giustetto, R.; Gallo, L.M.; Castelli, L.; Mazzinghi, A.; Ruberto, C.; et al. Towards a portable X-ray luminescence instrument for applications in the Cultural Heritage field. Eur. Phys. J. Plus 2018, 133, 362. [Google Scholar] [CrossRef]
  201. Saleh, M.; Bonizzoni, L.; Orsilli, J.; Samela, S.; Gargano, M.; Gallo, S.; Galli, A. Application of statistical analyses for lapis lazuli stone provenance determination by XRL and XRF. Microchem. J. 2020, 154, 104655. [Google Scholar] [CrossRef]
  202. Lo Giudice, A.; Re, A.; Angelici, D.; Calusi, S.; Gelli, N.; Giuntini, L.; Massi, M.; Pratesi, G. In-air broad beam ionoluminescence microscopy as a tool for rocks and stone artworks characterisation. Anal. Bioanal. Chem. 2012, 404, 277–281. [Google Scholar] [CrossRef]
  203. Calusi, S.; Colombo, E.; Giuntini, L.; Giudice, A.L.; Manfredotti, C.; Massi, M.; Pratesi, G.; Vittone, E. The ionoluminescence apparatus at the LABEC external microbeam facility. Nucl. Instrum. Methods Phys. Res. Sect. B Beam Interact. Mater. At. 2008, 266, 2306–2310. [Google Scholar] [CrossRef]
  204. Colombo, E.; Calusi, S.; Cossio, R.; Giuntini, L.; Giudice, A.L.; Mandò, P.A.; Manfredotti, C.; Massi, M.; Mirto, F.A.; Vittone, E. Recent developments of ion beam induced luminescence at the external scanning microbeam facility of the LABEC laboratory in Florence. Nucl. Instrum. Methods Phys. Res. Sect. B Beam Interact. Mater. At. 2008, 266, 1527–1532. [Google Scholar] [CrossRef]
  205. Re, A.; Angelici, D.; Lo Giudice, A.; Corsi, J.; Allegretti, S.; Biondi, A.F.; Gariani, G.; Calusi, S.; Gelli, N.; Giuntini, L.; et al. Ion Beam Analysis for the provenance attribution of lapis lazuli used in glyptic art: The case of the “collezione Medicea. Nucl. Instrum. Methods Phys. Res. Sect. B Beam Interact. Mater. At. 2015, 348, 278–284. [Google Scholar] [CrossRef]
  206. Guidorzi, L.; Re, A.; Picollo, F.; Aprà, P.; Fantino, F.; Martire, L.; Artioli, G.; Peruzzo, L.; Boesso, S.; Rigato, V.; et al. Multi-technique study of He+ micro-irradiation effects on natural quartz crystals contained in archaeological pottery. Nucl. Instrum. Methods Phys. Res. B. 2020, 479, 143–149. [Google Scholar] [CrossRef]
  207. Czelusniak, C.; Palla, L.; Massi, M.; Carraresi, L.; Giuntini, L.; Re, A.; Giudice, A.L.; Pratesi, G.; Mazzinghi, A.; Ruberto, C.; et al. Preliminary results on time-resolved ion beam induced luminescence applied to the provenance study of lapis lazuli. Nucl. Instrum. Methods Phys. Res. Sect. B Beam Interact. Mater. At. 2016, 371, 336–339. [Google Scholar] [CrossRef]
  208. Taccetti, N.; Giuntini, L.; Casini, G.; Stefanini, A.A.; Chiari, M.; Fedi, M.E.; Mandò, P.A. The pulsed beam facility at the 3 MV Van de Graaff accelerator in Florence: Overview and examples of applications. Nucl. Instrum. Methods Phys. Res. Sect. B Beam Interact. Mater. At. 2002, 188, 255–260. [Google Scholar] [CrossRef]
  209. Oleari, C. Standard Colorimetry. Definitions, Algorithms, and Software; Wiley: Hoboken, NJ, USA, 2016. [Google Scholar]
  210. Commission Internationale de l’Eclairage. CIE Publication 15.3:2004, Colorimetry, 3rd ed.; Commission Internationale de l’Eclairage: Vienna, Austria, 2004. [Google Scholar]
  211. McCamy, C.S. Concepts, terminology, and notation for optical modulation. Photogr. Sci. Eng. 1966, 10, 314–325. [Google Scholar] [CrossRef]
  212. Judd, D.B. Terms, definitions, and symbols in reflectometry. J. Opt. Soc. Am. 1967, 57, 445–452. [Google Scholar] [CrossRef] [PubMed]
  213. Commission Internationale de l’Eclairage. CIE Publication No. 44, Absolute Methods for Reflection Measurements; Commission Internationale de l’Eclairage: Vienna, Austria, 2006. [Google Scholar]
  214. Commission Internationale de l’Eclairage. ILV CIE S 017/E:2011, ILV: International Lighting Vocabulary; Commission Internationale de l’Eclairage: Vienna, Austria, 2011. [Google Scholar]
  215. Donati, S. Photodetectors: Devices, Circuits and Applications. Meas. Sci. Technol. 2001, 12, 653. [Google Scholar] [CrossRef] [Green Version]
  216. Wyszecki, G.; Stiles, W.S. Color Science: Concepts and Methods, Quantitative Data and Formulae, 2nd ed.; Wiley-Interscience: Hoboken, NJ, USA, 2000. [Google Scholar]
  217. Ryer, A. Light Measurement Handbook; International Light Technologies: Peabody, MA, USA, 1998. [Google Scholar]
  218. Dectris. Available online: www.konikaminolta.it (accessed on 4 February 2021).
  219. Ikemoto, Y.; Tanaka, M.; Higuchi, T.; Semba, T.; Moriwaki, T.; Kawasaki, E.; Okuyama, M. Infrared synchrotron radiation and its application to the analysis of cultural heritage. Condens. Matter 2020, 5, 28. [Google Scholar] [CrossRef]
  220. Pronti, L.; Romani, M.; Viviani, G.; Stani, C.; Gioia, P.; and Cestelli Guidi, M. Advanced methods for the analysis of Roman wall paintings: Elemental and molecular detection by means of synchrotron FT-IR and SEM micro-imaging spectroscopy. Rend. Lincei 2020, 31, 485–493. [Google Scholar] [CrossRef]
  221. Henderson, E.J.; Helwig, K.; Read, S.; Rosendahl, S.M. Infrared chemical mapping of degradation products in cross-sections from paintings and painted objects. Herit. Sci. 2019, 7, 71. [Google Scholar] [CrossRef]
  222. Sotiropoulou, S.; Papliaka, Z.E.; Vaccari, L. Micro FTIR imaging for the investigation of deteriorated organic binders in wall painting stratigraphies of different techniques and periods. Microchem. J. 2016, 124, 559–567. [Google Scholar] [CrossRef]
  223. Unger, M.; Mattson, E.; Schmidt Patterson, C.; Alavi, Z.; Carson, D.; Hirschmugl, C.J. Synchrotron-based multiple-beam FTIR chemical imaging of a multi-layered polymer in transmission and reflection: Towards cultural heritage applications. Appl. Phys. A Mater. Sci. Process. 2013, 111, 135–145. [Google Scholar] [CrossRef]
  224. Guidi, M.C.; Piccinini, M.; Marcelli, A.; Nucara, A.; Calvani, P.; Burattini, E. Optical performances of SINBAD, the Synchrotron INfrared Beamline at DAΦNE. J. Opt. Soc. Am. A 2005, 22, 2810–2817. [Google Scholar] [CrossRef]
  225. Thickett, D.; Pretzel, B. FTIR surface analysis for conservation. Herit. Sci. 2020, 8, 5. [Google Scholar] [CrossRef]
  226. Bitossi, G.; Giorgi, R.; Mauro, M.; Salvadori, B.; Dei, L. Spectroscopic techniques in cultural heritage conservation: A survey. Appl. Spectrosc. Rev. 2005, 40, 187–228. [Google Scholar] [CrossRef]
  227. Kempfert, K.D.; Jiang, E.Y.; Oas, S.; Coffin, J. Detectors for Fourier Transform Spectroscopy; AN-00125; Thermo Nicolet Corporation: Waltham, MA, USA, 2001; Available online: mmrc.caltech.edu/FTIR/Nicolet/DetectorsforFTIR1204.pdf (accessed on 1 April 2021).
  228. Rosi, F.; Cartechini, L.; Sali, D.; Miliani, C. Recent trends in the application of fourier transform infrared (FT-IR) spectroscopy in Heritage Science: From micro: From non-invasive FT-IR. Phys. Sci. Rev. 2019, 4, 1–19. [Google Scholar] [CrossRef]
  229. Rogalski, A. Infrared detectors: An overview. Infrared Phys. Technol. 2002, 43, 187–210. [Google Scholar] [CrossRef] [Green Version]
  230. Characteristic and Use of Infrared Detectors, Hamamatsu. Available online: https://www.hamamatsu.com/resources/pdf/ssd/infrared_kird9001e.pdf (accessed on 1 April 2021).
  231. Kendix, E.L.; Prati, S.; Mazzeo, R. Far infrared spectroscopy in the field of cultural heritage. e-Preservation Science 2010, 7, 8–13. [Google Scholar]
  232. Fukunaga, K.; Hosako, I.; Picollo, M. Terahertz spectroscopy and imaging for material analysis in conservation science. In Proceedings of the 2010 IEEE International Conference on Solid Dielectrics, ICSD, Potsdam, Germany, 4–9 July 2010. [Google Scholar] [CrossRef]
  233. Vahur, S.; Teearu, A.; Peets, P.; Joosu, L.; Leito, I. ATR-FT-IR spectral collection of conservation materials in the extended region of 4000-80 cm−1. Anal. Bioanal. Chem. 2016, 408, 3373–3379. [Google Scholar] [CrossRef]
  234. For Bruker FT-IR and FT-NIR Spectrometers Detectors; Product Note M25-01/04; Bruker: Billerica, MA, USA; Available online: https://www.cigs.unimore.it/CigsDownloads/labs/FTIR2/manuali_letture/detectors.pdf (accessed on 1 April 2021).
  235. Subramanian, A.; Rodriguez-Saona, L. Fourier Transform Infrared (FTIR) Spectroscopy. In Infrared Spectroscopy for Food Quality Analysis and Control; Elsevier Inc.: Amsterdam, The Netherlands, 2009; pp. 145–178. [Google Scholar] [CrossRef]
  236. Prati, S.; Sciutto, G.; Bonacini, I.; Mazzeo, R. New Frontiers in Application of FTIR Microscopy for Characterization of Cultural Heritage Materials. Top. Curr. Chem. 2016, 374, 26. [Google Scholar] [CrossRef] [PubMed]
  237. Badillo-Sanchez, D.; Chelazzi, D.; Giorgi, R.; Cincinelli, A.; Baglioni, P. Understanding the structural degradation of South American historical silk: A Focal Plane Array (FPA) FTIR and multivariate analysis. Sci. Rep. 2019, 9, 17239. [Google Scholar] [CrossRef] [PubMed] [Green Version]
  238. Hans, P.; Peter, S. Neutron Methods for Archaeology and Cultural Heritage; Kardjilov, N., Festa, G., Eds.; Springer International Publishing: Berlin/Heidelberg, Germany, 2017; Available online: https://0-www-springer-com.brum.beds.ac.uk/gp/book/9783319331614 (accessed on 1 April 2021). [CrossRef]
  239. Bish, D.L.; Howard, S.A. Quantitative phase analysis using the Rietveld method. J. Appl. Cryst. 1988, 21, 86–91. [Google Scholar] [CrossRef]
  240. Grazzi, F.; Bartoli, L.; and Siano, S. Characterization of copper alloys of archaeometallurgical interest using neutron diffraction: A systematic calibration study. Anal. Bioanal. Chem. 2010, 397, 2501–2511. [Google Scholar] [CrossRef] [PubMed]
  241. Grazzi, F.; Civita, F.; Williams, A.; Scherillo, A.; Barzagli, E.; Bartoli, L.; Edge, D.; Zoppi, M. Ancient and historic steel in Japan, India and Europe, a non-invasive comparative study using thermal neutron diffraction. Anal. Bioanal. Chem. 2011, 400, 1493–1500. [Google Scholar] [CrossRef] [PubMed]
  242. Corsi, J.; Grazzi, F.; Giudice, A.L.; Re, A.; Scherillo, A.; Angelici, D.; Allegretti, S.; Barello, F. Compositional and microstructural characterization of Celtic silver coins from northern Italy using neutron diffraction analysis. Microchem. J. 2016, 126, 501–508. [Google Scholar] [CrossRef]
  243. Barzagli, E.; Grazzi, F.; Civita, F.; Scherillo, A.; Pietropaolo, A.; Festa, G.; Zoppi, M. Non-invasive characterisation of SIX Japanese hand-guards (tsuba). Appl. Phys. A 2013, 113, 1143–1150. [Google Scholar] [CrossRef]
  244. Schillinger, B. Why use neutrons? Restaur. Archäol. 2015, 8, 1–7. [Google Scholar]
  245. Uno, S.; Uchida, T.; Sekimoto, M.; Murakami, T.; Miyama, K.; Shoji, M.; Nakano, E.; Koike, T.; Morita, K.; Satoh, H.; et al. Two-dimensional Neutron Detector with GEM and its Applications. Phys. Procedia 2012, 26, 142–152. [Google Scholar] [CrossRef] [Green Version]
  246. Jiang, X.; Xiu, Q.; Zhou, J.; Yang, J.; Tan, J.; Yang, W.; Zhang, L.; Xia, Y.; Zhou, X.; Zhou, J.; et al. Study on the neutron imaging detector with high spatial resolution at China spallation neutron source. Nucl. Eng. Technol. 2020. [Google Scholar] [CrossRef]
  247. Thomson, J.J. Bakerian Lecture:—Rays of positive electricity. Proc. R. Soc. Lond. 1913, 89, 1–20. [Google Scholar] [CrossRef] [Green Version]
  248. Trincherini, P.R.; Barbero, P.; Quarati, P.; Domergue, C.; Long, L. Where do the lead ingots of the Saintes-Maries-de la -Mer wreck come from? Archaeology compared with physics. Archaeometry 2001, 43, 393–406. [Google Scholar] [CrossRef]
  249. Trincherini, P.R.; Domergue, C.; Manteca, I.; Nesta, A.; Quarati, P. The identification of lead ingots from the Roman mines of Cartagena: The role of lead isotope analysis. J. Rom. Archaeol. 2009, 22, 123–145. [Google Scholar] [CrossRef]
  250. Sabbatini, L.; Van der Werf, I.D. Chemical Analysis in Cultural Heritage; De Gruyter GmbH: Berlin, Germany, 2020. [Google Scholar] [CrossRef]
  251. Fortunato, G.; Ritter, A.; Fabian, D. Old Masters’ lead white pigments: Investigations of paintings from the 16th to the 17th century using high precision lead isotope abundance ratios. Analyst 2005, 130, 898–906. [Google Scholar] [CrossRef]
  252. Clemenza, M.; Contini, A.; Baccolo, G.; di Vacri, M.L.; Ferrante, M.; Nisi, S.; Carpinelli, M.; Cremonesi, O.; Enzo, S.; Fiorini, E.; et al. Development of a multi-analytical approach for the characterization of ancient Roman lead ingots. J. Radioanal. Nucl. Chem. 2017, 311, 1495–1501. [Google Scholar] [CrossRef]
  253. Gallo, F.; Silvestri, A.; Degryse, P.; Ganio, M.; Longinelli, A.; Molin, G. Roman and late-Roman glass from north-eastern Italy: The isotopic perspective to provenance its raw materials. J. Archaeol. Sci. 2015, 62, 55–65. [Google Scholar] [CrossRef] [Green Version]
  254. Becker, S.J. Inductively coupled plasma mass spectrometry (ICP-MS) and laser ablation ICP-MS for isotope analysis of long-lived radionuclides. Int. J. Mass Spectrom. 2005, 242, 183–195. [Google Scholar] [CrossRef]
  255. Houk, R.S.; Fassel, V.A.; Flesch, G.D.; Svec, H.J.; Gray, A.L.; Taylor, C.E. Inductively coupled argon plasma as an ion source for mass spectrometric determination of trace elements. Anal. Chem. 1980, 52, 2283–2289. [Google Scholar] [CrossRef] [Green Version]
  256. Wilschefski, S.C.; Baxter, M.R. Inductively Coupled Plasma Mass Spectrometry: Introduction to Analytical Aspects. Clin. Biochem. Rev. 2019, 40, 115–133. [Google Scholar] [CrossRef] [PubMed]
  257. Jakubowski, N.; Prohaska, T.; Rottmann, L.; Vanhaecke, F. Inductively coupled plasma- and glow discharge plasma-sector field mass spectrometry. J. Anal. Spectrom. 2011, 26, 693. [Google Scholar] [CrossRef] [Green Version]
  258. Johnson, E.G.; Nier, A.O. Angular aberrations in sector shaped electromagnetic lenses for focusing beams of charged particles. Phys. Rev. 1953, 91, 10–17. [Google Scholar] [CrossRef]
  259. Becker, S.J. Mass spectrometry of long-lived radionuclides. Spectrochim. Acta Part B 2003, 58, 1757–1784. [Google Scholar] [CrossRef]
  260. Becker, J.S. Inorganic Mass Spectrometry of Radionuclides. In Handbook of Radioactivity Analysis; Elsevier: Amsterdam, The Netherlands, 2012; pp. 833–870. [Google Scholar] [CrossRef]
  261. Balcaen, L.; Moens, L.; Vanhaecke, F. Determination of isotope ratios of metals (and metalloids) by means of inductively coupled plasma-mass spectrometry for provenancing purposes—A review. Spectrochim. Acta Part B 2010, 65, 769–786. [Google Scholar] [CrossRef]
  262. Nord, A.G.; Billström, K. Isotopes in cultural heritage: Present and future possibilities. Herit. Sci 2018, 6, 25. [Google Scholar] [CrossRef] [Green Version]
  263. Gomes, S.S.; Araújo, M.F.; Monge Soares, A.M.; Pimenta, J.; Mendes, H. Lead provenance of Late Roman Republican artifacts from Monte dos Castelinhos archaeological site (Portugal): Insights from elemental and isotopic characterization by Q-ICPMS. Microchem. J. 2018, 141, 337–343. [Google Scholar] [CrossRef]
  264. Merkel, S.W. Archaeometallurgical investigations of a Viking brass ingot hoard from the Hedeby Harbor in northern Germany. J. Archeol. Sci. Rep. 2018, 20, 293–302. [Google Scholar] [CrossRef]
  265. Gulson, B.; Kamenov, G.D.; Manton, W.; Rabinowitz, M. Concerns about Quadrupole ICP-MS Lead Isotopic Data and Interpretations in the Environment and Health Fields. Int. J. Environ. Res. Public Health 2018, 15, 723. [Google Scholar] [CrossRef] [PubMed] [Green Version]
  266. Walczyk, T. TIMS versus multicollector-ICP-MS: Coexistence or struggle for survival? Anal. Bioanal. Chem. 2004, 378, 229–231. [Google Scholar] [CrossRef] [PubMed] [Green Version]
  267. Carlson, R.W. Thermal Ionization Mass Spectrometry. Reference Module in Earth Systems and Environmental Sciences, Treatise on Geochemistry, 2nd ed.; 2013; Volume 15, pp. 337–354. [Google Scholar] [CrossRef]
  268. Macarona, C.; Nys, K.; Claeys, P. Sr isotope analysis for the provenance study of ancient ceramics: An integrated approach. In Proceedings of the 39th International Symposium for Archaeometry, Leuven, Belgium, 28 May–1 June 2012. [Google Scholar]
  269. Ma, H.; Henderson, J.; Evans, J. The exploration of Sr isotopic analysis applied to Chinese glazes: Part one. J. Archaeol. Sci. 2014, 50, 551–558. [Google Scholar] [CrossRef] [Green Version]
  270. Mook, W.G. Introduction to Isotope Hydrology: Stable and Radioactive Isotopes of Hydrogen, Oxygen and Carbon; Taylor & Francis Group: London, UK, 2005; p. 226. [Google Scholar]
  271. DeNiro, M.J.; Epstein, S. Influence of diet on the distribution of carbon isotopes in animals. Geochim. Cosmochim. Acta 1981, 45, 341–351. [Google Scholar] [CrossRef]
  272. William, F.K.; DeNiro, M.J. Stable carbon- and nitrogen-isotope ratios of bone collagen used to study coral-reef and terrestrial components of prehistoric Bahamian diet. Am. Antiq. 1988, 320–336. [Google Scholar] [CrossRef]
  273. Garcia Collado, M.I.; Ricci, P.; Catalan Ramos, R.; Altieri, S.; Lubritto, C.; Qiròs Castillo, J.A. Palaeodietary reconstruction as an alternative approach to poorly-preserved early medieval human bone assemblages: The case of Boadilla (Toledo, Spain). Archaeol. Anthropol. Sci. 2019, 11, 3765–3782. [Google Scholar] [CrossRef]
  274. Lubritto, C.; Garcia-Collado, M.I.; Ricci, P.; Altieri, S.; Sirignano, C.; Qiròs Castillo, J.A. New Dietary Evidence on Medieval Rural Communities of the Basque Country (Spain) and Its Surroundings from Carbon and Nitrogen Stable Isotope Analyses: Social Insights, Diachronic Changes and Geographic Comparison. Int. J. Osteoarchaeol. 2017, 27, 984–1002. [Google Scholar] [CrossRef]
  275. Evershed, R.P. Organic residue analysis in archaeology: The archaeological biomarker revolution. Archaeometry 2008, 50, 895–924. [Google Scholar] [CrossRef]
  276. Buonincontri, M.P.; Pecci, A.; Di Pasquale, G.; Ricci, P.; Lubritto, C. Multiproxy approach to the study of Medieval food habits in Tuscany (central Italy). Archaeol. Anthropol. Sci. 2017, 9, 653–671. [Google Scholar] [CrossRef]
  277. Lubritto, C.; Ricci, P.; Germinario, C.; Izzo, F.; Mercurio, M.; Langella, A.; Cuenca, V.S.; Torres, I.M.; Fedi, M.; Grifa, C. Radiocarbon dating of mortars: Contamination effects and sample characterisation. The case-study of Andalusian medieval castles (Jaén, Spain). Meas. J. Int. Meas. Confed. 2018, 118, 362–371. [Google Scholar] [CrossRef]
  278. Pellegrini, M.; Lee-Thorp, J.A.; Donahue, R.E. Exploring the variation of the δ18Op and δ18Oc relationship in enamel increments. Palaeogeogr. Palaeoclimatol. Palaeoecol. 2011, 310, 71–83. [Google Scholar] [CrossRef]
  279. Ricci, P.; Mongelli, V.; Vitiello, A.; Campana, S.; Sirignano, C.; Rubino, M.; Fornaciari, G.; Lubritto, C. The privileged burial of the Pava Pieve (Siena, 8th Century AD). Rapid Commun. Mass Spectrom. 2012, 26, 2393–2398. [Google Scholar] [CrossRef] [PubMed]
  280. Ricci, P.; Sirignano, C.; Altieri, S.; Pistillo, M.; Santoriello, A.; Lubritto, C. Paestum dietary habits during the Imperial period: Archaeologycal records and stable isotope measurement. Acta IMEKO 2016, 5, 26–32. [Google Scholar] [CrossRef] [Green Version]
  281. Sanyova, J.; Cersoy, S.; Richardin, P.; Laprévote, O.; Walter, P.; Brunelle, A. Unexpected Materials in a Rembrandt Painting Characterized by High Spatial Resolution Cluster-TOF-SIMS Imaging. Anal. Chem. 2011, 83, 753–760. [Google Scholar] [CrossRef]
  282. Richardin, P.; Mazel, V.; Walter, P.; Laprévote, O.; Brunelle, A. Identification of Different Copper Green Pigments in Renaissance Paintings by Cluster-TOF-SIMS Imaging Analysis. J. Am. Soc. Mass Spectrom. 2011, 22, 1729–1736. [Google Scholar] [CrossRef] [Green Version]
  283. Sodhi, R.N.S.; Brodersen, P.M.; Zaccagnino, C. XPS and TOF-SIMS applied to the study of ancient artifacts: Further studies on Alexandrian tetradrachms from the time of the Julio-Claudian dynasty. Surf. Interface Anal. 2020, 52, 1004–1010. [Google Scholar] [CrossRef]
  284. Tortora, L.; de Notaristefani, F.; Ioele, M. ToF-SIMS investigation of gilt and painted leather: Identification of indigo, oil binder and gold varnish. Surf. Interface Anal. 2014, 46, 807–811. [Google Scholar] [CrossRef]
  285. Biocca, P.; Santopadre, P.; Sidoti, G.; Sotgiu, G.; de Notaristefani, F.; Tortora, L. ToF-SIMS study of gilding technique in the fresco Vela della Castità by Giotto’s school. Surf. Interface Anal. 2016, 48, 404–408. [Google Scholar] [CrossRef]
  286. Ingo, G.M.; Riccucci, C.; Pascucci, M.; Messina, E.; Giuliani, C.; Biocca, P.; Tortora, L.; Fierro, G.; Di Carlo, G. Combined use of FE-SEM+EDS, ToF-SIMS, XPS, XRD and OM for the study of ancient, gilded artifacts. Appl. Surf. Sci. 2018, 446, 168–176. [Google Scholar] [CrossRef]
  287. Tortora, L.; Biocca, P.; Sotgiu, G.; de Notaristefani, F.; Urbini, M.; Ioele, M. Oleanolic and ursolic acid in dammar and mastic resin: Isomer discrimination by using ToF-SIMS and multivariate statistics. Surf. Interface Anal. 2016, 48, 398–403. [Google Scholar] [CrossRef]
  288. Graziani, V.; Iorio, M.; Albini, M.; Riccucci, C.; Di Carlo, G.; Branchini, P. Metals and environment: Chemical outputs from the interaction between gilded copper-based objects and burial soil. Front. Mater. 2020, 7, 32. [Google Scholar] [CrossRef] [Green Version]
  289. Sodo, A.; Tortora, L.; Biocca, P.; Municchia, A.C.; Fiorin, E.; Ricci, M.A. Raman and time of flight secondary ion mass spectrometry investigation answers specific conservation questions on Bosch painting Saint Wilgefortis Triptych. J. Raman Spectrosc. 2020, 50, 150–160. [Google Scholar] [CrossRef]
  290. Iorio, M.; Sodo, A.; Graziani, V.; Branchini, P.; Municchia, A.C.; Ricci, M.A.; Salvadori, O.; Fiorin, E.; Tortora, L. Mapping at the Nanometer Scale the Effects of Sea-Salt Derived Chlorine on Cinnabar and Lead White by using ToF-SIMS imaging. Analyst 2021. [Google Scholar] [CrossRef]
  291. Longo, L.; Altieri, S.; Birarda, G.; Cagnato, C.; Graziani, V.; Obada, T.; Pantyukhina, I.; Ricci, P.; Skakun, N.; Sorrentino, G.; et al. A multidimensional approach to investigate use-related biogenic residues on Paleolithic ground stone tools. Environ. Archaeol. 2021, in press. [Google Scholar]
  292. Tortora, L.; Di Carlo, G.; Mosquera, M.J.; Ingo, G.M. Editorial: Nanoscience and Nanomaterials for the Knowledge and Conservation of Cultural Heritage. Front. Mater. 2020, 7, 606076. [Google Scholar] [CrossRef]
  293. Purser, K.H.; Liebert, R.B.; Litherland, A.E.; Beukens, R.P.; Gove, H.E.; Bennett, C.L.; Clover, M.R. An attempt to detect stable N- ions from a sputter ion source and some implications of the results for the design of tandems for ultra-sensitive carbon analysis. Rev. Phys. Appl. 1977, 12, 1487–1492. [Google Scholar] [CrossRef] [Green Version]
  294. Bennett, C.L.; Beukens, R.P.; Clover, M.R.; Gove, H.E.; Liebert, R.B.; Litherland, A.E.; Purser, K.H.; Sondheim, W.E. Radiocarbon dating using electrostatic accelerators: Negative ions provide the key. Science 1977, 198, 508–510. [Google Scholar] [CrossRef] [PubMed]
  295. Fedi, M.E.; Cartocci, A.; Manetti, M.; Taccetti, F.; Mandò, P.A. The 14C AMS facility at LABEC, Florence. NIM B 2007, 259, 18–22. [Google Scholar] [CrossRef]
  296. Lachner, J.; Christl, M.; Müller, A.M.; Suter, M.; Synal, H.-A. 10Be and 26Al low-energy AMS using He-stripping and background suppression via an absorber. NIM B 2014, 331, 209–214. [Google Scholar] [CrossRef]
  297. Müller, A.M.; Döbeli, M.; Suter, M.; Synal, H.-A. Performance of the ETH gas ionization chamber at low energy. NIM B 2012, 287, 94–102. [Google Scholar] [CrossRef]
  298. Steier, P.; Golser, R.; Liechtenstein, V.; Kutschera, W.; Priller, A.; Vockenhuber, C.; Wallner, A. Opportunities and limits of AMS with 3 MV tandem accelerators. NIM B 2005, 240, 445–451. [Google Scholar] [CrossRef]
  299. Palla, L.; Castelli, L.; Czelusniak, C.; Fedi, M.E.; Giuntini, L.; Liccioli, L.; Mandò, P.A.; Martini, M.; Mazzinghi, A.; Ruberto, C.; et al. Preliminary measurements on the new TOF system installed at the AMS beamline of INFN-LABEC. NIM B 2015, 361, 222–228. [Google Scholar] [CrossRef]
  300. Taccetti, F.; Carraresi, L.; Fedi, M.; Manetti, M.; Mariani, P.; Tobia, G.; Mandò, A. Beam Profile Monitor for Rare Isotopes in Accelerator Mass Spectrometry: Preliminary Measurements. Radiocarbon 2010, 52, 272–277. [Google Scholar] [CrossRef] [Green Version]
  301. Barile, F.; Barone, S.; Fedi, M.E.; Liccioli, L.; Paticchio, V.; Perrino, R.; Schiavulli, L.; Taccetti, F. A C-14 beam monitor using silicon solid state sensor for cultural heritage. Nucl. Instr. Meth. A 2019, 936, 22–24. [Google Scholar] [CrossRef]
  302. Calabrisotto, C.; Amadio, M.; Fedi, M.; Liccioli, L.; Bombardieri, L. Strategies for Sampling Difficult Archaeological Contexts and Improving the Quality of Radiocarbon Data: The Case of Erimi Laonin Tou Porakou, Cyprus. Radiocarbon 2017, 59, 1919–1930. [Google Scholar] [CrossRef]
  303. Fabiani, G.; Fedi, M.; Giuliani, M.R.; Signorini, G.; Togni, M. The discovery of marouflage on decorated structural timber in a villa of the XV century. Int. J. Conserv. Sci. 2019, 10, 59–66. [Google Scholar]
  304. Petrucci, F.; Caforio, L.; Fedi, M.; Schwartzbaum, P.; Taccetti, F. Radiocarbon dating of twentieth century works of art. Appl. Phys. A Mater. Sci. Process. 2016, 122, 983. [Google Scholar] [CrossRef]
  305. Roner, M.; Ghinassi, M.; Fedi, M.; Brivio, L.; D’Alpaos, A. Latest Holocene depositional history of the southern Venice Lagoon, Italy. Holocene 2017, 27, 1731–1744. [Google Scholar] [CrossRef]
  306. D’Orefice, M.; Graciotti, R.; Bertini, A.; Ricci, M.; Toti, F. Latest Pleistocene to Holocene environmental changes in the northern Tyrrhenian area (central Mediterranean). A case study from southern Elba island. Alp. Mediterr. Quat. 2019, 33, 5–30. [Google Scholar] [CrossRef]
Figure 1. Schematic representation of the three-SDD MA-XRF scanner of INFN-CHNet (left). Picture of the measuring head taken during the acquisition of elemental maps on the Raffaello’s Fornarina, 80 × 60 cm2 panel at Palazzo Barberini, Galleria Nazionale Arte Antica, Rome (right). Two of the three detectors are visible, as well as the two laser beams (which allow for the correct aiming of the point of interest).
Applsci 11 03462 g001
Figure 2. XAS near edge region spectrum of a lazurite sample with its typical pre-edge peak over 2470 eV, measured in the transmission mode.
Applsci 11 03462 g002
Figure 3. The ARDESIA four-channel SDD detector installed on the experimental chamber of a synchrotron radiation beamline. Its finger-like structure, visible in the red circle, makes its use in vacuum-tight chambers easy.
Applsci 11 03462 g003
Figure 4. XRF measurement of a graphite sheet with an excitation energy of 2100 eV performed at the DXR1 beamline (CPS = counts/s).
Applsci 11 03462 g004
Figure 5. X-ray tomography facilities devoted to in situ CH investigations, developed by the X-ray tomography laboratory of Bologna. (a) picture of the setup designed for medium-size objects (up to 50 by 50 cm) during the analysis of ancient Japanese theatre masks in Rome; (b) photo of the facility for large-size objects, up to 150 by 150 cm, during the investigation of a Celestial Globe in Venice.
Applsci 11 03462 g005
Figure 6. Top left panel: Picture of the PCBs with 1 mm SiPM soldered on. Top right panel: Picture of one fiber holder with some 1 mm fibers inside. The two PCBs with SiPM are shown. Bottom left panel: Mechanics layout of the 1 mm beam hodoscope. Bottom right panel: Image of the mounted detector. Signal/power cables are fanned out through the feedthrough along the lateral side of the structure.
Applsci 11 03462 g006
Figure 7. Left panel: Distribution of breakdown voltage for the SiPM used in the 1 mm pitch hodoscope. Right panel: Breakdown voltage curve for a typical Advansid ASD RGB SiPM.
Applsci 11 03462 g007
Figure 8. Left panel: Incoming muon rate per second at RiKEN RAL as estimated with one beam hodoscope. Right panel: X–Y beam profile in a typical run.
Applsci 11 03462 g008
Figure 9. Experimental setup for MAXRS at RIKEN-RAL: 5 HpGe for low-, medium-, and high-energy X-ray detection and scintillating fibers hodoscope placed instead of the sample, for muon beam monitoring.
Applsci 11 03462 g009
Figure 10. X-ray spectra acquired at different energies of the muon beam in order to scan several depths inside the sample. The sample consisted of several layers of materials (Teflon, Al, Si, Cu, Zn, Ag, Ta, Au) with different thickness placed one after the other in sequence.
Applsci 11 03462 g010
Figure 11. Left-hand side: The PGNAA facility at LENA. Right-hand side: The design of the PGNAA facility used for Monte Carlo simulations.
Applsci 11 03462 g011
Figure 12. IL spectrum of a diopside crystal contained in lapis lazuli, acquired at the Legnaro National Laboratories of INFN with an Ocean Optics QEPro thermoelectrically cooled spectrometer.
Applsci 11 03462 g012
Figure 13. FT-IR principle of image formation using single-element detectors, 1-D (LA) or 2-D (FPA) systems. As an example, the image obtained on a cross section of a pictorial layer sample is shown.
Applsci 11 03462 g013
Figure 14. Typical neutron imaging system. The scintillator screen is perpendicular to the neutron beam. The emitted light is reflected, via a 45° tilted mirror, to a lens focusing the scintillator image on a CCD camera.
Applsci 11 03462 g014
Figure 15. Scheme of Element 2 high-resolution double-focusing ICP-MS (Thermo Fischer Scientific).
Applsci 11 03462 g015
Figure 16. Schematic layout of the ToF analyzer with reflectron ion mirror at the LASR3 Surface Laboratory Roma Tre.
Applsci 11 03462 g016
Table 1. Type of measurements, detectors, instruments and measured photometric and colorimetric quantities.
Type of MeasurementDetectorsInstrumentsPhotometric and Colorimetric Quantities Measured
Light characterization
(photometric techniques)
Silicon photocellIlluminometerIlluminance (lx)
Silicon photodiode arraySpectroradiometerLight intensity (cd)
Luminance (cd/m2)
Color specification
(colorimetric techniques)
RGB sensorsColorimeterColor coordinates
Silicon array photodiodeSpectrophotometerSRF (%)
Color coordinates
Table 2. Comparison of detectors of different areas basing on their D* values.
Detector TypeSpectral Range (cm−1)D* (cm Hz½ W−1)
DTGS10,000–370>2 × 10⁸
MCT Narrow-Band10,000–750>4 × 10¹⁰
MCT Mid-Band10,000–600>2.5 × 10¹⁰
MCT Wide-Band10,000–420>5 × 10⁹
MCT Photovoltaic4800–850>3 × 10¹⁰
Publisher’s Note: MDPI stays neutral with regard to jurisdictional claims in published maps and institutional affiliations.

