
A DMAIC Integrated Fuzzy FMEA Model: A Case Study in the Automotive Industry


Research and Development Unit in Mechanical and Industrial Engineering (UNIDEMI), Department of Mechanical and Industrial Engineering, NOVA School of Science and Technology, Universidade NOVA de Lisboa, 2829-516 Caparica, Portugal
*
Author to whom correspondence should be addressed.
Appl. Sci. 2021, 11(8), 3726; https://0-doi-org.brum.beds.ac.uk/10.3390/app11083726
Submission received: 25 March 2021
/
Revised: 15 April 2021
/
Accepted: 16 April 2021
/
Published: 20 April 2021
(This article belongs to the Section Applied Industrial Technologies)
Abstract
:The growing competitiveness in the automotive industry and the strict standards to which it is subject, require high quality standards. For this, quality tools such as the failure mode and effects analysis (FMEA) are applied to quantify the risk of potential failure modes. However, for qualitative defects with subjectivity and associated uncertainty, and the lack of specialized technicians, it revealed the inefficiency of the visual inspection process, as well as the limitations of the FMEA that is applied to it. The fuzzy set theory allows dealing with the uncertainty and subjectivity of linguistic terms and, together with the expert systems, allows modeling of the knowledge involved in tasks that require human expertise. In response to the limitations of FMEA, a fuzzy FMEA system was proposed. Integrated in the design, measure, analyze, improve and control (DMAIC) cycle, the proposed system allows the representation of expert knowledge and improves the analysis of subjective failures, hardly detected by visual inspection, compared to FMEA. The fuzzy FMEA system was tested in a real case study at an industrial manufacturing unit. The identified potential failure modes were analyzed and a fuzzy risk priority number (RPN) resulted, which was compared with the classic RPN. The main results revealed several differences between both. The main differences between fuzzy FMEA and classical FMEA come from the non-linear relationship between the variables and in the attribution of an RPN classification that assigns linguistic terms to the results, thus allowing a strengthening of the decision-making regarding the mitigation actions of the most “important” failure modes.
1. Introduction
In recent years, automotive manufacturing companies have faced an increasingly competitive environment. The increase in the number of competitors in the market forces companies to constantly improve their processes and forces them to adopt innovative strategies for expanding their product range and offer more and more personalized products [1]. Coupled with the increase in the level of demand from customers, quality is particularly relevant. The automotive industry is subject to a high level of requirements regarding prices, safety, respect for environmental standards, and, significantly, brand image. In this respect, quality constitutes an important lever for competitiveness, since it has a real impact on production costs and has a high contribution to better meeting customer expectations [2]. This is a factor of great impact on differentiation, proving to be increasingly valued. It is, therefore, necessary for operational tasks and decisions to take into account the expectations and needs of customers and, as well as trying to exceed them, to satisfy the requirements in their entirety [3].
In the automotive industry, which represents an environment where product errors and failures can be fatal, quality and reliability are paramount. It is essential to reduce these risks both at the product development level and at the operational level, only in this way will the good performance of the final product be guaranteed and problems that can lead to unnecessary non-compliance costs, as well as waste, are avoided [4].
Risk management is a fundamental part of the organizations’ strategy, in which they address the risks associated with the processes in order to achieve sustainable benefits within the activities they incorporate. The main objective of risk management is to add maximum sustainable value to all of its activities, by increasing the likelihood of their success and reducing the likelihood of failures and uncertainties in relation to the fulfillment or not of the objectives. One of the main tools used for this purpose, in risk management, is the FMEA [5].
FMEA is a methodology used to identify and analyze the potential failure modes of a product or process [6,7]. It is a risk management methodology widely used in situations in which the simple quantification of risk is insufficient and the identification of root causes as well as means of mitigation is essential. It is an essential preventive technique, which aims to align risks as much as possible with their source. It is an engineering methodology that performs a bottom-up analysis, that is, from the bottom upwards [8]. This allows the determination of the root cause of the risk and allows the selection of means to detect the occurrence of a specific failure and/or find options to avoid it, or to mitigate its effects. It can be used as a stand-alone tool or as part of a general quality management system [9].
The fuzzy set theory, proposed by Zadeh in 1965, provides a flexible and meaningful way to assess the risk associated with component failure modes. Classical FMEA requires a thorough knowledge of the subject under study. It is necessary to deal with associated ambiguous information, in a consistent and logical manner [10]. It is often difficult to accurately assess the indicators, probability of the event occurring (P), severity (S), and detection (D). In FMEA, these parameters require clear numerical assignments, causing many possible values to be ignored. On the other hand, conventional FMEA does not have enough flexibility to reflect the opinion of experts [11]. Human beings are better at evaluating processes using linguistic expressions than using clear numerical scores, hence the use of fuzzy logic, in which the RPN is calculated using linguistic terms. It provides mathematical tools to convert linguistic variables into numeric values. Thus, the assessment of criticality based on fuzzy logic allows assessment of the risk associated with failure modes in a natural and easy way [12,13,14].
This study aims to contribute to a deeper understanding of fuzzy logic as an asset in the modeling of fuzzy inference systems that seek to model risk management, concretely associated with the failure modes detected by visual inspection. In this study, the limitations of FMEA for the failures identified by visual inspection are addressed, resorting to the implementation of a fuzzy inference system (FIS) with the parameters collected from the FMEA analysis. With the use of this tool, it will be possible to create mathematical models that contemplate problems that present a great degree of uncertainty and that do not disregard aspects that are sometimes ignored in the application of traditional logic. For this purpose, it is intended to have the contribution of specialists in the area of quality, to assist in the interpretation of data, and in the definition of some parameters to estimate the risk associated with each failure mode. To structure the proposed approach, fuzzy FMEA will be integrated into the define, measure, analyze, improve, and control (DMAIC) cycle—specifically in the analyze phase. In view of the constant concern of the automotive industry for the continuous improvement of its processes, the integration of DMAIC contributes so that this approach does not neglect the Six Sigma philosophy, so valued for improving the reliability of products.
2. Fuzzy FMEA
Although the present work falls within the scope of visual inspections in the automotive industry, the use of fuzzy FMEA is present in the most varied sectors of activity. The fuzzy FMEA, an improvement over classical FMEA, is a general method that can be employed to fuzzify the risk indexed parameters S, O, and D with suitable membership functions. Several studies proposed the implementation of an FIS to improve the efficiency of FMEA and to overcome its limitations [12,13,14,15,16,17]. In most applications, the results achieved revealed the advantages of this methodology to deal with the risk associated with failure modes. In particular, they proved beneficial for the problems indicated in [10,18].
As a way to prioritize the problems associated with healthcare, in [18] was implemented a fuzzy FMEA inference system. He applied FMEA with linguistic variables and fuzzy inference rules, “IF-THEN”. Inputs S and O were defined according to five linguistic terms and exclusively trapezoidal membership functions. Input D and output RPN were defined by six linguistic terms and trapezoidal and triangular functions. Taking into account the vast modes of failure that can occur in health care institutions, their prioritization is of great importance. FMEA is efficient for this purpose, allowing identification of the causes and effects of potential failures. However, the implemented fuzzy FMEA analysis proved to be a more flexible alternative of assessment, providing the capture of the uncertainty associated with the variables.
In [19] addresses an extended FMEA approach by employing fuzzy best–worst method and multi-objective optimization by ratio analysis based on the Z-number theory (Z-MOORA) method. These methods in the proposed approach are utilized to surmount several traditional RPN shortcomings. This approach was applied in the automotive spare parts industry, and the results have shown a full prioritization of the failures when compared with other traditional methods. While in [10] applied the fuzzy FMEA inference system to the hydraulic system of a paper mill. Specifically, the system was applied to the supply structure due to the high levels of saturation and the increase in the number of maintenance interventions, as a result of constant breakdowns. The FIS was applied to prioritize the causes associated with malfunctions. Causes that previously were not of high importance, showed, through the fuzzy FMEA analysis, to be critical to the problem. Thus, thanks to the contribution of fuzzy logic, it was possible to improve the understanding of the dynamics of complex problems, characterized by inaccurate and subjective information.
Fuzzy FMEA has been applied to many distinct industries and for different applications. A risk-based fuzzy evidential approach is proposed in [20] by employing interval-valued Dempster–Shafer theory and fuzzy axiomatic design in order to assess the risk of failure modes with fuzzy belief structures. The efficiency of the proposed model was researched through an example and the results were compared with riskless evaluations. An FMEA risk management approach is proposed in [16] through fuzzy rule based interface system with the intention of mitigating the failures of a load, haul, dump machine (LHD). The risk assessment in a green supply chain using the fuzzy approach to FMEA was addressed in [21] and was applied in an Indian plastic industrial unit. In other areas of application in knowledge management failure factors were evaluated in [22] through an intuitionistic fuzzy environment as a case study in an Iranian oil and gas company. The results of this study have shown that the lack of leadership and management commitment was the most significant factor that affected the failure of knowledge management in the company. In [11] a fuzzy numerical method for FMEA was proposed that addresses the drawbacks of crisp FMEA and fuzzy rule based FMEA approaches. In this study, a distinct methodology was developed that integrates the concepts of similarity value measure of fuzzy numbers and possibility theory.
What all these studies have shown, is that causes that previously were not of extraordinary importance, by employing fuzzy FMEA analysis, were found to be critical. Thus, due to the contribution of fuzzy logic, it was possible to improve the understanding of the dynamics of complex problems, characterized by inaccurate and subjective information. That said, this approach has not only solved FMEA’s limitations to a problem but has also made it possible to accurately analyze risk.
3. Proposed Method
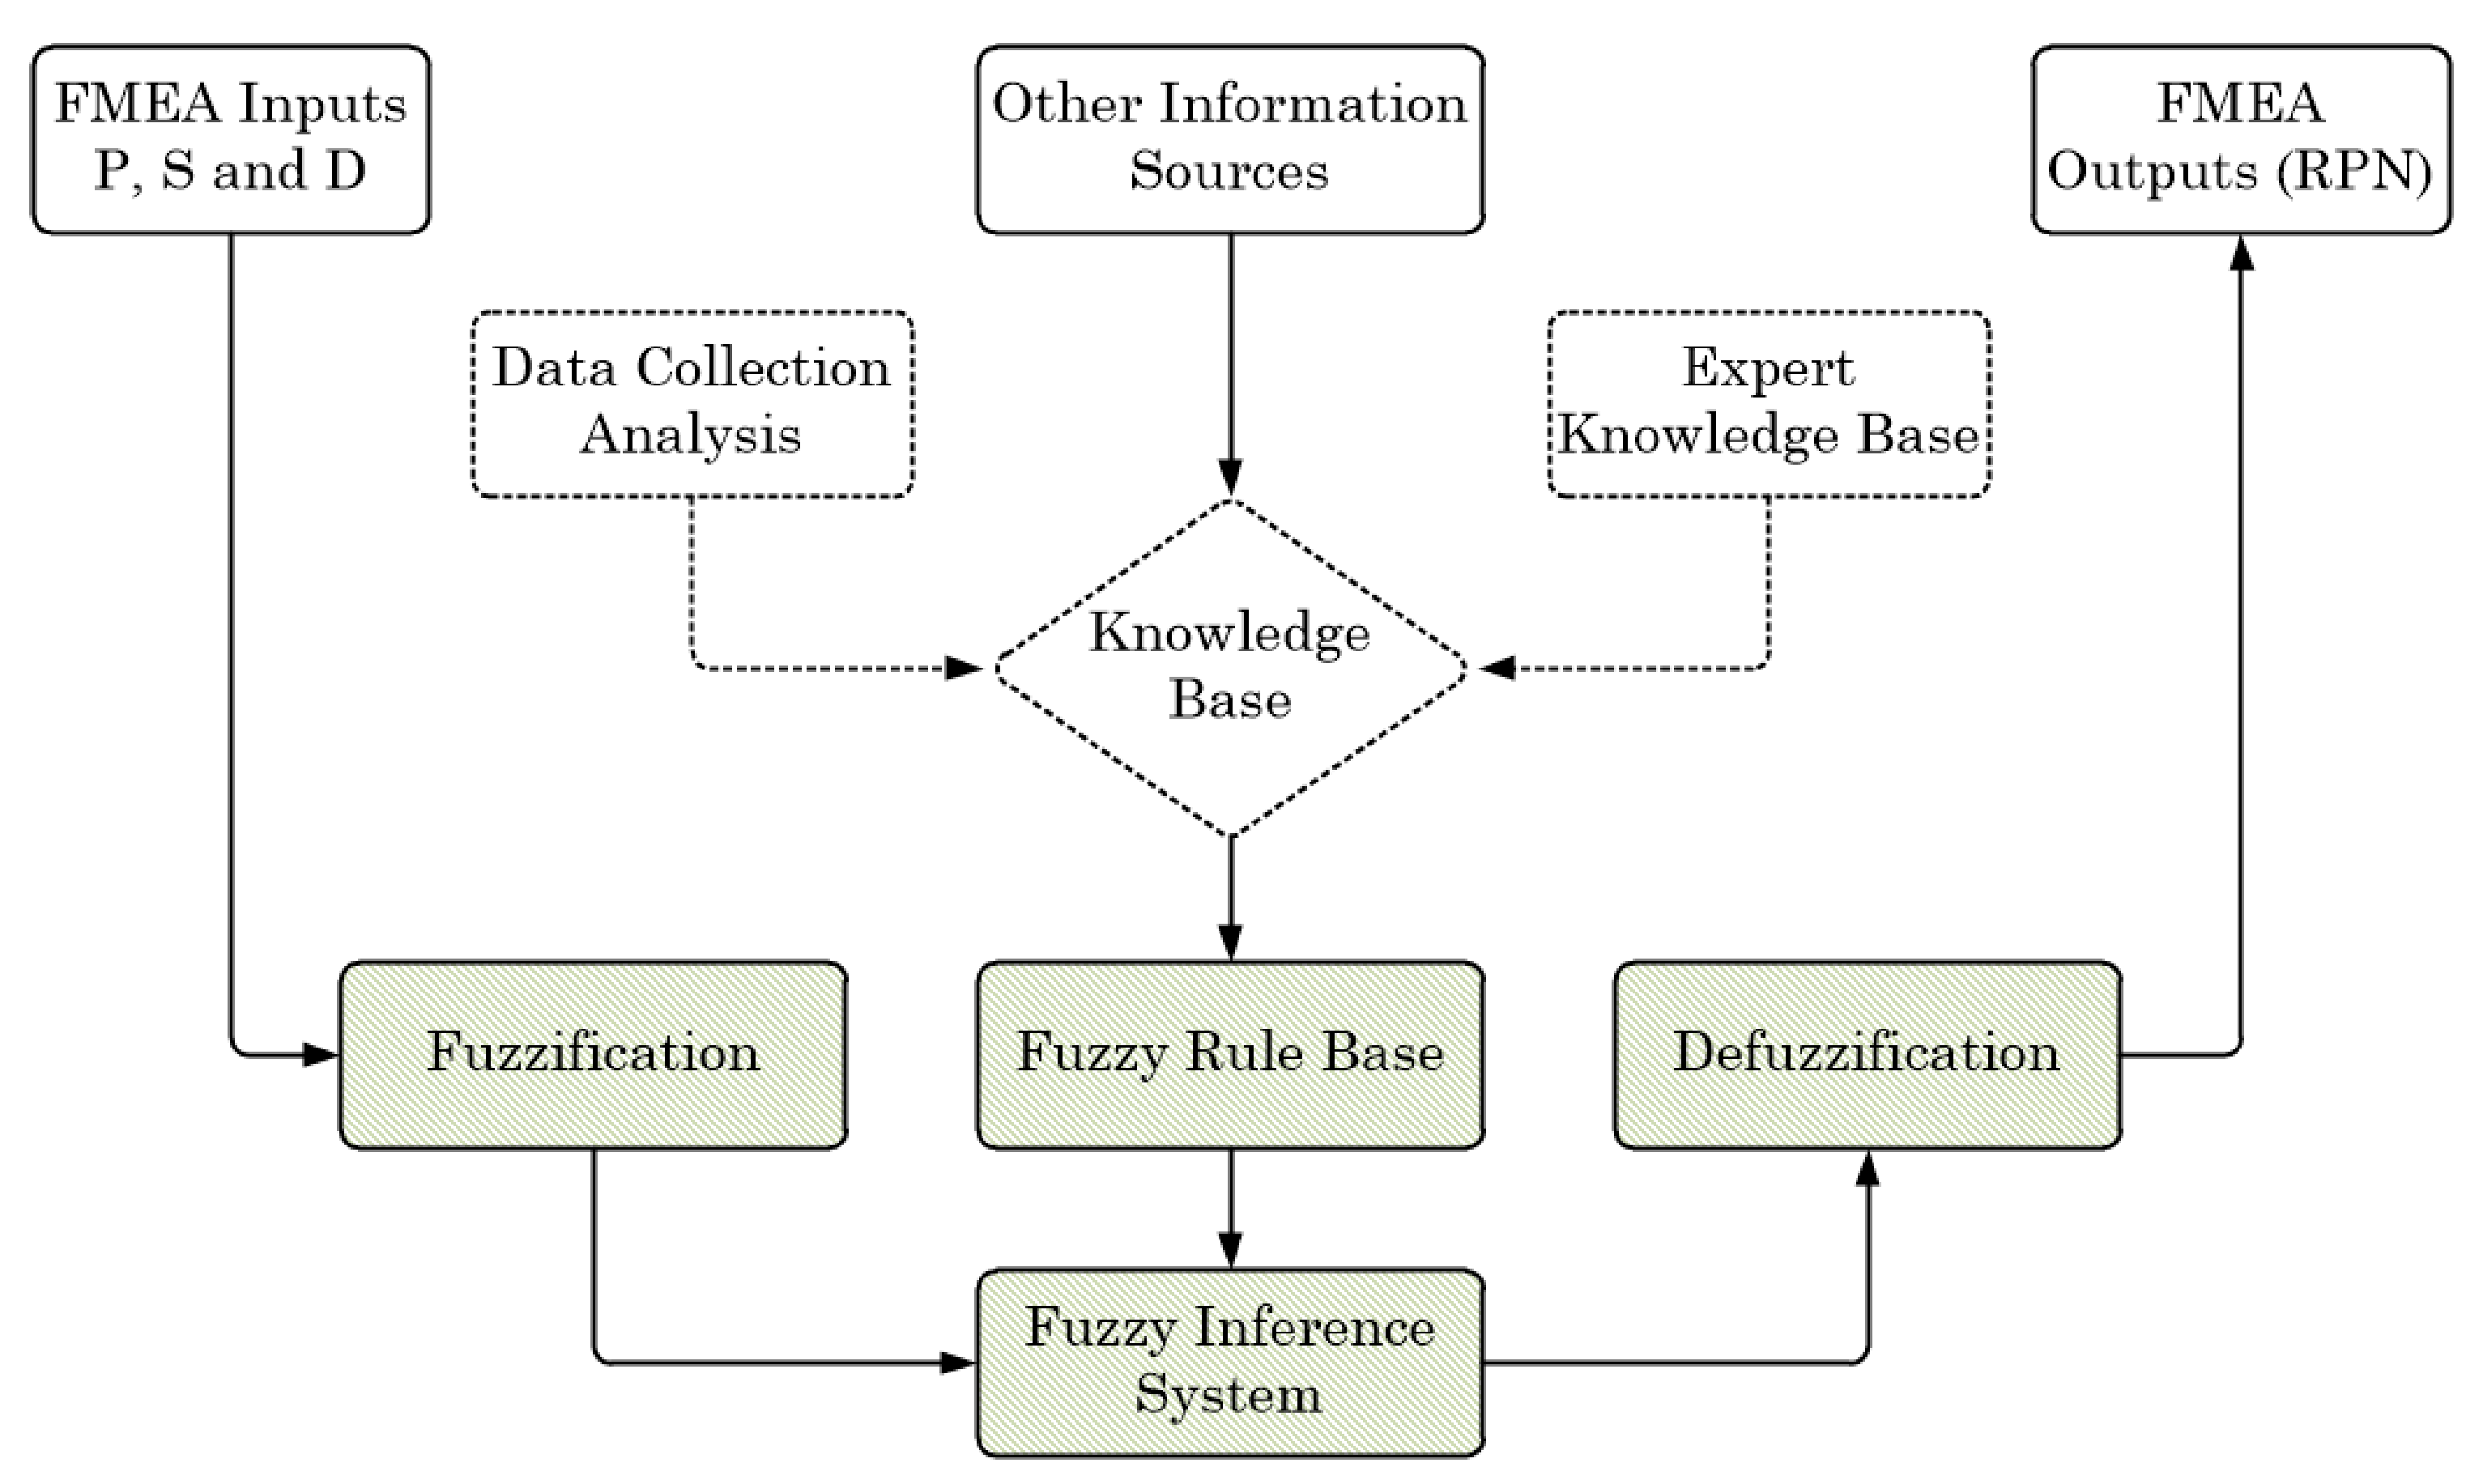
The developed fuzzy FMEA system follows a basic architecture of the fuzzy FMEA inference system consists of three main modules: input interface module (fuzzification), knowledge base module (rules base), and output interface model (defuzzification), as shown in Figure 1, adapted from [10].
As it can be observed in Figure 1, the input variables correspond to the parameters S, P, and D that are used in FMEA [23], whereas the output variable corresponds to the RPN. S, P, and D are fuzzified using membership functions to determine the degree of membership in each input class. The resulting fuzzy inputs are evaluated on the FIS, which uses a well-defined rule base. These rules are of the “IF-THEN” type and together with fuzzy logic operations are used to determine the level of risk of failure. The fuzzy conclusion is then defuzzified to obtain the RPN (output). The higher the value of the RPN, the greater the risk and vice versa.
In the proposed methodology the fuzzy FMEA system is implemented in the DMAIC cycle. Figure 2 summarizes the main aspects of the methodology.
DMAIC methodology is employed for problem solving, being used in Six Sigma projects to improve the quality of manufacturing processes. The objective is to identify and solve the different root causes that cause defects through stages already defined. The name DMAIC comes from the initials of each stage, define, measure, analyze, improve, and control, and that each phase is essential for the Six Sigma project to be a success [24,25,26]. In order to correct a specific quality problem, DMAIC cycle was applied in this study.
In the next section we explain the application of the proposed fuzzy FMEA system according to each DMAIC stage.
3.1. Define
The purpose of this step is to know the business of the project, the current state, define the production process, and identify the types of defects in the automotive industry. Thus, the target is chosen, i.e., the assembly line, the product to perform the analysis, as well as the failure modes of this product that need to be investigated. This identification is done using the analysis of historical data and based on interviews and discussions with the engineers responsible for the management of the respective processes. At the end of this step, it is possible to identify the line chosen for analysis, the product, and the failure modes determined. Thus, once these principles are established, the second stage of the cycle, measure, follows.
3.2. Measure
The measure step is of particular importance since it represents the project’s reference point. At this stage, data is collected to accurately mirror the current state of the system. By defining metrics, it is possible to measure progress and set goals. For this system is suggested the quantification of the number of failures that occurred in the defined period for each failure mode considered.
3.3. Analyze
The analyze stage is carried out in order to examine the current state of the system. In this phase, an FMEA table is analyzed and the causes of the failure modes are identified [23]. Subsequently, as a way to obtain an expert view of the risk of failure modes, compared to what is possible to obtain with the traditional FMEA, the fuzzy FMEA system is implemented. The system was developed in four stages:
- Fuzzification of inputs (S, P, and D) and output (RPN).
- Fuzzy rules definition.
- Fuzzified inputs and rule consequence combination—fuzzy inference process.
- Defuzzification of the output.
3.3.1. Fuzzification of Inputs and Outputs
In the fuzzification process, the variables S, P, and D were converted into linguistic terms and membership functions [27]. Various experts with varying degrees of competence are used to build the membership functions [10]. In this case, S, P, and D were firstly converted to linguistic terms, based on [23] FMEA’s scales. In FMEA, S, O, and D are assigned in values from 1 to 10. RPN is computed by the equation:
According to the mathematical expression (1), the minimum and maximum value that can be computed for RPN is 1 and 1000, respectively. Since the input for the fuzzy FMEA is based on traditional FMEA data, we adopted the same values to define the universe of discourse for each variable. Hence, it was considered a universe of discourse of values from 1 to 10 for S, O and D; and from 1 to 1000 for RPN.
Then, membership functions were designed according to the weight of each FMEA classification. Table 1, Table 2, Table 3 and Table 4 present the linguistic variables and membership functions of S, P, D, and RPN, respectively.
The criterion for the definition of the functions of variable S came from the little importance that the lowest values of S have for the process, and this was the reason why trapezoidal functions with large belonging intervals were used. For values above the average, we tried to refine the criterion by using a triangular function for the term “High”. Thus, a greater variability is obtained for the terms with greater importance.
The variable O was represented with a set of symmetric functions, highlighting the terms “Low” and “High”, in order to define them more precisely. This decision reflects the context in which the model is applied, since it was understood that the greatest variability should exist in the intervals that both terms represent.
The variable D deserved particular emphasis for the “High” and “Average” terms, through the assignment of triangular functions. This is because it is in the value range that encompasses these two functions that most of the observations are concentrated, hence it deserves to be more clearly defined.
For the output variable two trapezoidal and four triangular membership functions were selected. The range for the output variable is defined by the interval set [0, 1000], thus allowing, in a more advanced phase, to compare the output obtained by the implementation of this model (fuzzy RPN) with the one obtained by the classical FMEA (RPN).
Analogously to variable O, the output variable is represented by symmetric functions, with greater emphasis on the intermediate terms. It is in the value range that encompasses the “Low Importance” and “Average Importance” terms that there is a need for differentiation, hence the union between these two functions.
3.3.2. Fuzzy Rules
Fuzzy rules provide a natural platform for inferring information based on expert judgment and engineering knowledge. The purpose of building the rule base (knowledge base), is the codification of the knowledge of experts so that the proposed system is able to reproduce the capabilities of human reasoning in solving complex systems [28]. For the construction of a valuable model, a rule base with quality is fundamental. This is a process that implies time and a full understanding of the various sources of risk, activities, and processes. As such, to understand the process as much as necessary, personal industry experience was combined with knowledge gleaned from experts in the field, based on interviews and informal discussions held.
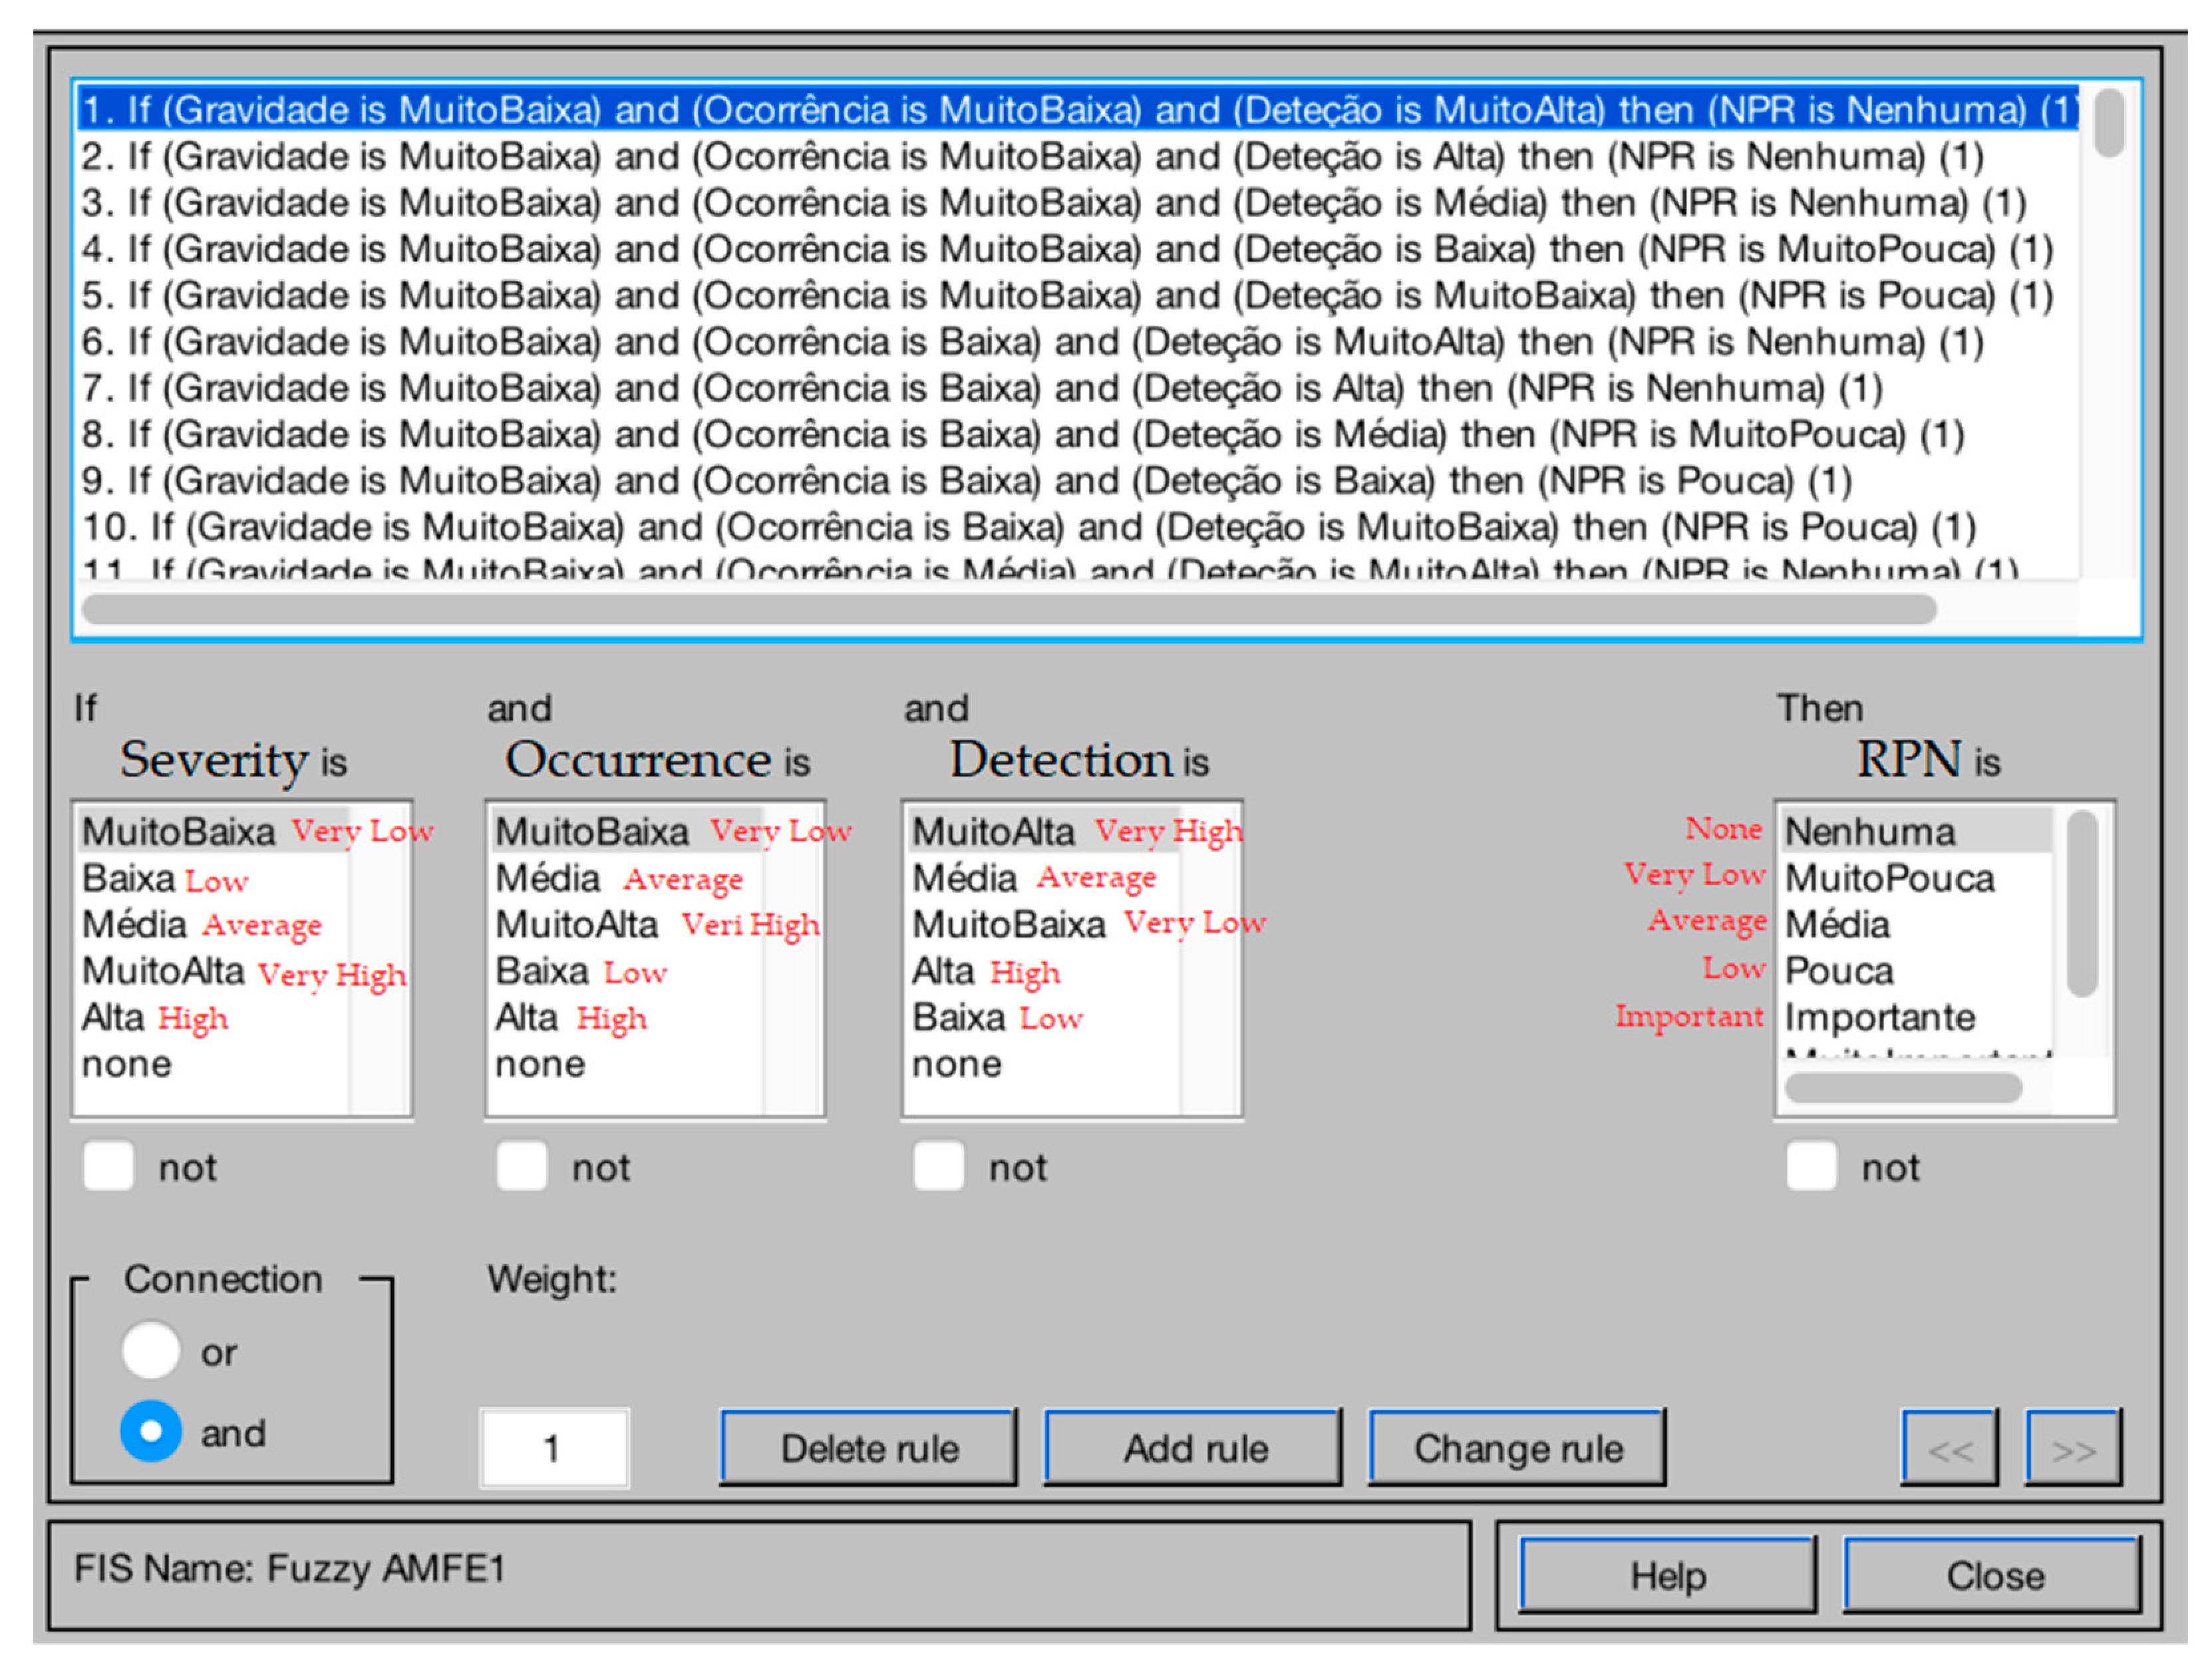
To combine inputs and outputs, 125 fuzzy inference rules were obtained. In Figure 3 we present a partial view of the rules configurations in MATLAB 2017. The combination of inputs was obtained using minimum and maximum operators for “AND” and “OR” operators, respectively.
3.3.3. Fuzzy Inference Process
For the fuzzy inference process, the Mamdani inference model is adequate to represent human knowledge [29,30]. There are two variants frequently used to determine the conclusions of the rules, (min-max and prod-max). Based on the literature review carried out, Mamdani’s min-max inference method is the one that best represents the system’s characteristics. That said, the min operator is used for the conjunction of rules and for implication operations [31]. The result of this assessment is a set of fuzzy conclusions that reflect the effects of all rules whose true value is greater than zero [27]. The outputs, represented by the fuzzy set, are aggregated using the max operator [32,33,34].
Finally, the aggregated output is defuzzified in order to obtain a clear classification of the set of fuzzy conclusions, so that corrective actions can be prioritized according to the need [35]. This process creates a ranking of fuzzy conclusions, which express the level of risk/criticality of the failure. Defuzzification is also necessary because it resolves conflicts between different results that may have arisen during the evaluation of the rule [27].
There are many methods of defuzzification available in the literature [36,37,38]. The criteria that should be used to select the appropriate defuzzification method are disambiguation (result in a single value), plausibility (located approximately in the middle of the area), and computational simplicity [35].
There is no defuzzification method that is the best for all applications, however, the opinion of most authors is consensual, and the most employed method is the center of gravity (COG), due to the several advantages over other methods. The consistency, balance, sensitivity to the length and width of the total fuzzy region, and the smooth variances in the final expected value for the output value, are some of the characteristics [39,40,41]. COG is calculated using the weighted average of the fuzzy region that defines the output and corresponds to the point on the x-axis that divides the fuzzy region into two equal subareas, as follows (2):
where: xi = support value where the membership function reaches the maximum value, and µi(x) = degree of membership of the function.
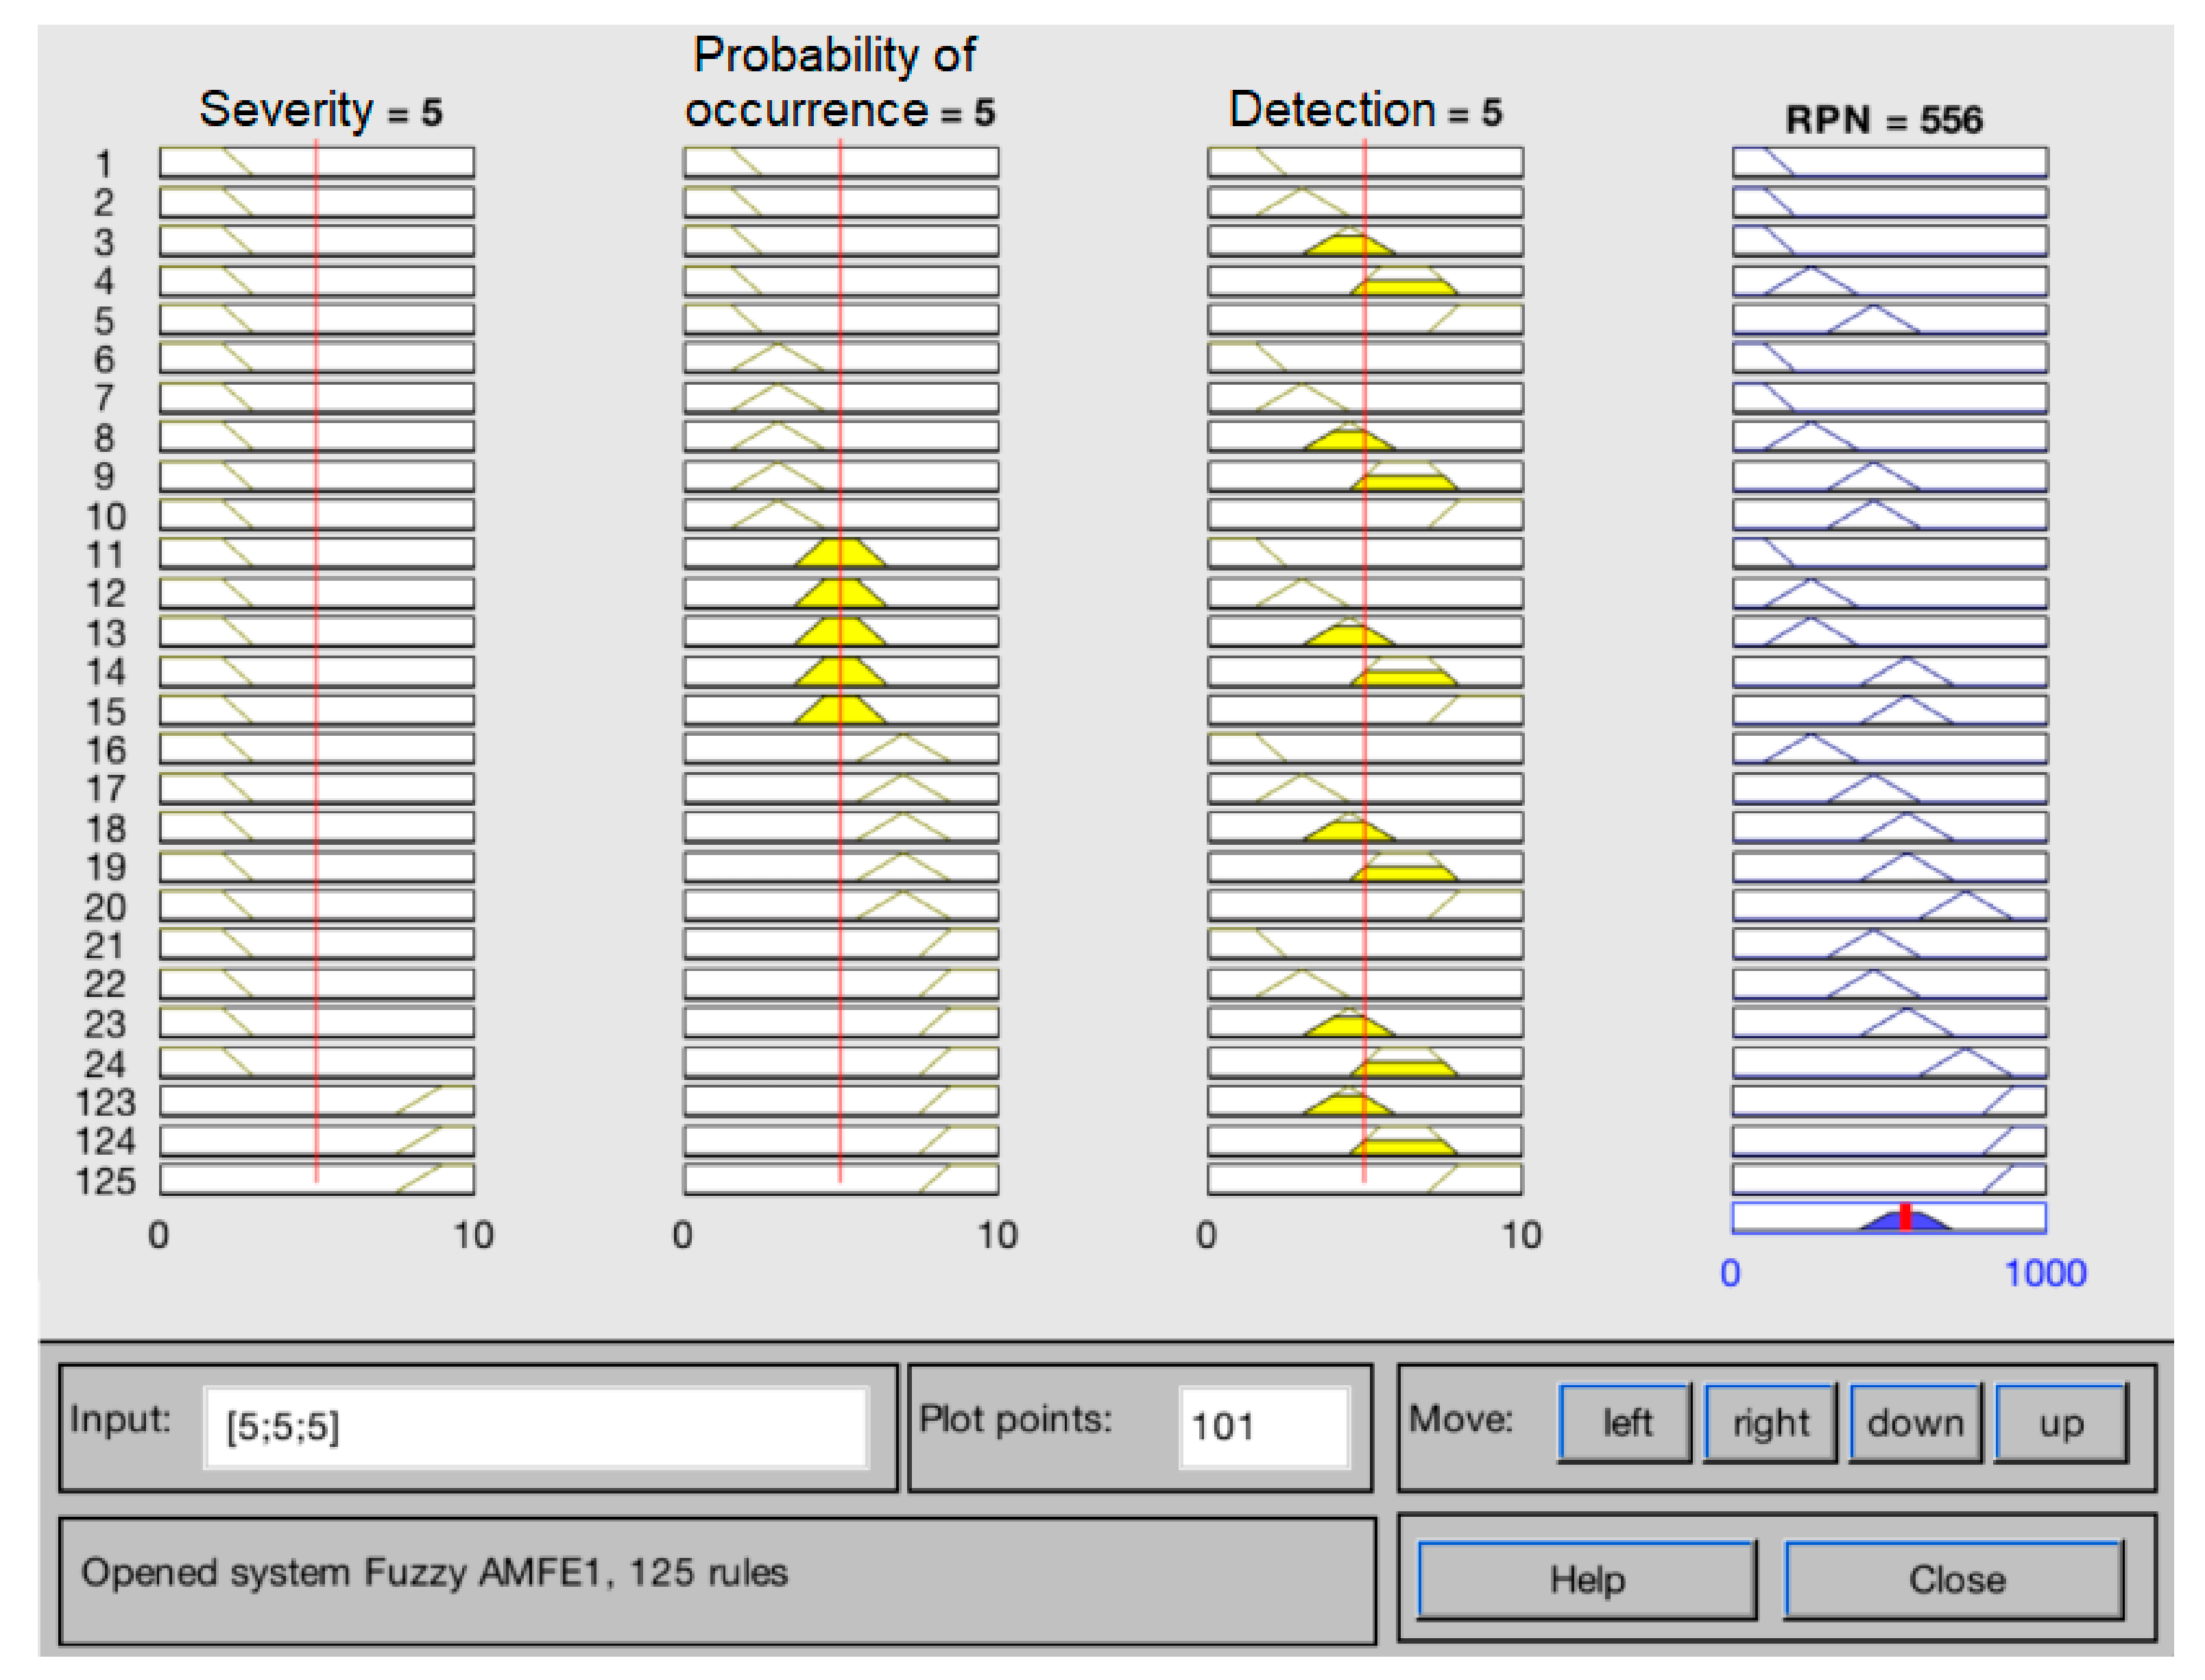
In Figure 4 we present the partial view of the fuzzy inference process for the fuzzy FMEA. On the left, the inputs S, O, and D are represented in Portuguese by “Gravidade”, “Ocorrência”, and “Deteção”. Based on the inputs, RPN is computed using the above explained combination operations. The final value for RPN is obtained using COG.
3.4. Improve
One of the purposes of this methodology is to formulate solutions to counteract process failures. For each of the priority failure modes identified in the previous phase, measures are generated to minimize or eliminate their causes and, thus, allow for process improvement. Since the failure modes that will be analyzed correspond to the most complicated, subjective, and uncertain defects to detect in the visual inspection stations, the proposed improvement measures aim to act in two ways:
- -
- Minimizing the root-causes—by finding solutions and intervening directly on the causes, which are usually mentioned in the FMEA tables.
- -
- Improving the visual inspection process—in the event that the measure applied to the causes of the failure modes does not fulfill the intended purpose, by also acting at the visual inspection stations, the failure is prevented from spreading along the line. This method consists of providing the inspection teams with sufficient capacity to identify the most critical defects.
Improvement solutions should be chosen based on the probability of success, execution time, impact on resources, and also the associated costs.
3.5. Control
In the fifth and last phase of the cycle, after the improvements have been implemented, they are monitored. During the experimental period of the proposed measures, it becomes necessary to perform constant verifications of their effectiveness. For this, the metric used in the measure phase to measure the initial state of the system should be used again each time a possible improvement is implemented. The metric determined at the beginning of the project is compared with the metric calculated after the implementation of the improvement, to verify, or not, the effectiveness of the improvement. Once this step is concluded, the DMAIC cycle is considered closed.
4. The Case Study
The study made in this paper addressed a production line from a multinational automotive industrial unit and is part of the production process of 10 injection coils member of the family of products and are intended for one of the largest customers of the factory. The line currently supports a production order of approximately 12,000 injection coils per day. It was decided to study this specific production line since it is the most representative of the factory, with the highest volume of business for the company and, consequently, the one that requires more concerns. Of the 10 models, only one of them was analyzed in detail. Throughout the work, it is referred to as injection coil 1.
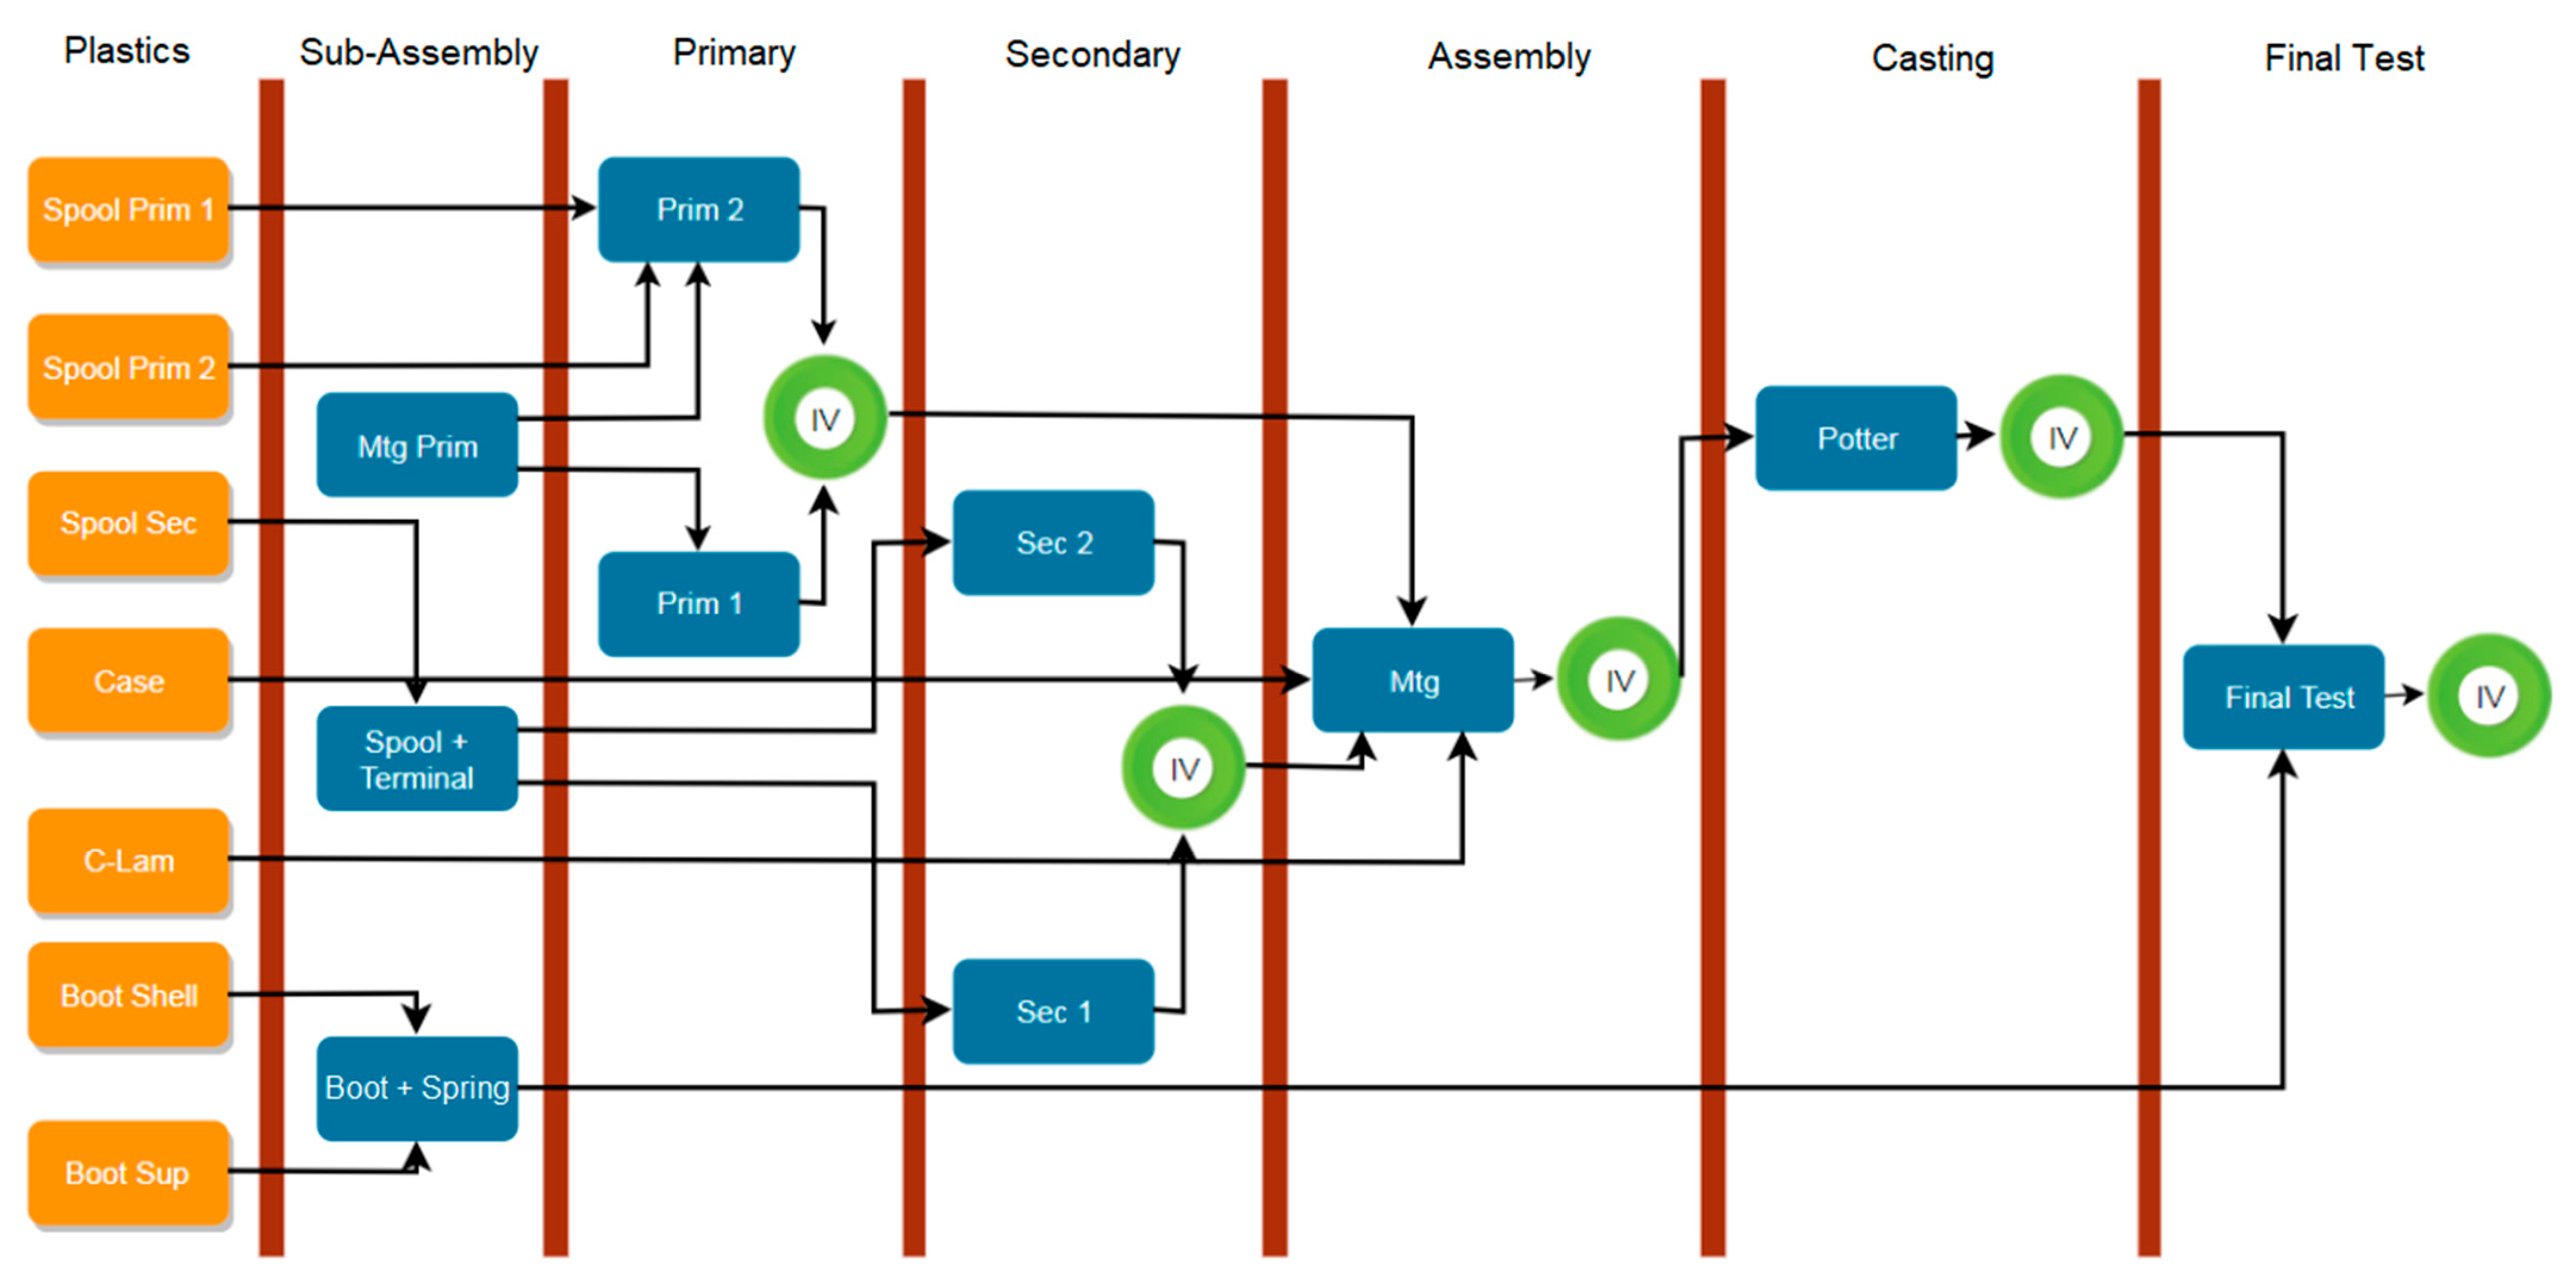
The selection of this model, injection coil 1, is due to the fact that it represents the largest volume of production from this line, as well as the entire factory, with approximately seven thousand injection coils produced daily. Since many of the production machines in the line are shared between models, when analyzing injection coil 1, faults and defects that are common to all will be covered. Figure 5 shows the schematic of the injection coil 1 production line.
4.1. DMAIC Cycle
4.1.1. Define
At the define stage of the cycle, during visual inspection stations, operators follow the typical defect detection procedure, so that defective parts do not proceed to the next steps in the process and are properly routed to a component recovery station. All kinds of defects are identified. Most detections correspond to defects where the analysis is straightforward. For example, lack of bushing (or any other component), bad winding, among others. For this type of defect, no human decision is necessary. Once the criteria are well defined, human participation is not crucial for decision making. The defects that lack human participation for decision-making are those with a high degree of subjectivity. Only the most experienced operators, with greater knowledge of the defects and classification criteria, correctly identify the defects and make the right decision as to the destination of the part. That said, it is about the subjective defects identified in the injection coil 1 assembly lines, which this study focuses on.
The analysis carried out went through analyzing all potential failure modes. About 270 potential failure modes have been identified. Together with the line quality engineer, these failure modes were analyzed and those with a subjective component of interest for the proposed approach were selected. Obvious defects were excluded from the list, whose analysis involves answering “YES/NO” to the failure mode and the defects detected by the machine. Finally, 47 failure modes with the desired characteristics remained.
4.1.2. Measure
Subsequently, the number of occurrences of each failure mode was counted. For accounting purposes, product failure records were analyzed for the total number of occurrences between January 2018 and June 2018. The data were then processed and modeled to obtain the values of interest. The analysis was conducted for the 47 potential failure modes and was measured in the number of occurrences detected per million inspected parts (ppm). This was the performance indicator (KPI), used to measure the progress of the process.
However, when measuring occurrences, it was found that for some failure modes, no occurrences were detected in the period under analysis. As such, these were excluded from the approach. Then, these data were cross-checked with the criteria defined in a procedure report for the visual inspections of each station. With this crossing, other failure modes with less interest were eliminated. Finally, also in order not to overload the analysis, 10 failure modes remained. Table 5 shows the potential final failure modes considered for the study, as well as the visual inspection station in which they are detected.
4.1.3. Analyze
In the analyze phase the proposed fuzzy FMEA system was implemented. After developing an FMEA table with all the failure modes, effects, occurrence, and respective indexes, the indices were fed into the fuzzy FMEA system and a fuzzy RPN index was generated for each set. Table 6 contains the comparative study between the RPN values of the two methodologies, classic FMEA and fuzzy FMEA. By observing Table 6, it is possible to verify that the difference in the results of the models is not significant. However, given the small differences, it is important to distinguish the approach of the proposed model. One of the main limitations of the classic FMEA corresponds to the tie that occurs in the RPN value for failure modes with different values of S, P, and D. In the classic FMEA (see column “RPN” in Table 6) the failure modes “Lost thread (6)”, “High shot (7)” and “High shot (8)” have a total RPN value of 72, despite differences in the risk implications of the three failure modes. With the fuzzy FMEA analysis, the draws referred to did not happen. On the contrary, the fuzzy RPN values are relatively dispersed from one another. The classic FMEA proves to be insensitive in the tiebreaker criterion since events with different parameters are given the same priority. Consequently, it can imply a waste of resources in mitigation actions, or even cause an event with a high degree of risk to go unnoticed.
On the other hand, the classification of failure modes according to their priority has undergone some changes, as shown in Table 7. The most critical failure modes remain the same, however, with a different prioritization. This change in the prioritization of failure modes, although not very significant, demonstrates FMEA’s inconsistencies in the face of the specialists’ real desire. Therefore, classic FMEA can result in preventive and corrective actions in failure modes with less implicit risk, contrary to the desire to act on those who really represent a greater risk for the process.
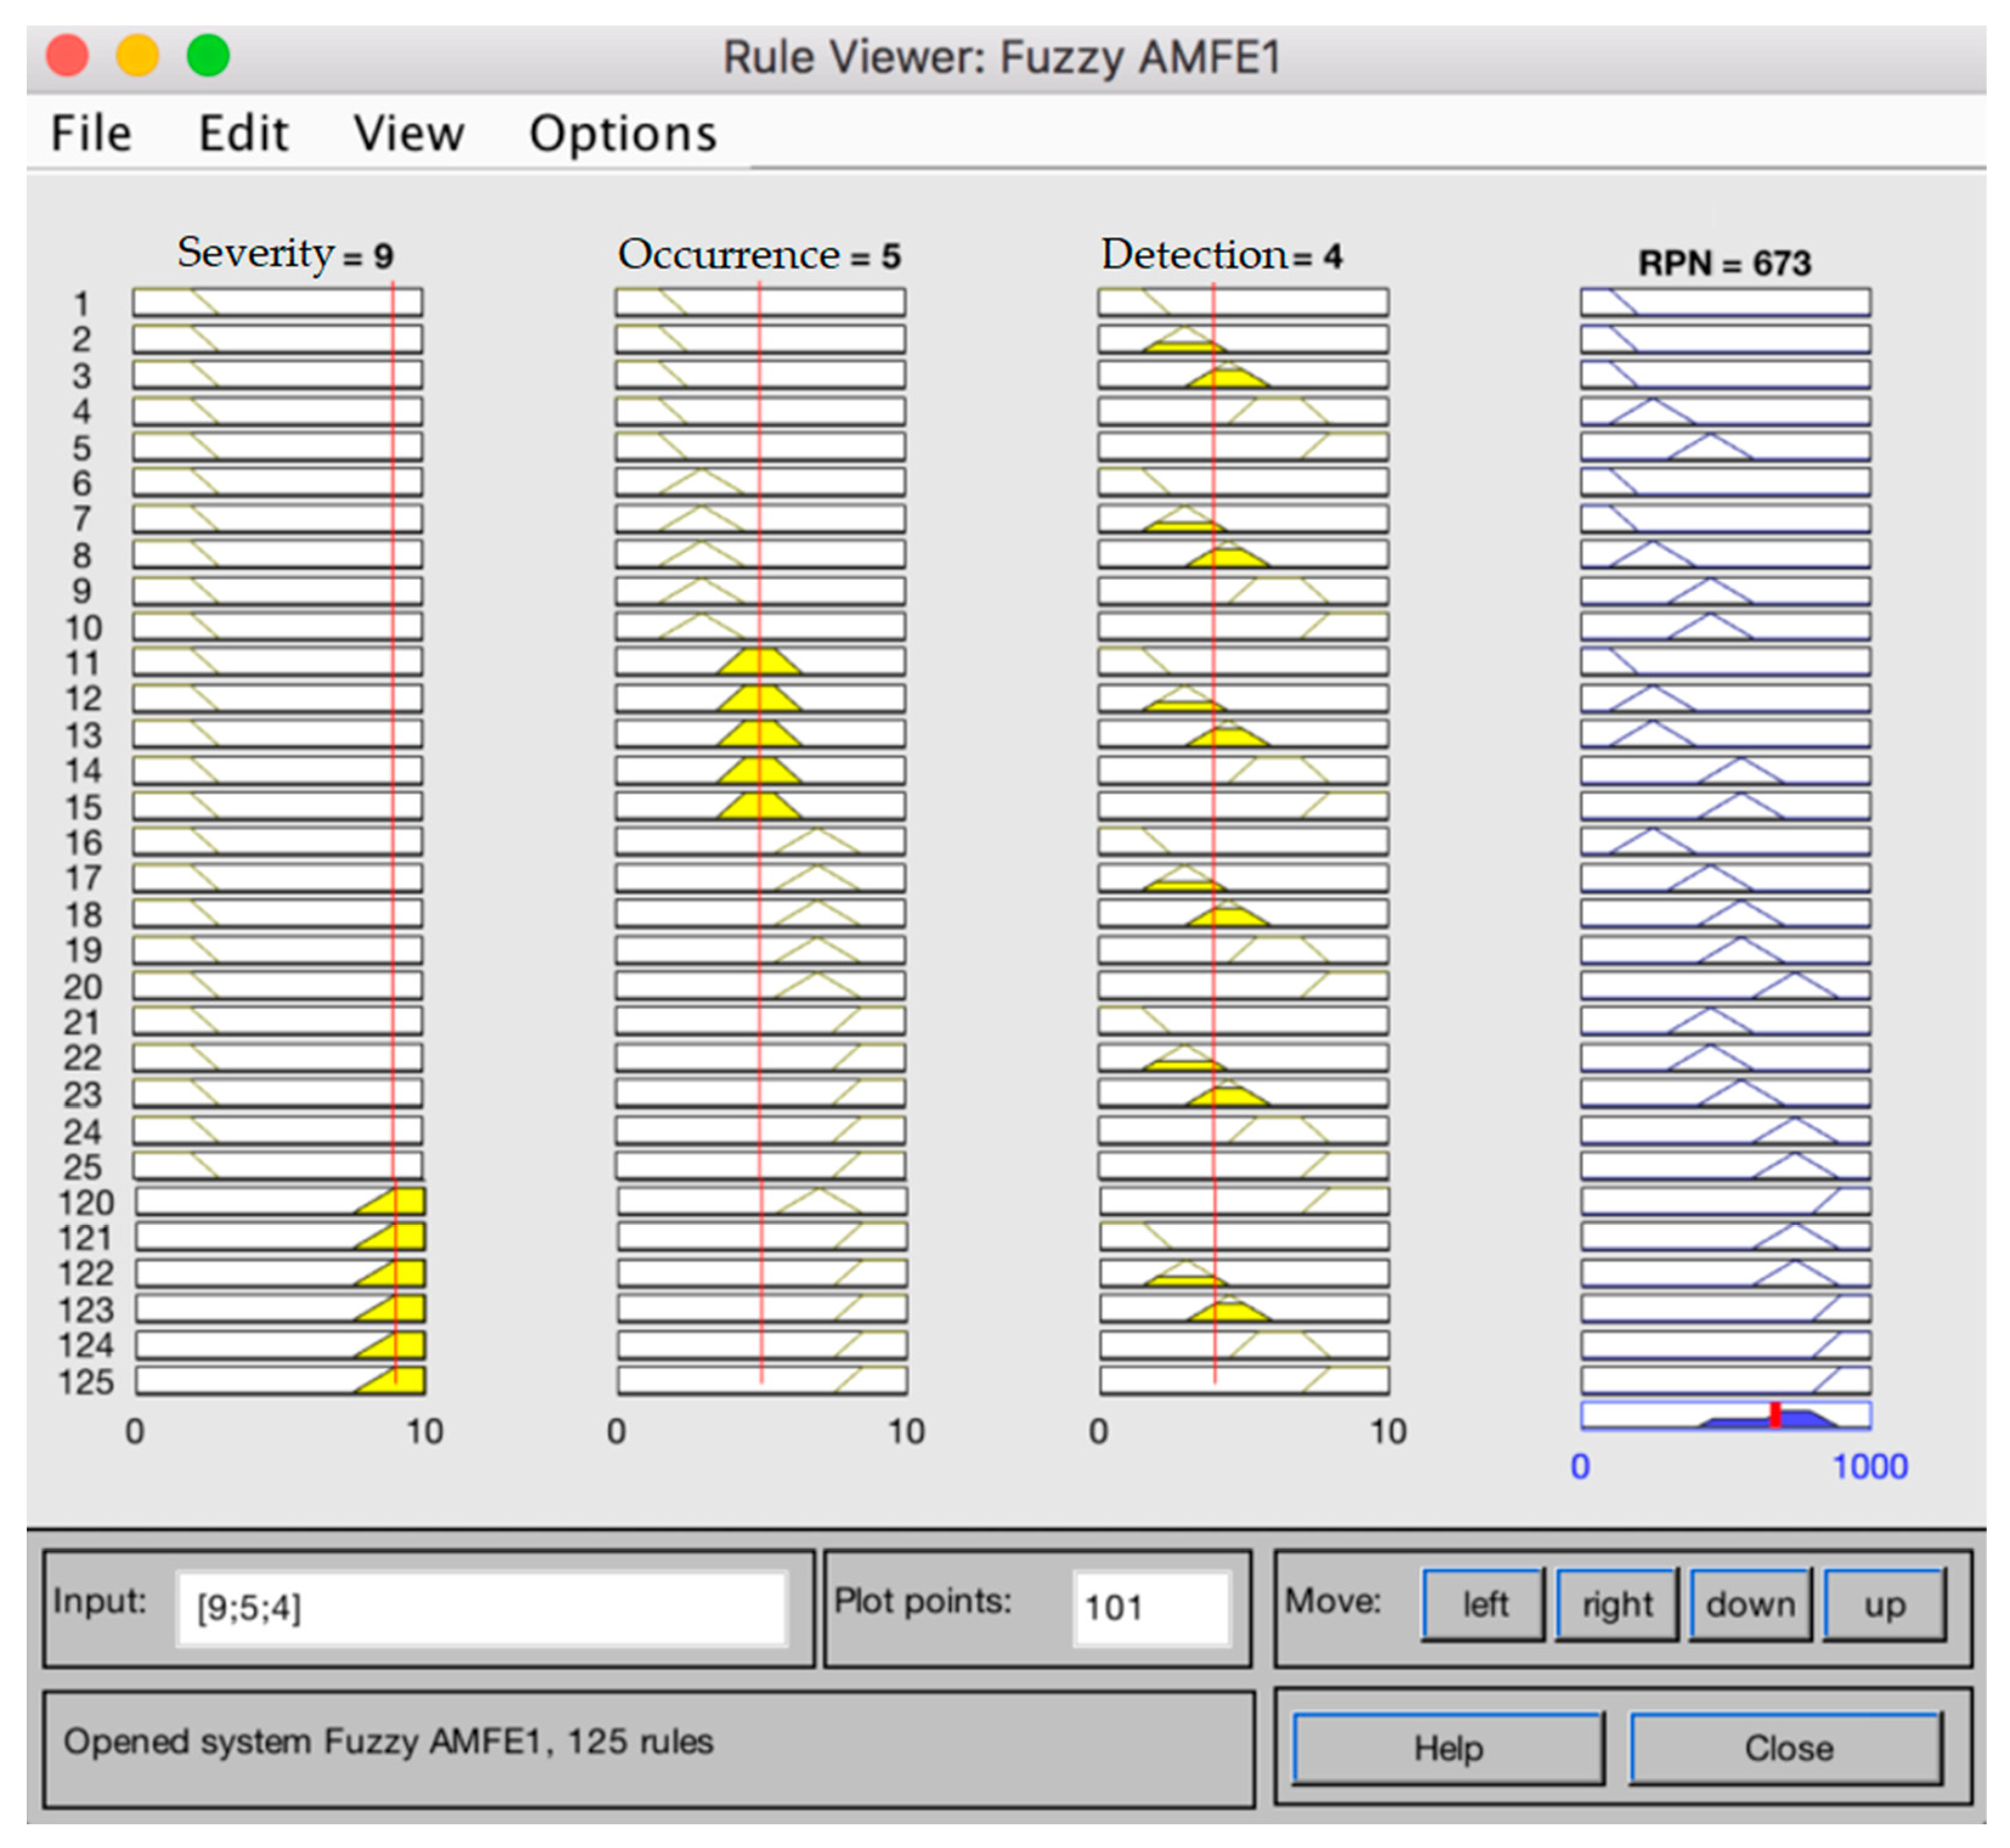
Figure 6 shows the fault mode rule viewer, “Conical winding (2)”. The parameters S = 9, O = 5, and D = 4 generated a fuzzy RPN = 673, which resulted in the highest priority being assigned to this failure mode. However, according to FMEA, the RPN value was 180, the second most critical failure mode, as shown in Table 6. Through FMEA, the assigned parameters represent the failure mode with S = “Critical”, O = “Low” and D = “Moderately High”. According to the fuzzy FMEA analysis, the evaluation was not so linear.
4.1.4. Improve
For the four failure modes identified as priority in the fuzzy FMEA analysis of the previous step, the measures presented in Table 8 were suggested. The suggestions for improvement are proposed for the root causes of the potential failure modes “Conical spool (2)”, “Bubbles in epoxy (1)”, “Contaminations in epoxy (4)” and “Contaminations in epoxy (3)”, but also for the visual inspection stations of the components to which the failure modes correspond, “Secondary” and “Cast transformer”.
4.1.5. Control
In the fifth and last phase of the DMAIC cycle, after the improvements are implemented, they are monitored. During the experimental period of the proposed measures, it is necessary to carry out constant checks on their effectiveness. For this, the metric used in the measure phase to measure the initial state of the system must be used again each time a possible improvement is implemented. For this case, the PPM metric determined at the beginning of the project is compared with the one calculated after the implementation of the possible improvement, in order to prove, or not, the effectiveness of the same. Despite the eventual success of the proposed measures, they had not been implemented or tested by the time this study was completed, so it was not possible to verify whether they would actually result in process improvement.
5. Conclusions
FMEA is a well established methodology for problem solving in Quality based on the analysis of failure modes and the determination of risks associated with each of them. Nevertheless, despite remaining a standard and robust method to address numerous quality issues and risks, the shortcomings of the traditional FMEA are explored by several authors (e.g., [12,13,14,15,16,17]). In the case of qualitative defects in visual inspection, traditional FMEA proved inefficient and fuzzy FMEA is a way to enhance its applicability in this setting [42]. In virtue, in this research paper was proposed a modification of the classic FMEA using fuzzy logic, to solve the problems associated with the calculation of the classic RPN when applied in subjective and vague contexts. It was proposed to evaluate how the integration of a fuzzy FMEA inference system in the DMAIC cycle, could improve the analysis made to potential failure modes with a subjective character, identified in the visual inspection stations of the automotive industry.
In this paper, a fuzzy FMEA system and a method based on the DMAIC cycle to assess risks in the visual inspection process of defects of automobile parts were proposed. The fuzzy FMEA system was proposed to deal with subjectivity and uncertainty inherent to the visual inspection process of qualitative defects. The fuzzy system permits increased detail when determining the risk associated with each type of failure. While FMEA allows the computing of RPN in a direct manner (multiplying S, O and D), it is not possible to match RPN values with evaluation criteria of the traditional RPN. Through the proposed fuzzy FMEA model, it is possible to classify the potential failure modes, with linguistic terms of the variable RPN fuzzy. Fuzzy FMEA allows the assignation of fuzzy sets of values to each level of S, O, and D; and, the combination of those sets is made through knowledge rules that enhance the scale of RPN in a systematic manner. As such, the value of the fuzzy FMEA model comes from the way that specialists are able to express their needs and obtain a response according to what they actually have as a priority.
To deploy the fuzzy system, a method based on the DMAIC cycle was also suggested. The method permits structuring the problem-solving process, enhancing the identification of failures to thoroughly solving them by measuring the current process, assessing risks through fuzzy RPN computation, improving and solving causes of failure, and controlling the process in the future through continuous improvement. In the define and measure steps, it was possible, in an organized way, to identify the process, the failure modes that were relevant to the study, as well as the quantification of their occurrences according to the metric/KPI ppm. This concept proved to be a great asset, not only in the way of structuring the project but also in interpreting and replicating it. In the analyze phase, after the implementation and obtaining of results by the fuzzy FMEA system, these same results were compared for the failure modes under study, namely the classic RPN index with the fuzzy RPN.
The proposed fuzzy FMEA system and DMAIC method were implemented in a case study performed in an automotive supplier production of injection coils. The inclusion of the fuzzy FMEA system in the DMAIC cycle allowed adequate identification of production problems in the define and measure stages. By measuring the ppm metric along the production process, it was possible to early prioritize failure modes that were used to apply the fuzzy FMEA. In the analyze stage, the fuzzy FMEA system was implemented. The fuzzy system allowed the computing of a more detailed version of RPN. In Table 6, a comparison between traditional and fuzzy FMEA was made. The fuzzy RPN enhanced the risk scale to better classify failures and root causes. Comparing traditional and fuzzy RPN, components 6, 7, and 8 were classified with the same value of RPN (72). When implementing the fuzzy system, the classification was enhanced, and components 6, 7, and 8 were assigned an RPN of 513, 382, and 366, respectively. Hence, with the fuzzy FMEA system was possible to better classify causes of failure in a more detailed fashion. Moreover, it was also possible to classify fuzzy RPN values according to the RPN linguistic variables, whereas component 6 was classified as “average importance” and components 7 and 8 were classified as “low importance”. In conclusion, was possible to determine that the main causes of failure that should be solved are the “conical winding (2)”, “bubbles in epoxy (1)”, “epoxy contamination (4)” and “epoxy contamination (3)”.
In the improve phase of the cycle, the proposed improvements were presented to act on the root causes of potential priority failure modes, but also on the way they are detected in the visual inspection stations of the components they represent. Thus, for situations in which it is not possible to eliminate the cause, it will always be likely to be detected. Once again, the preponderance of the DMAIC cycle was revealed. However, due to a lack of useful time, the proposed measures were not implemented in the case study, and it is not possible to prove whether they would actually result in improvements. This stage of the process corresponds to the last phase of the DMAIC cycle, control phase, which, because it was not carried out, did not allow the closing of the cycle. Thus, it was not possible to prove the validity of the model presented in its entirety.
Author Contributions
Writing—original draft, R.G.; conceptualization and methodology, B.G.R.S. and P.E.-C.; software P.E.-C.; supervision, P.E.-C.; validation and investigation, R.G. and P.E.-C.; review and editing, R.G. All authors have read and agreed to the published version of the manuscript.
Funding
The authors acknowledge Fundação para a Ciência e a Tecnologia (FCT-MCTES) for its financial support via the project UIDB/00667/2020 (UNIDEMI).
Institutional Review Board Statement
Not applicable.
Informed Consent Statement
Not applicable.
Data Availability Statement
Not applicable.
Conflicts of Interest
The authors declare no conflict of interest.
References
- Ebrahimi, M.; Baboli, A.; Rother, E. The Evolution of World Class Manufacturing toward Industry 4.0: A Case Study in the Automotive Industry. IFAC-Pap. 2019, 52, 188–194. [Google Scholar] [CrossRef]
- Godina, R.; Matias, J.C.O. Statistical Process Control Accuracy Estimation of a Stamping Process in Automotive Industry. In Innovations Induced by Research in Technical Systems; Lecture Notes in Mechanical Engineering; Majewski, M., Kacalak, W., Eds.; Springer International Publishing: Basel, Switzerland, 2020; ISBN 978-3-030-37565-2. [Google Scholar]
- Drury, C.G.; Sinclair, M.A. Human and Machine Performance in an Inspection Task. Hum. Factors 1983, 25, 391–399. [Google Scholar] [CrossRef]
- Chougule, R.; Khare, V.R.; Pattada, K. A Fuzzy Logic Based Approach for Modeling Quality and Reliability Related Customer Satisfaction in the Automotive Domain. Expert Syst. Appl. 2013, 40, 800–810. [Google Scholar] [CrossRef]
- Ebrahimipour, V.; Rezaie, K.; Shokravi, S. An Ontology Approach to Support FMEA Studies. Expert Syst. Appl. 2010, 37, 671–677. [Google Scholar] [CrossRef]
- Subriadi, A.P.; Najwa, N.F. The Consistency Analysis of Failure Mode and Effect Analysis (FMEA) in Information Technology Risk Assessment. Heliyon 2020, 6, e03161. [Google Scholar] [CrossRef] [PubMed]
- Rastayesh, S.; Bahrebar, S.; Blaabjerg, F.; Zhou, D.; Wang, H.; Dalsgaard Sørensen, J. A System Engineering Approach Using FMEA and Bayesian Network for Risk Analysis—A Case Study. Sustainability 2020, 12, 77. [Google Scholar] [CrossRef] [Green Version]
- Rehman, Z.; Kifor, C.V.; Jabeen, F.; Naz, S.; Waqar, M. Automatic Acquisition of Failure Mode and Effect Analysis Ontology for Sustainable Risk Management. Sustainability 2020, 12, 208. [Google Scholar] [CrossRef]
- Crawley, F. 12—Failure modes and effects analysis (FMEA) and failure modes, effects and criticality analysis (FMECA). In A Guide to Hazard Identification Methods, 2nd ed.; Crawley, F., Ed.; Elsevier: Amsterdam, The Netherlands, 2020; pp. 103–109. ISBN 978-0-12-819543-7. [Google Scholar]
- Sharma, R.K.; Kumar, D.; Kumar, P. Systematic Failure Mode Effect Analysis (FMEA) Using Fuzzy Linguistic Modelling. Int. J. Qual. Reliab. Manag. 2005, 22, 986–1004. [Google Scholar] [CrossRef]
- Mandal, S.; Maiti, J. Risk Analysis Using FMEA: Fuzzy Similarity Value and Possibility Theory Based Approach. Expert Syst. Appl. 2014, 41, 3527–3537. [Google Scholar] [CrossRef]
- Wan, C.; Yan, X.; Zhang, D.; Qu, Z.; Yang, Z. An Advanced Fuzzy Bayesian-Based FMEA Approach for Assessing Maritime Supply Chain Risks. Transp. Res. Part E Logist. Transp. Rev. 2019, 125, 222–240. [Google Scholar] [CrossRef]
- Fattahi, R.; Khalilzadeh, M. Risk Evaluation Using a Novel Hybrid Method Based on FMEA, Extended MULTIMOORA, and AHP Methods under Fuzzy Environment. Saf. Sci. 2018, 102, 290–300. [Google Scholar] [CrossRef]
- Jahangoshai Rezaee, M.; Yousefi, S.; Eshkevari, M.; Valipour, M.; Saberi, M. Risk Analysis of Health, Safety and Environment in Chemical Industry Integrating Linguistic FMEA, Fuzzy Inference System and Fuzzy DEA. Stoch. Environ. Res. Risk Assess. 2020, 34, 201–218. [Google Scholar] [CrossRef]
- Qin, J.; Xi, Y.; Pedrycz, W. Failure Mode and Effects Analysis (FMEA) for Risk Assessment Based on Interval Type-2 Fuzzy Evidential Reasoning Method. Appl. Soft Comput. 2020, 89, 106134. [Google Scholar] [CrossRef]
- Balaraju, J.; Govinda Raj, M.; Murthy, C.S. Fuzzy-FMEA Risk Evaluation Approach for LHD Machine—A Case Study. J. Sustain. Min. 2019, 18, 257–268. [Google Scholar] [CrossRef]
- Li, Z.; Chen, L. A Novel Evidential FMEA Method by Integrating Fuzzy Belief Structure and Grey Relational Projection Method. Eng. Appl. Artif. Intell. 2019, 77, 136–147. [Google Scholar] [CrossRef]
- Kahraman, C.; Kaya, İ.; Şenvar, Ö. Healthcare Failure Mode and Effects Analysis Under Fuzziness. Hum. Ecol. Risk Assess. Int. J. 2013, 19, 538–552. [Google Scholar] [CrossRef]
- Ghoushchi, S.J.; Yousefi, S.; Khazaeili, M. An Extended FMEA Approach Based on the Z-MOORA and Fuzzy BWM for Prioritization of Failures. Appl. Soft Comput. 2019, 81, 105505. [Google Scholar] [CrossRef]
- Seiti, H.; Hafezalkotob, A.; Najafi, S.E.; Khalaj, M. A Risk-Based Fuzzy Evidential Framework for FMEA Analysis under Uncertainty: An Interval-Valued DS Approach. J. Intell. Fuzzy Syst. 2018, 35, 1419–1430. [Google Scholar] [CrossRef]
- Mangla, S.K.; Luthra, S.; Jakhar, S. Benchmarking the Risk Assessment in Green Supply Chain Using Fuzzy Approach to FMEA: Insights from an Indian Case Study. Benchmarking Int. J. 2018, 25, 2660–2687. [Google Scholar] [CrossRef]
- Sayyadi Tooranloo, H.; Ayatollah, A.S.; Alboghobish, S. Evaluating Knowledge Management Failure Factors Using Intuitionistic Fuzzy FMEA Approach. Knowl. Inf. Syst. 2018, 57, 183–205. [Google Scholar] [CrossRef]
- Stamatis, D.H. Failure Mode and Effect Analysis FMEA from Theory to Execution, 2nd ed.; ASQ Quality Press: Milwaukee, WI, USA, 2003; ISBN 0-87389-598-3. [Google Scholar]
- de Mast, J.; Lokkerbol, J. An Analysis of the Six Sigma DMAIC Method from the Perspective of Problem Solving. Int. J. Prod. Econ. 2012, 139, 604–614. [Google Scholar] [CrossRef]
- Srinivasan, K.; Muthu, S.; Devadasan, S.R.; Sugumaran, C. Enhancing Effectiveness of Shell and Tube Heat Exchanger through Six Sigma DMAIC Phases. Procedia Eng. 2014, 97, 2064–2071. [Google Scholar] [CrossRef] [Green Version]
- Boon Sin, A.; Zailani, S.; Iranmanesh, M.; Ramayah, T. Structural Equation Modelling on Knowledge Creation in Six Sigma DMAIC Project and Its Impact on Organizational Performance. Int. J. Prod. Econ. 2015, 168, 105–117. [Google Scholar] [CrossRef]
- Chin, K.-S.; Chan, A.; Yang, J.-B. Development of a Fuzzy FMEA Based Product Design System. Int. J. Adv. Manuf. Technol. 2008, 36, 633–649. [Google Scholar] [CrossRef]
- Zimmermann, H.-J. Fuzzy Set Theory—And Its Applications, 3rd ed.; Springer: Boston, MA, USA, 1996; ISBN 978-0-7923-9624-6. [Google Scholar]
- Rustum, R.; Kurichiyanil, A.M.J.; Forrest, S.; Sommariva, C.; Adeloye, A.J.; Zounemat-Kermani, M.; Scholz, M. Sustainability Ranking of Desalination Plants Using Mamdani Fuzzy Logic Inference Systems. Sustainability 2020, 12, 631. [Google Scholar] [CrossRef] [Green Version]
- Lee, K.-M.; Lee-Kwang, H. 44—Techniques in Fuzzy Inference Neural Networks for Fuzzy Model Improvement and Their Application. In Fuzzy Theory Systems; Leondes, C.T., Ed.; Academic Press: San Diego, CA, USA, 1999; pp. 1241–1264. ISBN 978-0-12-443870-5. [Google Scholar]
- Pourjavad, E.; Mayorga, R.V. A Comparative Study and Measuring Performance of Manufacturing Systems with Mamdani Fuzzy Inference System. J. Intell. Manuf. 2019, 30, 1085–1097. [Google Scholar] [CrossRef]
- Putri, S.N.; Saputro, D.R.S. Construction Fuzzy Logic with Curve Shoulder in Inference System Mamdani. J. Phys. Conf. Ser. 2021, 1776, 012060. [Google Scholar] [CrossRef]
- Devita, R.; Zain, R.H. Ipriadi Fountains Height Measurement Accuracy with Mamdani Fuzzy Inference System Algorithm. J. Phys. Conf. Ser. 2021, 1783, 012009. [Google Scholar] [CrossRef]
- Jamalinia, H.; Alizadeh, Z.; Nejatian, S.; Parvin, H.; Rezaie, V. An Innovative and Improved Mamdani Inference (IMI) Method. In Proceedings of the Advances in Soft Computing; Batyrshin, I., de Martínez-Villaseñor, M.L., Ponce Espinosa, H.E., Eds.; Springer International Publishing: Cham, Switzerland, 2018; pp. 413–422. [Google Scholar]
- Ross, T.J. Fuzzy Logic with Engineering Applications, 4th ed.; Wiley: Southern Gate, UK; Chichester, UK; West Sussex, UK, 2016; ISBN 978-1-119-23586-6. [Google Scholar]
- Ahmed, J.S.; Mohammed, H.J.; Chaloob, I.Z. Application of a Fuzzy Multi-Objective Defuzzification Method to Solve a Transportation Problem. Mater. Today Proc. 2021. [Google Scholar] [CrossRef]
- Kalaiarasi, K.; Sabina Begum, M.; Sumathi, M. Optimization of Unconstrained Multi-Item (EPQ) Model Using Fuzzy Geometric Programming with Varying Fuzzification and Defuzzification Methods by Applying Python. Mater. Today Proc. 2021. [Google Scholar] [CrossRef]
- Jiang, T.; Li, Y. 31—Techniques and Applications of Fuzzy Theory in Generalized Defuzzification Methods and Their Utilization in Parameter Learning Techniques**Portions reprinted, with permission, from IEEE Trans. Fuzzy Systems, Vol. 4, No. 1. pp. 64–71, February 1996, © 2021 IEEE; IEEE Trans. Systems Man. Cybernet., Vol. 27, No. 5, pp. 877–883, October 1997, © 2021 IEEE. In Fuzzy Theory Systems; Leondes, C.T., Ed.; Academic Press: San Diego, CA, USA, 1999; pp. 871–895. ISBN 978-0-12-443870-5. [Google Scholar]
- Sain, D.; Mohan, B.M. Modeling, Simulation and Experimental Realization of a New Nonlinear Fuzzy PID Controller Using Center of Gravity Defuzzification. ISA Trans. 2021, 110, 319–327. [Google Scholar] [CrossRef]
- Borges, R.E.P.; Dias, M.A.G.; Dória Neto, A.D.; Meier, A. Fuzzy Pay-off Method for Real Options: The Center of Gravity Approach with Application in Oilfield Abandonment. Fuzzy Sets Syst. 2018, 353, 111–123. [Google Scholar] [CrossRef]
- Yuan, X.; Liu, Z.; Stanley Lee, E. Center-of-Gravity Fuzzy Systems Based on Normal Fuzzy Implications. Comput. Math. Appl. 2011, 61, 2879–2898. [Google Scholar] [CrossRef] [Green Version]
- Menčík, J. Efficient Tools for Managing Uncertainties in Design and Operation of Engineering Structures. Int. J. Ind. Manuf. Eng. 2010, 4, 179–184. [Google Scholar]
Figure 1.
Fuzzy inference system (adapted from [10]).
Figure 1.
Fuzzy inference system (adapted from [10]).

Figure 2.
Fuzzy FMEA system integration in DMAIC cycle.

Figure 3.
Partial view of the inference rules in MATLAB 2017.

Figure 4.
Partial view of the inference process in MATLAB 2017.

Figure 5.
Process schematic of injection coil 1 production line. The representation by colors are as follows: all the machines on the production line, the plastic injection machines, where the plastic components that make up the part (orange), the assembly stations (Mtg), winding, casting, and final testing are molded (blue) and the visual inspection stations, where the operator inspects the parts or lots at the exit of the critical machines (green).

Figure 6.
An example of the rule viewer for failure mode “Conical winding”.


Table 1.
Linguistic variables and membership functions for severity (S).
| Input | None | Low | Average | High | Dangerous |
|---|---|---|---|---|---|
| Severity (S) | [0, 2, 3] | [2, 3, 4, 5] | [4, 5, 6.5, 7.5] | [6, 7.5, 9] | [7.5, 9, 10] |
Table 2.
Linguistic variables and membership functions for Probability of the event occurring (P).
| Input | Nearly Impossible | Low | Average | High | Almost Certain |
|---|---|---|---|---|---|
| Probability (O) | [0, 1.5, 2.5] | [1.5, 3, 4.5] | [3.5, 4.5, 5.5, 6.5] | [5.5, 7, 8.5] | [7.5, 8.5, 10] |
Table 3.
Linguistic variables and membership functions for Detection (D).
| Input | Almost Certain | High | Average | Low | Nearly Impossible |
|---|---|---|---|---|---|
| Detection (D) | [0, 1.5, 2.5] | [1.5, 3, 4.5] | [3, 4.5, 6] | [4.5, 5.5, 7, 8] | [7, 8, 10] |
Table 4.
Linguistic variables and membership functions for RPN.
| Input | No Importance | Very Few Importance | Few Importance | Average Importance | Important | Very Important |
|---|---|---|---|---|---|---|
| RPN | [0, 100, 200] | [150, 250, 400] | [300, 450, 600] | [400, 550, 700] | [600, 750, 900] | [800, 900, 1000] |
Table 5.
Number of occurrences of potential failure modes with a subjective character in the visual inspection process.
Table 5.
Number of occurrences of potential failure modes with a subjective character in the visual inspection process.
| Feature | Detected Flaws (in units) | Entirety of Inspected Pieces (in units) | Detected Pieces in ppm |
|---|---|---|---|
| Secondary | |||
| Conical winding | 3409 | 1,793,947 | 1900 |
| Lost Thread | 301 | 1,793,947 | 168 |
| Unreadable, incomplete or double marking | 1194 | 1,793,947 | 666 |
| Primary | |||
| Unreadable 2D code | 182 | 716,292 | 463 |
| Assembly | |||
| Poorly inserted core | 332 | 716,292 | 463 |
| Damaged crossbar | 180 | 716,292 | 251 |
| Casting | |||
| High Shot | 2788 | 1,039,030 | 2683 |
| Uneven shot | 948 | 1,039,030 | 912 |
| Contamination in the epoxy | 880 | 1,039,030 | 847 |
| Bubbles in epoxy | 78 | 1,039,030 | 75 |
Table 6.
Comparison between classic RPN and fuzzy RPN.
| Component | # | Failure Mode | Cause | S | P | D | RPN | FMEA Ranking | Fuzzy RPN | Fuzzy FMEA Ranking | Fuzzy RPN Classification |
|---|---|---|---|---|---|---|---|---|---|---|---|
| Cast transformer | 1 | Bubbles in epoxy | C1, C2 & C3 | 9 | 6 | 4 | 216 | 1st | 665 | 2nd | Important |
| Secondary | 2 | Conical spool | C1, C2 & C3 | 9 | 5 | 4 | 180 | 2nd | 673 | 1st | Important |
| Cast transformer | 3 | Epoxy contamination | C3 | 7 | 6 | 4 | 168 | 3rd | 591 | 4th | Average Importance |
| 4 | Epoxy contamination | C2 | 7 | 2 | 8 | 112 | 4th | 648 | 3rd | Average Importance | |
| Primary | 5 | Unreadable D2 code | C2 & C3 | 5 | 5 | 3 | 75 | 5th | 450 | 6th | Low Importance |
| Secondary | 6 | Lost thread | C1,C2 & C3 | 9 | 2 | 4 | 72 | 6th | 513 | 5th | Average Importance |
| Cast transformer | 7 | High shot | C1 & C2 | 6 | 6 | 2 | 72 | 6th | 382 | 8th | Low Importance |
| 8 | High shot | C4 | 6 | 4 | 3 | 72 | 6th | 366 | 9th | Low Importance | |
| 9 | Shot uneven | C2 | 6 | 5 | 2 | 60 | 7th | 334 | 10th | Very Low Importance | |
| 10 | Shot uneven | C3 | 6 | 5 | 2 | 60 | 7th | 335 | 10th | Very Low Importance | |
| 11 | Epoxy contamination | C1 | 6 | 2 | 4 | 48 | 8th | 382 | 8th | Low Importance | |
| Secondary | 12 | Unreadable marking | C1 & C2 | 5 | 3 | 3 | 45 | 9th | 250 | 12th | Very Low Importance |
| Primary | 13 | Unreadable D2 code | C1 | 6 | 2 | 3 | 36 | 10th | 426 | 7th | Low Importance |
| Cast transformer | 14 | Shot uneven | C2 | 6 | 2 | 3 | 36 | 10th | 426 | 7th | Low Importance |
| 15 | High shot | C3 | 6 | 2 | 2 | 24 | 11th | 303 | 11th | Very Low Importance | |
| Assembled transformer | 16 | Poorly inserted core | C1 & C2 | 3 | 1 | 3 | 9 | 12th | 75.2 | 13th | Not Important |
| 17 | Damaged crossbar | C3 | 5 | 1 | 1 | 5 | 13th | 75.2 | 13th | Not Important |
Table 7.
Prioritization obtained by classic FMEA and fuzzy FMEA.
| Classification | Classic FMEA | Fuzzy FMEA |
|---|---|---|
| 1st | Bubbles in epoxy (1) | Conical winding (2) |
| 2nd | Conical spool (2) | Bubbles in epoxy (1) |
| 3rd | Epoxy contamination (3) | Epoxy contamination (4) |
| 4th | Epoxy contamination (4) | Epoxy contamination (3) |
Table 8.
Improvement measures for priority failure modes.
| Component | Failure Mode | Cause | Proposed Improvement for Root Causes | Proposed Improvement for Visual Inspection |
|---|---|---|---|---|
| Secondary | Conical spool | C1: Wire wound incorrectly on the stretcher | Winder equipped with wire tension control sensor | Inspection station equipped with specialized equipment for measuring the transformer voltage with each batch of parts |
| C2: Faulty machine configuration | Any changes to the machine configuration must be approved by the coordinator or technician in charge | Specific operator training for overwinding detection | ||
| C3: Operator did not change transition program | Reformulating work instructions with perceptible real examples | |||
| Cast transformer | Bubbles in epoxy | C1: Too much temperature in the preparation drum | Machine temperature limits well established by the technicians in charge | Inspection station equipped with specialized equipment for measuring the homogeneity of epoxy with each batch of parts |
| C2: Mixer malfunction | Any change in temperature must be approved by the coordinator or technician in charge | |||
| C3: Material too long in preparation vessel | Reduced time between overhaul and maintenance of mixing equipment | Specific operator training for air bubble detection in epoxy | ||
| Controlled environment for epoxy mixing | Rewriting the work instructions with perceptible real-life examples | |||
| Periodic review of epoxy quality | ||||
| Epoxy contamination | C2: Mixer/accumulators/injectors dirty | Cleaning the equipment after each batch of castings | Inspection station equipped with specialized equipment for quantification of the purity of epoxy | |
| Configuring the machines to issue an alert if the installed equipment does not match the product to be leaked | Specific operator training for oil and metal contamination detection | |||
| C3: Lubrication cup leakage | Regular maintenance of the potter configuration | Rewriting the work instructions with perceptible real-life examples |
Publisher’s Note: MDPI stays neutral with regard to jurisdictional claims in published maps and institutional affiliations. |
© 2021 by the authors. Licensee MDPI, Basel, Switzerland. This article is an open access article distributed under the terms and conditions of the Creative Commons Attribution (CC BY) license (https://creativecommons.org/licenses/by/4.0/).
Share and Cite
MDPI and ACS Style
Godina, R.; Silva, B.G.R.; Espadinha-Cruz, P. A DMAIC Integrated Fuzzy FMEA Model: A Case Study in the Automotive Industry. Appl. Sci. 2021, 11, 3726. https://0-doi-org.brum.beds.ac.uk/10.3390/app11083726
AMA Style
Godina R, Silva BGR, Espadinha-Cruz P. A DMAIC Integrated Fuzzy FMEA Model: A Case Study in the Automotive Industry. Applied Sciences. 2021; 11(8):3726. https://0-doi-org.brum.beds.ac.uk/10.3390/app11083726
Chicago/Turabian StyleGodina, Radu, Beatriz Gomes Rolis Silva, and Pedro Espadinha-Cruz. 2021. "A DMAIC Integrated Fuzzy FMEA Model: A Case Study in the Automotive Industry" Applied Sciences 11, no. 8: 3726. https://0-doi-org.brum.beds.ac.uk/10.3390/app11083726
Note that from the first issue of 2016, this journal uses article numbers instead of page numbers. See further details here.