Article

Evaluation of Multivariate Biomarker Indexes Application in Ecotoxicity Tests with Marine Diatoms Exposed to Emerging Contaminants

by
Vanessa Leal Pires
1,2,
Sara C. Novais
2,
Marco F. L. Lemos
2,
Vanessa F. Fonseca
1,3 and
Bernardo Duarte
1,4,*
1
MARE—Marine and Environmental Sciences Centre, Faculdade de Ciências da Universidade de Lisboa, Campo Grande, 1749-016 Lisbon, Portugal
2
MARE—Marine and Environmental Sciences Centre, ESTM, Politécnico de Leiria, 2520-630 Peniche, Portugal
3
Departamento de Biologia Animal, Faculdade de Ciências da Universidade de Lisboa, Campo Grande, 1749-016 Lisbon, Portugal
4
Departamento de Biologia Vegetal, Faculdade de Ciências da Universidade de Lisboa, Campo Grande, 1749-016 Lisbon, Portugal
*
Author to whom correspondence should be addressed.
Submission received: 14 March 2021 / Revised: 14 April 2021 / Accepted: 15 April 2021 / Published: 25 April 2021

Abstract

:

Featured Application

Evaluation of oxidative stress indexes for ecotoxicological evaluation of marine diatoms exposed to emerging contaminants.

Abstract

Worldwide anthropogenic activities result in the production and release of potentially damaging toxic pollutants into ecosystems, thereby jeopardizing their health and continuity. Research studies and biomonitoring programs attend to this emerging problematic by applying and developing statistically relevant indexes that integrate complex biomarker response data to provide a holistic approach, reflecting toxically induced alterations at the organism or population level. Ultimately, indexes allow simple result communications, enhancing policy makers understanding, and contributing to better resource and environmental managing policies. In this study three indexes, the integrated biomarker response index (IBR), the bioeffects assessment index (BAI) and principal components analysis (PCA), were evaluated for their sensitivity in revealing toxically induced stress patterns in cells of the diatom Phaeodactylum tricornutum under contaminant exposure. The set of biomarkers selected for index construction comprised the anti-oxidant enzymes APX, CAT and SOD, and the lipid peroxidation marker TBARS. Several significant correlations with the applied concentration gradients were noticed for all indexes, although IBR excelled for its reliability in delivering statistically significant dose-response patterns for four out of the five tested compounds.

1. Introduction

Daily worldwide spread of pharmaceuticals, pesticides and detergents that endanger the health of natural aquatic ecosystems are of major concern [1,2]. These emerging contaminants have serious implications for the organisms living in aquatic environments, at different biological levels, leading to biochemical, physiological, metabolic, individual and population-level effects [3,4]. These impacts are often addressed from the biochemical point of view, as a starting point for understanding the early effects of these contaminants in the biota, using a collection of biomarkers [5,6,7]. These biomarker responses are used as indicators of health status, which are already considered in international environmental policies [8]. The World Health Organization (WHO) defines biomarkers as biological measurements at the biochemical, cellular or molecular level that result from the interaction between an organism and environmental chemical, physical or biological agents [9].
The applicability of subcellular biomarkers to address pollutants in aquatic ecosystems is currently widely studied. Biomarkers of exposure, such as antioxidant systems, are widely used for their sensitivity within the scope of toxicological studies [10,11]. As chemical pollutants induce oxidative damage to biological systems, the activity levels of antioxidant enzymes, like superoxide dismutase (SOD) and catalase (CAT)—which are vitally involved in the detoxification of reactive oxygen species (ROS) and in the reduction of oxidative stress—can be evaluated and understood [7,10]. Likewise, biomarkers of lipid peroxidation (LPO) are vastly investigated [10], especially through the thiobarbituric acid reactive substances (TBARS) test, which measures the levels of secondary lipid oxidation products, such as malondialdehyde (MDA) formation [12]. This set of biomarkers provides a standing of the overall oxidative stress state of cells under a certain compound exposure at a specific dose [13].
While from the scientific point of view, the mode of action of these antioxidant processes and how they are affected by different emerging contaminants is of upmost importance, these biochemical results are often difficult to communicate to non-scientific communities, such as stakeholders and decision makers [14,15]. The pressing need for methodologies and information that can effectively connect researchers and environmental managers, linked to international environmental frameworks, led to the development of a variety of indexes that can easily communicate scientific results to stakeholders, as applicable tools for decision making in environmental managing [16,17,18]. An array of scoring indexes have emerged in the past few years [16], thus adopting an ecologically transversal approach of great importance in order to develop meaningful community management tools towards addressing contaminants of emerging concern [5,19,20]. Therefore, following biochemical evaluations, new index development must accurately reflect the biological status, follow suitable validation and consider result communication, so that management entities can approach similar new environmental matters within the scope of policy development [16,17]. As mentioned above, several approaches have been developed to translate vast arrays of biochemical data into numeric indexes, such as the integrated biomarker response index (IBR) [5], the bioeffect assessment index (BAI) [19] and the principal component analysis scoring based index (denoted as PCA-index hereafter) [20,21]. These indexes are based on different approaches to the same biochemical data. The IBR index uses the normalization of biochemical data to overcome differences in the magnitude between the different biochemical traits it integrates, and requires expert judgment or previous experience from an operator to define how a certain biochemical trait is altered (enhanced or inhibited) by a given compound [5]. The BAI approach divides each biochemical trait at each exposure level into statistical cohorts, considering quartile distribution, and scoring each biochemical trait accordingly [19]. The PCA index uses the values obtained from a PCA plot of biochemical traits to normalize the values and to weigh each variable according to its importance to the PCA model [20,21]. Thus, these three indexes range from univariate (BAI) to multivariate approaches (IBR and PCA-based indexes), with or without operator intervention (IBR and PCA-based respectively), and a comparative analysis allows to assess which approach is more suitable to be applied in emerging contaminants ecotoxicological studies.
In the present work, the suitability of the three different multivariate indexes (BAI, IBR, and PCA-based indexes) was tested through application of previously obtained oxidative stress biomarker data, using marine diatoms as a study model. The impacts of pharmaceuticals (propranolol [22], fluoxetine [23], ibuprofen [24], detergents (SDS) [25], and herbicides (glyphosate [15])) on primary production and physiological fitness of the marine diatom Phaeodactylum tricornutum were used to understand the suitability of multivariate indexes in depicting dose responses and contaminant types, as well as to evaluate the performance and accuracy of each approach for future ecotoxicological trials. In sum, we intended to produce an index that allows to better communicate toxicity results, providing an easy-to-understand framework, which is accessible to managers and the general public.

2. Materials and Methods

2.1. Diatom Exposure Trials and Biomarker Analysis

Data regarding growth and biomarker activity/concentration were collected from previously published works [15,22,23,24,25]. Phaeodactylum tricornutum Bohlin (Bacillariophyceae; strain IO 108–01, Instituto Português do Mar e da Atmosfera (IPMA)) axenic cell cultures (maintained under asexual reproduction conditions) were placed to grow in f/2 medium [26], under constant aeration in a phytoclimatic chamber, at 18 °C, programmed with a 14/10 h day/night photoperiod (RGB 1:1:1, maximum PAR 80 μmol photons m−2 s−1), a sinusoidal function to mimic sunrise and sunset, and light intensity equal to noon, set to replicate a natural light environment [27]. Exposure trials were conducted according to the Organization for Economic Cooperation and Development (OECD) recommendations for algae assays [28], with minor adaptations, and as described in [15,22,23,24,25]. Briefly, cultures were exposed to the compounds and target concentrations for 48 h. Target concentrations were selected aiming to cover a concentration gradient reflecting, not only the detected environmental concentrations found in the literature, but also concentrations known to have significant biological effects in P. tricornutum [29,30]. Growth inhibition concentration (IC50) was calculated according to the OECD guidelines for the algae inhibition test [28]. Biomarker analysis was performed according to standard spectrophotometric procedures as described in [15,22,23,24,25]. Briefly, catalase (CAT), ascorbate peroxidase (APx) and superoxide dismutase (SOD) activities were assayed by spectrophotometric means using specific substrates as previously described [31,32,33]. Lipid peroxidation products were analyzed spectrophotometrically [34], using trichloroacetic acid extraction before the reaction with thiobarbituric acid.

2.2. Multivariate Index Calculation

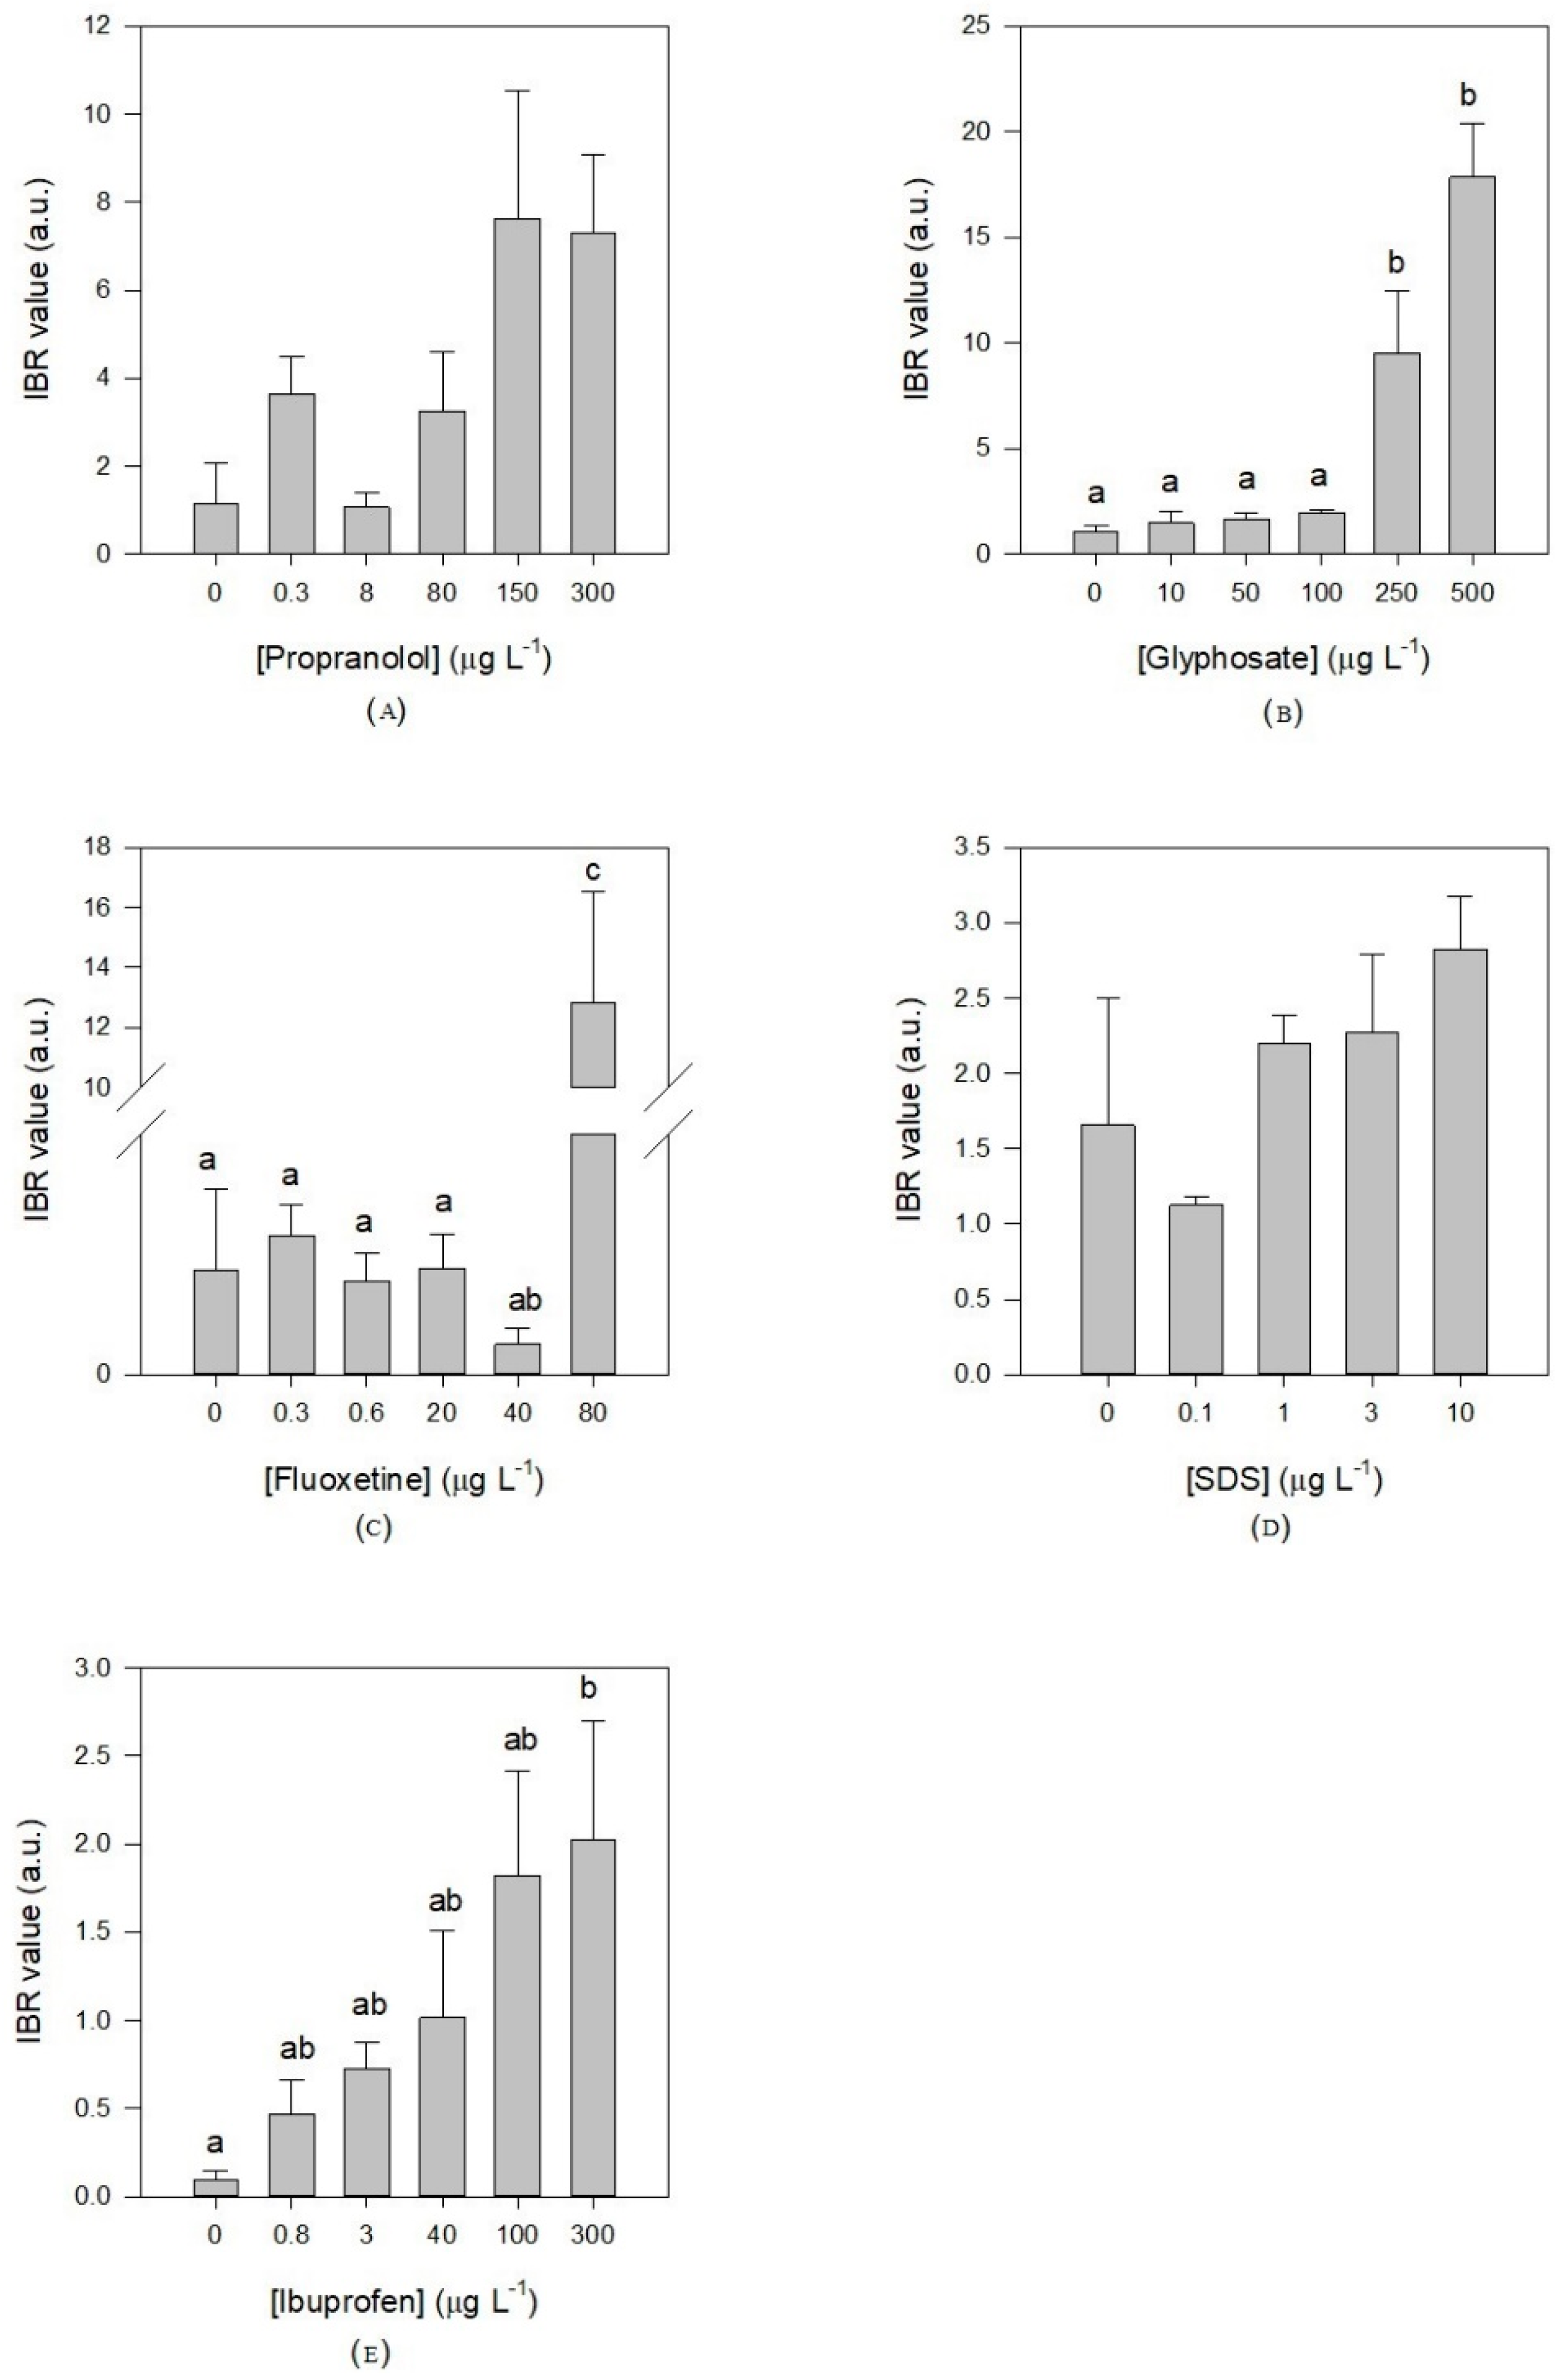
2.2.1. Integrated Biomarker Response (IBR) Index

The IBR index was calculated for each tested compound according to Beliaeff and Burgeot (2002) [5], posteriorly adapted by Broeg and Lehtonen (2006) [35]. Briefly, it was calculated by summing up triangular star plot areas calculated for each two neighbouring variables. To calculate IBR integrating all biomarkers, data of each biomarker were standardized to obtain Y as:
Y = X m s
where X is the value for each biomarker replicate within a given concentration, m is the general mean of all data (including concentrations) regarding a given biomarker, and s is the standard deviation of the biomarker data for a given treatment/concentration. Then Z was calculated using Z = −Y or Z = Y, in the case of a biological effect corresponding respectively to an inhibition or a stimulation and it was determined using the slope of the biomarker activity/concentration towards the applied exogenous concentration. Positive slopes corresponded to a stimulation, while negative slopes corresponded to an inhibition. Regarding the biological effect, biomarkers can either increase or decrease depending on the type and concentration of the compound exposure, but they can also vary among organisms.
Subsequently, the score (S) was calculated as
S = Z + | M i n |
where, S ≥ 0 and |Min| is the absolute value for the minimum value for all calculated Y for a given biomarker at all the made measurements (again all concentrations considered). Star plots were then used to display score results (S) and to calculate the IBR index as:
I B R = t = 15 n A i
Ai is the area between two consecutive clockwise scores in a given star plot:
A i = S i 2 sin β ( S i cos β + S i + 1 sin β )
β = tan 1 S i + 1 sin α S i S i + 1 cos α
where Si and Si+1 are two consecutive clockwise scores of a given star plot; n the number of biomarkers used and α:
α = 2 π n

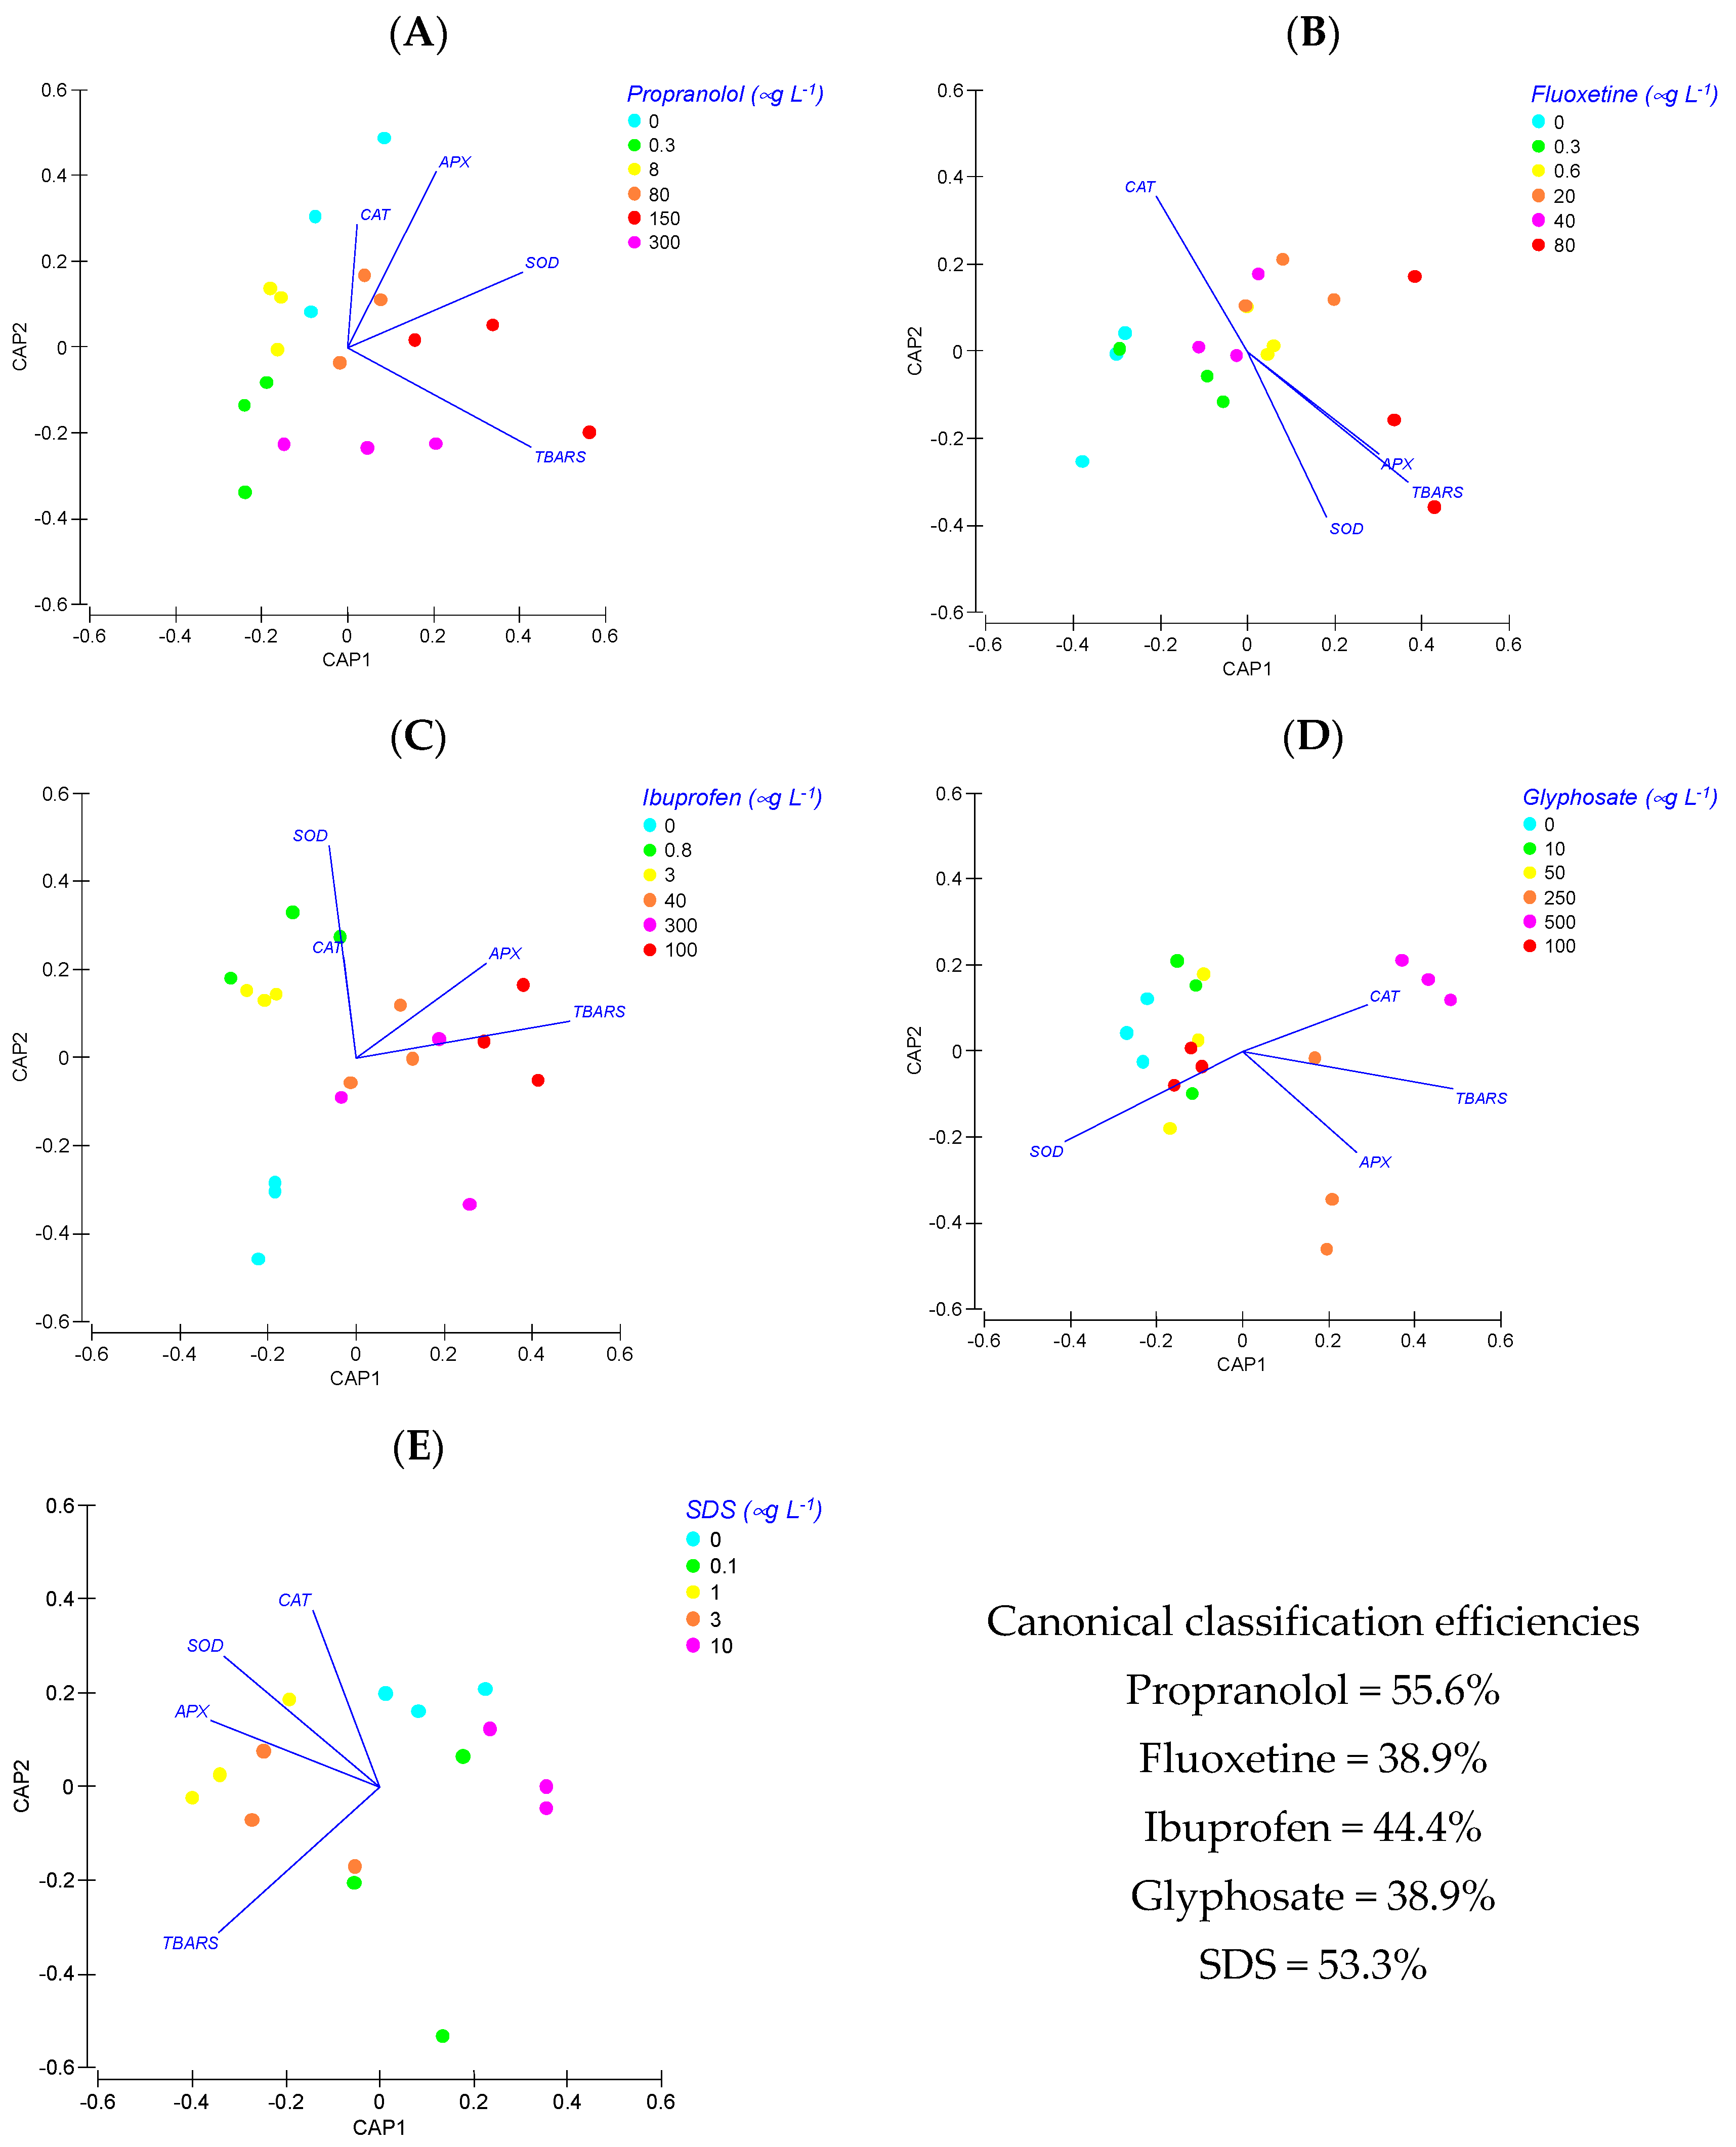
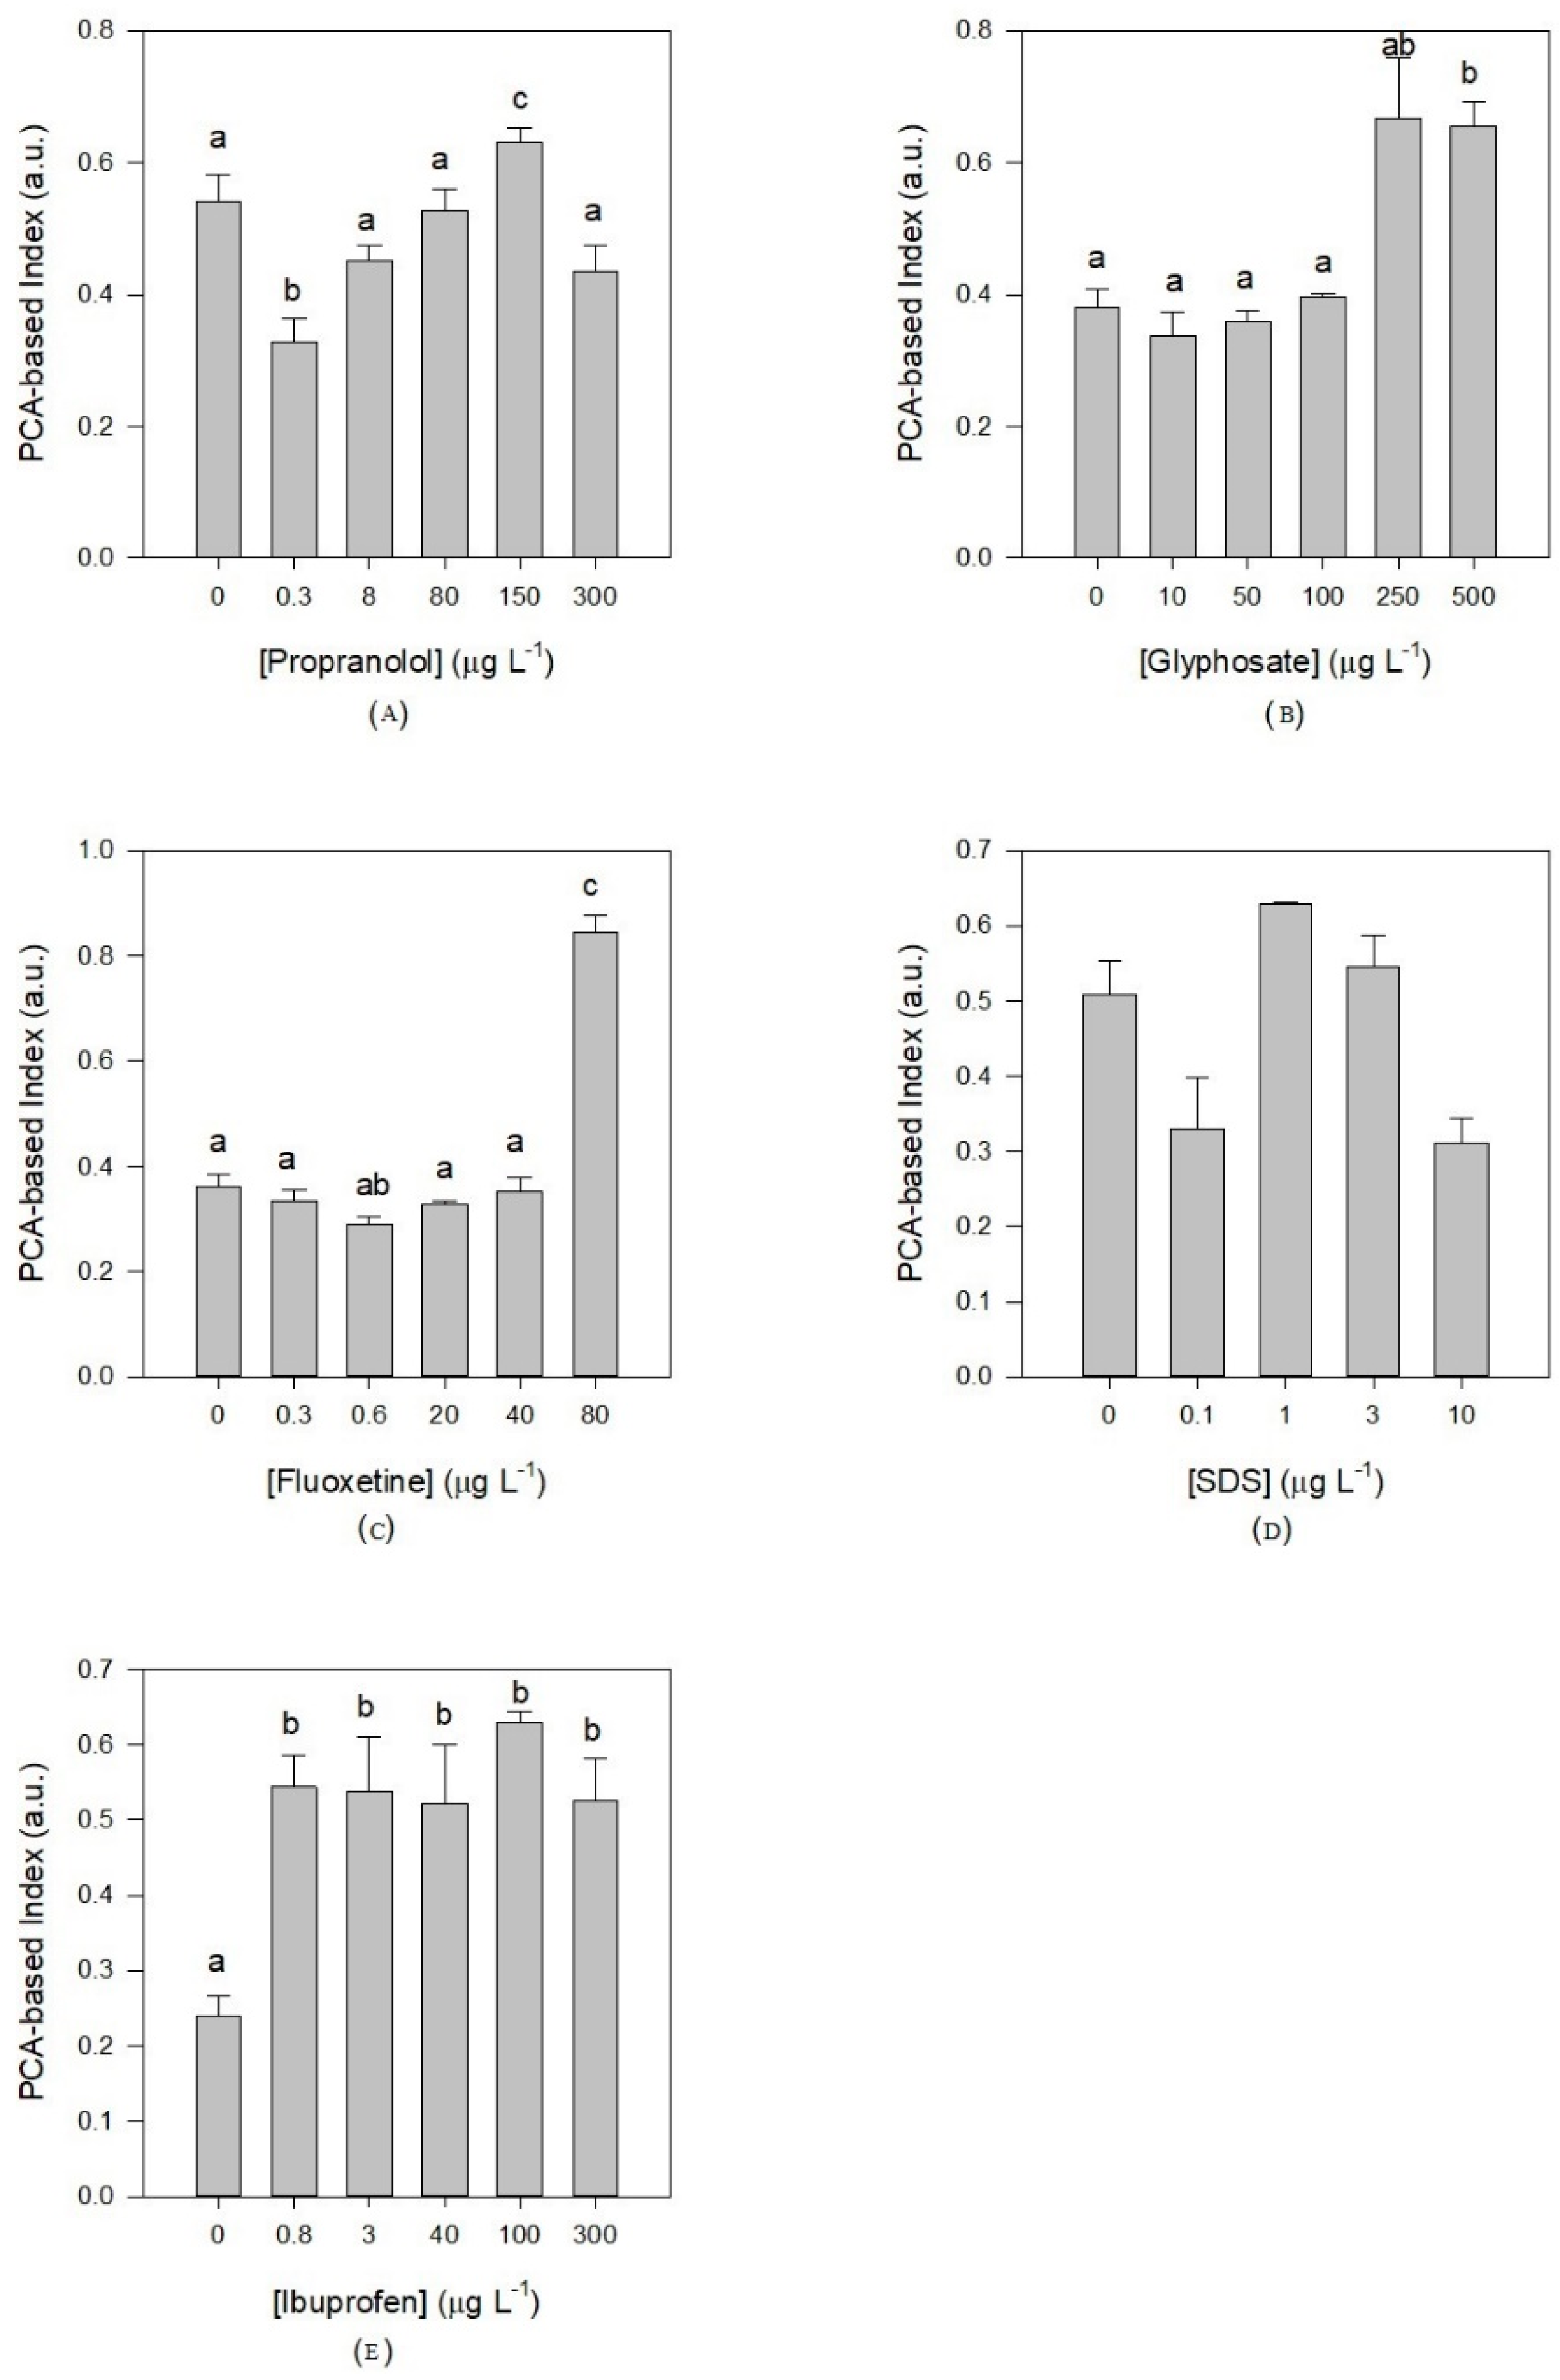
2.2.2. Principal Component Analysis (PCA)-Based Index

To assess which variables were more suitable for the index elaboration and implementation, a previously successfully tested statistical approach was used [20,21,36]. This was preformed independently for each compound. Principal component analysis (PCA) was performed in order to select the appropriate measured parameters to integrate the index. For this selection, the five variables with higher weighing factors from the factor axis with higher explanatory value percentages were chosen [21]. PCA was performed after data normalization and transformation using PRIMER 6 [37]. The PCA-based index is defined as:
P C A b a s e d   i n d e x =   W i E i
where W is the PCA weighing factor of the PCA selected variable and E its respective score. The scores were normalized using a sigmoidal equation limited from 1 to 0, as follows [21,36,38]:
E = a 1 + x x 0 b
where x is the variable verified value, a is the maximum score of the variable (in this case 0.535 so that the final index has 1 as its maximum value), x0 is the average value of the variable and b is the value of the slope of the equation. The slope was defined as −2.5 for the better-adjusted curve tending to 1 for all the variables proposed.

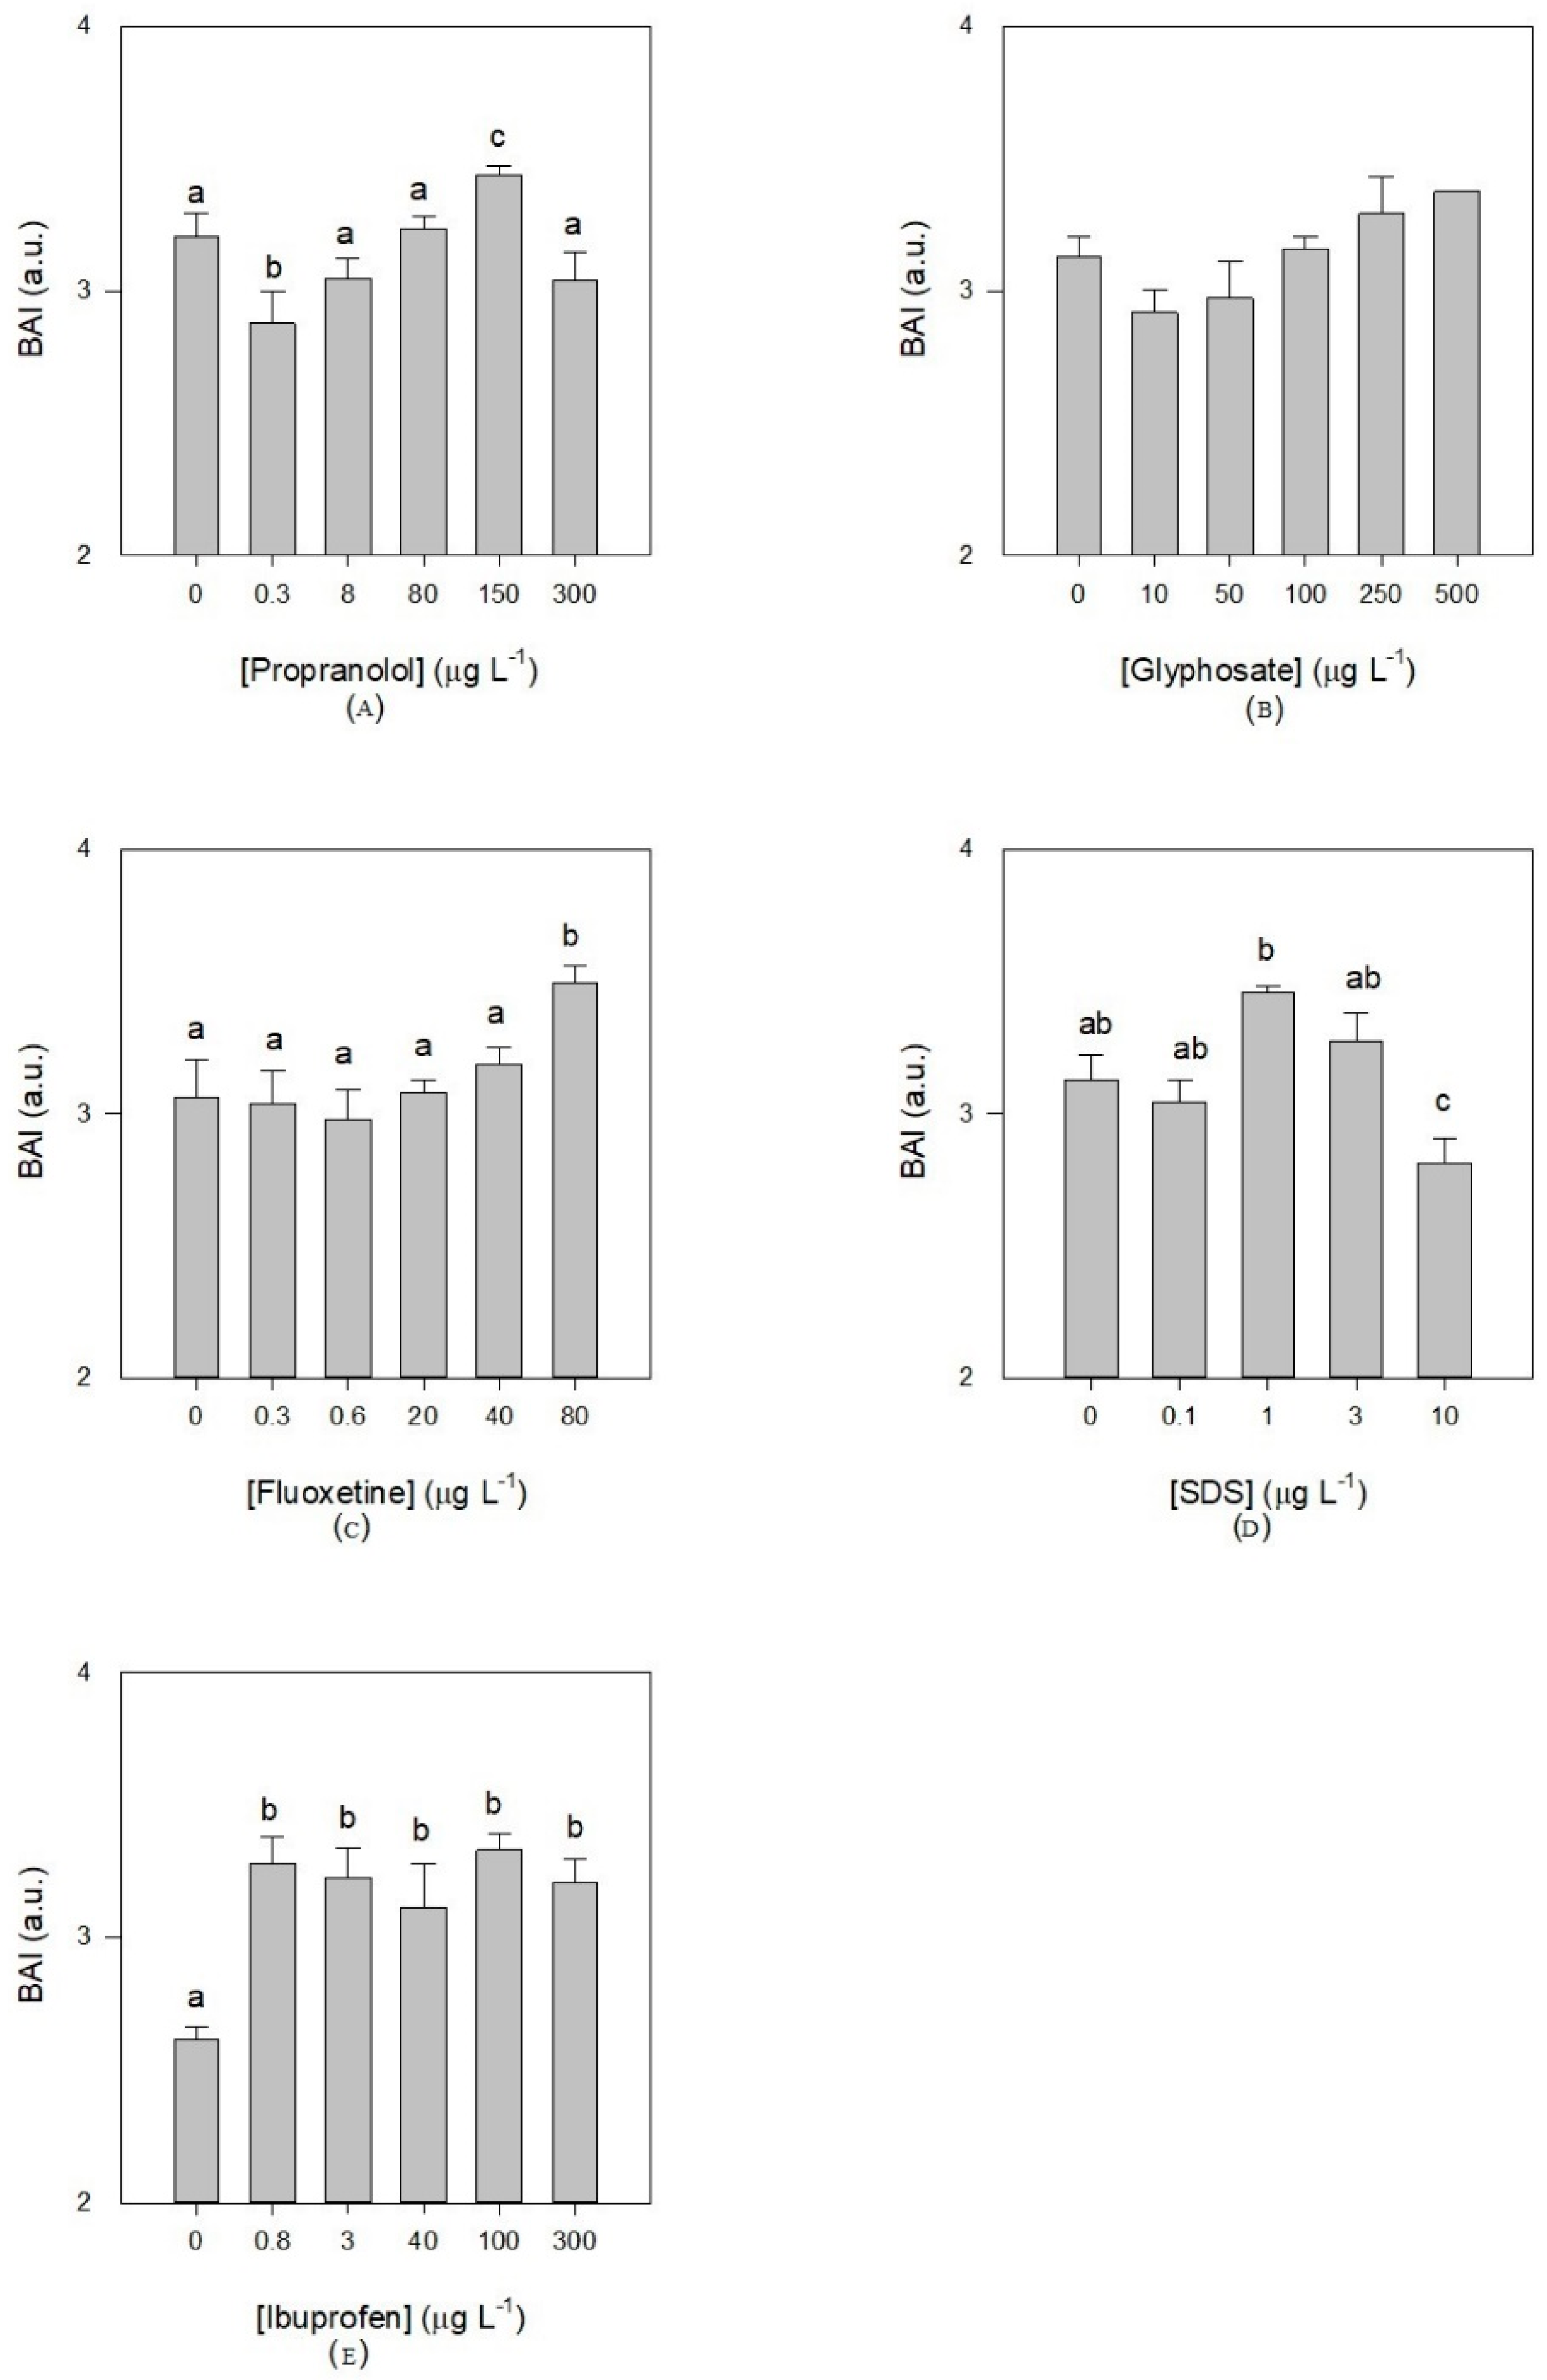
2.2.3. Bioeffect Assessment Index (BAI)

Numerical values were assigned to the index variables, based on the degree or severity of damage to an organ or tissue caused by environmental stressors [19]. The BAI was designed as an index for the assessment of multifactorial contamination situations of coastal areas. Thus, it only includes biomarkers of general toxicity [19]. To assess the individual values of each biomarker within the BAI stages, biomarker population quartils were determined. The index value of biomarker (Biomarkerindex) was attributed, depending on the quartil interval of each value:
  • Values > 3rd quartile: 40
  • Values between 3rd and 2nd quartiles: 30
  • Values between 2nd and 1st quartiles: 20
  • Values < 1st quartile: 10
The BAI value results from:
B A I =   B i o m a r k e r i n d e x 1 / n
where n is the number of biomarkers used for index calculation.

2.3. Statistical Analysis

Owing to the absence of normality and homogeneity of variances in our data, pairwise comparisons between different sample groups were assessed through non-parametric Kruskal–Wallis tests. Spearman correlation tests were performed to evaluate if there was a dose–response behavior between the exogenous concentrations tested and the biomarker variables. Both Kruskal–Wallis and Spearman tests were performed using Statistica software (StataSoft, version 12.5.192.7). Statistical significance was considered at p < 0.05. A multivariate approach was employed to test for variations in the complete oxidative stress data package [23,38,39]. Canonical analysis of principle (CAP) coordinates, using Euclidean distances, were preformed to plot in a canonical space the dissimilarities regarding biomarker studied variables while preforming a cross-validation step and determining the allocation efficiency into the different treatment groups. This multivariate methodology is unaffected by heterogeneous data and is frequently used to compare different sample assemblies using the inherent features of each assembly (metabolic traits) [39,40,41,42]. Multivariate statistical analyses were performed using Primer 6 software (version 6.1.13, Plymouth, UK) [37].

3. Results

3.1. Diatom Growth and Ecotoxicological Parameters (IC50)

Data on the exposure concentration and toxicity of five contaminants that inhibit the growth of the marine diatom P. tricornutum were obtained from previous studies [15,22,23,24,25] and are presented in Table 1. According to the IC50 values, which refer to the exposure concentration capable to inhibit half of the maximum growth in this marine diatom, SDS and fluoxetine are the most toxic compounds tested in P. tricornutum, with the lowest IC50 values of the tested cultures (<50 μg L−1). In opposition, ibuprofen appears as the least toxic compound tested, with the highest dose (ca. 350 μg L−1) needed to reduce to half the growth of P. tricornutum.

3.2. Oxidative Stress Biomarkers

To evaluate potential cell damage due to oxidative stress conditions induced by contaminant exposure, several oxidative stress biomarkers were evaluated in the diatom cells exposed to different pollutant levels. Oxidative stress biomarker values (average ± std deviation), linear regression slope and the statistical relation between each biomarker and the external concentration of the different contaminants applied are presented in Supplementary Material Table S1. Further discussion on the biological considerations of these results can be found in the studies contributing to the present work [15,22,23,24,25]. To study the dose-response relationship of each of the analyzed biomarkers, correlations between the biomarker response and the exogenous dose applied were also determined (Supplementary Material Table S1). Propranolol gradient concentrations showed a positive dose relationship for SOD antioxidant enzyme (r2 = 0.87, p < 0.05) and TBARS (r2 = 0.72, p < 0.05), whereas CAT and APX showed no significant relation to this compound. A significant rise in lipid peroxidation products (TBARS) was observed in P. tricornutum cells exposed to fluoxetine concentration gradient, revealing a positive and significant correlation (r2 = 0.73, p < 0.05). Among the tested antioxidant enzymes, SOD and APX followed a similar a trend similar to the lipid peroxidation, though not significant, but showing the highest activity levels under the highest applied concentration (80 µg L−1), whereas CAT activity did not respond to any of the exogenous fluoxetine concentrations. A positive correlation with the applied exogenous ibuprofen dose is shown for TBARS (r2 = 0.77, p < 0.05) and APX activities (r2 = 0.62, p < 0.05). On the other hand, CAT and SOD antioxidant enzymes were irresponsive to this contaminant concentration variation. Glyphosate exposure revealed a positive correlation to APX (r2 = 0.60, p < 0.05) and TBARS (r2 = 0.92, p < 0.05) activities, where TBARS activity levels showed an increasing trend up to the maximum glyphosate exogenous concentration (500 µg L−1). CAT antioxidant enzyme revealed no correlation to glyphosate exposure but a great increase in activity under the applied highest concentration (500 µg L−1). SOD activity decreased as the compound concentration increased, revealing a negative but significant dose–response correlation (r2 = 0.64, p < 0.05). The applied set of oxidative stress biomarkers showed no correlation to the exogenous SDS exposure concentrations applied to the P. tricornutum cell culture.
To determine the efficiency of the considered biomarkers in classifying the sample exposures, a multivariate canonical analysis was conducted for each of the studied compounds (Figure 1). Fluoxetine (Figure 1B) and glyphosate (Figure 1D) multivariate analysis revealed the lowest classification efficiency of the samples (38.9%) using the considered biomarkers. This was attributed to a high degree of misclassification of the samples exposed to intermediate concentrations, indicative of a low impact of these compounds at these concentrations on the considered biomarkers. On the other hand, the assessed biomarkers in the cells exposed to propranolol (Figure 1A) and SDS (Figure 1E) were able to provide a correct classification of more than half of the evaluated samples (55.6% and 53.3%, respectively). Once again, in intermediate concentrations the considered biomarkers had lower efficiency in classifying the samples, due to possible reduced impacts of these compounds in intermediate concentrations.

3.3. Oxidative Stress Biomarkers Indexes

To evaluate the applicability of these biomarkers in multivariate indexes, towards a better communication of the overall effect of each tested compound, three index approaches were undertaken: the Integrated biomarker response (IBR) index; the principal component analysis (PCA)-based index; and the bioeffect assessment index (BAI).
The IBR index applied to biomarker results on propranolol and SDS contaminant exposure gradient, showed no significant variance between the exogenous concentrations tested (Figure 2A,D respectively). Nevertheless, a trend can be noticed for both pollutants, as the highest index values reflected higher concentrations. For the glyphosate exogenous concentration gradient, IBR scores showed significant increases on index values at 250 µg L−1 and 500 µg L−1 exposure concentrations (Figure 2B), akin to fluoxetine (Figure 2C) delivering a significantly higher index value at 80 µg L−1 concentration, suggesting a significant dose–response tendency for both pollutants. Concerning exposure to ibuprofen (Figure 2E), the IBR index revealed a significantly higher score at the maximum tested concentration of 300 µg L−1, and in fact, this increase reflects a high significant positive trend alongside the exogenous ibuprofen gradient.
Regarding PCA-based index results for propranolol exposure, a significantly lower value was found in cultures exposed to 0.3 µg L−1, whilst the highest significant value was verified at 150 µg L−1 of propranolol concentration (Figure 3A). For glyphosate and fluoxetine exposure (Figure 3B,C respectively), the PCA-based index attributes a significantly higher score at the maximum concentrations of 500 µg L−1 and 80 µg L−1, respectively, evidencing a positive correlation with both exogenous concentrations of these contaminants. Concerning SDS detergent (Figure 3D), PCA-based index scores did not show any significant variance under the increasing contaminant exposure gradient. On the other hand, in relation to ibuprofen (Figure 3E), significant and approximate high index values are presented for cultures exposed to 0.8 µg L−1 ibuprofen and all the concentrations above.
For the propranolol exposure gradient, the BAI index provided similar results as the abovementioned PCA-based index, where a significant low index value is attributed to the minimum exogenous concentration of 0.3 µg L−1, and a significant index value increase was registered under the application of 150 µg L−1 of propranolol, underlining a positive trend for dose–response (Figure 4A). Regarding glyphosate, BAI was unsuccessful to provide significant values for the evaluation of antioxidant stress response under this contaminant exposure gradient (Figure 4B). However, a slight increase in the index values was followed by an increase in the contaminant concentration. Considering fluoxetine, BAI index values were only found to be considerably higher in the cells exposed to 80 µg L−1, the maximum contaminant concentration applied (Figure 4C). For the SDS detergent, a significantly higher index value is obtained in the cells exposed to 1 µg L−1 SDS, whereas an inverse trend is noticed for the maximum exogenous concentration, with significantly lower index scores, suggesting a noteworthy inhibition of the activity levels of the antioxidant enzymes in the cells exposed to 10 µg L−1 SDS (Figure 4D). Applied to ibuprofen exposure data, the BAI index classifies the response to contaminant concentration gradient similarly to the PCA-based index, attributing substantial and approximately high scores for cells exposed to 0.8 µg L−1 ibuprofen and all the concentrations above, without the suggestion of a dose–response trend (Figure 4E).
In order to provide a comparison of the obtained index results, a visual exploration of the correlations between the exogenous contaminant concentrations and the suitability of the subjected indexes is presented in Figure 5, shown as cluster heat maps. These clusters display the statistical significances of the associations between the considered variables and allow the evaluation of dataset quality. When comparing the IBR values with the exogenous concentration a significant positive dose–response correlation was found in the cells exposed to propranolol, ibuprofen, glyphosate and SDS, while for fluoxetine the inverse trend could be observed (Figure 5). If the same approach is performed for the PCA-based index it is possible to observe the values of this index in the cells exposed to ibuprofen and glyphosate, present an inverse significant dose–response relationship with the exogenous dose for these compounds. As for the BAI values, these showed only significant correlations with the exogenous dose applied in the cells exposed to fluoxetine and glyposhate. It is also noticeable that, in most cases, the majority of the indexes also present significant correlations between them.

4. Discussion

In the present work, selected biomarker data from five ecotoxicological contributions on emerging contaminants (three pharmaceuticals, one detergent and one herbicide), were subjected to integrated response analyses using three methods, the integrated biomarker response (IBR) [5], the principal components analysis (PCA)-based index and the bioeffect assessment index (BAI) [19], to devise which could be more suitable in delivering an accurate measurement on the physiological stress response of diatom cell cultures under pollutant exposure.
Greater emphasis on evaluating the suitability of the already existing indexes prior to developing new ones is essential [16]. The set of biomarkers should be selected with flexibility considering cell function, biological level and pollutant affinity, in order to calculate relevant integrated responses of organisms to different contamination compounds, given that certain marker responses could emphasize certain functions or systems, while other levels of sensitivity could be at stake. Additionally, attention to the proper interpretation of biomarker responses integrating the index construction as parameters, and later, interpreting the derived index scores, is paramount [35]. In sum, a representative index is able to expose toxically induced response trends in natural systems which, therefore, are relevant to policy resolutions.
Previous contributions concerning aquatic environmental contamination, based their analysis on biomarker responses, proving that the adverse effects resulting from a wide variety of pollutants can be evaluated based on an array of specific and general exposure biomarkers, such as oxidative stress biomarkers, exhibiting sensitivity and accuracy in developing valid results [6,43], which are essential for the correct computation of the indexes [35]. Here, the efficiency of the applied set of biomarkers was determined by CAP (canonical analysis of principal coordinates) multivariate statistical approach. The antioxidant enzymes CAT, SOD and APX, and the non-enzymatic TBARS oxidative stress biomarkers, involved in the stress response physiological processes of a cosmopolitan marine diatom species, Phaeodactylum tricornutum, revealed an overall suitability for characterizing the different exogenous contaminants and the applied concentration gradients. This set of biomarkers produced statistically significant dose–response relations for four out of the five pollutants, fitting the experimental purpose, as determined by CAP efficiency results.
The IBR index is one of the most widely used and proficient indexes for evaluating good ecological status and contamination levels of sites and in fact, available literature on biological effects following chemical exposure integrate the IBR index as an important tool for contamination assessment [5,6,7,35,44,45,46,47]. IBR appears as a useful tool to mark pollution in field assessments, as it reflects contaminant levels at sites, despite the variability of biomarkers used for its calculation. Field and biomonitoring studies, concerning environmental pollution, rely on IBR for result support [48,49,50,51,52]. Fewer laboratory studies testify to IBR’s applicability within the scope of treatment comparisons [47,53].
One of the premises of the IBR index is the “user judgment step”, as one should decide the weight of each biomarker for the index construction a priori, as it may positively or negatively influence the index, depending on an induction or an inhibition in terms of physiological response to contamination. In the present work, the decision was based on the statistical relation of each biomarker alongside a gradient of contaminant concentrations [5]. This is the only empirical step of the IBR index, and can also be its weakness, putting at stake the index’s reliability as it is highly dependent on a user’s expert judgement and on data availability. As was previously observed, the same biomarker can have different responses depending on the species and on the tested compound and thus this attribution of a positive or negative influence has to be greatly based on experimental data [54,55]. As the IBR index integrates multiple biomarker scores through standardization of diverse biological responses, it enables direct comparisons among contaminants and performs suitable scores for the set of selected biomarkers. In the end, the complex collected data are presented within a scoring framework, where high values represent environmental stress and low values represent a lack of stress or inhibition. The results of IBR data analysis in this study were consistent and reflected the overall oxidative stress conditions induced in P. tricornutum cells by the exogenous contaminants, translating the expected response of the cell physiological mechanisms to overcome stressful contaminated conditions. Higher index values were attributed to higher pollutant concentrations, which conforms with the general assumption of IBR, revealing statistically significant dose-response trends for four out of the five harmful compounds examined. Our considerations on IBR’s advantages and disadvantages must consider some factors: (i) a relatively large set of biomarkers is recommended as the higher the number of biomarkers, the more significant the index becomes [35,44]; (ii) it is recommended to classify which markers can be combined for IBR, differentiating effect and defense responses [35]; (iii) to compare spatial and temporal series of datasets, new data should be normalized and incorporated together with previously obtained numerical values, since the numerical values of IBR are comparable only within each dataset, [35]; (iv) IBR values must be interpreted in combination with individual biomarker scores [7,47]; and (v) IBR is appropriate for qualitative assessments [50]. In this context, IBR constitutes a robust and practical tool to assess the susceptibility of P. tricornutum cells to contaminants using multiple biomarker responses.
The BAI index came into existence as a modification of the “health assessment index” (HAI) [56], intending to assess contamination levels for coastal areas. It integrates only biomarkers of general toxicity, leading to a more holistic approach since the use of biomarkers that are non-specific to toxic effects allow the index to respond to a wider set of chemicals [19]. This is a valuable characteristic for an environmental health index, as the anthropogenic sources of contamination comprise a complex mixture of pollutants and tend to show an exponential worldwide increase [16]. The BAI index has confirmed its suitability to address alterations at different bio-organizational levels, reflecting general toxicity patterns and revealing health status under polluted conditions, capturing degradative and restorative information on routine monitoring programs and allowing comparison between geographically distinct areas with differing contamination conditions [6,19,34,35]. The BAI index, a univariate statistical approach, transforms complex alterations of biomarkers into single classes of values, losing some of the original data variability, so the combination of BAI analysis with other integrative index approaches is frequently applied for assessment protocols [6,45]. The BAI index revealed low sensitivity against our data set, confirming its scope of applicability as more adequate for general toxicity biomarkers and parameters of non-specific stress, as suggested in the literature [35], while present results were constructed from specific exposure oxidative stress biomarkers. The BAI index exhibited a significant correlation to the PCA-based index, both indexes suggesting similar stress patterns under the application of all contaminant gradients. On the other hand, comparisons between the BAI index and the IBR index reflected the dissimilarities of these index productions, as, generally, IBR will be based on parameters of general health biomarkers or complemented with specific biomarkers, whereas the BAI takes only general toxicity markers [35]. Still, the BAI results support an overall significantly negative relation between index scores and pollutant concentration gradients, confirmed particularly for fluoxetine and glyphosate.
The PCA is a multivariate statistical technique, familiar in terms of the identification of environmental pollution patterns and in the discrimination of the main variables responsible for the variance of chemical accumulation in organisms and consequential biological effects and, thus, is largely applied for the development of interpretative models of pollution data for decision makers [48,57,58,59]. PCA is an effective tool when applied to high-dimensional data sets, reducing their dimensionality while identifying the patterns between the inter-related variables, retaining as much as possible the variability of the original data set [60,61]. Additionally, PCA demonstrates applicability for index construction, selecting the appropriate measured parameters to integrate the index and identifying the main axes of variance within a dataset [60,62,63]. Improved interpretation on other indexes results, such as the IBR index, may be supported by the application of PCA analysis [48]. A correct PCA procedure assumes: (i) large complex datasets; (ii) the normalization and/or standardization of the original data should be considered; (iii) biomarker weigh and influence are set solely based on statistical results; and (iv) patterns are suggested without reference to prior knowledge about the samples; thus, it is also recommended for scaling to not be adjusted to match prior knowledge of the data. Nevertheless, limitations on PCA applicability should be considered on output interpretation, which are, according to Lever et al. (2017) [63]: (a) the assumption of a linear underlying structure of the data, (b) highly correlated patterns may be undetermined due to the resultant uncorrelated principal components (axes of variance), and (c) maximizing variance is the objective rather than clustering results. When applied to our dataset, PCA satisfactorily delivered a significant negative correlation for the overall experiment relative to compound concentration and index scores, particularly for ibuprofen and glyphosate gradients. In fact, the observed trend was identical to using either the PCA or BAI indexes, which were statistically positively correlated. PCA relies on data variance to create next step assumptions, and a large dataset delivers better results with this statistical method.

5. Conclusions

This study provides information about the suitability and reliability of three biological indexes in pollution monitoring research. An adequate index provides an integrative approach, constructed with the integration of multi-biomarker response data, to better clarify the links between contaminant exposure and biological effects in aquatic systems. The potential use of stress biomarkers in biological effects studies is highlighted.
Overall, the three indexes addressed in the present study (IBR, PCA and BAI) could be successfully applied for the evaluation of environmental quality, given that all of them depicted the response triggered by the tested pollutants under varying concentration gradients, reflecting disruption in the cell physiological processes by contamination, and providing a simplified output of the biomarker data despite their varying sensitivities and resolutions. IBR performed the best, successfully reflecting the expected level of exposure, thus revealing the stress patterns exposed by the set of specific oxidative stress markers here selected, under a contaminant gradient, corroborating it as a suitable tool for the assessment of the biological effects of pollution in marine organisms. IBR combines multibiomarker responses, delivers a qualitative approach and provides temporal assessment of contamination patterns.
Open access publications examining the applicability of the already available tools for pollution assessment, such as the present, improve scientific communication and efficiency within the research community, sustaining result communication to the general public and bringing great advantages for management deliberations.

Supplementary Materials

Author Contributions

Conceptualization, B.D. and V.F.F.; formal analysis, B.D. and V.F.F.; writing—original draft preparation, V.L.P.; writing—review and editing, B.D., V.F.F., S.C.N. and M.F.L.L.; project administration, B.D.; funding acquisition, B.D. All authors have read and agreed to the published version of the manuscript.

Funding

The authors would like to thank Fundação para a Ciência e a Tecnologia (FCT) for funding the research via project grants PTDC/MAR-EST/3048/2014 (BIOPHARMA), PTDC/CTA-AMB/30056/2017 (OPTOX), UIDB/04292/2020 and UID/MULTI/04046/2019. Work was also funded by the Integrated Programme of SR&TD SmartBioR (reference Centro-01-0145-FEDER-000018), co-funded by Centro 2020 program, Portugal 2020, European Union, through the European Regional Development Fund. B. Duarte and V. F. Fonseca were supported by researcher contracts (CEECIND/00511/2017 and DL57/2016/CP1479/CT0024).

Institutional Review Board Statement

Not applicable.

Informed Consent Statement

Not applicable.

Data Availability Statement

Data available upon request.

Conflicts of Interest

The authors declare no conflict of interest. The funders had no role in the design of the study; in the collection, analyses, or interpretation of data; in the writing of the manuscript, or in the decision to publish the results.

References

  1. Asimakopoulos, A.; Bletsou, A.; Thomaidis, N. Emerging contaminants: A tutorial mini-review. Glob. Nest J. 2012, 14, 72–79. [Google Scholar]
  2. EUROSTAT. EUROSTAT. Available online: https://ec.europa.eu/eurostat/statisticsexplained/index.php?title=Archive:Chemicals_production_statistics&oldid=199190 (accessed on 11 February 2021).
  3. Duarte, B.; Caçador, I. Ecotoxicology of Marine Organisms, 1st ed.; Duarte, B., Caçador, I., Eds.; CRC Press: Boca Raton, FL, USA; Taylor & Francis Group: Abingdon-on-Thames, UK, 2019; ISBN 1138035491. [Google Scholar]
  4. Lopes, D.G.; Duarte, I.A.; Antunes, M.; Fonseca, V.F. Effects of antidepressants in the reproduction of aquatic organisms: A meta-analysis. Aquat. Toxicol. 2020, 227, 105569. [Google Scholar] [CrossRef]
  5. Beliaeff, B.; Burgeot, T. Integrated biomarker response: A useful tool for ecological risk assessment. In Proceedings of the Environmental Toxicology and Chemistry; SETAC Press: Pensacola, FL, USA, 2002; Volume 21, pp. 1316–1322. [Google Scholar]
  6. Schettino, T.; Caricato, R.; Calisi, A.; Giordano, M.E.; Lionetto, M.G. Biomarker Approach in Marine Monitoring and Assessment: New Insights and Perspectives. Open Environ. Sci. 2012, 12. [Google Scholar] [CrossRef] [Green Version]
  7. Duarte, I.A.; Reis-Santos, P.; França, S.; Cabral, H.; Fonseca, V.F. Biomarker responses to environmental contamination in estuaries: A comparative multi-taxa approach. Aquat. Toxicol. 2017, 189, 31–41. [Google Scholar] [CrossRef]
  8. European Comission. European Comission Marine Strategy Framework Directive (MSFD); Europen Comision: Luxembourg, 2017. [Google Scholar]
  9. WHO. Biomarkers and Risk Assessment: Concepts and Principles, Environmental Health Criteria; WHO: Geneva, Switzerland, 1993. [Google Scholar]
  10. Valavanidis, A.; Vlahogianni, T.; Dassenakis, M.; Scoullos, M. Molecular biomarkers of oxidative stress in aquatic organisms in relation to toxic environmental pollutants. Ecotoxicol. Environ. Saf. 2006, 64, 178–189. [Google Scholar] [CrossRef]
  11. Livingstone, D.R. Contaminant-stimulated reactive oxygen species production and oxidative damage in aquatic organisms. Mar. Pollut. Bull. 2001, 42, 656–666. [Google Scholar]
  12. Draper, H.H.; Squires, E.J.; Mahmoodi, H.; Wu, J.; Agarwal, S.; Hadley, M. A comparative evaluation of thiobarbituric acid methods for the determination of malondialdehyde in biological materials. Free Radic. Biol. Med. 1993, 15, 353–363. [Google Scholar] [CrossRef]
  13. Anjum, N.A.; Duarte, B.; Caçador, I.; Sleimi, N.; Duarte, A.C.; Pereira, E. Biophysical and biochemical markers of metal/metalloid-impacts in salt marsh halophytes and their implications. Front. Environ. Sci. 2016, 4, 24. [Google Scholar]
  14. Borja, A.; Bricker, S.B.; Dauer, D.M.; Demetriades, N.T.; Ferreira, J.G.; Forbes, A.T.; Hutchings, P.; Jia, X.; Kenchington, R.; Marques, J.C.; et al. Overview of integrative tools and methods in assessing ecological integrity in estuarine and coastal systems worldwide. Mar. Pollut. Bull. 2008, 56, 1519–1537. [Google Scholar] [CrossRef]
  15. De Carvalho, R.C.; Feijão, E.; Matos, A.R.; Cabrita, M.T.; Novais, S.C.; Lemos, M.F.L.; Caçador, I.; Marques, J.C.; Reis-Santos, P.; Fonseca, V.F.; et al. Glyphosate-based herbicide toxicophenomics in marine diatoms: Impacts on primary production and physiological fitness. Appl. Sci. 2020, 10, 7391. [Google Scholar] [CrossRef]
  16. Borja, A.; Dauer, D.M. Assessing the environmental quality status in estuarine and coastal systems: Comparing methodologies and indices. Ecol. Indic. 2008, 8, 331–337. [Google Scholar] [CrossRef]
  17. Beck, M.W.; O’Hara, C.; Lowndes, J.S.S.; Ma-Zor, R.D.; Theroux, S.; Gillett, D.J.; Lane, B.; Gearheart, G. The importance of open science for biological assessment of aquatic environments. PeerJ 2020, 8, 1–27. [Google Scholar] [CrossRef]
  18. Cabral, H.N.; Fonseca, V.F.; Gamito, R.; Gonalves, C.I.; Costa, J.L.; Erzini, K.; Gonalves, J.; Martins, J.; Leite, L.; Andrade, J.P.; et al. Ecological quality assessment of transitional waters based on fish assemblages in Portuguese estuaries: The Estuarine Fish Assessment Index (EFAI). Ecol. Indic. 2012, 19, 144–153. [Google Scholar] [CrossRef]
  19. Broeg, K.; Westernhagen, H.V.; Zander, S.; Körting, W.; Koehler, A. The “bioeffect assessment index” (BAI): A concept for the quantification of effects of marine pollution by an integrated biomarker approach. Mar. Pollut. Bull. 2005, 50, 495–503. [Google Scholar] [CrossRef]
  20. Duarte, B.; Freitas, J.; Caçador, I. Sediment microbial activities and physic-chemistry as progress indicators of salt marsh restoration processes. Ecol. Indic. 2012, 19, 231–239. [Google Scholar] [CrossRef]
  21. Bastida, F.; Luis Moreno, J.; Teresa, H.; García, C. Microbiological degradation index of soils in a semiarid climate. Soil Biol. Biochem. 2006, 38, 3463–3473. [Google Scholar] [CrossRef]
  22. Duarte, B.; Feijão, E.; de Carvalho, R.C.; Duarte, I.A.; Silva, M.; Matos, A.R.; Cabrita, M.T.; Novais, S.C.; Lemos, M.F.L.; Marques, J.C.; et al. Effects of propranolol on growth, lipids and energy metabolism and oxidative stress response of Phaeodactylum tricornutum. Biology 2020, 9, 478. [Google Scholar] [CrossRef] [PubMed]
  23. Feijão, E.; Cruz de Carvalho, R.; Duarte, I.A.; Matos, A.R.; Cabrita, M.T.; Novais, S.C.; Lemos, M.F.L.; Caçador, I.; Marques, J.C.; Reis-Santos, P.; et al. Fluoxetine Arrests Growth of the Model Diatom Phaeodactylum tricornutum by Increasing Oxidative Stress and Altering Energetic and Lipid Metabolism. Front. Microbiol. 2020, 11, 1803. [Google Scholar] [CrossRef]
  24. Silva, M.; Feijão, E.; da Cruz de Carvalho, R.; Duarte, I.A.; Matos, A.R.; Cabrita, M.T.; Barreiro, A.; Lemos, M.F.L.; Novais, S.C.; Marques, J.C.; et al. Comfortably numb: Ecotoxicity of the non-steroidal anti-inflammatory drug ibuprofen on Phaeodactylum tricornutum. Mar. Environ. Res. 2020, 161. [Google Scholar] [CrossRef]
  25. Silva, M.; Feijão, E.; Carvalho, R.C.; Matos, A.R.; Cabrita, M.T.; Lemos, M.F.L.; Novais, S.C.; Marques, J.C.; Caçador, I.; Reis-Santos, P.; et al. Ecotoxicity of the detergent SDS on Phaeodactylum tricornutum primary productivity, fatty acid metabolism and oxidative stress biomarkers. 2021; preprint. [Google Scholar]
  26. Guillard, R.R.; Ryther, J.H. Studies of marine planktonic diatoms. I. Cyclotella nana Hustedt, and Detonula confervacea (cleve) Gran. Can. J. Microbiol. 1962, 8, 229–239. [Google Scholar] [CrossRef] [PubMed]
  27. Feijão, E.; Gameiro, C.; Franzitta, M.; Duarte, B.; Caçador, I.; Cabrita, M.T.; Matos, A.R. Heat wave impacts on the model diatom Phaeodactylum tricornutum: Searching for photochemical and fatty acid biomarkers of thermal stress. Ecol. Indic. 2018, 95, 1026–1037. [Google Scholar] [CrossRef]
  28. OECD. OECD guidelines for the testing of chemicals. Freshwater alga and cyanobacteria, growth inhibition test. Organ. Econ. Coop. Dev. 2011, 1–25. [Google Scholar] [CrossRef]
  29. Franzellitti, S.; Buratti, S.; Du, B.; Haddad, S.P.; Chambliss, C.K.; Brooks, B.W.; Fabbri, E. A multibiomarker approach to explore interactive effects of propranolol and fluoxetine in marine mussels. Environ. Pollut. 2015, 205, 60–69. [Google Scholar] [CrossRef] [PubMed]
  30. Claessens, M.; Vanhaecke, L.; Wille, K.; Janssen, C.R. Emerging contaminants in Belgian marine waters: Single toxicant and mixture risks of pharmaceuticals. Mar. Pollut. Bull. 2013, 71, 41–50. [Google Scholar] [CrossRef] [PubMed]
  31. Teranishi, Y.; Tanaka, A.; Osumi, M.; Fukui, S. Catalase activities of hydrocarbon-utilizing candida yeasts. Agric. Biol. Chem. 1974, 38, 1213–1220. [Google Scholar] [CrossRef]
  32. Tiryakioglu, M.; Eker, S.; Ozkutlu, F.; Husted, S.; Cakmak, I. Antioxidant defense system and cadmium uptake in barley genotypes differing in cadmium tolerance. J. Trace Elem. Med. Biol. 2006, 20, 181–189. [Google Scholar] [CrossRef]
  33. Marklund, S.; Marklund, G. Involvement of the Superoxide Anion Radical in the Autoxidation of Pyrogallol and a Convenient Assay for Superoxide Dismutase. Eur. J. Biochem. 1974, 47, 469–474. [Google Scholar] [CrossRef]
  34. Heath, R.L.; Packer, L. Photoperoxidation in isolated chloroplasts. I. Kinetics and stoichiometry of fatty acid peroxidation. Arch. Biochem. Biophys. 1968, 125, 189–198. [Google Scholar] [CrossRef]
  35. Broeg, K.; Lehtonen, K.K. Indices for the assessment of environmental pollution of the Baltic Sea coasts: Integrated assessment of a multi-biomarker approach. Mar. Pollut. Bull. 2006, 53, 508–522. [Google Scholar] [CrossRef] [Green Version]
  36. Sinha, S.; Masto, R.E.; Ram, L.C.; Selvi, V.A.; Srivastava, N.K.; Tripathi, R.C.; George, J. Rhizosphere soil microbial index of tree species in a coal mining ecosystem. Soil Biol. Biochem. 2009, 41, 1824–1832. [Google Scholar] [CrossRef]
  37. Clarke, K.; RN, G. Primer v6: User Manual/Tutorial. 2006. Available online: https://www.scienceopen.com/document?vid=87ec9d6d-cae1-4f49-9204-0fbf723dcdbc (accessed on 3 March 2021).
  38. Masto, R.E.; Chhonkar, P.K.; Singh, D.; Patra, A.K. Alternative soil quality indices for evaluating the effect of intensive cropping, fertilisation and manuring for 31 years in the semi-arid soils of India. Environ. Monit. Assess. 2008, 136, 419–435. [Google Scholar] [CrossRef] [PubMed]
  39. Cabrita, M.T.; Duarte, B.; Gameiro, C.; Godinho, R.M.; Caçador, I. Photochemical features and trace element substituted chlorophylls as early detection biomarkers of metal exposure in the model diatom Phaeodactylum tricornutum. Ecol. Indic. 2018, 95, 1038–1052. [Google Scholar] [CrossRef]
  40. Duarte, B.; Cabrita, M.T.; Vidal, T.; Pereira, J.L.; Pacheco, M.; Pereira, P.; Canário, J.; Gonçalves, F.J.M.; Matos, A.R.; Rosa, R.; et al. Phytoplankton community-level bio-optical assessment in a naturally mercury contaminated Antarctic ecosystem (Deception Island). Mar. Environ. Res. 2018, 140, 412–421. [Google Scholar] [CrossRef] [PubMed]
  41. Duarte, B.; Prata, D.; Matos, A.R.; Cabrita, M.T.; Caçador, I.; Marques, J.C.; Cabral, H.N.; Reis-Santos, P.; Fonseca, V.F. Ecotoxicity of the lipid-lowering drug bezafibrate on the bioenergetics and lipid metabolism of the diatom Phaeodactylum tricornutum. Sci. Total Environ. 2019, 650, 2085–2094. [Google Scholar] [CrossRef] [PubMed]
  42. Duarte, B.; Pedro, S.; Marques, J.C.; Adão, H.; Caçador, I. Zostera noltii development probing using chlorophyll a transient analysis (JIP-test) under field conditions: Integrating physiological insights into a photochemical stress index. Ecol. Indic. 2017, 76, 219–229. [Google Scholar] [CrossRef]
  43. Kaviraj, A.; Unlu, E.; Gupta, A.; El Nemr, A. Biomarkers of environmental pollutants. Biomed Res. Int. 2014, 2014, 806598. [Google Scholar] [CrossRef] [Green Version]
  44. Devin, S.; Burgeot, T.; Giambérini, L.; Minguez, L.; Pain-Devin, S. The integrated biomarker response revisited: Optimization to avoid misuse. Environ. Sci. Pollut. Res. 2014, 21, 2448–2454. [Google Scholar] [CrossRef] [Green Version]
  45. Meng, F.-P.; Yang, F.-F.; Cheng, F.-L. Marine environmental assessment approaches based on biomarker index: A review. J. Appl. Ecol. 2012, 23, 1128–1136. [Google Scholar]
  46. Marigómez, I.; Garmendia, L.; Soto, M.; Orbea, A.; Izagirre, U.; Cajaraville, M.P. Marine ecosystem health status assessment through integrative biomarker indices: A comparative study after the Prestige oil spill “mussel Watch.”. Ecotoxicology 2013, 22, 486–505. [Google Scholar] [CrossRef] [Green Version]
  47. Novais, S.C.; Gomes, N.C.; Soares, A.M.V.M.; Amorim, M.J.B. Antioxidant and neurotoxicity markers in the model organism Enchytraeus albidus (Oligochaeta): Mechanisms of response to atrazine, dimethoate and carbendazim. Ecotoxicology 2014, 23, 1220–1233. [Google Scholar] [CrossRef]
  48. Brooks, S.J.; Escudero-Oñate, C.; Gomes, T.; Ferrando-Climent, L. An integrative biological effects assessment of a mine discharge into a Norwegian fjord using field transplanted mussels. Sci. Total Environ. 2018, 644, 1056–1069. [Google Scholar] [CrossRef] [PubMed] [Green Version]
  49. Serafim, A.; Company, R.; Lopes, B.; Fonseca, V.F.; Frana, S.; Vasconcelos, R.P.; Bebianno, M.J.; Cabral, H.N. Application of an integrated biomarker response index (IBR) to assess temporal variation of environmental quality in two Portuguese aquatic systems. Ecol. Indic. 2012, 19, 215–225. [Google Scholar] [CrossRef]
  50. Raftopoulou, E.K.; Dimitriadis, V.K. Assessment of the health status of mussels Mytilus galloprovincialis along Thermaikos Gulf (Northern Greece): An integrative biomarker approach using ecosystem health indices. Ecotoxicol. Environ. Saf. 2010, 73, 1580–1587. [Google Scholar] [CrossRef]
  51. Felício, A.A.; Freitas, J.S.; Scarin, J.B.; de Souza Ondei, L.; Teresa, F.B.; Schlenk, D.; de Almeida, E.A. Isolated and mixed effects of diuron and its metabolites on biotransformation enzymes and oxidative stress response of Nile tilapia (Oreochromis niloticus). Ecotoxicol. Environ. Saf. 2018, 149, 248–256. [Google Scholar] [CrossRef] [Green Version]
  52. Rodrigues, A.P.; OlivaeTeles, T.; Mesquita, S.R.; DelerueeMatos, C.; Guimarães, L. Integrated biomarker responses of an estuarine invertebrate to high abiotic stress and decreased metal contamination. Mar. Environ. Res. 2014, 101, 101–114. [Google Scholar] [CrossRef] [PubMed]
  53. Silva, C.S.E.; Novais, S.C.; Simões, T.; Caramalho, M.; Gravato, C.; Rodrigues, M.J.; Maranhão, P.; Lemos, M.F.L. Using biomarkers to address the impacts of pollution on limpets (Patella depressa) and their mechanisms to cope with stress. Ecol. Indic. 2018, 95, 1077–1086. [Google Scholar] [CrossRef]
  54. Duarte, B.; Carreiras, J.; Pérez-Romero, J.A.; Mateos-Naranjo, E.; Redondo-Gómez, S.; Matos, A.R.; Marques, J.C.; Caçador, I. Halophyte fatty acids as biomarkers of anthropogenic-driven contamination in Mediterranean marshes: Sentinel species survey and development of an integrated biomarker response (IBR) index. Ecol. Indic. 2018, 87, 86–96. [Google Scholar] [CrossRef]
  55. Duarte, B.; Durante, L.; Marques, J.C.; Reis-Santos, P.; Fonseca, V.F.; Caçador, I. Development of a toxicophenomic index for trace element ecotoxicity tests using the halophyte Juncus acutus: Juncus-TOX. Ecol. Indic. 2021, 121, 107097. [Google Scholar] [CrossRef]
  56. Adams, S.M.; Brown, A.M.; Goede, R.W. A Quantitative Health Assessment Index for Rapid Evaluation of Fish Condition in the Field. Trans. Am. Fish. Soc. 1993, 122. [Google Scholar] [CrossRef]
  57. Clarke, K.R. Nonmetric multivariate analysis in community-level ecotoxicology. Environ. Toxicol. Chem. 1999, 18, 118–127. [Google Scholar] [CrossRef]
  58. Jollands, N.; Lermit, J.; Patterson, M. Aggregate eco-efficiency indices for New Zealand—A principal components analysis. J. Environ. Manag. 2004, 73, 293–305. [Google Scholar] [CrossRef]
  59. Isibor, P.O.; Imoobe, T.O.T.; Enuneku, A.A.; Akinduti, P.A.; Dedeke, G.A.; Adagunodo, T.A.; Obafemi, D.Y. Principal Components and Hierarchical Cluster Analyses of Trace Metals and Total Hydrocarbons in Gills, Intestines and Muscles of Clarias gariepinus (Burchell, 1822). Sci. Rep. 2020, 10, 1–15. [Google Scholar] [CrossRef] [PubMed] [Green Version]
  60. Shin, P.K.S.; Lam, W.K.C. Development of a Marine Sediment Pollution Index. Environ. Pollut. 2001, 113, 281–291. [Google Scholar] [CrossRef]
  61. Reid, M.K.; Spencer, K.L. Use of principal components analysis (PCA) on estuarine sediment datasets: The effect of data pre-treatment. Environ. Pollut. 2009, 157, 2275–2281. [Google Scholar] [CrossRef] [PubMed]
  62. Caçador, I.; Neto, J.M.; Duarte, B.; Barroso, D.V.; Pinto, M.; Marques, J.C. Development of an Angiosperm Quality Assessment Index (AQuA-Index) for ecological quality evaluation of Portuguese water bodies—A multi-metric approach. Ecol. Indic. 2013, 25, 141–148. [Google Scholar] [CrossRef]
  63. Lever, J.; Krzywinski, M.; Altman, N. Principal component analysis. Nat. Methods 2017, 14, 641–642. [Google Scholar] [CrossRef] [Green Version]
Figure 1. Canonical analysis of principal components plots of the diatom cells exposed to propranolol (A), fluoxetine (B), Ibuprofen (C), glyphosate (D), and SDS (E) at different exogenous concentrations, having the biomarker values as classifying variables. Data sources are available in Table 1.
Applsci 11 03878 g001
Figure 2. Integrated biomarker response (IBR) index of Phaeodactylum tricornutum cells exposed to different contaminants and concentrations. (A) Propranolol. (B) Glyphosate. (C) Fluoxetine. (D) SDS. (E) Ibuprofen. Average ± standard deviation, n = 3, different letters indicate significant differences at p < 0.05.
Applsci 11 03878 g002
Figure 3. Principal component analysis (PCA)-based index of Phaeodactylum tricornutum cells exposed to different contaminants and concentrations. (A) Propranolol. (B) Glyphosate. (C) Fluoxetine. (D) SDS. (E) Ibuprofen. Average ± standard deviation, n = 3, different letters indicate significant differences at p < 0.05.
Applsci 11 03878 g003
Figure 4. Bioeffect assessment index (BAI) of Phaeodactylum tricornutum cells exposed to different contaminants and concentrations. (A) Propranolol. (B) Glyphosate. (C) Fluoxetine. (D) SDS. (E) Ibuprofen. Average ± standard deviation, n = 3, different letters indicate significant differences at p < 0.05.
Applsci 11 03878 g004
Figure 5. Spearman correlations heatmaps between the calculated index values and the applied exogenous concentrations for each applied compound. (*) denote significant differences at p < 0.05 for all tested compounds. Indexes include the integrated biomarker response (IBR) index; the principal component analysis (PCA)-based index; and the bioeffect assessment index (BAI), whilst (C) refers to the gradient of exposure concentration.
Applsci 11 03878 g005
Table 1. Exposure compounds concentrations, Phaeodactylum tricornutum relative growth inhibition and calculated IC50.
CompoundConcentrations Tested (μg L−1)Inhibition (%)IC50 (μg L−1)Reference
Propranolol0.30.15194.6[22]
84.11
8041.11
15077.08
300154.16
Fluoxetine0.30.6347.3[23]
0.61.27
2042.26
4084.52
80169.04
Ibuprofen0.80.23350.6
30.86[24]
4011.41
10028.52
30085.57
Glyphosate104.43225.9
5022.13[15]
10044.27
250110.67
500221.34
SDS0.115.511.4
121.1[25]
324.6
1043.8
Publisher’s Note: MDPI stays neutral with regard to jurisdictional claims in published maps and institutional affiliations.

