Article

Impact of Grid Strength and Impedance Characteristics on the Maximum Power Transfer Capability of Grid-Connected Inverters †

Department of Energy Technology, Aalborg University, 9220 Aalborg Øst, Denmark
*
Author to whom correspondence should be addressed.
This paper is an extended version of the paper to be published in 2021 IEEE 12th Energy Conversion Congress and Exposition-Asia (ECCE-Asia) to be held in Singapore, 24–27 May 2021.
Submission received: 6 April 2021 / Revised: 4 May 2021 / Accepted: 5 May 2021 / Published: 10 May 2021
(This article belongs to the Section Energy Science and Technology)

Abstract

:
Continuously expanding deployments of distributed power generation systems are transforming conventional centralized power grids into mixed distributed electrical networks. The higher penetration and longer distance from the renewable energy source to the main power grid result in lower grid strength, which stimulates the power limitation problem. Aimed at this problem, case studies of inductive and resistive grid impedance with different grid strengths have been carried out to evaluate the maximum power transfer capability of grid-connected inverters. It is revealed that power grids with a higher short circuit ratio (SCR) or lower resistance-inductance ratio (R/X) provide higher power transfer capability. Moreover, under the resistive grid conditions, a higher voltage at the point of common coupling (PCC) is beneficial to increase the power transfer capability. Based on mathematical analysis, the maximum power curves in the inductive and resistive grids can be found. Moreover, a performance index is proposed in this paper to quantify the performance of the system with different parameter values. Finally, the effectiveness of the analysis is verified by simulation.

1. Introduction

In the past decades, due to a foreseen exhaustion of conventional fossil-based energies and their climate impact, traditional centralized power generation using fossil fuels has been increasingly considered unsustainable in the long term. Consequently, many global efforts have been devoted to developing more renewable energy sources, such as wind and solar photovoltaics (PVs) [1]. Thus, the proportion of distributed power generation systems has increased quite fast, especially in Europe [2]. Moreover, due to the fact that the best locations to get wind and solar energy are often far from the main grid, the long-distance transmission-line impedance makes the grid weaker than before, which brings a significant challenge to effective power transmission [3]. Although a high voltage direct current (HVDC) system can replace the alternating current (AC) system for long-distance power transmission [4,5], the grid-side converter of the HVDC system still faces the challenge of connecting to a weak grid in some cases [6,7]. Therefore, it is necessary to study the maximum power transfer capability of grid-connected inverters.
The strength of the grid is defined by the short circuit ratio (SCR), which is the ratio of the short circuit power at the point of common coupling (PCC) and the rated power of the inverter. When the SCR is below 6–10, the grid is weak. In the case that the SCR is above 20, the grid is strong [8]. According to the definition of the SCR, the increase of the rated inverter power or the transmission impedance will reduce the SCR and make the grid weaker. The PCC voltage varies easily when a large amount of active power is injected into a weak grid. Thus, the reactive power control has to be used to keep the PCC voltage around its rated value [9]. Since the total rated power of the inverter is constant, the more the output reactive power, the less the output active power, which will limit the power transfer capability of the grid-connected inverter. Therefore, the SCR is an important factor that influences the maximum power transfer capability of the grid-connected inverter.
Most previous works have focused on improving the control strategies of inverters to increase the power transfer capability limited by control stability, such as improved grid-following control methods [10,11,12] and newly developed grid-forming control methods [13,14,15,16]. A gain-scheduling controller with the H-infinity method is presented in [10] to extend the stability range of classical grid-following inverters. Similarly, a current error-based voltage angle and magnitude compensation method is proposed in [11] to improve system stability. Moreover, a power-synchronization-based grid-forming control method is proposed in [13], which has better stability performance than grid-following inverters. Differently, the natural maximum power transfer capability of grid-connected inverters mainly depends on the physical parameters of the system, which is constant for an existing system [17,18]. Hence, it is a key property for engineering design and analysis.
Recently, it was reported in [19] that not only the SCR but also the resistance-inductance ratio (R/X) of grid impedance affects the maximum power transfer capability of grid-connected inverters. However, [19] mainly discusses the inductive grid case, while the resistive grid case is not analyzed. In fact, both the inductive and resistive grids exist in real applications. Generally, high-voltage lines are inductive, while low-voltage lines are resistive [20,21]. Therefore, the resistive grid case should also be analyzed. This paper attempts to fill this research gap and provides a full map of both cases. Since both current and voltage limitations are considered, this research is closer to reality.
Furthermore, our early work in [22] mainly analyzes the impact of the SCR and the R/X ratio on the maximum power transfer capability in the constant PCC voltage case, where the impact of the PCC voltage is not considered. Based on our early work, this paper reveals that the PCC voltage amplitude is also a key factor affecting the maximum power transfer capability of the system, especially in the resistive grid case. It was found that a higher PCC voltage than the rated value in a resistive grid is beneficial to increase the power transfer capability of grid-connected inverters.
The rest of this paper is organized as follows. Section 2 introduces the study system and its simplified model. Then, the maximum power transfer capability of the system at the rated PCC voltage is analyzed. Section 3 analyzes the maximum power transfer capability of the system at varying PCC voltage. After that, optimal parameters for maximum power operation in the inductive and resistive grids are illustrated in Section 4. The simulation results are illustrated in Section 5. Finally, concluding remarks are drawn in Section 6.

2. Maximum Power Transfer Capability of Grid-Connected Systems at the Rated PCC Voltage

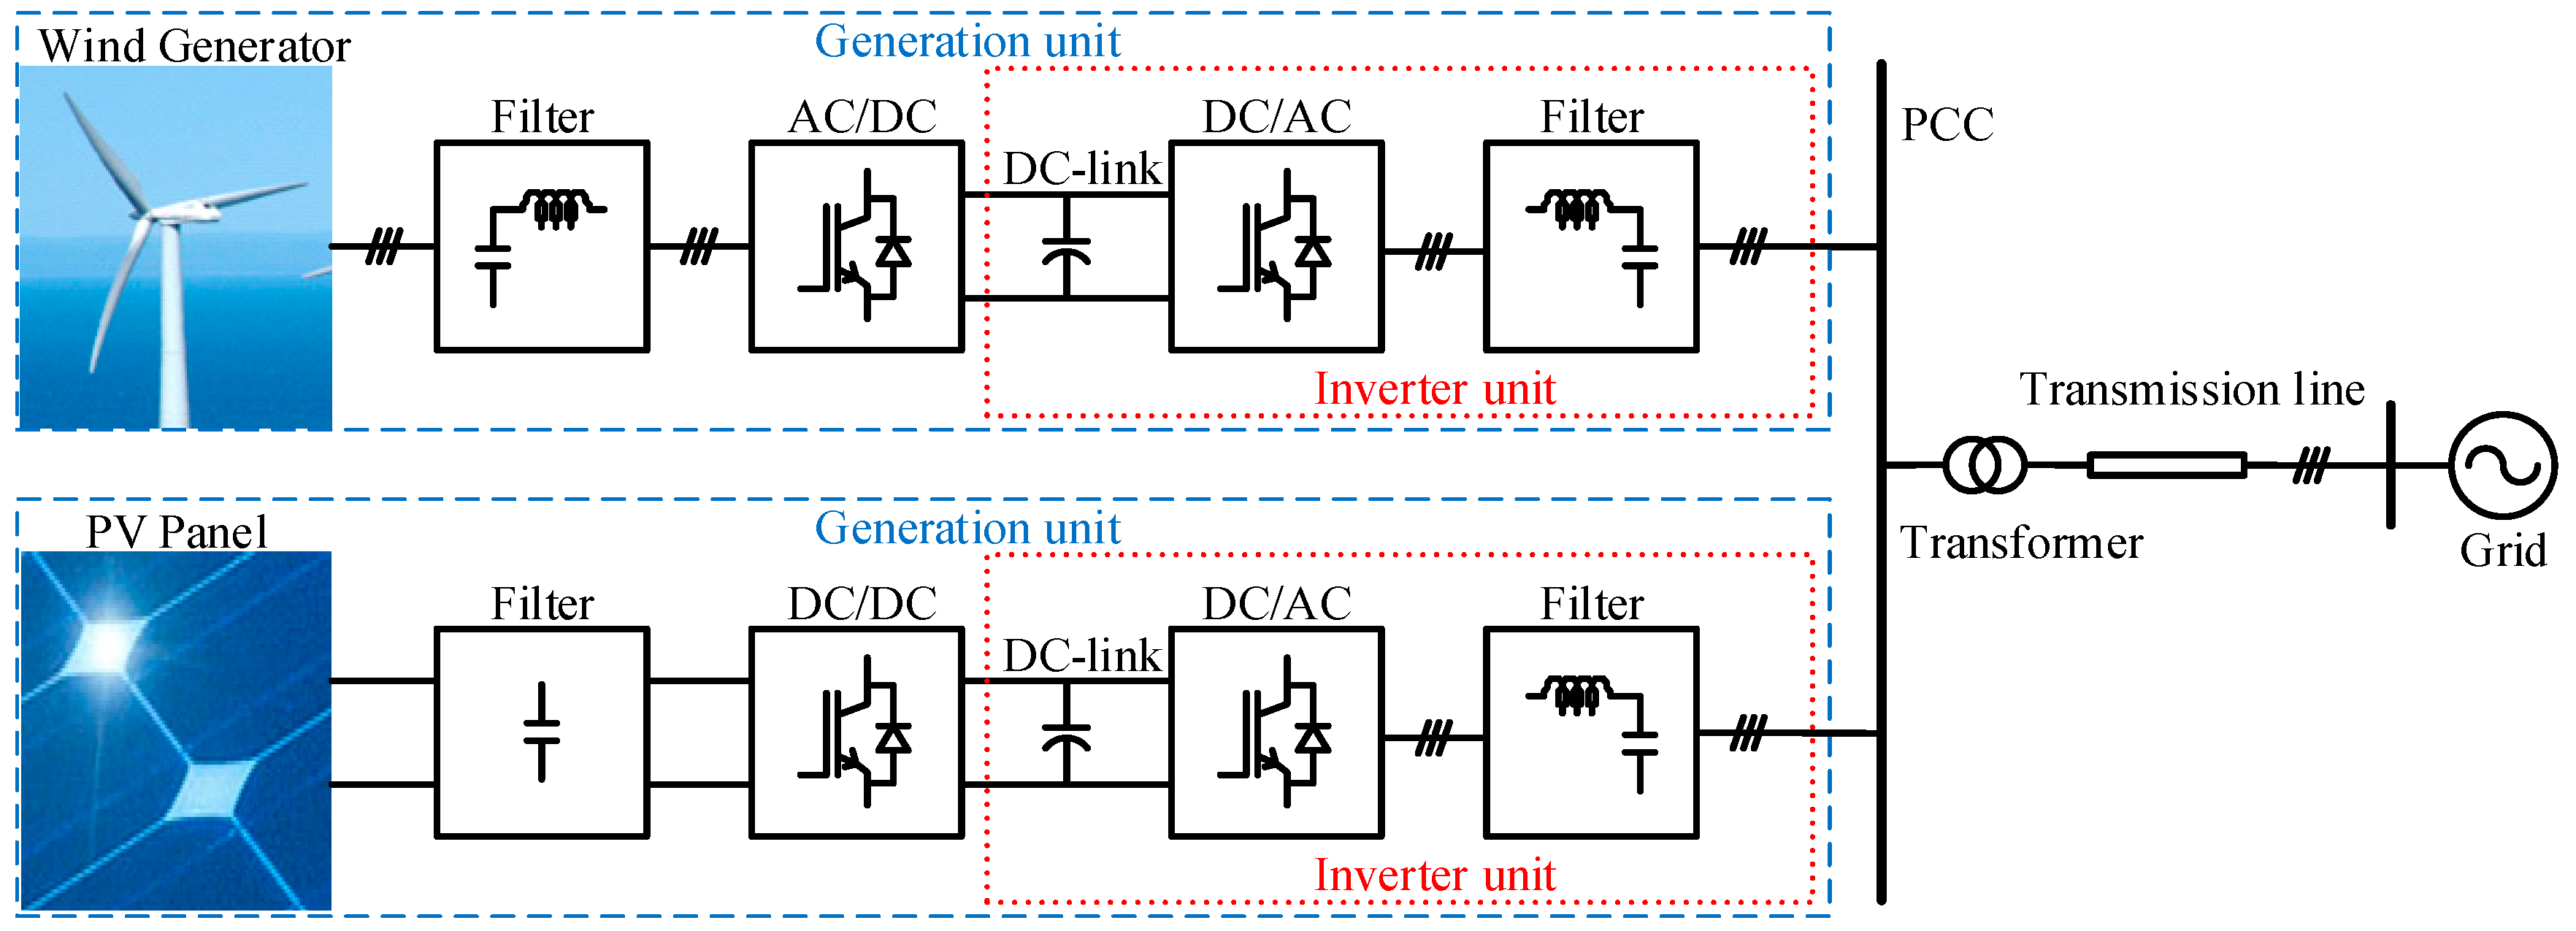
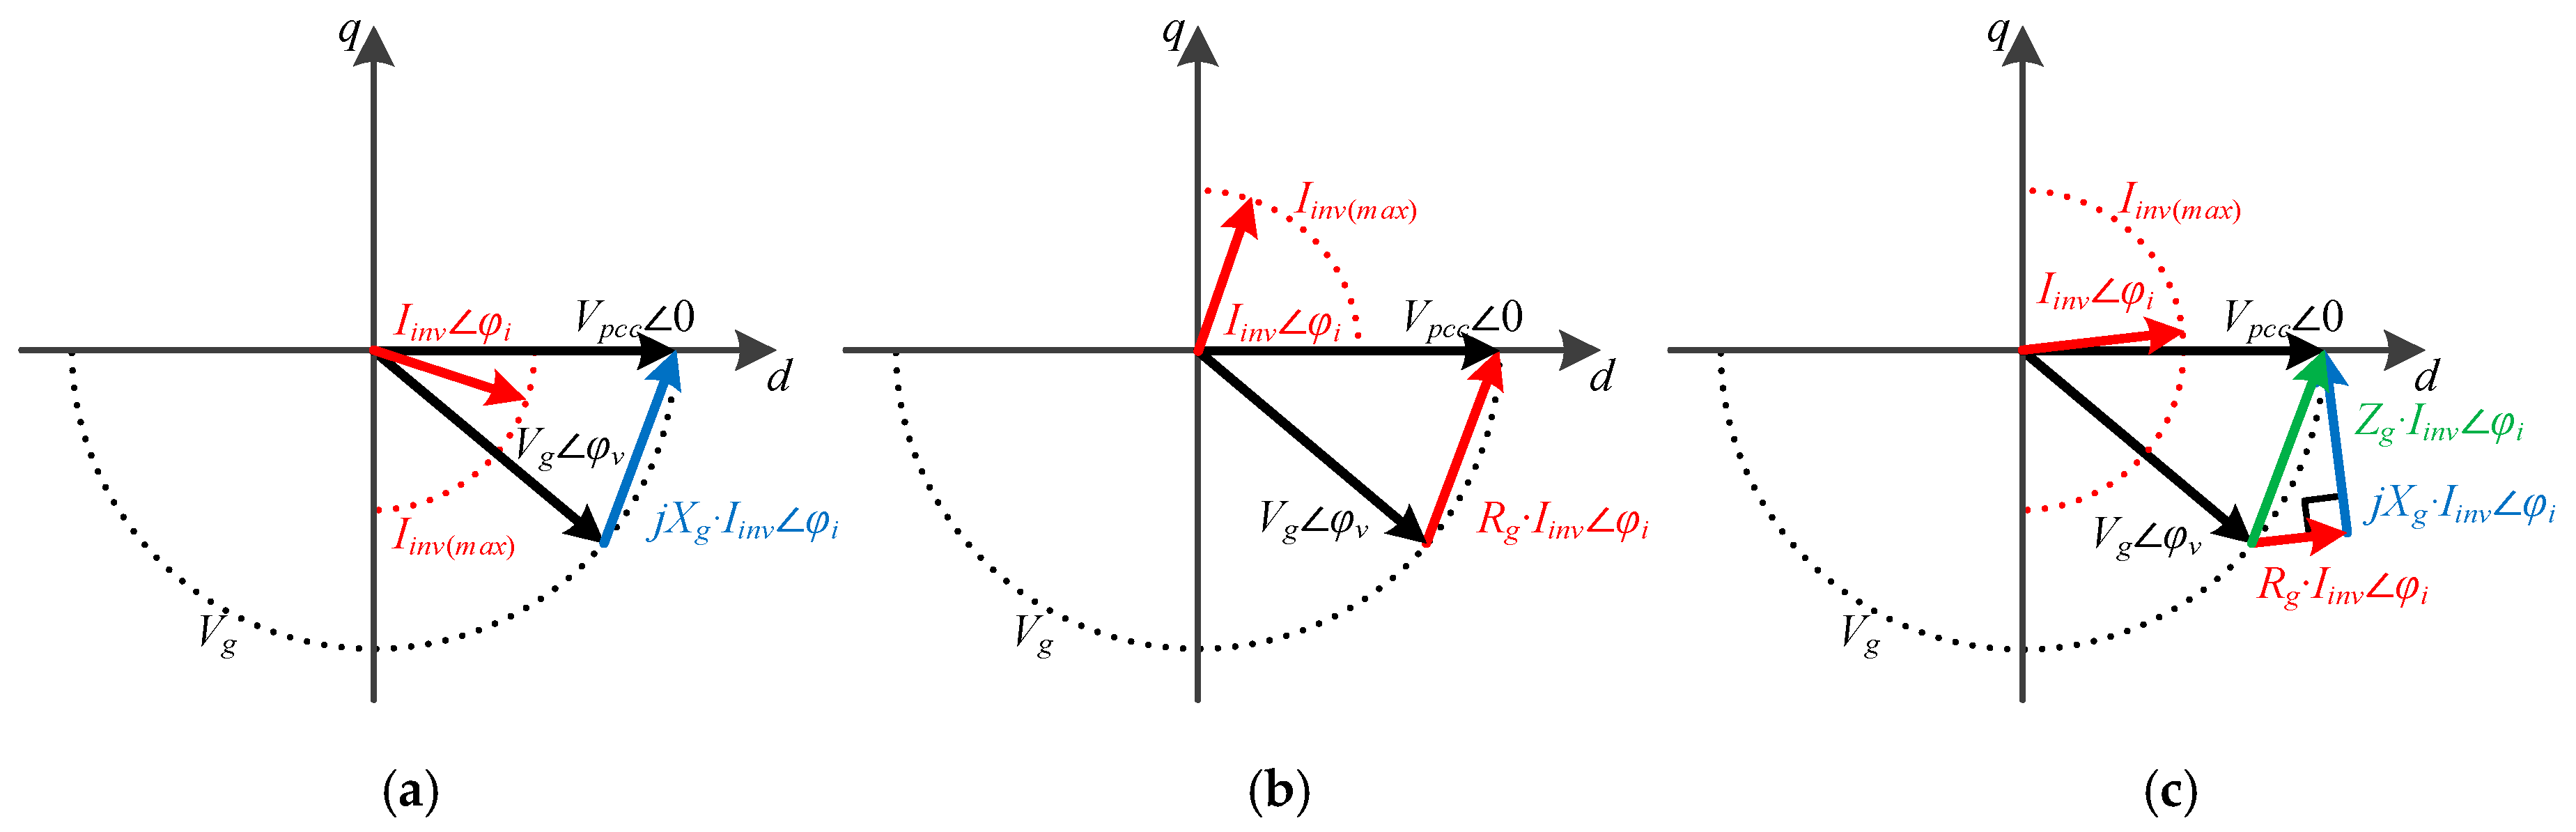
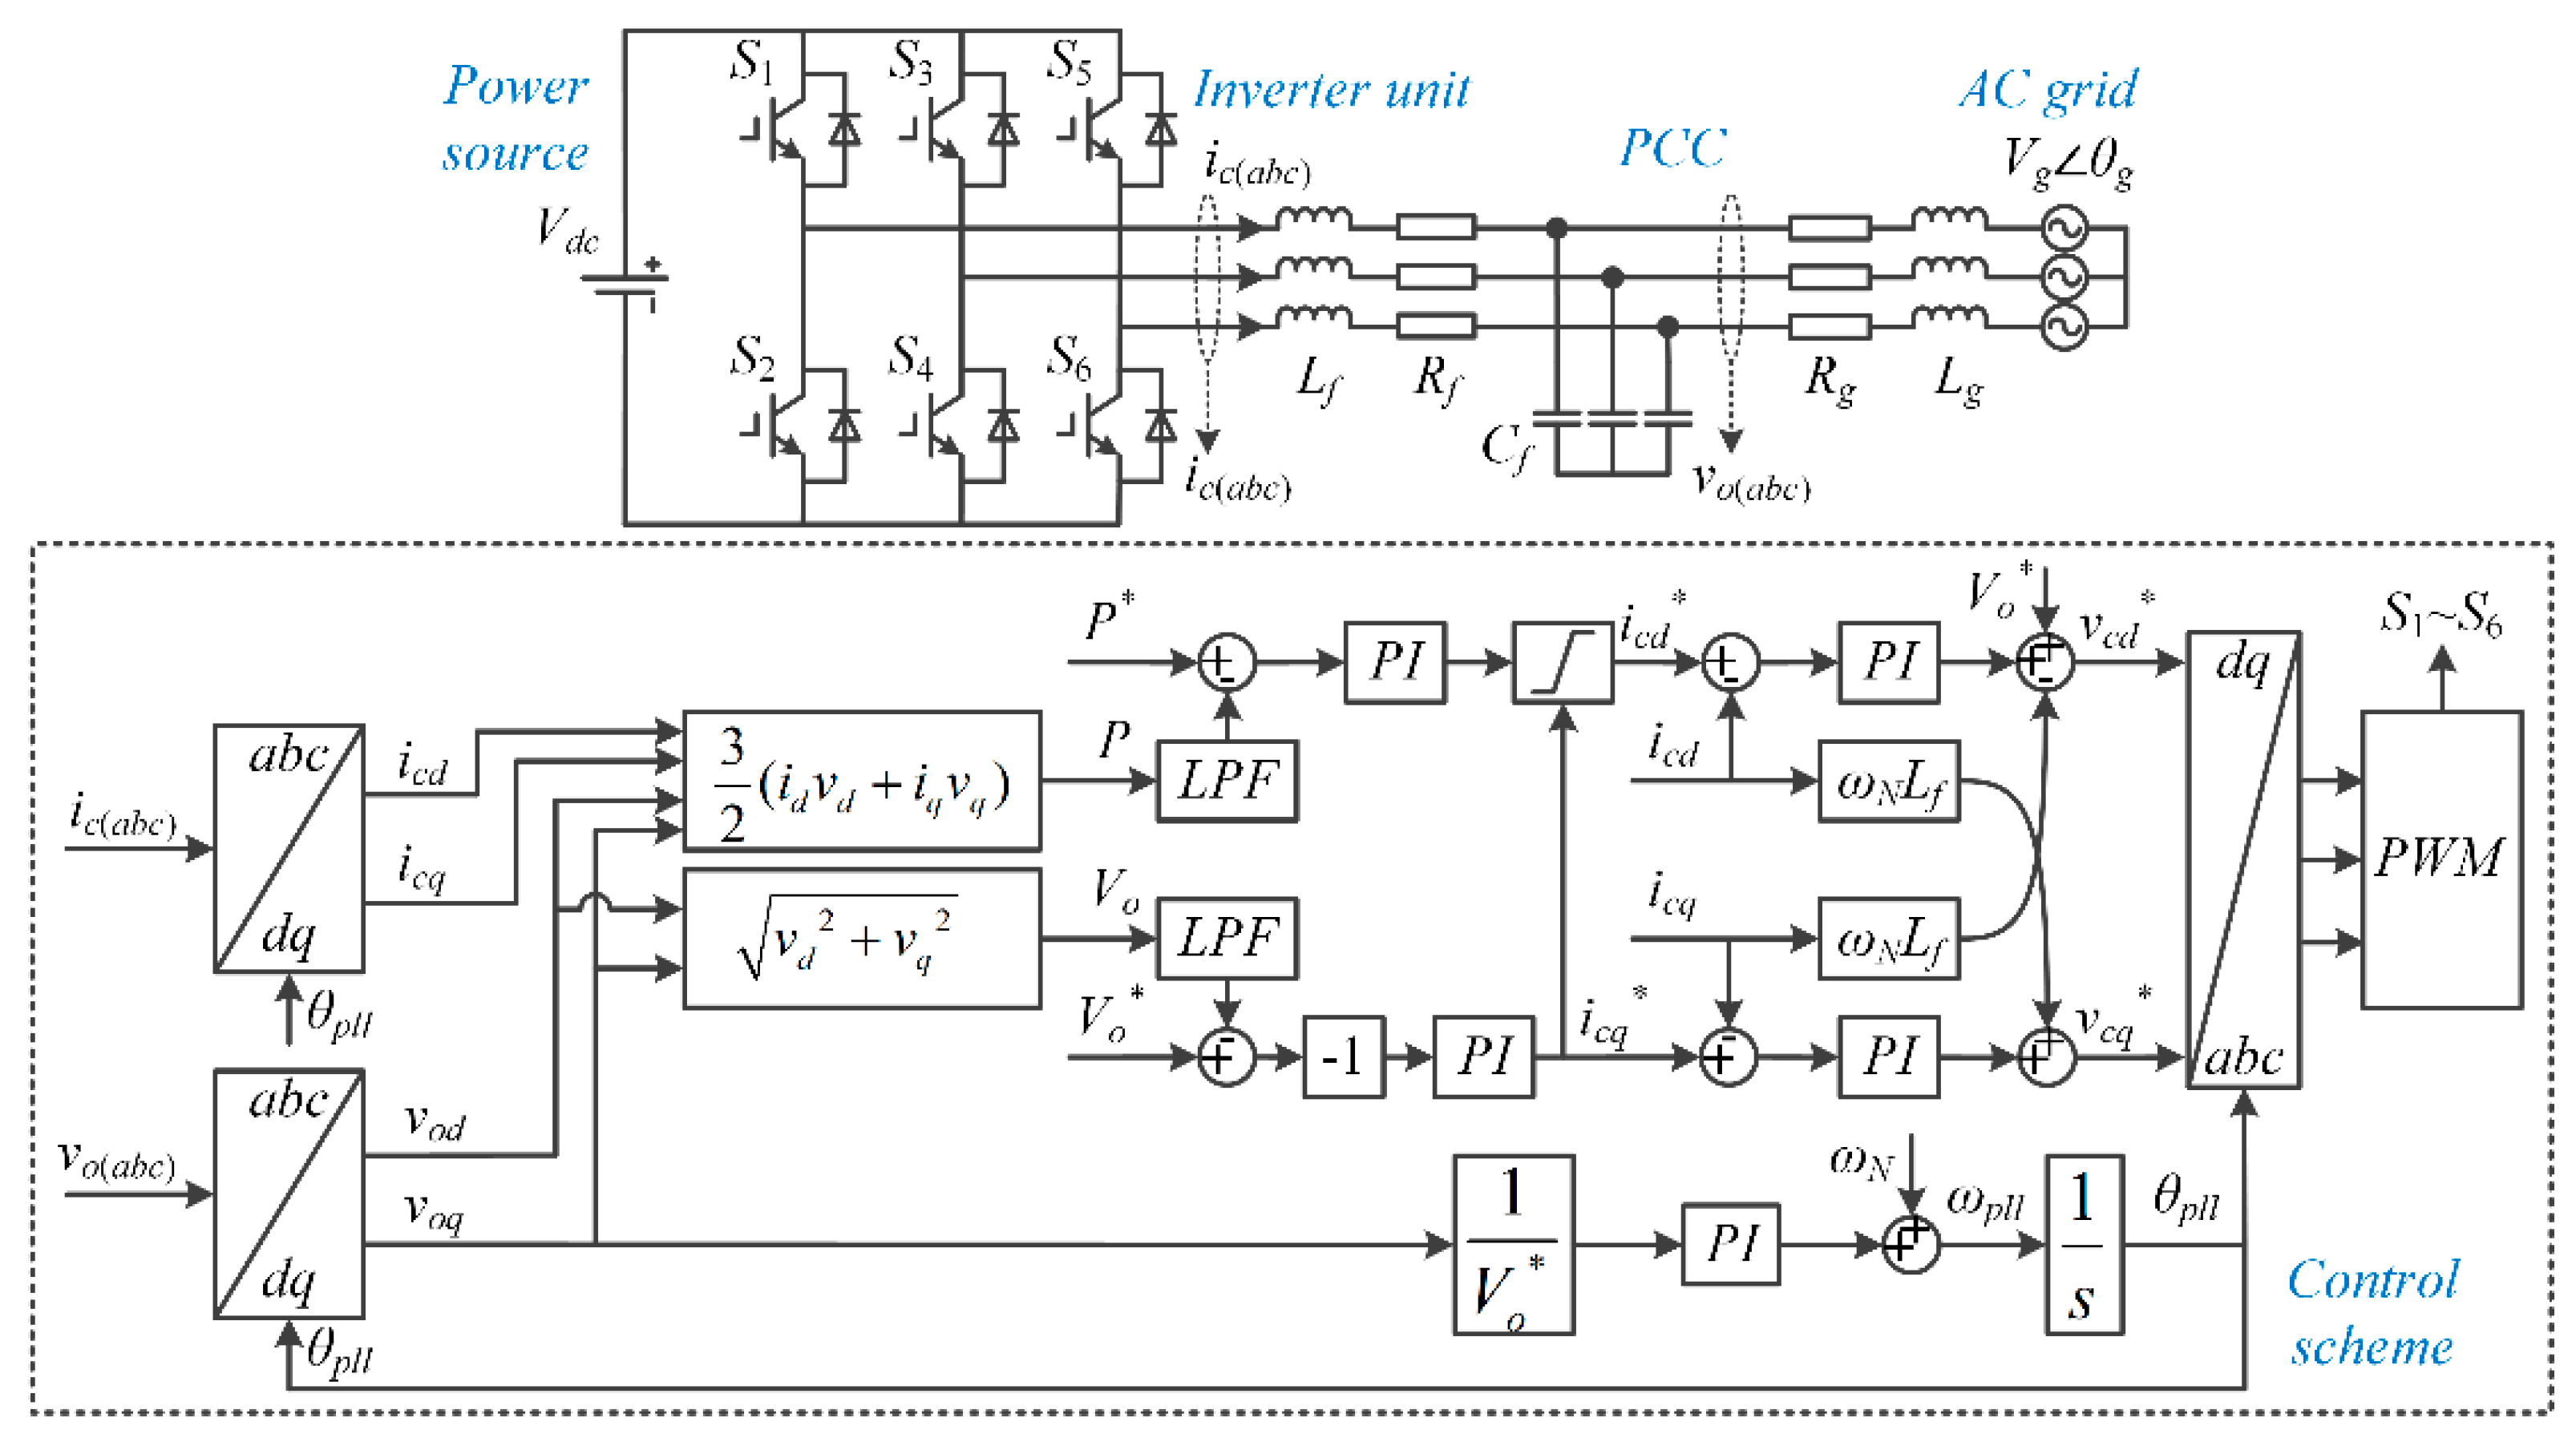
2.1. System Configuration and Mathematical Model

Figure 1 shows the typical configuration of grid-connected wind and PV generation systems. Generally, a wind generation unit contains an AC/DC converter for maximum power point tracking (MPPT) control and a DC/AC inverter for grid connection. Similarly, a PV generation unit mainly contains a DC/DC converter for MPPT control and a DC/AC inverter for grid connection. In the entire wind or PV power plant, all these generation units are connected at the PCC. The total output power of inverters at the PCC is injected into the high-voltage transmission network connected to the main grid. To simplify the analysis, the transmission network is represented by a transmission line, as shown in Figure 1. In the following sections, this paper will mainly focus on the impact of transmission-line impedance on the maximum power transfer capability of the system.
Grid-connected inverters usually operate in current-controlled mode, so the whole generation power plant can be treated as an ideal current source. Moreover, the grid can be represented by its Thevenin’s equivalent circuit; the equivalent circuit of the grid-connected generation system is shown in Figure 2. Assuming the PCC voltage vector is aligned to the d-axis, Vpcc∠0 is the vector of the PCC voltage, Iinvφi is the vector of the inverter current, Vgφv is the vector of the grid voltage, and Zg is the grid impedance. It is noted that series-connected resistor Rg and inductor Xg are used to represent grid impedance Zg.
The stiffness of the grid at the PCC can be described by the SCR, which is expressed as:
S C R = S S C S N = 3 / 2 V g 2 / | Z g | 3 / 2 V p c c ( r a t e d ) I i n v ( r a t e d )
where SSC is the short-circuit apparent power at the PCC, SN is the total rated apparent power of inverters, Vg is the amplitude of grid voltage, Vpcc(rated) and Iinv(rated) are the amplitude of the rated PCC voltage and rated inverter current.
Generally, the rated PCC voltage should be equal to the grid voltage, namely, “Vpcc(rated) = Vg”, and the rated current Iinv(rated) is the same as the maximum inverter current Iinv(max), which is determined by the endurable current of the power semiconductor. Thus, the grid impedance can be represented by the SCR according to Equation (1), which is expressed as:
| Z g | = R g 2 + X g 2 = V g I i n v ( m a x ) S C R
According to the equivalent circuit in Figure 2, the relationship between the grid voltage and the inverter current can be derived as:
V p c c 0 = V g φ v + ( R g + j X g ) I i n v φ i
To simplify the vector expression in Equation (3), the current vector Iinvφi can be expressed by the d-axis component “id = Iinv∙cos(φi)” and the q-axis component “iq = Iinv∙sin(φi)”. Thus, the relationship between the two current components and the PCC voltage can be derived as:
( R g 2 + X g 2 ) ( i d 2 + i q 2 ) + 2 V p c c ( X g i q R g i d ) + V p c c 2 V g 2 = 0

2.2. Ideal Maximum Power without Current Limitation

Firstly, an ideal case without current limitation is analyzed as follows. Substituting “Vpcc = Vg” and Equation (2) into Equation (4), the per-unit values of id and iq can be derived as:
i q ( p u ) 2 + 2 S C R ( R g / X g ) 2 + 1 i q ( p u ) + [ i d ( p u ) 2 2 S C R ( R g / X g ) ( R g / X g ) 2 + 1 i d ( p u ) ] = 0
Considering Equation (5) as a quadratic equation of iq(pu), thus, only when Equation (6) is satisfied, does Equation (5) have solutions.
Δ = 4 S C R 2 ( R g / X g ) 2 + 1 + 8 S C R ( R g / X g ) ( R g / X g ) 2 + 1 i d ( p u ) 4 i d ( p u ) 2 0
According to Equation (6), the maximum value of id(pu) can be calculated, as given in Equation (7). Because the PCC voltage is considered a constant in this section, the per-unit value of the current id is equal to the per-unit value of the inverter active power Pinv. Hence, the ideal maximum power of the inverter can be represented by Equation (7).
P i n v ( p u ) m a x = i d ( p u ) m a x = S C R [ ( R g / X g ) ( R g / X g ) 2 + 1 + 1 ]
According to Equation (7), the relationship between the ideal maximum inverter power Pinv(pu)max and the SCR with different Rg/Xg ratios is shown in Figure 3. It can be seen that the relationship between Pinv(pu)max and the SCR is linear. In the purely inductive (R/X = 0) case, SCR = 1 is a critical point because when the SCR is lower than 1, the maximum power Pinv(pu)max is lower than 1, namely, the maximum output power of the inverter is limited naturally under weak grid conditions. Hence, this natural characteristic between Pinv(pu)max and the SCR can be considered a standard to be compared with the maximum power operating point at the stability boundary of different control strategies.

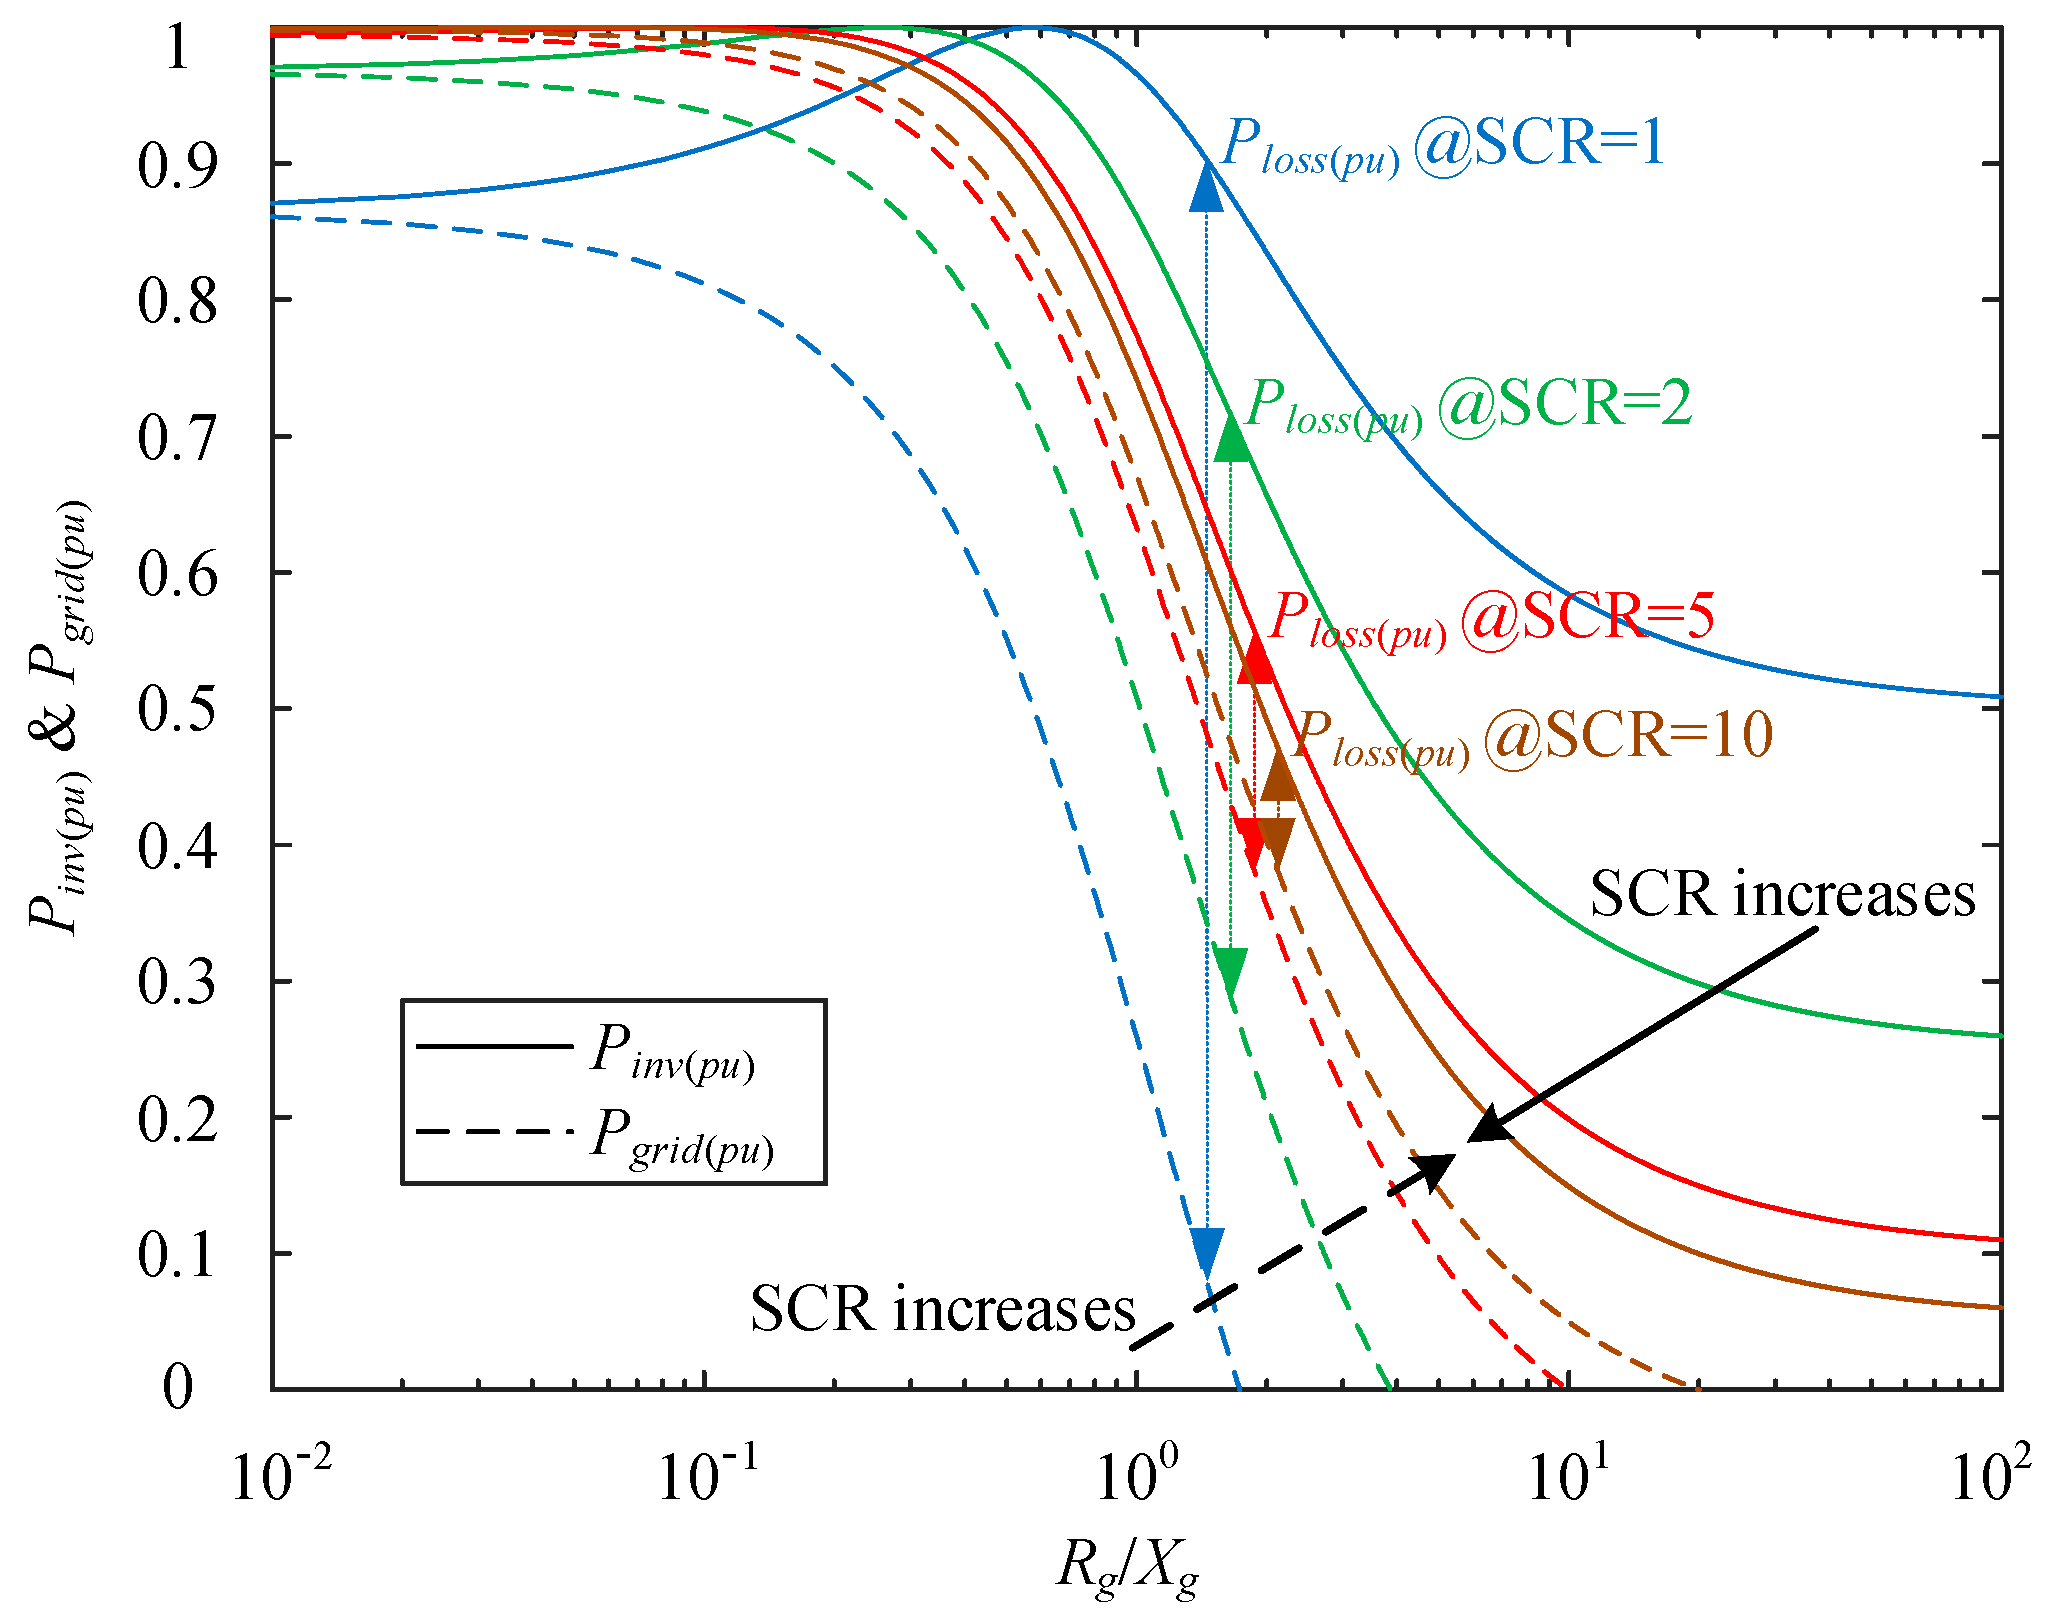
2.3. Realistic Maximum Power with Current Limitation

In real applications, the maximum inverter current Iinv(max) is determined by the endurable current of the power semiconductor. Thus, considering the current limitation of the inverter, the d-axis inverter current should be limited by the expression in Equation (8). To analyze the maximum transferred power of a grid-connected inverter, the d-axis inverter current should be equal to the limiting value in Equation (8). It is worth mentioning that since the active power is transferred from the wind or PV power plant to the grid under normal circumstances, the active power Pinv should be positive. Thus, the current id should also be positive; hence, a negative id is not considered in this paper.
i d I i n v ( m a x ) 2 i q 2
It is worth noting that this paper investigates the system without reactive power compensation devices; thus, all the reactive power is provided by the inverter itself. Due to the flexible control ability of inverters, the suitable reactive power from the inverter can be controlled to make sure the PCC voltage operates near its rated value [23,24]. To be easily understandable, the analysis starts with the case where the PCC voltage equals its rated value.
By substituting “Vpcc = Vg” and Equation (8) into Equation (4), a standard quadratic equation for the q-axis inverter current iq can be derived as:
1 R g 2 + X g 2 i q 2 + X g I i n v ( m a x ) 2 ( R g 2 + X g 2 ) V g i q + [ I i n v ( m a x ) 4 4 V g 2 R g 2 I i n v ( m a x ) 2 ( R g 2 + X g 2 ) 2 ] = 0
Based on Equation (9), positive and negative solutions of the q-axis inverter current can be obtained. As the control law in the voltage PI controller is only suitable for the positive solution, the negative solution is unattainable. Hence, it is disregarded. The positive solution is given by Equation (10).
i q = R g I i n v ( m a x ) 1 R g 2 + X g 2 I i n v ( m a x ) 2 4 V g 2 X g I i n v ( m a x ) 2 2 V g
If the solution listed in Equation (10) exists, Equation (11) must be satisfied.
1 R g 2 + X g 2 I i n v ( m a x ) 2 4 V g 2 0
Substituting Equation (2) into Equation (11), the range of the SCR is derived as:
S C R 1 2
The expression in Equation (12) shows that the PCC voltage cannot be maintained at the rated value if the SCR is lower than 0.5.
Moreover, when Equations (2) and (10) are substituted into Equation (8), the expression of the d-axis inverter current id is derived as:
i d ( p u ) = i d I i n v ( m a x ) = S C R 2 1 4 + R g 2 X g S C R 1 + R g 2 X g 2
In order to visualize the aforementioned analytical analysis, the voltage and current vector diagrams of the grid-connected system at the d-q plane are shown in Figure 4. The purely inductive, purely resistive, and hybrid impedance cases are shown in Figure 4a–c, respectively. The vector amplitudes Iinv and Vg are invariable, while the phase angles φi and φv are adjusted to match different values of Zg. It can be seen from Equation (13) that the d-axis current id is always positive because only the inverter mode is considered in this paper. Moreover, according to Equation (10), the q-axis current iq is negative in the purely inductive case, which is shown in Figure 4a. However, the q-axis current iq is positive in the purely resistive case, which is shown in Figure 4b. Then, in the hybrid case, the current vector should be in the middle area between these two extreme cases, which is shown in Figure 4c.
As seen in Figure 4, because the amplitude of the inverter current is invariable, the larger the d-axis current component, the smaller the q-axis current component, and vice versa. Thus, as the output reactive power increases, the output active power decreases. This characteristic is more obvious in a weaker grid, where the amplitude of Zg is higher.
The output active power of the inverter Pinv shown in Figure 2 can be calculated as:
P i n v = 3 2 V p c c i d
Thus, according to Equations (13) and (14), the output active power of the inverter (per unit) can be derived as:
P i n v ( p u ) = P i n v S N = 3 / 2 V g i d 3 / 2 V g I i n v ( m a x ) = i d ( p u ) = S C R 2 1 4 + R g 2 X g S C R 1 + R g 2 X g 2
Moreover, according to Equations (1) and (2), the power loss introduced by the transmission line (per unit) is derived as:
P l o s s ( p u ) = P l o s s S N = 3 / 2 I i n v ( m a x ) 2 R g 3 / 2 V g I i n v ( m a x ) = R g X g S C R 1 + R g 2 X g 2
Thus, according to Equations (15) and (16), the transferred active power to the grid (per unit) can be derived as:
P g r i d ( p u ) = P i n v ( p u ) P l o s s ( p u ) = S C R 2 1 4 R g 2 X g S C R 1 + R g 2 X g 2
Based on Equations (15) and (17), Figure 5 presents the relationship between the inverter power Pinv(pu), grid power Pgrid(pu), and Rg/Xg ratio with different SCRs at the rated PCC voltage. Since the SCR is usually higher than 1 in practice, the situation where SCR is lower than 1 is omitted. It can be seen that a higher SCR leads to higher grid power, Pgrid(pu). However, a higher R/X ratio causes lower grid power, Pgrid(pu). Therefore, inductive grids with a high SCR have a high power transfer capability, while resistive grids with a low SCR have a limited power transfer capability.
Moreover, in the resistive grid (Rg/Xg > 1) case, the higher the SCR, the lower the output power of the inverter, Pinv(pu). It seems counterintuitive. This is because more reactive power has to be supplied to maintain the PCC voltage so that the output active power of the inverter is limited. This indicates that it is uneconomical to use reactive power to compensate the PCC voltage in resistive grids because much of the potential active power capacity is sacrificed. Aiming at this problem, tuning the PCC voltage within a small range can reduce reactive power consumption and increase the power transfer capability in resistive grids, which will be analyzed in the next section.

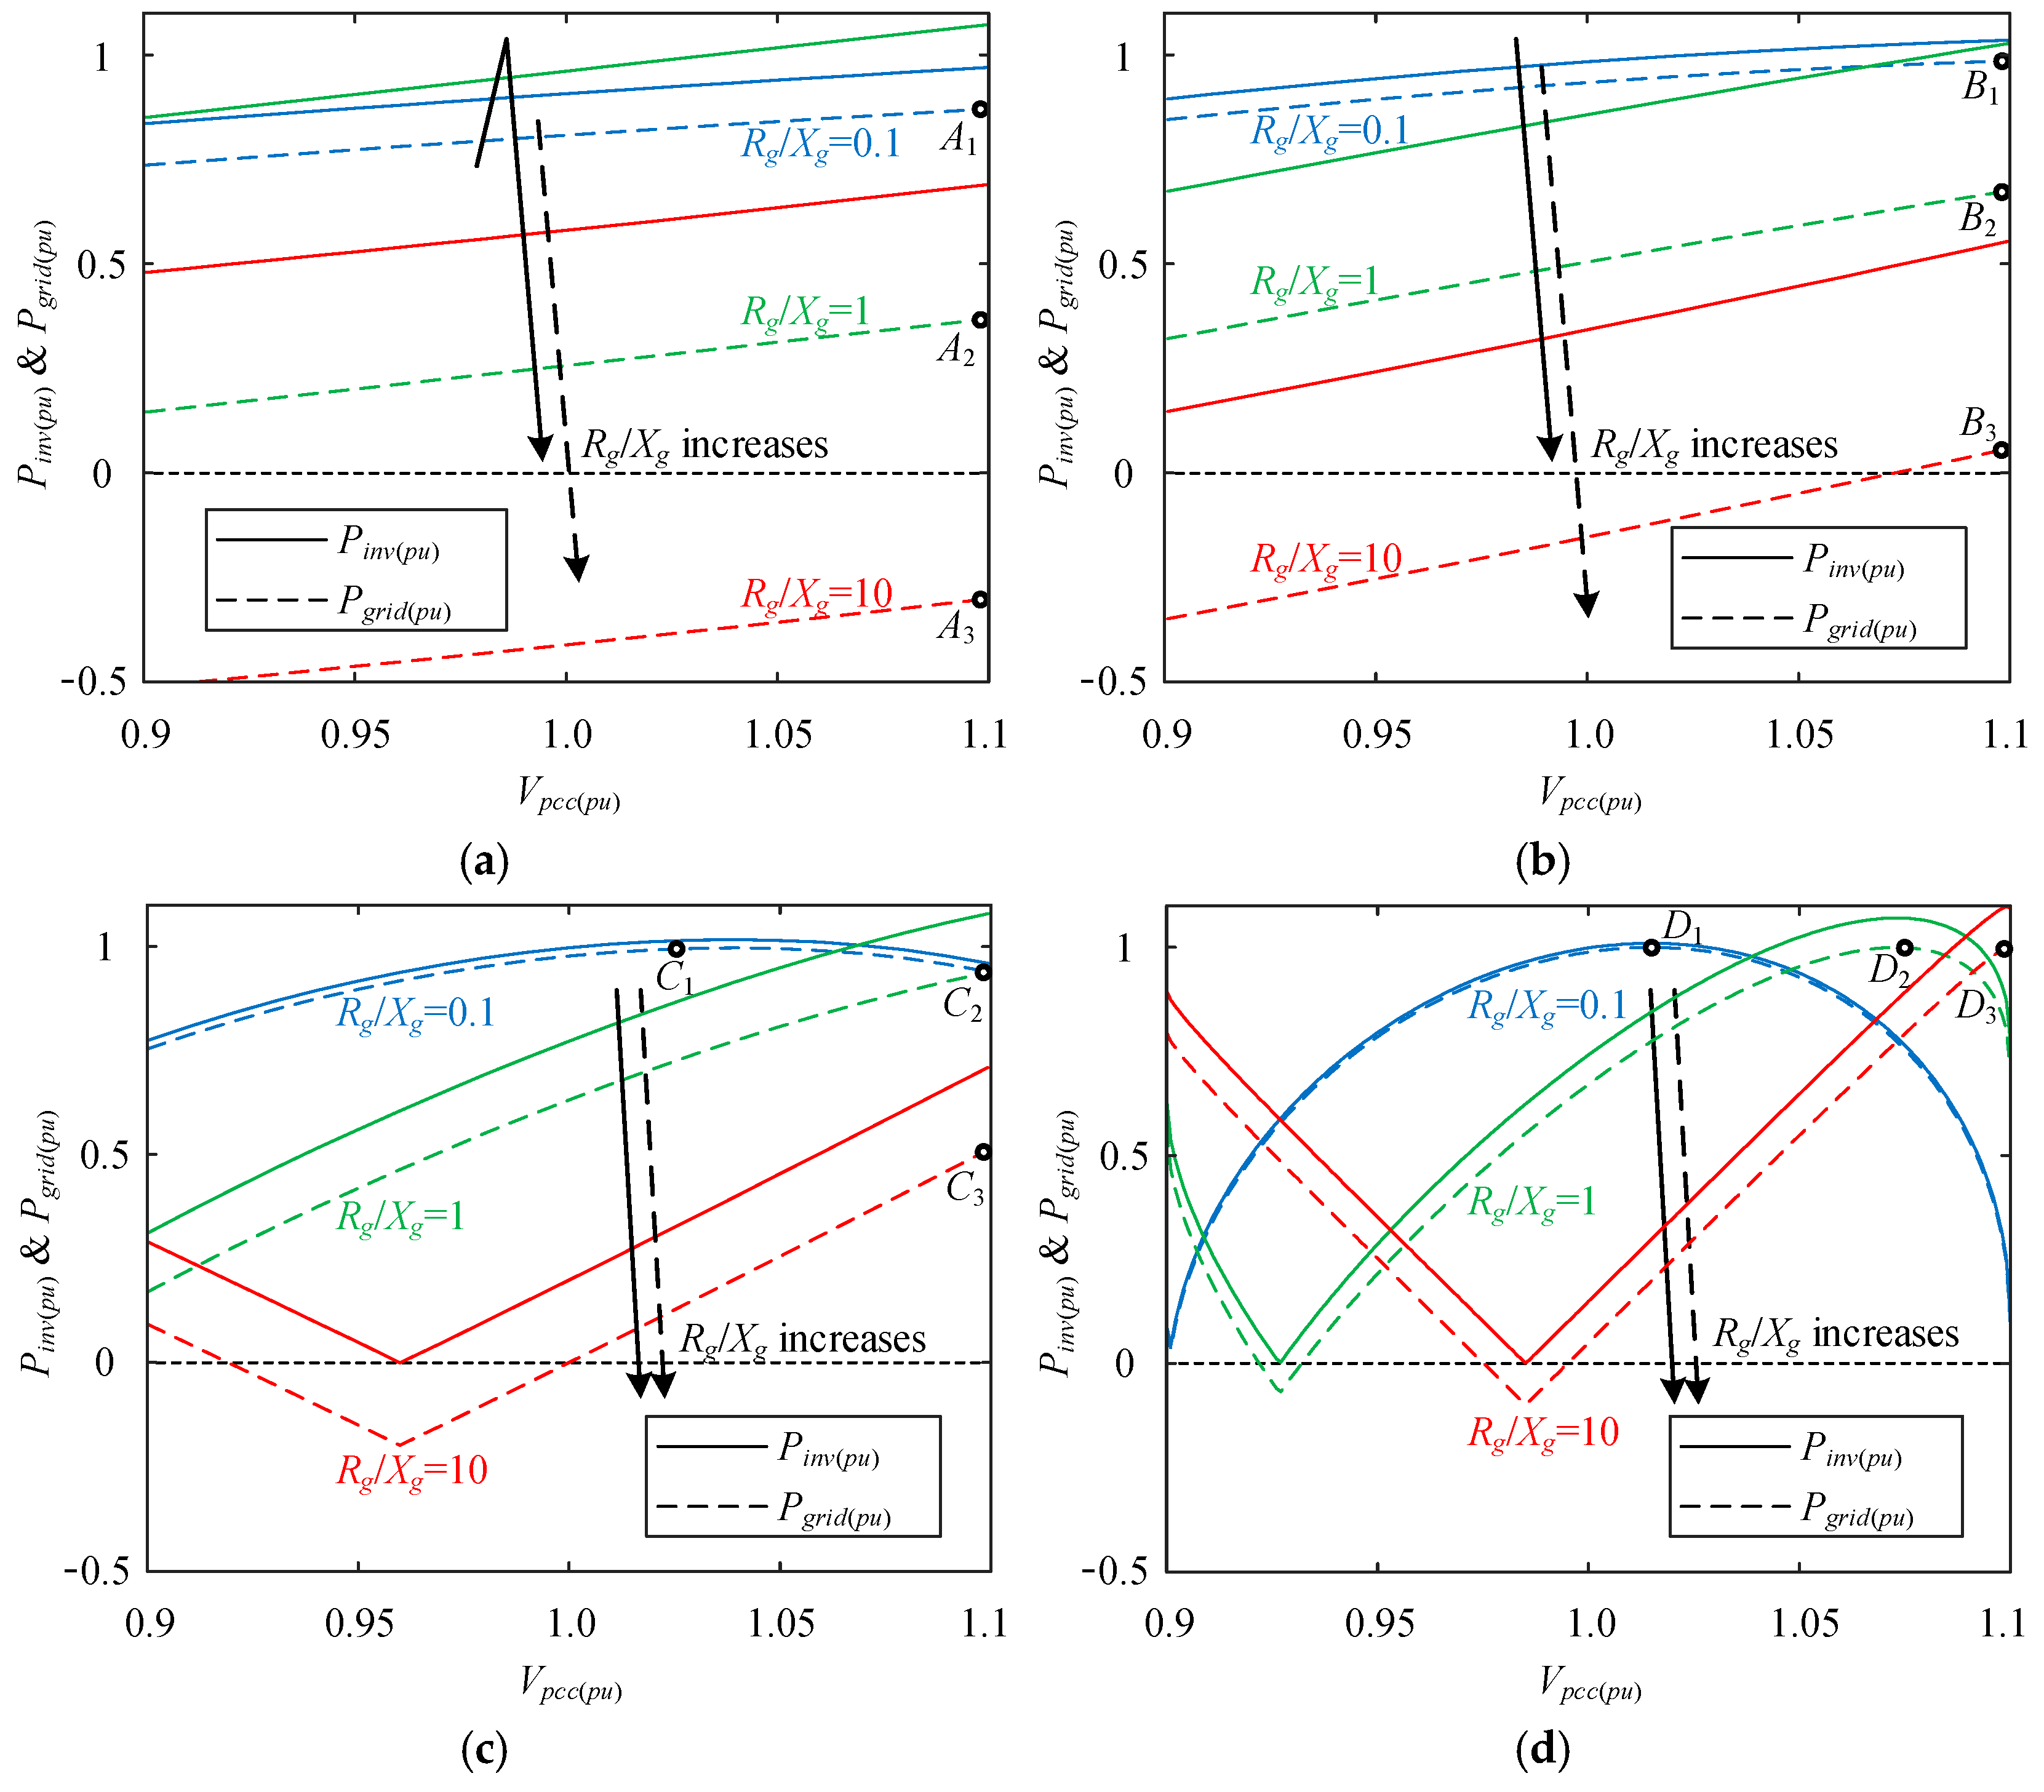
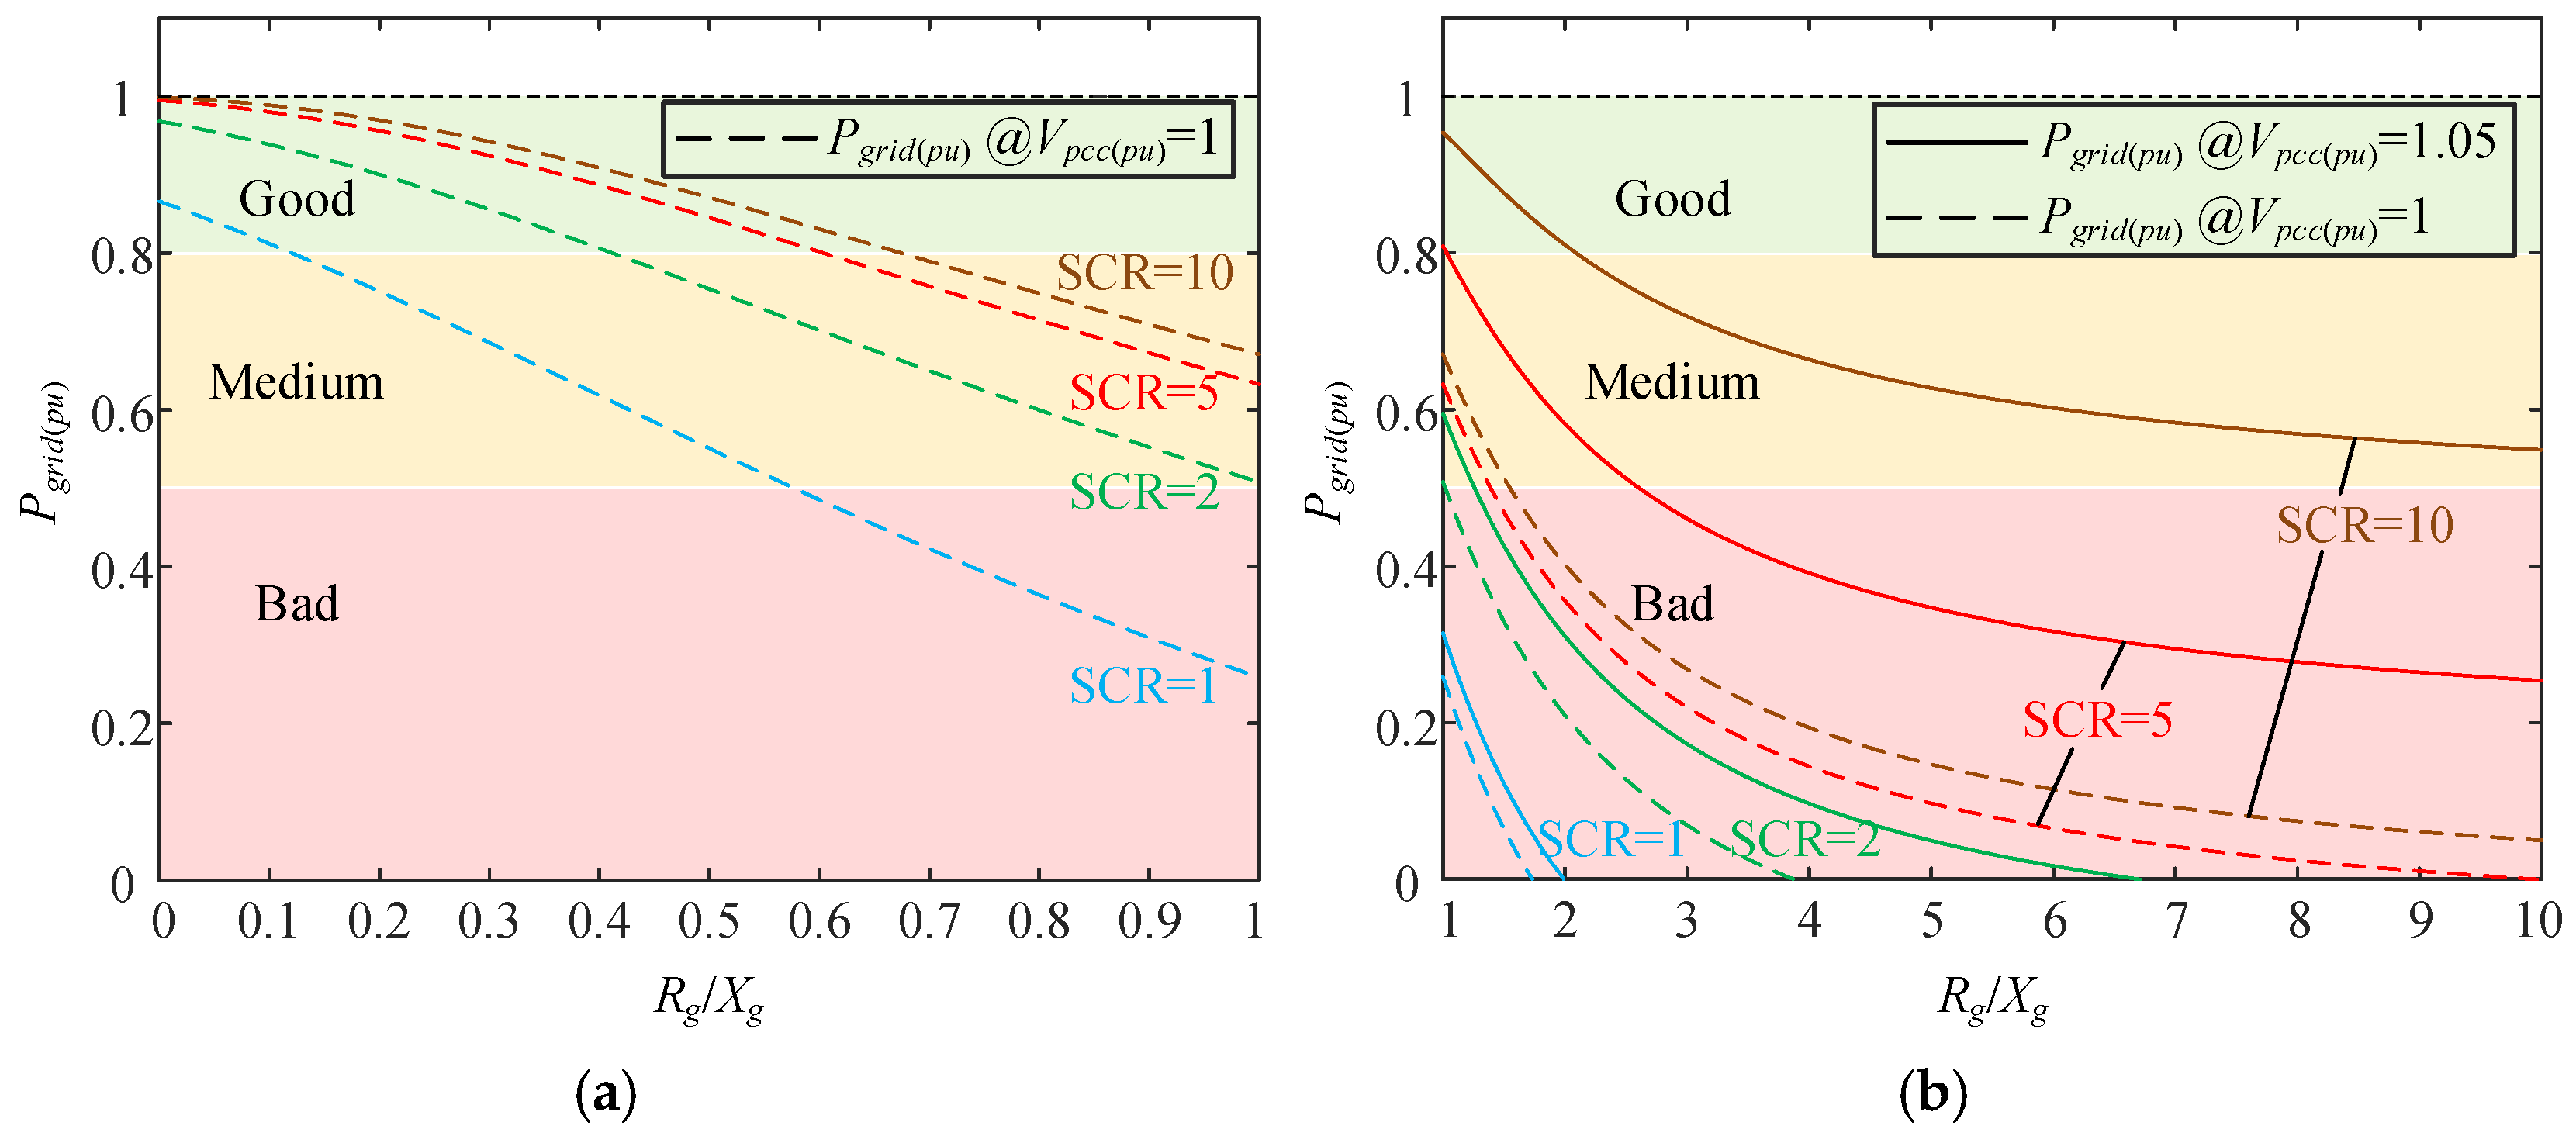
3. Maximum Power Transfer Capability of Grid-Connected Systems at Varying PCC Voltages

In the previous section, the situation where the PCC voltage equals the rated value was evaluated. A more general situation where the PCC voltage varies within a small range around the rated value will be analyzed in this section.
By substituting Equations (2) and (8) into Equation (4), a standard quadratic equation for the q-axis inverter current iq can be obtained. Then, the positive solution of the quadratic equation is derived as Equation (18). Because the control law in the voltage PI controller is only suitable for the positive solution, the negative solution does not exist in the actual control system. Hence, it is disregarded here.
{ i q ( p u ) = i q I i n v ( m a x ) = 1 V p c c ( p u ) R g 2 / X g 2 + 1 ( V p c c ( p u ) 2 + 1 2 K 1 4 R g X g K 2 2 ) K 1 = S C R 2 ( V p c c ( p u ) 2 1 ) 2 + 1 S C R 2 , K 2 = S C R ( V p c c ( p u ) 2 1 ) + 1 S C R
where Vpcc(pu) is the per-unit value of the PCC voltage, expressed as “Vpcc(pu) = Vpcc/Vg”; K1 and K2 are two intermediate variables.
If the solution listed in Equation (18) exists, the expression in Equation (19) must be satisfied.
1 | V p c c ( p u ) + 1 | S C R 1 | V p c c ( p u ) 1 |
According to Equation (19), when the SCR is equal to 1, the range of Vpcc(pu) is [0, 2]. When the SCR is equal to 10, the range of Vpcc(pu) is [0.9, 1.1]. Hence, it is noted that the PCC voltage is naturally close to its rated value under strong grid conditions, where reactive power compensation may not be necessary. However, the PCC voltage varies easily under weak grid conditions. Thus, reactive power compensation is necessary to keep the PCC voltage close to its rated value.
When Equation (18) is substituted into Equation (8), the expression of the d-axis inverter current id can be derived as:
i d ( p u ) = i d I i n v ( m a x ) = 1 V p c c ( p u ) V p c c ( p u ) 2 1 2 + K 1 4 + ( 1 K 1 2 + V p c c ( p u ) 2 + 1 2 K 1 4 K 2 R g X g ) 1 R g 2 / X g 2 + 1
where the expressions of K1 and K2 are shown in Equation (18).
According to Equations (14) and (20), the output active power of the inverter (per unit) can be derived as:
P i n v ( p u ) = P i n v S N = V p c c ( p u ) i d ( p u ) = V p c c ( p u ) 2 1 2 + K 1 4 + ( 1 K 1 2 + V p c c ( p u ) 2 + 1 2 K 1 4 K 2 R g X g ) 1 R g 2 / X g 2 + 1
According to Equations (16) and (21), the transferred active power to the grid (per unit) can be derived as:
P g r i d ( p u ) = V p c c ( p u ) 2 1 2 + K 1 4 + ( 1 K 1 2 + V p c c ( p u ) 2 + 1 2 K 1 4 K 2 R g X g ) 1 R g 2 / X g 2 + 1 1 S C R R g X g R g 2 / X g 2 + 1
According to Equations (21) and (22), Figure 6 presents the relationship between inverter power Pinv(pu), grid power Pgrid(pu), and PCC voltage Vpcc(pu) with different Rg/Xg ratios and SCRs. Moreover, the points (A1, A2, A3), (B1, B2, B3), (C1, C2, C3), and (D1, D2, D3) in Figure 6 are the maximum value points of Pgrid(pu).
As shown in Figure 6a,b, when the SCR is low, the grid power Pgrid(pu) drops significantly as the R/X ratio increases. For example, the maximum value of Pgrid(pu) decreases from point A1 to A2 and A3 as the R/X ratio increases. However, as presented in Figure 6c,d, when the SCR is high, the maximum value of Pgrid(pu) can stay at a high level, such as points D1, D2, and D3. Therefore, a larger SCR is beneficial for power transmission.
Comparing the maximum power points (A1, A2, A3), (B1, B2, B3), (C1, C2, C3), and (D1, D2, D3) in Figure 6, the rated PCC voltage in the inductive grid (Rg/Xg = 0.1) is appropriate for power transmission. In contrast, a higher PCC voltage than the rated value in the resistive grid (Rg/Xg = 10) is beneficial for power transmission. Furthermore, as shown in Figure 6a, the value of Pgrid(pu) in the resistive grid (Rg/Xg = 10) is lower than 0 whatever the PCC voltage is, which means that the resistive weak grid cannot be used for power transmission. Hence, a required minimum SCR should be known in the resistive grid.

4. Optimal Parameters for Maximum Power Operation in Inductive and Resistive Grids

Based on the aforementioned analysis, the maximum power transfer capability of the grid-connected system is jointly determined by the SCR and the R/X ratio as well as the PCC voltage. Therefore, the optimal values of these parameters for effective power transmission need to be investigated in a mathematical manner.
According to Equation (17), when the PCC voltage is at the rated value, the partial derivatives of Pgrid(pu) can be derived as:
P g r i d ( p u ) R g X g = 1 2 + R g X g S C R 2 1 4 S C R ( 1 + R g 2 X g 2 ) 3 < 0
P g r i d ( p u ) S C R = 1 2 + R g X g S C R 2 1 4 2 S C R 2 1 + R g 2 X g 2 S C R 2 1 4 > 0
It can be seen from Equation (23), the partial derivative from Pgrid(pu) to the R/X ratio is smaller than 0, which means that as the R/X ratio decreases, Pgrid(pu) increases. Namely, R/X = 0 is the theoretically optimal value for power transmission. Moreover, it can be seen from Equation (24), the partial derivative from Pgrid(pu) to the SCR is larger than 0, which means that as the SCR increases, Pgrid(pu) increases. Namely, SCR = ∞ is the theoretically optimal value for power transmission. Obviously, these two optimal values, in theory, cannot be obtained in real applications. Nevertheless, a higher SCR or a lower R/X ratio is beneficial to increase the power transfer capability of the system.
Aside from the SCR and the R/X ratio, the PCC voltage is another key parameter affecting the maximum power transfer capability of the system. As aforementioned, the rated PCC voltage in an inductive grid is appropriate for power transmission, while a higher PCC voltage than the rated value in a resistive grid is beneficial for power transmission. Thus, according to Equation (22), the curves for maximum Pgrid(pu) with different Rg/Xg ratios, SCRs, and PCC voltages are shown in Figure 7. Figure 7a presents the inductive grid impedance case, where the rated PCC voltage is preferable to be used. Figure 7b shows the resistive grid impedance case, where the power curves at two PCC voltages are compared. Obviously, a higher PCC voltage is better than the rated PCC voltage.
Based on the above analysis, Pgrid(pu) in Equation (22) can be considered a key performance index to quantify the performance of the system at different Vpcc, SCRs, and R/X values. Namely, if Pgrid(pu) is within [0.8, 1], the performance of the system is good. If Pgrid(pu) is within [0.5, 0.8], the performance is medium. If Pgrid(pu) is lower than 0.5, the performance of the system is bad. Hence, the suitable Vpcc, SCRs, and R/X values can be found according to this definition of performance.
It was reported in [21] that the R/X ratio of the high voltage line is around 0.3, while the R/X ratio of the low voltage line is around 7 in real applications. Thus, as shown in Figure 7a, when the R/X ratio is 0.3, an SCR higher than 2 is required in order to make Pgrid higher than 0.8 pu (good performance). Moreover, as shown in Figure 7b, when the R/X ratio is 7, an SCR higher than 10 and a PCC voltage higher than 1.05 pu are required in order to make Pgrid higher than 0.5 pu (medium performance).
In order to apply the above research to practical projects, a case study on wind generation is discussed, as follows. Question: How to increase the penetration level from 20% to 40% for wind generation connected to an inductive grid with Rg/Xg = 0.3 and SCR = 3? If the penetration level is increased from 20% to 40%, the rated power SN will be doubled, and the SCR will become 3/2. As shown in Figure 7a, when the Rg/Xg is 0.3, an SCR higher than 2 is preferable. Thus, the grid impedance |Zg| should be reduced to 3/4. For example, increasing the voltage level can reduce grid impedance. Moreover, since the low inertia in wind generation systems may cause frequency instability issues, grid-forming control techniques on inverters are recommended to support the grid frequency. Moreover, energy storage systems (ESSs) can also be used to smooth the wind energy and realize an uninterrupted supply of power.

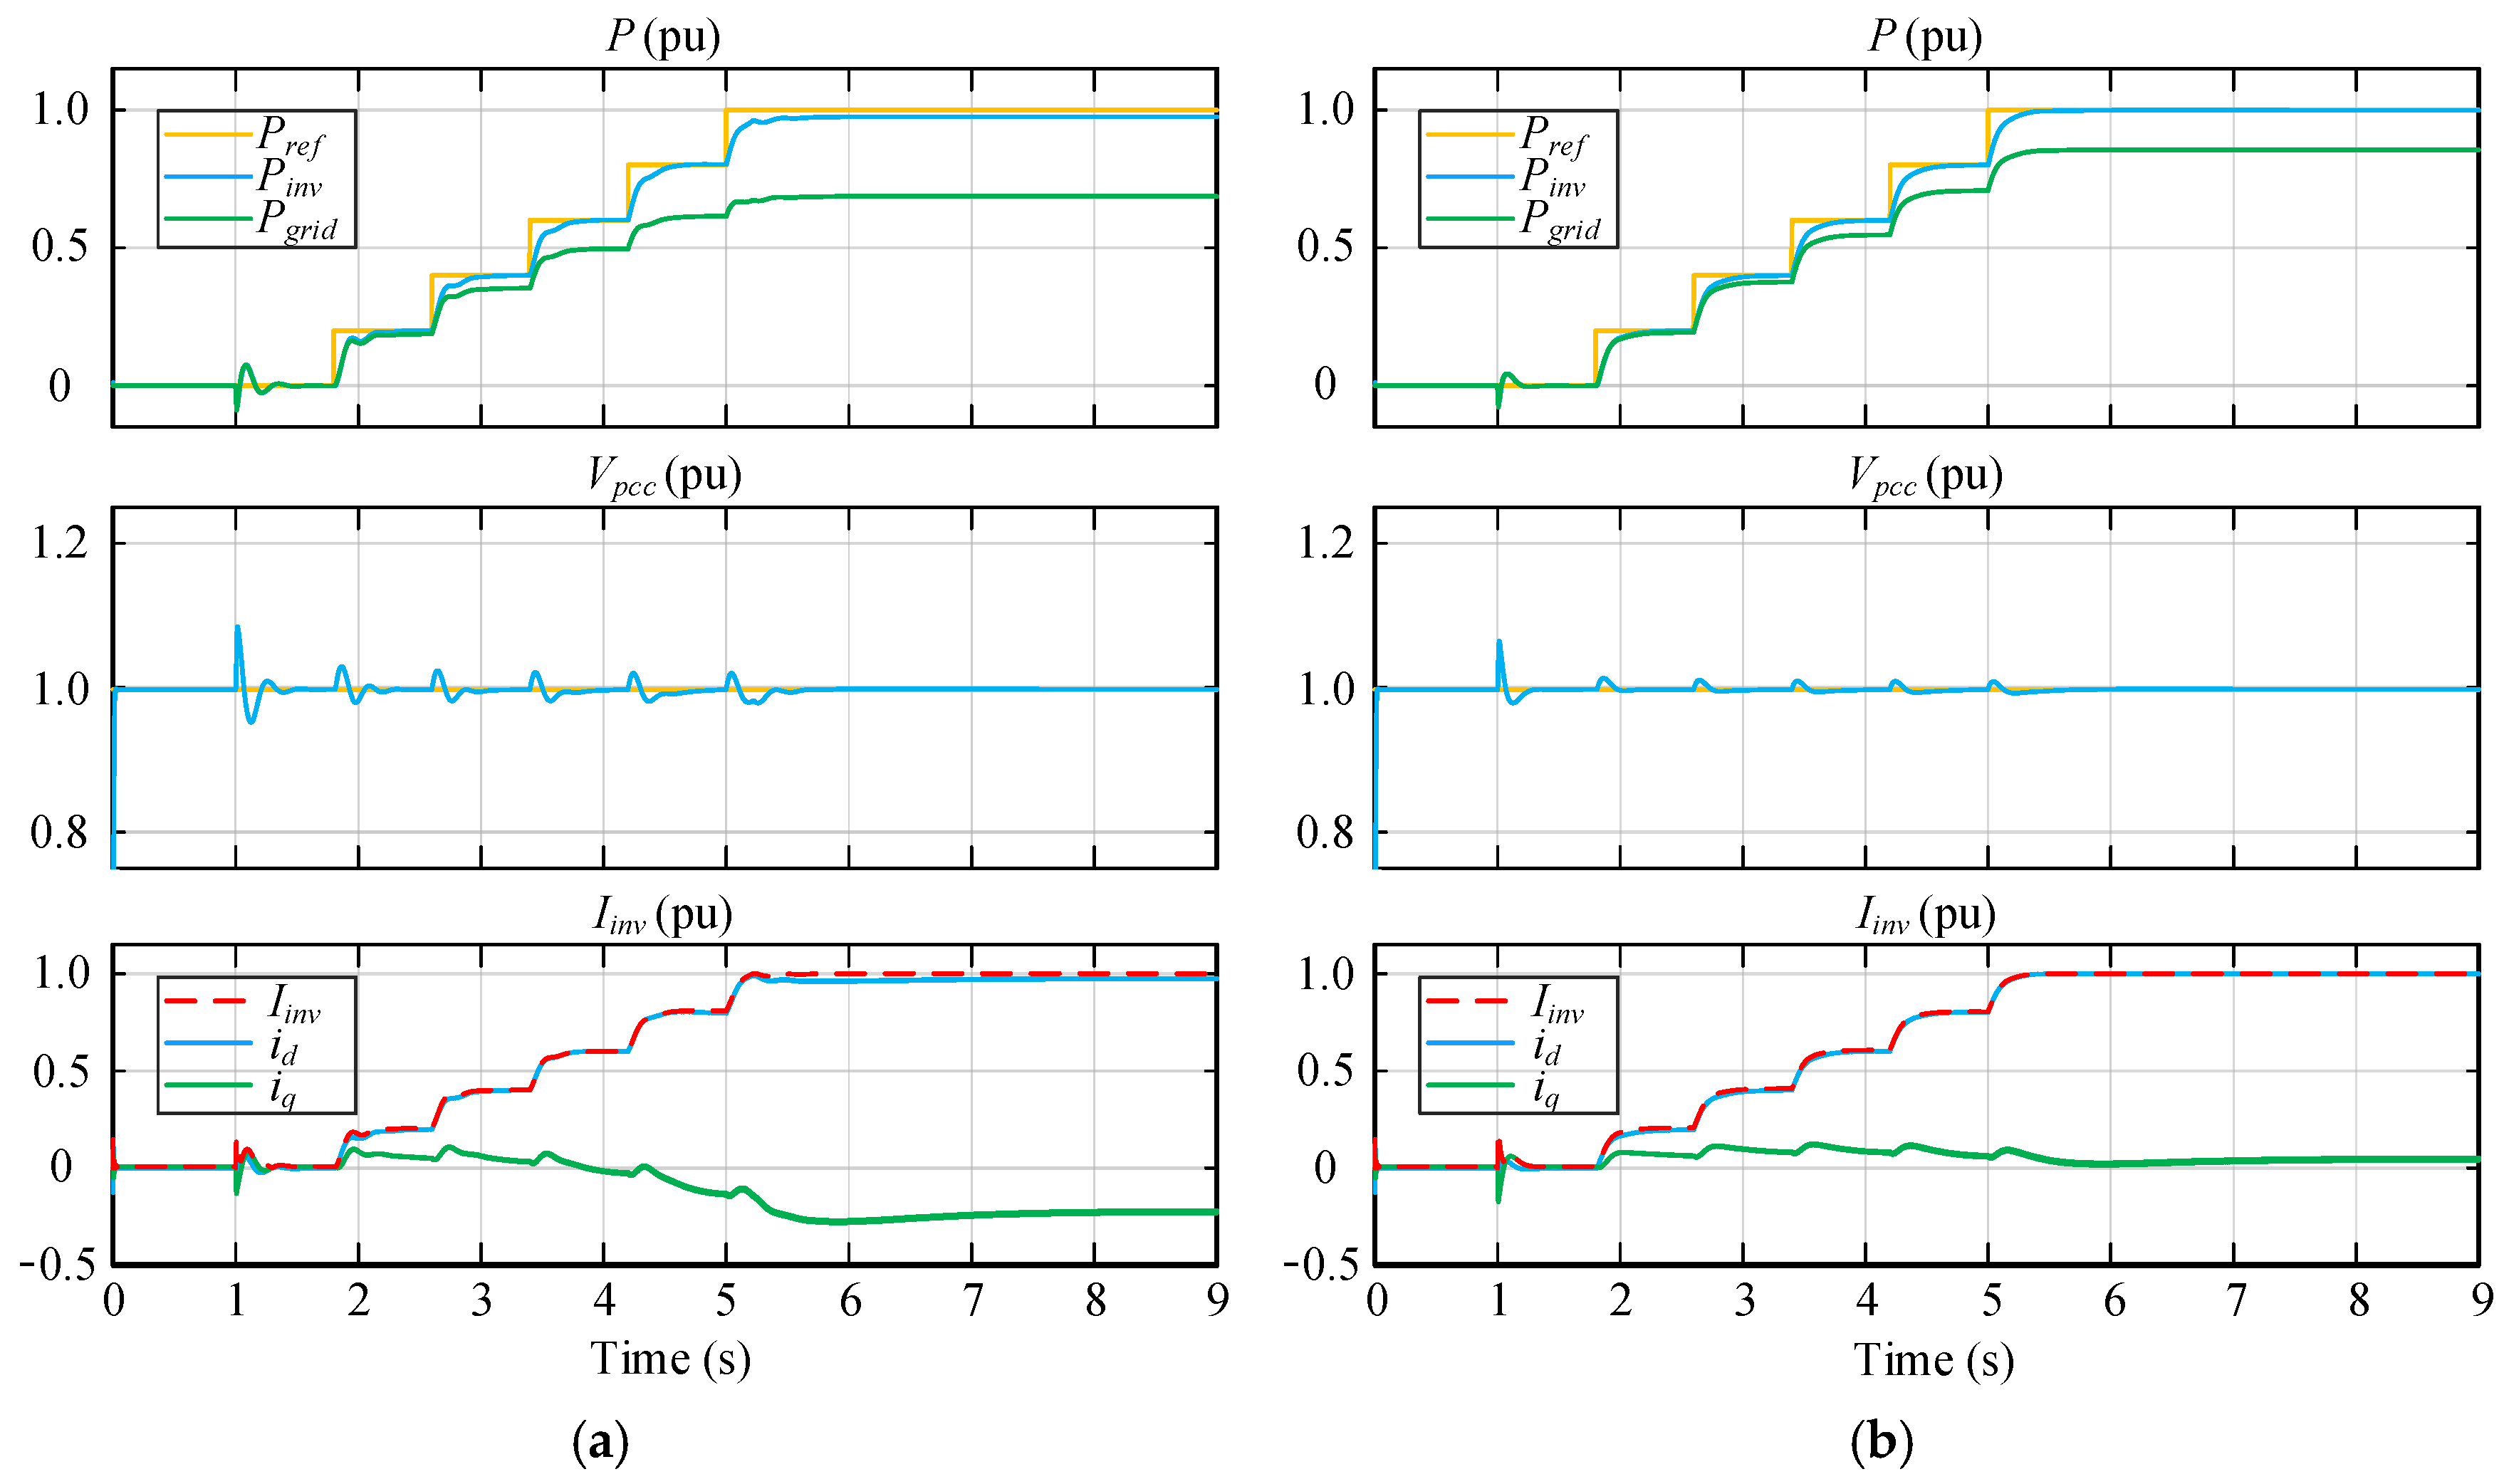
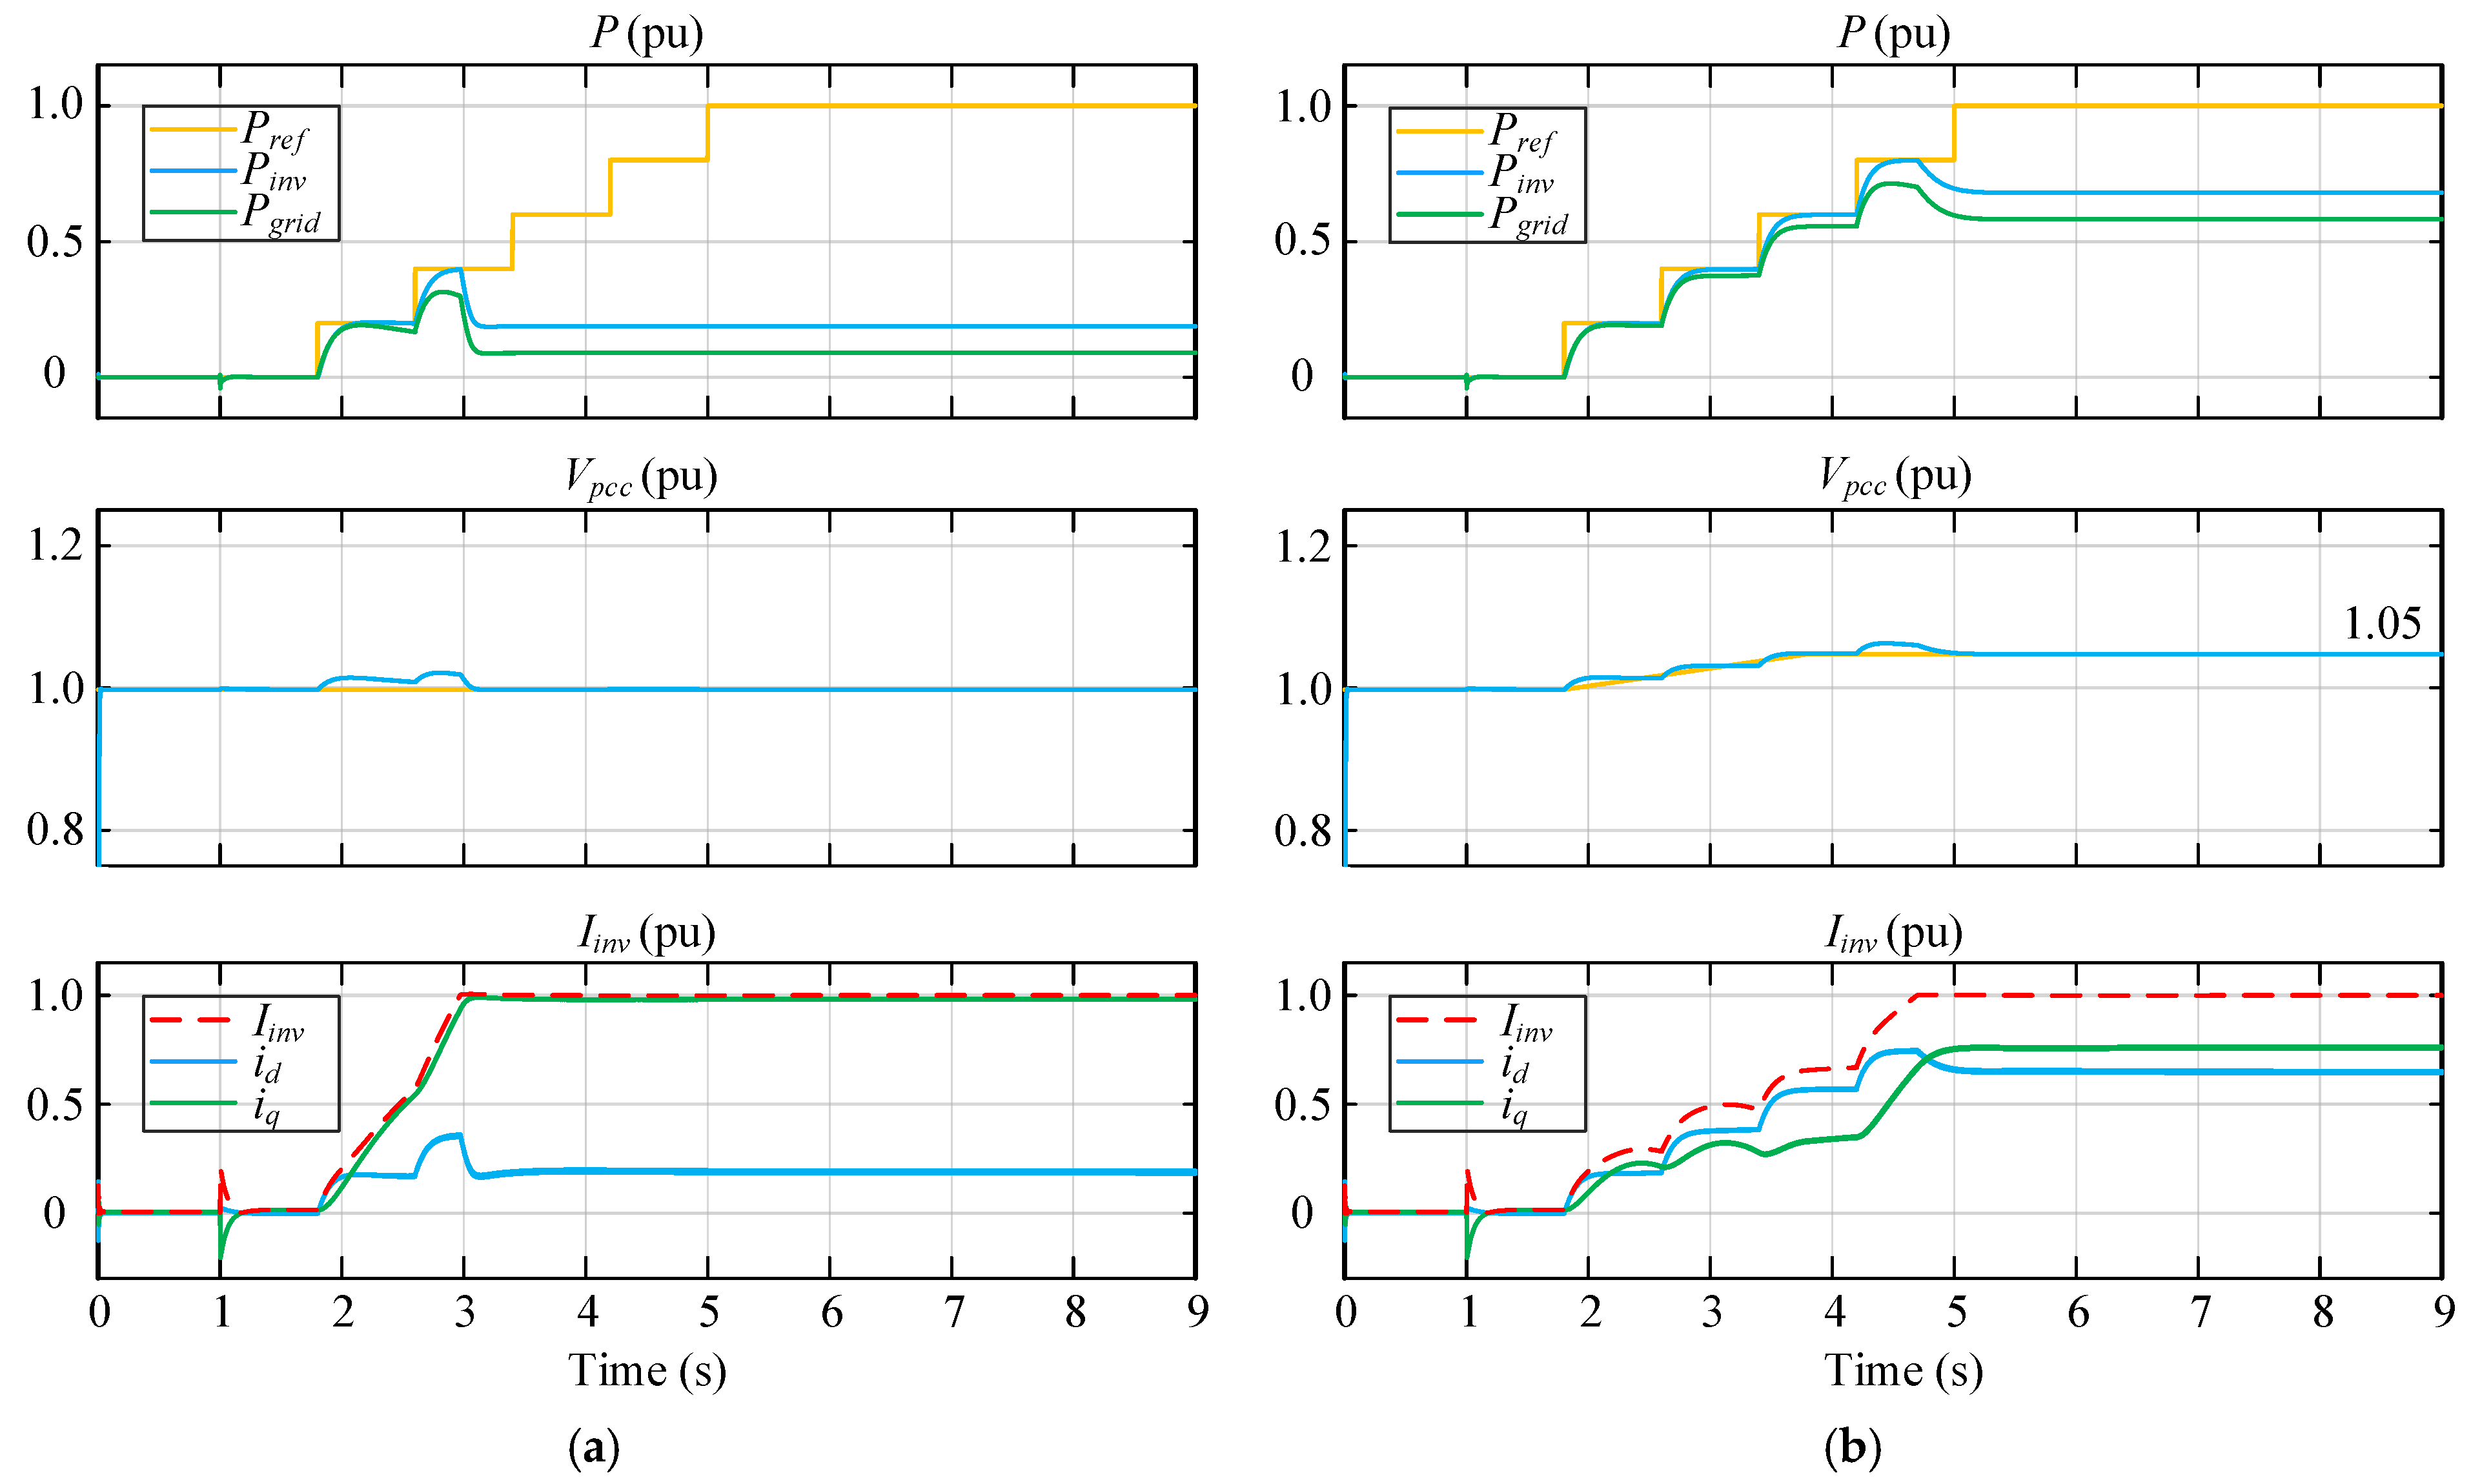
5. Simulation Verification

In order to verify the effectiveness of the theoretical analysis, a 30 kW grid-connected inverter simulation model with classical vector current control was established in Matlab/Simulink. The control method is shown in Figure 8. To avoid the influence of high-frequency harmonics, the average model of the inverter was used. Firstly, an inductive grid case (Rg/Xg = 0.3) with low SCRs was carried out. Then, a resistive grid case (Rg/Xg = 7) with SCR = 10 was performed. The key parameters of the grid-connected inverter are listed in Table 1. Moreover, the parameters of grid impedance in the inductive grid and resistive grid cases are summarized in Table 2.
The simulation results of the inductive grid case are shown in Figure 9, where the power reference Pref, the output active power of inverter Pinv, and the transferred active power to the grid Pgrid are presented, respectively. Moreover, Iinv is the amplitude of the inverter current, and id and iq are the d-axis and q-axis components of the inverter current. It can be seen that as the power reference increases, the current amplitude Iinv increases. When Iinv reaches 1 pu, id is limited; thus, Pinv is also limited. In the steady state, the maximum value of Pgrid represents the maximum power transfer capability of the grid-connected inverter. As shown in Figure 9a, when the SCR is equal to 1, the maximum value of Pgrid is around 0.70 pu. Moreover, as shown in Figure 9b, when the SCR is equal to 2, the maximum value of Pgrid is around 0.85 pu. These simulation results agree well with the maximum power operating points for Rg/Xg = 0.3, as shown in Figure 7a.
The simulation results of the resistive grid case are shown in Figure 10, focusing on the power reference Pref, the output active power of the inverter Pinv, and the transferred active power to the grid Pgrid. Figure 10 shows that as the power reference increases, the current amplitude Iinv increases. When Iinv reaches 1 pu, id is limited and Pinv is also limited. In Figure 10a, the PCC voltage is controlled as 1 pu. It can be seen that iq is quite large but id is small, so that the output active power of the inverter Pinv is limited (as low as 0.2 pu), and the grid power Pgrid is only 0.1 pu. In contrast, as shown in Figure 10b, when the PCC voltage is controlled as 1.05 pu, id is not so small. Thus, the output active power of the inverter Pinv is 0.7 pu and the grid power Pgrid is only 0.6 pu. These simulation results are in accordance with the maximum power operating points for Rg/Xg = 7 and SCR = 10, as shown in Figure 7b.
It can be seen in Figure 9 and Figure 10 that there is a steady-state error on the power Pinv when the current reaches the limiting value. In fact, this steady-state error is equal to (1-Pinv(pu)). According to the expression of Pinv(pu) in Equation (21), the steady-state error can be calculated accurately. The power steady-state errors in different cases are compared in Table 3. It can be seen that for the inductive grid case, the rated PCC voltage has a relatively small power steady-state error. As the R/X ratio increases, a higher PCC voltage has a smaller power steady-state error, which can also be observed from Figure 6d. Moreover, when Vpcc(pu) is equal to 1, the impact of the R/X ratio and the SCR on Pinv(pu) are shown in Figure 5. It can be seen in Figure 5 that there is a maximum power point on each constant SCR curve. When R/X ratios are smaller than the R/X ratios at the maximum power points, Pinv(pu) increases as SCR increases. However, when R/X ratios are larger than the R/X ratios at the maximum power points, Pinv(pu) decreases as SCR increases. Even so, the R/X ratio at each maximum power point is not the optimal one because the optimal R/X ratio should be determined by Pgrid(pu).

6. Conclusions

This paper investigates the maximum power transfer capability of grid-connected inverters, which is jointly determined by the SCR, the R/X ratio of grid impedance, and the PCC voltage amplitude. The maximum power curves in the inductive grid and resistive grid cases, with different SCRs and PCC voltages, are illustrated and benchmarked. It is revealed that increasing the SCR or reducing the R/X ratio of grid impedance can increase the maximum power transfer capability of the system. In order to have higher power transfer capability, SCR > 2 and R/X < 1 are recommended to be used. Moreover, under resistive grid conditions, a higher PCC voltage than the rated value is beneficial for power transmission. Based on this research, a suitable SCR can be designed for high-penetration renewable generation systems in practice. Finally, simulation results verified the effectiveness of the theoretical analysis.

Author Contributions

Conceptualization, C.W.; methodology, L.H.; validation, L.H.; writing—original draft preparation, L.H.; writing—review and editing, C.W., D.Z. and F.B. All authors have read and agreed to the published version of the manuscript.

Funding

This research was funded by THE VELUX FOUNDATIONS under the VILLUM Investigator Grant—REPEPS, grant number 00016591.

Institutional Review Board Statement

Not applicable.

Informed Consent Statement

Not applicable.

Data Availability Statement

Not applicable.

Conflicts of Interest

The authors declare no conflict of interest.

References

  1. Blaabjerg, F.; Yang, Y.; Yang, D.; Wang, X. Distributed Power-Generation Systems and Protection. Proc. IEEE 2017, 105, 1311–1331. [Google Scholar] [CrossRef] [Green Version]
  2. Brown, T. Transmission network loading in Europe with high shares of renewables. IET Renew. Power Gener. 2015, 9, 57–65. [Google Scholar] [CrossRef]
  3. Lorenzen, S.L.; Nielsen, A.B.; Bede, L. Control of a grid connected converter during weak grid conditions. In Proceedings of the IEEE International Symposium on Power Electronics for Distributed Generation Systems, Vancouver, BC, Canada, 27–30 June 2016; pp. 1–6. [Google Scholar]
  4. Flourentzou, N.; Agelidis, V.G.; Demetriades, G.D. VSC-Based HVDC Power Transmission Systems: An Overview. IEEE Trans. Power Electron. 2009, 24, 592–602. [Google Scholar] [CrossRef]
  5. Van Eeckhout, B.; Van Hertem, D.; Reza, M.; Srivastava, K.; Belmans, R. Economic comparison of VSC HVDC and HVAC as transmission system for a 300 MW offshore wind farm. Eur. Trans. Electr. Power 2009, 20, 661–671. [Google Scholar] [CrossRef]
  6. Khazaei, J.; Idowu, P.; Asrari, A.; Shafaye, A.; Piyasinghe, L. Review of HVDC control in weak AC grids. Electr. Power Syst. Res. 2018, 162, 194–206. [Google Scholar] [CrossRef]
  7. Zhou, J.Z.; Gole, A.M. VSC transmission limitations imposed by AC system strength and AC impedance characteristics. In Proceedings of the IET International Conference on AC and DC Power Transmission, Birmingham, UK, 4–5 December 2012; pp. 1–6. [Google Scholar]
  8. Etxegarai, A.; Eguia, P.; Torres, E.; Iturregi, A.; Valverde, V. Review of grid connection requirements for generation assets in weak power grids. Renew. Sustain. Energy Rev. 2015, 41, 1501–1514. [Google Scholar] [CrossRef]
  9. Collins, L.; Ward, J.K. Real and reactive power control of distributed PV inverters for overvoltage prevention and increased renewable generation hosting capacity. Renew. Energy 2015, 81, 464–471. [Google Scholar] [CrossRef]
  10. Egea-Alvarez, A.; Fekriasl, S.; Hassan, F.; Gomis-Bellmunt, O. Advanced vector control for voltage source converters connected to weak grids. IEEE Trans. Power Syst. 2015, 30, 3072–3081. [Google Scholar] [CrossRef] [Green Version]
  11. Givaki, K.; Chen, D.; Xu, L. Current Error Based Compensations for VSC Current Control in Weak Grids for Wind Farm Applications. IEEE Trans. Sustain. Energy 2018, 10, 26–35. [Google Scholar] [CrossRef] [Green Version]
  12. Li, Y.; Fan, L.; Miao, Z. Stability Control for Wind in Weak Grids. IEEE Trans. Sustain. Energy 2019, 10, 2094–2103. [Google Scholar] [CrossRef]
  13. Zhang, L.; Harnefors, L.; Nee, H.-P. Power-Synchronization Control of Grid-Connected Voltage-Source Converters. IEEE Trans. Power Syst. 2010, 25, 809–820. [Google Scholar] [CrossRef]
  14. Zhang, L.; Harnefors, L.; Nee, H.P. Interconnection of two very weak ac systems by VSC-HVDC links using power-synchronization control. IEEE Trans. Power Syst. 2019, 26, 344–355. [Google Scholar] [CrossRef]
  15. Wu, H.; Wang, X. Design-Oriented Transient Stability Analysis of Grid-Connected Converters With Power Synchronization Control. IEEE Trans. Ind. Electron. 2019, 66, 6473–6482. [Google Scholar] [CrossRef] [Green Version]
  16. Harnefors, L.; Hinkkanen, M.; Riaz, U.; Rahman, F.M.M.; Zhang, L. Robust Analytic Design of Power-Synchronization Control. IEEE Trans. Ind. Electron. 2019, 66, 5810–5819. [Google Scholar] [CrossRef] [Green Version]
  17. Egea-Alvarez, A.; Barker, C.; Hassan, F.; Gomis-Bellmunt, O. Capability curves of a VSC-HVDC connected to a weak AC grid considering stability and power limits. In Proceedings of the IET International Conference on AC and DC Power Transmission, Birmingham, UK, 10–12 February 2015; pp. 1–5. [Google Scholar]
  18. Suul, J.A.; Arco, S.D.; Rodriguez, P.; Molinas, M. Impedance-compensated grid synchronization for extending the stability range of weak grids with voltage source converters. IET Gener. Transm. Distrib. 2016, 10, 1315–1326. [Google Scholar] [CrossRef] [Green Version]
  19. Yang, D.; Wang, X.; Liu, F.; Xin, K.; Liu, Y.; Blaabjerg, F. Adaptive reactive power control of PV power plants for improved power transfer capability under ultra-weak grid conditions. IEEE Trans. Smart Grid 2019, 10, 1269–1279. [Google Scholar] [CrossRef] [Green Version]
  20. Golsorkhi, M.S.; Shafiee, Q.; Lu, D.D.-C.; Guerrero, J.M. Distributed Control of Low-Voltage Resistive AC Microgrids. IEEE Trans. Energy Convers. 2018, 34, 573–584. [Google Scholar] [CrossRef]
  21. Engler, A.; Soultanis, N. Droop control in LV-grids. In Proceedings of the IEEE International Conference on Future Power Systems, Amsterdam, The Netherlands, 18 November 2005; pp. 1–6. [Google Scholar]
  22. Huang, L.; Wu, C.; Zhou, D.; Blaabjerg, F. Grid impedance impact on the maximum power transfer capability of grid-connected inverter. In Proceedings of the IEEE 12th Energy Conversion Congress and Exposition—Asia (ECCE-Asia), Singapore, 24–27 May 2021. (Accepted for publication). [Google Scholar]
  23. Weckx, S.; Driesen, J. Optimal Local Reactive Power Control by PV Inverters. IEEE Trans. Sustain. Energy 2016, 7, 1624–1633. [Google Scholar] [CrossRef]
  24. Molina-Garcia, A.; Mastromauro, R.A.; Garcia-Sanchez, T.; Pugliese, S.; Liserre, M.; Stasi, S. Reactive Power Flow Control for PV Inverters Voltage Support in LV Distribution Networks. IEEE Trans. Smart Grid 2017, 8, 447–456. [Google Scholar] [CrossRef] [Green Version]
Figure 1. Typical configuration of grid-connected wind and PV generation systems.
Applsci 11 04288 g001
Figure 2. Equivalent circuit of the grid-connected generation system.
Applsci 11 04288 g002
Figure 3. Relationship between ideal maximum inverter power Pinv(pu)max and SCRs with different Rg/Xg.
Applsci 11 04288 g003
Figure 4. Voltage and current vector diagrams of the grid-connected system with various impedance characteristics of the power grid. (a) Purely inductive impedance; (b) purely resistive impedance; (c) hybrid impedance.
Applsci 11 04288 g004
Figure 5. Relationship between inverter power Pinv(pu), grid power Pgrid(pu), and Rg/Xg ratio with different SCRs at the rated PCC voltage.
Applsci 11 04288 g005
Figure 6. Relationship between inverter power Pinv(pu), grid power Pgrid(pu), and PCC voltage Vpcc(pu) with different Rg/Xg ratios and SCRs. (a) SCR = 1; (b) SCR = 2; (c) SCR = 5; (d) SCR = 10.
Applsci 11 04288 g006
Figure 7. Curves for maximum Pgrid(pu) with different Rg/Xg ratios, SCRs, and PCC voltages. (a) Inductive grid impedance case; (b) resistive grid impedance case.
Applsci 11 04288 g007
Figure 8. Classical grid-following vector current control method.
Applsci 11 04288 g008
Figure 9. Simulation results of the inductive grid case with Rg/Xg = 0.3 and low SCRs. (a) SCR = 1; (b) SCR = 2.
Applsci 11 04288 g009
Figure 10. Simulation results of the resistive grid case with Rg/Xg = 7 and SCR = 10. (a) Vpcc = 1 pu; (b) Vpcc = 1.05 pu.
Applsci 11 04288 g010
Table 1. Parameters of grid-connected systems.
ParametersValues
VgGrid phase voltage (peak value)311 V
fgGrid frequency50 Hz
SNRated apparent power of inverter30 kVA
ImaxMaximum current of inverter (peak value)64.3 A
VdcDC-link voltage700 V
LfOutput filter inductor5 mH
CfOutput filter capacitor5 μF
Table 2. Parameters of grid impedances.
ParametersValues
(Inductive Case)
Values
(Resistive Case)
Rg/XgR/X ratio of grid impedance0.37
SCRShort circuit ratio1/210
LgGrid inductor14.7 mH/7.3 mH0.22 mH
RgGrid resistor1.38 Ω/0.69 Ω0.48 Ω
Table 3. Power steady-state error comparison in different cases.
Steady-State Error on PinvVpcc = 1 puVpcc = 1.05 puVpcc = 1.1 pu
Rg/Xg = 0.3SCR = 12.68%00
SCR = 20.08%00
SCR = 51.82%00
SCR = 102.90%068.39%
Rg/Xg = 1SCR = 522.57%4.97%0
SCR = 1025.84%022.22%
Rg/Xg = 7SCR = 576.03%50.76%25.33%
SCR = 1080.93%31.78%0
Publisher’s Note: MDPI stays neutral with regard to jurisdictional claims in published maps and institutional affiliations.

