
Aggression Detection in Social Media from Textual Data Using Deep Learning Models
by
 , ,
, ,
Umair Khan
1, 
Salabat Khan
1,2,*,
Atif Rizwan
2 ,
,
Ghada Atteia
3 ,
,
Mona M. Jamjoom
4,* and
Nagwan Abdel Samee
3 1
Department of Computer Science, COMSATS University Islamabad, Attock Campus, Attock 43600, Pakistan
2
Department of Computer Engineering, Jeju National University, Jejusi 63243, Korea
3
Department of Information Technology, College of Computer and Information Sciences, Princess Nourah bint Abdulrahman University, P.O. Box 84428, Riyadh 11671, Saudi Arabia
4
Department of Computer Sciences, College of Computer and Information Sciences, Princess Nourah bint Abdulrahman University, P.O. Box 84428, Riyadh 11671, Saudi Arabia
*
Authors to whom correspondence should be addressed.
Appl. Sci. 2022, 12(10), 5083; https://0-doi-org.brum.beds.ac.uk/10.3390/app12105083
Submission received: 4 April 2022
/
Revised: 9 May 2022
/
Accepted: 14 May 2022
/
Published: 18 May 2022
(This article belongs to the Special Issue Artificial Intelligence-Based Approaches for Future Cybersecurity Applications and Crime Detection)
Abstract
:It is an undeniable fact that people excessively rely on social media for effective communication. However, there is no appropriate barrier as to who becomes a part of the communication. Therefore, unknown people ruin the fundamental purpose of effective communication with irrelevant—and sometimes aggressive—messages. As its popularity increases, its impact on society also increases, from primarily being positive to negative. Cyber aggression is a negative impact; it is defined as the willful use of information technology to harm, threaten, slander, defame, or harass another person. With increasing volumes of cyber-aggressive messages, tweets, and retweets, there is a rising demand for automated filters to identify and remove these unwanted messages. However, most existing methods only consider NLP-based feature extractors, e.g., TF-IDF, Word2Vec, with a lack of consideration for emotional features, which makes these less effective for cyber aggression detection. In this work, we extracted eight novel emotional features and used a newly designed deep neural network with only three numbers of layers to identify aggressive statements. The proposed DNN model was tested on the Cyber-Troll dataset. The combination of word embedding and eight different emotional features were fed into the DNN for significant improvement in recognition while keeping the DNN design simple and computationally less demanding. When compared with the state-of-the-art models, our proposed model achieves an F1 score of 97%, surpassing the competitors by a significant margin.
1. Introduction
The internet has proven to be an excellent tool for public participation. Many meaningful conversations are conducted on social media via the internet. Moreover, people rely on social media to communicate their; social media has essentially transformed the whole world into a global village. However, this rapid shift toward digitalization comes with concerns, one of which is cyberbullying. Cyberbullying involves harassing, humiliating, threatening, or hassling other people using social media platforms. It is challenging to reduce cyberbullying due to anonymous profiles. Since cyberbullying leads humans to psychological and emotional disorders, online bullying is more dangerous than physical bullying. According to [1], 8% of social media users are unaware of cyberbullying, while many of them may be bullied.
Cyberbullying can be classified into different types, such as racism, sexism, cyber aggression, etc. According to [2], cyber aggression involves aggressive or hateful behavior towards others on online platforms. Hate based on race, nationality, religion, color, gender, and other factors, are considered the main motive of cyber aggression [3]. Online bullying may lead to similar issues in all people, irrespective of age. According to a new survey [4], almost 3.3M Facebook posts and 4.5M tweets are posted by people every single minute. However, these statistics are increasing each day. By analyzing and extracting reviews on particular issues, products, or celebrities, one can see that these vast amounts of tweets or Facebook posts often contain offensive text.
According to [5], cyberbullying is a serious danger to social media users as the victims of cyberbullying become susceptible to many problems, such as low self-esteem, fear, anxiety, anger, and even suicide. According to statistical results obtained by [6], 25% of internet users are bullied, and 1 out of 3 teenagers are threatened online. Furthermore, about 145M active users daily post tweets on Twitter, regarding many topics, while 36% of these social media users were bullied in the year 2020 [7]. It is difficult to stop cyberbullying on social media; however, intelligent solutions could alleviate the problem of online bullying. Keeping in mind the requirements of automatic recognition of cyberbullying contents, machine learning and deep learning models are apparent.
Cyber aggression detection is a fundamental problem of natural language processing (NLP). The critical part is to preprocess the data to remove unwanted text and tokenize the data for further processing. Afterward, feature extraction and selection are performed to prepare the data for input to machine learning or deep learning models. Much research has been conducted using conventional machine learning models. The study in [8] employed traditional machine learning models to perform text classification. They used support vector machine (SVM), logistic regression (LR), and naïve Bayes (NB) as classification models. The authors of [9] also performed a comparative analysis of the machine learning models. Another study [10] used naïve Bayes and SVM to identify cyberbullying in Arabic text. The limitation in [9] is that they only used textual features and basic machine learning models. However, it is difficult to achieve significant improvements in cyber aggression detection using machine learning algorithms while using traditional feature extraction methods, such as term frequency-inverse document frequency (TF-IDF), Word2Vec, etc. Identifying emotions without facial expressions and voice tones is still an operose task. Understanding emotions from textual data is difficult as there is limited text length on Twitter and the use of internet slang and sarcasm. To overcome this difficulty, deep learning involves robust models, such as the dense neural network (DNN) [10], multilayer perceptron (MLP), long short-term memory (LSTM), recurrent neural network (RNN), and convolutional neural network (CNN). As deep learning has the capability to learn deep high-level features, some variants of these networks demonstrate superior performance in text classification [11].
Our research focused on the detection of cyber aggression using deep learning models. Our framework, of the proposed model will be described in Section 3, which demonstrates the entire flow of the proposed methodology. The framework for aggression detection is based on the combination of novel emotional features and Word2Vec features.
The contributions are as follows:
- 1.
- The proposed model extracts eight novel emotional features from the textual tweets to evaluate their roles in identifying aggressive statements.
- 2.
- The DNN model is optimized with fine-tuned parameters, consuming fewer (possible number of) layers compared to its competitors to identify aggression.
- 3.
- The proposed DNN model is compared with the existing state-of-the-art models using various evaluation measures.
- 4.
- A hybridized model for combining manual feature extraction, feature selection, and feeding these features to a neural network for behavior analysis of tweets is presented for better performance.
The rest of the paper is organized as follows: Section 2 provides a detailed literature review of aggression detection. Section 3 describes the analysis and working of the proposed DNN algorithm in detail. The findings of the proposed approach are listed in Section 4. Finally, a comprehensive discussion of the results and future scope are presented in Section 5,which concludes the work.
2. Related Work
Rapid advancements in the ’social web’ have paved the path for conducting research in the field of NLP. Considering the social web as an active area of research, researchers have used different approaches, such as machine learning, deep learning, and NLP to identify the sentiment polarity expressed in various social media platforms. Social media applications, such as Twitter, weblogs, Facebook, etc., have become diverse language platforms where people of different languages, races, and communities comment every day on various topics, images, celebrities, etc. Consequently, the diversity of users on social media could lead to bullying, aggression, and hate speech threads. Due to the complexity of foreign languages, handling this kind of online behavior is a challenging task.
Some related terminologies used by researchers to represent aggression include cyberbullying [12,13,14], offensive language [15,16], hate speech [17,18,19], racism [20], and profanity [21]. The author in [22] compared cyber aggressors to non-cyber-aggressors and analyzed whether a non-cyber-aggressor consults a psychologist more than a cyber aggressor. The authors in [23] used text, network, and user-based features to detect aggression in a Twitter dataset. Moreover, they suggested that bullying victims relatively write fewer posts and participate less in discussions, while aggressors often participate in online discussions and try to put out more negativity. Another study [24] used the Lexicon-based method to identify hate speech. They used sentiment lexicon to perform a subjectivity analysis and achieved a 70% F1 score. The authors of [25] showed that the performance of offensive language detection could be improved by choosing effective text features, such as verbs, nouns, adjectives, several emoticons, and others.
The majority of research into computational linguistics often focuses on languages rich in resources, such as English. However, researchers have paid less attention to resource-poor languages due to the lack of resources, such as prepared datasets. However, numerous regional researchers have used machine learning algorithms to detect offensive language in social media posts of various languages. For instance, the authors of [26] presented their achievements in aggression detection in Hindi and Marathi, local Indian languages. They used bag-of-words (BOW) with multinomial-naïve Bayes (MNB), stochastic gradient descent (SGD), and LR as classification techniques. They used a small dataset and did not apply any deep learning models. Similarly, ref. [8] performed their experiments in Arabic text on Twitter by considering the strength of bullying messages. Article [5] focused on the analysis of user credibility to classify Indonesian text messages as bullying or non-bullying, by using state-of-the-art approaches of SVM and KNN. Moreover, ref. [27] performed their experiments on Twitter data for aggression detection using a single feature, i.e., TF-IDF, and a straightforward method, MLP. The technique presented in [27] can be improved further by the features proposed in this paper. A study conducted by [28] made a machine learning model for offensive language detection in German text. Another study [29] applied various models of machine learning to classify tweets in German to detect offensive text. A classifier ensemble was used in the study [30] to detect offensive text from web pages in Portuguese. Moreover, an n-gram was used by [17,31] to detect offensive language in Arabic text from online comments. The study by [32] used a support vector machine, naïve Bayes, and a decision tree with n-gram features of grouped words to detect abusive text on Indonesian social media. Similarly, other researchers [33,34] also performed experiments to detect abusive text using the Indonesian language. The majority of researchers performed extensive experiments to identify cyberbullying detection on English datasets. Several studies are discussed below.
In [35], the authors performed experiments to identify ’bully’ traces on the social network. They used syntactic and semantic features for textual data based on emojis to identify ‘bully’ traces on the Twitter dataset. Furthermore, they tested their model with other social media datasets, such as YouTube and Formspring. Ref. [36] composed a model with three pragmatic features: user tagging, negative emoticons, and positive emoticons to identify sarcasm in tweets. They also compared their model performance with human sarcasm identification to clarify the difficulty of sarcasm detection. The author in [37] performed experiments to find sarcasm and irony in an English language Twitter dataset. Features included emoji and TF-IDF vector techniques to express text into vectors. Furthermore, the author also discussed the relationship among sarcasm, irony, and cyberbullying. The authors in [38] collected English cyberbullying tweets from Twitter. Then, they established an auto-detection model of cyberbullying detection based on sentiment score, readability, and text to predict the tweets. Moreover, the authors used a curse word dictionary to find the emotional score in the text using the number of occurrences of negative emotions in a tweet. Ref. [17] also used the English dataset to identify aggression detection using the Bert model.
As deep learning has become widely used in many application domains, new usages of deep learning for NLP purposes have also come into focus. Various deep learning techniques are proven to be more efficient than certain machine learning techniques. Researchers in [21] performed experiments to differentiate between hate speech and profanity. They applied ensemble learning, which achieved 87% accuracy. Tuning hyperparameters of meta classifiers can improve this work. Moreover, ref. [39] used CNN to identify hate speech in textual data. They used Word2Vec and character four-gram as feature extraction techniques. This work can be improved by identifying the sequential nature of data using LSTM and BiLSTM. To learn high level classification, ref. [7] performed character level classification using logit-boost and LSTM. Similarly, ref. [40] performed experiments on the Bangla text using LSTM, BiLSTM, and GRU to identify cyberbullying. An empirical analysis was performed by [41] to evaluate the performance of deep learning in the detection of cyberbullying across social media. LSTM, BiLSTM, GRU, and RNN are used for experiments.
3. Methodology
This section presents a complete analysis of all the implemented machine learning and deep learning models for aggression identification. We will begin the methodology by describing the dataset used for the experiments in Section 3, followed by feature extraction and feature selection discussed in Section 3.4 and Section 3.5, respectively. Afterward, we describe the results in detail in Section 4. Finally, Section 5 explains the conclusion in detail.
3.1. Evaluation Metrics
We evaluate our models using the average , , , and . Calculation of these measures was done using true positive (), false positive (), true negative (), and false negative (). Correctly-classified cyber-aggressive tweets are called true positive(s) (TP), while FN is incorrectly classified as non-cyber-aggressive tweets. Tweets correctly classified as non-cyber-aggressive are named TN, and those incorrectly classified as cyber-aggressive are called FP.
is the proportion of correctly classified aggressive and non-aggressive tweets.
measures the number of correctly identified cyber aggression tweets among all tweets labeled as cyber-aggressive.
The is the number of aggressive tweets among all of the tweets in the dataset.
is a measure of how well your classifier balances precision and .
3.2. Dataset
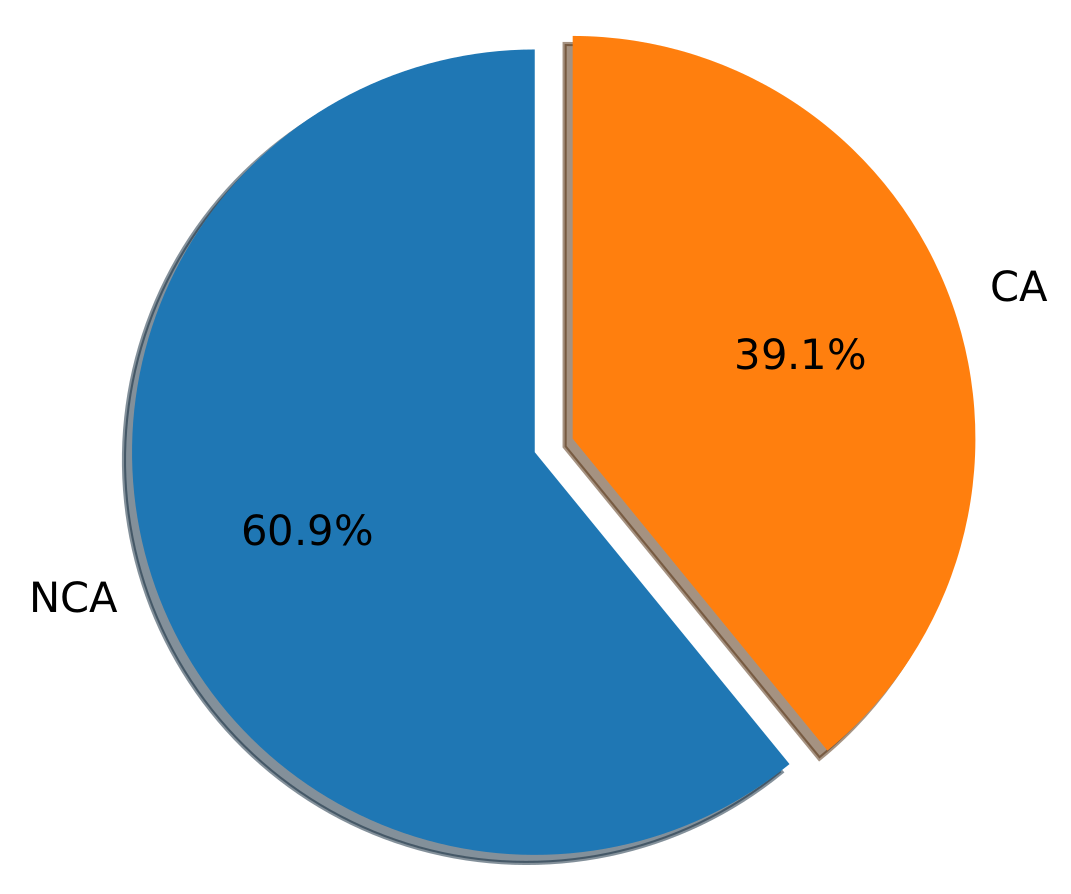
In this research, the Cyber-Troll publicly available dataset (https://www.kaggle.com/datasets/dataturks/dataset-for-detection-of-cybertrolls (accessed on 9 February 2022)) was used. Data-Turk created this dataset for aggression detection purposes. The dataset contains English language tweets, classified into two classes; cyber-aggressive (CA) and non-cyber-aggressive (NCA) by the Data-Turk society. Cyber-aggressive tweets contain messages intended to insult or hurt someone online. On the other, non-cyber-aggressive are tweets that contain no negative meaning, with no harm directed toward others. The dataset contains 20,001 tweets, of which 12,179 tweets are NCA and 7822 tweets are CA, as shown in Table 1. As depicted in Figure 1, CA tweets represent about 39% of the data while the NCA represents 61%.
3.3. Preprocessing
Previous research has demonstrated that preprocessing improves results in natural language processing (NLP) tasks performed on social media data. The extraction of valuable features from text is accomplished by removing extraneous information. This dimensionality reduction decreases processing time and produces a more concise model. We performed these steps on our dataset using the natural language toolkit (NLTK). Furthermore, implementation of models was done using python programming language, using Keras (https://keras.io/ (accessed on 9 February 2022)), a framework of deep learning, using Jupyter notebook.
3.4. Feature Extraction
Feature extraction is the process through which a raw unprocessed dataset can be simplified into a more meaningful form for further processing. In most cases, it reduces the size of the data by removing the unwanted data so that the reduced data still describes the original dataset without losing critical information. Feature extraction reduces the computational time of machine learning models. When dealing with text data, feature extraction needs to be utilized to transform text data into vector form. Usually, Word2Vec and TF-IDF are used to obtain the feature vector of text data. In combination with Word2Vec, we also extracted novel emotional features for aggression detection. Features extracted in this work are described below.
3.4.1. Discrete Emotions
A group of researchers [42,43,44] at the National Research Council Canada (NRC) used word choice to identify certain positive and negative emotions in tweets. Using NRC, we extracted eight emotional features: anticipation, joy, surprise, trust, anxiety, sadness, anger, and disgust. Anticipation, joy, surprise, and trust are deemed to be positive discrete emotions, whereas the analysis revealed that anxiety, sadness, anger, and disgust are considered negative discrete emotions. To the best of our knowledge, these novel features have not yet been used for cyberbullying problems in previous work. All emotional features were extracted using the following mathematical expression.
where is the emotional score of the specific emotional feature and i belongs to the emotional features set, including anticipation, joy, surprise, trust, anxiety, sadness, anger, and disgust, is the number of matching words in the dictionary for specific features , e.g., (anger, sad …) and is the total number of words in a sentence.
3.4.2. Word2Vec
Word-embedding methods, especially the Word2Vec algorithm [45], introduced new ideas that had an enormous impact on the natural language processing. Word2Vec is one of the most popular methods when processing text. Word2Vec is based on word embedding, i.e., when dealing with words, it creates vectors. The Word2Vec-embedding technique generates vectors that can be used to find relationships between words having the same meanings in the context of other words. Some of the researchers [46,47,48] used the TF-IDF embedding technique. TF-IDF, while simple and efficient, fails to capture several key linguistic concepts, such as synonymy and polysemy, since it reveals little of the connections between terms [49]. It also falls short of capturing the sentiments of the words [50]. The motivation behind using Word2Vec is that it is pre-trained on a large corpus and reduces computational complexity. It is based on the Skip-gram model trained by negative sampling to predict surrounding words given a center word, and the idea is: if words are similar to each other, they tend to have similar properties. So, the words can be represented as points in vector space. Features extracted using Word2Vec are combined with emotional features before feeding them to deep learning models.
3.5. Feature Selection
Overfitting [51] remains one of the major problems in many deep learning and machine learning algorithms. Feature selection is a process of finding the right combination of different features to build classifiers useful for solving a specific problem. Feature selection seeks to remove extraneous features that may be irrelevant, redundant because they are already modeled adequately by other features, or not needed by the end-user. We used the mutual information selection method to obtain the best-selected feature set among all combined features. The author in [52] presented a detailed review of the mutual information method. Moreover, they also discussed some of the variants of Mi. The author in [53] presented a new feature selection method based on mutual information, called the mutual information with correlation coefficient (CCMI). The mutual information and correlation coefficient is used to identify the relation between two features. [54], used the mutual information method along with the correlation coefficient for the intrusion detection system. Mutual information is a statistical measure of the relationship among two variables, Features X and target Y (usually represent random variables), which quantifies the amount of information obtained about Y from knowing the value of X [55]. Mutual information can be calculated by
Here, shows the probability density function of variable X and variable Y, and the marginal density functions are denoted by and , respectively. The mutual information quantifies the similarity of joint distribution to the marginal distributions product . If X and Y are independent (unrelated) then will be equal to the product of , and and their integration will be 0. In feature selection, we want to make that the most predictive subset of features are relevant to the target variable y. We can obtain the best subset of features by maximizing the mutual information between the feature and the target Y.
Among all embedding features, the 25 best features were selected, which was then combined with 8 emotional features before feeding to machine learning and deep learning algorithms.
3.6. Machine Learning Models
We used seven different basic machine learning algorithms: support vector machine (SVM), logistic regression (LR), k-nearest neighbor (KNN), decision tree (DT), naïve Bayes (NB), and gradient boosting (GB). Training these machine-learning algorithms was conducted by feeding them with Word2Vec and emotional features.
3.7. Deep Learning Models
This study implemented four deep learning models: LSTM, BiLSTM, CNN, and DNN. In order to feed text data to any deep learning model, we first converted it to a numeric vector. To train the proposed DNN, the Word2Vec method was used to obtain text embedding. Furthermore, emotional features wee manually extracted from the tweets. Later, both categories of features were combined before being fed to the model. Each deep neural network model has its own set of detailed hyper-parameters, shown in Table 2.
Proposed Model
We used DNN as a classification module, composed of fully-connected dense layers. Our DNN model was fine-tuned through extensive experiments based on trial and error. In addition, k-fold validation was used to evaluate the model’s performance. After tuning, DNN uses only three dense layers; the first two layers use rectified linear unit (ReLU) as an activation function, while the output layer uses sigmoid as an activation function.
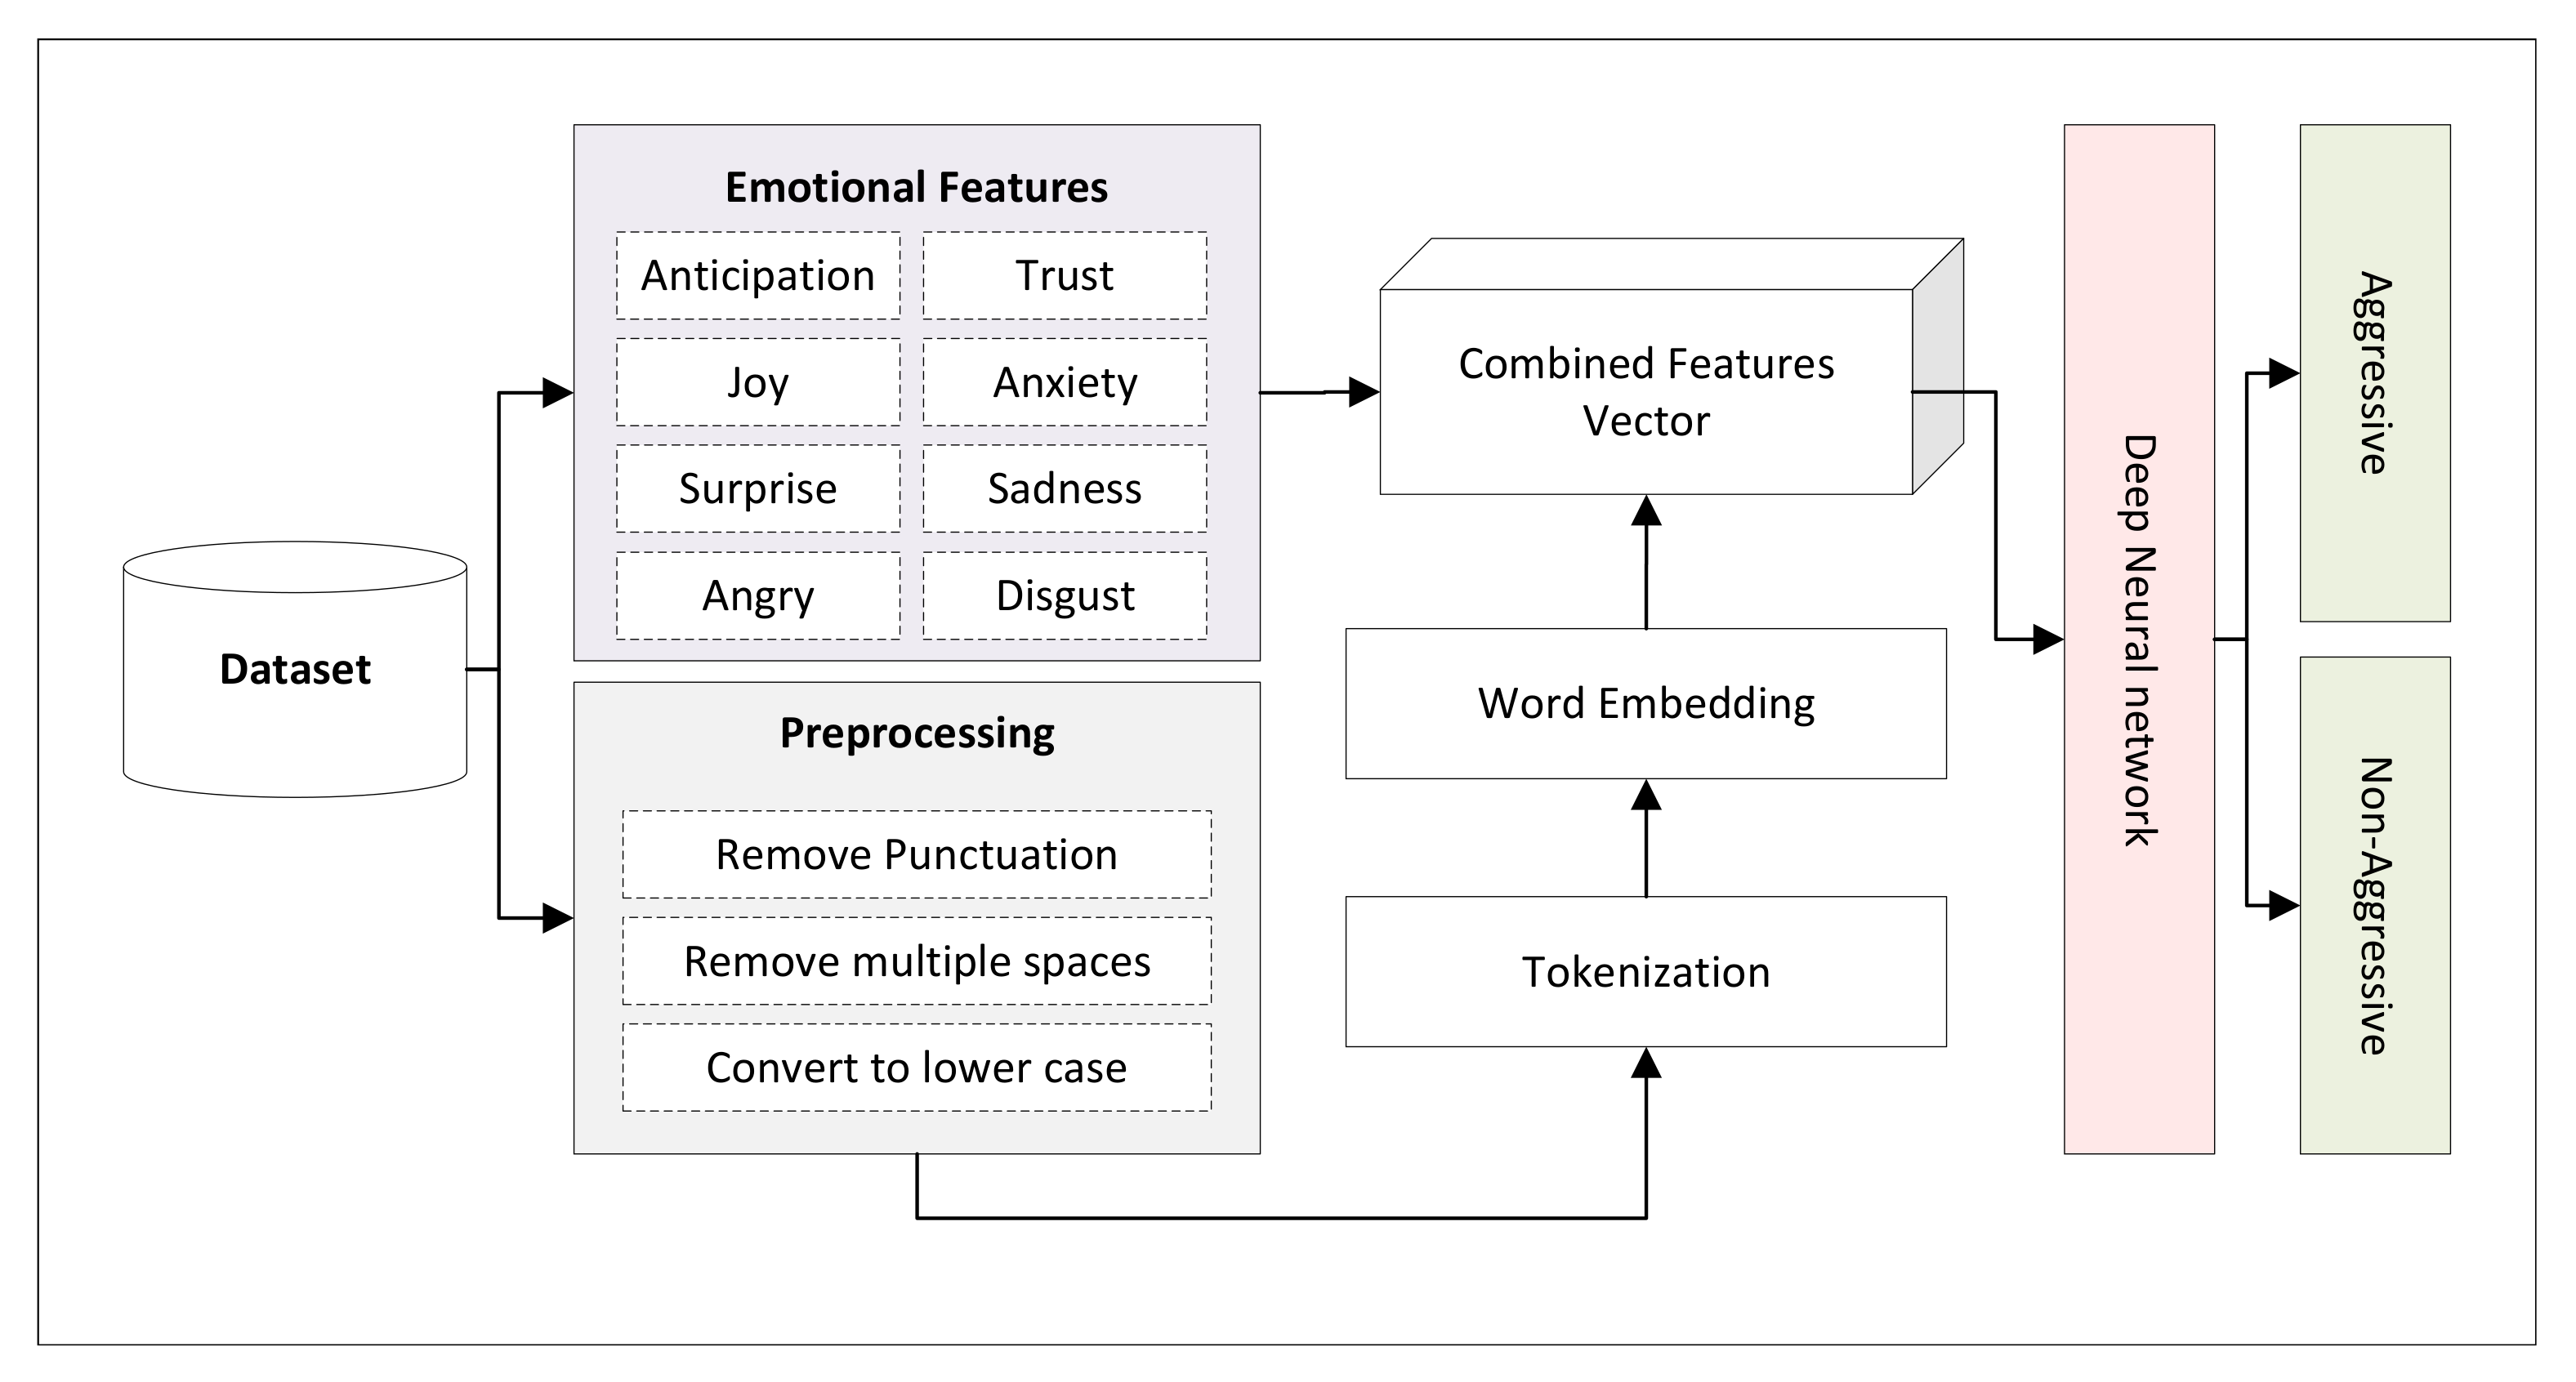
We selected dropout 0.2, with a batch size of 128 samples. Binary-cross entropy was used as a loss function and performed experiments using LSTM and BiLSTM. The DNN algorithm calculates two different types of features from each statement in the dataset. One feature set was obtained as a result of the Word2Vec-embedding model and the other was obtained from the emotional analysis of the tweet. Both types of features were combined and fed to the DNN model to determine whether the tweet was aggressive or non-aggressive. Algorithm 1 implemented in this paper takes one sentence as input at a time t and determines whether the sentence is aggressive or non-aggressive. The algorithm uses different symbols that can be defined as: : emotional features, : one single tweet, : pre-processed text, : feature embedding matrix, : word tokens : combined feature. Moreover, Figure 2 shows the framework of the DNN model.
| Algorithm 1: Proposed algorithm for feature engineering step |
 |
4. Results
This section presents the results of using several machine learning and deep learning models for the aggression detection of tweet datasets. The models were fed with Word2vec features only, and combined with manually-extracted emotional features. The experiments were conducted, and the models were evaluated with the 10 folds cross-validation scheme. A comparison of the proposed deep learning model with the state-of-the-art is provided afterward. Lastly, the significance of the emotional features was demonstrated by conducting hypothesis testing.
4.1. Experiments with Word2vec
Table 3 depicts the classification performance of a number of conventional machine learning models when fed with Word2vec features. The NB classifier showed the worst performance in overall classifiers in all classification metrics. In contrast, the GB classification algorithm recorded the highest values in all metrics and outperformed all other classifiers. The second-best performer was the DT classifier. The highest F1 score recorded by the GB classifier was 77%, which shows that the conventional machine learning models could not be used reliably for aggression detection.
The classification performance of the deep learning models trained using Word2vec features is presented in Table 4. The proposed DNN model recorded the highest evaluation metrics over all other deep learning models, followed by the BiLSTM. The F1-score of the introduced DNN is 87%, which is higher than that of the GB machine learning model. This observation highlights the effectiveness of deep learning models over machine learning in the aggression detection problem. Nevertheless, the values of the F1-score reflect the inadequacy of the Word2vec-driven features for reliable aggression classification using both deep learning and machine learning models. Therefore, manually extracted features were combined with Word2vec features and introduced to the models.
4.2. Experiments with Combined Word2vec and Emotional Features
In these experiments, eight emotional features were extracted manually from annotated training data and added to the Word2vec features to perform aggression classification.
Table 5 shows the performance measures of the machine learning classifiers with combined features. Similarly, as in Section 4.1 experiments, the GB classifier recorded the highest metric values compared to other machine learning models. However, the F1-score of the GB with the combined features was 86%. This observation highlights the significance of integrating the emotional features with the Word2vec features to improve classification performance.
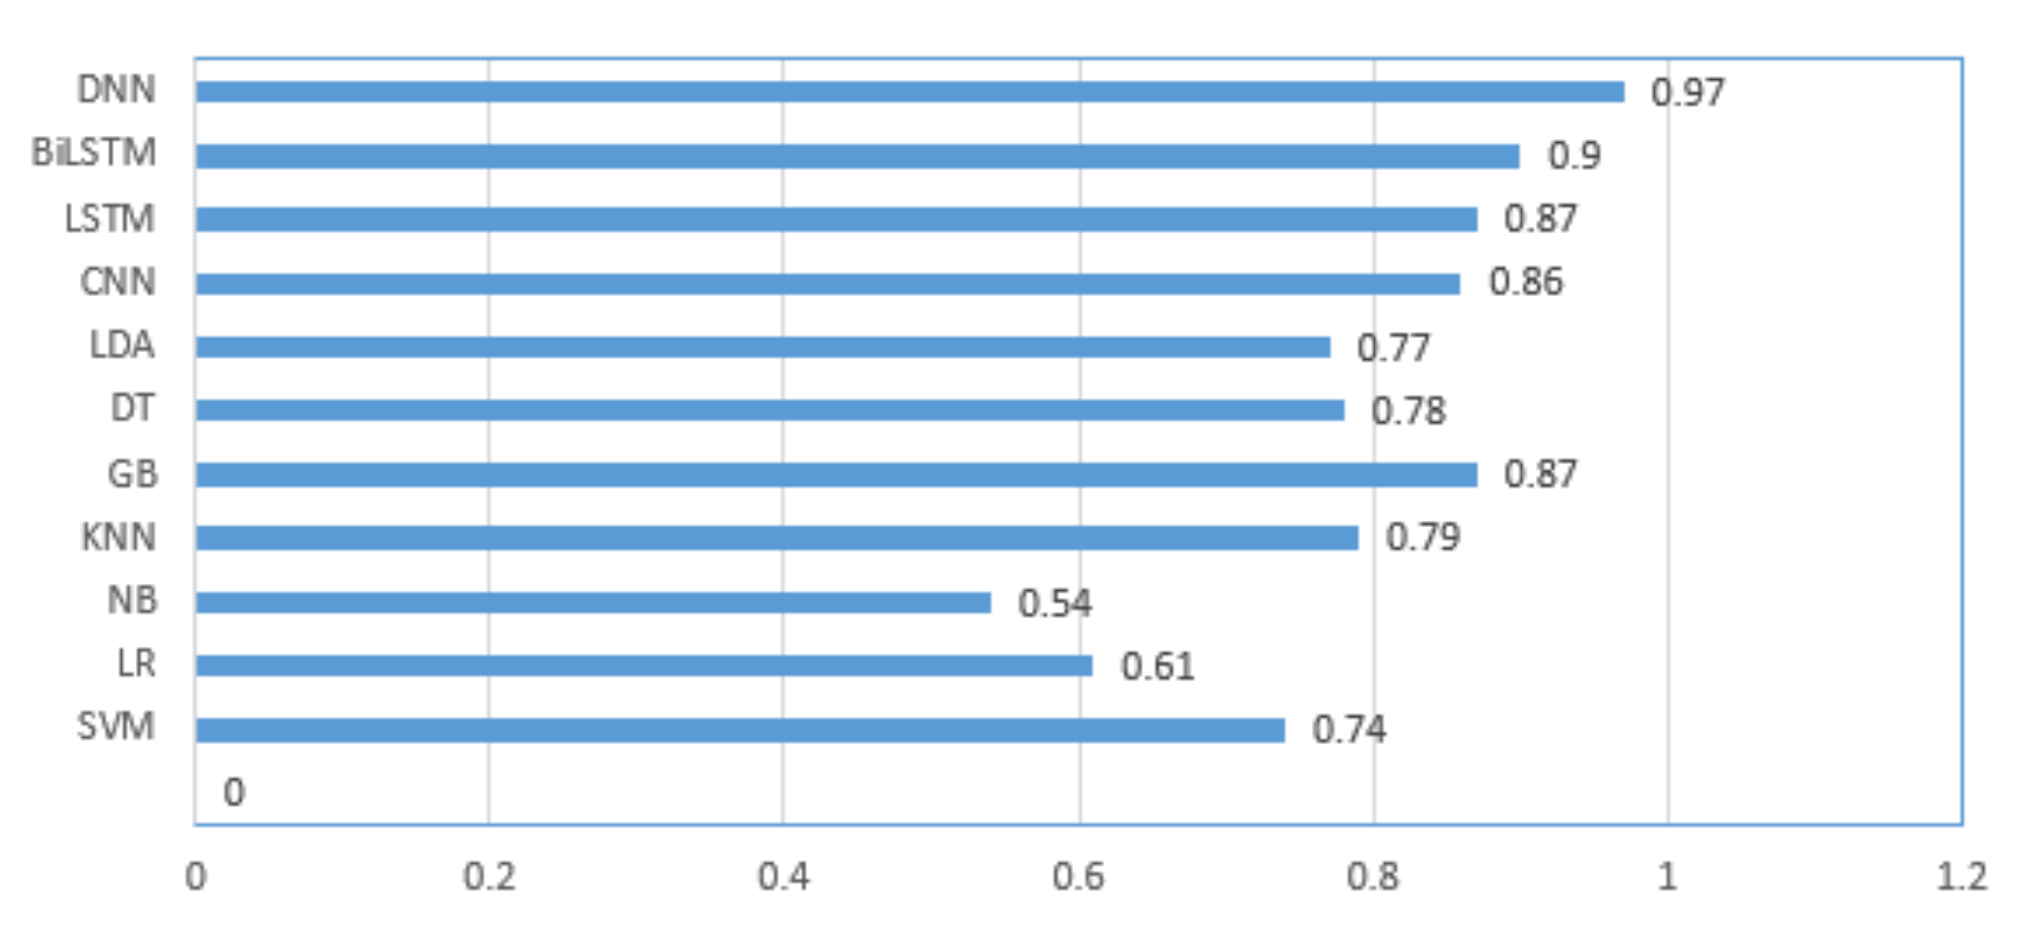
The classification performance of the deep learning classifiers fed with the Word2vec and emotional features combined set is depicted in Table 6. The proposed DNN performed the best over all other deep learning models with the highest F1-score value of 97%. It was also noticed that the performances of all the deep learning models improved when the classifiers were fed with the combined feature set over that when provided with the standalone Word2vec features. The same observation was reported for the classical machine learning classifiers. This observation reveals that the emotional features contributed to improving the ability of the algorithms to distinguish between aggressive and non-aggressive tweets.
To compare the performance of the machine and deep learning models, a bar graph of the F1-score of all models trained using the combined feature set is shown in Figure 3. As the F1-score took the recall and precision into account, and the data classes were unbalanced, comparing the machine learning and deep learning models was considered. It is clear that the proposed DNN model trained by the combined features outperformed all other machine and deep learning models.
The significant finding of this research work is that the combination of emotional features with word embedding features improves the classification performance of aggressive and non-aggressive classes on the Cyber-Troll Twitter dataset. The classification performance measures on the combined features demonstrate that emotional features play prominent roles when identifying aggressive tweets. Furthermore, the experimental study on the used dataset shows that manually extracted emotional features, when combined with Word2vec, improved the classification capability of the classifiers. Therefore, this finding suggests that features such as anger, anxiety, disgust, and anticipation play important roles in identifying aggressive content. To reinforce this finding, hypothesis testing was conducted to test the significance of the emotional features.
4.3. Hypothesis Testing and Significance of the Emotional Features
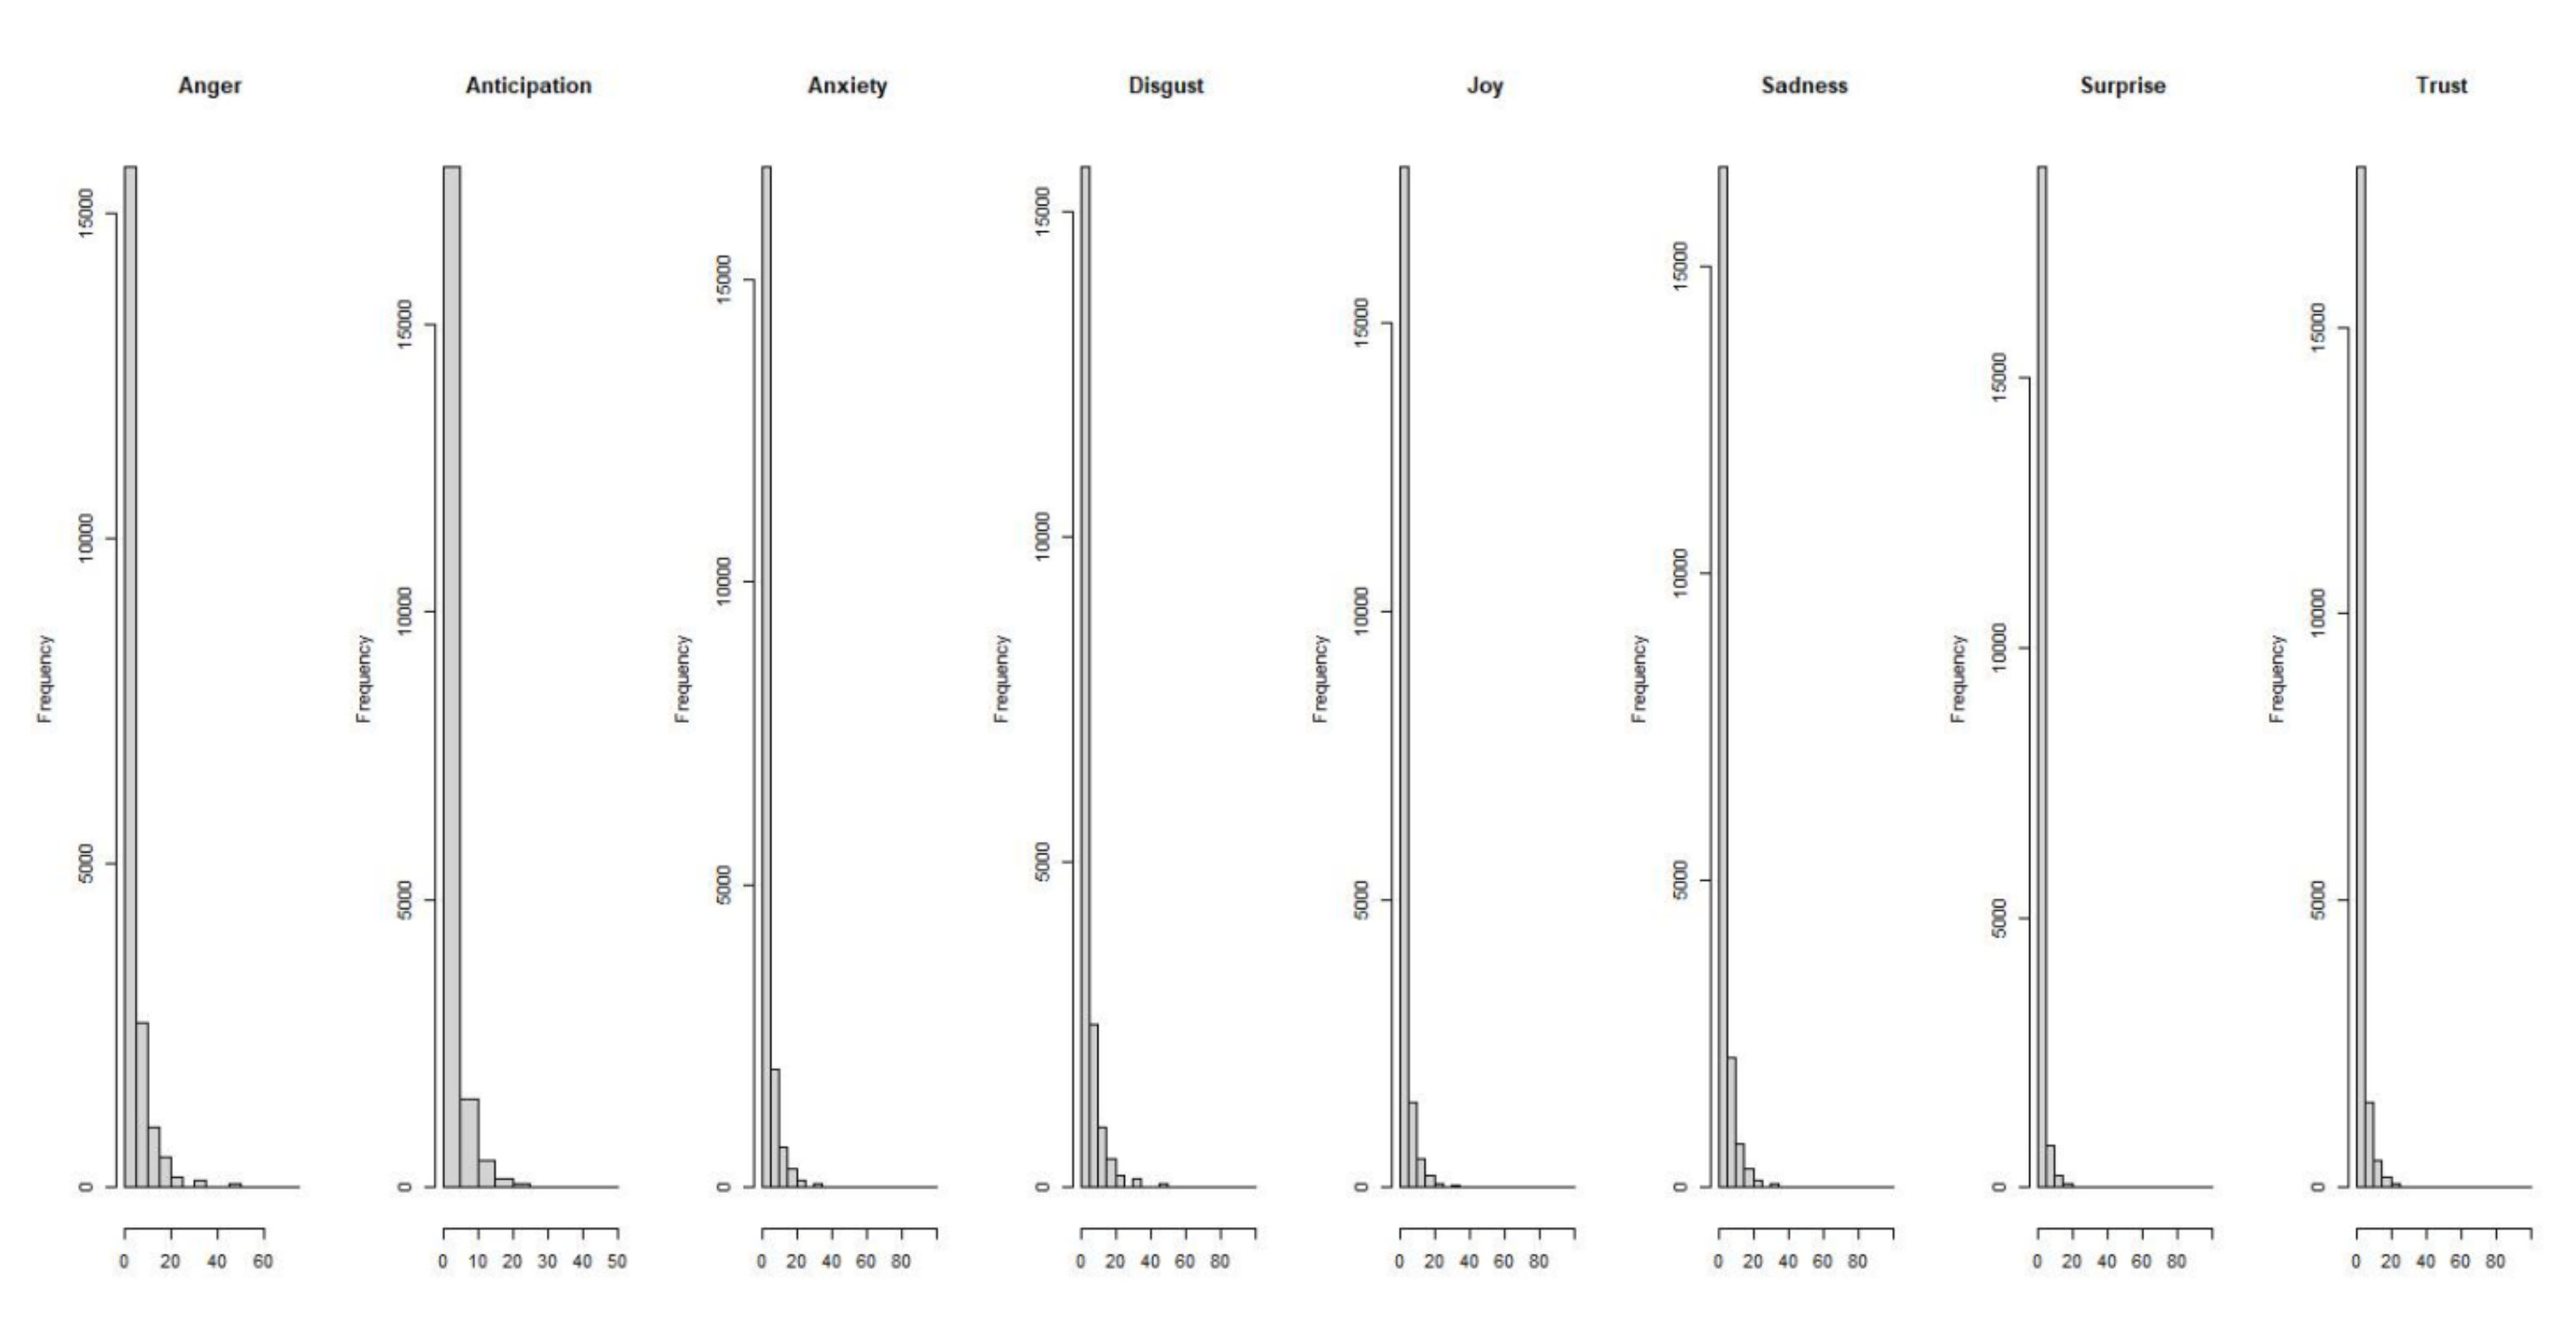
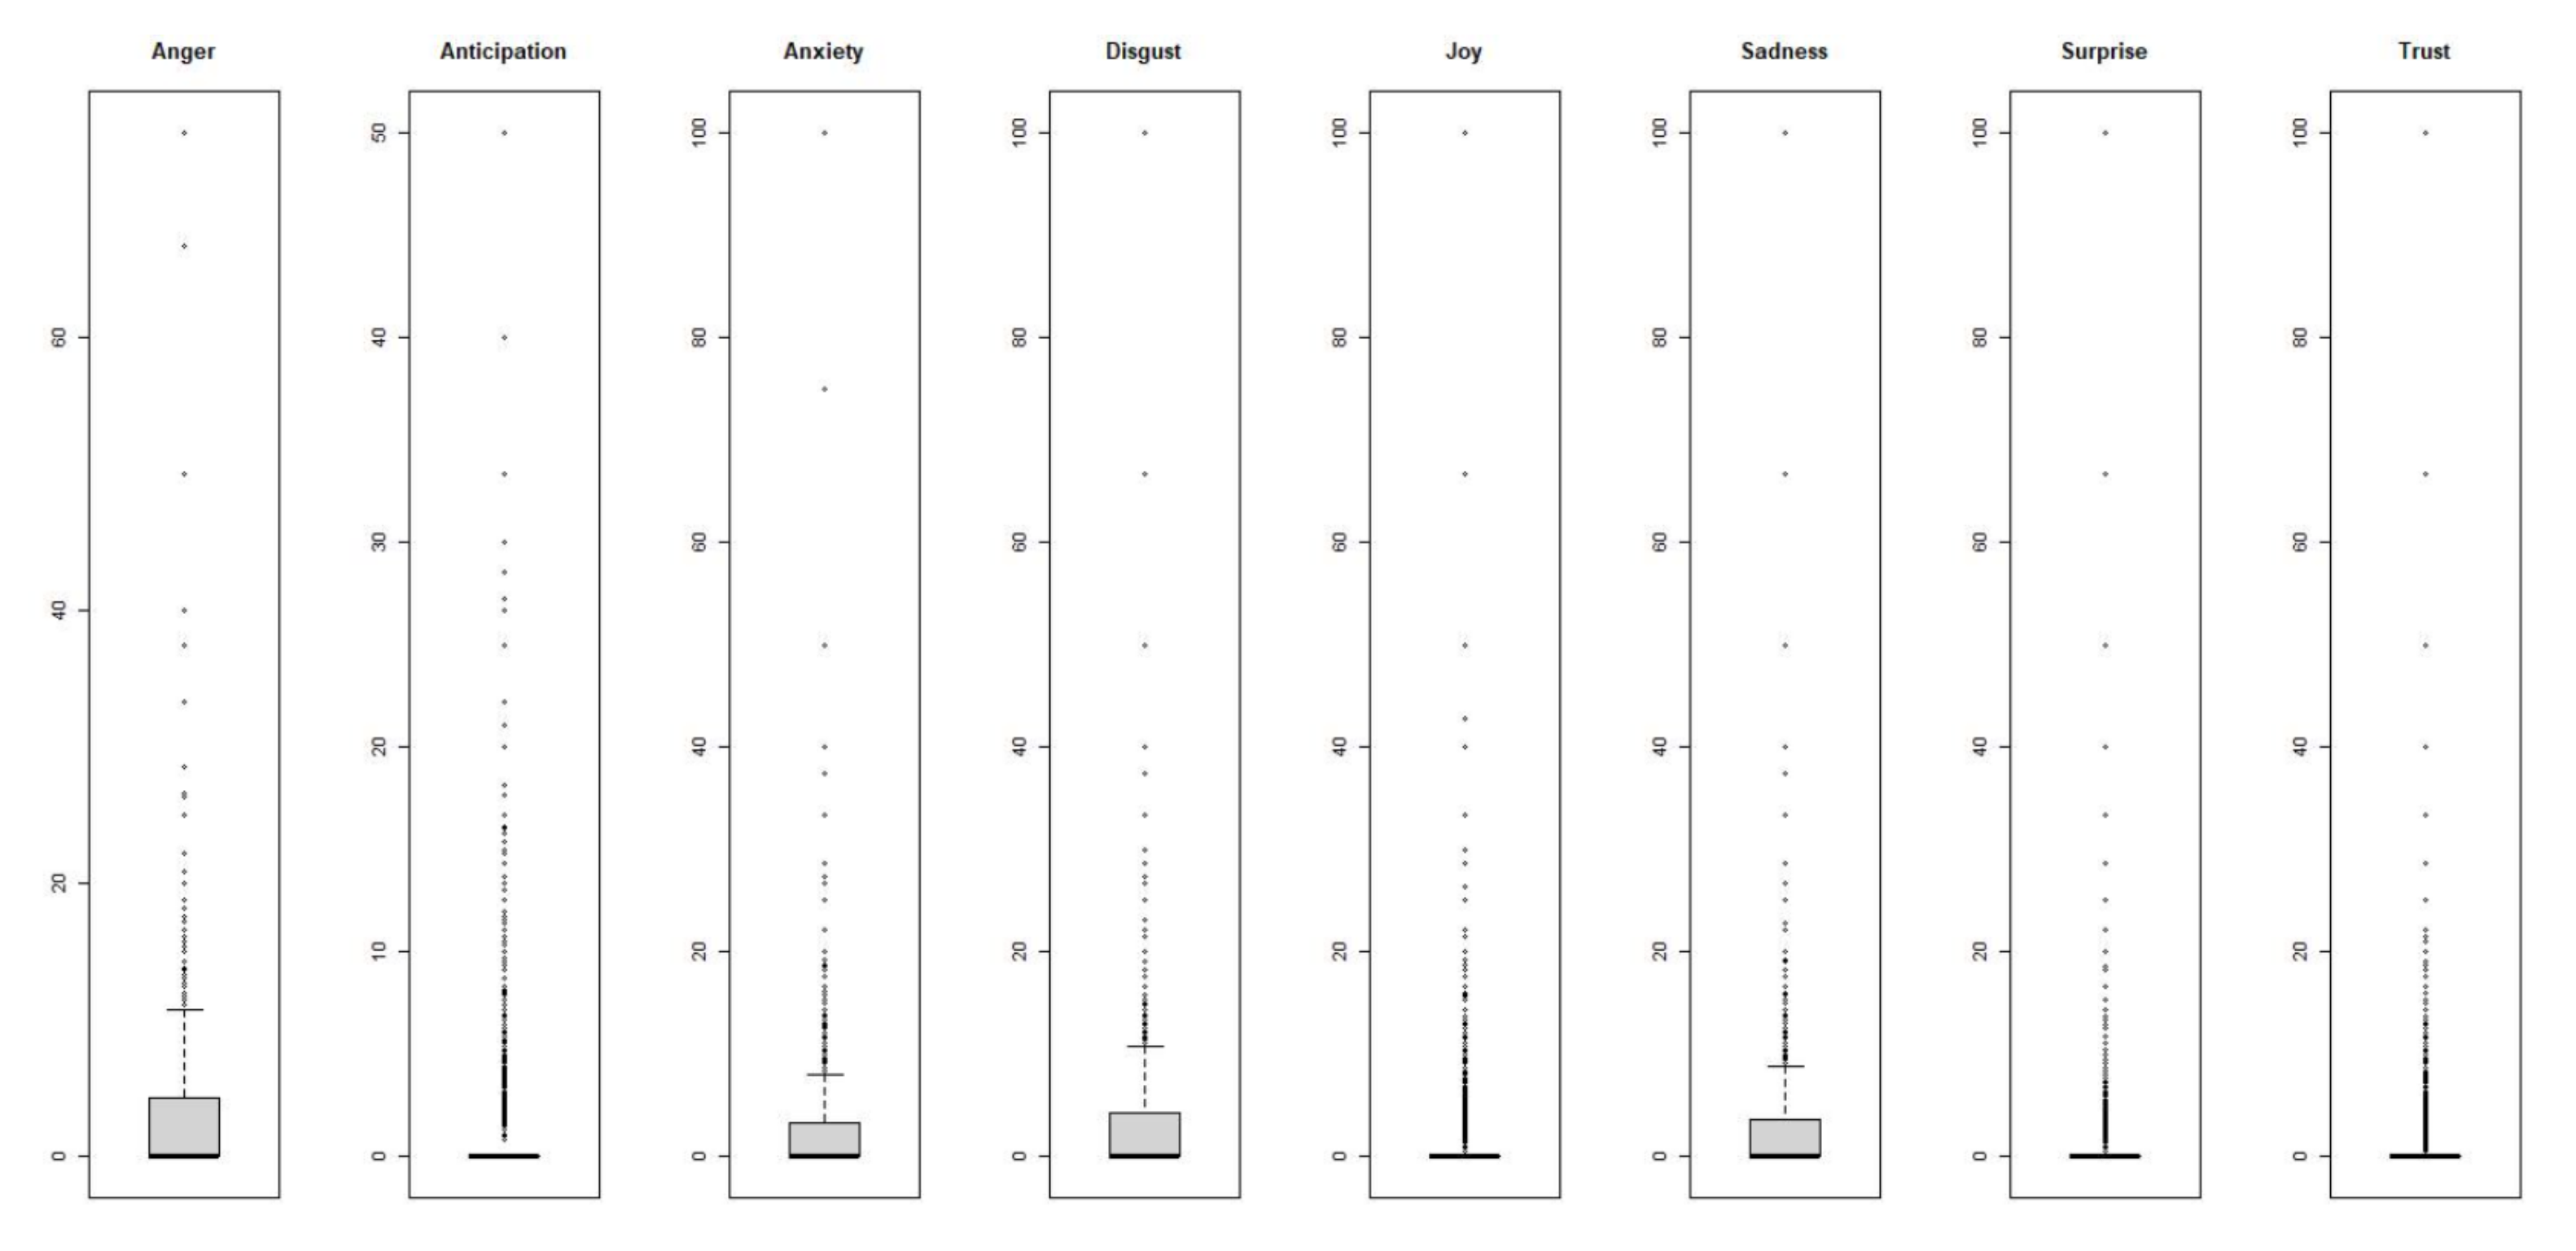
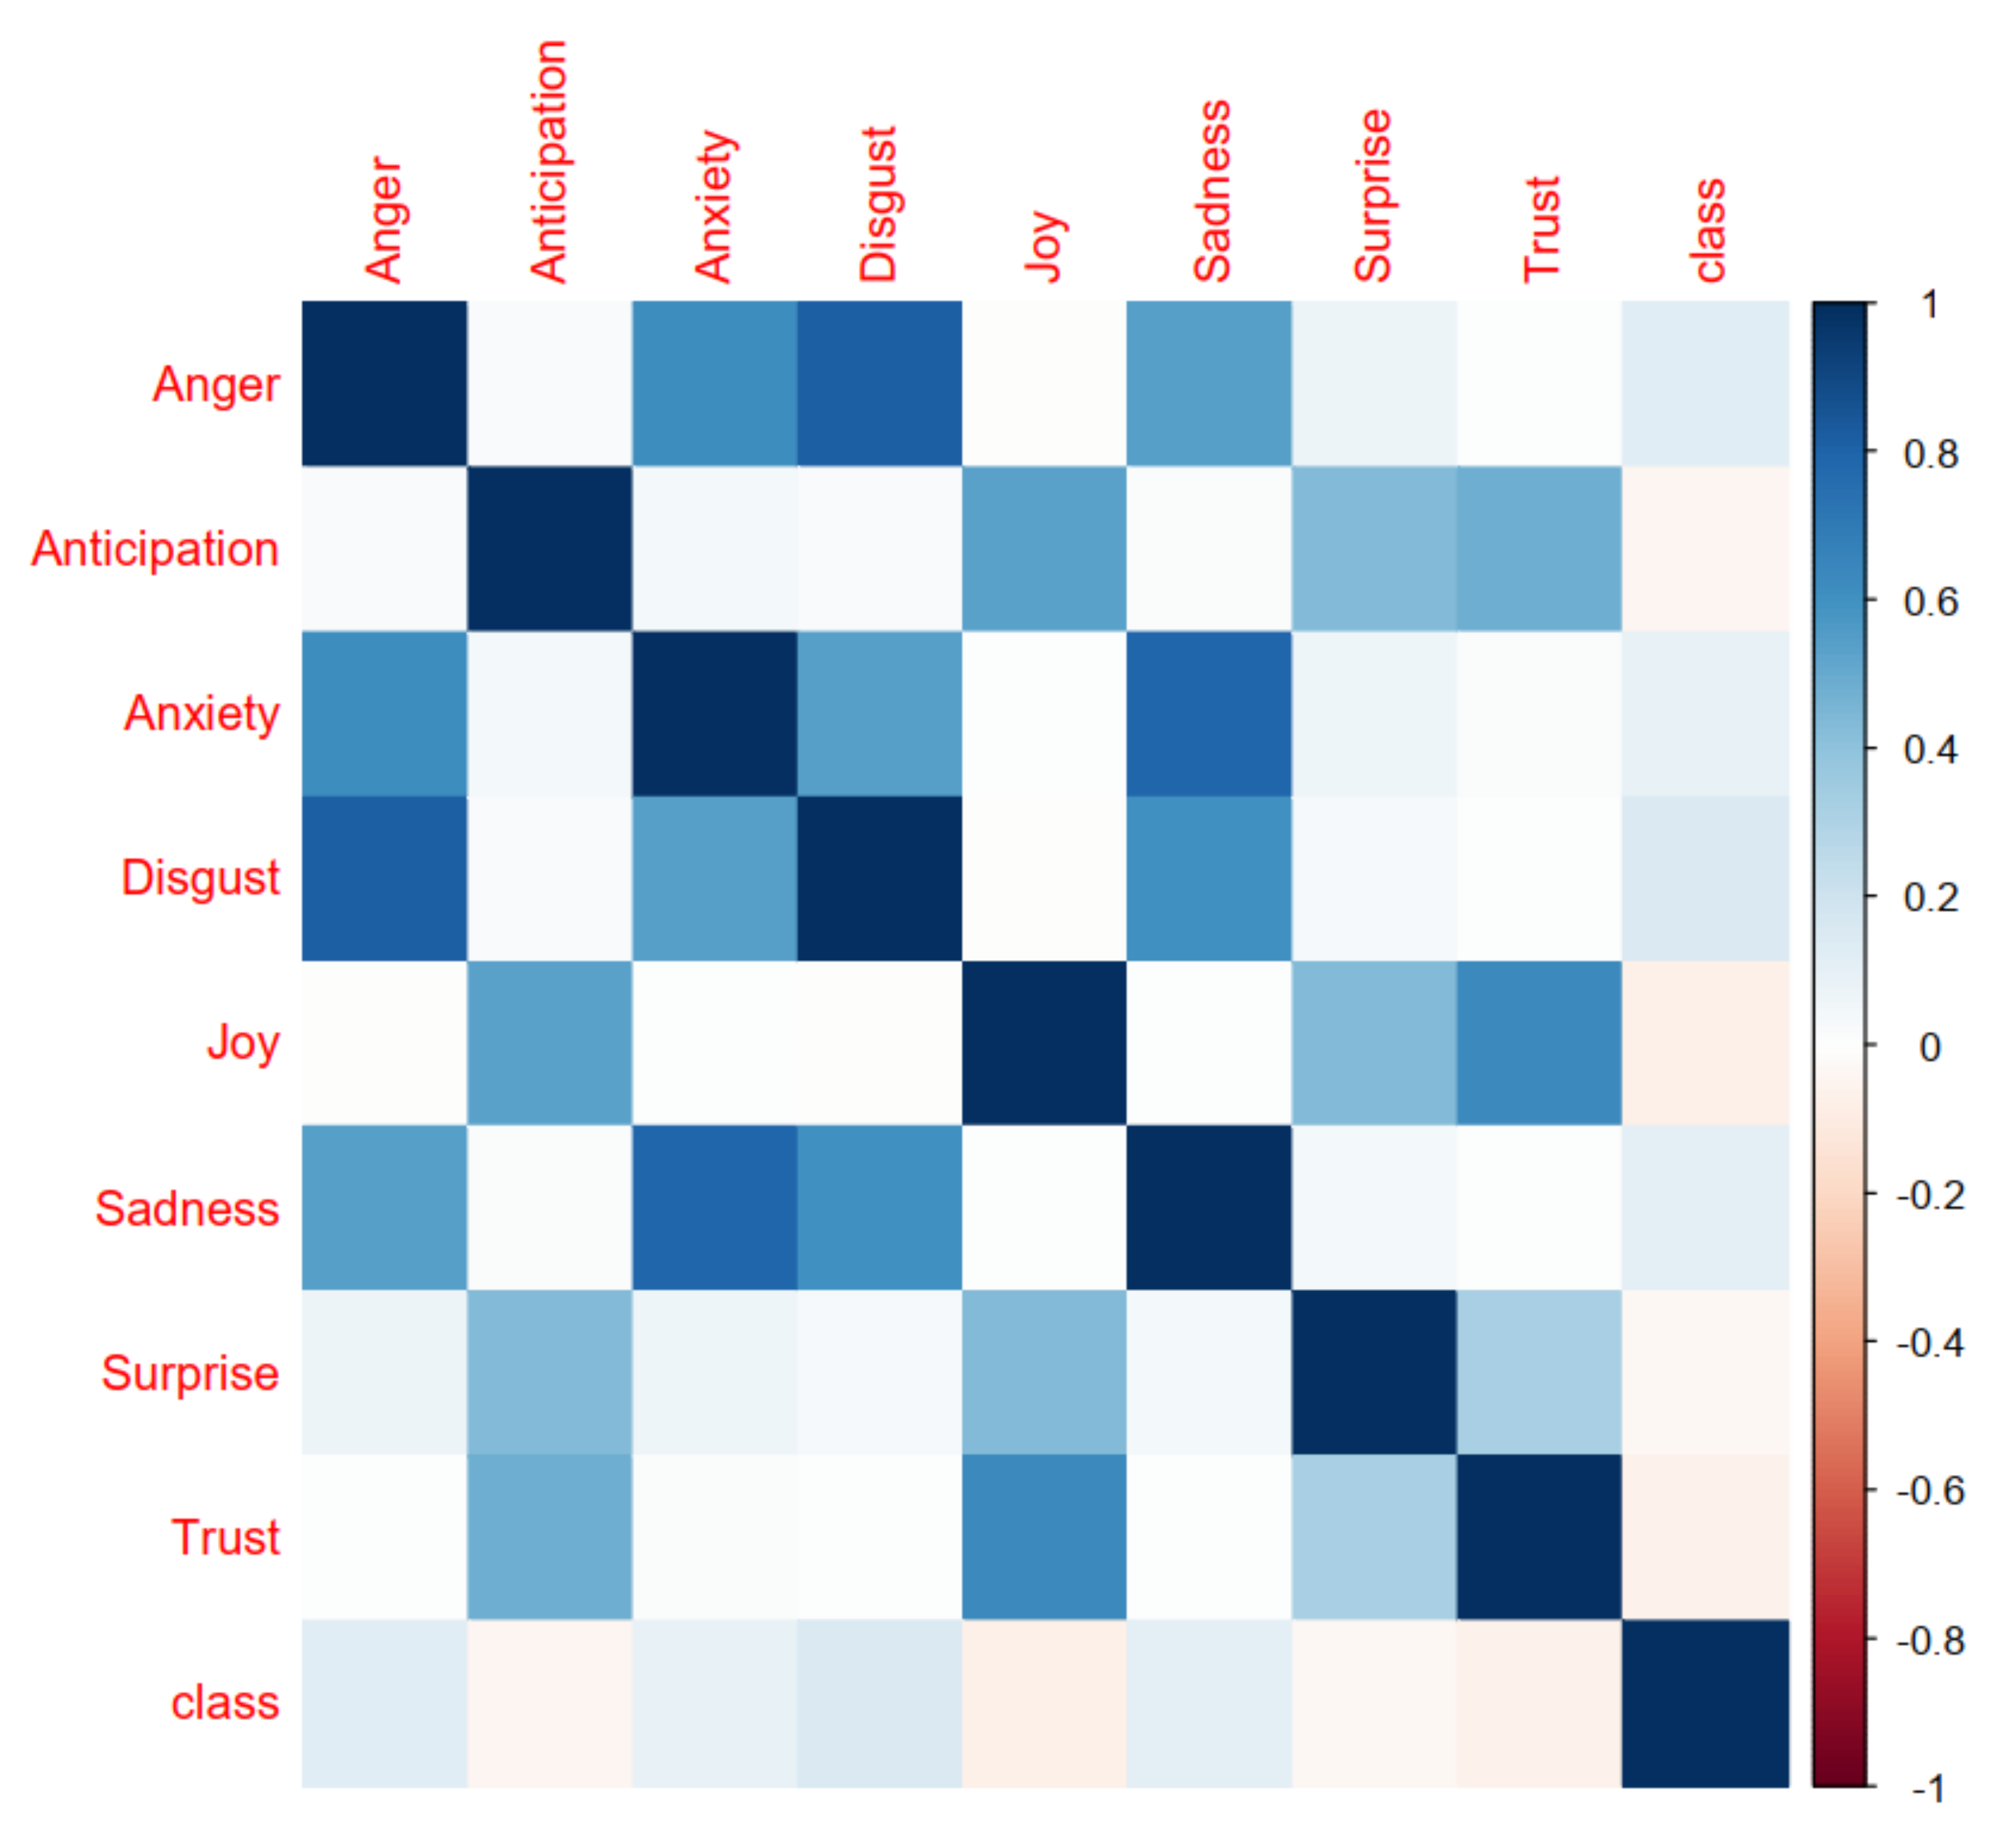
The conducted statistical analysis of the emotional features to assure its significance in the collected tweets is depicted in Table 7. The entries of Table 7 present a summary of the feature statistics in the data records, including N (the number of data records), the mean, standard deviation (), the maximum, and minimum, the 25th percentile (Q1), and the 75th percentile (Q3). The distribution of that features is explained by the aid of sketching the histograms, and boxplots, as depicted in Figure 4 and Figure 5. A histogram is a bar chart of a numeric variable divided into bins, with the height of each bin indicating the number of instances that fall into it. It is utilized to obtain a sense of an attribute’s distribution. As shown in Figure 4, the majority of the variables have Gaussian distribution. The box in the boxplot represents the middle half of the data points, the line represents the median, and the whiskers of the plots represent the feature’s reasonable range. Any dots outside of the whiskers are likely to be outliers. The correlation between all features and the prediction outcome is illustrated in Figure 6. The anger feature demonstrates a high correlation with the anxiety, disgust, and sadness features; however, the joy feature reveals a high correlation with anticipation, surprise, and trust features. As illustrated in Figure 6, the outcome does not have a high correlation with the emotional feature. The correlation coefficient is a measure of how closely two continuous variables are related. However, in this study, the response variable is categorical (aggressive and non-aggressive), and the input features are continuous. So, the association between the input features and the response can be extracted using the logistic regression [56]. Binomial logistic regression is as an example of a classification technique to predict a categorical response. Logistic regression, in an instance, estimates the probability that an emotional feature belongs to a specific outcome (aggressive and non-aggressive). Table 8 presents a statistical summary of a binomial logistic regression model that has been fit to predict the outcome based on the values of the emotional features in the tweet data records. The entries of Table 8 include an estimate, z-score, standard error, p-value, and significance of each of the coefficients returned by the regression model. The significance level is represented by asterisks and a high significance of a coefficient is represented by more asterisks. As illustrated in Table 8, most coefficients have a high significance level. The first five probabilities yielded by the logistic regression model are 0.46, 0.37, 0.53, 0.39, and 0.37, which can be considered close to 50%. To verify the adequacy of the logistic regression model, a hypothesis testing was utilized, considering a hypothesis in : , which indicates a null relationship between the response variable and the emotional features as input features. The learning model can be considered efficient if there is any hypothesis. The hypothesis testing was conducted using the ANOVA test, which yielded two performance measures, including the and residual deviance. The deviance indicates how effectively a model with only an intercept term can predict the response variable. However, the residual deviance shows how the input predictors, emotional features, can help in a good prediction of the response variable. A lower value of the residual deviance than the deviance indicates a better performance of the learning model using the emotional features. The retrieved residual and null deviance values are 20,888 and 21,407, respectively. So, the hypothesis can be rejected and the association between the emotional features in the classification of the collected tweets, if it is aggressive or non-aggressive, is ensured.
4.4. Comparison of the Proposed Model with the State-of-the-Art
The proposed DNN model trained on the combined feature set was compared with two studies. The study in [30] used the same Cyber-Troll dataset with the MLP classifier, while the study in [57] used their own dataset and a CNN classifier. Both studies used the FD-IDF features. The comparison depicted in Table 9 shows that the proposed DNN with the combined features outperforms the state-of-the-art models.
5. Conclusions
Identifying aggression from textual content is very challenging in the field of natural language processing. The neural network model has become increasingly popular in natural language processing tasks in recent years. Its importance in NLP has increased dramatically due to its learning capabilities. Many layers are needed in these networks to extract higher-level features and to learn long-term dependencies; this makes the computation heavy and slow. This paper used a simple and efficient approach to overcome this issue. Our work demonstrates that the DNN with fewer layers is capable of learning useful representations of data that can be used for aggression detection. The proposed model leverages eight emotional features and word embedding features to build a classifier that automatically identifies the aggressive language in the text. We evaluated the proposed DNN model using the Cyber-Troll dataset, which achieved an F1 score of 97%. The DNN model outperformed several machine learning and deep learning models. The proposed framework achieved better results with less training time and fewer possible layers than previous methods. The current proposal may extend this particular feature to include a multi-lingual scenario that prevails in several non-native English countries. In the future, we plan to experiment with larger datasets for aggression detection. We also intend to expand the datasets to other languages (Arabic, Urdu, Hindi, etc.) and social media platforms, such as Facebook. This will be helpful in the domestic sphere, but with an increasing number of users, there may be cases where people are accused falsely or experience stalking due to misunderstandings with friends. Detecting these cases may provide better methods to research aggression in social network analyses.
Author Contributions
Conceptualization, U.K. and S.K.; methodology, U.K., S.K., A.R., G.A., N.A.S. and M.M.J.; software, S.K., G.A. and N.A.S.; validation, S.K., A.R., G.A., N.A.S. and M.M.J.; formal analysis, S.K.; investigation, U.K., A.R., G.A., N.A.S. and M.M.J.; resources, S.K.; data curation, S.K.; writing—original draft preparation, U.K., S.K., A.R., G.A., N.A.S. and M.M.J.; writing—review and editing, S.K., A.R., G.A., N.A.S. and M.M.J.; visualization, S.K., A.R., G.A., N.A.S. and M.M.J.; supervision, U.K.; project administration, G.A., N.A.S. and M.M.J.; funding acquisition, G.A., N.A.S. and M.M.J. All authors have read and agreed to the published version of the manuscript.
Funding
Princess Nourah bint Abdulrahman University Researchers Supporting project number (PNURSP2022R104), Princess Nourah bint Abdulrahman University, Riyadh, Saudi Arabia.
Conflicts of Interest
The authors declare no conflict of interest.
References
- Nurrahmi, H.; Nurjanah, D. Indonesian twitter cyberbullying detection using text classification and user credibility. In Proceedings of the 2018 International Conference on Information and Communications Technology (ICOIACT), Yogyakarta, Indonesia, 6–7 March 2018. [Google Scholar]
- Machackova, H. Bystander reactions to cyberbullying and cyberaggression: Individual, contextual, and social factors. Curr. Opin. Psychol. 2020, 36, 130–134. [Google Scholar] [CrossRef] [PubMed]
- Oriola, O.; Kotzé, E. Evaluating machine learning techniques for detecting offensive and hate speech in South African tweets. IEEE Access 2020, 8, 21496–21509. [Google Scholar] [CrossRef]
- Visualizing Eight Years of Twitter’s Evolution: 2012–2019. 14 November 2019. Available online: https://blog.gdeltproject.org/visualizing-eight-years-of-twitters-evolution2012-2019/ (accessed on 12 February 2022).
- Hosseinmardi, H.; Rafiq, R.I.; Han, R.; Lv, Q.; Mishra, S. Prediction of cyberbullying incidents in a media-based social network. In Proceedings of the 2016 IEEE/ACM International Conference on Advances in Social Networks Analysis and Mining (ASONAM), San Francisco, CA, USA, 18–21 August 2016. [Google Scholar]
- Hemmatian, F.; Sohrabi, M.K. A survey on classification techniques for opinion mining and sentiment analysis. Artif. Intell. Rev. 2019, 52, 1495–1545. [Google Scholar] [CrossRef]
- Luo, X. Efficient english text classification using selected machine learning techniques. Alex. Eng. J. 2021, 60, 3401–3409. [Google Scholar] [CrossRef]
- Haidar, B.; Chamoun, M.; Serhrouchni, A. A multilingual system for cyberbullying detection: Arabic content detection using machine learning. Adv. Sci. Technol. Eng. Syst. J. 2017, 2, 275–284. [Google Scholar] [CrossRef] [Green Version]
- Khairy, M.; Mahmoud, T.M.; Abd-El-Hafeez, T. Automatic Detection of Cyberbullying and Abusive Language in Arabic Content on Social Networks: A Survey. Procedia Comput. Sci. 2021, 189, 156–166. [Google Scholar] [CrossRef]
- Torfi, A.; Shirvani, R.A.; Keneshloo, Y.; Tavaf, N.; Fox, E.A. Natural language processing advancements by deep learning: A survey. arXiv 2020, arXiv:2003.01200. [Google Scholar]
- Lauriola, I.; Lavelli, A.; Aiolli, F. An Introduction to Deep Learning in Natural Language Processing: Models, Techniques, and Tools. Neurocomputing 2022, 470, 443–456. [Google Scholar] [CrossRef]
- Van Hee, C.; Lefever, E.; Verhoeven, B.; Mennes, J.; Desmet, B.; De Pauw, G.; Daelemans, W.; Hoste, V. Detection and fine-grained classification of cyberbullying events. In Proceedings of the International Conference Recent Advances in Natural Language Processing (RANLP), Hissar, Bulgaria, 5–11 September 2015. [Google Scholar]
- Chen, Y. Detecting Offensive Language in Social Medias for Protection of Adolescent Online Safety. Master’s Thesis, Penn State University, State College, PA, USA, 2011. [Google Scholar]
- Balakrishnan, V.; Khan, S.; Arabnia, H.R. Improving cyberbullying detection using Twitter users’ psychological features and machine learning. Comput. Secur. 2020, 90, 101710. [Google Scholar] [CrossRef]
- Akhter, M.P.; Jiangbin, Z.; Naqvi, I.R.; Abdelmajeed, M.; Sadiq, M.T. Automatic detection of offensive language for urdu and roman urdu. IEEE Access 2020, 8, 91213–91226. [Google Scholar] [CrossRef]
- Kumar, R.; Lahiri, B.; Ojha, A.K. Aggressive and offensive language identification in hindi, bangla, and english: A comparative study. SN Comput. Sci. 2021, 2, 1–20. [Google Scholar] [CrossRef]
- Plaza-del-Arco, F.M.; Molina-González, M.D.; Urena-López, L.A.; Martín-Valdivia, M.T. Comparing pre-trained language models for Spanish hate speech detection. Expert Syst. Appl. 2021, 166, 114120. [Google Scholar] [CrossRef]
- Herwanto, G.B.; Ningtyas, A.M.; Nugraha, K.E.; Trisna, I.N. Hate speech and abusive language classification using fastText. In Proceedings of the 2019 International Seminar on Research of Information Technology and Intelligent Systems (ISRITI), Yogyakarta, Indonesia, 5–6 December 2019. [Google Scholar]
- Fortuna, P.; Soler-Company, J.; Wanner, L. How well do hate speech, toxicity, abusive and offensive language classification models generalize across datasets? Inf. Process. Manag. 2021, 58, 102524. [Google Scholar] [CrossRef]
- Alotaibi, A.; Hasanat, M.H.A. Racism Detection in Twitter Using Deep Learning and Text Mining Techniques for the Arabic Language. In Proceedings of the 2020 First International Conference of Smart Systems and Emerging Technologies (SMARTTECH), Riyadh, Saudi Arabia, 3–5 November 2020. [Google Scholar]
- Malmasi, S.; Zampieri, M. Challenges in discriminating profanity from hate speech. J. Exp. Theor. Artif. Intell. 2018, 30, 187–202. [Google Scholar] [CrossRef] [Green Version]
- Garaigordobil, M.; Mollo-Torrico, J.P.; Machimbarrena, J.M.; Páez, D. Cyberaggression in adolescents of Bolivia: Connection with psychopathological symptoms, adaptive and predictor variables. Int. J. Environ. Res. Public Health 2020, 17, 1022. [Google Scholar] [CrossRef] [Green Version]
- Chatzakou, D.; Kourtellis, N.; Blackburn, J.; De Cristofaro, E.; Stringhini, G.; Vakali, A. Mean birds: Detecting aggression and bullying on twitter. In Proceedings of the 2017 ACM on Web Science Conference, Troy, NY, USA, 25–28 June 2017. [Google Scholar]
- Gitari, N.D.; Zuping, Z.; Damien, H.; Long, J. A lexicon-based approach for hate speech detection. Int. J. Multimed. Ubiquitous Eng. 2015, 10, 215–230. [Google Scholar] [CrossRef]
- Zois, D.S.; Kapodistria, A.; Yao, M.; Chelmis, C. Optimal online cyberbullying detection. In Proceedings of the 2018 IEEE International Conference on Acoustics, Speech and Signal Processing (ICASSP), Calgary, AB, Canada, 15–20 April 2018. [Google Scholar]
- Pawar, R.; Raje, R.R. Multilingual cyberbullying detection system. In Proceedings of the 2019 IEEE International Conference on Electro Information Technology (EIT), Brookings, SD, USA, 20–22 May 2019. [Google Scholar]
- Sadiq, S.; Mehmood, A.; Ullah, S.; Ahmad, M.; Choi, G.S.; On, B.W. Aggression detection through deep neural model on twitter. Future Gener. Comput. Syst. 2021, 114, 120–129. [Google Scholar] [CrossRef]
- Sigurbergsson, G.I.; Derczynski, L. Offensive language and hate speech detection for Danish. arXiv 2019, arXiv:1908.04531. [Google Scholar]
- Schneider, J.M.; Roller, R.; Bourgonje, P.; Hegele, S.; Rehm, G. Towards the automatic classification of offensive language and related phenomena in German tweets. In Proceedings of the 14th Conference on Natural Language Processing KONVENS, Vienna, Austria, 19–21 September 2018; p. 95. [Google Scholar]
- Pelle, R.; Alcântara, C.; Moreira, V.P. A classifier ensemble for offensive text detection. In Proceedings of the 24th Brazilian Symposium on Multimedia and the Web, Salvador, Brazil, 16–19 October 2018. [Google Scholar]
- Haidar, B.; Chamoun, M.; Serhrouchni, A. Multilingual cyberbullying detection system: Detecting cyberbullying in Arabic content. In Proceedings of the 2017 1st Cyber Security in Networking Conference (CSNet), Rio de Janeiro, Brazil, 18–20 October 2017. [Google Scholar]
- Ibrohim, M.O.; Budi, I. A dataset and preliminaries study for abusive language detection in Indonesian social media. Procedia Comput. Sci. 2018, 135, 222–229. [Google Scholar] [CrossRef]
- Ibrohim, M.O.; Budi, I. Multi-label hate speech and abusive language detection in Indonesian twitter. In Proceedings of the Third Workshop on Abusive Language Online, Florence, Italy, 1 August 2019. [Google Scholar]
- Desrul, D.R.K.; Romadhony, A. Abusive language detection on Indonesian online news comments. In Proceedings of the 2019 International Seminar on Research of Information Technology and Intelligent Systems (ISRITI), Yogyakarta, Indonesia, 5–6 December 2019. [Google Scholar]
- Di Capua, M.; Di Nardo, E. Unsupervised cyber bullying detection in social networks. In Proceedings of the 2016 23rd International Conference on Pattern Recognition (ICPR), Cancun, Mexico, 4–8 December 2016. [Google Scholar]
- González-Ibánez, R. Identifying sarcasm in twitter: A closer look. In Proceedings of the 49th Annual Meeting of the Association for Computational Linguistics: Human Language Technologies, Stroudsburg, PA, USA, 19–24 June 2011. [Google Scholar]
- Chia, Z.L.; Ptaszynski, M.; Masui, F.; Leliwa, G.; Wroczynski, M. Machine Learning and feature engineering-based study into sarcasm and irony classification with application to cyberbullying detection. Inf. Process. Manag. 2021, 58, 102600. [Google Scholar] [CrossRef]
- Lee, P.J.; Hu, Y.H.; Chen, K.; Tarn, J.M.; Cheng, L.E. Cyberbullying Detection on Social Network Services. In Proceedings of the 22nd Pacific Asia Conference on Information Systems, PACIS 2018, Yokohama, Japan, 26–30 June 2018. [Google Scholar]
- Al-Ajlan, M.A.; Ykhlef, M. Optimized Twitter Cyberbullying Detection based on Deep Learning. In Proceedings of the 2018 21st Saudi Computer Society National Computer Conference (NCC), Riyadh, Saudi Arabia, 25–26 April 2018; pp. 1–5. [Google Scholar]
- Ahmed, M.T.; Rahman, M.; Nur, S.; Islam, A.; Das, D. Deployment of Machine Learning and Deep Learning Algorithms in Detecting Cyberbullying in Bangla and Romanized Bangla text: A Comparative Study. In Proceedings of the 2021 International Conference on Advances in Electrical, Computing, Communication and Sustainable Technologies (ICAECT), Bhilai, India, 19–20 February 2021. [Google Scholar]
- Dadvar, M.; Eckert, K. Cyberbullying detection in social networks using deep learning based models. In International Conference on Big Data Analytics and Knowledge Discovery; Springer: Cham, Switzerland, 2020. [Google Scholar]
- Malik, M.; Hussain, A. Helpfulness of product reviews as a function of discrete positive and negative emotions. Comput. Hum. Behav. 2017, 73, 290–302. [Google Scholar] [CrossRef] [Green Version]
- Plutchik, R. The Psychology and Biology of Emotion; HarperCollins College Publishers: New York, NY, USA, 1994. [Google Scholar]
- Mohammad, S.M.; Turney, P.D. Nrc emotion lexicon. Natl. Res. Counc. Can. 2013, 2. Available online: http://www.saifmohammad.com/WebDocs/NRCemotionlexicon.pdf (accessed on 12 February 2022).
- Mikolov, T.; Sutskever, I.; Chen, K.; Corrado, G.S.; Dean, J. Distributed representations of words and phrases and their compositionality. In Proceedings of the 27th Annual Conference on Neural Information Processing Systems, Lake Tahoe, NV, USA, 5–10 December 2013; pp. 3111–3119. [Google Scholar]
- Kulkarni, N. A comparative study of Word Embedding Techniques to extract features from Text. Turk. J. Comput. Math. Educ. 2021, 12, 3550–3557. [Google Scholar]
- Kumari, K.; Singh, J.P.; Dwivedi, Y.K.; Rana, N.P. Towards Cyberbullying-free social media in smart cities: A unified multi-modal approach. Soft Comput. 2020, 24, 11059–11070. [Google Scholar] [CrossRef]
- Alsubait, T.; Alfageh, D. Comparison of Machine Learning Techniques for Cyberbullying Detection on YouTube Arabic Comments. Int. J. Comput. Sci. Netw. Secur. 2021, 21, 1–5. [Google Scholar]
- Hakak, S.; Alazab, M.; Khan, S.; Gadekallu, T.R.; Maddikunta, P.K.; Khan, W.Z. An ensemble machine learning approach through effective feature extraction to classify fake news. Future Gener. Comput. Syst. 2021, 117, 47–58. [Google Scholar] [CrossRef]
- Salton, G.; Buckley, C. Term-weighting approaches in automatic text retrieval. Inf. Process. Manag. 1988, 24, 513–523. [Google Scholar] [CrossRef] [Green Version]
- Bejani; Mahdi, M.; Ghatee, M. A systematic review on overfitting control in shallow and deep neural networks. Artif. Intell. Rev. 2021, 54, 6391–6438. [Google Scholar] [CrossRef]
- Vergara, J.R. A review of feature selection methods based on mutual information. Neural Comput. Appl. 2014, 24, 175–186. [Google Scholar] [CrossRef]
- Zhou, H. Feature selection based on mutual information with correlation coefficient. Appl. Intell. 2022, 52, 5457–5474. [Google Scholar] [CrossRef]
- Amiri, F.; Yousefi, M.R.; Lucas, C.; Shakery, A.; Yazdani, N. Mutual information-based feature selection for intrusion detection systems. J. Netw. Comput. Appl. 2011, 34, 1184–1199. [Google Scholar] [CrossRef]
- Che, J.; Yang, Y.; Li, L.; Bai, X.; Zhang, S.; Deng, C. Maximum relevance minimum common redundancy feature selection for nonlinear data. Inf. Sci. 2017, 409, 68–86. [Google Scholar] [CrossRef]
- Aggarwal, R.; Ranganathan, P. Common pitfalls in statistical analysis: Linear regression analysis. Perspect. Clin. Res. 2017, 8, 100. [Google Scholar] [PubMed]
- Chen, J.; Yan, S.; Wong, K. Verbal aggression detection on Twitter comments: Convolutional neural network for short-text sentiment analysis. Neural Comput. Appl. 2020, 32, 10809–10818. [Google Scholar] [CrossRef]
Figure 1.
Pie chart for the class distribution in the Cyber-Troll dataset.

Figure 2.
Framework of the proposed model for DNN-based cyber aggression detection.

Figure 3.
Bar graph of the F1-score of the used machine and deep learning models trained using the Word2vec and emotional combined feature set.
Figure 3.
Bar graph of the F1-score of the used machine and deep learning models trained using the Word2vec and emotional combined feature set.

Figure 4.
Histograms of the emotional features.

Figure 5.
Boxplots of the emotional features.

Figure 6.
The correlation between the emotional features and the prediction outcome.


Table 1.
Cyber-Troll Dataset.
| Dataset Name | Total Tweets | Aggressive | Non Aggressive |
|---|---|---|---|
| Cyber_ Troll | 20,001 | 7822 | 12,179 |
Table 2.
Parameters of the used deep learning models.
| Hyper Parameters | DNN | CNN | LSTM | BiLSTM |
|---|---|---|---|---|
| LSTM units | - | - | 2 | 2 |
| Hidden neurons | - | - | 512,256 | 512,256 |
| Dense layers | 3(256,128,1) | 1 (3) | 2 (256,2) | 2 (256,2) |
| Max- pooling | - | 4 | - | - |
| Act func on hidden Layer | ReLU | ReLU | ReLU | ReLU |
| Act func on output Layer | Softmax | Softmax | Softmax | Softmax |
| Epochs | 100 | 200 | 200 | 200 |
| Batch_size | 128 | 128 | 128 | 128 |
| Optimizer | Adam | Adam | Adam | Adam |
Table 3.
Evaluation measures of the used machine learning models fed with Word2vec features. The measures are presented as average percentages.
Table 3.
Evaluation measures of the used machine learning models fed with Word2vec features. The measures are presented as average percentages.
| Models | Precision | Recall | F1-Score | Accuracy |
|---|---|---|---|---|
| SVM | 67.21 ± 0.23 | 67.74 ± 0.85 | 64.24 ± 0.74 | 62.17 ± 0.36 |
| LR | 62.36 ± 0.18 | 49.24 ± 0.73 | 44.96 ± 0.19 | 58.14 ± 0.90 |
| NB | 62.75 ± 0.22 | 49.74 ± 0.69 | 44.09 ± 0.74 | 48.27 ± 0.18 |
| KNN | 67.36 ± 0.77 | 67.88 ± 0.37 | 67.08 ± 0.74 | 66.23 ± 0.88 |
| GB | 77.82 ± 0.58 | 76.66 ± 0.69 | 77.10 ± 0.27 | 76.71 ± 0.05 |
| DT | 75.08 ± 0.41 | 74.47 ± 0.81 | 74.33 ± 0.38 | 73.13 ± 0.61 |
| LDA | 69.94 ± 0.04 | 69.94 ± 0.82 | 68.31 ± 0.36 | 68.55 ± 0.54 |
Table 4.
Evaluation measures of the used deep learning models fed with the Word2vec features. The measures are presented as percentages.
Table 4.
Evaluation measures of the used deep learning models fed with the Word2vec features. The measures are presented as percentages.
| Models | Precision | Recall | F1-Score | Accuracy |
|---|---|---|---|---|
| LSTM | 80.25 ± 0.24 | 82.15 ± 0.47 | 80.65 ± 0.85 | 82.15 ± 0.15 |
| BiLSTM | 83.17 ± 0.74 | 85.84 ± 0.21 | 84.76 ± 0.86 | 85.17 ± 0.48 |
| CNN | 81.14 ± 0.47 | 80.38 ± 0.16 | 79.96 ± 0.84 | 82.14 ± 0.37 |
| DNN | 86.28 ± 0.08 | 87.74 ± 0.19 | 87.11 ± 0.83 | 88.34 ± 0.17 |
Table 5.
Evaluation measures of the used machine learning models fed with the combined (Word2vec + emotional) features. The measures are presented as average percentages.
Table 5.
Evaluation measures of the used machine learning models fed with the combined (Word2vec + emotional) features. The measures are presented as average percentages.
| Models | Precision | Recall | F1-Score | Accuracy |
|---|---|---|---|---|
| SVM | 80.15 ± 0.85 | 80.69 ± 0.21 | 74.37 ± 0.96 | 78.48 ± 0.65 |
| LR | 78.17 ± 0.73 | 59.67 ± 0.09 | 61.36 ± 0.19 | 68.48 ± 0.54 |
| NB | 82.18 ± 0.38 | 59.64 ± 0.63 | 54.19 ± 0.37 | 56.90 ± 0.71 |
| KNN | 79.15 ± 0.81 | 79.37 ± 0.94 | 79.16 ± 0.09 | 76.38 ± 0.73 |
| GB | 83.28 ± 0.54 | 84.08 ± 0.66 | 84.18 ± 0.75 | 86.06 ± 0.77 |
| DT | 77.17 ± 0.19 | 78.85 ± 0.84 | 78.25 ± 0.07 | 75.37 ± 0.96 |
| LDA | 78.27 ± 0.21 | 78.18 ± 0.29 | 77.39 ± 0.74 | 75.69 ± 0.24 |
Table 6.
Evaluation measures of the used deep learning models fed with the combined (Word2vec + emotional) features. The measures are presented as average percentages.
Table 6.
Evaluation measures of the used deep learning models fed with the combined (Word2vec + emotional) features. The measures are presented as average percentages.
| Models | Precision | Recall | F1-Score | Accuracy |
|---|---|---|---|---|
| LSTM | 88.41 ± 0.67 | 86.96 ± 0.75 | 87.47 ± 0.67 | 88.14 ± 0.27 |
| BiLSTM | 91.21 ± 0.74 | 90.86 ± 0.41 | 90.96 ± 0.96 | 91.43 ± 0.17 |
| CNN | 88.75 ± 0.56 | 87.34 ± 0.63 | 86.41 ± 0.38 | 84.74 ± 0.68 |
| DNN | 97.17 ± 0.48 | 96.73 ± 0.91 | 97.18 ± 0.19 | 96.07 ± 0.28 |
Table 7.
Emotional features, statistical summary.
| Emotional Feature | N | Mean | SD | Min | Q1 | Q3 | Max |
|---|---|---|---|---|---|---|---|
| Anger | 20,001 | 3.014 | 5.964 | 0 | 0 | 4.348 | 75 |
| Anticipation | 20,001 | 1.472 | 3.708 | 0 | 0 | 0 | 50 |
| Anxiety | 20,001 | 2.162 | 4.874 | 0 | 0 | 3.333 | 100 |
| Disgust | 20,001 | 3.109 | 6.235 | 0 | 0 | 4.348 | 100 |
| Joy | 20,001 | 1.532 | 4.097 | 0 | 0 | 0 | 100 |
| Sadness | 20,001 | 2.292 | 5.038 | 0 | 0 | 3.571 | 100 |
| Surprise | 20,001 | 0.748 | 2.753 | 0 | 0 | 0 | 100 |
| Trust | 20,001 | 1.485 | 3.864 | 0 | 0 | 0 | 100 |
Table 8.
Statistical summary of a binomial logistic regression using emotional features.
| Estimate | Standard Error | z Value | Pr(>|z|) | Significance | |
|---|---|---|---|---|---|
| Intercept | −0.5531 | 0.0205 | −26.9310 | <2 × 10 | *** |
| Anger | 0.0003 | 0.0057 | 0.0520 | 0.9588 | |
| Anticipation | 0.0023 | 0.0059 | 0.3970 | 0.6914 | |
| Anxiety | −0.0088 | 0.0066 | −1.3270 | 0.1846 | |
| Disgust | 0.0474 | 0.0054 | 8.7020 | <2 × 10 | *** |
| Joy | −0.0380 | 0.0067 | −5.7090 | 1.13 × 10 | *** |
| Sadness | 0.0228 | 0.0064 | 3.5660 | 0.0004 | *** |
| Surprise | −0.0061 | 0.0079 | −0.7690 | 0.4420 | |
| Trust | −0.0140 | 0.0063 | −2.2390 | 0.0252 | * |
Table 9.
Comparison of the classification performance of the proposed DNN model with the existing models.
Publisher’s Note: MDPI stays neutral with regard to jurisdictional claims in published maps and institutional affiliations. |
© 2022 by the authors. Licensee MDPI, Basel, Switzerland. This article is an open access article distributed under the terms and conditions of the Creative Commons Attribution (CC BY) license (https://creativecommons.org/licenses/by/4.0/).
Share and Cite
MDPI and ACS Style
Khan, U.; Khan, S.; Rizwan, A.; Atteia, G.; Jamjoom, M.M.; Samee, N.A. Aggression Detection in Social Media from Textual Data Using Deep Learning Models. Appl. Sci. 2022, 12, 5083. https://0-doi-org.brum.beds.ac.uk/10.3390/app12105083
AMA Style
Khan U, Khan S, Rizwan A, Atteia G, Jamjoom MM, Samee NA. Aggression Detection in Social Media from Textual Data Using Deep Learning Models. Applied Sciences. 2022; 12(10):5083. https://0-doi-org.brum.beds.ac.uk/10.3390/app12105083
Chicago/Turabian StyleKhan, Umair, Salabat Khan, Atif Rizwan, Ghada Atteia, Mona M. Jamjoom, and Nagwan Abdel Samee. 2022. "Aggression Detection in Social Media from Textual Data Using Deep Learning Models" Applied Sciences 12, no. 10: 5083. https://0-doi-org.brum.beds.ac.uk/10.3390/app12105083
Note that from the first issue of 2016, this journal uses article numbers instead of page numbers. See further details here.