Article

Effects of Slope Angle on Toppling Deformation of Anti-Dip Layered Rock Slopes: A Centrifuge Study

1
State Key Laboratory of Geohazard Prevention and Geoenvironment Protection, Chengdu University of Technology, Chengdu 610059, China
2
Department of Civil and Environmental Engineering, University of Alberta, Edmonton, AB T6G 2R3, Canada
3
China Huaxi Engineering Design & Construction Co., Ltd., Chengdu 610059, China
4
Powerchina Chengdu Engineering Corporation Limited, Chengdu 610059, China
*
Author to whom correspondence should be addressed.
Submission received: 19 April 2022 / Revised: 12 May 2022 / Accepted: 16 May 2022 / Published: 18 May 2022
(This article belongs to the Section Civil Engineering)

Abstract

:
To reveal the impact of slope angle change on toppling deformation, this paper takes the dam toppling deformation of Gushui Hydropower Station based at Lancang River as an example, based on which three groups of models with different slope angles are conceptualized and designed. Through the centrifuge test, the evolution of toppling deformation of a counter-tilt layered slope under different slope angles was simulated. The research results show that: (1) The steeper the slope angle, the shorter the cumulative time required for such deformation is, the larger the toppling deformation will be, and it is more likely that multi-stage fracture zones will occur during the toppling process. (2) The toppling deformation process can be summarized as four stages. (3) The toppling deformation mainly occurs above the datum surface of the toppling fracture; the angle between the datum surface and the normal of the layer is between 12° to 16°. This value shall not change as the slope angle changes. (4) The lesser the slope angle is, the more likely the toppling deformed slope will be experience overall slipping instability. while the steeper the slope angle is, the greater the possibility of collapse after the rock mass falls.

1. Introduction

In recent years, various engineering slope problems have been exposed and have become the key issues hindering engineering construction projects with the rapid development of water conservancy and hydropower, transportation, mining and other civil engineering projects. Geological hazards such as landslides occur regularly along the Yangtze River in China. With a total length of 6300 km, the river cuts through a multitude of geomorphic units and encompasses geological conditions that are prone to landslides [1]. For example, the 1985 Xintan colluvial landslide in the TGA destroyed the thousand-year-old town of Xintan and resulted in a 12-day disruption to shipping. Fortunately, early forecasts and timely evacuation prevented any fatalities [2]. Compared with that of inclined rock slopes, toppling failure is the most typical deformation failure mode of anti-dip rock slopes. This type of deformation is very common in the deep-cut valley region of the Qinghai-Tibet Plateau (Figure 1). For example, most toppling deformation problems of slopes have occurred in large hydropower projects that have were being constructed in the middle and upper reaches of the Lancang River. We learned that anti-dip steep slopes show signs of toppling deformation if the lithology conditions (mostly in schist and slate) and the free-face condition of the river valley (high steep vertical slope) are met. Toppling deformations have posed great threats in engineering constructions and have gradually attracted wide attention from researchers and geologists.
Previous research suggested that the depth of toppling deformation and failure was usually within a certain range of tens of metres, and large-scale deep failure was unusual. Goodman and Bray [3] categorized the toppling deformation of layered slopes into three basic types: flexural toppling, block toppling and block flexural toppling; the concept of secondary toppling deformation caused by slope foot cutting, river erosion and weathering or human engineering activities was also proposed. The large amount of slope toppling deformation recently found in the deep-cut valley area of Western China greatly exceeded the pre-existing knowledge in terms of development scale and toppling degree. Based on the analysis of numerous engineering projects, Huang et al. [4] proposed that toppling deformation could be divided into the following basic types depending on the development scale, deformation characteristics and disaster pattern involved: shallow toppling, deep-seated toppling and a composite deformation of toppling and slipping. Zhang and Liu [5] comprehensively analysed the deformation mechanism of the anti-dip slope and divided the evolution process of toppling deformation into four stages: flexural–tensile, flexural fracture, slip and fracture and deep slip. Nichol et al. [6] conducted a study on the differences between the lithologies of brittle rock and ductile rock regarding the toppling deformation characteristics of anti-dip rock slopes through the Universal Distinct Element Code (UDEC), concludeding that ductile toppling deformation occurs over a long period of time and brittle toppling deformation was controlled by dominant sets of joints.
At present, the geotechnical centrifuge test is the most intuitive and comparably accurate physical simulation method for studying the failure modes and evolution process of slopes (Moo-Yong et al. [7]; Lee K et al. [8]; Kapogianni, and Sakellariou, et al. [9]; Zhang et al. [10]; Alzo’ubi et al. [11]; Wang et al. [12]; Dewoolkar et al. [13]; Chu. [14]; Yan et al. [15]; and Idinger et al. [16]). The high-speed rotation of the centrifuge could approximately construct the natural stress field of the original slope; thus, the slope model can undergo deformation evolution under certain acceleration conditions, which can relatively realistically reproduce the deformation failure process of the slope. Adhikary et al. [17,18] conducted a series of centrifuge tests to study the toppling failure mechanism of anti-dip rock slopes and the development process of the rupture surface. The results indicate that toppling failure is controlled by the planes of the rock layer and the structure planes and deformation failure often occurs from the foot of the slope, which can be regarded as cantilever beam toppling and bending freely to the free face under gravity. The internal friction angle controls the failure mode of the anti-dip slope, and the cohesion has little effect on the toppling deformation or failure. Alzo’ubi and Martin [11] analysed the influence of the tensile strength of the rock stratum on toppling deformation by centrifuge model testing. The results indicated that toppling deformation was mainly controlled by the tensile strength of the rock stratum. The failure mechanism of block-flexure toppling failure using a centrifuge model was reported by Zhang et al. [19]. The results of the centrifuge test indicates that block-flexure toppling failure occurs instantaneously and that the total failure surface is stepped. The deformation and failure zone can be divided into three subzones: a toppling failure zone, a crack zone, and a deformation zone [20].
The causes and conditions for the toppling deformation of counter-tilt layered rock slopes are complicated (Zheng et al. [21]). The author took the toppling deformation body in front of the dam of the Lancang River Gushui Hydropower Station as a prototype slope to construct a physics model slope and conducted a centrifuge simulation test. The author revealed the disaster mode for deep-seated toppling of anti-dip rock slopes and proposed that the change in the slope angles was the key hazard factor for the deformation and failure of anti-dip rock slopes. However, the conclusion is required further verification and improvement because of the limitations of the test samples. This study is based on the above-mentioned understanding, taking the toppling deformation body in front of the dam of the Lancang River Gushui Hydropower Station as a prototype slope for the construction of three physics models with slope angles of 55°, 65° and 75° and attempts to perform a comparative analysis on the centrifuge tests of the models with different slope angles to investigate the influence of the change in the free-face conditions on the toppling deformation of anti-dip rock slopes. Additionally, the author would like to obtain the relationship between the change in the slope angle and the evolution of the toppling deformation on the basis of centrifuge tests of multiple samples. In this way, the author can establish a basis for further understanding the failure mode of the toppling deformation and to establish a reliable method for calculating the depth of the toppling-bending zone.

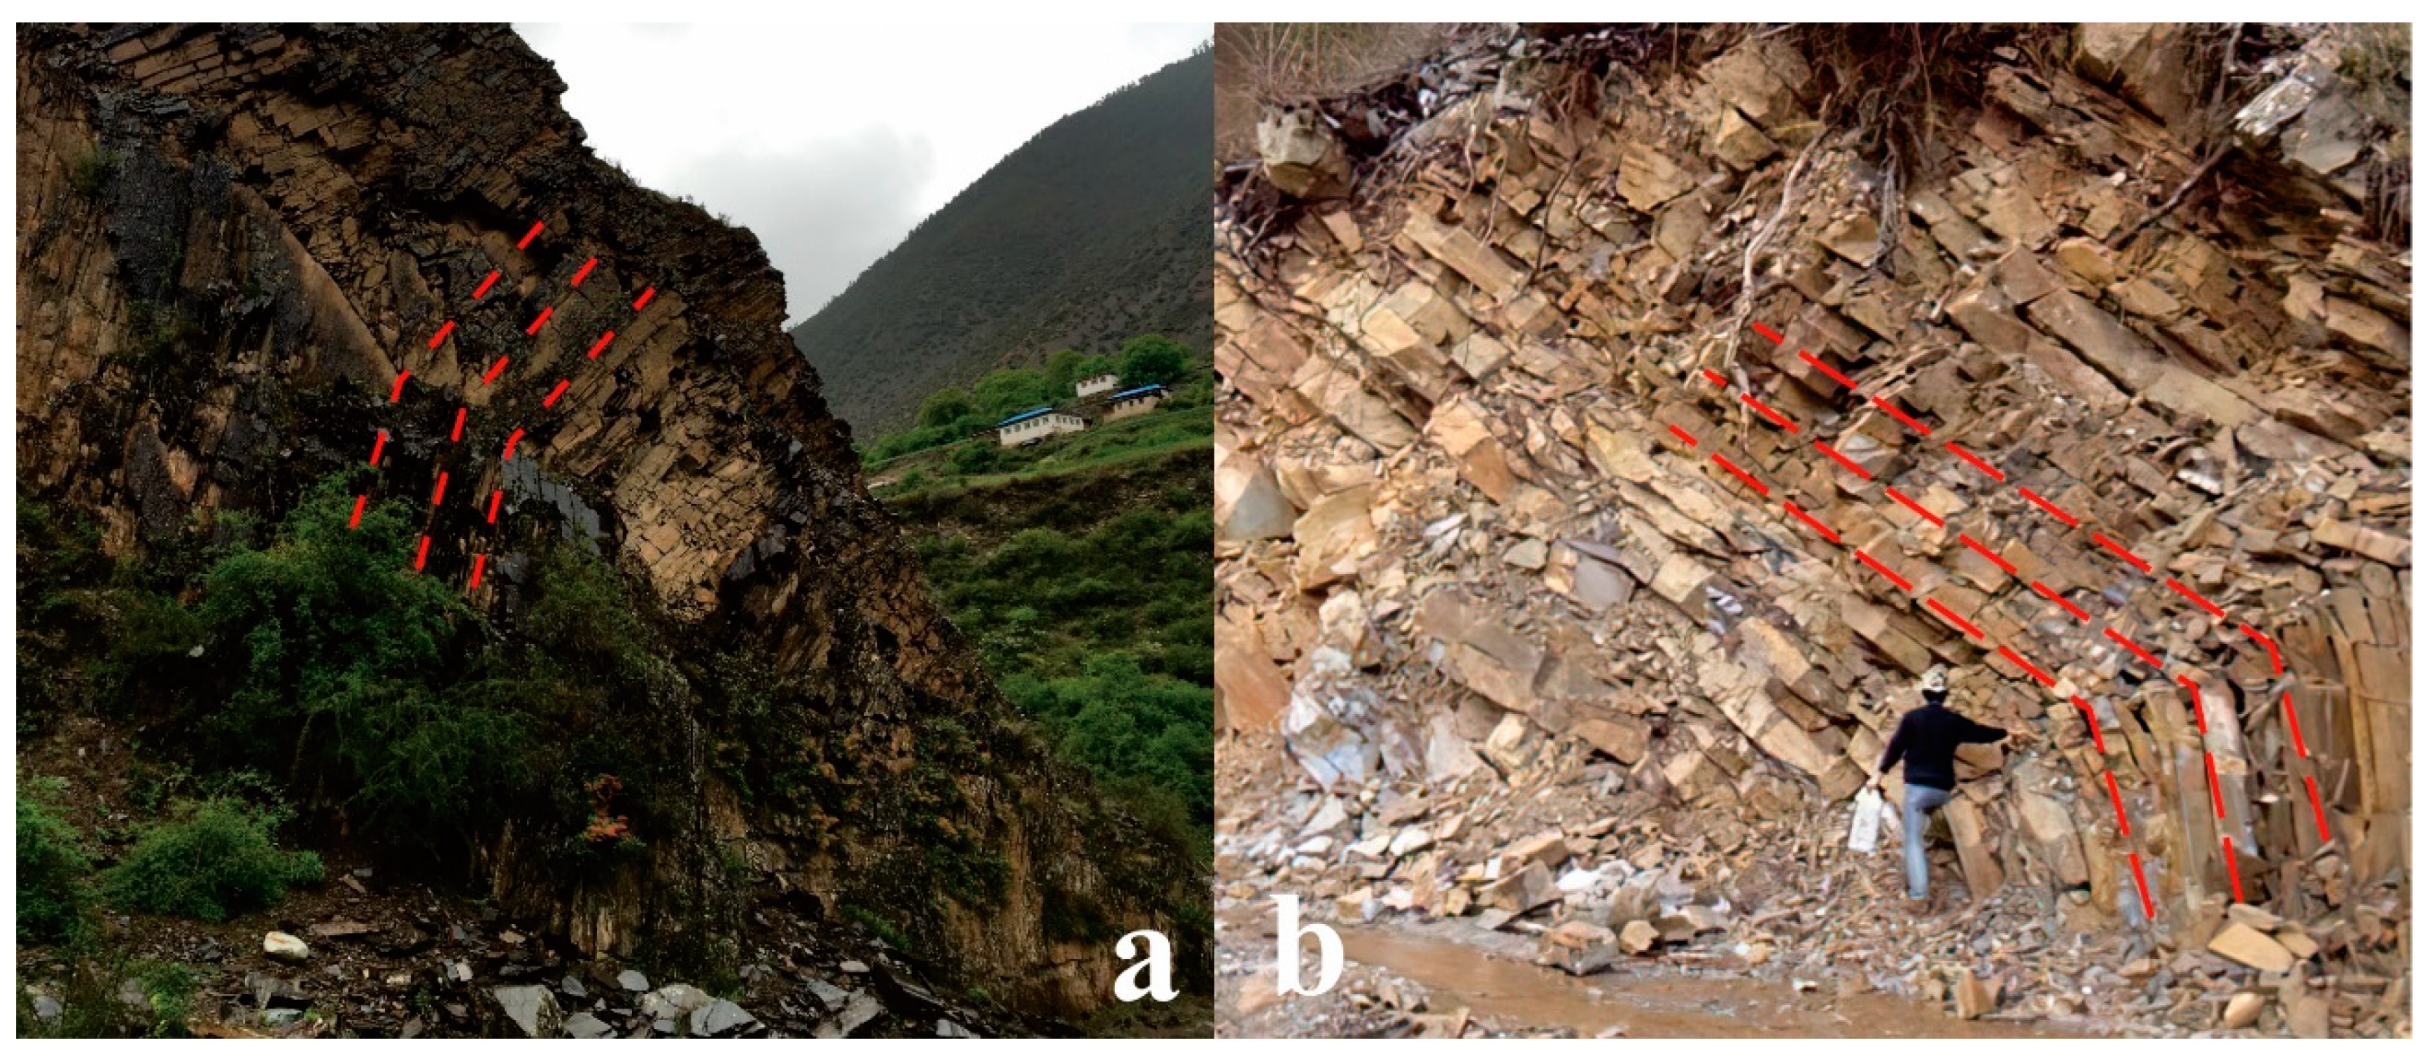
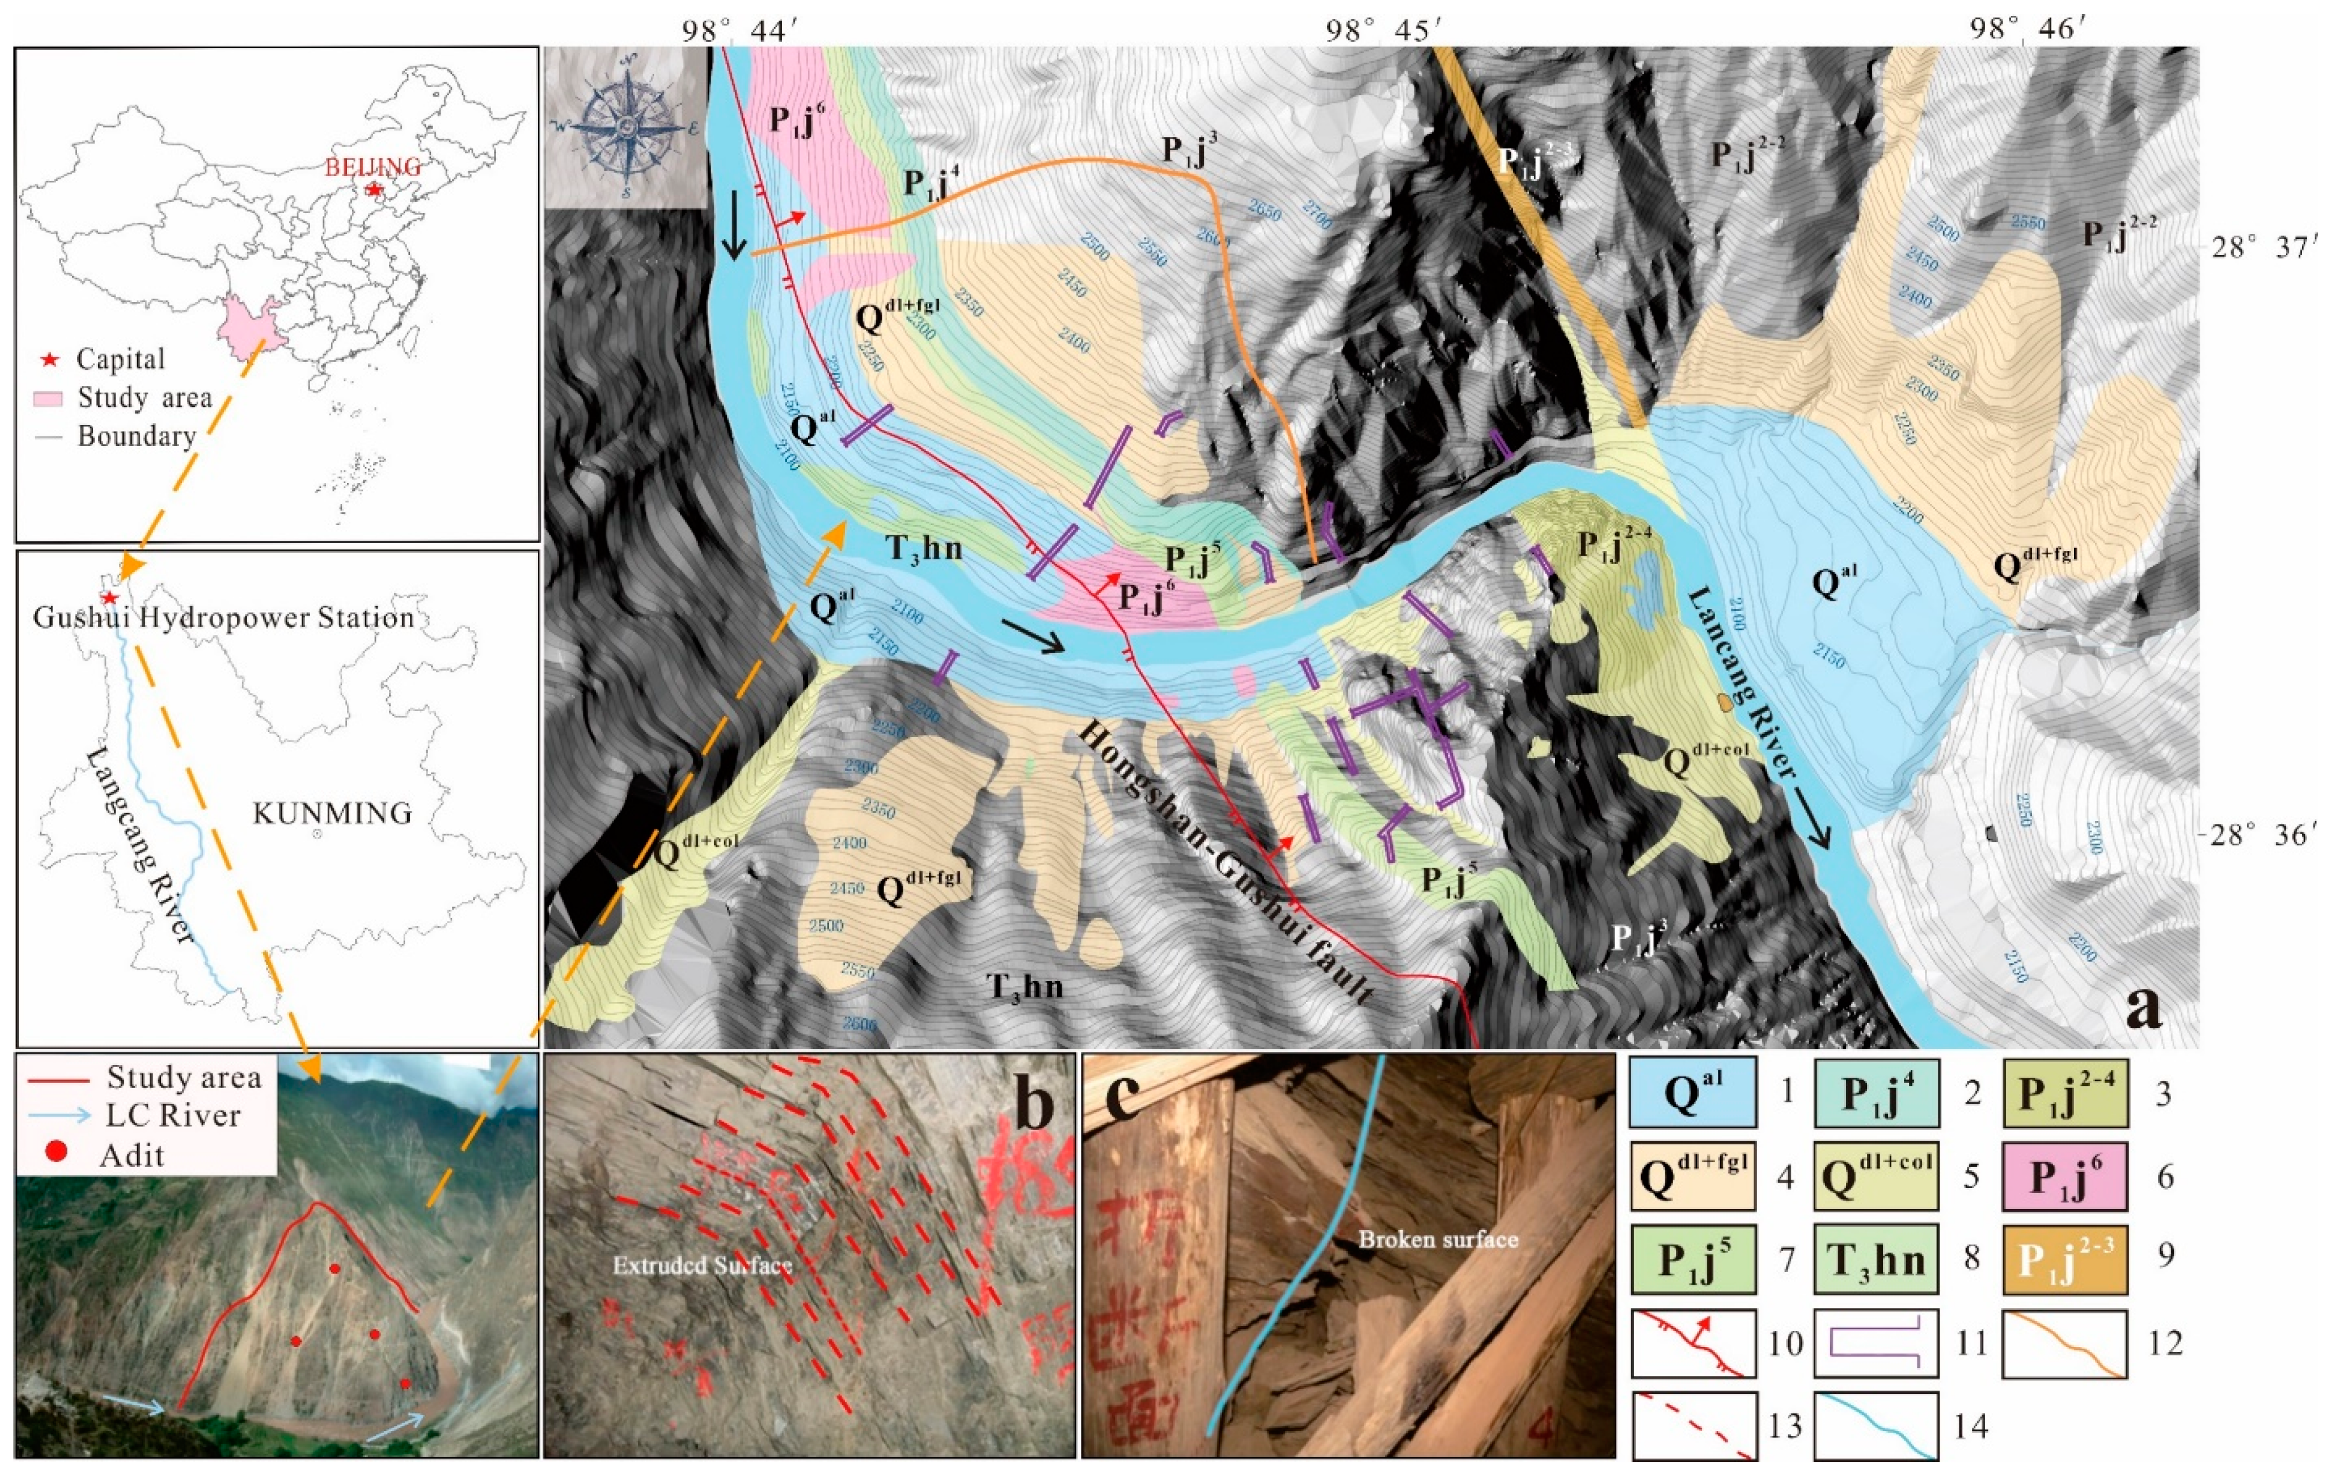
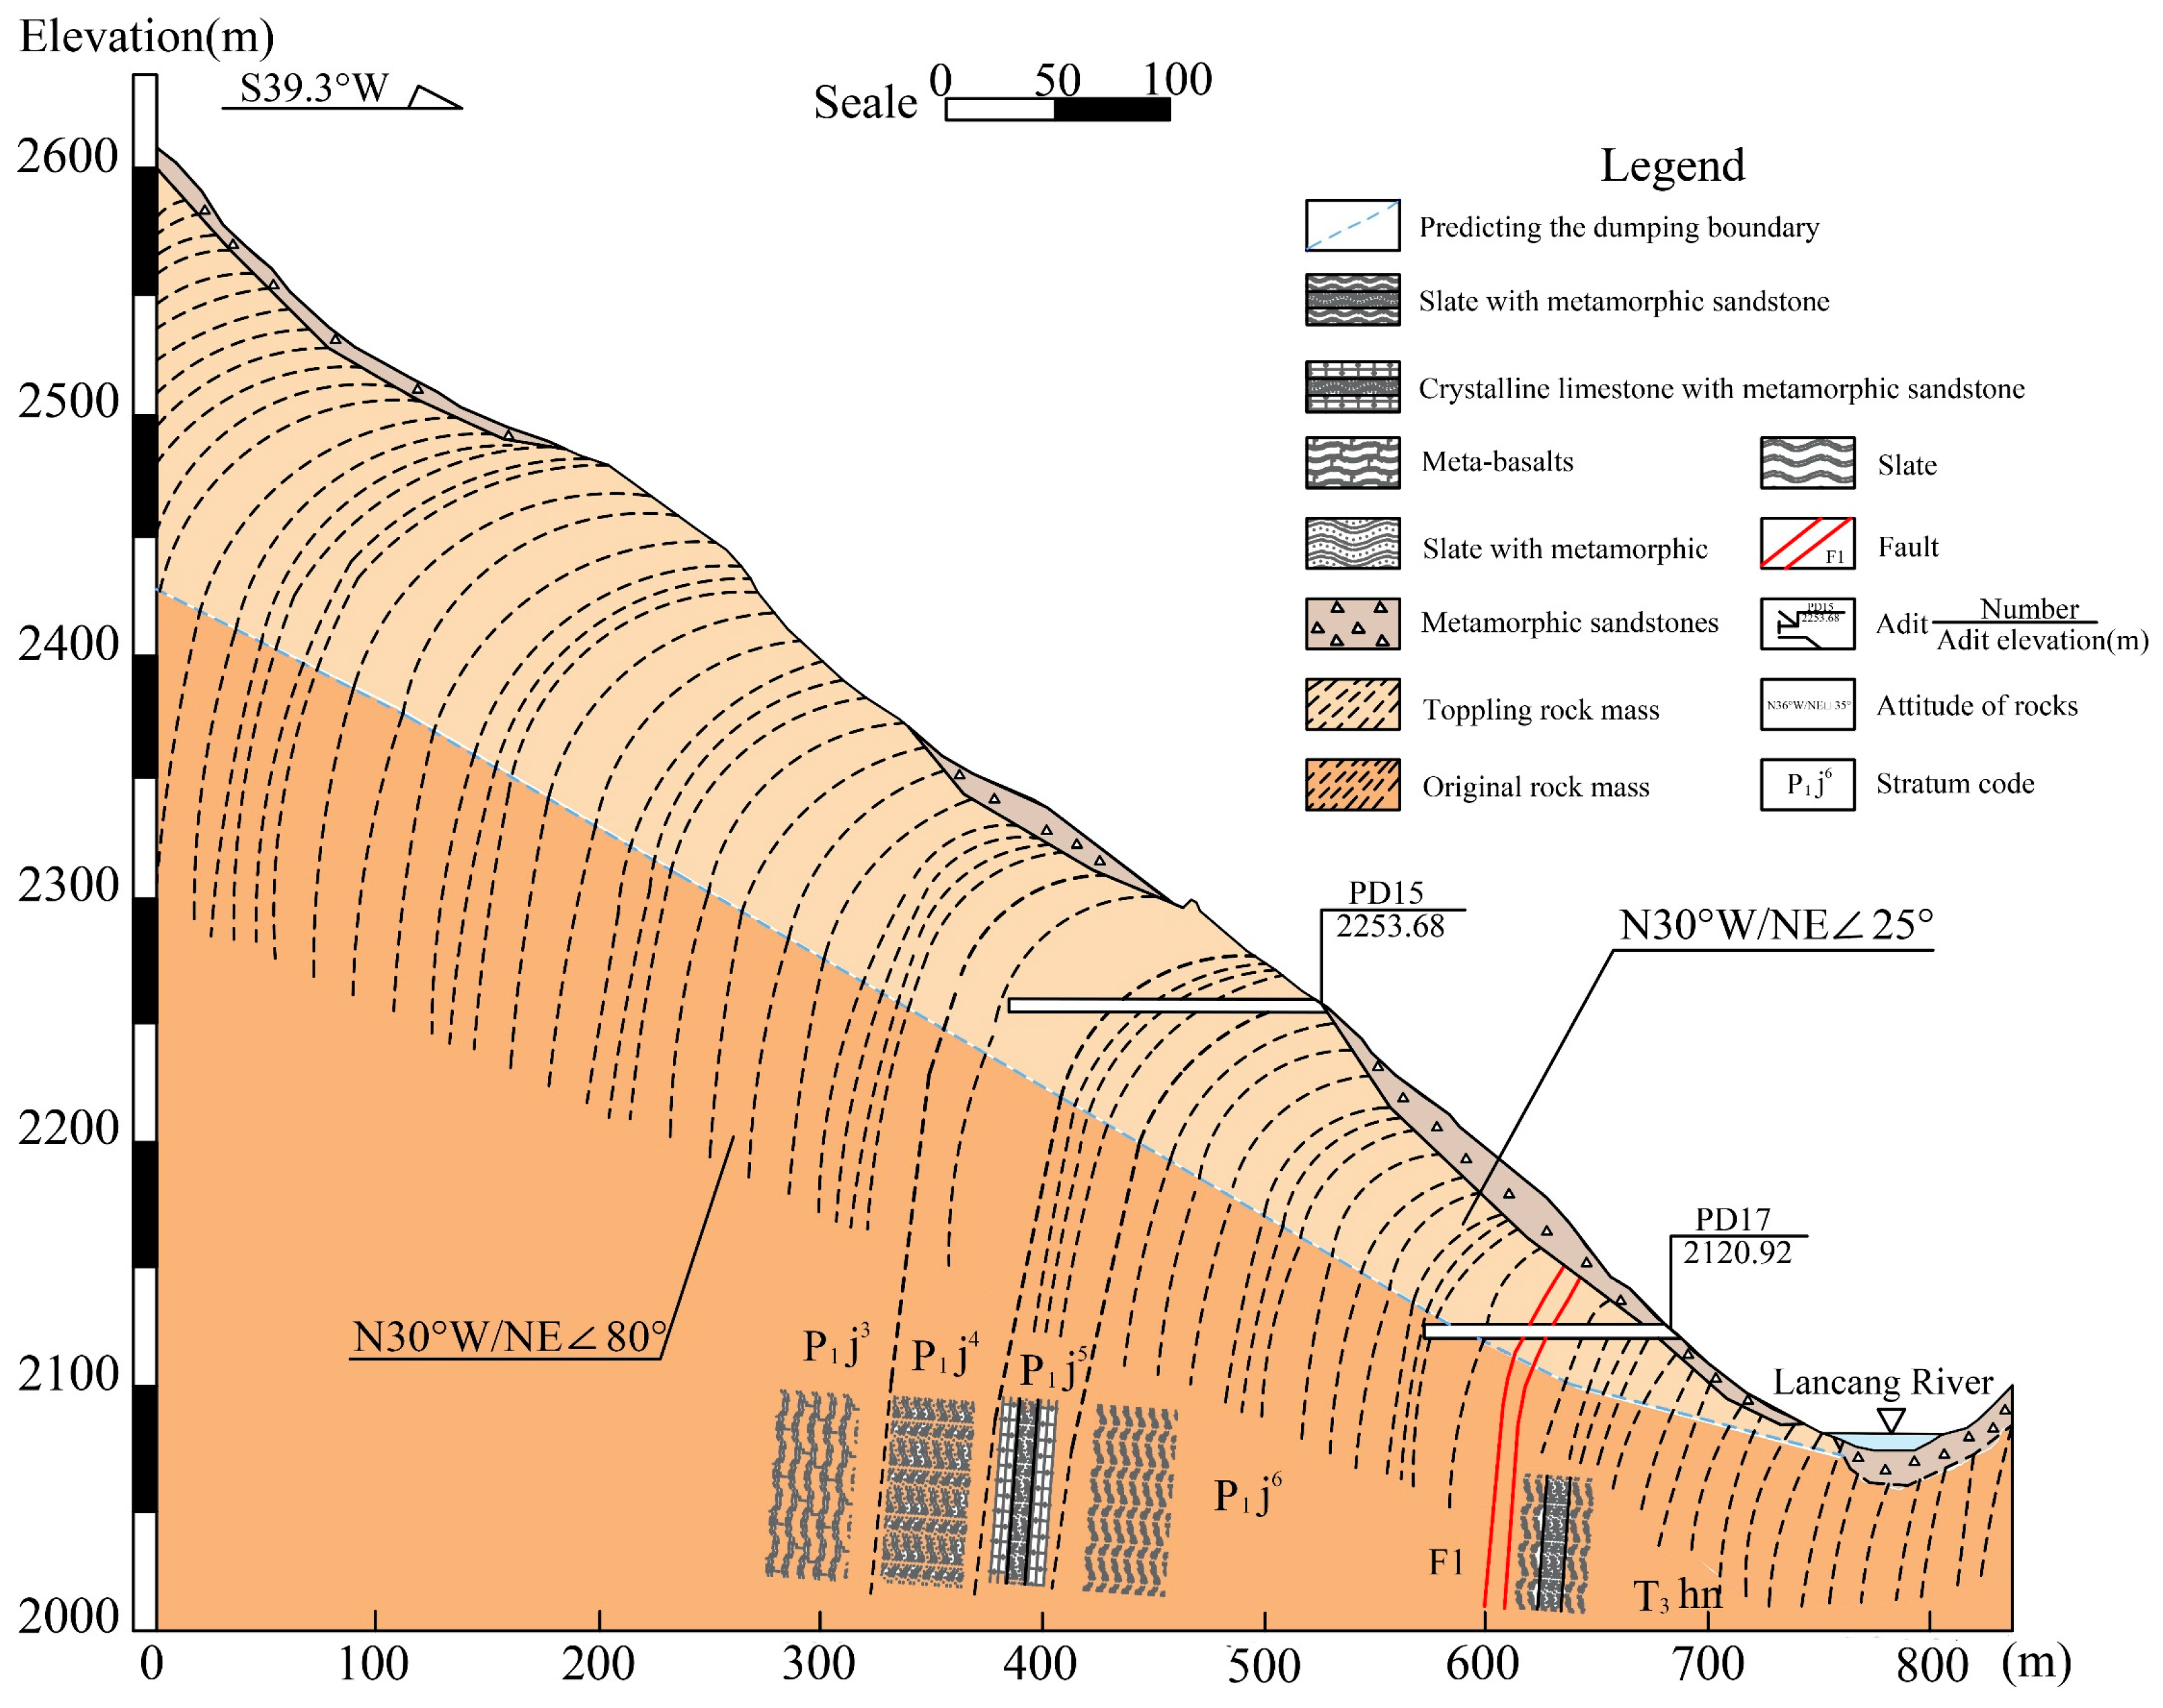
2. Geological Background of the Prototype Slope

The Gushui hydropower station is the first step in a seven-step cascade development plan for a reservoir planned in the upper reaches of the Lancang River and is also the key project of hydroelectric development of the Lancang River. Since the Paleozoic era, the research aera has witnessed the movement of multiple periods, thus forming relatively complex folds and fractures with all different properties. Especially after the Eocene, due to the strong collision between the Indian plate and the Eurasian plate, the Neo-Tethys Ocean, which is adjacent to the west of the research area, closed and disappeared. This effected a strong impact within the area, renovating the ancient mountains. The powerful squeezing by the Indian plate to the Eurasian plate led to a wide range of overlap, dislocation, and slippage between the blocks divided by the fault zones, leading to large-scale geological thrust, which specifically refers to the nappe structure, vertical shear, and strike-slip effect. The Yangtze plate on the east side is getting closer to the Indian plate on the west, thus significantly squeezing the research area and leading to geological shrinkage and slip. In this case, some blocks are not continuous or are missing, thus, finally giving rise to the landform with alternate deep valleys and high mountains.
The river in this study area has strong downward erosion, and the valley is V-shaped. The Lancang River flows in a southeast direction. The river elevation during the dry season is 2074~2080 m, while the width of the river is 20~60 m and the water depth is less than 10 m. Gushui River and a few small gullies are located at the left bank, where the clear water has the flow at about 0.5~1 m3/s. In addition, a large fault structure, the Red Mountain–Gushui fault, developed in this location. The researched slope is located at the sharp bend of the river under the left bank of the dam site of the hydropower station (Figure 2a). The slope is in the west wing of the Flying Temple anticline, and the height of the slope is more than 600 metres, with three free faces and some shallow grooves developed on the slope surface. The slope angle of the study area is between 45° and 75°. The main strata composing the slope are the Upper Triassic Hongpo Formation (T3hn), Lower Permian Tongji Donglong Formation (P1j) and Quaternary (Q) cover layers, and the lithology mainly consists of metamorphic sandstones, micrite limeston, slates, and metamorphic basalts.
There are distinctive signs of toppling deformation for this counter-slip layered rock side slope. The toppling deformation range of the rock strata is mainly distributed at the elevation of 2150~2720 m. The stratum of toppling deformation is mainly the metamorphic sandstone and slate in Jidonglong formation and Hongpo formation. According to the disclosure of PD15 (elevation 2253.7 m) and PD 17 (elevation 2120.9 m) on the slope, the toppling depth of this slope is 90.7~111.2 m, with the total volume about 700 × 104 m3. The attitude of the normal rock formation that is not toppled is N25°~35°W, SW(NE) ∠80°~90°, and that of the part with toppling deformation is N20°~30°W, NE ∠25°~40°. The engineering geological section of the slope is shown in Figure 3. Inside the rock mass that has undergone toppling deformation, obvious fracture surfaces and zones can be seen. In some parts, there is obvious staggered deformation. At the external side of the fracture zone, the rock mass structure is in a loose structure and shows obvious off-contact (Figure 2b,c).
The essence of toppling deformation is the gravitational deformation of the rock layer towards the direction of the free face. This process requires a relatively long geological age. The main causes for such deformation, apart from the lithological conditions of the counter-tilt layered slopes, which specifically refers to the brittle metamorphic sandstone and slate of steeply tilting middle layer to the thin layer, are the external factors that change the free-face conditions of the slope (slope height and degree). First of all, the rapid uplift of the Qinghai Tibet Plateau since the Quaternary has directly led to the rapid downward direction change in the Lancang River Valley. The result of such geological change is that the steep “V-shaped” canyon has been formed. The increasing bank slope height and the change in slope degrees have given rise to the large-scale toppling in this area. Furthermore, since the Quaternary, the pushing and squeezing by the Indian plate in the NEE direction and that of the Sichuan Yunnan diamond block to the south makes NNW the direction for the main compressive stress within this area. Within the research area, the flow direction of Lancang River is basically parallel with this direction. The dynamic characteristics of this region have caused the bank slope in the longitudinal direction of the valley experience more violent toppling deformations, where even slope instability and destruction may occur.
Therefore, based on the understanding towards geology and the analysis of underlying reasons, we mentioned in our past research that the change in free-face conditions is the key factor to impact toppling deformation of the slope. To have more in-depth understanding on the impact of free-face conditions on counter-tilt rock slope, and to further locate the relations between free-face conditions and the destruction modes of toppling deformation, this research performed experiments thorough centrifuge simulation and studied the models based on various slope angles to show the toppling deformation process of the slope and explore the deformation process from origin, development, and destruction.

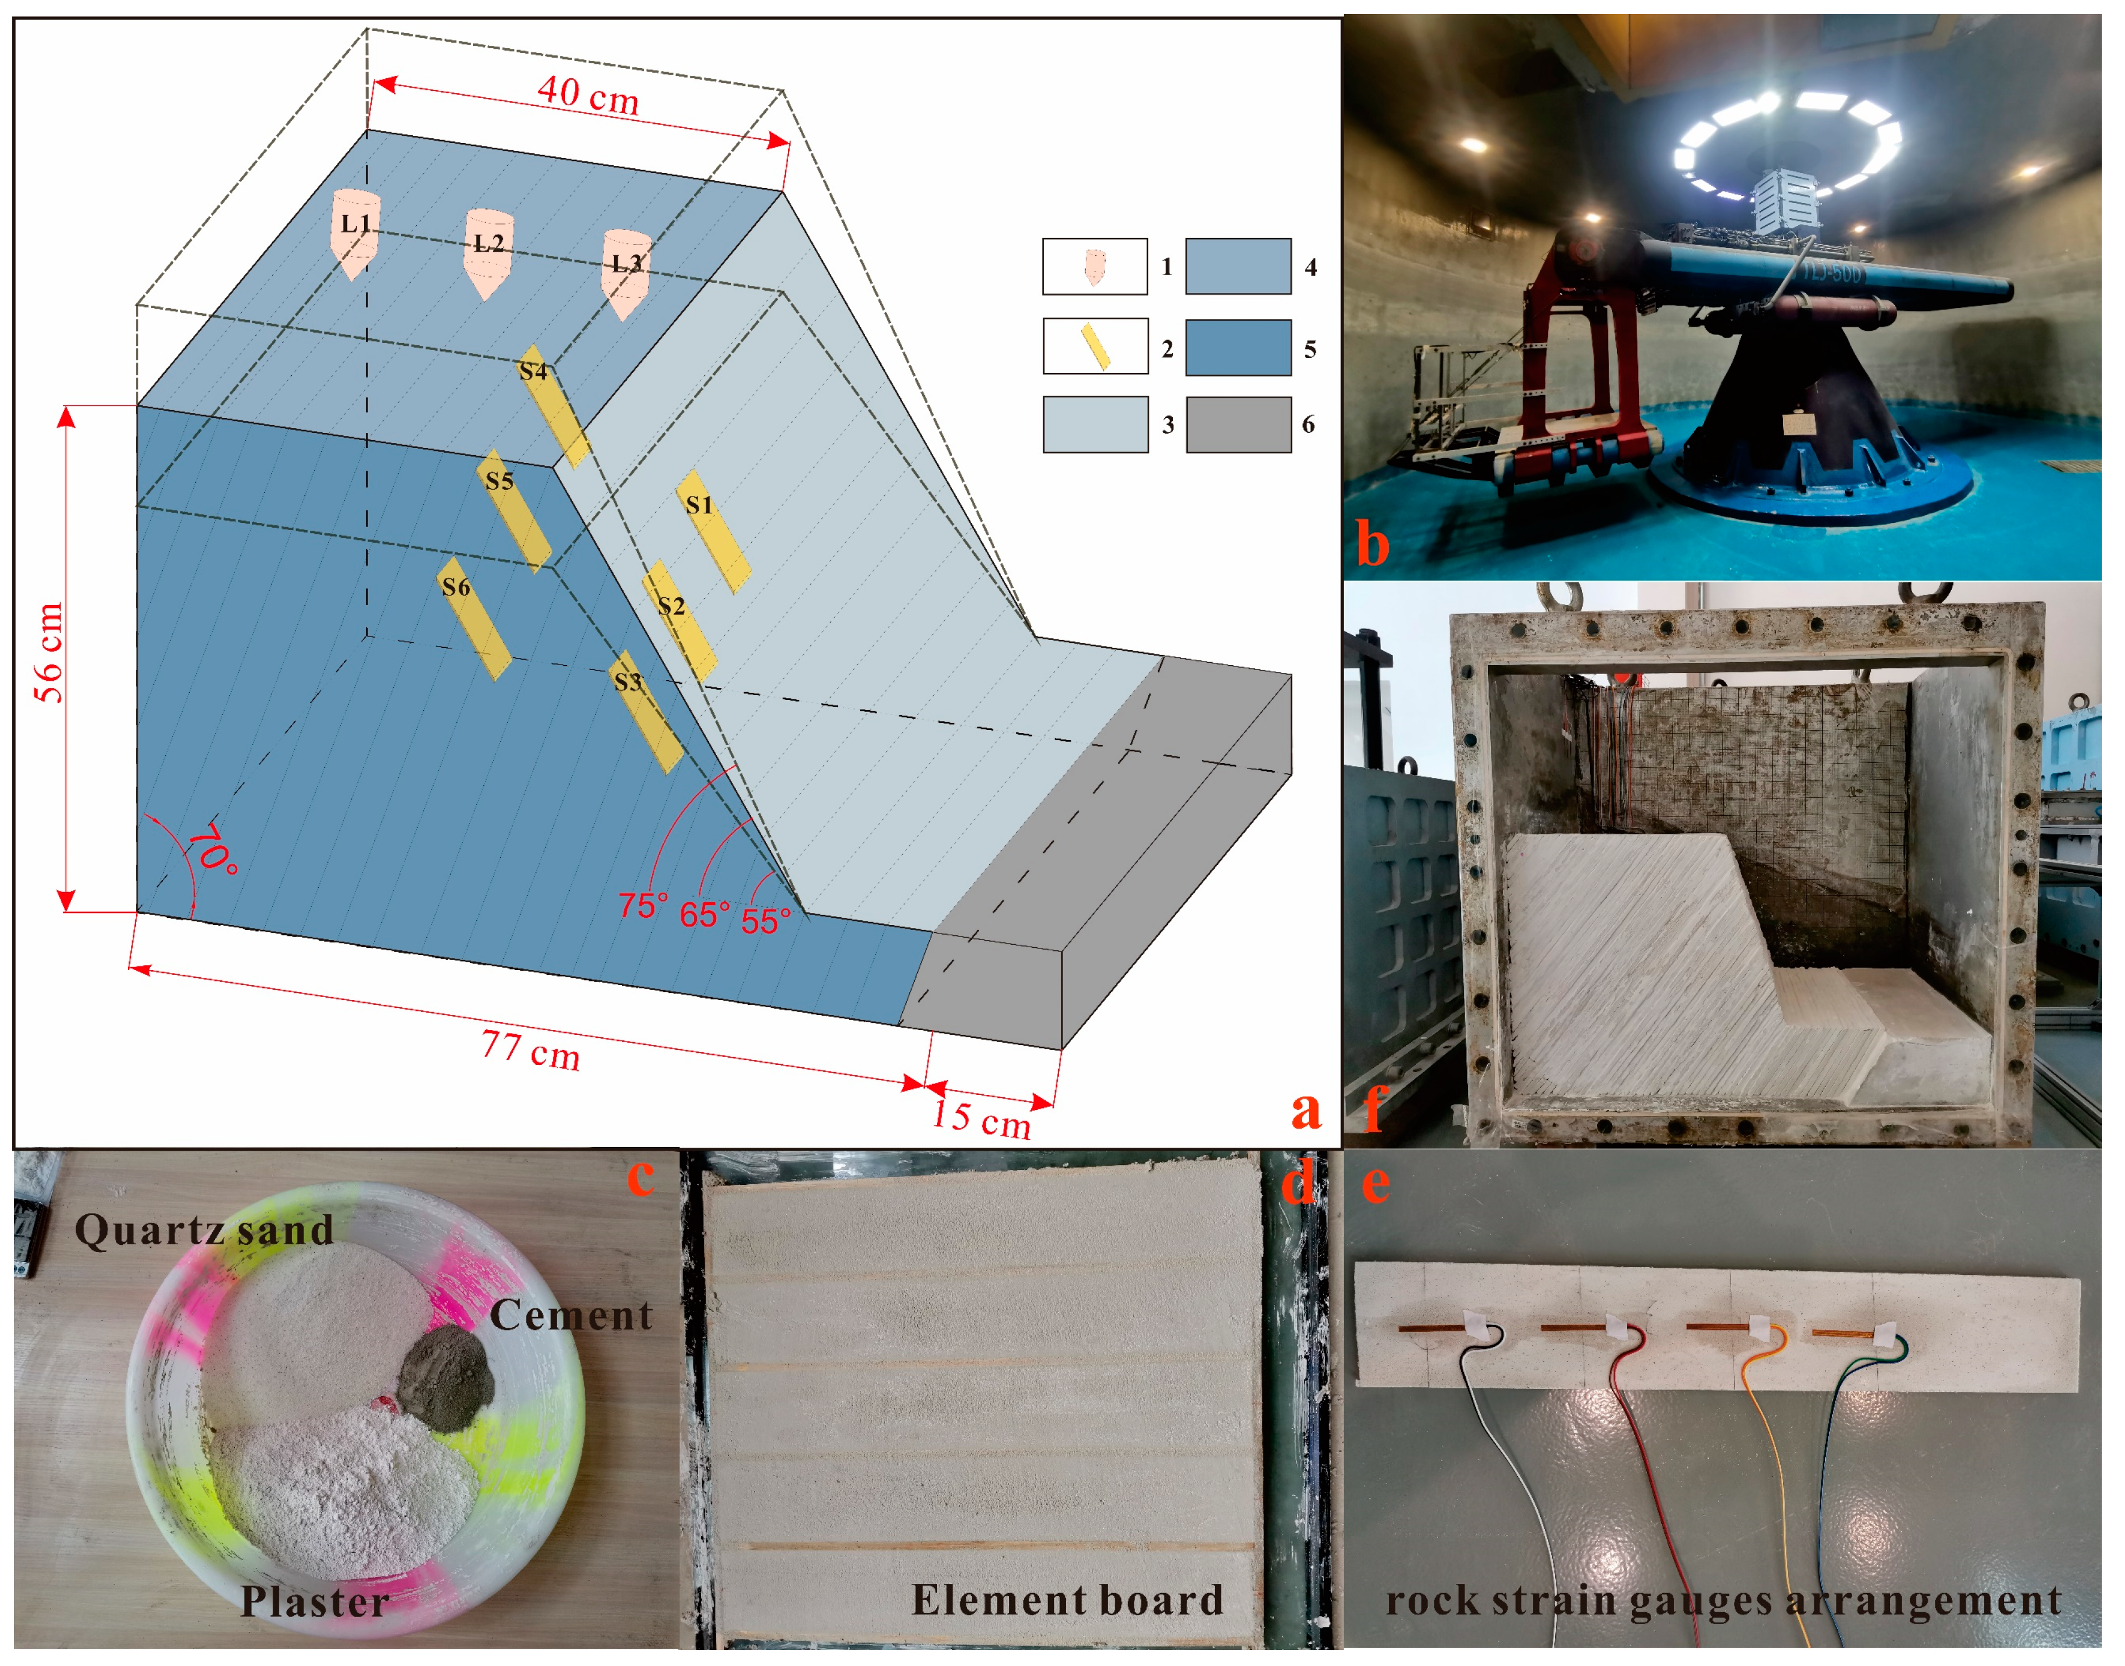
3. Centrifuge Model Design
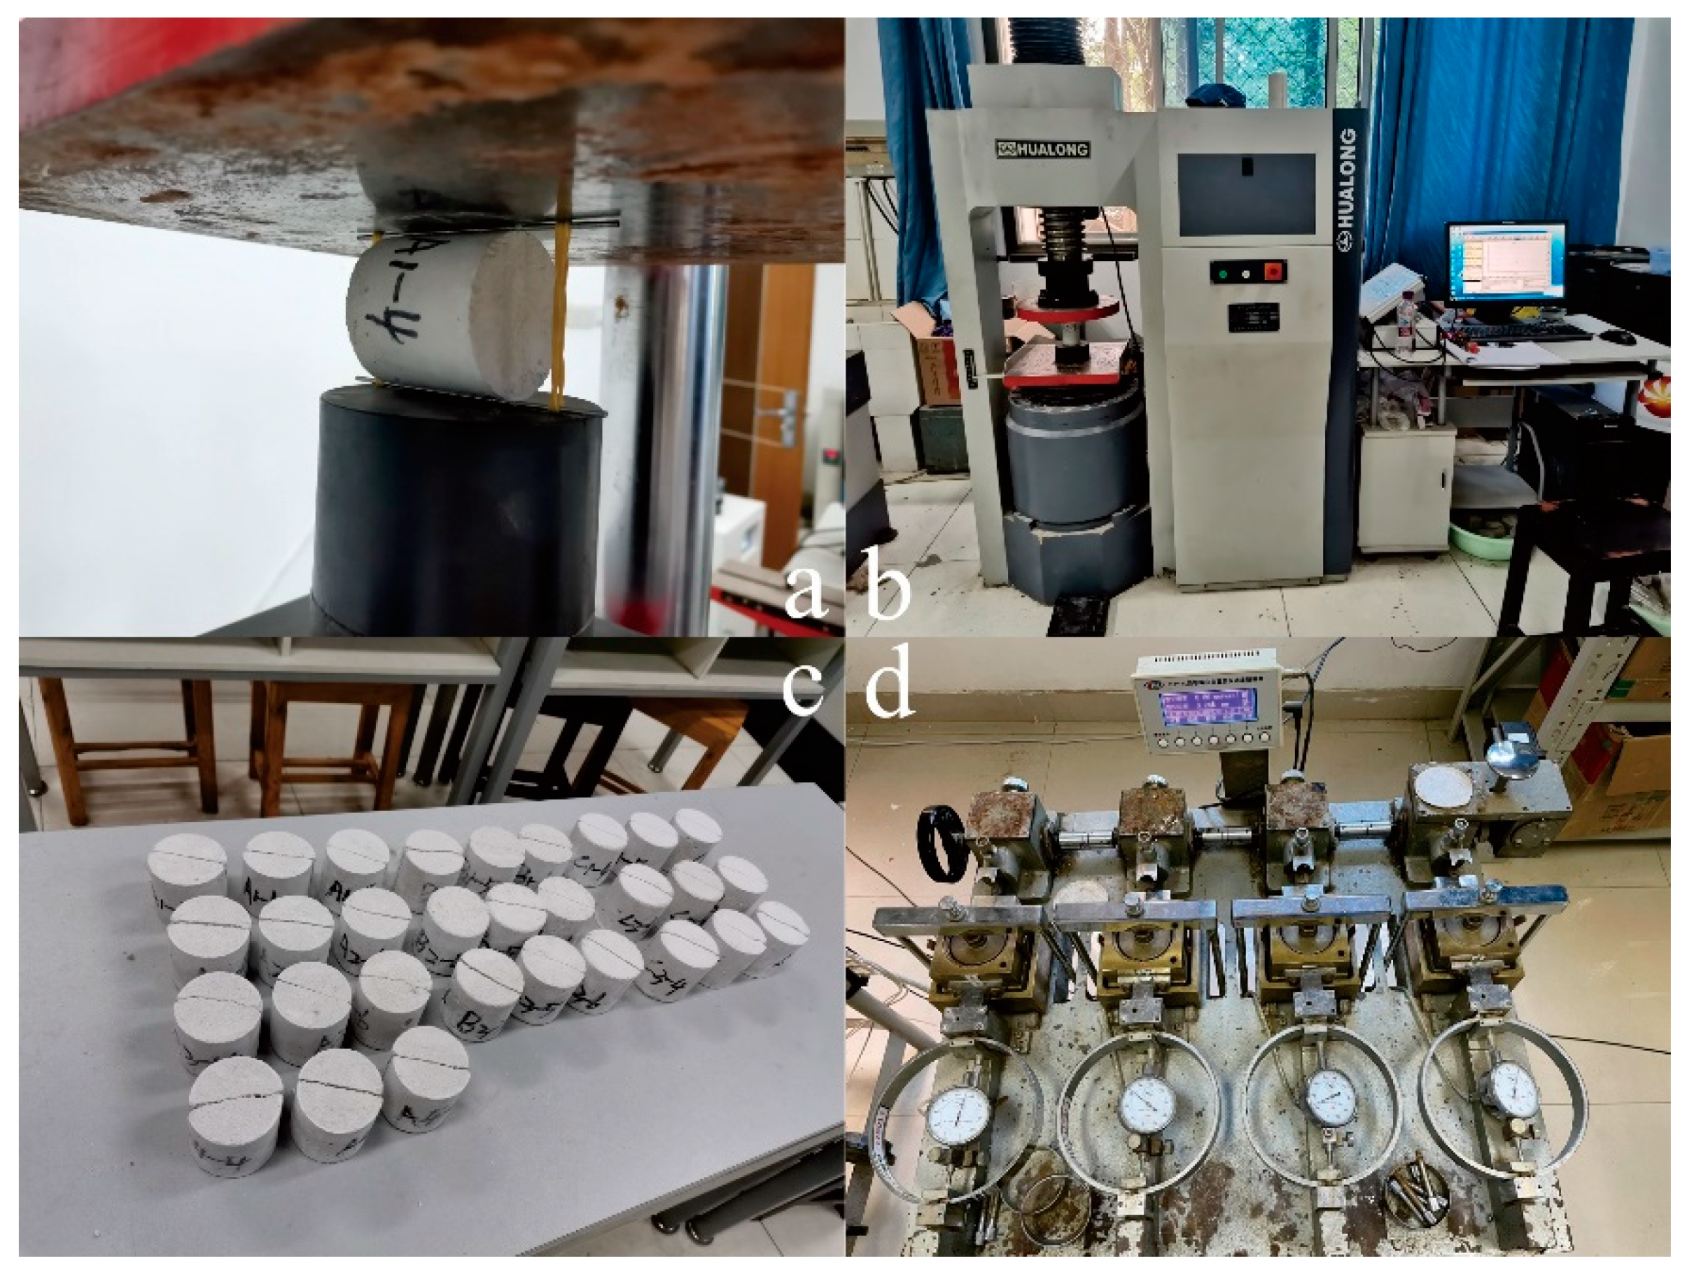
3.1. Test Equipment

The principle of the geotechnical centrifuge test is to use centrifugal force to simulate gravity, and then the centrifugal force can compensate for the model’s self-weight stress loss caused by the 1/n reduced scale model under the conditions of n-fold centrifugal acceleration. The slope model can reproduce the natural stress field of a real slope and display similar deformation and failure characteristics. The test equipment in this study is the TLJ-500 geotechnical centrifuge at the State Key Laboratory for Geohazard Prevention and Geoenvironment Protection of the Chengdu University of Technology, which has a maximum capacity of 500 g∙t, a maximum centrifugal acceleration of 250× g, and an effective rotation radius of 4.5 m. The model box size is 1.0 m × 0.6 m × 1.0 m (Figure 4f). The test equipment is composed of five parts: the host computer, data acquisition and transmission system, delivery system, photography system and data processing system (Figure 4a,b).

3.2. Model Materials

According to the size of the model box and the scale of the prototype slope, the geometric similarity ratio of the model was determined to be 1:120. Besides, taking into account indexes such as the limit weight of the centrifuge machine, the maximum acceleration of the test was determined to be 120× g. On the basis of the artificial mass similarity law, which is widely used in shaking table tests, similar constants were determined. The handling of the similarity relationship between the test slope models and real slopes is a key technical difficulty, because each physical quantity of the model material is independent. The model material only satisfies a certain similarity criterion, but it cannot satisfy the other similarity criteria after selecting a model material; therefore, the test model can only meet the main similarity criterion. Because the test model is involved the toppling deformation and shear failure of rock slopes, the basic control parameters such as the density, elastic modulus, compressive strength, tensile strength, cohesion and internal friction angle of the test models are required to be nearly 1:1 to those of the prototype slope. The other parameters are not strictly required in this test.
The model was constructed with test blocks made of similar materials (Figure 4c,d), and the prototype rock mass of the test blocks was the P1j metasandstone. Similar test block materials were made proportionally with a mixture of cement, quartz sand, gypsum, and borax solution, and similar interlayer bonding materials were made proportionally with a mixture of quartz sand, gypsum, and borax solution. The author designed mixture proportion tests, Splitting tensile strength test, Uniaxial compression test, and Direct shear test to determine the ratios of the similar materials and obtained material ratios in line with those of the prototype rock mass (Figure 5a–d). The basic physical and mechanical parameters of the prototype rock and those of similar materials are listed in Table 1.

3.3. Test Model Design

Due to the complex geological conditions of the prototype slope, the prototypes slopes were appropriately generalized in this test. The sizes of all three generalized test models were 77 cm (length) × 50 cm (width) × 56 cm (height), and the anti-dip angles were 70°. Under the identical conditions of the slope height, stratum thickness and boundary conditions, three models with slope angles of 55°, 65° and 75° were constructed.
In order to effectively control the dip angle of the lap model of the test blocks, the supporting component at the end of the model box should be designed and manufactured before the model is built. Considering the similarity of the prototype slope and slope models in the thickness of the rock stratum, the slope models were constructed with two types of prefabricated test blocks (Figure 4f). Block I was 60 cm (length) × 10 cm (width) × 1 cm (height), and block II was 60 cm (length) × 5 cm (width) × 1 cm (height). The abovementioned two types of test blocks were piled up in a staggered way in the width direction to eliminate the influence of the test block boundary and improve the connectivity between test blocks. Meanwhile, the interlayer bonding force was simulated by placing similar materials between test blocks.
The monitoring system for this test consists of LVDTs (LVDT is known as a linear variable differential transformer to obtain the displacement), rock strain gauges and particle-image velocimetry (PIV). There were three LVDTs installed on the crest of the slope, where LVDT1 was installed at the trailing edge, LVDT2 was arranged at the middle, and LVDT3 was installed at the front edge. LVDT was used to monitor the vertical displacement of the slope model over time in this test (LVDT2 was not installed at the middle of the model with a slope angle 75° because of sensor failure). There were six rock strain gauges installed inside the rock strata opposite to the slope surface to monitor the deformation of the rock strata inside the slope. The PIV camera was fixed on the centrifuge basket and was directly facing the model box to record the deformation and failure process of the slope model (Figure 4a).

3.4. Scheme of Test Loading

The test used a step-loaded scheme during centrifugal acceleration loading from 0× g to 120× g. We first steadily loaded the slope models to 40× g, held at this value for 5 min, and then gradually increased the centrifugal acceleration to 120× g at a step size of 40× g with a 5 min hold after each additional 40× g of centrifugal acceleration. When the centrifugal acceleration increased to the designed maximum of 120× g, we held at this value for 10 min and then lowered the centrifugal acceleration to 0× g, and the test was complete.

4. Test Phenomena Analysis

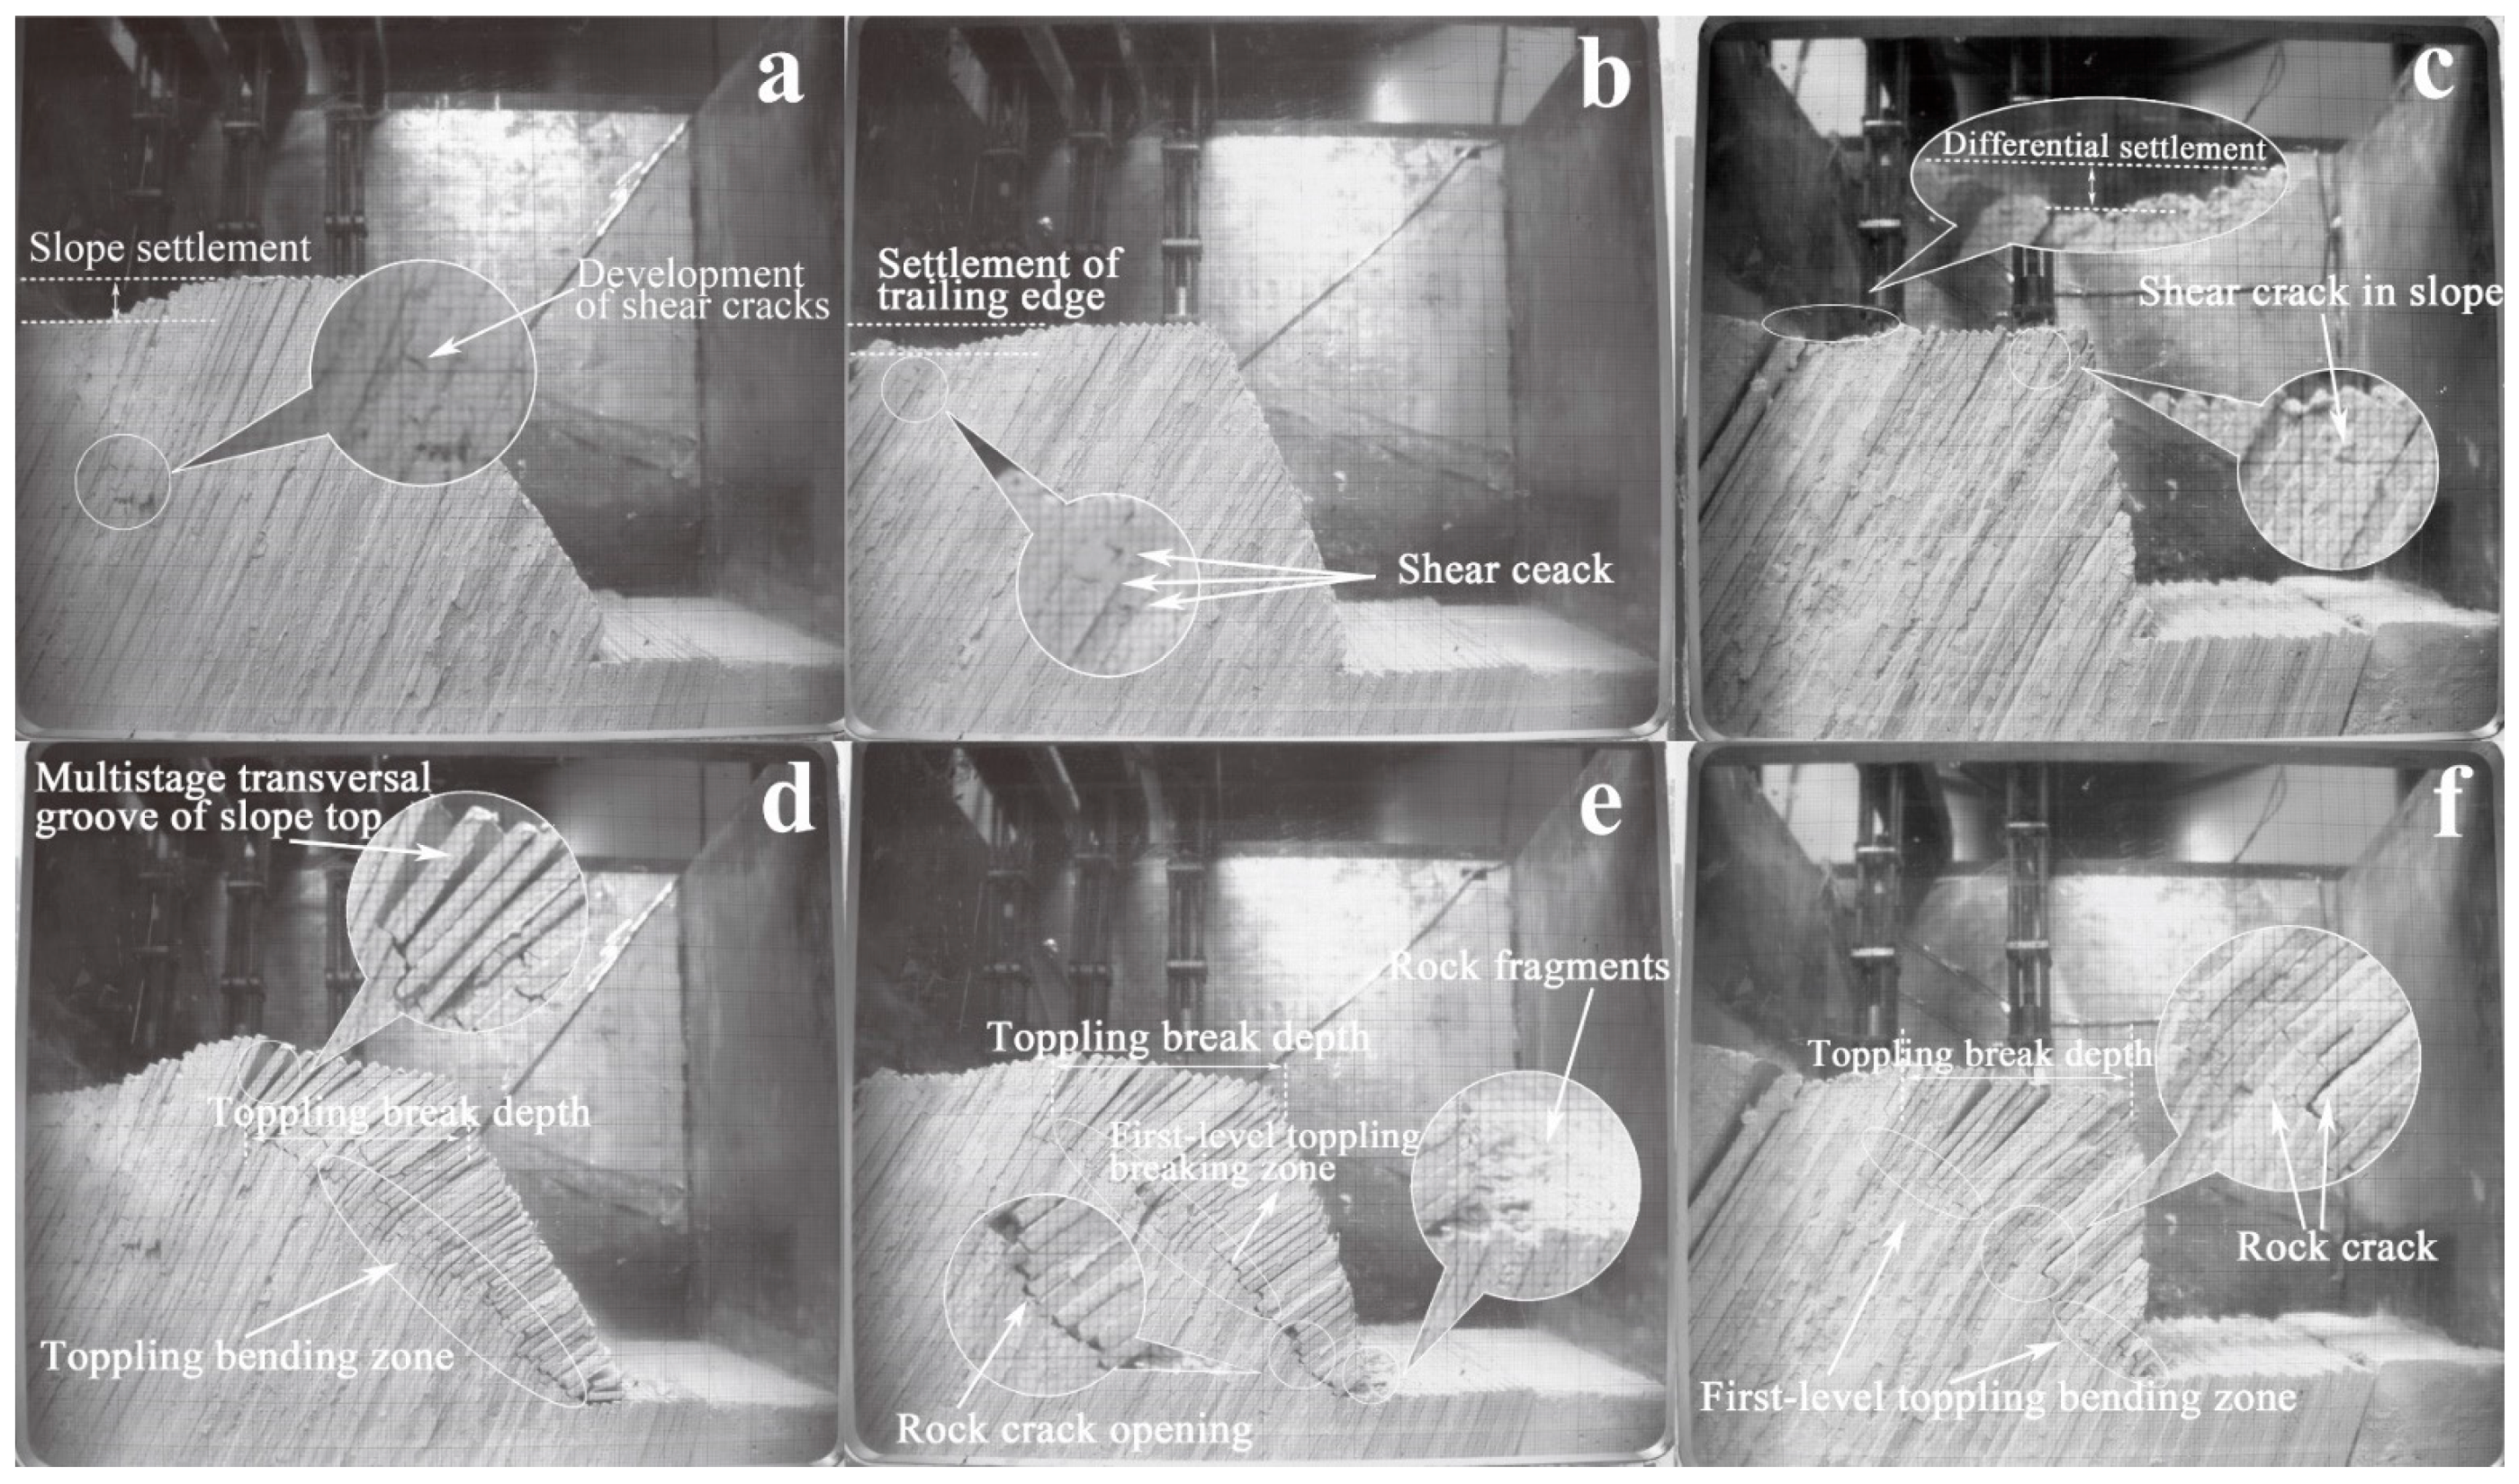
4.1. Description of the Test Phenomena

The centrifugal tests for these three slope models with different angles indicated that all three slope models demonstrated the phenomenon of toppling deformation under the self-weight stress (centrifugal force) field. The deformation characteristics and evolution processes exhibited the same toppling deformation and failure but different deformation degrees and development evolutions due to the different slope angles. The specific test phenomena are described as follows:
With increasing centrifugal acceleration, toppling deformation of the rock strata near the slope surface began to appear and increased slowly towards the free face under gravity at the initial stage of the test. The slope models indicated a tendency towards overall toppling, which provided space for deformation at the rear of the slope models. As a result, major settlement deformation occurred at the trailing edge of the slope and formed certain settlement grooves. Additionally, a small number of shear fractures were observed inside the slope due to the interlayer shear dislocation. No signs of tensile cracking appeared in the slope models, and the dip angle of the rock strata did not change obviously in this stage. Among the three model slopes, the model with a slope angle of 75° had the fastest response to toppling deformation and the largest settlement (Figure 6c), followed by those of 65° and 55° (Figure 6a,b). The author concluded that the larger the slope angle is, the more readily toppling deformation occurs in the slope models and the more conspicuous the response of the settlement at the trailing edge of the slopes is under identical geological conditions.
With the gradual increase in centrifugal acceleration, besides the shear effect, the tensile effect between the rock strata gradually increased, causing tensile cracks in the rock mass to appear at the crest of the slope near the free face. The rock strata generated stress concentrations under the self-weight stress and intensified the compression of the overlying rock strata, and toppling bending rupture occurred first at the slope foot. The toppling deformation of the overlying rock strata, without support at the slope foot, intensified and began to form a “toppling bending” scenario under gravity. During this process, we found that the model with a slope angle of 55° exhibited a certain breaking and rupturing of rock strata only at the slope foot and the other parts were still inconspicuous. That of 65° already presented slight toppling bending of the near-slope rock strata, whereas the toppling bending deformation of the rock strata of the model with a slope angle of 75° was remarkable. As the toppling deformation of the slope models further developed, the toppling bending degree of the rock strata increased gradually, and the interlayer tension became more conspicuous. Intermittent tensile cracks generated inside the rock mass and the toppling bending intensified towards the free face until the rock strata broke. During this process, the rock strata toppled and broke first at the slope foot, the interlayer tensile cracks developed rapidly at the maximum deflection position inside the slope, and the rupture surface of the rock strata at the slope foot extended gradually from the slope foot to the top in the form of a ladder (Figure 6d,f). This “beam-slab” step breakage can be seen from the section and reflects the development process of the rupture surface from the bottom to the top. Eventually, due to the accumulation of space caused by the breakage of the lower rock strata, the crest of the slope model generated a certain significant tensile crack after the rock strata had broken. The toppling broken zone was not completely penetrated at this stage, and the slope model was not destroyed. The sequence of “toppling-breaking” of the three model slopes was as follows: the model with a slope angle of 75° was the first, followed by that of 65°, and that of 55° showed “toppling-breaking” only when gravity affected the model for a long time.
With the extension of the toppling-bending zone of the rock strata, the interlayer tension effect and the cross-layer shear effect were more intense. The tensile cracks at the crest of the slope deepened, widened, and increased in number, and the cross-layer shear dilatation rupture and shear displacement inside the slope were intensified simultaneously. Finally, the rupture surface extended upward by step, and the tensile cracks at the crest of the slope penetrated through and formed a continuous toppling-bending zone. At this time, the centrifugal acceleration of the centrifuge machine reached a maximum of 120× g, and then the centrifuge slowed and stopped loading according to the test scheme. Due to the limitation at the bottom boundary of the test models, the slope models did not develop overall instability. During this process, the failure patterns and the development characteristics of the toppling-bending zones of the model with a slope angle of 55° and that of 65° changed minimally compared to the upper stage. However, that of 75° generated an obvious secondary toppling-bending zone in this stage, which was not observed in the other two slope models (Figure 7a–c).

4.2. Analysis of the Test Phenomena

The three test models exhibited almost the same deformation evolution process: the toppling failure of the anti-dip rock slope first occurred at the slope foot, and the rupture surface gradually extended from the bottom to top in a stepped form until it fully penetrated the slope. The steeper the slope angle was, the shorter the cumulative time to this deformation failure. According to the characteristics of the toppling deformation in the three slope models shown in the tests, the process of toppling deformation could be divided into four stages: (a) the rock stratum of the slope toppled and the trailing edge of that settled; (b) the rock strata at the slope foot toppled and ruptured, and the rock strata occurred “toppling-bending” deformation; (c) the toppling-bending zone extended from the foot of the slope to the top, and the tension deformation was generated at the crest of the slope; (d) the toppling-bending zone extended until it penetrated the slope, and the rock strata generated “toppling-breaking” failure. Although the evolution processes of the toppling deformation of these slope models were generally parallel, there were still some differences in the degree and characteristics of the toppling deformation because of the different slope angles. Then, a comparative analysis was conducted from the following aspects.

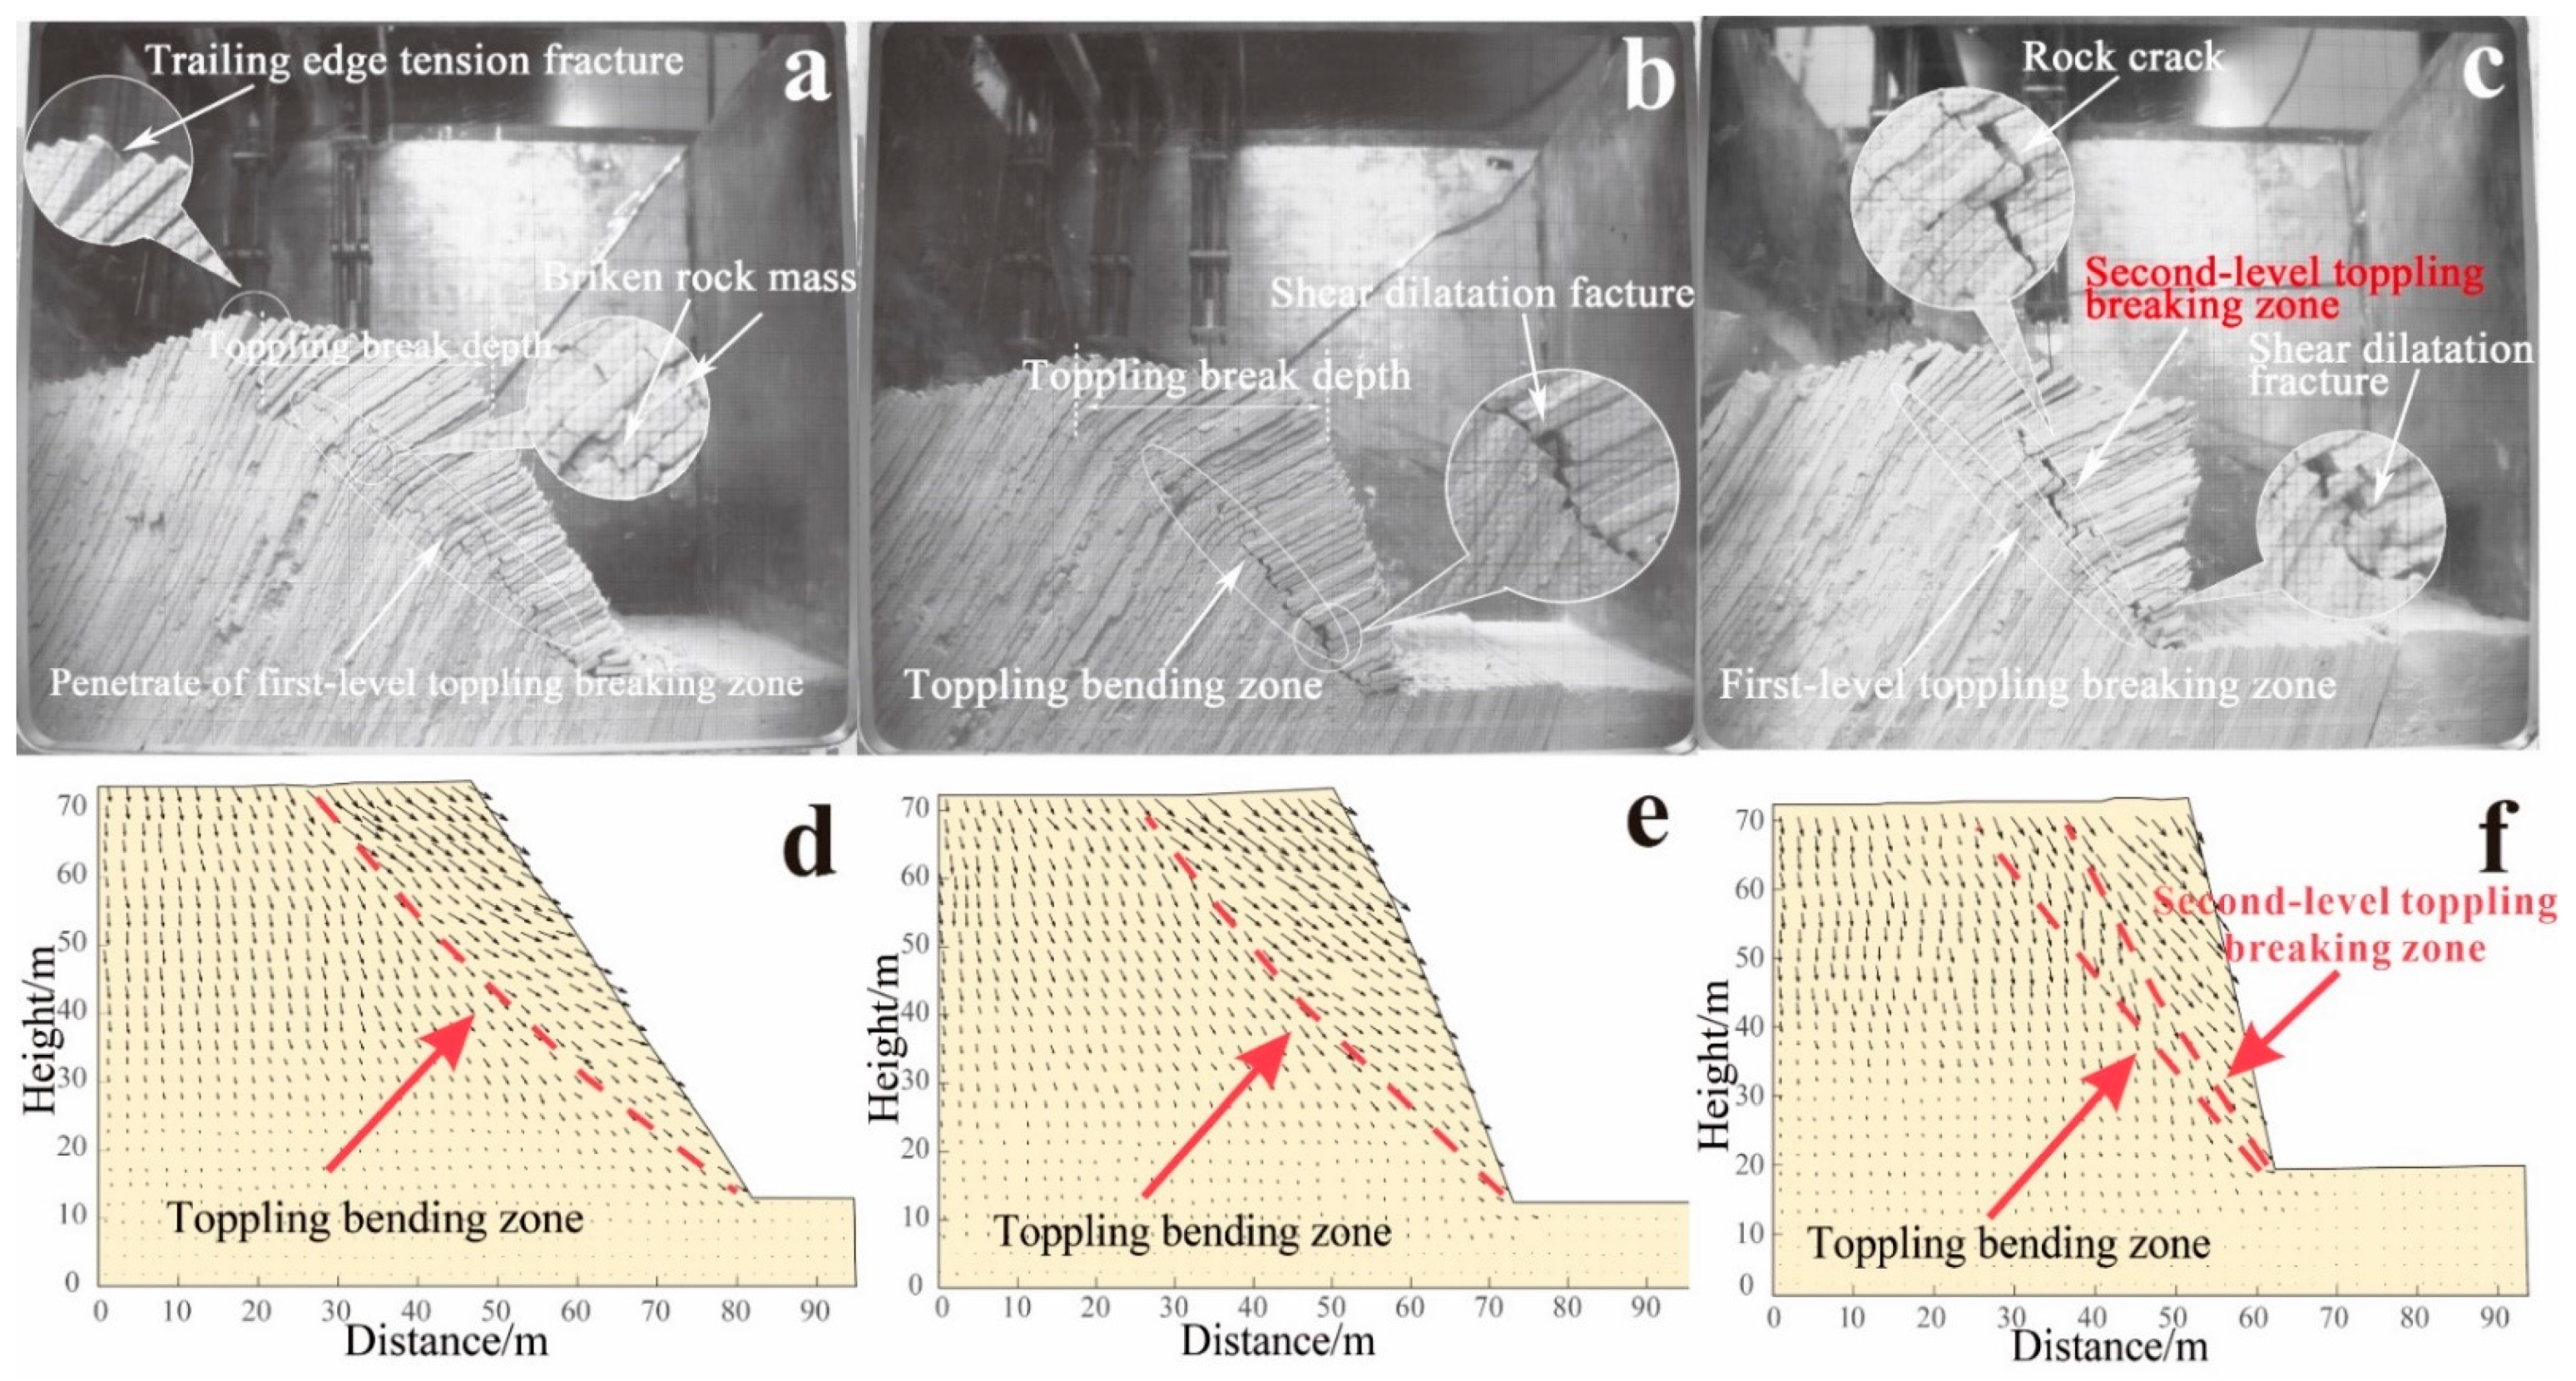
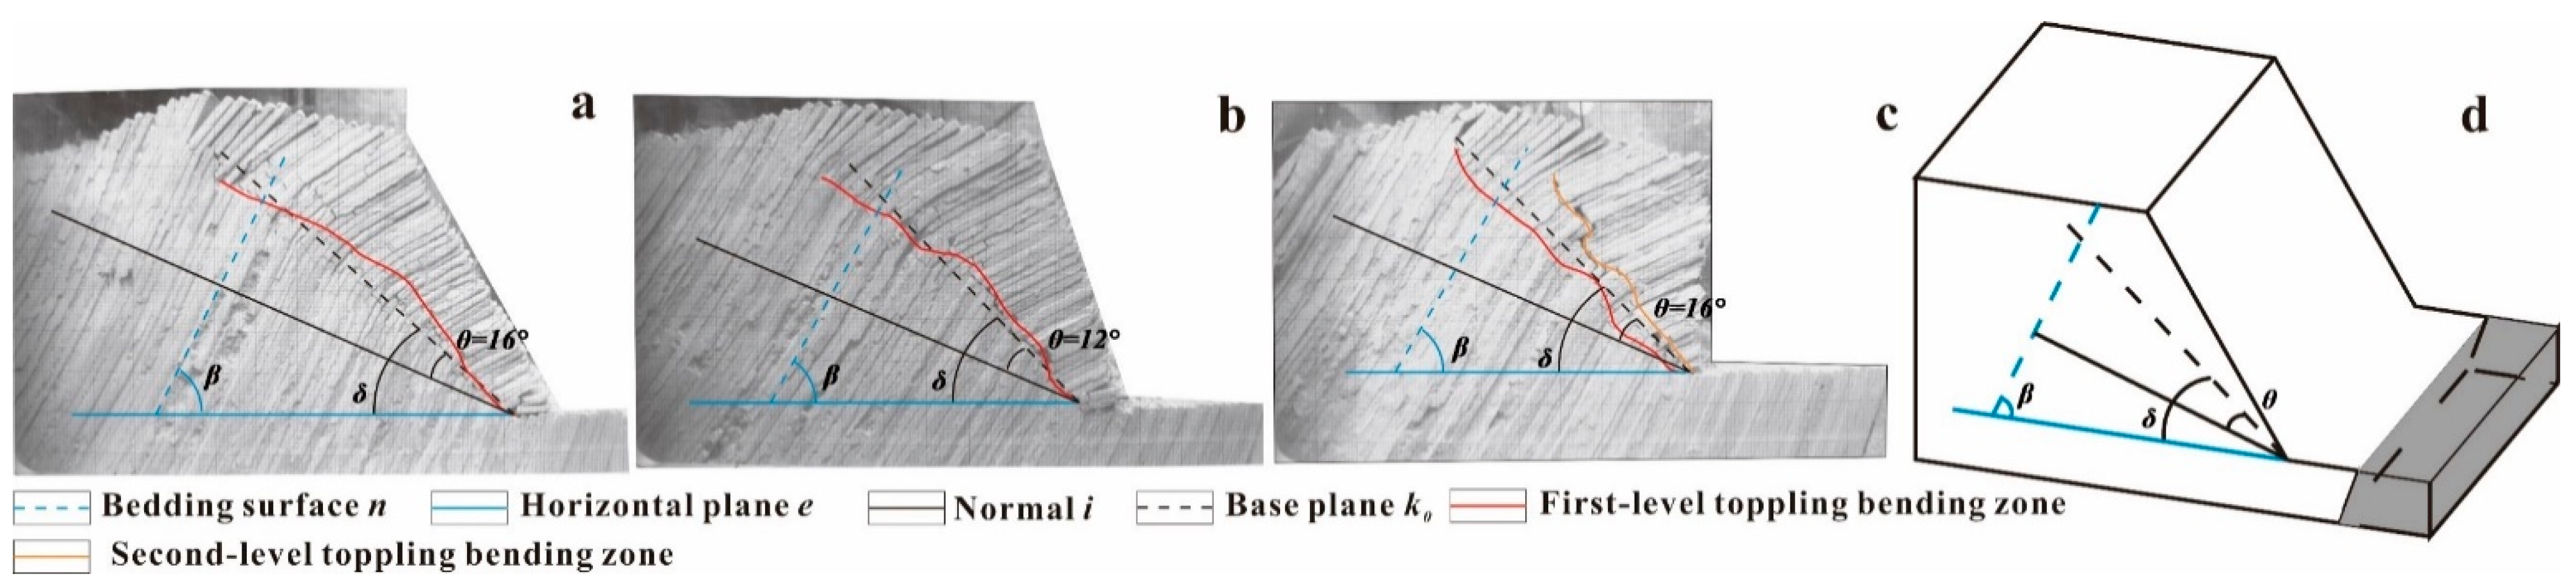
4.2.1. The Depth and Range of the Development of the Toppling-Bending Zone

The horizontal distance from the toppling-bending zone to the slope surface increased gradually from the foot of the slope to the top, and the maximum value of this distance was selected as the toppling-break depth H (Figure 6). The measurement results after the test showed that the toppling-break depth of the model with a slope angle of 55° was 189.6 mm, that of 65° was 214.8 mm and that of 75° was 234.4 mm. The author can conclude that under identical conditions for slope height, dip angle of the rock stratum and thickness of the rock stratum, the larger the slope angle is, the deeper the development depth of the toppling-bending zone and the larger the deformation range; that is, the development depth of the toppling-bending zone is positively related to the slope angle.

4.2.2. The Development of the Multi-Level Toppling-Bending Zone

The model with a slope angle of 75°, different from the other two slope models, generated a new secondary toppling-bending zone with increasing centrifugal acceleration after the first toppling-bending zone formed. The secondary toppling-bending zone was located inside the toppled rock mass, the above rock strata toppled more strongly, and the dip angle of the rock strata was further reduced. The interlayer tensile effect intensified, and the number and width of the tensile cracks increased. In addition, the rock mass near the free face of the slope broke and collapsed towards the slope foot. The multi-level rupture surface appearing in this experiment was consistent with the phenomenon of multiple rupture zones of rock strata exposed in the adit exploration of the Gushui Hydropower Station. This indicated that the steeper the free-face is, the higher probability that the occurrence of multi-level toppling during the evolution process of the toppling slope will occur.
Furthermore, the centrifugal acceleration value at the beginning of the slope foot rupture was taken as the critical acceleration value of the toppling failure and as a criterion for judging the difficulty degree of the toppling failure. Under the same dip angle of the rock stratum, the influence of the slope angle on the development of toppling-bending zones was relatively sensitive. The larger the slope angle is, the smaller the critical acceleration needed for toppling and breaking and the more readily toppling failure occurs in the slope. The morphology of the toppling-bending zone can explain this phenomenon: the larger the slope angle is, the thicker the rock strata above the toppling-bending zone, and the larger the pressure of the slope foot from the overlying rock strata. Then, the rock strata of the slope foot more easily meets the ultimate strength, breaks and fails as the centrifugal acceleration increase.

5. Test Data Analysis

5.1. Analysis of Displacement Vector

The test photos before and after the slope models were processed by using image measurement technology, and cumulative displacement vector diagrams of the three slope models were obtained, as shown in Figure 7e,f. The boundary, as the development position of the toppling-bending zone, between the toppling zone and the un-toppling zone of the slope can be identified clearly from the variable in the displacement direction in the vector diagram. The part below the toppling-bending zone could be regarded as an un-toppling zone, the direction of the displacement vector of the rock mass in this zone was generally downward, and the rock mass was dominated by settlement deformation under gravity. The phenomenon of toppling deformation was not obvious; the part above the toppling-bending zone was the toppling zone of the slope, and the relative displacement was larger. The resultant vector was deflected downward in the oblique direction and nearly parallel to the toppling-bending zone due to the displacement in the direction of the free face outside the slope under gravity.
The differences between the displacement vector diagrams of the three slope models were as follows: as the slope angle became steeper, the location of the toppling-bending zone inside the slope became deeper, and the zone of toppling continued to expand. The direction of the resultant vector of the toppling zone changed from moderate to steep. During the toppling deformation process, the models with slope angles of 55° and 65° were dominated by horizontal tension, and the toppling deformation body presented good integrity; therefore, the horizontal displacement was more significant than the vertical displacement. The resultant displacement vector was directed gently downward and presented a certain degree of integrity. In contrast, in the model with a slope angle of 75°, there were numerous interlayer shear failures in addition to horizontal tension during the deformation process. The toppling deformation was intense enough that part of the rock mass broke away from the parent rock and collapsed downwards, causing the displacement vector near the free face to be slightly messy. The vertical displacement of the toppling zone was generally larger than the horizontal displacement, and the resultant vector appeared to be directed steeply downward.

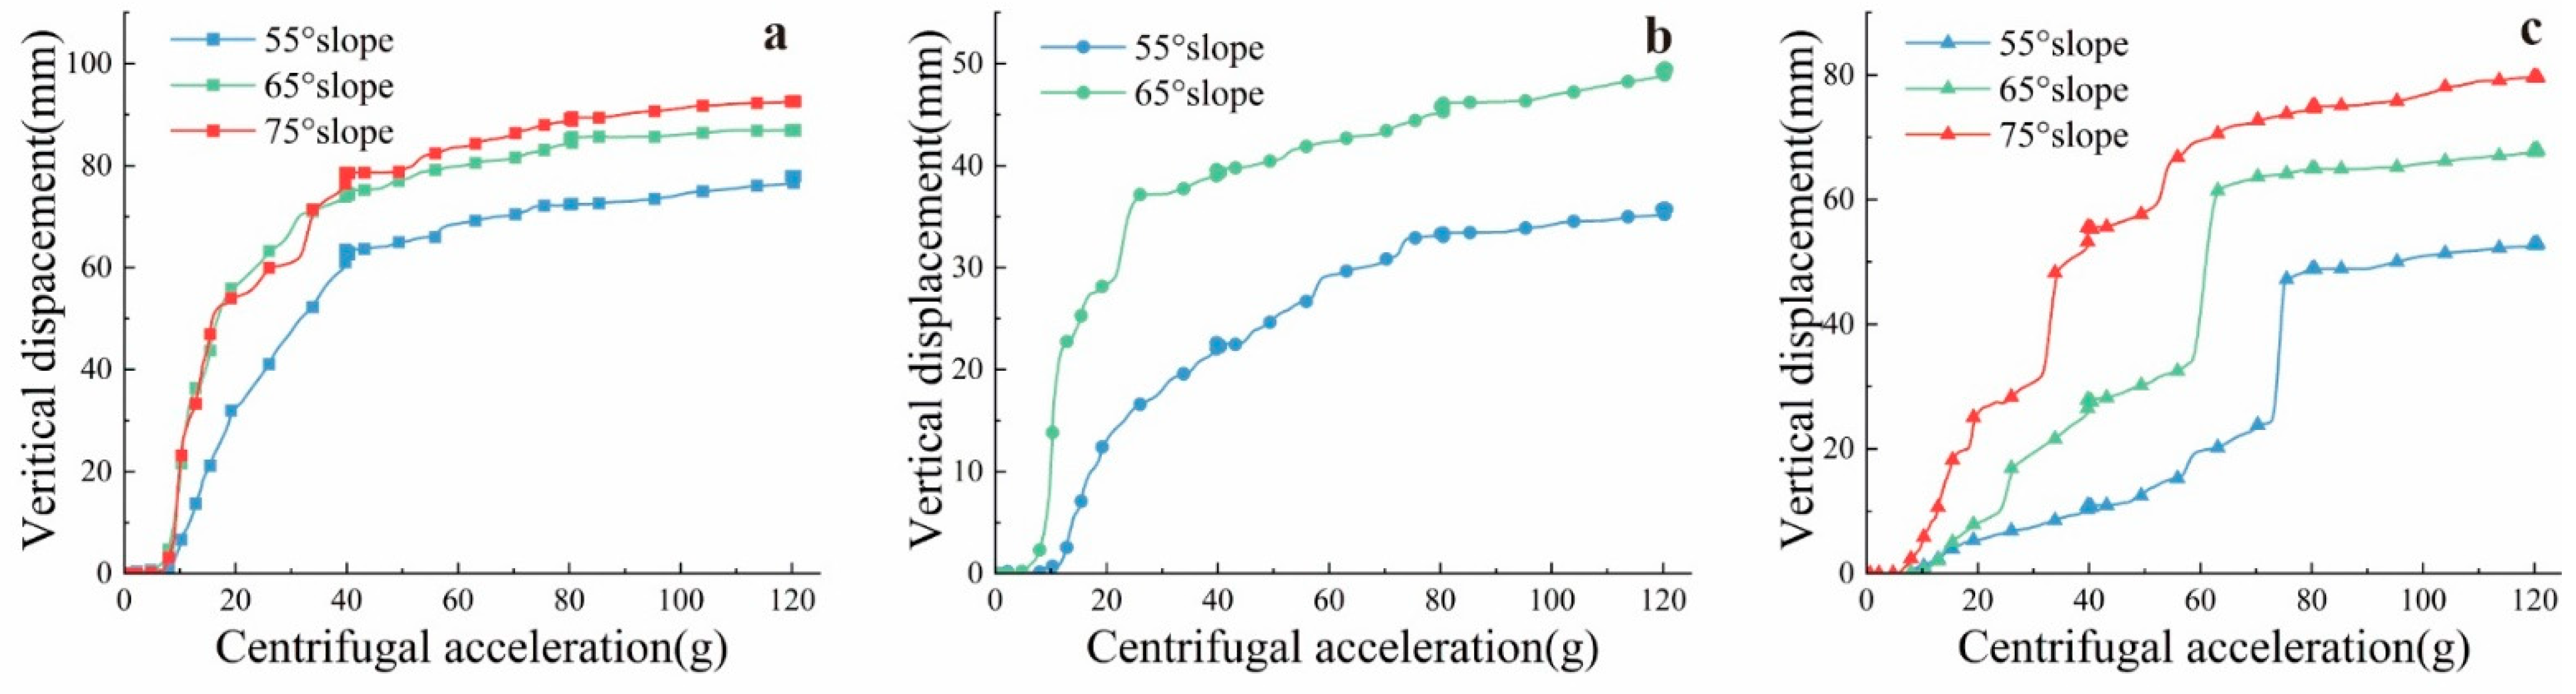
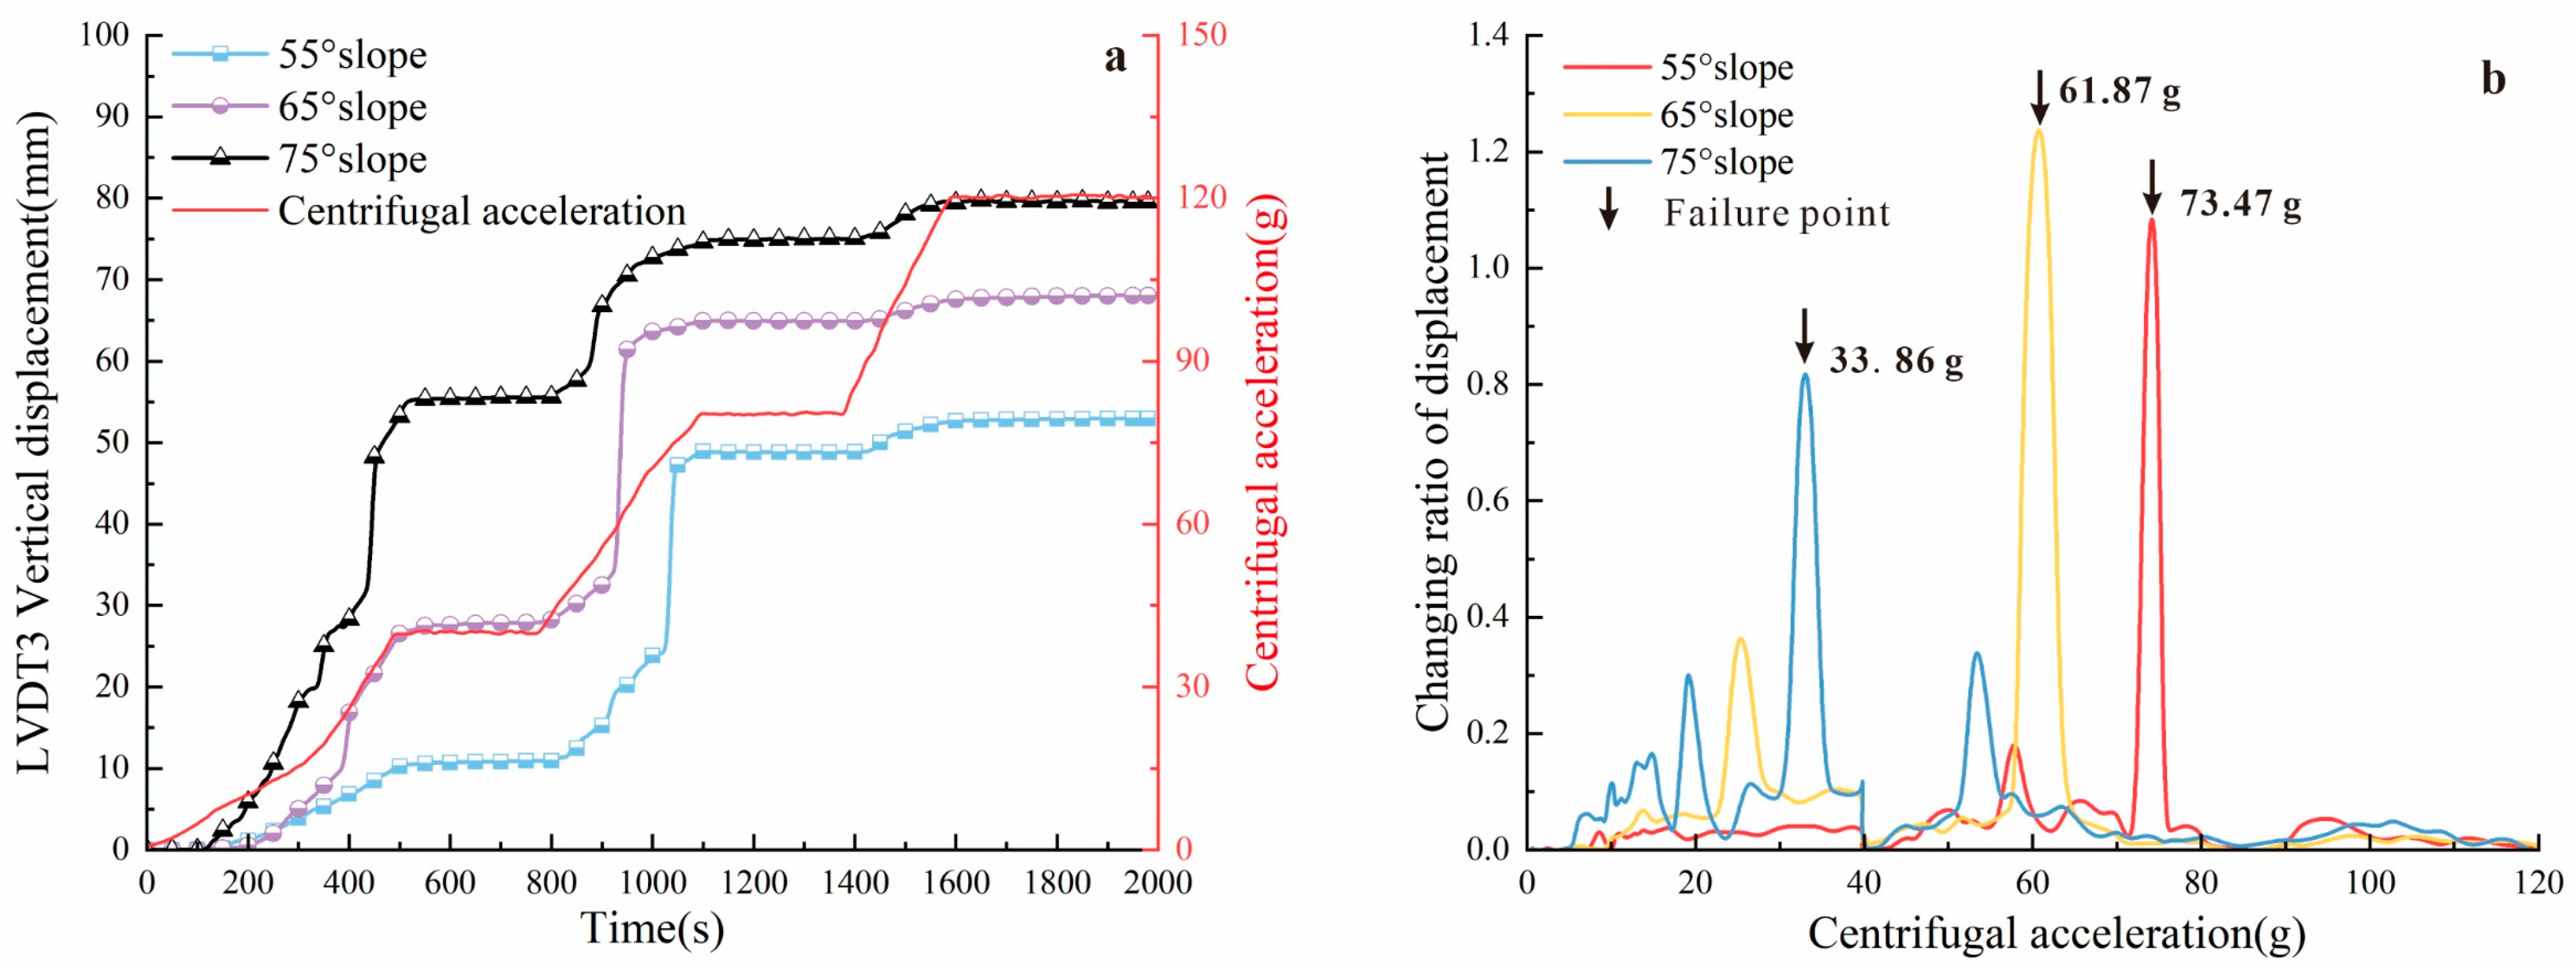
5.2. Analysis of Displacement Data

The differential displacement sensors were installed at the front edge (LVDT3), at the middle (LVDT2), and at the trailing edge (LVDT1) of the test models to monitor the vertical displacements in different zones. The vertical displacement-centrifugal acceleration curves for the monitoring points of the three slope models are shown in Figure 8. The displacement evolution characteristics of these slope models could be analysed in combination with the test phenomena.
With the start of the test, the vertical displacement curve of LVDT1, located at the trailing edge, showed linear rapid growth when the centrifugal acceleration increased to 40× g; however, the vertical displacement fluctuated slightly with time. This indicated that the settlement deformation of the slope models mainly occurred in the early stage of the test; the vertical displacement curve of LVDT2 grew relatively slowly. The vertical displacement slightly lagged behind the loading of the centrifugal force and the settlement deformation of the trailing edge, and the cumulative displacement value was only approximately half the value of LVDT1. This is mostly because the monitoring point was located in the transition area between the toppling zone and the un-toppling zone of the slope, which was less affected by the toppling and the settlement deformation. LVDT3 was located in the toppling zone. The vertical displacement curve of LVDT3 grew slowly at first, but the rock mass of the slope generated toppling-bending deformation, and the vertical displacement curve had a corresponding sudden mutation after a period of centrifugal loading. Then, the displacement tended to be stable with the convergence of the deformation.
In general, the displacement changes of each monitoring point were basically synchronized with the loading of the centrifugal acceleration and showed step-like growth. The cumulative displacement of each monitoring point is shown in Table 2. The vertical displacement of different parts of the same slope models presented the order trailing edge > front edge > middle, indicating that the settlement deformation of the trailing edge was more intense than that of the front edge. Additionally, the vertical displacement value of the same monitoring point shows an upward trend as the slope becomes steeper. This is because the toppling deformation of the slope gradually increases and provides increasing space for vertical deformation.
Further analysis of the LVDT3 located near the free face of the slope shows that the vertical displacement curve could intuitively reflect the difference in the toppling deformation with different slope angles. The growth of the vertical displacement slightly lagged behind the centrifugal loading, and this was more obvious when the slope angle was lower (Figure 9a). In the phase of 0~40× g centrifugal acceleration, the vertical displacement curve of the model with a slope angle of 75° increased rapidly. When the centrifugal acceleration increased to 20 g, the vertical displacement exhibited a 5 mm mutation. Combined with the test phenomena, we found that the rock mass at the slope foot broke and the rock strata toppled and bent. When the centrifugal acceleration increased to 33× g, the first-level toppling-bending zone inside the slope penetrated, and the vertical displacement underwent 16 mm mutation. The slope experienced toppling-bending deformation; that of 65° was gentle first and then steep. When the centrifugal acceleration increased to 25× g, the vertical displacement had a 6 mm mutation, indicating that the slope entered the stage of accelerated deformation; that of 55° had a low deformation rate in this stage, and the vertical displacement exhibited no mutations. In the phase of 40~80× g centrifugal acceleration, the vertical displacement curve for the model with a slope angle of 75° had a 7 mm mutation at a centrifugal acceleration of 50 g, which meant that the second-level toppling-bending zone inside the slope penetrated and the slope toppled again. With increasing centrifugal acceleration, the vertical displacement curve of the model with a slope angle of 65° experienced a 23 mm mutation, and the slope experienced toppling-bending deformation. When the centrifugal acceleration increased to 55× g, a toppling-bending zone developed from the slope foot of the model with a slope angle of 55° and penetrated at 75× g. The displacement curve exhibited a 22 mm mutation. In the phase of 80~120× g centrifugal acceleration, the deformation displacement of each slope model converged. The vertical displacement only increased slightly with increasing centrifugal acceleration. At the same time, it can be clearly seen from the acceleration-displacement rate of change graph that there is a peak in the displacement change rate curve of different slope toe. The first-level toppling-bending zone inside the slope penetrated. There is a smaller peak appearing in the slope of 75° after the maximum peak, which meant that the second-level toppling-bending zone inside the slope penetrated and the slope toppled again (Figure 9b).
In conclusion, the period of deformation or energy accumulation in the early stage of the slope is greatly shortened with increasing slope angle. The model with a slope angle of 75° had a significantly shorter period from the beginning of toppling deformation to the penetration of the toppling-bending zone to the failure of the slope. Those of 55° and 65° have larger displacement mutations in the period when the large toppling-bending deformation formed, which released more energy in a shorter time, and the overall deformation displacement of the slope is larger. Because the secondary toppling-bending zone is generated inside the model with a slope angle of 75°, the value of the slope deformation displacement is generated gradually; thus, the single displacement mutation is smaller than the other two slope models.
The above mentioned displacement characteristics of the slope models were closely related to the ultimate failure mode of the toppling deformation of the slope.

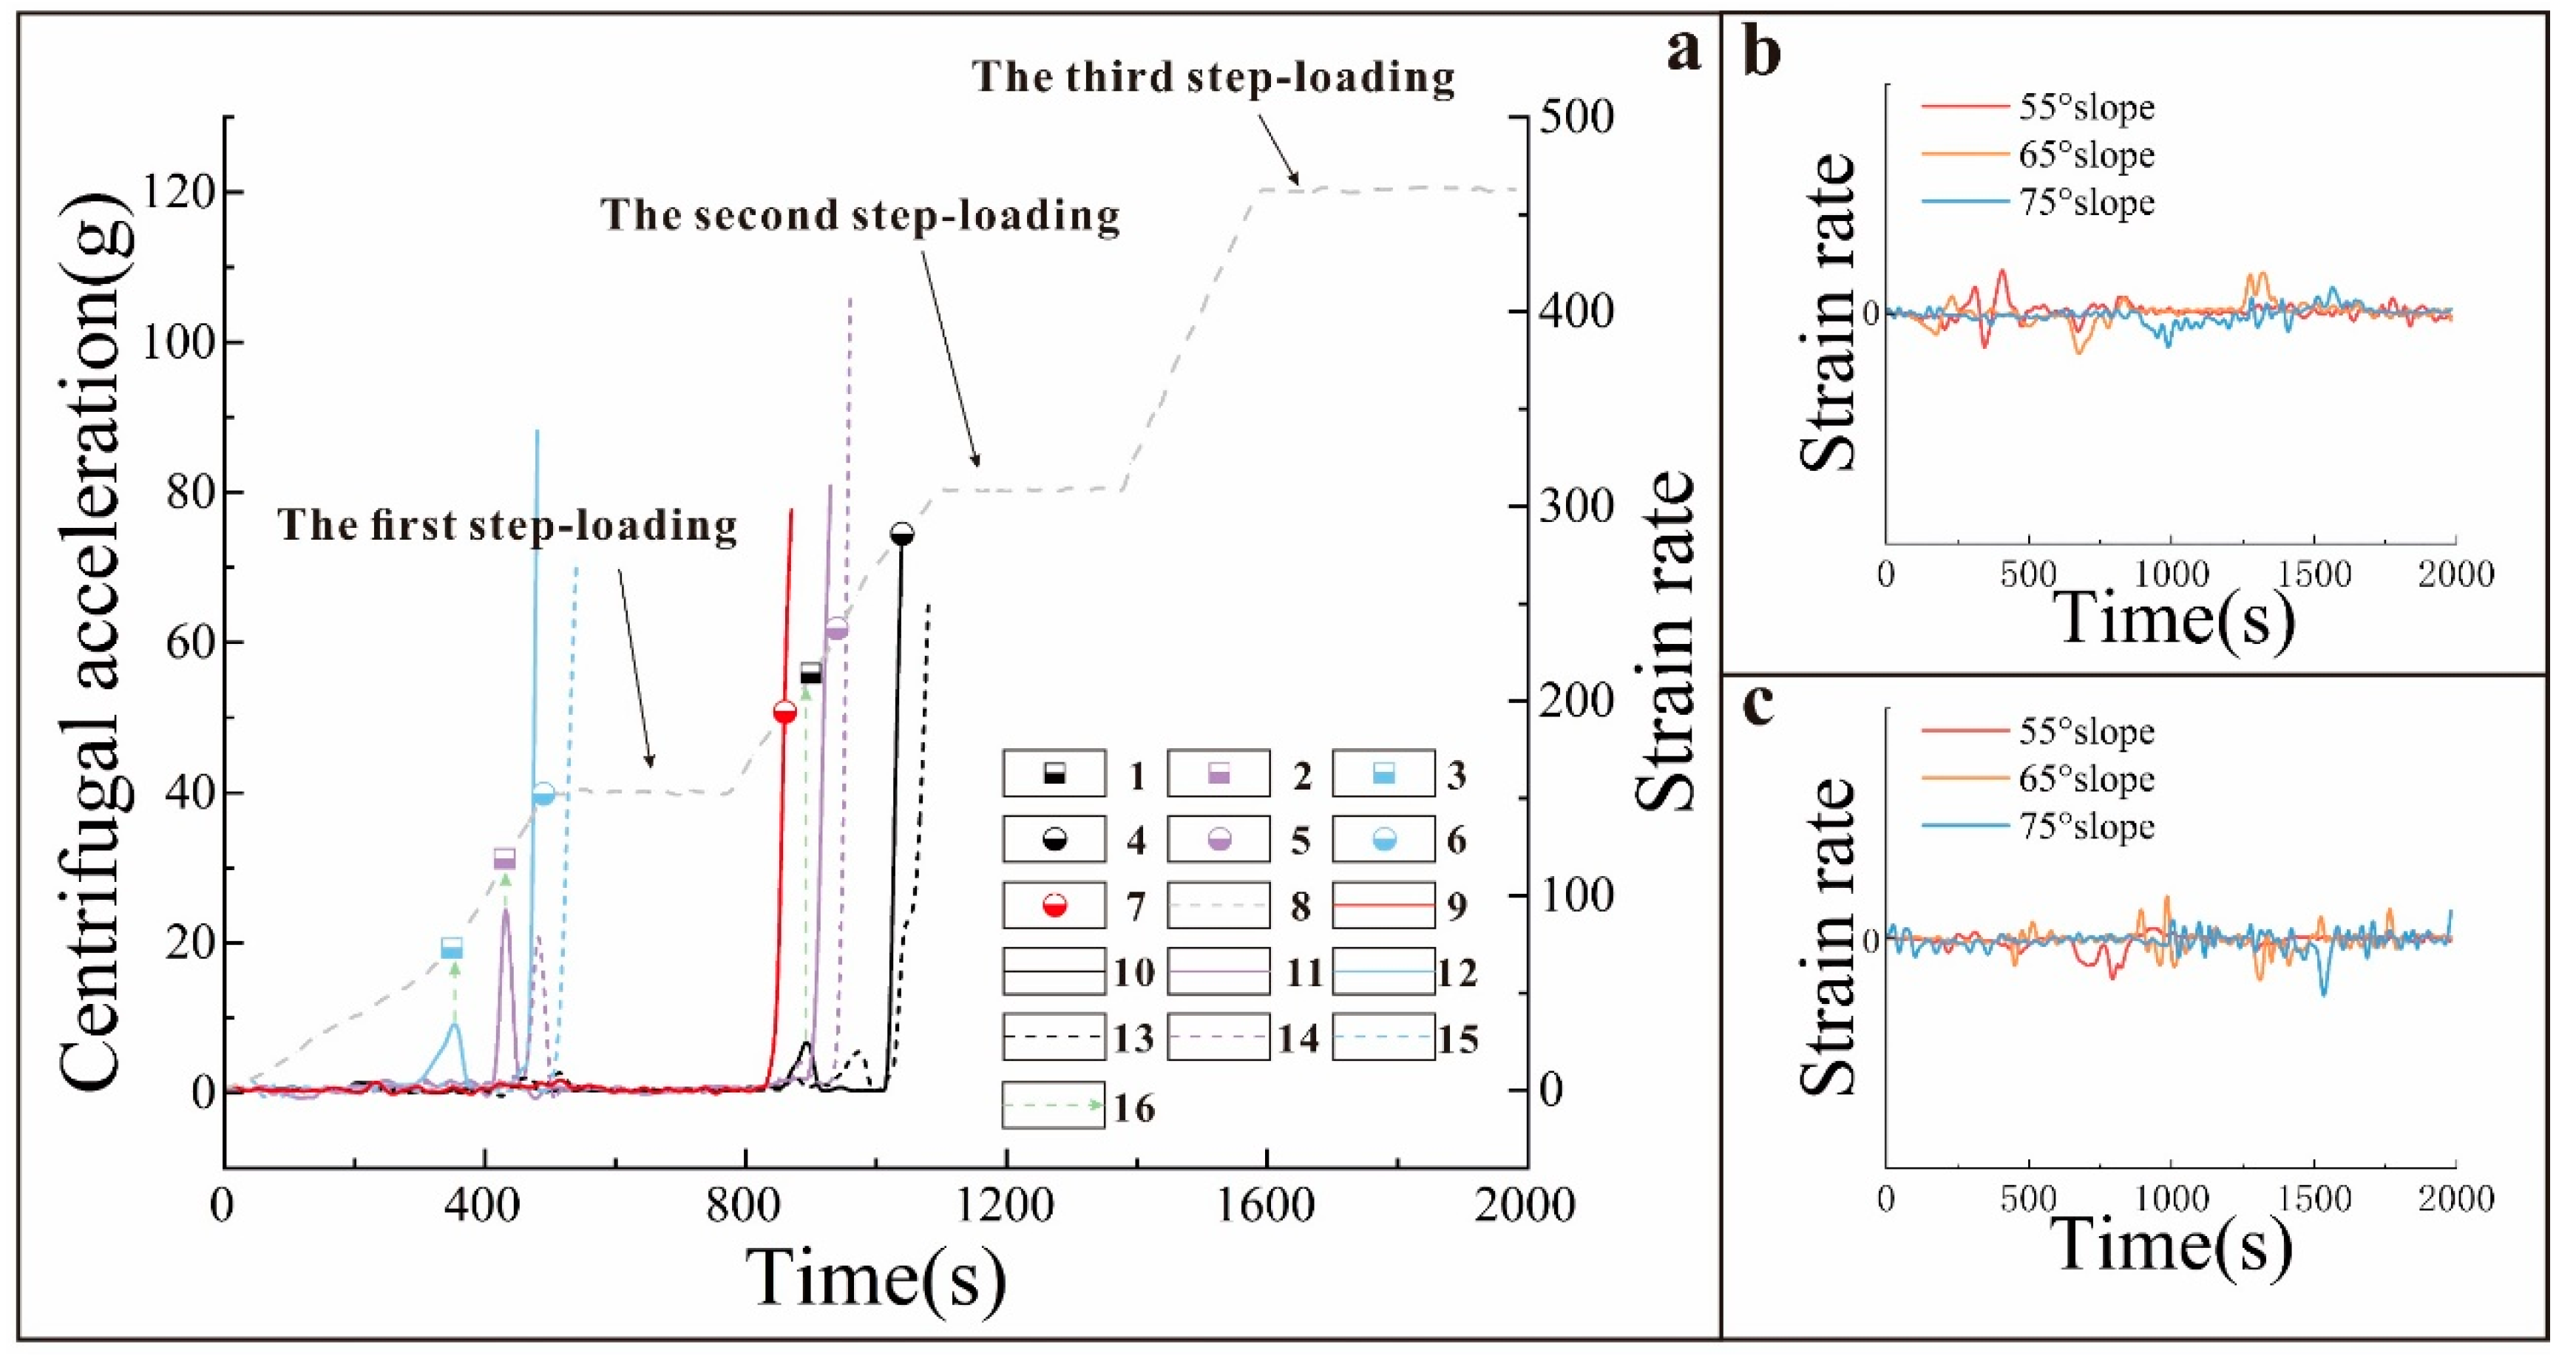
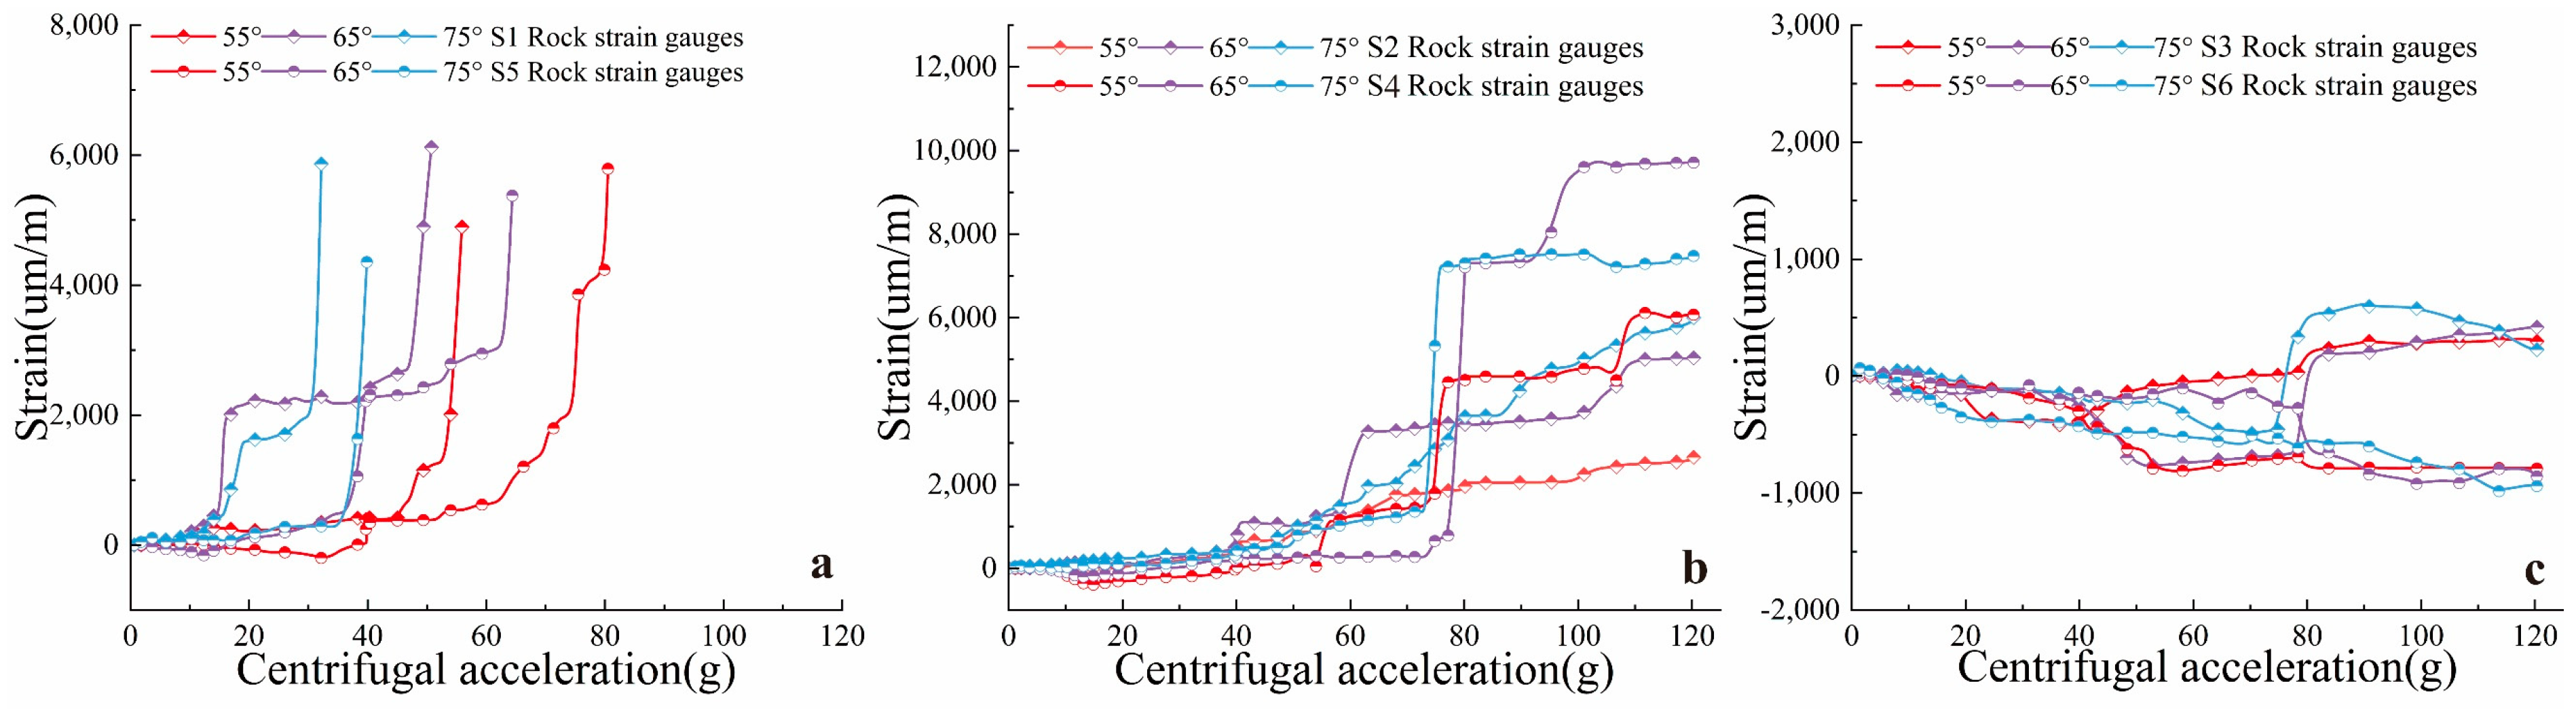
5.3. Analysis of the Strain Data

In this test, six rock strain gauges were arranged at the surface of the rock strata to monitor the deformation inside the slope; the specific layout is presented in Figure 3. After observing the slope failure characteristics and the location of the strain gauges in this test, it was found that the strain gauges s1, s2, and s5 were closer to the toppling-bending zones, the strain gauge s4 was the closest to the strong toppling deformation zone near the crest of the slope, and the strain gauges s3 and s6 were located in the un-toppling zone below the toppling-bending zone. The variation curves for strain rate with time are shown in Figure 10, and the analysis was as follows:
From the perspective of strain curve shape (Figure 11), the strain curves for s1 and s5, s3 and s6, and s2 and s4 had similar moving trends, related to the deformation positions they were located at. The strain gauges s1 and s5 were the closest to the toppling-bending zone, and the corresponding strain curves fluctuated the most dramatically. All the curves increased sharply (indicating rock mass failure) as the centrifugal acceleration increased to nearly 60 g, and the deformation response of the model with a slope angle of 75° was the fastest among the three slope models. The steep increase in the strain curves was the result of the instantaneous release of the strain energy when the rock mass toppled and broke. The rock strata, where the strain gauges s3 and s6 were located, almost had no toppling deformation; thus, the strain curves they corresponded to changed gently and did not indicate the trend of increasing with increasing centrifugal acceleration. The strain curves even presented a certain number of negative values because of the effect of self-weight and overburden pressure. The shapes of the strain curves for s2 and s4 were similar to the change curve for the centrifugal acceleration, which showed a step-like growth shape. This indicated that the strain rate at the same site of the other slope models showed a gradual trend with time and acceleration changes, except for s4 located near the crest of the model with a slope angle of 75°, which showed a steep increase in the strain due to intense deformation.
The steeper the slope angle was, the faster the deformation response to centrifugal acceleration. The toppling-bending rupture zone and the crest of the slope are the parts inside the slope with serious deformation. It was found that strain gauge s1 near the slope foot was always the first to present mutation, earlier than strain gauge s5 located on the upper part of the slope. Comparing the steep increase in the strain curves, strain curve s4 showed the last mutation. This indicated that the development of the toppling-bending zone happened at the slope foot and gradually extended to the crest of the slope.

6. Discussion

6.1. The Position of the Toppling-Bending Zone

Through the analysis of the above test phenomena and the test data, the development position of the toppling-bending zone of the slope is further discussed below.
The test results of the three slope models showed that the toppling-bending zone, caused by the toppling deformation of the slope, started at the slope foot and extended to the crest of the slope in the form of a ladder. From the profile view, the toppling-bending zone tended to be a straight line and could be represented by a straight line k0 crossing the slope foot, which was called the base line for toppling-breaking (Figure 12). The plane passing through the straight line k0 with the same direction as the slope surface was defined as the base plane. The upper part of this plane was the toppling zone of the slope, and the lower part of this plane was the un-toppling zone. The angle between k0 and the normal of the rock strata was expressed by θ, and we found that the θ values obtained by the three test models were almost the same: that of the model with a slope angle of 55° was 16°; that of 65° was 12°; that of 75° was 14°. In other words, the angle θ did not change with changing slope angle. This understanding was consistent with the conclusion that the angle between the base plane of the toppling deformation and the normal of the rock strata lies between 12 and 20° obtained by Goodman et al. [22,23] through mechanical analysis. The angle was designed θ to be between 12 and 16°. Assuming the dip angle of the rock strata is β, the angle δ between the base plane and the horizontal plane e can be calculated by the following formula (Figure 12).
δ = θ + 90 ° β
Conditions are required for the toppling deformation of the anti-dip rock slope; only the rock strata above the base plane of the toppling-breaking could be unstable and fail due to toppling. Therefore, the following could be inferred: Provided that the dip angle of the rock strata is β for the anti-dip layered rock slopes, we obtained the value of δ through Formula (1). If the slope angle α < δ, the whole slope was located below the base plane of the toppling-breaking; thus, it could be inferred that toppling deformation occurred with difficulty on this slope.

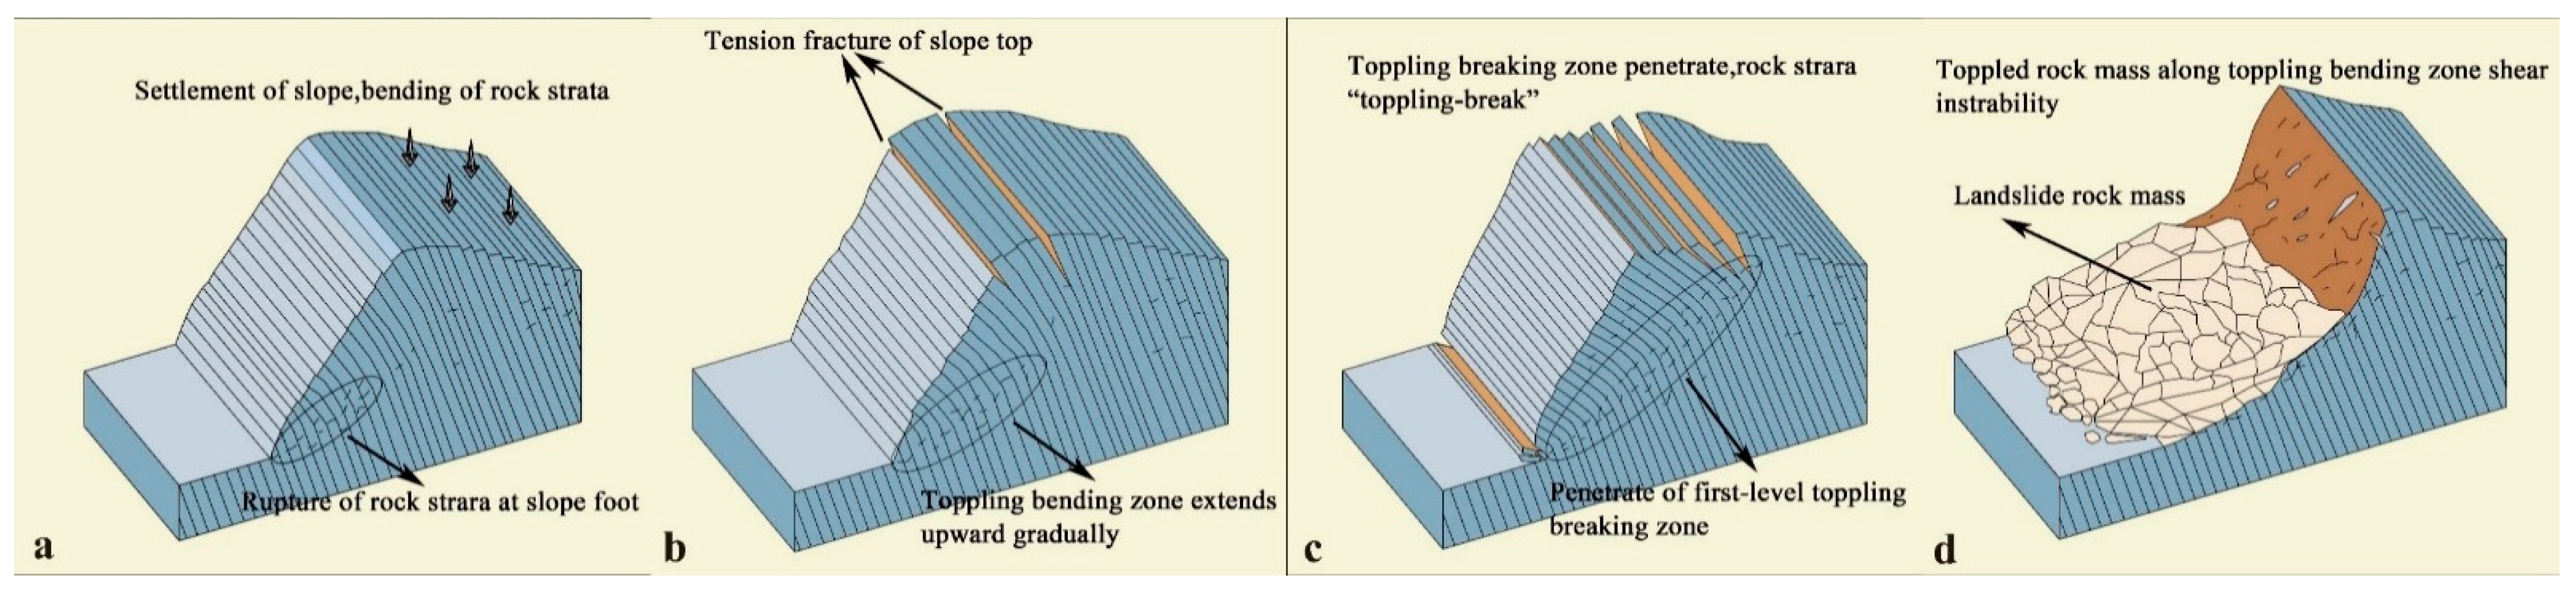
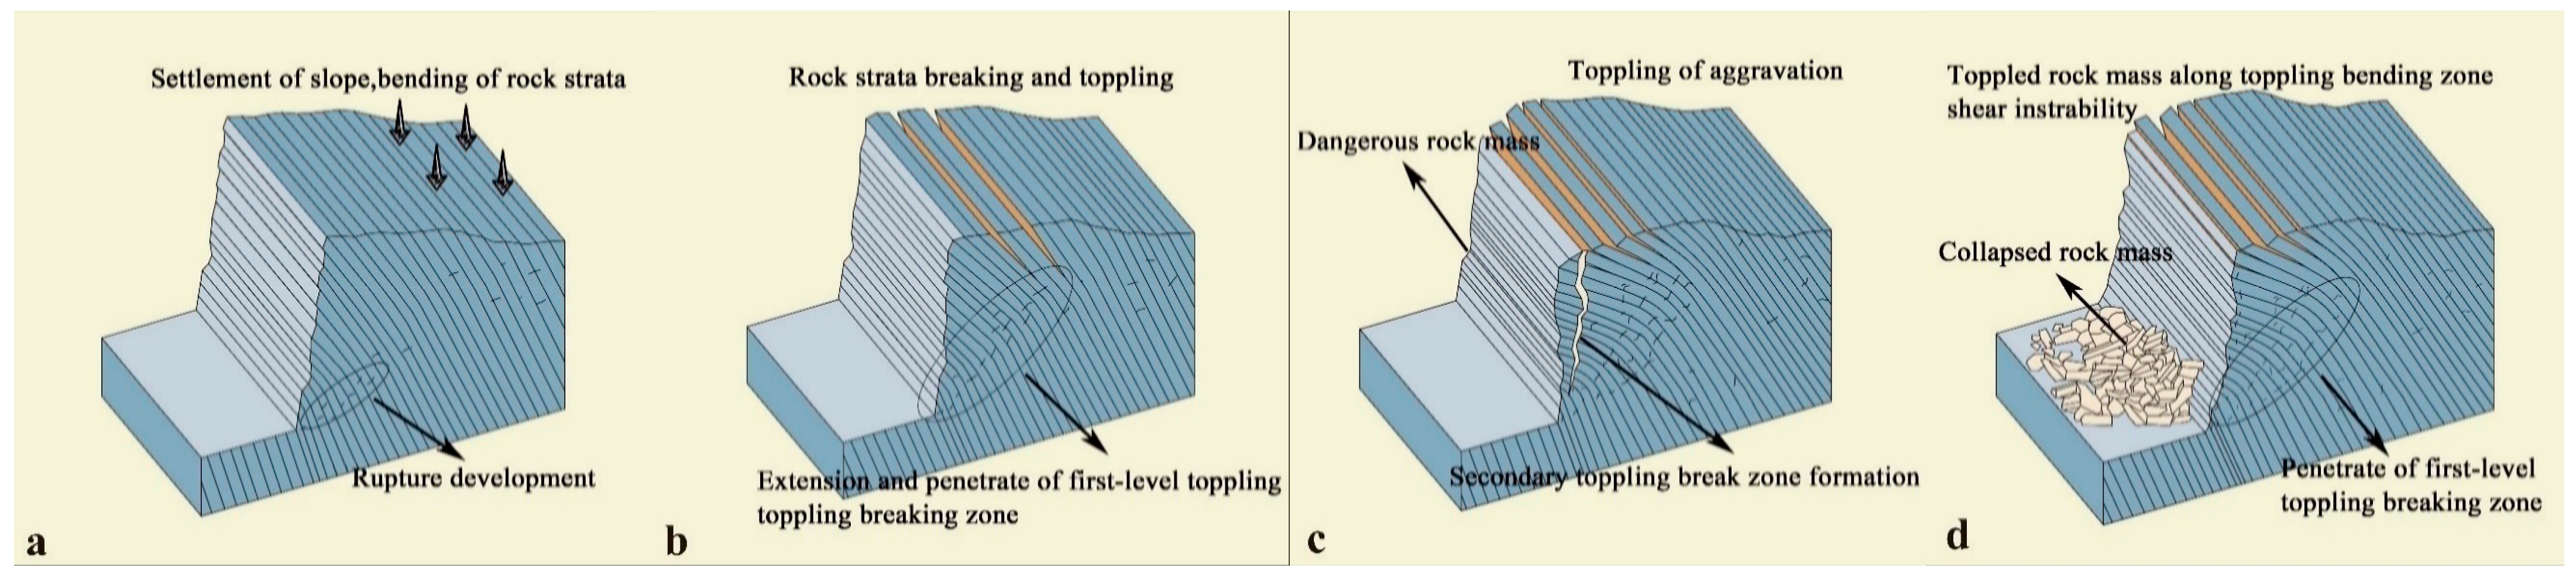
6.2. Analysis of Disaster Patterns

After the slope undergoes toppling deformation under gravity, a long period of geological evolution is required for instability, and different slope angles lead to differences in the final disaster patterns. Therefore, combined with the results of the centrifugal testing for the analysis of the characteristics and evolution of the toppling deformation of the models with different slope angles, we attempted to study and understand the disaster patterns of the toppling deformation from the perspective of the slope angle change (change of the free face condition of the slope).
The models with slope angles of 55° and 65° did not generate a secondary toppling-bending zone at any point during test. As the centrifugal acceleration increased and the time passed, the slope model sustained a longer time period and accumulated more failure energy for the final instability, and the result of this process reflected the overall deformation and failure. The disaster pattern under the effect of gravity may show the overall shear slip of the slope due to the penetration of the toppling-bending zone. This evolution and disaster pattern is shown in Figure 13.
The model with a slope angle of 75° had a secondary toppling-bending zone inside the toppled rock layers, different from the other two slope models. The toppling of the slope was not an integral deformation failure. The rock mass above the secondary toppling-bending zone was closer to the slope surface, and thus, the rock mass broke and collapsed down to the slope foot during the formation process of the toppling-bending zone. The increase in the slope angle directly led to the generation of the multi-level toppling-bending zone of the toppling deformation rock mass, and the final result was that the toppling rock mass in the shallow surface of the slope collapsed. This destruction was also a kind of energy release and caused the slope deformation to temporarily converge. Meanwhile, the rock mass continued to generate toppling deformation under the effect of gravity, accumulating energy for the next collapse failure. This evolution and disaster pattern is shown in Figure 14.
In conclusion, the variation in the free-face conditions of the slope could directly influence the degree of toppling deformation, the development characteristics of the toppling-bending zone and the final disaster pattern of the toppling deformation. Under identical conditions of slope height, dip angle of the rock stratum and thickness of the rock stratum, the lower the slope angle is, the more likely the toppling deformation will develop into an overall slide instability. The steeper the slope angle is, the more likely the toppled rock mass is to evolve into a collapse.

7. Conclusions

In this study, centrifugal model tests were performed to simulate the toppling deformation process of an anti-dip slope with different slope angles, and the following conclusions were obtained.
The evolution process of toppling deformation of the anti-dip layered rock slope could be divided into four stages: (a) the rock strata topples, and the trailing edge of the slope settles; (b) the rock strata at the slope foot topple and rupture, and the slope rock strata generates “toppling-bending” deformation; (c) the toppling-bending zone extends from the foot of the slope to the top, and tension deformation is generated at the crest of the slope; (d) the toppling-bending zone extends until it penetrates the slope and the rock strata generate “toppling-breaking” failure.
When toppling deformation occurs in the anti-dip layered rock slope, a toppling-bending zone is generated from the slope foot and extends to the top of the slope in the form of a ladder until it penetrates the slope. A new secondary toppling-bending zone is generated at the steep slope inside the toppled rock mass caused by the previous first toppling-bending zone and extends upward in a similar way. The larger the slope angle is, the more favourable the development of the anti-dip slope toppling deformation.
The development depth of the toppling deformation is sensitive to the slope angle. With the other conditions remaining unchanged, the larger the slope angle is, the deeper the development depth of the toppling-bending zone, and the larger the deformation range. That is, the development depth of the toppling-bending zone is positively related to the slope angle.
The angle between the base plane of the toppling-breaking and the normal i of the rock strata is θ, and this test indicates that the angle is between 12 and 16. Provided that the dip angle of the rock strata of the anti-dip slope is β, when the slope angle α is less than the angle δ between the base plane and the horizontal plane e ( δ = θ + 90 ° β ), then toppling deformation occurs with difficulty in the slope.
Under identical conditions for the parameters such as the slope height, the dip angle of the rock stratum and the thickness of the rock stratum, the lower the slope angle is, the more likely it is that the toppling deformation will develop into overall slide instability; the steeper the slope angle is, the more likely it is that the toppled rock mass will evolve into a collapse.

Author Contributions

Conceptualization, D.Z. and H.Z. (Hongke Zhou); methodology, D.Z.; software, H.Z. (Hang Zhou); validation, D.Z., H.Z. (Hang Zhou) and Z.W.; formal analysis, F.L.; investigation, Q.C.; resources, D.Z.; data curation, H.Z. (Hongke Zhou); writing—original draft preparation, H.Z. (Hongke Zhou); writing—review and editing, D.Z.; visualization, D.Z.; supervision, D.Z.; project administration, D.Z.; funding acquisition, D.Z. All authors have read and agreed to the published version of the manuscript.

Funding

The study is financially supported by the State Key Laboratory of Geohazard Prevention and Geoenvironment Protection Independent Research Project (Chengdu University of Technology) (SKLGP2020Z008), the National Key Research and Development Program of China (2018YFC1504905), and Department of Natural Resources of Tibet Autonomous Region (Tibetan Finance 2020 0890-1).

Institutional Review Board Statement

Not applicable.

Informed Consent Statement

Not applicable.

Data Availability Statement

Not applicable.

Acknowledgments

The authors thank all funding agencies.

Conflicts of Interest

All authors declare no conflict of interest.

References

  1. Wang, J.; Su, A.; Liu, Q.; Xiang, W.; Yeh, H.F.; Xiong, C.; Zou, Z.; Zhong, C.; Liu, J.; Cao, S. Three-dimensional analyses of the sliding surface distribution in the Huangtupo No. 1 riverside sliding mass in the Three Gorges Reservoir area of China. Landslides 2018, 15, 1425–1435. [Google Scholar] [CrossRef]
  2. Wang, J.; Schweizer, D.; Liu, Q.; Su, A.; Hu, X.; Blum, P. Three-dimensional landslide evolution model at the Yangtze River. Eng. Geol. 2021, 292, 106275. [Google Scholar] [CrossRef]
  3. Hoek, E.; Bray, J. Rock Slope Engineering, 3rd ed.; Institution of Mining and Metallurgy: London, UK, 1981; pp. 257–270. Available online: https://books.google.com/books?id=R0NZDwAAQBAJ&lpg=PP1&dq=Rock%20slope%20engineering&lr&hl=zh-CN&pg=PP1#v=onepage&q=Rock%20slope%20engineering&f=false (accessed on 3 January 2022).
  4. Huang, R.Q.; Li, Y.S. The implication and evaluation of toppling failure in engineering geology practice. J. Eng. Geol. 2017, 25, 1165–1181. [Google Scholar] [CrossRef]
  5. Zhang, Z. Rock slope deformation mechanism in the Cihaxia Hydropower Station, Northwest China. Bull. Eng. Geol. Environ. 2015, 74, 942–958. [Google Scholar] [CrossRef]
  6. Nichol, S.L.; Hungr, O. Large-scale brittle and ductile toppling of rock slopes. Can. Geotech. J. 2002, 39, 773–788. [Google Scholar] [CrossRef]
  7. Moo-Young, T.; Myers, B. Centrifuge simulation of the consolidation characteristics of capped marine sediment beds. Eng. Geol. 2003, 70, 249–258. [Google Scholar] [CrossRef]
  8. Lee, K.; Kim, J.; Woo, S.I. Analysis of Horizontal Earth Pressure Acting on Box Culverts through Centrifuge Model Test. Appl. Sci. 2022, 12, 1993. [Google Scholar] [CrossRef]
  9. Kapogianni, E.; Laue, J. Experimental Investigation of Reinforced Soil Slopes in a Geotechnical Centrifuge, with the Use of Optical Fibre Sensors. Geotech. Geol. Eng. 2017, 35, 585–605. [Google Scholar] [CrossRef]
  10. Zhang, J.H.; Chen, Z.Y. Centrifuge Modeling of Rock Slopes Susceptible to Block Toppling. Rock Mech. Rock Eng. 2007, 40, 363–382. [Google Scholar] [CrossRef]
  11. Alzo’ubi, A.K.; Martin, C.D. Influence of tensile strength on toppling failure in centrifuge tests. Int. J. Rock Mech. Min. Sci. 2010, 47, 974–982. [Google Scholar] [CrossRef]
  12. Wang, R.; Zhang, G. Centrifuge modelling of clay slope with montmorillonite weak layer under rainfall conditions. Appl. Clay Sci. 2010, 50, 386–394. [Google Scholar] [CrossRef]
  13. Dewoolkar, M.M.; Goddery, T. Centrifuge Modeling for Undergraduate Geotechnical Engineering Instruction. GTJ 2003, 26, 201–209. [Google Scholar] [CrossRef]
  14. Chu, I.; Woo, S.K. Analysis of Vertical Earth Pressure Acting on Box Culverts through Centrifuge Model Test. Appl. Sci. 2022, 12, 81. [Google Scholar] [CrossRef]
  15. Yan, K.; Zhang, J. Earthquake loading response of a slope with an inclined weak intercalated layer using centrifuge modeling. Bull. Eng. Geol. Environ. 2019, 78, 4439–4450. [Google Scholar] [CrossRef]
  16. Idinger, G.; Aklil, W. Centrifuge model test on the face stability of shallow tunnel. Acta Geotech. 2011, 6, 105–117. [Google Scholar] [CrossRef] [Green Version]
  17. Adhikary, D.P.; Dyskin, A.V. A study of the mechanism of flexural toppling failure of rock slopes. Rock Mech. Rock Eng. 1997, 30, 75–93. [Google Scholar] [CrossRef]
  18. Adhikary, D.P.; Dyskin, A.V. Numerical modelling of the flexural deformation of foliated rock slopes. Int. J. Rock Mech. Min. Sci. Geomech. Abstr. 1996, 33, 595–606. [Google Scholar] [CrossRef]
  19. Zhang, H.; Chen, C. Centrifuge modeling of layered rock slopes susceptible to block-flexure toppling failure. Bull. Eng. Geol. Environ. 2020, 79, 3815–3831. [Google Scholar] [CrossRef]
  20. Nonika, A.; Abdoun, T.; Sasanakul, I. Centrifuge tests on liquefaction potential and slope stability of mine tailings. Int. J. Phys. Model. Geotech. 2018, 19, 104–114. [Google Scholar] [CrossRef]
  21. Zheng, D.; Wang, Q.L. Centrifuge model test study on key hazard-inducing factors of deep toppling deformation and disaster patterns of counter-tilt layered rock slopes. Chin. J. Rock Mech. Eng. 2019, 38, 1954–1963. [Google Scholar] [CrossRef]
  22. Goodman, R.E. Toppling—A Fundamental Failure Mode in Discontinuous Materials—Description and Analysis. In Proceedings of the Geo-Congress 2013, San Diego, CA, USA, 3–7 March 2013. [Google Scholar] [CrossRef]
  23. Goodman, R.E.; Bray, J.W. Toppling of Rock Slopes, 1st ed.; American Society of Civil Engineers: New York, NY, USA, 2021; pp. 201–234. Available online: https://cedb.asce.org/CEDBsearch/record.jsp?dockey=0265503 (accessed on 13 December 2021).
Figure 1. Typical toppling deformation slope, (a) The toppling slope of the Yuqu River Zhala Hydropower Station, (b) The toppling slope on the left bank of Wulongnong Hydropower Station.
Applsci 12 05084 g001
Figure 2. The toppling deformation slope in front of the dam of the Gushui Hydropower Station. (a) Engineering geological planar graph of the study area, 1 Alluvium deposit, 2 4th section of the Permian Jidonglong Formation, 3 2nd–4th section of the Permian Jidonglong formation, 4 diluvial layer and ice water accumulation layer, 5 diluvial layer and colluvium, 6 6th section of the Permian Jidonglong formation, 7 5th section of the Permian Jidonglong formation, 8 upper Triassic Hongpo formation, 9 2nd–3th section of the Permian Jidonglong formation, 10 Hongshan-Gushui thrust fault, 11 Adit, 12 study area, (b) zone with extremely strong toppling deformation, 13 Extruded surface, (c) zone with extremely strong toppling deformation, 14 broken surface.
Applsci 12 05084 g002
Figure 3. Engineering geological profiles of the slope.
Applsci 12 05084 g003
Figure 4. (a) Figure of the model designs, 1 linear variable differential transformer to obtain the displacement, 2 rock strain gauges, 3 free face of slope, 4 slope crest, 5 plate beam structure, 6 fixed. structure, (b) TLJ-500 geotechnical centrifuge, (c) similar material, (d) element board, (e) rock strain gauges arrangement, (f) similitude model.
Applsci 12 05084 g004
Figure 5. (a) Splitting tensile strength test, (b) uniaxial compression test, (c) specimen, (d) direct shear test.
Applsci 12 05084 g005
Figure 6. The deformation of the slopes, (a) the deformation signs of the 55° slopes in the initial stage, (b) the deformation signs of the 65° slopes in the initial stage, (c) the deformation signs of the 75° slopes in the initial stage, (d) the deformation signs of the 55° slopes, (e) the deformation signs of the 65° slopes, (f) the deformation signs of the 75° slopes.
Applsci 12 05084 g006
Figure 7. Failure patterns after slope toppling, (a) 55° slope toppling, (b) 65° slope toppling, (c) 75° slope toppling, (d) displacement vector diagrams of the 55° slopes, (e) displacement vector diagrams of the 65° slopes, (f) displacement vector diagrams of the 75° slopes.
Applsci 12 05084 g007
Figure 8. Variation curves for the vertical displacements of the monitoring points, (a) LVDT1, (b) LVDT2, (c) LVDT3.
Applsci 12 05084 g008
Figure 9. Curve of LVDT3 monitoring point, (a) displacement vs. time, (b) displacement changing ratio vs. centrifugal acceleration.
Applsci 12 05084 g009
Figure 10. Model slope strain rate curves, (a) acceleration values and strain rate of key nodes in the development of the toppling bending zone, 1 rupture of 55° slope foot, 2 rupture of 65° slope foot, 3 rupture of 75° slope foot, 4 first-level toppling zone of 55° slope, 5 first-level toppling zone of 65° slope, 6 first-level toppling zone of 75° slope, 7 s-level toppling zone of 75° slope, 8 centrifugal acceleration curve, 9 S4 strain rate of 75°slope, 10 S1 strain rate of 55° slope, 11. S1 strain rate of 65° slope, 12. S1 strain rate of 75° slope, 13. S5 strain rate of 55° slope, 14. S5 strain rate of 65° slope, 15. S5 strain rate of 75° slope, 16. curve crest corresponding to rupture of slope foot. (b) slope of S3 strain rate curves, (c) slope of S4 strain rate curves.
Applsci 12 05084 g010
Figure 11. Model slope strain curves. (a) S1 and S5 strain curve, (b) S2 and S4 strain curve, (c) S3 and S6 strain curve.
Applsci 12 05084 g011
Figure 12. Developmental characteristics of the toppling bending zone, (a) 55° slope, (b) 65° slope, (c) 75° slope, (d) 3D schematics.
Applsci 12 05084 g012
Figure 13. “Toppling–shear slide” disaster pattern.(a) settlement of slope bending of rock strata, (b) tension fracture of slope top, (c) penetrate of first-level toppling breaking zone, (d) toppled rock mass.
Applsci 12 05084 g013
Figure 14. “Toppling-collapse” disaster pattern. (a) settlement of slope bending of rock strata, (b) first-level toppling breaking zone, (c) second-level toppling breaking zone, (d) toppled rock mass.
Applsci 12 05084 g014
Table 1. Physical and mechanical parameters of prototypes and similar materials.
Rock Similarity IndexDensity (g/cm3)Elastic Modulus (MPa)Compressive Strength (MPa)Tensile Strength (MPa)Cohesion (kPa)Internal Fiction Angle (°)
PrototypeMetamorphic sandstone2.423000151.75//
Interlayer bonding////3516
ModelMetamorphic sandstone2.38280014.81.84//
Interlayer bonding////34.515.8
Table 2. Displacement of different monitoring points on each slope.
Slope AngleVertical Displacement Change Value (mm)
LVDT1LVDT2LVDT3
55°773552
65°874968
75°92/79
Publisher’s Note: MDPI stays neutral with regard to jurisdictional claims in published maps and institutional affiliations.

