
Anomaly Detection in Log Files Using Selected Natural Language Processing Methods


Faculty of Electronics and Information Technology, Warsaw University of Technology, Nowowiejska 15/19, 00-665 Warsaw, Poland
*
Author to whom correspondence should be addressed.
Appl. Sci. 2022, 12(10), 5089; https://0-doi-org.brum.beds.ac.uk/10.3390/app12105089
Submission received: 21 April 2022
/
Revised: 16 May 2022
/
Accepted: 17 May 2022
/
Published: 18 May 2022
(This article belongs to the Special Issue Soft Computing Application to Engineering Design)
Abstract
:In this article, we address the problem of detecting anomalies in system log files. Computer systems generate huge numbers of events, which are noted in event log files. While most of them report normal actions, an unusual entry may inform about a failure or malware infection. A human operator may easily miss such an entry; therefore, anomaly detection methods are used for this purpose. In our work, we used an approach known from the natural language processing (NLP) domain, which operates on so-called embeddings, that is vector representations of words or phrases. We describe an improved version of the LogEvent2Vec algorithm, proposed in 2020. In contrast to the original version, we propose a significant shortening of the analysis window, which both increased the accuracy of anomaly detection and made further analysis of suspicious sequences much easier. We experimented with various binary classifiers, such as decision trees or multilayer perceptrons (MLPs), and the Blue Gene/L dataset. We showed that selecting an optimal classifier (in this case, MLP) and a short log sequence gave very good results. The improved version of the algorithm yielded the best F1-score of 0.997, compared to 0.886 in the original version of the algorithm.
1. Introduction
Modern computer systems are becoming larger and more complex than ever before. All of them generate logs, which are text-based entries describing the events that make up the state of the system at any given moment in time. Logs contain extremely valuable information for system administrators, ranging from potential causes of failure to attacks on the system, e.g., as a result of malware infection.
System logs require careful monitoring, because each anomaly in the system log may have a potential impact on service availability, data confidentiality, or integrity. However, large-scale systems generate such a large number of logs that human supervision of them becomes both very difficult and expensive. What is more, security specialists may sometimes overlook a suspicious entry among thousands of others.
This article contributes to the area of the automatic analysis of system logs. This topic has already been researched for several years [1,2,3,4]. Log analysis is widely used to improve the reliability and security of systems in many respects, such as failure diagnosis and troubleshooting [5], intrusion detection [6], anomaly detection [7], and e-commerce [8]. In this work, we propose an improved version of the LogEvent2Vec algorithm [9], which detects anomalies in log files using natural language processing (NLP) methods.
Usually, three types of anomalies are considered: point anomalies, contextual anomalies, and collective anomalies [10]. Point anomalies are the simplest type and probably the most common. If we define some kind of metric or transformation and apply it to the text data, the point anomaly will stand out from the rest of the data, being outside the boundary of normal regions or values. In contrast, contextual anomalies are single data points or groups that are outstanding only when seen in context with other surrounding data points. Contextual anomalies without surrounding context will not be deemed to be anomalies. Lastly, collective anomalies are those related data instances that stand out with respect to the whole dataset. Single data instances within that group may not be anomalous by themselves, but their joint occurrence as a collection is an anomaly. In this paper, by embodying context information in input data of anomaly detection algorithms, we transform a point and collective anomaly detection problem into a contextual anomaly detection problem.
Our article is structured as follows: In Section 2, we briefly review the state-of-the-art in the area of anomaly detection in log files. Next, in Section 3, we describe our approach. The experiments conducted are described in Section 4, followed by the presentation of the results in Section 5. The article concludes with a discussion of the results in Section 6 and a summary in Section 7.
2. Related Work
Many existing solutions for log anomaly detection are based on traditional data-mining techniques, such as regular expressions filtering entries containing keywords that may be indicative of anomalies, e.g., error [11,12]. Such solutions, apart from having a high false-positive rate, are not able to detect some types of anomalies. Whether a log should be classified as an anomaly depends not only on the content of the entry itself, but also on the logs surrounding it. This approach makes it possible to detect anomalies such as brute force and denial of service attacks. Some approaches [13,14] focus on extracting statistical features of individual logs, e.g., the frequency of occurrence of a given template, the time interval between entries, or the number of entries classified as a given template. However, NLP methods provide tools that, according to the experimental results, extract template sequence features in a more universal way, resulting in better evaluation metrics for the anomaly detection process.
Another model [15] utilizes the word2vec algorithm [16] for word embedding of every token in each log entry. The input data of the anomaly detection algorithm are a vector representing a sequence of log entries. Obtaining such a vector in this approach requires a double transformation of the embedded word vectors. The first transformation (e.g., averaging or tf-idf) yields a vector representing a given entry, and the second transformation results in a vector representing a given sequence. This approach allows the extraction of not only the relationships between words within the content of the entries, but also the relationships between the entries. Note that the number of all words in the logs is much larger than the number of all log entries in the training set, thus requiring large computational resources. The model presented in this paper does not extract features from the words that make up the log entries, but treats the log templates as words and their sequences as sentences, so that only one transformation is required to obtain a sequence vector.
GloVe [17] is a similar algorithm to word2vec. While word2vec predicts the context of a given word, GloVe learns by building a coexistence matrix that contains information about how often a word appears in the context. fastText [18] is another word embedding algorithm used in NLP, that converts a text into a vector of real numbers. Vectors are generated in such a way that words occurring in similar contexts are close together in linear space, as opposed to words occurring in different contexts, between which the Euclidean distances are greater.
The so-called Log2Vec representation was proposed in [19]. This method minimizes false alarms by taking into account the domain-specific semantic information of the logs, deals with out-of-vocabulary (OOV) words, and significantly improves the online log analysis performance.
Machine learning methods are also widely used in log anomaly detection. Due to the imbalance problem, many unsupervised methods have been proposed. Some of them are principal component analysis (PCA) [1] or one-class SVM techniques [20]. In the case of big datasets, the isolated forest algorithm achieves better performance results than SVM and K-means [21]. The approach based on the combination of the K-means algorithm, used for the separation of the anomalies from normal observations, and the XGBoost model, used for detection of malicious web logs, was presented in [22]. Unlabeled observations clustered by K-means are used to build a set of interpretable rules to generalize unseen events. In [23], anomaly log detection with an improved version of the k-NN algorithm was presented. After parsing with the n-gram and the frequent pattern mining (FPM) methods, observations are clustered and automatically receive labels from historical logs. Additionally, the average weighting distance method is used to reduce the negative effects of sample imbalance.
Recently, deep learning models have been widely used for log anomaly detection since they can capture temporal information in sequential data. The DeepLog model, presented in [24], uses the long short-term memory (LSTM) recurrent neural network (RNN) to analyze sequences of log templates, which allows the detection of semantic relationships between consecutive log entries. Utilizing one-hot encoding to represent log templates in numeric form results in a partial loss of information about the very important semantic relationships between log templates. One-hot encoding causes each template to be treated as an independent random variable. For log templates, this is an oversimplification. Some templates may occur in very similar contexts and some in very different ones. Preserving this information can help improve the performance of the anomaly detection model. In addition, DeepLog is prone to parsing errors—any error in the log parser is a potential error of the anomaly detection algorithm, due to the lack of a feature extraction layer. Furthermore, the LSTM neural network is more resource-intensive than other machine learning methods, e.g., those used in this paper. In [25], the LSTM-based approach was compared with the Autoencoder and Transformer [26] techniques and usually had better performance. On the other hand, compared to supervised methods (convolutional neural network—CNN, attention-based Bi-LSTM [27]), the results were more often lower.
Another approach based on the DeepLog model, but using dual LSTM with a symmetric structure, was presented in [28]. The authors designed the filtering process and obtained a more detailed list of log event templates solving the problem of log inconsistencies. In [29], the RNN-based LogBERT log anomaly detection system was presented. This self-supervised solution uses the bidirectional encoder representations from Transformers (BERT) method [30] to capture the information of whole log sequences with various lengths. LogBERT is trained on normal log sequences and can detect malicious log sequences using two novel techniques: masked log message prediction and volume of hypersphere minimization.
On the other hand, the deep-learning-based NeuralLog method [31] is OOV and semantic-aware, but able to use raw log data without parsing. The method based on reinforcement learning was proposed in [32]. The authors proved that the log anomaly detection problem is a typical sequential decision problem and can be modeled by the Markov decision process (MDP).The Q-learning algorithm was used to determine whether the log execution sequence is abnormal or not, rewarding relevant observations. Yet another system, called LogTransfer, is based on transfer learning [33]. This technique consists of transferring the anomalous knowledge of one type of software system to another, minimizing the impact of noises in anomalous log sequences. The sequential patterns of logs are extracted by an LSTM neural network. Other approaches using deep learning methods for log anomaly detection were presented in survey [34].
Wang et al. [9] introduced the LogEvent2Vec model, which uses the word2vec word embedding algorithm for log vectorization. However, as the word2vec input, all the log entries were used, rather than individual words that comprised an entry. Consequently, obtaining a sequence vector required only one vector transformation, in contrast to two, as in the case of [15]. This allowed extracting semantic relationships between logs and further saved computational resources. The model also used the Drain parser. The anomaly detection process was tested employing three supervised binary classifiers: random forests, naive Bayes, and neural networks (MLP). The length of the sequence was set to a fixed value of 5000 logs. The model was evaluated on the BGL dataset, using a 90/10 split/test validation method. The study reported the best F1-score of 89%.
3. Materials and Methods
In this paper, we propose an anomaly detection model whose architecture is based on LogEvent2Vec. However, we made several modifications, including significantly reducing the sequence length and investigating the impact of this parameter on the anomaly detection process, using the fastText vectorization algorithm without character n-gram, instead of word2vec as in LogEvent2Vec. We also employed the cross-validation validation method suitable for highly unbalanced datasets. For anomaly detection, we tested six various binary classifiers, and we selected the best one.
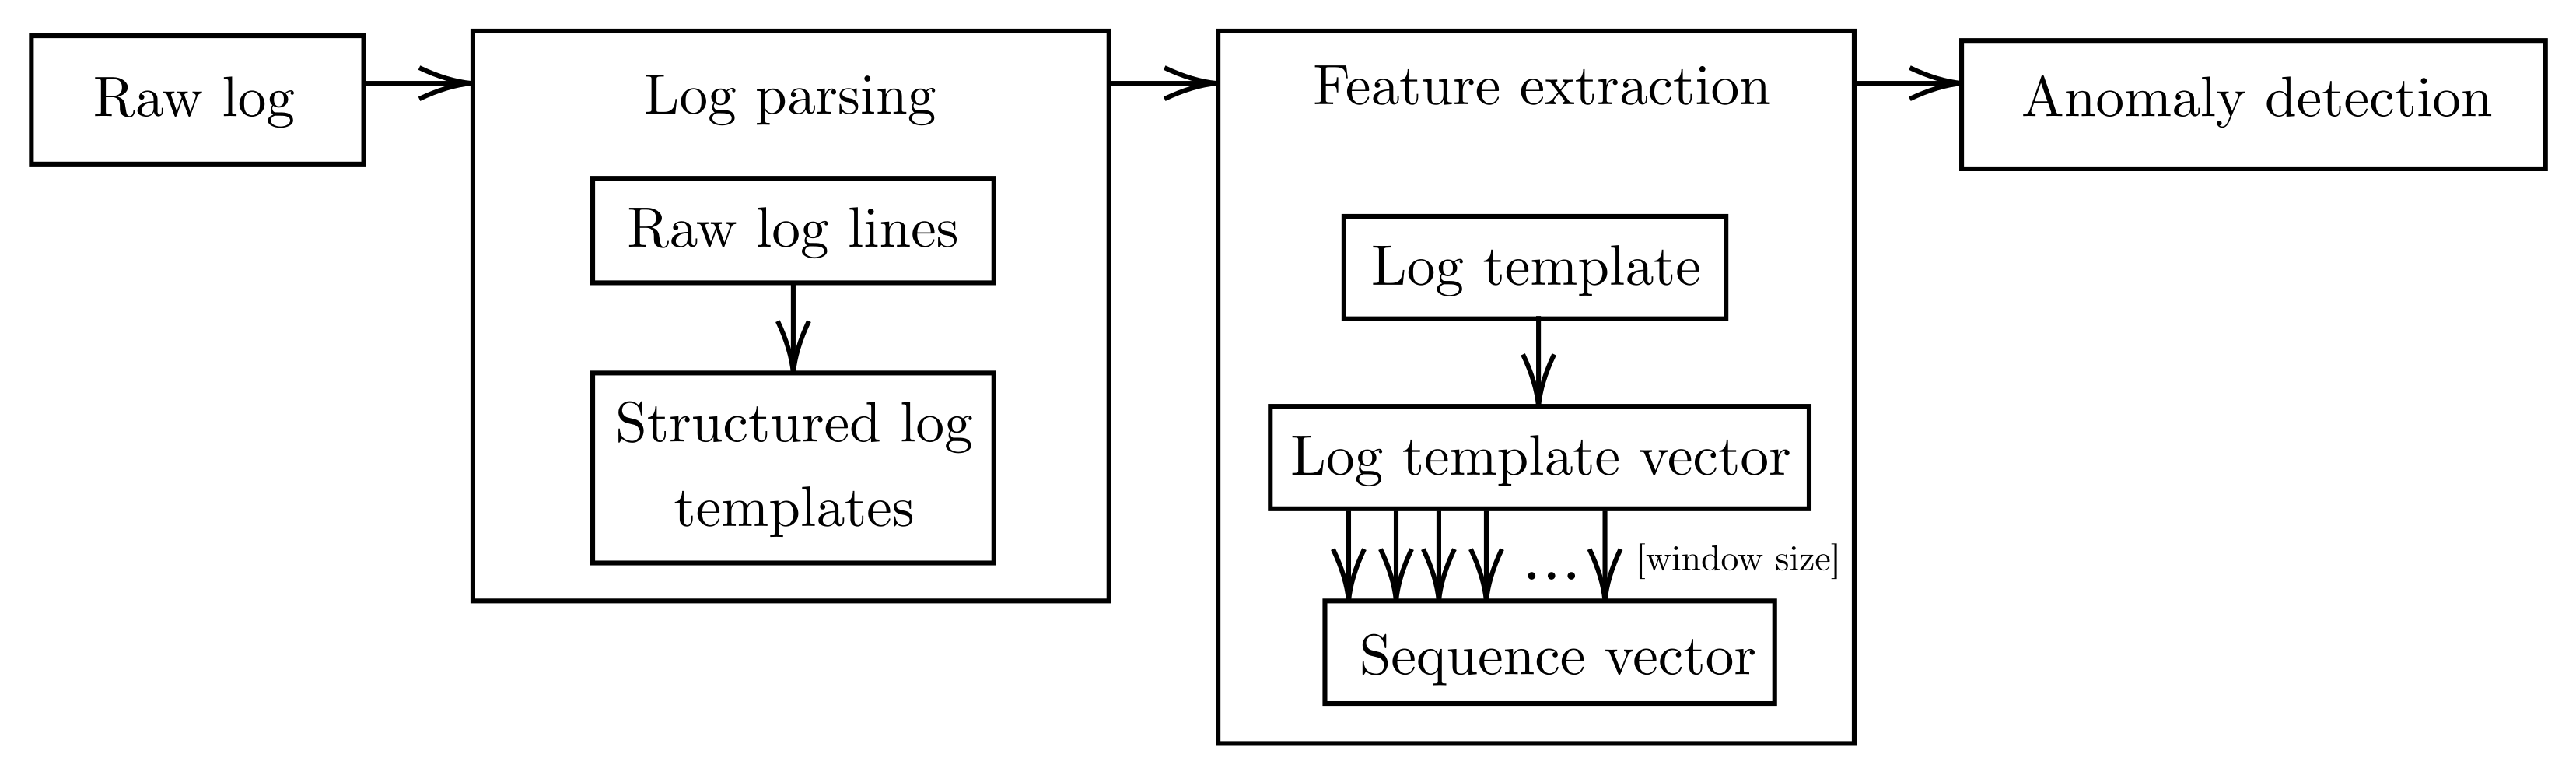
The anomaly detection process presented in this paper takes three steps: log parsing, log template feature extraction, and detection of anomalous sequences (Figure 1). By treating logs as natural language, this model handles log templates as words and sequences of log templates as sentences. The log templates are obtained through a log structuring process, called parsing, for which the Drain parser [35] is used. After dividing the set of log templates into sequences, each template in the sequence is represented in vector form by the fastText algorithm [18]. All vectors in the sequence are then averaged, resulting in a vector representing the sequence of log templates. This vector is given as the input to the anomaly detection algorithm, which attempts to predict whether an anomaly has occurred within this sequence.
3.1. Parsing Log Data
Logs are textual data in semi-structured form. Each log event conforms to a strict syntax. For example, Blue Gene/L (BGL) logs [36] are composed of a header and a descriptive message. We distinguish between the following types of header parameters in the BGL dataset: Label, Timestamp, Date, Node, Time, NodeRepeat, Type, Component, Level. They store information about the log and take strictly defined values, e.g., timestamp in UNIX format or log level as an element from the set of all log levels (FATAL, FAILURE, SEVERE, ERROR, WARNING, INFO). The header is followed by a message that describes precisely the information contained in a given log entry and does not have a strictly defined syntax. Listing 1 provides an example log event. The log line starts with a header, consisting of various parameters, such as ID number, date, etc., which is followed by a descriptive message.
Listing 1.
Sample log event from BGL logs. Descriptive message is shown in bold.
1123240759 2005.08.05 R32-M1-N8-C:J05-U01 2005-08-05-04.19.19.6064 R32-M1-N8-C:J05-U01 RAS KERNEL INFO CE sym 16, at 0x0456cd40, mask 0x04
Before the parsing process, the header part of a log event is discarded. Variable parameter values in the header could adversely affect the parsing process, resulting in the generation of too many templates. Detecting anomalies in log parameter values is a task for a different classification model. After discarding the header, the parser in the parsing process replaces the parameters within the message with the token. Listing 2 represents the result of the parsing of an example log event presented in Listing 1.
Listing 2.
Example log template.
CE <∗>, at <∗>, mask <∗>
In our experiments, we used IBM’s Python 3 implementation of the Drain parser [37], which makes use of a fixed depth tree to parse logs in a streaming and timely manner. In the parsing process, Drain creates lists of template groups that are located in the leaves of the parsing tree. Each group contains a log template and a list of log entry identifiers that have been assigned to it. The other nodes of the tree, including the parent node, contain well-defined rules according to which the process of finding the appropriate group for a given log entry is performed. One such rule is to search by the number of tokens in a given log. Another rule is based on the assumption that initial tokens in log entries are more often fixed character strings, rather than parameters.
After assigning the appropriate path based on the initial tokens, the log goes to the leaf, where the parser selects the appropriate group for the log. This selection is made based on a metric designed to determine which template contains the most tokens in common with the log being parsed. Finally, the log is assigned to the group containing the template for which the metric score was the largest and the metric score exceeded the threshold value specified in the parser configuration. A new template is created if none of the groups contain a template for which the metric value has exceeded the similarity threshold.
3.2. Vectorization of Text Data
To utilize the potential of machine learning algorithms, a text needs to be properly encoded. The simplest and most common method is one-hot encoding. However, the orthogonality of the vectors obtained by one-hot encoding contributes to the loss of information about the semantic relationships between words, which are crucial in the anomaly detection process.
In our approach, we used the fastText algorithm, which provides two models for computing word representations: skipgram and continuous bag-of-words (cbow). skipgram learns to predict a target word based on a nearby word. In contrast, cbow predicts the target word according to its context. The context is represented as a bag-of-words contained in a fixed-length window around the target word. cbow tends to learn several times faster than skipgram, but skipgram performs better on small datasets. In this paper, we made use of the cbow model as the BGL dataset is rather large and the cbow model is able to compute embeddings precise enough for anomaly detection in a much shorter time than skipgram. Furthermore, initial experiments showed that using skipgram instead of cbow did not improve the results.
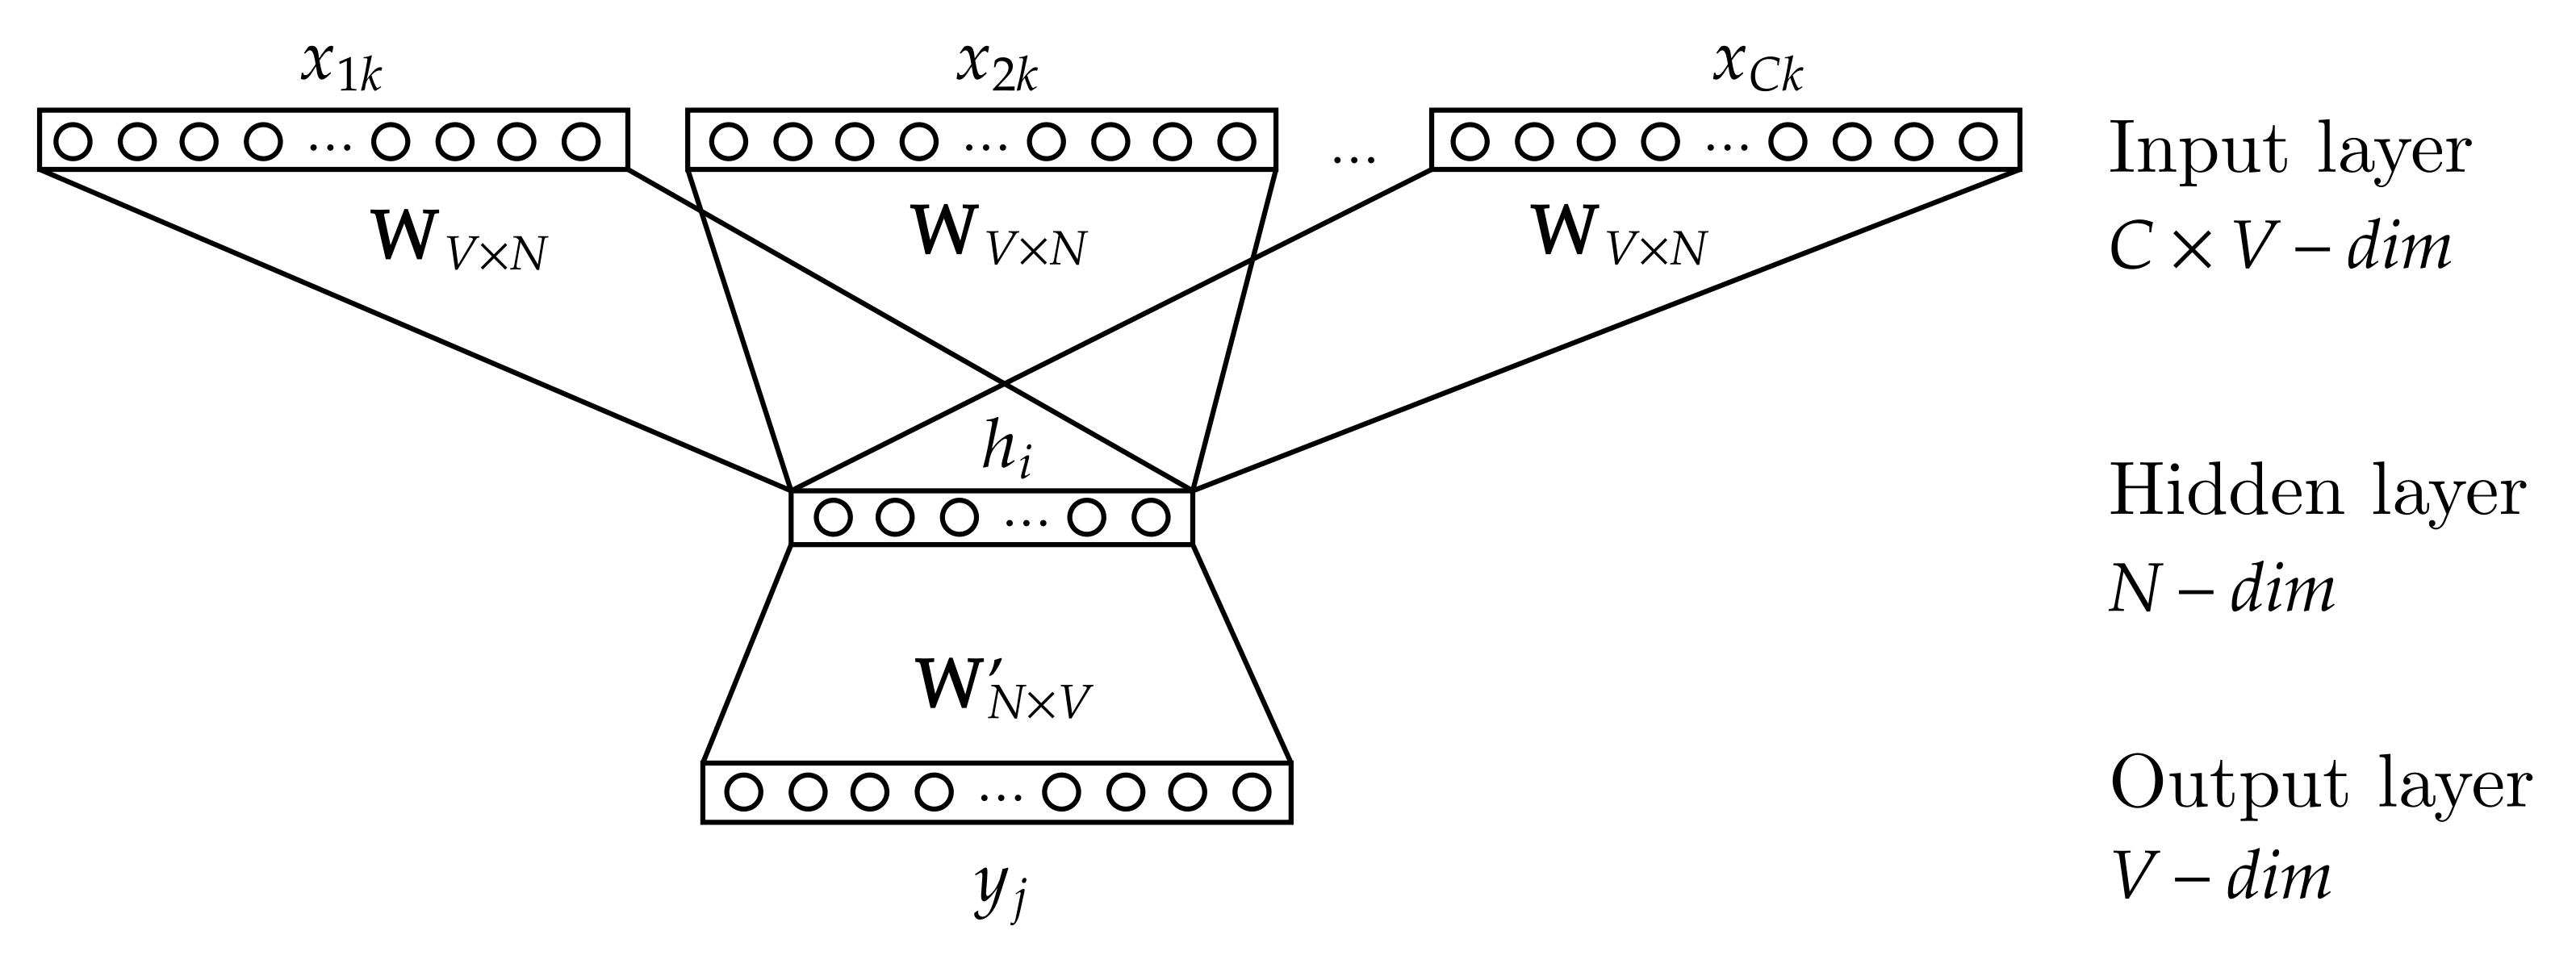
As shown in Figure 2, the cbow model is a neural network consisting of three layers: input, hidden, and output. The input data of the neural network are one-hot encoded words that surround the target word context window ( to ). By words, we are referring to log templates. is a weight matrix of size . The results of multiplying the weight matrix with each vector from the input layer are averaged to obtain the activation value of the hidden layer (N-dimensional vector h). The matrix is a weight matrix of size . The result of multiplying the weight matrix with the activation vector from the hidden layer is the output layer vector of length V. During model training, the output layer vector is passed as an argument to a loss function to determine the prediction error. The cbow model also makes use of negative sampling to make the training process more efficient [38].
Model training is the process of optimizing the loss function by changing the values of the weights in weight matrices. Once the training process is complete, the model can represent words in vector form. The model stores the activation values for all pairs containing a given word from the dictionary and its context window, making it possible to calculate the target word vector representation by averaging all the activation vectors of that word.
The approach based on the fastText vectorization without character n-grams, which we used in this study, is different from other log vectorization methods, such as word2vec log embedding [15], log2Vec [19], or NeuralLog [31]. All these approaches take words that compose a single log entry as the smallest units, which are then vectorized and transformed once (as in NeuralLog and log2Vec) or twice (as in word2vec log embedding) to a log event vector. Such an approach is resource-intensive because the number of words in the dataset is much larger than the number of log events. In this paper, we treat the entire log entry as the smallest unit by vectorizing the template indices using the fastText algorithm. The sequence vector is then obtained by a single transformation of all vectorized log events. The fastText algorithm itself, without n-grams, is almost identical to the word2vec word embedding method [16] (not to confuse it with the word2vec log embedding method), which could be used interchangeably in this approach. In the remainder of our article, we show that the vectors extracted this way are sufficient for efficient anomaly detection, once the sequence length has been adapted to a given binary classifier.
3.3. Classification Algorithms for Anomaly Detection
The problem of detecting anomalous log sequences can be reinterpreted as a binary classification problem. The model presented in this paper can work with any binary classification algorithm that supports supervised learning. We decided to explore the following algorithms: Gaussian naive Bayes (hereafter called GNB), decision tree (DT), random forest (RF), AdaBoost (AB), extreme gradient boosting (XB), and multilayer perceptron (MLP). The input data of the binary classifier are a sequence vector, and the output is a prediction of whether the sequence is anomalous.
3.4. Overview of the Anomaly Detection Process
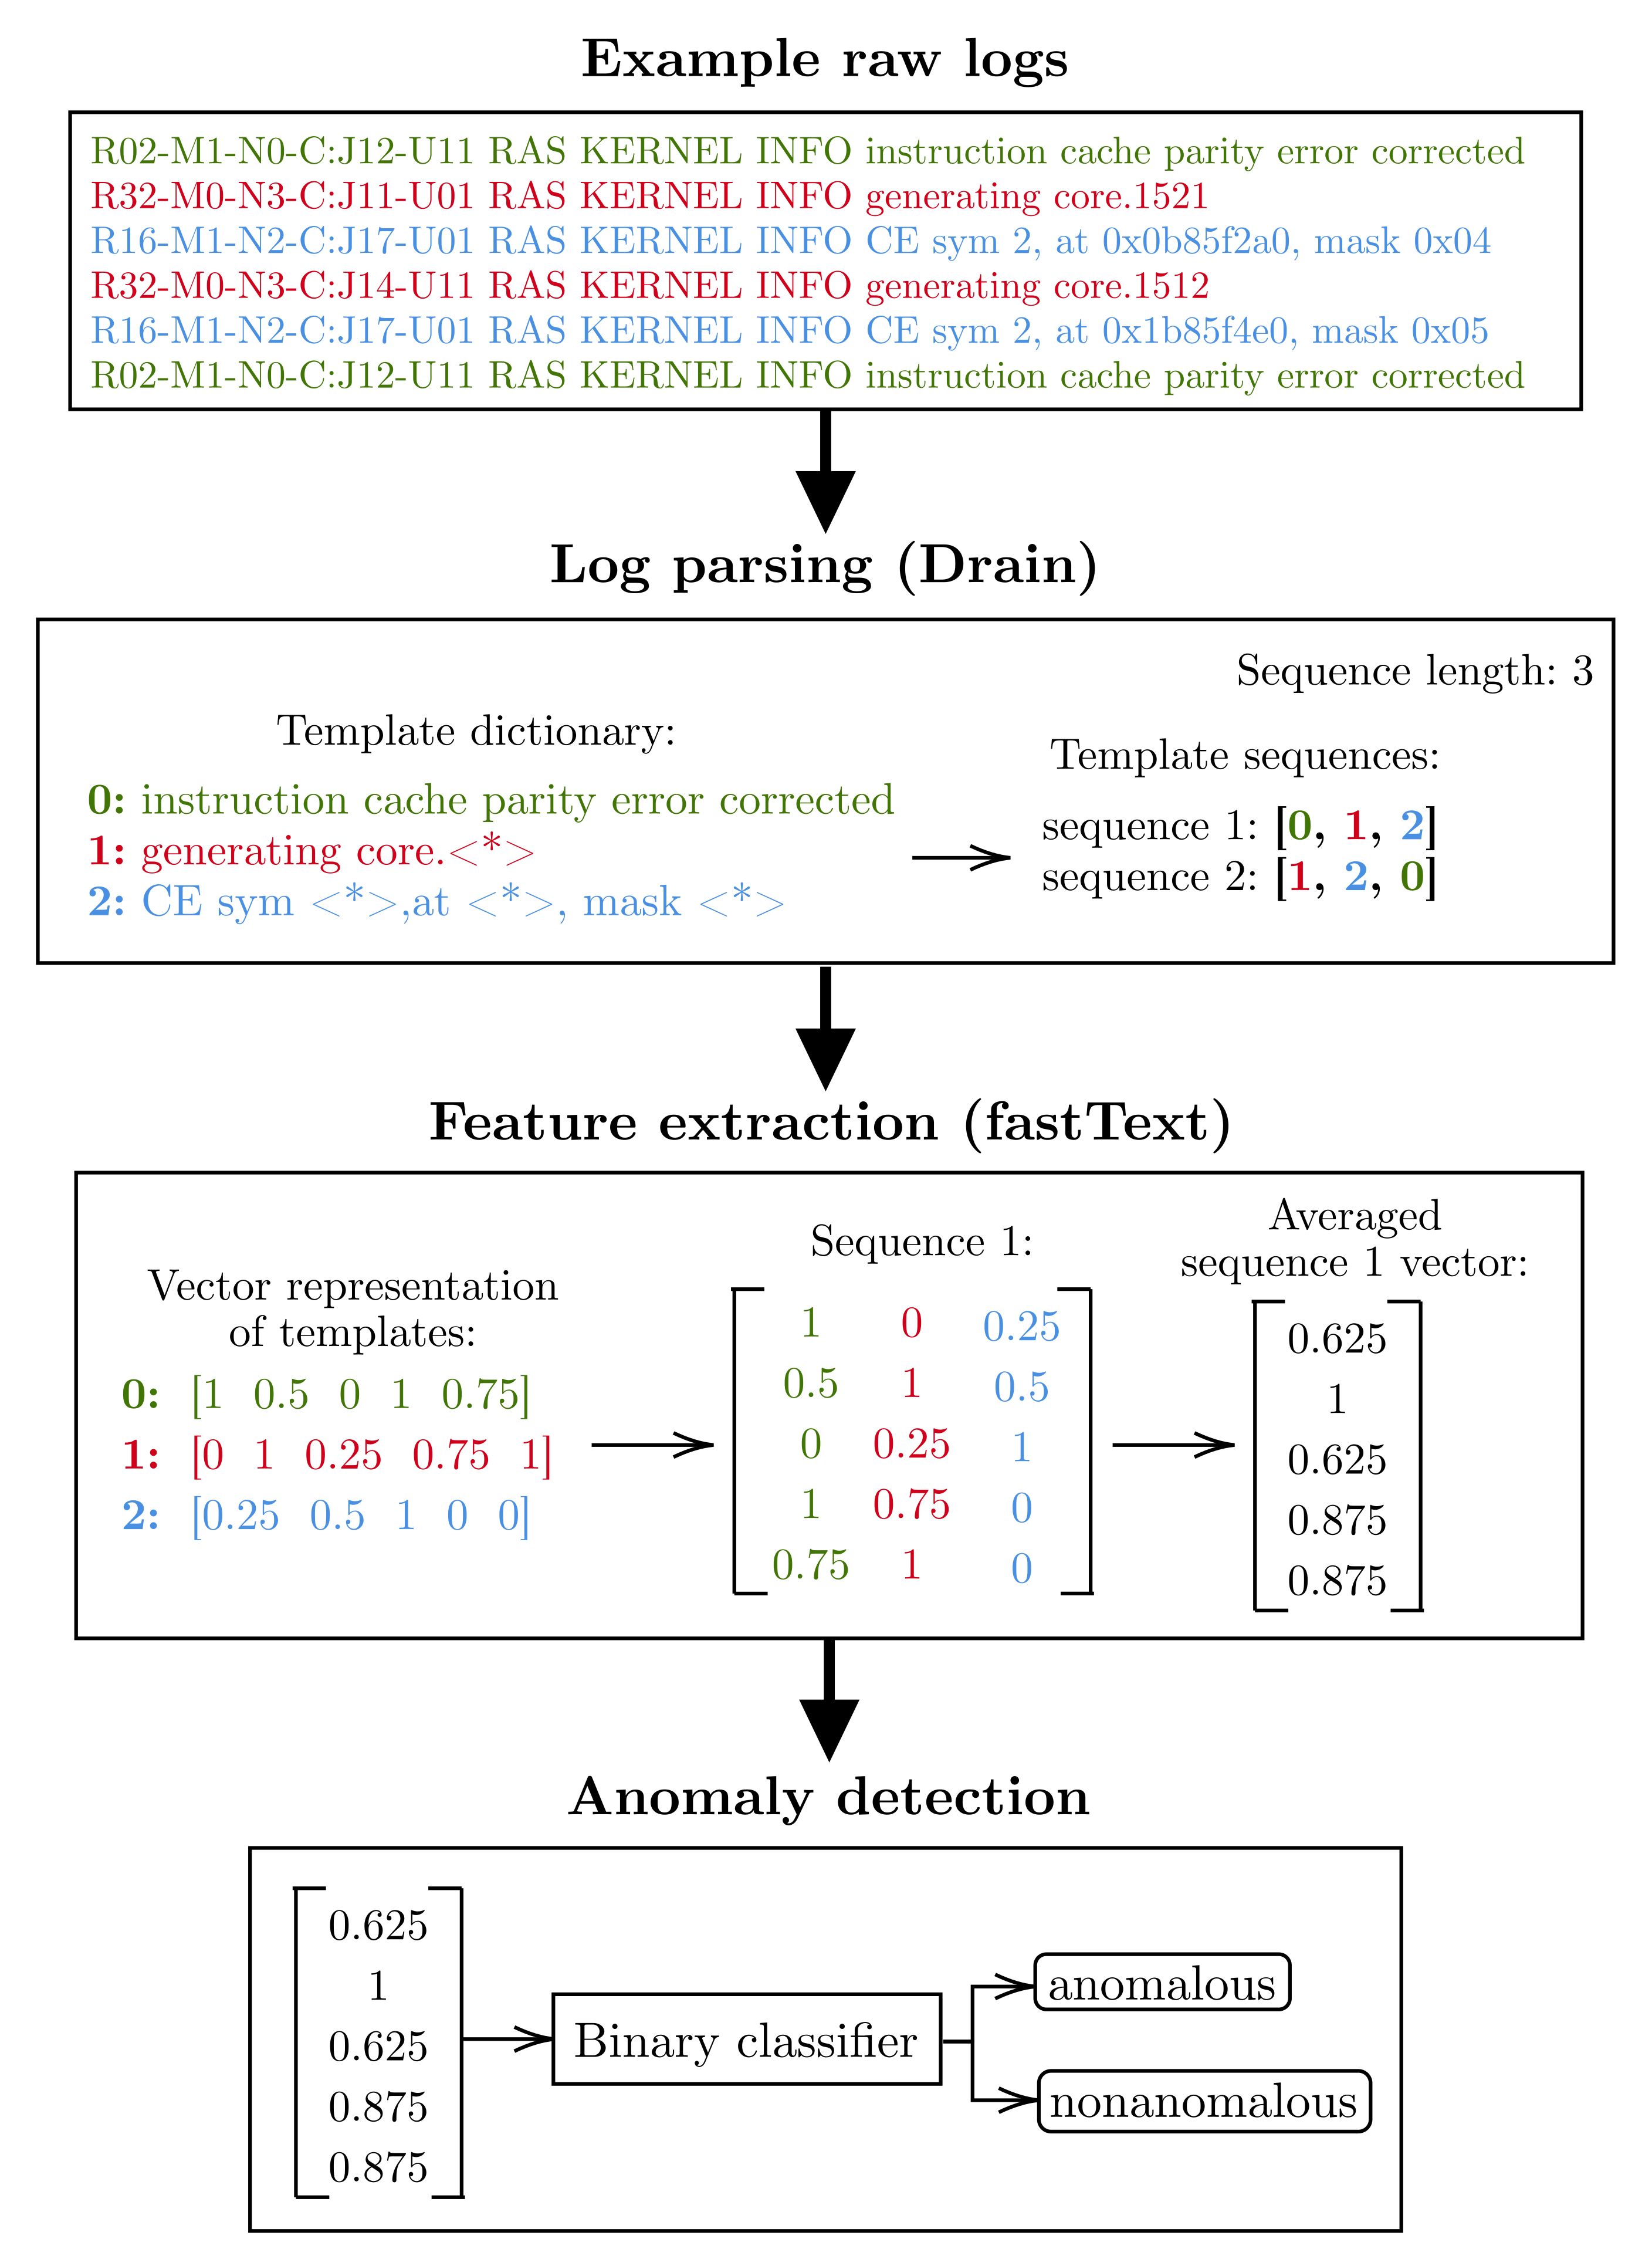
Figure 3 illustrates an overview of the anomaly detection process based on sample input data, which are six log lines from the BGL dataset. Before the parsing process begins, the data are preprocessed by removing the log header. For example, the first log entry R02-M1-N0-C:J12-U11 RAS KERNEL INFO instruction cache parity error corrected is stripped of its header parameters, resulting in instruction cache parity error corrected.
Further, the input data undergo a parsing process. The Drain parser identifies the parameters within each entry and replaces them with a wildcard token , creating log templates. If the resulting template was not observed during model training, the entire entry is replaced with the wildcard token. Otherwise, an unknown log template would spoil the following process of feature extraction. The result of parsing the example data is three log templates: instruction cache parity error corrected had no parameters, so became a template; generating core.1521 and generating core.1512 had one parameter each and have been aggregated into the same template generating core.; CE sym 2, at 0x0b85f2a0, mask 0x04 and CE sym 2, at 0x1b85f4e0, mask 0x05 had three parameters each and have also been aggregated into the same template CE sym , at , mask .
To reduce the resources utilized by the model, each template is replaced by its index in the dictionary. The resulting template index sequence is then split into sequences of a specified length, in this case three. The results of splitting the sample input data are two log template sequences: [0, 1, 2] and [1, 2, 0].
The next step is to represent each log template (log event) in the sequence in vector form. The fastText model stores a vector representation of each template observed during training, making it possible to convert the template index into a vector from the Euclidean space. The exceptions are log templates that were not present in the training dataset and were aggregated to the wildcard template (). The fastText model could not learn the context in which such templates occur, so it assigns them a vector filled with zeros. The vector representation of a given sequence of logs is a coordinate matrix consisting of vectors corresponding to each log event. The last step before anomaly detection is to transform the coordinate matrix of each sequence into a vector by averaging the rows. Using the first sequence as an example, the coordinate matrix was averaged to the following vector: [0.625, 1.000, 0.625, 0.875, 0.875].
Finally, the averaged sequence vector is given as the input to one of the binary classifiers, which, after a supervised learning process on the training dataset, is able to evaluate whether a given sequence vector is anomalous.
4. Experiments
In this section, we present the experiments conducted. We describe the dataset used, the experimental environment, and the metrics used for the evaluation of our solution.
4.1. Dataset
The approach presented in this paper was validated on the Blue Gene/L (BGL) dataset, prepared by the Usenix organization [36]. Blue Gene/L is an IBM supercomputer with 131,072 processors and 32,768 GB of RAM. Logs from this computer were collected over 215 days. The log file consists of 4,747,963 log lines, which amounts to 708 MB. The dataset is highly imbalanced. It contains 348,460 anomalous log lines, that is 7.3% of the total dataset. Oliner and Stearley [40] identified 41 anomaly classes in the BGL dataset through semi-automated log filtering combined with close collaboration with system administrators. The most common anomaly, accounting for 44% of all cases (152,734 log lines), is the KERNDTLB alert, the typical descriptive message of which is: data TLB error interrupt. The next 48% of all anomalies (168,011 log lines) are: KERNSTOR, APPSEV, KERNMNTF, and KERNTERM. For the remaining 8% of anomalous log lines, there are 36 categories of alerts that occur much less frequently. Details of all alerts are described in the above-mentioned paper.
Listing 3 presents sample raw log lines from the BGL dataset. The last entry is an anomaly and reports a hardware interrupt to the data storage medium—KERNSTOR alert category.
Listing 3.
Example logs from the BGL dataset.
1117838570 2005.06.03 R02-M1-N0-C:J12-U11 2005-06-03-15.42.50.363779 R02-M1-N0-C:J12-U11 RAS KERNEL INFO instruction cache parity error corrected
1117973853 2005.06.05 R30-M0-NB-C:J14-U01 2005-06-05-05.17.33.516470 R30-M0-NB-C:J14-U01 RAS KERNEL INFO generating core.1280
1118769430 2005.06.14 R27-M1-NC-C:J06-U01 2005-06-14-10.17.10.932971 R27-M1-NC-C:J06-U01 RAS KERNEL FATAL instruction address: 0x00004ed8
KERNSTOR 1118769430 2005.06.14 R24-M1-N0-C:J14-U012005-06-14-10.17.10.952598 R24-M1-N0-C:J14-U01 RAS KERNEL FATAL data storage interrupt
4.2. Experimental Environment
All experiments were run on a machine with an Intel(R) Core(TM) i5-4690K CPU @ 3.50 GHz processor and 8 GB RAM. The proposed solution was implemented in the Python programming language (Version 3.9.7) with the support of the following external libraries and modules:
- Modified Drain3 (Version 0.9.9) [37] log-parser module;
- Re [41]—regular expression library,
- NumPy (Version 1.21.5) [42]—module for scientific computing;
- Pandas (Version 1.4.1) [43]—Python Data Analysis Library;
- fastText module (Version 0.9.2) [44], providing an implementation of the feature extraction model;
- Scikit-learn (Version 1.0.2) [45], providing an implementation of the classification algorithms.
The Drain parser is configurable with a number of parameters that affect the log parsing process. The two most important parameters are the maximum depth of the parsing tree and the simth parameter, which is the threshold value of the log and template similarity metric that must be exceeded for the log to be assigned to a particular template group.
For the experiments, the maximum tree depth was set to 3 and the similarity threshold was set to 0.3, following the suggestions from [35].
Furthermore, the parameter specifying the maximum number of child nodes in the parsing tree was set to the default value—100. Experiments with the modification of the above parameters did not improve the results.
During the training phase, the training set of logs was parsed by the Drain parser, which creates a set of log templates—a dictionary. However, in validation mode, such behavior is undesirable. In that phase, Drain’s objective is to parse incoming logs and assign them to suitable template groups if their metrics exceed the similarity threshold and, if not, assign them to separate single groups instead of creating a new one for each unknown template. The reason for that is that the feature extraction model is only able to represent the log templates in vector form if they were present in the training dataset. Therefore, Drain was modified so that it could create the wildcard template, which prevented the creation of new templates.
During the parsing process of the training dataset on each fold, Drain created a dictionary containing on average 1551 log templates. In the validation phase, the parser identified on average 266 logs that did not match any template. They were aggregated to the wildcard template “”. The remaining logs from the validation dataset were assigned to suitable log template groups created during the training phase.
After the log parsing process, the log templates were split into non-overlapping log sequences of various lengths—from 3 to 100. Table 1 provides a comparison of the number of sequences depending on the length of the window. The split into training and testing sets was performed as part of the cross-validation process using the repeated stratified K-fold method. This validation method preserves the class ratios in both training and validation datasets, making it more suitable for model validation on imbalanced datasets than the classic train/test approach. The validator was configured to create five data splits and make two iterations.
fastText, the feature extraction algorithm, was configured to map words into a 100-dimensional feature space. Moreover, the parameter for the minimal number of word occurrences was set to 1, and the parameter for the maximum length of character n-grams was set to 0. Character n-grams, which are strings of n consecutive characters that make up a word, are used by the fastText algorithm to embed words that do not occur in the dictionary, based on syntactic similarity. By setting the maximum length of character n-grams to 0, we configured the fastText algorithm not to use this functionality. In our model, log templates are replaced by their indexes in the dictionary, which would cause the above functionality to falsely correlate the syntactic similarity of template indexes—for example, templates with indexes 200 and 201, despite their syntactic similarity, may not necessarily show semantic similarity at all. Extracting features from log templates is a task based solely on detecting semantic dependencies. Furthermore, word embedding based on character n-grams, according to experiments, contributes to the deterioration of the accuracy of semantic dependency detection [46]. As a consequence of such a configuration, when an unknown word is encountered, the model is unable to compute its vector representation, so it replaces it with a vector of zeros.
The final anomaly detection process was performed by binary classifiers configured as follows:
- GNB—with default configuration;
- DT—with Gini impurity as a measure of the quality of a split;
- RF—with 100 trees in the forest and the Gini impurity as a measure of the quality of a split;
- AB—with 100 estimators, SAMME.R real boosting algorithm, and learning rate of 1.0;
- XB—with logistic regression for binary classification, negative log-likelihood evaluation metrics for validation data, and configured weight scaling as the sum of negative instances divided by the sum of positive instances;
- MLP—with 100 neurons in the hidden layer, the Adam optimizer, and rectified linear unit (ReLU) as the activation function.
4.3. Evaluation Metrics
Let us define the following basic terms:
- True positives (TP)—number of correctly predicted malicious log entries;
- False positives (FP)—number of normal log entries classified as anomalies (false alarms);
- True negatives (TN)—number of correctly predicted normal log entries;
- False negatives (FN)—number of malicious log entries classified as normal log entries.
The performance of our models was analyzed using several metrics:
- Precision, which indicates what percentage of all positive predictions were actually malicious log entries:
- Recall, which is a fraction of true positives among all malicious log entries:
- F1-score, which considers both precision and recall and is their harmonic mean:
We also analyzed recall vs. precision (PR) curves, which are effective diagnostic tools for binary classification models built on imbalanced data. Apart from this, we calculated the area under the PR curve (PR AUC), which is the average of precision scores calculated for each recall threshold. Additionally, we present the receiver operator characteristic (ROC) curves, which display the FP rate vs. TP rate, to observe the performance of a given model on the positive class. Finally, the area under the ROC Curve (ROC AUC) delivered single evaluation scores for the models across all threshold values.
5. Results
In this section, we present the results of our experiments, starting from the visualization of the feature extraction process, through the results of experiments with various window lengths. We conclude with the results of actual anomaly detection using the proposed method.
5.1. Feature Extraction Results
The fastText algorithm used in this work was configured to create vectors of length 100. Figure 4 presents visualized example vector representations of all templates in the dictionary, which were used to capture semantic trends in the data. The number of dimensions was reduced to two using a combination of the incremental principal components analysis (IPCA) and t-distributed stochastic neighbor embedding (t-SNE) algorithms, allowing word embeddings to be represented on a plane.
Between vectors of log templates occurring in similar contexts, the Euclidean distance is smaller than the distance between those occurring in different contexts. The context of log templates is a semantic relationship between them in a sequence. For example, log templates with indexes 310 and 427 have respective text representations “external input interrupt (unit = 0x02 bit = 0x00): uncorrectable torus error” and “Torus non-recoverable error DCRs follow”. Both log templates describe similar log messages related to non-recoverable torus error; therefore, the Euclidean distance between their vector representations is very small.
5.2. Impact of Sequence Length
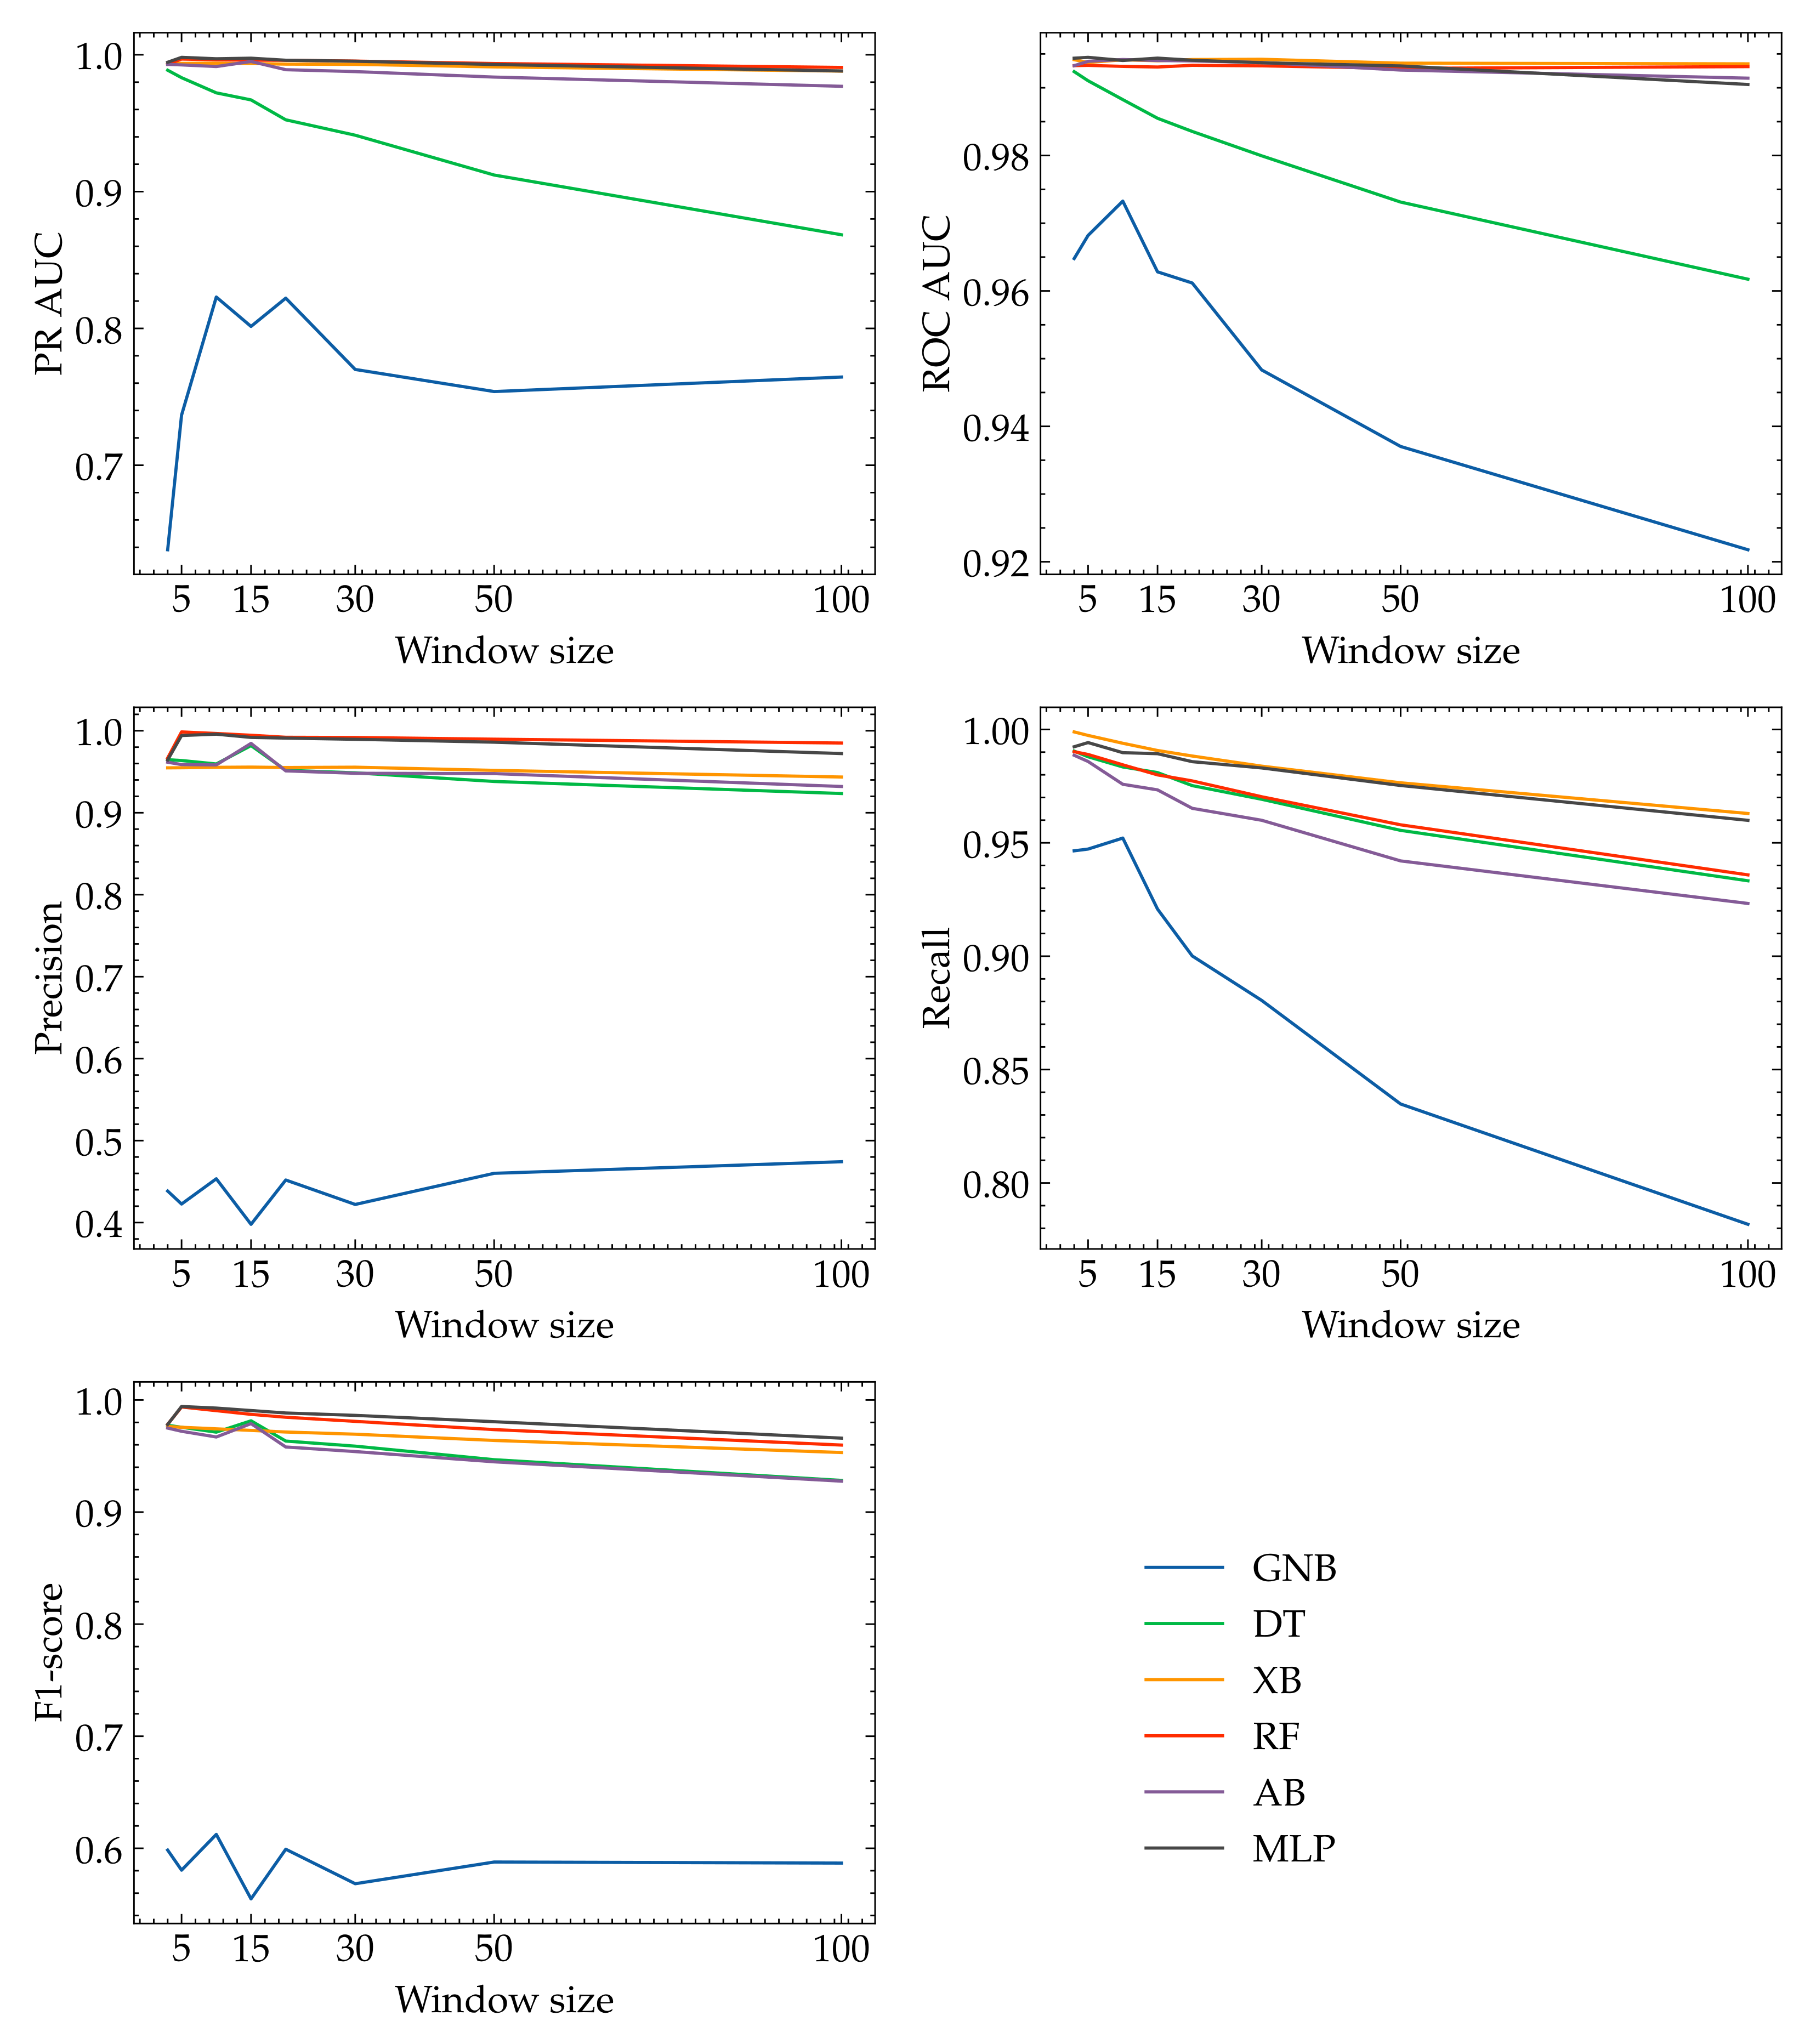
Figure 5 presents graphs of evaluation metrics as a function of sequence length. The metrics precision, recall, PR AUC, and ROC AUC were calculated for all the classifiers and the respective window lengths: 3, 5, 10, 15, 20, 30, 50, 100.
In general, a larger window length contributes to decreased values for the evaluation metrics. This is due to the extended semantic context of a sequence, which makes the task of anomaly detection more difficult for binary classifiers. The individual features responsible for anomalies are less important in longer sequences, as a result of the transformation of template vectors to a single sequence vector through averaging. However, there are some exceptions to this pattern. For example, we observed an increase in the precision and F1-score metrics for the DT and AB algorithms and a window length of 15. For the RF and MLP classifiers, we also observed an increase in the values of the precision and F1-score metrics, but for a window length of five. For the GNB algorithm, as the window length increases, we do not see a consistent trend of change in the values of all metrics. On the contrary, in this case, the changes are spiking, and for some metrics, we even see an increasing trend. In summary, the length of the window should be chosen according to this, as it is one of the factors determining the performance of the model.
5.3. Anomaly Detection Results for Optimal Sequence Length
We conducted an investigation of the performance of binary classifiers, given a sequence length of five log templates and feature extraction vector of length 100. Table 2 provides a summary of evaluation metrics as a result of experiments on the BGL dataset. Each evaluation metric score is an arithmetic average of the values obtained during the cross-validation process.
Clearly, the MLP classifier achieved the best overall performance, with an F1-score of over 99.4%. Other binary classifiers, with the exception of GNB, scored slightly lower, but still with very good evaluation metrics. All of them obtained an F1-score above 97%. Nevertheless, the XB algorithm recognized the highest number of malicious logs (99.74%), and RF was the most precise algorithm (99.86% of the predicted positives were true positives).
The GNB algorithm performed worst on the task of classifying anomalous template sequences. This algorithm assumes strong independence between features. However, the relationships between logs in the sequence (features) are important in the system log anomaly detection process, and apparently, the GNB classifier is not able to discover them.
6. Discussion
Table 3 provides a comparison of F1-scores and AUC metrics obtained from our experiments and those derived from the LogEvent2Vec paper. Our best results are significantly better than those obtained by the authors of the LogEvent2Vec approach. The experimental environments were configured in the same way, except for the length of the sequences and model validation method. The authors of LogEvent2Vec divided the input data into sequences of length 5000, resulting in 943 sequences split randomly into training and validation subsets in a ratio of 90 to 10. In this paper, we used much shorter sequences: with the length ranging from 3 to 100 log templates, resulting in a total number of sequences ranging from 1,582,654 to 47,479. To validate a model, we used the repeated stratified K-fold cross-validation method, which is much more suitable for the imbalance classification task than is the classic train/test split validation method used by the authors of the LogEvent2Vec approach. Repeated stratified K-fold cross-validation sustains the class distribution in each fold, which results in an estimate of model performance that is neither too “optimistic” nor too “pessimistic”. For the most adequate comparison, the feature vector length of 100 was preserved.
Splitting the dataset into shorter sequences implies a greater number of sequences, which in turn improves the model training data. A narrower semantic context allows binary classifiers to better identify the features responsible for anomalies and decreases the number of false negatives. Anomalies, by definition, are rare; thus, in long sequences, the features responsible for the anomaly are averaged over the others, making the task of binary classification more difficult and prone to errors.
Furthermore, long log template sequences reduce the usefulness of the model in production environments. Usually, any sequence classified by the model as anomalous is forwarded to a system administrator, whose task is to identify whether it is a false-positive. With a sequence length of 5000 log templates, finding a potentially anomalous log or log series within 5000 entries may be very tedious and time consuming. The model presented in this paper can identify much more precisely which logs should be manually analyzed, making it more suitable for use in production environments.
7. Conclusions
In our article, we discussed the problem of detecting anomalies in system log files using an approach known from the NLP domain. We described an improved version of the LogEvent2Vec algorithm, presented first in [9]. We proposed a significant shortening of the analysis window, which both increased the accuracy of anomaly detection and made further analysis of suspicious sequences much easier. In contrast to the original paper, we experimented with various classifiers, such as GNB, DT, XB, RF, AB, and MLP. We showed that selecting an optimal classifier (in this case, MLP) and a short log sequence gave an excellent result. The improved version of the algorithm yielded the best F1-score of 0.997, compared to 0.886 in the original version of the algorithm.
Future work on this topic may include incorporating feedback from system administrators. The administrator, after manual verification of sequences marked by the model as anomalous, would have a set of false-positive sequences that could be used to retrain the model so that similar sequences are marked correctly in the future. We also plan to test our approach using other open-source log datasets, such as HDFS [47], Thunderbird, and Spirit [40], to verify how general our method is.
Moreover, further work may involve adapting the architecture so that the learning process runs on anomaly-free data. As a result, the model will learn the normal operation of the system, and thus be able to determine which logs stand out from these characteristics. Such an approach, presented by the authors of DeepLog [24], would allow for the detection of new types of anomalies in the analyzed systems.
Author Contributions
Conceptualization, P.R. and A.J.; methodology, P.R., K.W. and A.J.; software, P.R.; validation, P.R., K.W. and A.J.; formal analysis, P.R.; investigation, P.R. and A.J.; resources, P.R.; data curation, P.R.; writing—original draft preparation, P.R., K.W. and A.J.; writing—review and editing, P.R., K.W. and A.J.; visualization, P.R.; supervision, A.J.; project administration, A.J.; funding acquisition, A.J. All authors have read and agreed to the published version of the manuscript.
Funding
This research was supported by the SIMARGL Project–Secure Intelligent Methods for Advanced RecoGnition of malware and stegomalware, with the support of the European Commission and the Horizon 2020 Program, under Grant Agreement No. 833042.
Institutional Review Board Statement
Not applicable.
Informed Consent Statement
Not applicable.
Data Availability Statement
The code used for experiments is publicly available at https://github.com/V0id01/LogAnomalyDetection (accessed on 12 May 2022).
Conflicts of Interest
The authors declare no conflict of interest.
References
- Xu, W.; Huang, L.; Fox, A.; Patterson, D.; Jordan, M.I. Detecting Large-Scale System Problems by Mining Console Logs. In Proceedings of the ACM SIGOPS 22nd Symposium on Operating Systems Principles; Association for Computing Machinery: New York, NY, USA, 2009; pp. 117–132. [Google Scholar] [CrossRef] [Green Version]
- Oliner, A.; Ganapathi, A.; Xu, W. Advances and Challenges in Log Analysis. Commun. ACM 2012, 55, 55–61. [Google Scholar] [CrossRef]
- Svacina, J.; Raffety, J.; Woodahl, C.; Stone, B.; Cerny, T.; Bures, M.; Shin, D.; Frajtak, K.; Tisnovsky, P. On Vulnerability and Security Log Analysis: A Systematic Literature Review on Recent Trends. In Proceedings of the International Conference on Research in Adaptive and Convergent Systems; Association for Computing Machinery: New York, NY, USA, 2020; pp. 175–180. [Google Scholar] [CrossRef]
- He, S.; He, P.; Chen, Z.; Yang, T.; Su, Y.; Lyu, M.R. A Survey on Automated Log Analysis for Reliability Engineering. ACM Comput. Surv. 2021, 54, 1–37. [Google Scholar] [CrossRef]
- Müller, A.; Miinz, G.; Carle, G. Collecting router information for error diagnosis and troubleshooting in home networks. In Proceedings of the 2011 IEEE 36th Conference on Local Computer Networks, Bonn, Germany, 4–7 October 2011; pp. 764–769. [Google Scholar] [CrossRef] [Green Version]
- Brandao, A.; Georgieva, P. Log Files Analysis For Network Intrusion Detection. In Proceedings of the 2020 IEEE 10th International Conference on Intelligent Systems (IS), Varna, Bulgaria, 28–30 August 2020; pp. 328–333. [Google Scholar] [CrossRef]
- He, S.; Zhu, J.; He, P.; Lyu, M.R. Experience Report: System Log Analysis for Anomaly Detection. In Proceedings of the 2016 IEEE 27th International Symposium on Software Reliability Engineering (ISSRE), Ottawa, ON, Canada, 23–27 October 2016; pp. 207–218. [Google Scholar] [CrossRef]
- Savitha, K.S.; Ms, V. Mining of Web Server Logs in a Distributed Cluster Using Big Data Technologies. Int. J. Adv. Comput. Sci. Appl. 2014, 5, 137–142. [Google Scholar] [CrossRef] [Green Version]
- Wang, J.; Tang, Y.; He, S.; Zhao, C.; Sharma, P.; Alfarraj, O.; Tolba, A. LogEvent2vec: LogEvent-to-Vector Based Anomaly Detection for Large-Scale Logs in Internet of Things. Sensors 2020, 20, 2451. [Google Scholar] [CrossRef] [PubMed]
- Chandola, V.; Banerjee, A.; Kumar, V. Anomaly Detection: A Survey. ACM Comput. Surv. 2009, 41, 1–58. [Google Scholar] [CrossRef]
- Grace, L.K.J.; Maheswari, V.; Nagamalai, D. Web Log Data Analysis and Mining. In Advanced Computing; Meghanathan, N., Kaushik, B.K., Nagamalai, D., Eds.; Springer: Berlin/Heidelberg, Germany, 2011; pp. 459–469. [Google Scholar]
- Breier, J.; Branišová, J. Anomaly Detection from Log Files Using Data Mining Techniques. In Information Science and Applications; Kim, K.J., Ed.; Springer: Berlin/Heidelberg, Germany, 2015; pp. 449–457. [Google Scholar]
- Zhang, S.; Zhang, Y.; Chen, Y.; Dong, H.; Qu, X.; Song, L.; Liu, Y.; Meng, W.; Luo, Z.; Bu, J.; et al. PreFix: Switch Failure Prediction in Datacenter Networks. ACM Sigmetrics Perform. Eval. Rev. 2018, 2, 1–29. [Google Scholar] [CrossRef]
- Khatuya, S.; Ganguly, N.; Basak, J.; Bharde, M.; Mitra, B. ADELE: Anomaly Detection from Event Log Empiricism. In Proceedings of the IEEE Conference on Computer Communications (INFOCOM 2018), Honolulu, HI, USA, 16–19 April 2018; pp. 2114–2122. [Google Scholar] [CrossRef]
- Bertero, C.; Roy, M.; Sauvanaud, C.; Tredan, G. Experience Report: Log Mining Using Natural Language Processing and Application to Anomaly Detection. In Proceedings of the 2017 IEEE 28th International Symposium on Software Reliability Engineering (ISSRE), Toulouse, France, 23–26 October 2017. [Google Scholar] [CrossRef] [Green Version]
- Mikolov, T.; Chen, K.; Corrado, G.; Dean, J. Efficient Estimation of Word Representations in Vector Space. arXiv 2013, arXiv:1301.3781. [Google Scholar]
- Pennington, J.; Socher, R.; Manning, C. GloVe: Global Vectors for Word Representation. In Proceedings of the Conference on Empirical Methods in Natural Language Processing (EMNLP 2014), Doha, Qatar, 25–29 October 2014; pp. 1532–1543. [Google Scholar] [CrossRef]
- Bojanowski, P.; Grave, E.; Joulin, A.; Mikolov, T. Enriching word vectors with subword information. Trans. Assoc. Comput. Linguist. 2017, 5, 135–146. [Google Scholar] [CrossRef] [Green Version]
- Meng, W.; Liu, Y.; Huang, Y.; Zhang, S.; Zaiter, F.; Chen, B.; Pei, D. A Semantic-aware Representation Framework for Online Log Analysis. In Proceedings of the 2020 29th International Conference on Computer Communications and Networks (ICCCN), Honolulu, HI, USA, 3–6 August 2020; pp. 1–7. [Google Scholar] [CrossRef]
- Li, K.L.; Huang, H.K.; Tian, S.F.; Xu, W. Improving one-class SVM for anomaly detection. In Proceedings of the International Conference on Machine Learning and Cybernetics (ICLMC), Xi’an, China, 5 November 2003; Volume 5, pp. 3077–3081. [Google Scholar] [CrossRef]
- Zhang, W.; Chen, L. Web Log Anomaly Detection Based on Isolated Forest Algorithm. In Proceedings of the IEEE 14th International Conference on Intelligent Systems and Knowledge Engineering (ISKE), Dalian, China, 14–16 November 2019; pp. 755–759. [Google Scholar] [CrossRef]
- Henriques, J.; Caldeira, F.; Cruz, T.; Simões, P. Combining K-Means and XGBoost Models for Anomaly Detection Using Log Datasets. Electronics 2020, 9, 1164. [Google Scholar] [CrossRef]
- Ying, S.; Wang, B.; Wang, L.; Li, Q.; Zhao, Y.; Shang, J.; Huang, H.; Cheng, G.; Yang, Z.; Geng, J. An Improved KNN-Based Efficient Log Anomaly Detection Method with Automatically Labeled Samples. ACM Trans. Knowl. Discov. Data 2021, 15, 1–22. [Google Scholar] [CrossRef]
- Du, M.; Li, F.; Zheng, G.; Srikumar, V. DeepLog: Anomaly Detection and Diagnosis from System Logs through Deep Learning. In Proceedings of the ACM SIGSAC Conference on Computer and Communications Security, Dallas, TX, USA, 30 October–3 November 2017. [Google Scholar] [CrossRef]
- Chen, Z.; Liu, J.; Gu, W.; Su, Y.; Lyu, M.R. Experience Report: Deep Learning-based System Log Analysis for Anomaly Detection. arXiv 2021, arXiv:2107.05908. [Google Scholar]
- Vaswani, A.; Shazeer, N.; Parmar, N.; Uszkoreit, J.; Jones, L.; Gomez, A.N.; Kaiser, L.U.; Polosukhin, I. Attention is All you Need. In Advances in Neural Information Processing Systems; Guyon, I., Luxburg, U.V., Bengio, S., Wallach, H., Fergus, R., Vishwanathan, S., Garnett, R., Eds.; Curran Associates, Inc.: New York, NY, USA, 2017; Volume 30. [Google Scholar]
- Huang, Z.; Xu, W.; Yu, K. Bidirectional LSTM-CRF Models for Sequence Tagging. arXiv 2015, arXiv:1508.01991. [Google Scholar]
- Chen, Y.; Luktarhan, N.; Lv, D. LogLS: Research on System Log Anomaly Detection Method Based on Dual LSTM. Symmetry 2022, 14, 454. [Google Scholar] [CrossRef]
- Guo, H.; Yuan, S.; Wu, X. LogBERT: Log Anomaly Detection via BERT. In Proceedings of the 2021 International Joint Conference on Neural Networks (IJCNN), Shenzhen, China, 18–22 July 2021; pp. 1–8. [Google Scholar] [CrossRef]
- Devlin, J.; Chang, M.W.; Lee, K.; Toutanova, K. BERT: Pre-training of deep bidirectional transformers for language understanding. arXiv 2018, arXiv:1810.04805. [Google Scholar]
- Le, V.H.; Zhang, H. Log-based Anomaly Detection without Log Parsing. In Proceedings of the 36th IEEE/ACM International Conference on Automated Software Engineering (ASE), Melbourne, Australia, 15–19 November 2021; pp. 492–504. [Google Scholar] [CrossRef]
- Duan, X.; Ying, S.; Yuan, W.; Cheng, H.; Yin, X. QLLog: A log anomaly detection method based on Q-learning algorithm. Inf. Process. Manag. 2021, 58, 102540. [Google Scholar] [CrossRef]
- Chen, R.; Zhang, S.; Li, D.; Zhang, Y.; Guo, F.; Meng, W.; Pei, D.; Zhang, Y.; Chen, X.; Liu, Y. LogTransfer: Cross-System Log Anomaly Detection for Software Systems with Transfer Learning. In Proceedings of the IEEE 31st International Symposium on Software Reliability Engineering (ISSRE), Coimbra, Portugal, 12–15 October 2020; pp. 37–47. [Google Scholar] [CrossRef]
- Yadav, R.B.; Kumar, P.S.; Dhavale, S.V. A Survey on Log Anomaly Detection using Deep Learning. In Proceedings of the 8th International Conference on Reliability, Infocom Technologies and Optimization (Trends and Future Directions) (ICRITO), Noida, India, 4–5 June 2020; pp. 1215–1220. [Google Scholar] [CrossRef]
- He, P.; Zhu, J.; Zheng, Z.; Lyu, M.R. Drain: An Online Log Parsing Approach with Fixed Depth Tree. In Proceedings of the IEEE International Conference on Web Services (ICWS), Honolulu, HI, USA, 25–30 June 2017. [Google Scholar] [CrossRef]
- Usenix. The HPC4 Data. Available online: https://www.usenix.org/cfdr-data#hpc4 (accessed on 20 February 2022).
- IBM. Drain3. Available online: https://github.com/IBM/Drain3 (accessed on 10 January 2022).
- Kim, E. Optimize Computational Efficiency of Skip-Gram with Negative Sampling. Available online: https://aegis4048.github.io/optimize_computational_efficiency_of_skip-gram_with_negative_sampling (accessed on 13 February 2022).
- Rong, X. word2vec Parameter Learning Explained. arXiv 2016, arXiv:1411.2738. [Google Scholar]
- Oliner, A.; Stearley, J. What Supercomputers Say: A Study of Five System Logs. In Proceedings of the 37th Annual IEEE/IFIP International Conference on Dependable Systems and Networks (DSN’07), Edinburgh, UK, 25–28 June 2007; pp. 575–584. [Google Scholar] [CrossRef]
- Python Software Foundation. Re. Available online: https://docs.python.org/3/library/re.html (accessed on 15 January 2022).
- Open-Source Python Library. Numpy. Available online: https://numpy.org/about/ (accessed on 15 January 2022).
- McKinney, W. Pandas. Available online: https://pandas.pydata.org/ (accessed on 15 January 2022).
- Facebook. fastText. Available online: https://fasttext.cc/ (accessed on 19 January 2022).
- Cournapeau, D. Scikit-Learn. Available online: https://scikit-learn.org/ (accessed on 20 January 2022).
- Rathore, M. Comparison of FastText and Word2Vec. Available online: https://markroxor.github.io/gensim/static/notebooks/Word2Vec_FastText_Comparison.html (accessed on 8 January 2022).
- He, S.; Zhu, J.; He, P.; Lyu, M.R. Loghub: A Large Collection of System Log Datasets towards Automated Log Analytics. arXiv 2020, arXiv:2008.06448. [Google Scholar]
Figure 1.
Model architecture for detecting anomalies in log files.

Figure 2.
Cbow model architecture, based on [39].
Figure 2.
Cbow model architecture, based on [39].

Figure 3.
Scheme of detecting anomalies in system log files.

Figure 4.
Visualized embeddings of BGL log templates (each circle denotes one template).

Figure 5.
Evaluation metrics for various window lengths.


Table 1.
Impact of sequence length on dataset size.
| Sequence Length | No. of Sequences | |
|---|---|---|
| Training Set (80%) | Testing Set (20%) | |
| 3 | 1,266,123 | 316,531 |
| 5 | 759,674 | 189,918 |
| 10 | 379,837 | 94,959 |
| 15 | 253,224 | 63,306 |
| 20 | 189,918 | 47,480 |
| 30 | 126,612 | 31,653 |
| 50 | 75,967 | 18,992 |
| 100 | 37,983 | 9496 |
Table 2.
Classification results for various classifiers.
| Classifier | PR AUC | ROC AUC | Precision | Recall | F1-Score |
|---|---|---|---|---|---|
| GNB | 0.7366 | 0.9682 | 0.4226 | 0.9472 | 0.5805 |
| DT | 0.9833 | 0.9910 | 0.9637 | 0.9879 | 0.9757 |
| XB | 0.9937 | 0.9937 | 0.9549 | 0.9974 | 0.9757 |
| RF | 0.9969 | 0.9933 | 0.9986 | 0.9890 | 0.9937 |
| AB | 0.9926 | 0.9939 | 0.9587 | 0.9859 | 0.9721 |
| MLP | 0.9981 | 0.9945 | 0.9942 | 0.9942 | 0.9942 |
Table 3.
Evaluation metrics’ comparison with LogEvent2Vec (W denotes the window length for which the best results were obtained).
Table 3.
Evaluation metrics’ comparison with LogEvent2Vec (W denotes the window length for which the best results were obtained).
| F1-Score | AUC | |||
|---|---|---|---|---|
| Classifier | LogEvent2Vec | Our Approach | LogEvent2Vec | Our Approach |
| GNB | 0.778 (W = 5000) | 0.612 (W = 10) | 0.929 (W = 5000) | 0.973 (W = 10) |
| RF | 0.886 (W = 5000) | 0.994 (W = 5) | 0.959 (W = 5000) | 0.993 (W = 5) |
| MLP | 0.829 (W = 5000) | 0.994 (W = 5) | 0.911 (W = 5000) | 0.994 (W = 5) |
Publisher’s Note: MDPI stays neutral with regard to jurisdictional claims in published maps and institutional affiliations. |
© 2022 by the authors. Licensee MDPI, Basel, Switzerland. This article is an open access article distributed under the terms and conditions of the Creative Commons Attribution (CC BY) license (https://creativecommons.org/licenses/by/4.0/).
Share and Cite
MDPI and ACS Style
Ryciak, P.; Wasielewska, K.; Janicki, A. Anomaly Detection in Log Files Using Selected Natural Language Processing Methods. Appl. Sci. 2022, 12, 5089. https://0-doi-org.brum.beds.ac.uk/10.3390/app12105089
AMA Style
Ryciak P, Wasielewska K, Janicki A. Anomaly Detection in Log Files Using Selected Natural Language Processing Methods. Applied Sciences. 2022; 12(10):5089. https://0-doi-org.brum.beds.ac.uk/10.3390/app12105089
Chicago/Turabian StyleRyciak, Piotr, Katarzyna Wasielewska, and Artur Janicki. 2022. "Anomaly Detection in Log Files Using Selected Natural Language Processing Methods" Applied Sciences 12, no. 10: 5089. https://0-doi-org.brum.beds.ac.uk/10.3390/app12105089
Note that from the first issue of 2016, this journal uses article numbers instead of page numbers. See further details here.