
Feature Residual Analysis Network for Building Extraction from Remote Sensing Images

1
Jiangsu Key Laboratory of Big Data Analysis Technology, Nanjing University of Information Science and Technology, Nanjing 210044, China
2
School of Management Science and Engineering, Nanjing University of Information Science and Technology, Nanjing 210044, China
*
Author to whom correspondence should be addressed.
Appl. Sci. 2022, 12(10), 5095; https://0-doi-org.brum.beds.ac.uk/10.3390/app12105095
Submission received: 4 April 2022
/
Revised: 8 May 2022
/
Accepted: 16 May 2022
/
Published: 18 May 2022
(This article belongs to the Special Issue Big Data Analysis and Management Based on Deep Learning)
Abstract
:Building extraction of remote sensing images is very important for urban planning. In the field of deep learning, in order to extract more detailed building features, more complex convolution operations and larger network models are usually used to segment buildings, resulting in low efficiency of automatic extraction. The existing network is difficult to balance the extraction accuracy and extraction speed. Considering the segmentation accuracy and speed, a Feature Residual Analysis Network (FRA-Net) is proposed to realize fast and accurate building extraction. The whole network includes two stages: encoding and decoding. In the encoding stage, a Separable Residual Module (SRM) is designed to extract feature information and extract building features from remote sensing images, avoiding the use of large convolution kernels to reduce the complexity of the model. In the decoding stage, the SRM is used for information decoding, and a multi-feature attention module is constructed to enhance the effective information. The experimental results on the LandCover dataset and Massachusetts Buildings dataset show that the reasoning speed has been greatly improved without reducing the segmentation accuracy.
1. Introduction
The extraction of buildings is one of the important applications of remote sensing technology. Building extraction also has important applications in land survey, military reconnaissance, and so on. Especially when it comes to issues related to sustainable development, such as river governance, urban planning [1], urban integration [2], and rural construction, architectural extraction can effectively help us provide more effective coping strategies. In turn, corresponding measures can be taken to promote the social balance and rationality of infrastructure construction.
1.1. Development History
In the past few decades, some traditional methods have been used for the extraction of buildings, which can be roughly divided into the following categories: object-based methods [3,4], edge-based methods [5], and shadow-based methods [6,7]. These traditional methods are mainly based on manually extracted features and utilize machine learning models for classification. This kind of method is difficult to achieve effective extraction of remote sensing image features, so the generalization ability is very low, and it is prone to serious overfitting in the training process, resulting in low accuracy.
With the development of deep learning techniques, convolutional neural networks have shown excellent performance in image classification, object detection, semantic segmentation, and object tracking [8,9]. Traditional machine learning needs to extract features manually and then classify them according to the features. The method based on artificial features is difficult to extract effective features for complex images; that is, the efficiency of feature extraction is low. The essence of deep learning is an excellent feature extractor, which can extract features effectively according to the task. Therefore, deep learning has more advantages than traditional machine learning in dealing with segmentation problems. With the improvement of computing power and the continuous increase of the amount of data, some classic deep neural networks for classification, such as Alex Neural Network (AlexNet) [10], Visual Geometry Group’s Network (VGGNet) [11], Residual Network (ResNet) [12], Densely Connected Convolutional Networks (DenseNet) [13], and Inception Net series [14,15,16], were successively proposed and applied to remote sensing image analysis. Compared with traditional methods for extracting buildings from remote sensing images, convolutional neural networks can extract deeper features from remote sensing images [17]. However, the above-mentioned deep neural network only predicts the remote sensing images from class to class and lacks the precise extraction of the image position and boundary. In contrast, semantic segmentation realizes image pixel-to-pixel prediction, which is more efficient and accurate in remote sensing images. At present, the scale of high-definition remote sensing data of many satellites is very large, so computational efficiency becomes very important. Although the operation efficiency can be improved by hardware, it is also very important to improve the operation efficiency by changing the algorithm structure.
1.2. Prevalent Methodologies
Semantic segmentation algorithms can classify images at the pixel level, extract more detailed features [18,19,20,21], and have the characteristics of high recognition rate and fast speed. Some of the semantic segmentation algorithms are performed on datasets, such as scene datasets, indoor datasets, and human and animal datasets. Compared with these datasets, the extraction of buildings in remote sensing images has the characteristics of building occlusion, complex landform, and dense target objects. Therefore, traditional semantic segmentation algorithms cannot solve these problems well, and researchers have improved the algorithm model accordingly. It is mainly aimed at the optimization of the model structure and post-processing of the model results [22]. Lu et al. [23] proposed a richer convolutional feature network (Richer Convolution Features Network, RCF) to detect building edges from high-resolution remote sensing images, making full use of semantic information and detail information for edge detection. In order to solve the problem of missed detection of small objects in building extraction, Zhang et al. [24] used the multi-scale fusion of feature information in the decoding stage to construct a Multiscale Decoding Network (MSDNet). However, it also generates a large number of parameters, which increases the prediction time of remote sensing images. Pan et al. [25] combined spatial and channel attention mechanisms with generative adversarial networks [26] to better extract remote sensing images of buildings with irregular landforms, but also increased the complexity and computational complexity of the model. In order to deal with the complex morphology of buildings and roads in remote sensing images, Zhang et al. [27] proposed a universal network for building and road segmentation and constructed a dense multi-convolution module to be added to the encoding stage of the network. In the process of downsampling, more detailed information is extracted, but it cannot be recovered in more detail in the decoding stage. Ji et al. [28] improved the UNet network and proposed the SiUNet network, which solved the recognition problem of a large area of buildings covered with only a small area of background in remote sensing images. In this work, they empirically found that all of the present methods did not solve the scale problem well, especially for large buildings. Many points on a large roof are often wrongly classified as background even when the roof has the same color and texture. SiUNet improved the scale invariance of the algorithm for extracting buildings of different sizes from remote sensing data, as they found large buildings hinder a high performance of FCN-based methods on remote sensing building detection. Due to the rapid development of remote sensing technology, the pixel count of most remote sensing images is very high. The previous semantic segmentation algorithms for building extraction from remote sensing images mainly improve the extraction accuracy by increasing the depth of the network model. However, a large number of model parameters and calculations are also generated. The automatic extraction of buildings from high-resolution remote sensing images is very slow, consumes a lot of resources, and leads to low work efficiency.
Aiming at improving the low efficiency of automatic building extraction, this paper proposes an end-to-end FRA-Net to balance the accuracy and speed of building extraction. The whole network is divided into two processes, upsampling and downsampling. In the upsampling process, the use of large convolution kernels is avoided to reduce the complexity of the model. At the same time, depthwise separable convolution [29] is introduced, and an SRM is designed to extract feature information. The information decoding using the SRM continues during the upsampling process. Since there is a lot of complex information in remote sensing images of buildings, it includes useless information. To selectively enhance useful information [25], our improved Multi-feature Attention (MFA) module is added after each residual block. On the other hand, inspired by Atrous Spatial Pyramid Pooling (ASPP) in DeepLab_v2 [30], this paper proposes Feature Pyramid Pooling (FPP) to better solve the segmentation problems on contextual multi-scale objects. The experimental results show that the inference speed has been greatly improved without reducing the segmentation accuracy. The work of this paper is essentially the segmentation task; that is, the segmentation of buildings from remote sensing images. The main innovations of this work are as follows: To reduce a large number of parameters, we introduce depthwise separable convolution to improve efficiency. At the same time, a separable residual module is designed to complete the downsampling work. Moreover, in order to obtain multi-scale information for constructing remote sensing images, we also design a feature pyramid pooling module to focus on context more effectively and extract multi-layer features more efficiently.
2. Methodology
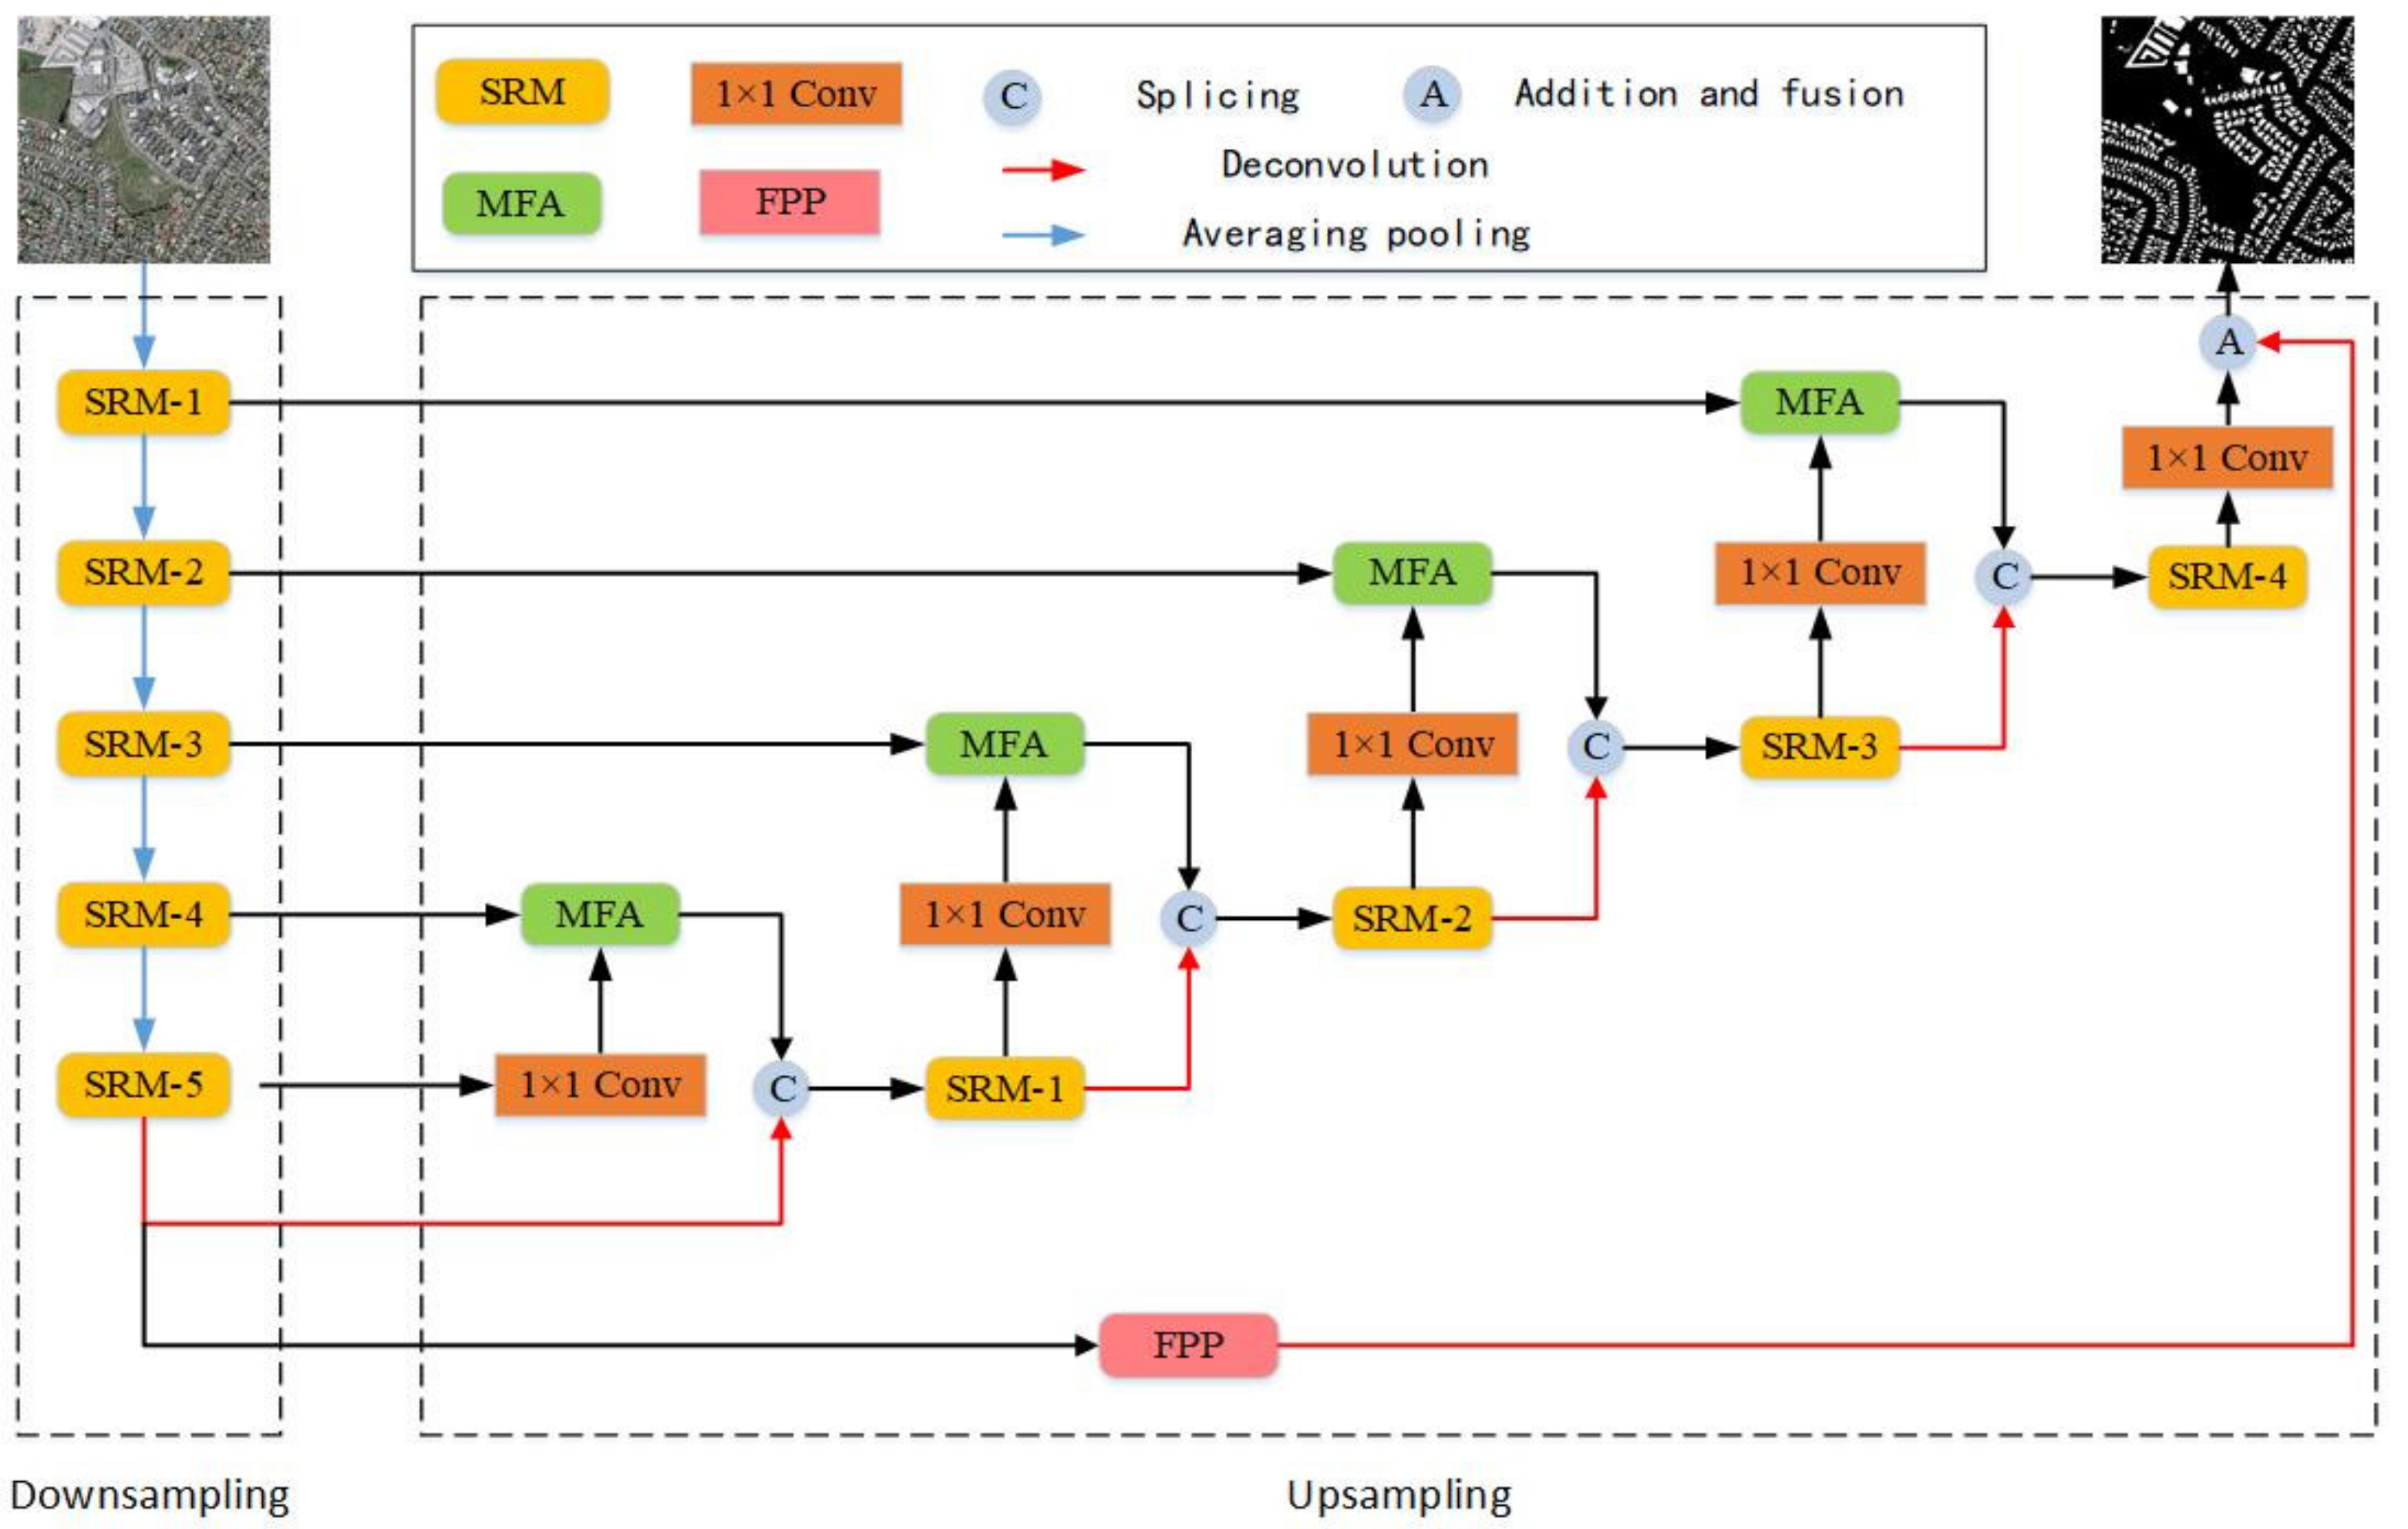
The overall texture and image background of high-resolution remote sensing images may be very complex, such as spatial resolution, building shape, and scale. It is still a challenging task to extract high-precision buildings from high-resolution remote sensing images. In the field of deep learning, in order to be able to extract more detailed building features from remote sensing images, more complex convolution operations and larger network models are usually used for building segmentation. On the one hand, the segmentation accuracy has indeed been significantly improved, but the segmentation speed is not satisfactory, and there is still a big gap for the actual use [31]. At present, the scale of high-definition remote sensing data of many satellites is very large, so computational efficiency becomes very important. Although the operation efficiency can be improved by hardware, it is also very important to improve the operation efficiency by changing the algorithm structure (which is why the lightweight model is an important research direction in the image field). In line with the starting point of balancing the segmentation accuracy and segmentation speed, this paper combines the improved spatial pyramid pooling structure with the encoder-decoder and proposes the FRA-Net. Figure 1 shows the FRA-Net proposed in this paper. The entire network includes two stages of encoding and decoding. Among them, the encoding stage is still used as a cascaded downsampling network for extracting building features from remote sensing images, and the decoding stage is responsible for reconstructing the extracted building features into an image with the same resolution as the input image.
As shown in Figure 1, in order to reduce the disappearance of the gradient in the training process of the model, the deep residual learning method is used in the coding stage to extract the building features in the remote sensing image. At the same time, in order to reduce the explosive growth of parameters caused by larger convolution kernels, this paper introduces a deep separable convolution to improve efficiency and designs an SRM. In addition, in order to obtain multi-scale information of remote sensing images of buildings, this paper improves the pyramid pooling module proposed in PSPNet and designs an FPP module that is more effective in contextual attention and extracting multi-layer features. In the decoding stage, on the one hand, the SRM is used to gradually restore the spatial information to generate the final building segmentation result; on the other hand, the idea of an attention mechanism is introduced, and an MFA is designed to recover the context information learned in the coding stage from multi-scale in an aggregated manner.
In Section 2.1, the SRM proposed in this paper will be introduced. In Section 2.2 and Section 2.3, the FPP module and MFA module designed in this paper will be introduced, respectively, and then the architecture of the FRA-Net proposed in this paper will be briefly summarized.
2.1. Separable Residual Module
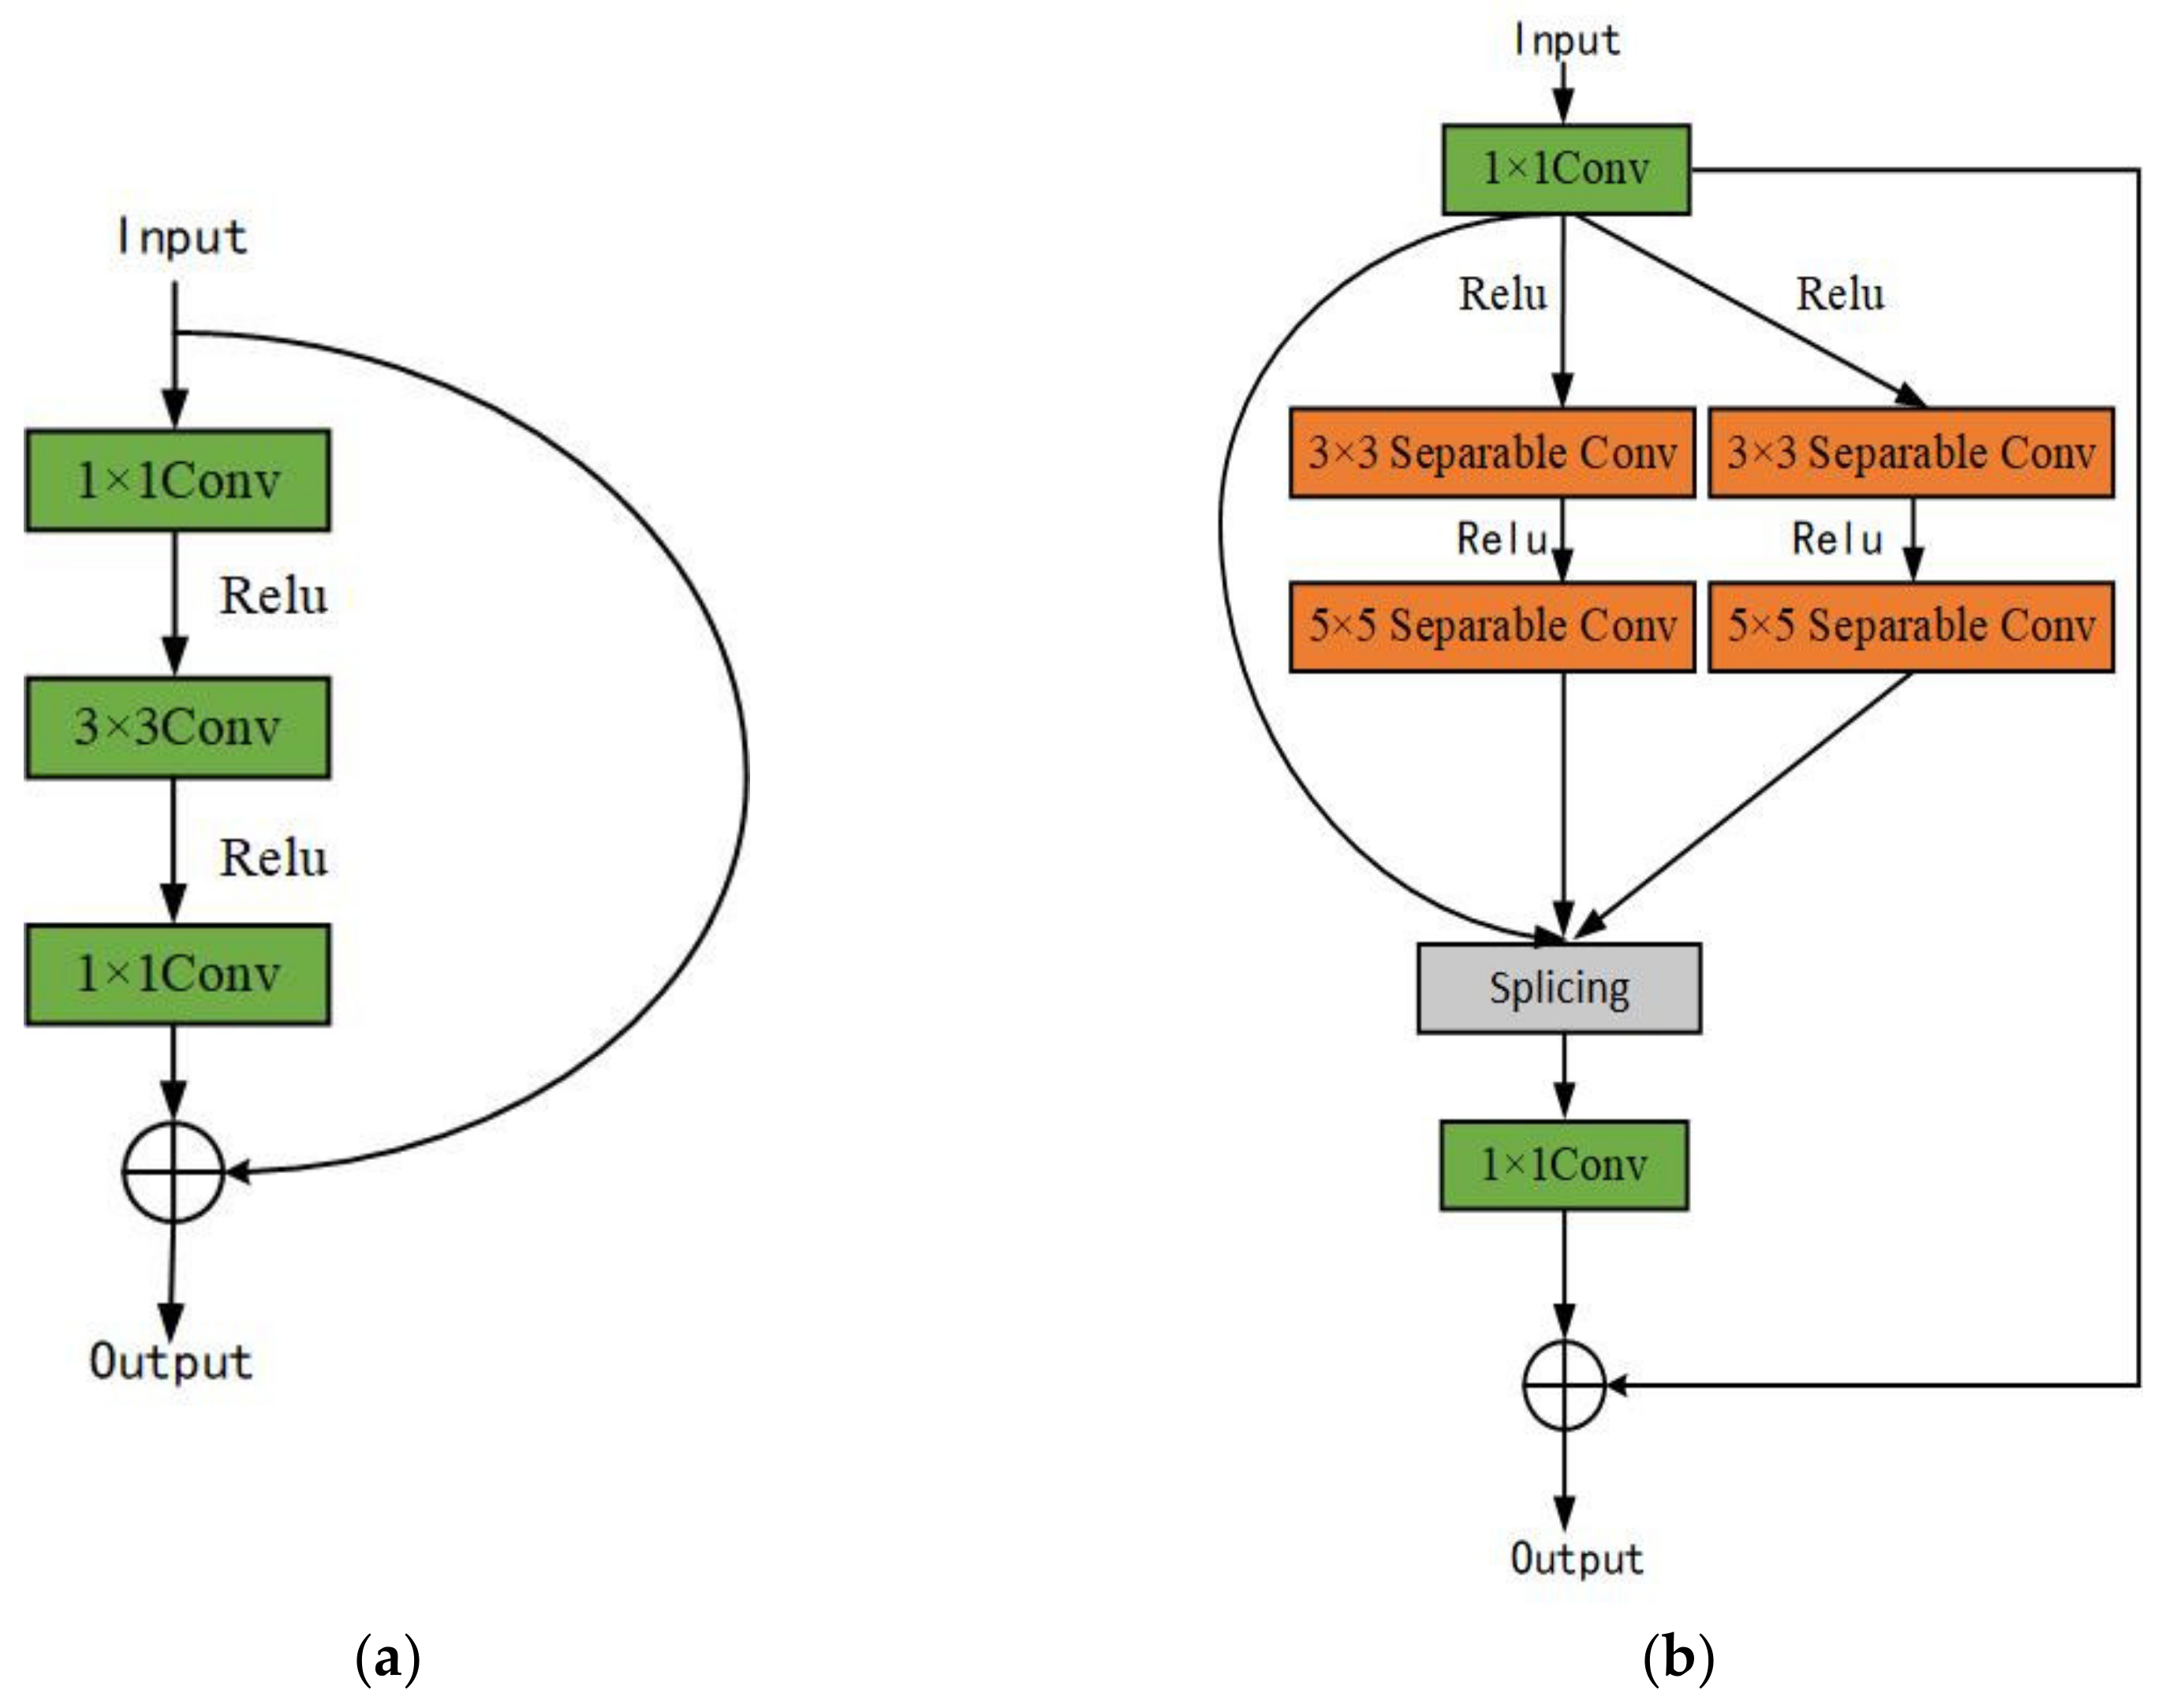
Figure 2b is the SRM proposed in this paper. Inspired by the residual network and the depth separable convolution, in order to alleviate the problem of the disappearance of the gradient during the training process, we design a 1 × 1 convolution. The convolutional layer is followed by two parallel 3 × 3 depth separable convolutions and two parallel 5 × 5 depth separable convolutions, and the Relu activation function is used as the activation function between successive layers. Under normal circumstances, a large convolution kernel can provide a larger receptive field, but it will also bring more parameters, making the entire model extremely complicated. Replacing the traditional convolution with a deep separable convolution can solve this problem. At the same time, inspired by Xeception, the idea of using parallel convolution is not to increase the depth of the network alone but to increase the width of the network. Then, the output of the convolutional layer is spliced to stack multiple layers of semantic information together so that the entire network becomes wider and deeper. Finally, the 1 × 1 convolution is used to extract multi-channel spatial information and compress it to a lower dimension, and then add and fuse it with the input.
2.2. Feature Pyramid Pooling Module
In 2017, PSPNet [21] proposed the Pyramid Pooling Module (PPM) for the first time. The pyramid structure can not only extract the feature information of different scales in the image but also increase the receptive field area appropriately, but this method is not able to extract the channel feature of the global context. In addition, the calculation in the channel direction cannot effectively obtain the multi-scale features of the image and lacks the information on the pixel direction. Due to the high resolution of remote sensing images of buildings, different sizes of buildings, and chaotic distribution, the global context information is also particularly important in the extraction process.
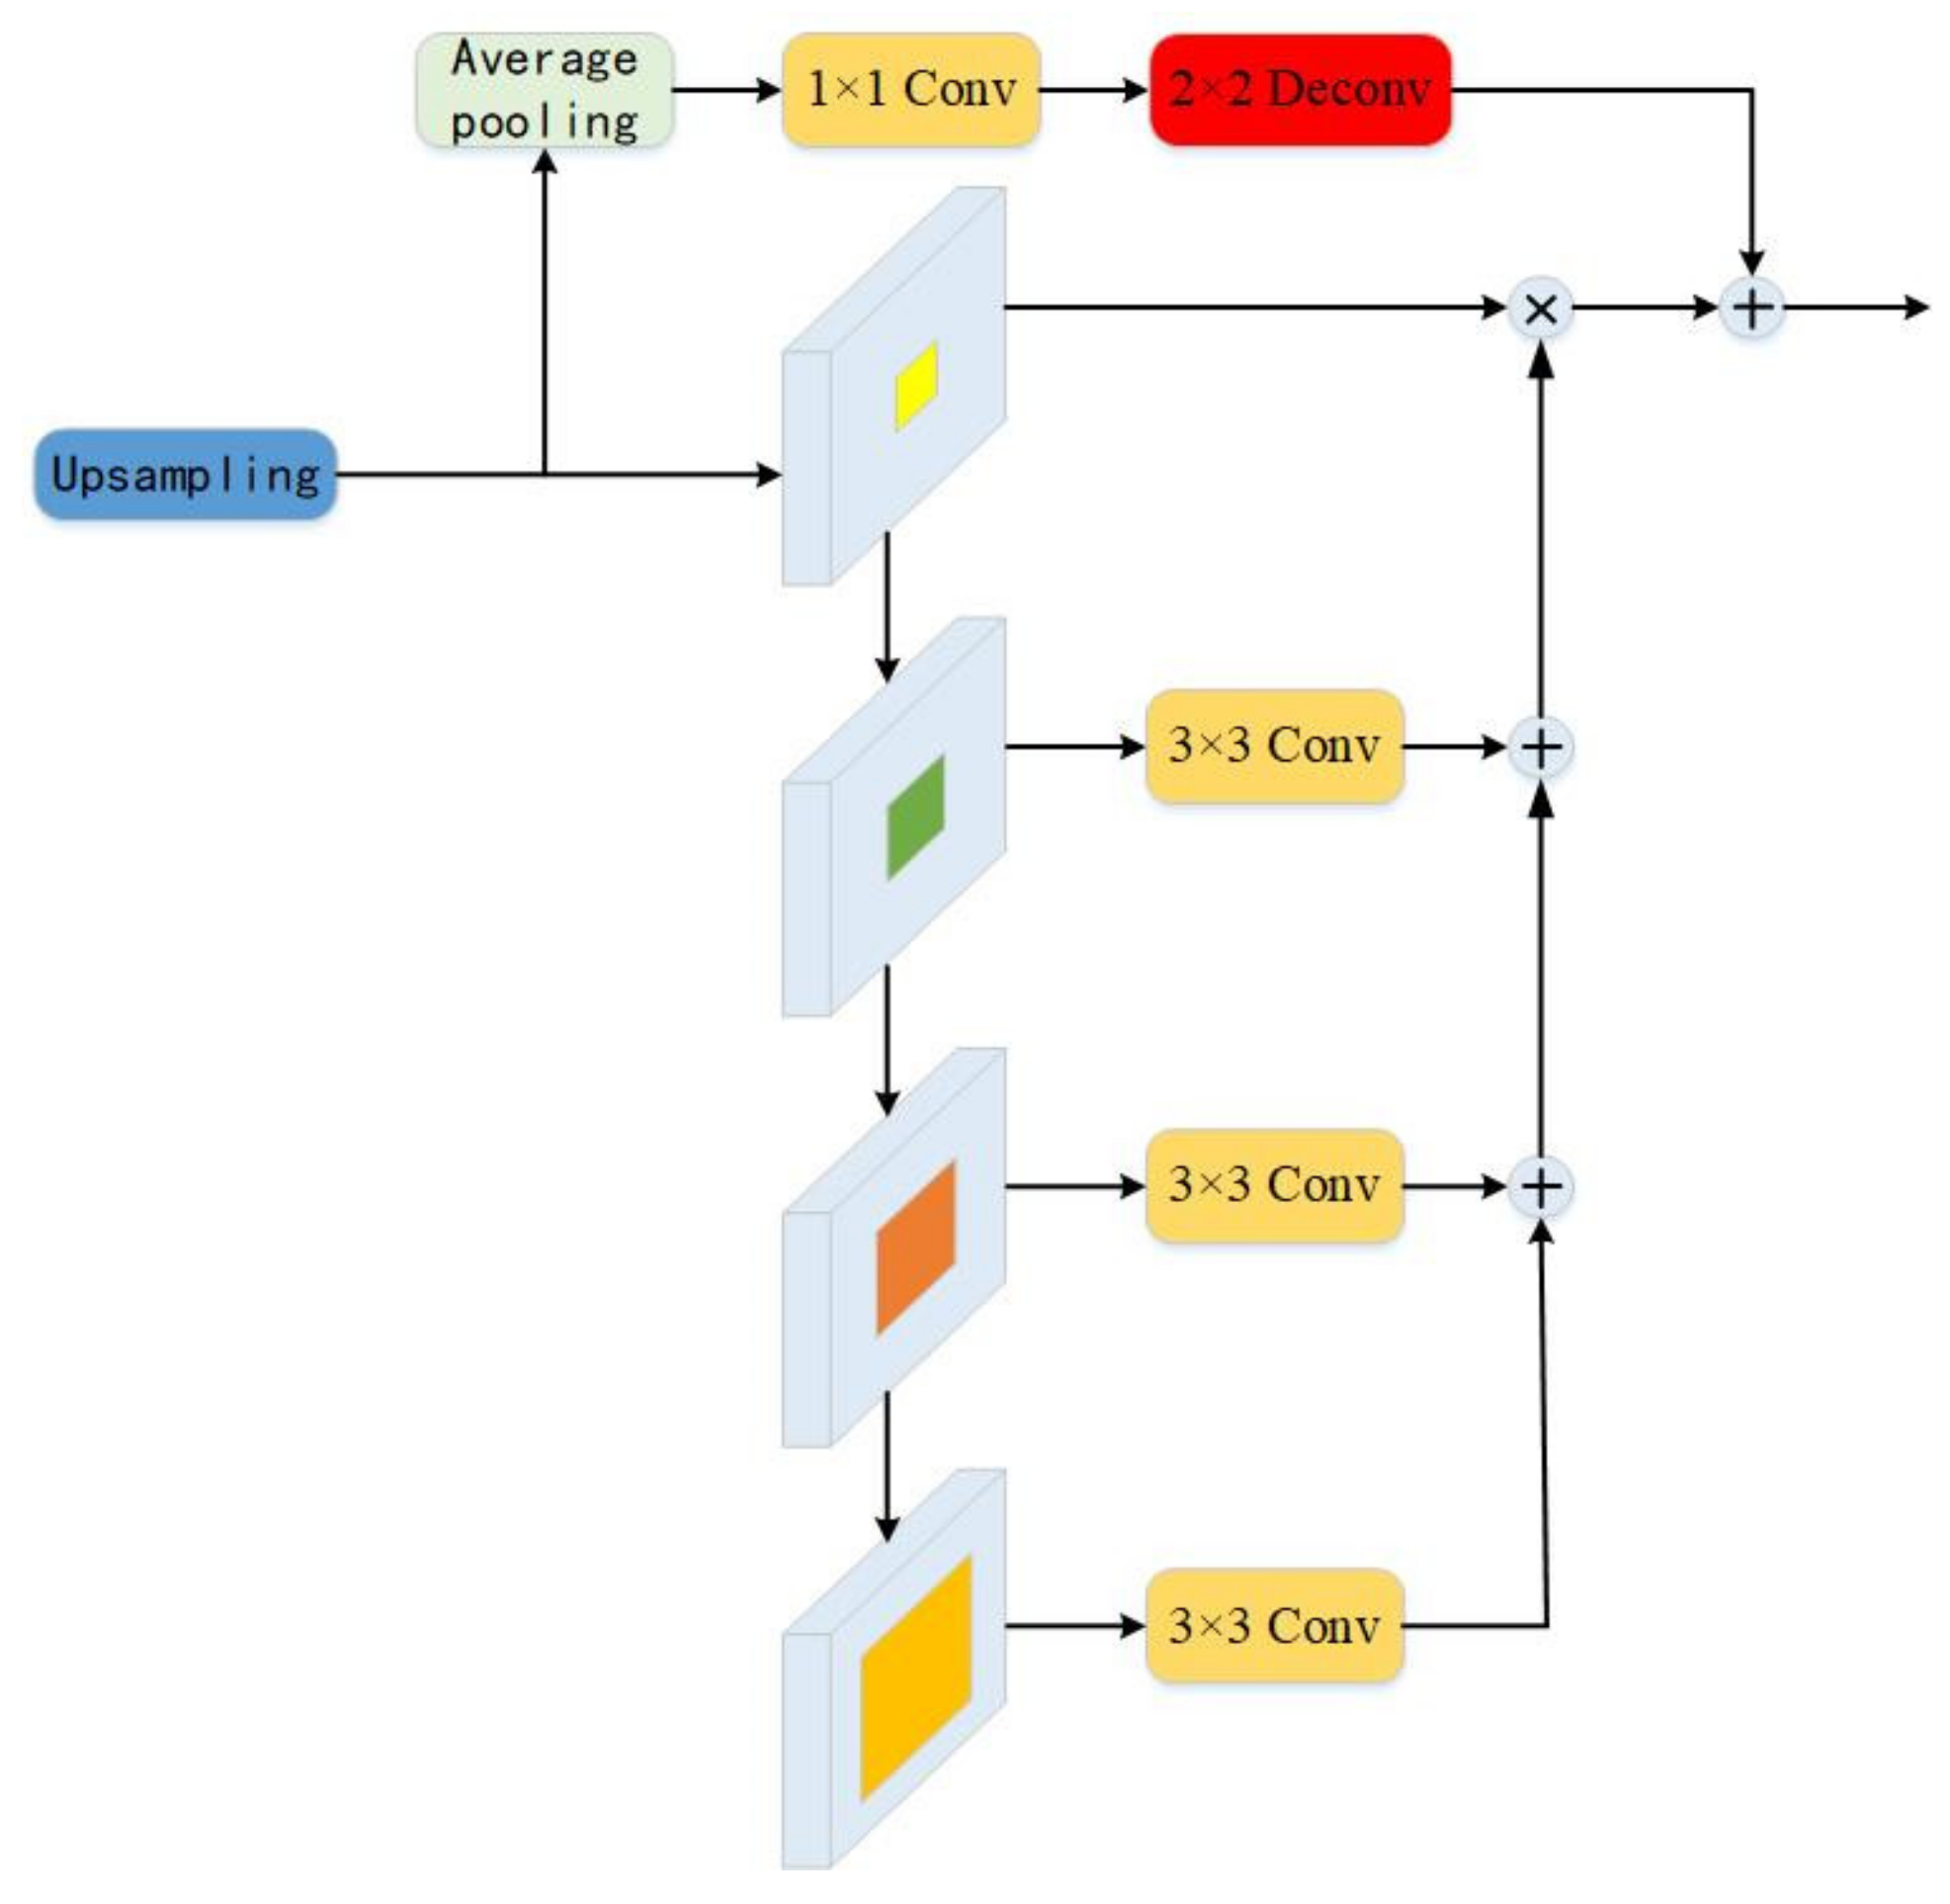
Based on this, this paper improves on the spatial pyramid pooling module and proposes FPP. As shown in Figure 3, in order to better extract context from different pyramid scales, the 3 × 3 convolution is used after the output of the last 3 scales in the pyramid structure. Extracting different scales of information can integrate context features more accurately. Afterward, the most original information in the first scale is multiplied by the information in the last three scales. Compared with the stacking operation in the spatial pyramid pooling module, the multiplication operation does not generate a lot of parameters. It is worth noting that the 4 scales passed through the down-sampled output are 3 × 3 dilated convolutions with dilated rates of 1, 6, 12, and 18, respectively. In addition, average pooling with output characteristics is also introduced, followed by the use of the 1 × 1 convolution to increase the linearity of the output characteristics, and then the introduction of the 2 × 2 deconvolution and multi-scale feature information for addition and fusion.
2.3. Multi-Feature Attention Module
In semantic segmentation, the most frequently used upsampling method is to directly use uppooling or deconvolution to gradually restore the same pixel as the input image. However, this method may simply restore the pixel to the original size, but it is not very helpful for pixel positioning and pixel identification. The intra-class inconsistency that often appears in semantic segmentation is mainly the lack of contextual information, which is also included in the segmentation of remote sensing images.
Under normal circumstances, the main feature of the decoding module is to fix the pixel positioning of the category. However, most of these types of methods usually use complex decoding modules, so they consume a lot of computing resources [32]. The attention mechanism is usually used to redistribute the weights of feature maps to strengthen semantic information, which can effectively enhance the model’s ability to capture target information [33,34]. SENet [35] is the most representative introduction of the attention mechanism into convolutional neural networks in recent years. It implements a channel dimension attention mechanism by introducing a learning parameter in the convolution process, which can adaptively adjust the weight of the feature mapping channel during the training process. The MFA module proposed in this work starts from the high-level and low-level feature information in the upsampling process. On the one hand, in the process of gradually restoring images, it can automatically learn to pay attention to the structures of buildings of different shapes and sizes in remote sensing images while highlighting the salient features that are useful for the task. On the other hand, the module more effectively deploys feature maps of different scales, and high-level features provide guidance information for low-level features.
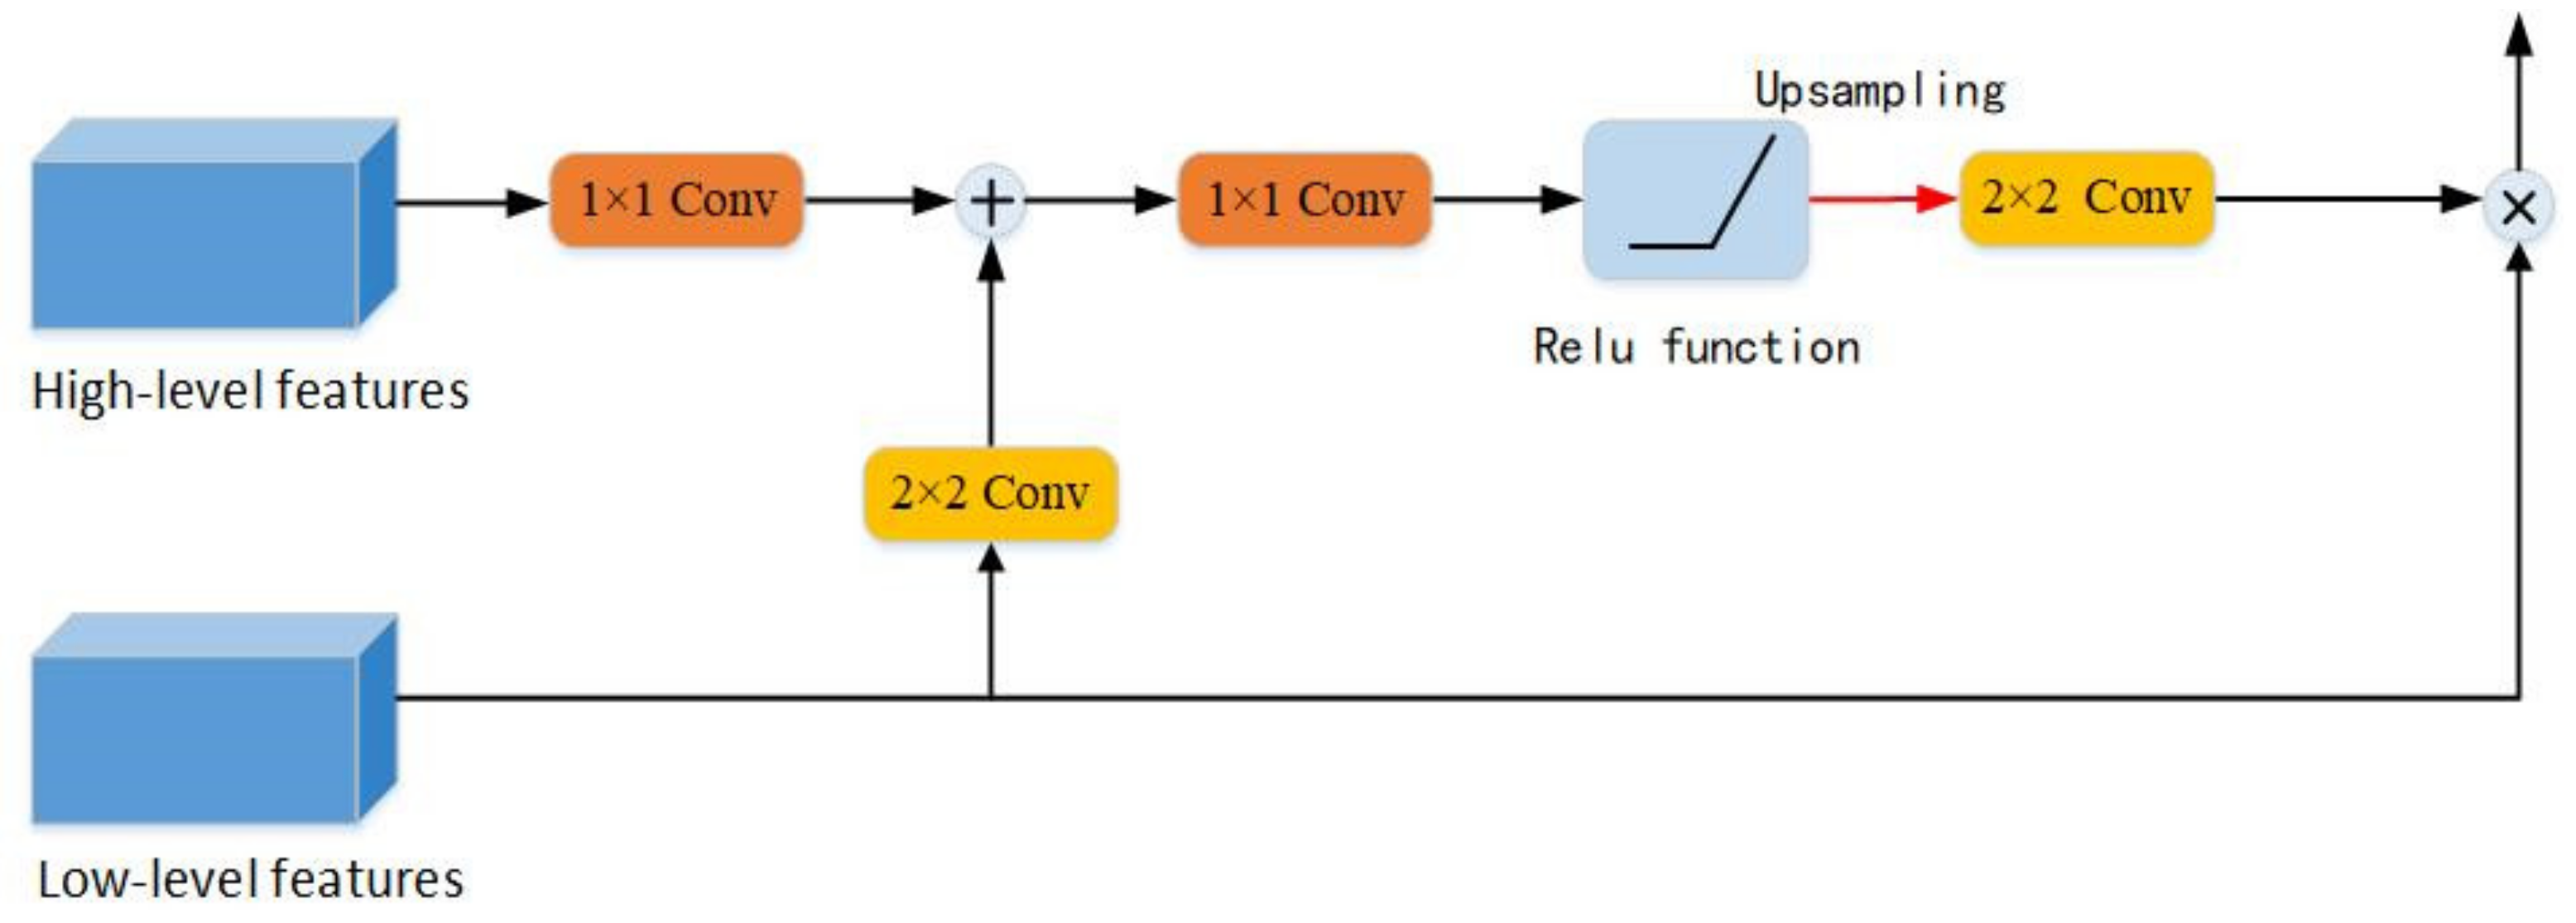
Figure 4 shows the MFA module designed in this paper. Considering that the low-level features have more pixels, the 2 × 2 convolution is performed on the low-level features to reduce the feature map channel and feature map size of the neural network, thereby reducing the amount of calculation caused by the upsampling process. At the same time, it also prepares for feature fusion with low-level features. The context information generated from high-level features is feature-fused with low-level features through 1 × 1 convolution. The fused features are subjected to 1 × 1 convolution and nonlinear Relu function, and then upsampling is performed once, and the obtained feature information is multiplied by the original low-level features.
3. Experiments and Results
3.1. Hyperparameter Settings
The hyperparameter settings of the FRA-Net in this experiment are shown in Table 1. At the same time, the meaning of these hyperparameters is briefly explained.
(1) Initial learning rate: The learning rate is a very important parameter in the training process, and its setting largely determines whether or when the objective function of the model can converge. Therefore, choosing a learning rate suitable for the model is crucial to the training process of the model. Generally speaking, a larger learning rate is selected at the beginning to make the loss value decrease faster to ensure that the model has a faster learning rate, but when the model learns for a long time, the learning of the model should be slowed down. At this time, the learning rate needs to be adjusted appropriately to ensure that the model does not “over-learn”.
(2) Batch size: When training the model, due to the limitation of the memory of the graphics card, generally, all data will not be input into the network for training. At this time, a certain amount of data needs to be entered in batches. The preprocessed images in this paper have a resolution of 256 × 256, and the batch size is set to 10.
(3) Training steps: refers to the number of steps in network training; each step will select 10 images from the data set for training.
(4) Loss function: Since it is necessary to judge whether to continue learning according to the deviation between the actual output and the expected value in the process of forward propagation, a loss function is needed to evaluate the quality of the model. This paper uses the cross-entropy loss function plus the L2 regularization loss function (L2 loss) to complete the gradient descent.
(5) Optimization method: Adam is an effective first-order optimization algorithm, which iteratively updates the training weights on the basis of training data.
3.2. Analysis of Implementation Results
Compared with some classic networks, such as FCN-8s, SegNet, UNet, PSPNet, and FPN_MSFF, the FRA-Net has the biggest difference in the way of image feature extraction during the downsampling process. The evaluation methods are all deep learning-based methods; they have different structures. These methods are designed based on a convolutional neural network, which is the relationships between them. Among them, FCN-8s, SegNet, and UNet use VGG16 as their downsampling reference network, and PSPNet and FPN_MSFF use ResNet-101 as their downsampling reference network. Table 2 shows the comparison of the model structure of the semantic segmentation network and the FRA-Net proposed in this paper and the comparison of the average prediction time of a single image in the (Aerial Imagery for Roof Segmentation) LandCover test set [36]. The LandCover dataset is a high-resolution aerial image set covering a total area of 216.27 square kilometers in Poland. The data set contains 33 pictures with a resolution of about 9000 × 9500 and 8 pictures with a resolution of about 4200 × 4700, and the data are RGB images. Each of the pictures is artificially labeled with four types of objects: buildings (red), woodlands (green), water (grey), and backgrounds (black). For the processing of this dataset, all images were cut from left to right and top to bottom without 264 overlapping the 512 × 512 images. The images with only one class are eliminated, and then 265 randomly are divided into the training set and test set according to the ratio of 0.8:0.2.
All experiments in this paper are based on Tensorflow deep learning framework. The software environment includes: the operating system is windows 10, Tensorflow version is 1.9.0, CUDA version in GPU acceleration library is 9.0, and cudnn version is 7.1. The hardware configuration includes: the CPU is AMD Ryzen 7 2700, the RTX 2070 8 g GPU is used for training and reasoning, and the memory is 16 g with a 512 g solid-state disk.
It can be clearly seen from the table that the three indicators of FRA-Net are all better than the five contrasting semantic segmentation networks. This shows that FRA-Net has good integrity and correctness for the buildings in the LandCover test set, and the mIoU is 1.57% higher than FPN_MSFF, which has the highest index of the comparison model. In Table 2, FCN-8s has the largest number of parameters and the longest average prediction time, reaching 86.57 s/frame. However, the accuracy of the test is still high. This is mainly due to the use of the jump structure, which combines the features of the low-level and high-level, and enhances the generalization performance of the model. FPN_MSFF’s mIoU index is the highest (0.8687 vs. our 0.8678) among the five comparison models but its reasoning speed is far lower than the FRA-Net proposed in this paper. Compared with FPN_MSFF, the reasoning speed of our FRA-Net is nearly twice as fast, reaching 34.57 s/frame. From a comprehensive consideration, FRA-Net has both speed and accuracy performance advantages. This is mainly due to two points. One is the improved SRM. The introduction of the residual structure makes the model easier to train, which not only alleviates the phenomenon of gradient disappearance but also guarantees good information. Depth separable convolution will not bring huge parameters while obtaining a larger receptive field, which reduces the computational complexity of the model. The second is that its symmetrical up-sampling structure makes it easier for the model to recover features. The improved FPP module adds a 2 × 2 convolution kernel in the multi-scale fusion method to process details that may not be restored.
3.2.1. Impact of Sampling Method on Extraction Results
In order to reflect the effectiveness of the FRA-Net model proposed, as well as the role and advancement of each module in the upsampling and downsampling process, this paper will show the exploration process carried out on the LandCover dataset. The FRA-Net structure built in this paper is also analyzed and experimented with around the two processes of downsampling and upsampling. In the downsampling process, the common approach adopted by existing semantic segmentation algorithms is to use classic classification networks, such as VGG16 and ResNet. Among them, ResNet-50, ResNet-101, and ResNet-152 are the most commonly used backbone networks for semantic segmentation. Through the ablation experiment of each module, the test results shown in Table 3 are obtained. Among them, RB represents the ordinary residual module, and its structure is shown in Figure 2a; SRM represents the SRM built with the idea of residual structure in this paper; ASPP is the hollow space pyramid pooling module proposed in DeepLab_v2; FPP means the FPP module improved in this chapter; MFA means the MFA module improved. It should be noted that all experimental settings and experimental environments are the same.
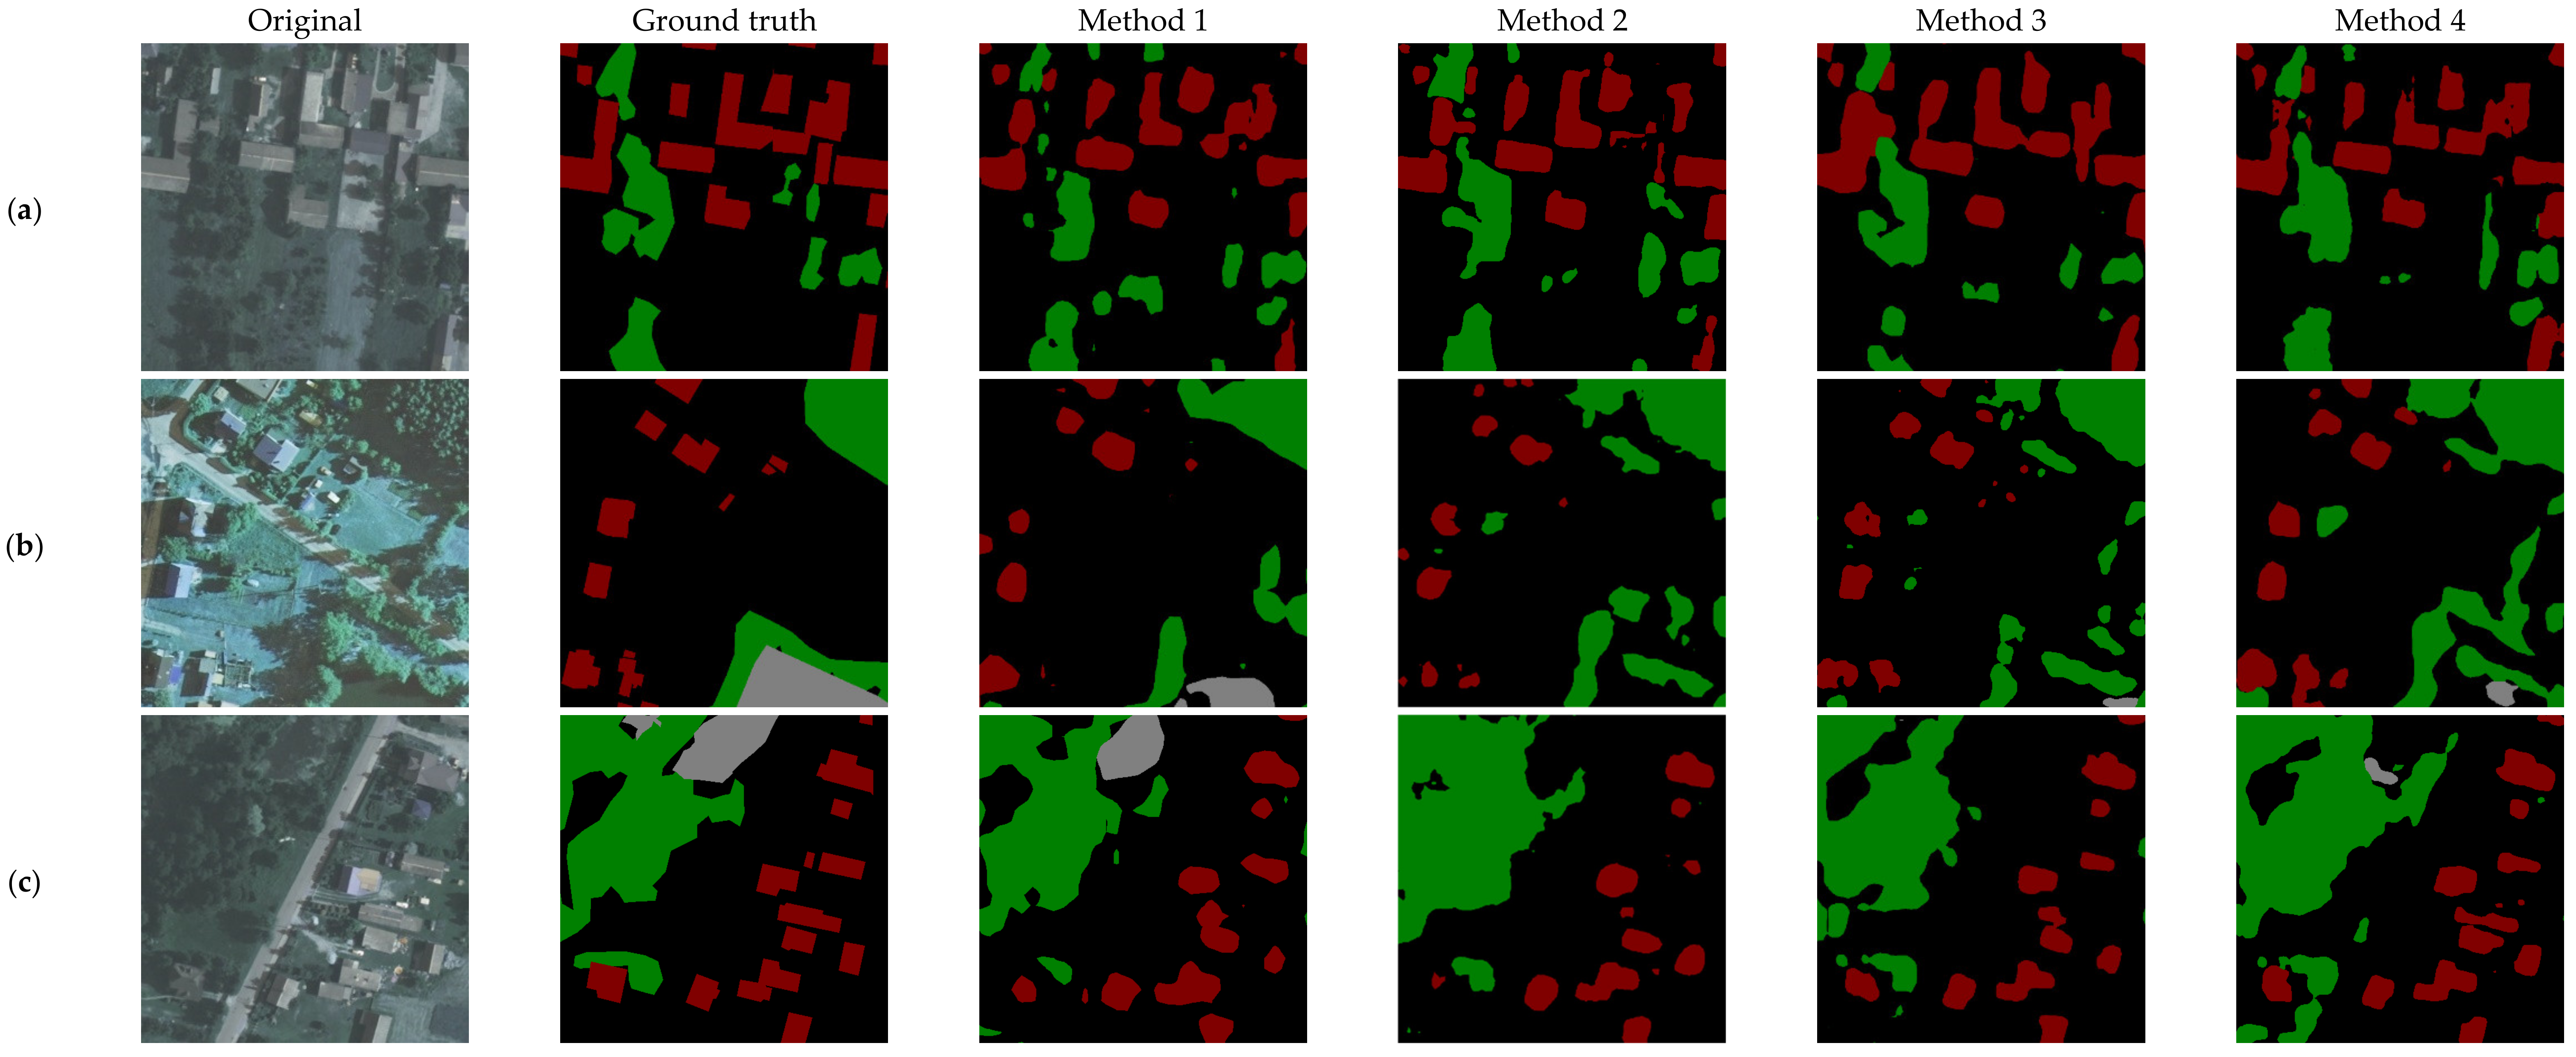
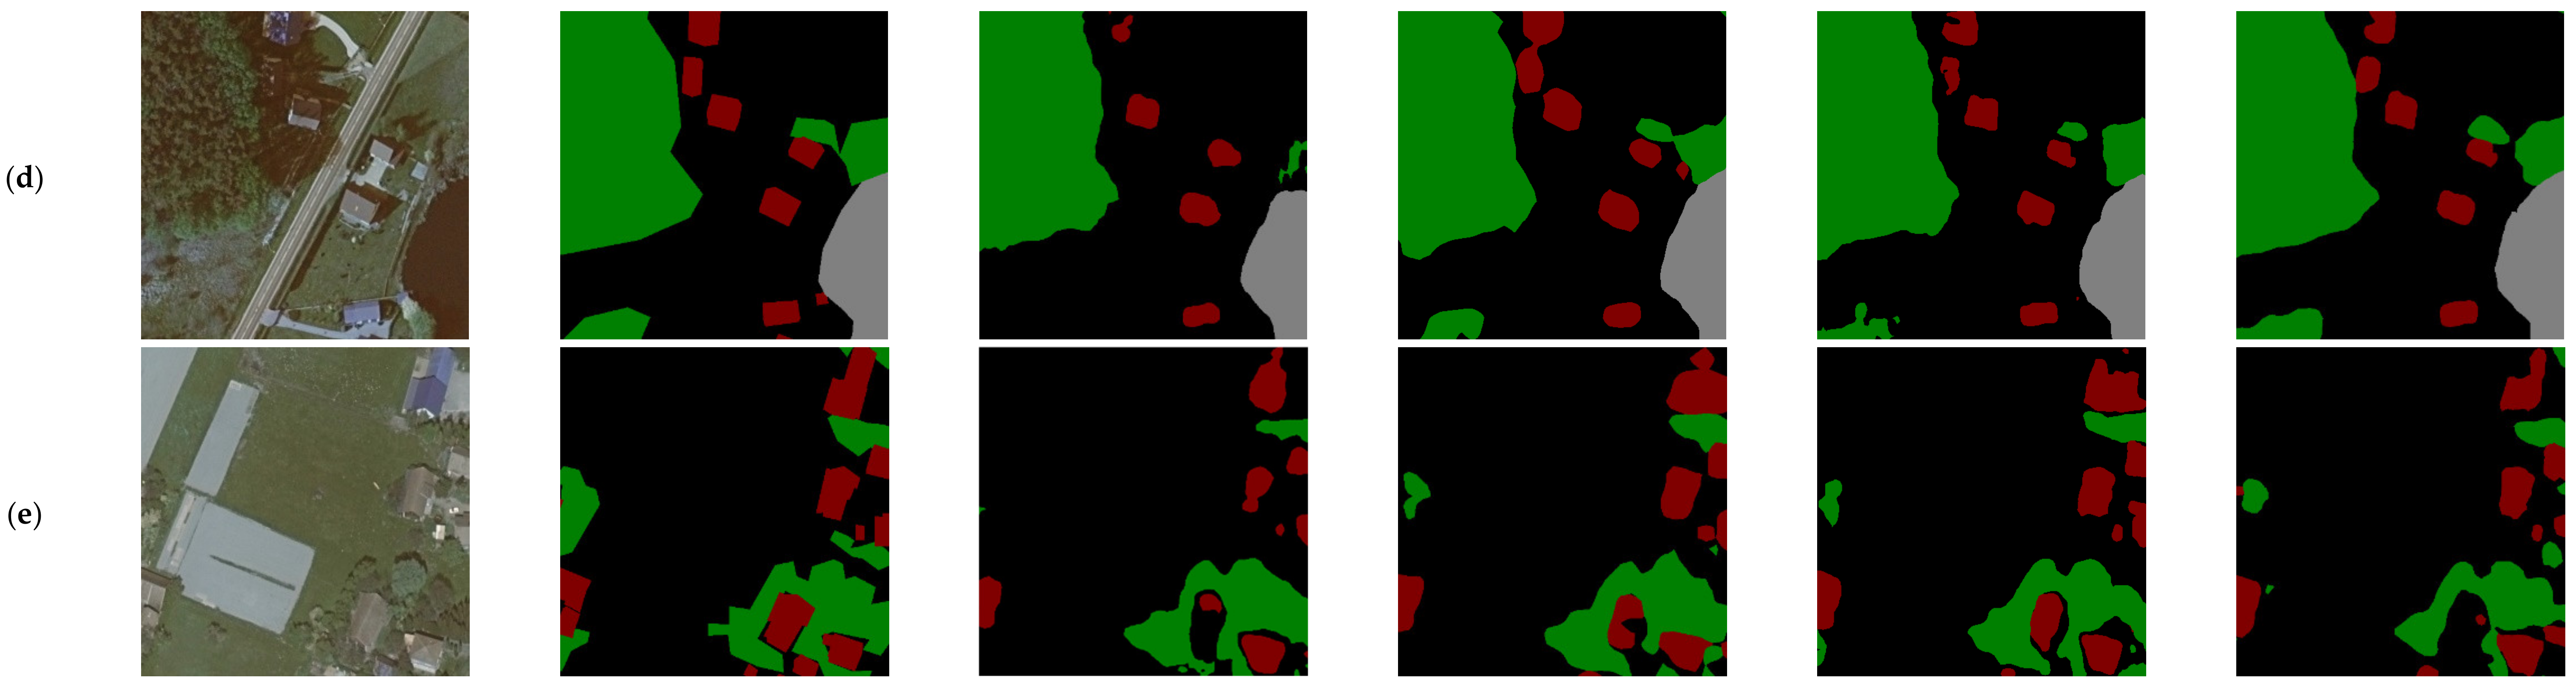
Figure 5 is a graph of prediction effects obtained by trying different downsampling and upsampling methods. In Figure 5, the red area is our main prediction object, which is buildings, the green area is predicted to be woodland, the gray area is predicted to be water, and other areas are classified as black. Table 3 shows the evaluation results of different sampling methods in the LandCover test set. From an overall point of view, compared to other methods, the FRA-Net proposed in this paper has achieved better results in these several prediction scenarios. Figure 5a–c show a residential area. The biggest feature of the residential area is that there are many trees and the distance between houses is small. From the remote sensing image, it is very dense, and the shape and size of the houses are similar. The biggest problem that often exists when dividing these residential houses is that the shelter caused by some tall trees blocks the disturbance caused by the roofs of the houses. Figure 5d,e are the areas of some public facilities and factories. Compared with houses in residential areas, these areas are quite different. First, the buildings in residential areas are mostly private houses, which are different in shape and size from the shopping malls and factory buildings in public facilities. Generally speaking, the shapes of shopping malls and factories are more diverse. From the remote sensing image, the appearance of the roof is very different from that of ordinary houses. There are usually some pipes, exhaust fans, and other public facilities on the roof, which cause great interference to the division of the building. Second, the surrounding environment of residential areas and shopping malls and factories are different. Residential areas usually consist of houses and green vegetation, so the scene is relatively simple. While most of the surrounding shopping malls and factories are cars, roads, and some containers, which appear to be relatively empty as a whole, but there are many interference objects, which also brings inconvenience to feature extraction.
Figure 5 shows several instance results for different categories. It can be seen from the observations that the resulting map predicted by FRA-Net is the closest to the original image, whether it is for woodland, water, or buildings. The results in the third column of Figure 5 are the worst predictions for buildings throughout the experiment, with many buildings being misclassified as non-buildings. At the same time, woodland areas are also misclassified as waters in Figure 5b–d. It is worth noting that methods 2 to 6 have fewer misjudgments in this regard. Except for method 1, the rest of the model structures use the residual structure for downsampling, and the same ordinary residual block is used for the upsampling process from method 1 to 3. This also explains the effectiveness of the residual structure as an upsampling process to some extent. From the five scenarios in the figure, method 1 has the highest false-positive rate of buildings. Residential houses were misjudged due to different roof shapes when dividing houses, and flat-roofed houses were identified as non-buildings. When dividing buildings for shopping malls and factories, they will be identified as non-buildings due to the architectural pattern of the roof. In contrast, methods 2 to 4 use residual blocks to extract features during downsampling, and the false identification rate of buildings is lower. This is because the “skip structure” of the residual block is stronger than the structural gradient propagation of VGG16, and can also perform effective back-propagation, which enhances the generalization performance of the model. Therefore, it can extract effective features better than VGG16, and the feature recognition of buildings is also more accurate.
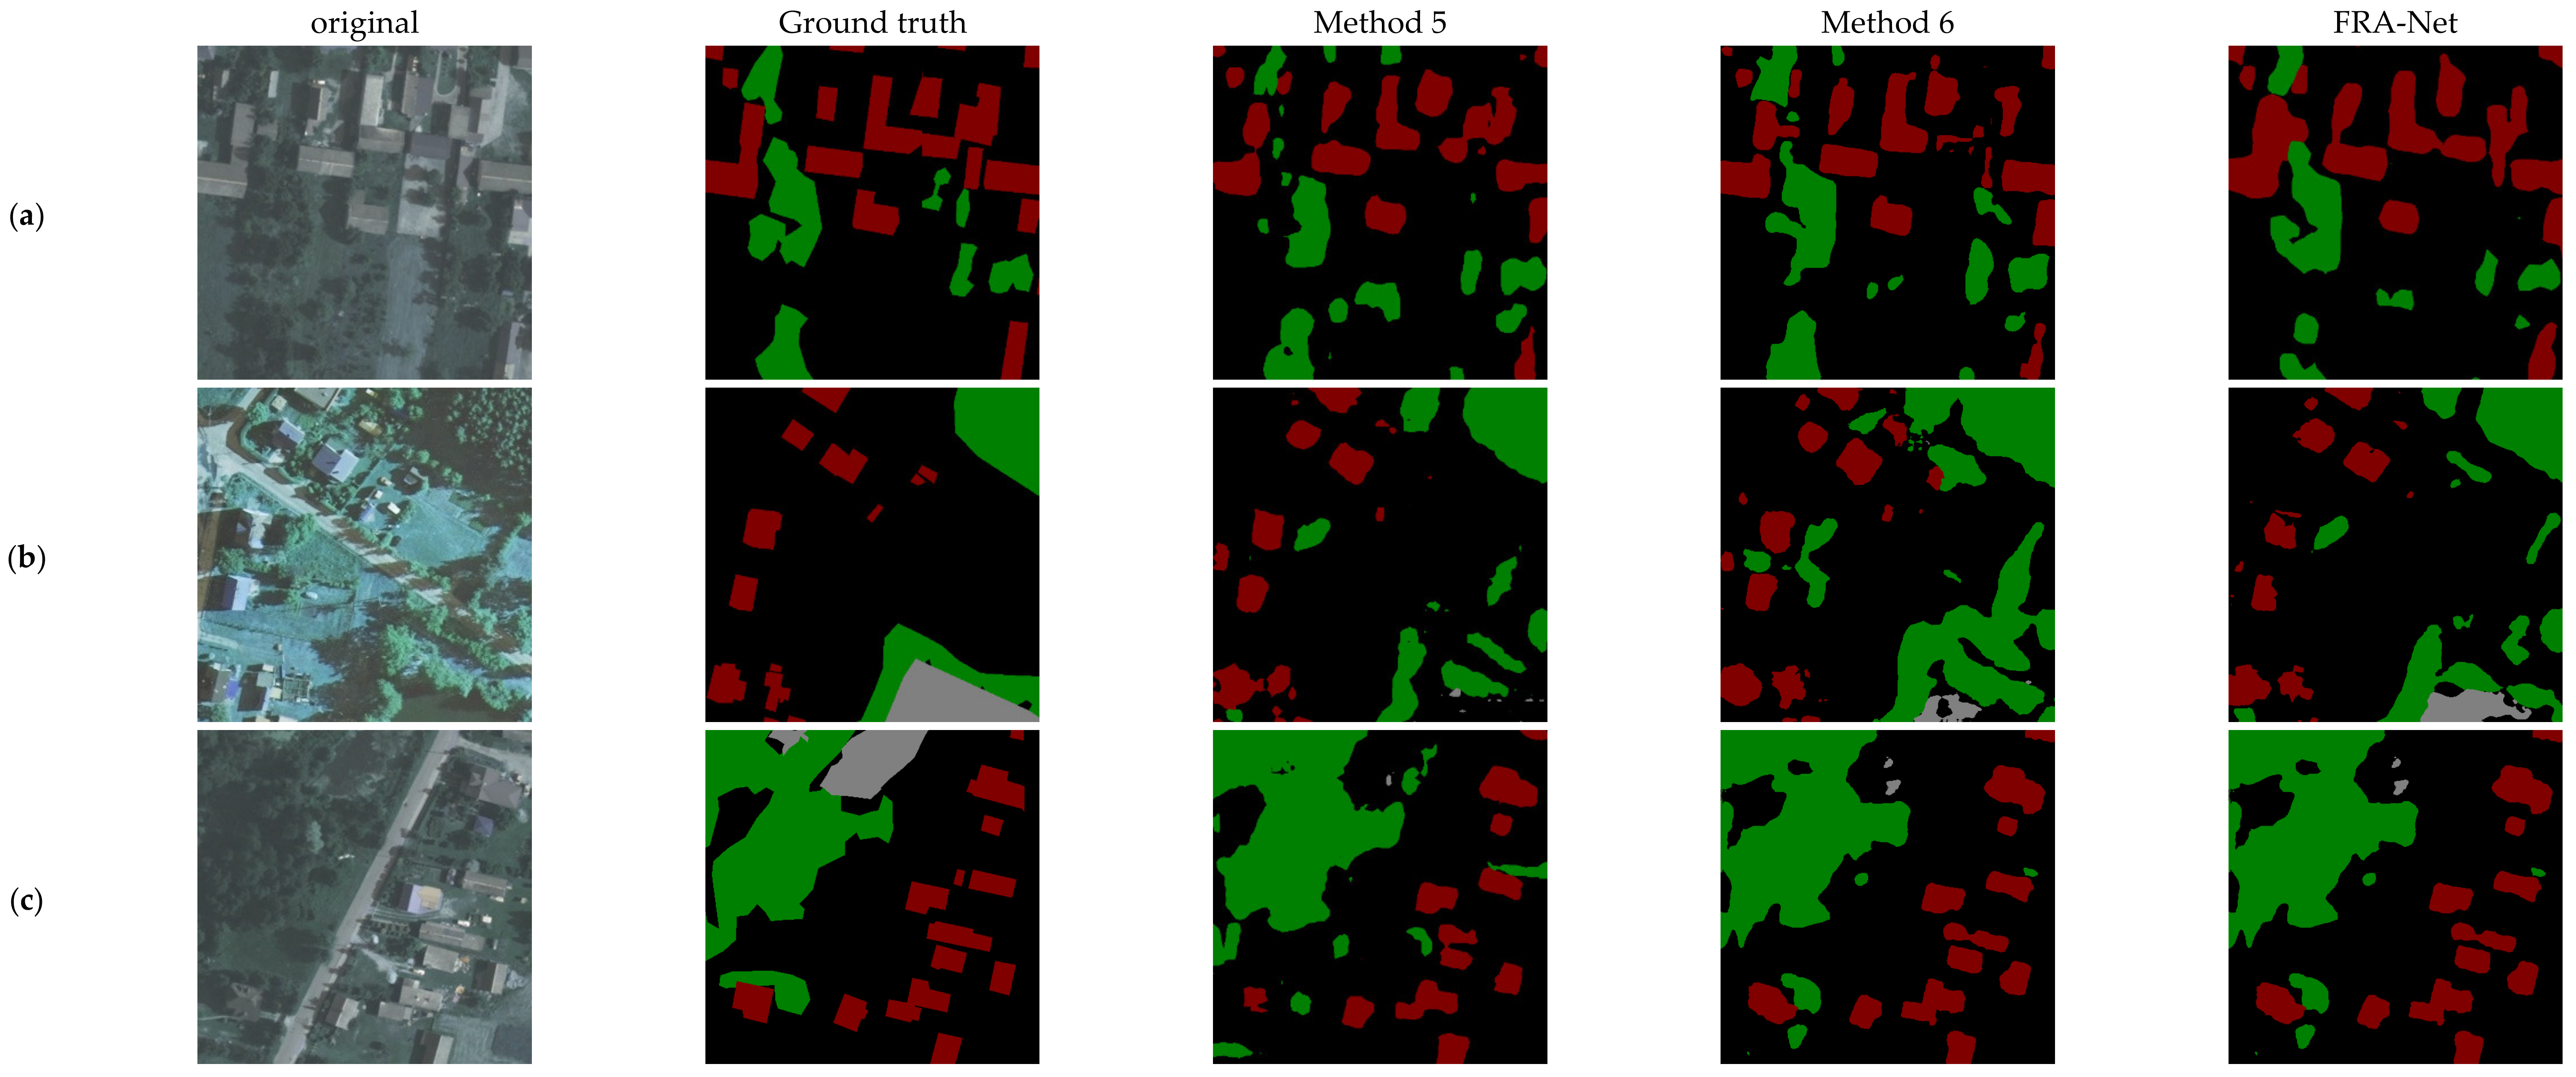
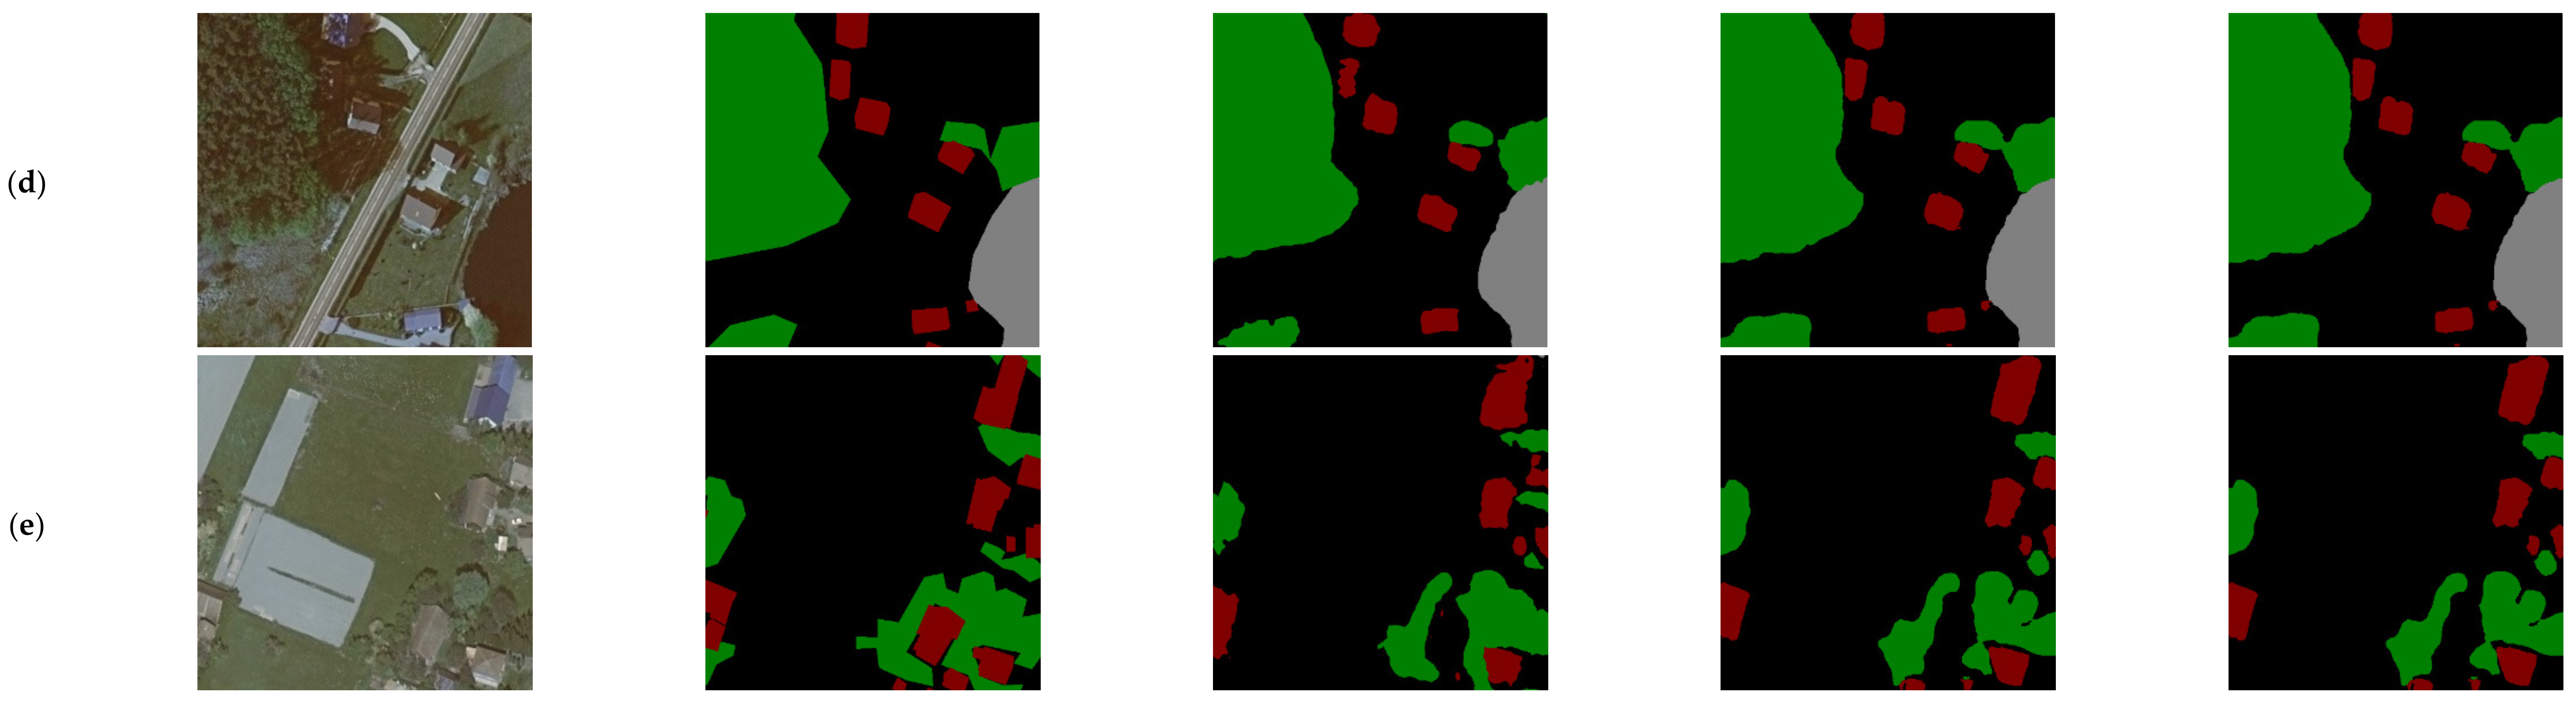
The only difference between method 2 and method 3 is the method of downsampling. One is the extraction method using ResNet-101, and the other is the extraction method consisting of five residual blocks. It can be seen from Table 3 that the downsampling method composed of residual blocks is about 1% higher than ResNet-101 in F1 score and mean Intersection over Union (mIoU). From the regions predicted to be buildings in the fourth and fifth columns of Figure 5, it can be seen that the extraction method consisting of five residual blocks is slightly better than the ReNet-101 extraction method in these parts. More importantly, the average time of predicting the entire set is reduced by about 20 s compared with method 2. Therefore, for remote sensing images, the deeper the convolutional layer may not necessarily achieve better prediction results. In the model prediction using method 4, there is no big difference between the segmentation accuracy index of method 3 in Table 3, but the average prediction time of a single image is shortened by about 15 s. In addition, from the prediction effect of the sixth column in Figure 5, it can be seen that the processing of complex and non-complex regions is not much different from that of method 3, but the segmentation effect is obviously better than that of method 2. This also illustrates the effectiveness of the SRM constructed in this paper. On the one hand, by increasing the width of the convolutional neural network to obtain more characterization information. On the other hand, a large convolution kernel of 3 × 3 or 5 × 5 is used to obtain a larger receptive field, and at the same time, the idea of depth separable convolution is introduced to reduce model parameters. Methods 5 and 6 are ablation experiments on the hollow space pyramid pooling module and the FPP module proposed after the improvement of this chapter. The mIoU of method 6 is higher than that of method 5. It can be seen from the red areas in the second and third columns in Figure 6 that method 6 has a higher recognition rate for buildings in more complex scenes such as shopping malls and factories. FRA-Net is added to introduce the idea of attention, and the details of building segmentation can be better processed through the further fusion of low-level and high-level features.
3.2.2. Model Validation Based on Massachusetts Building Dataset
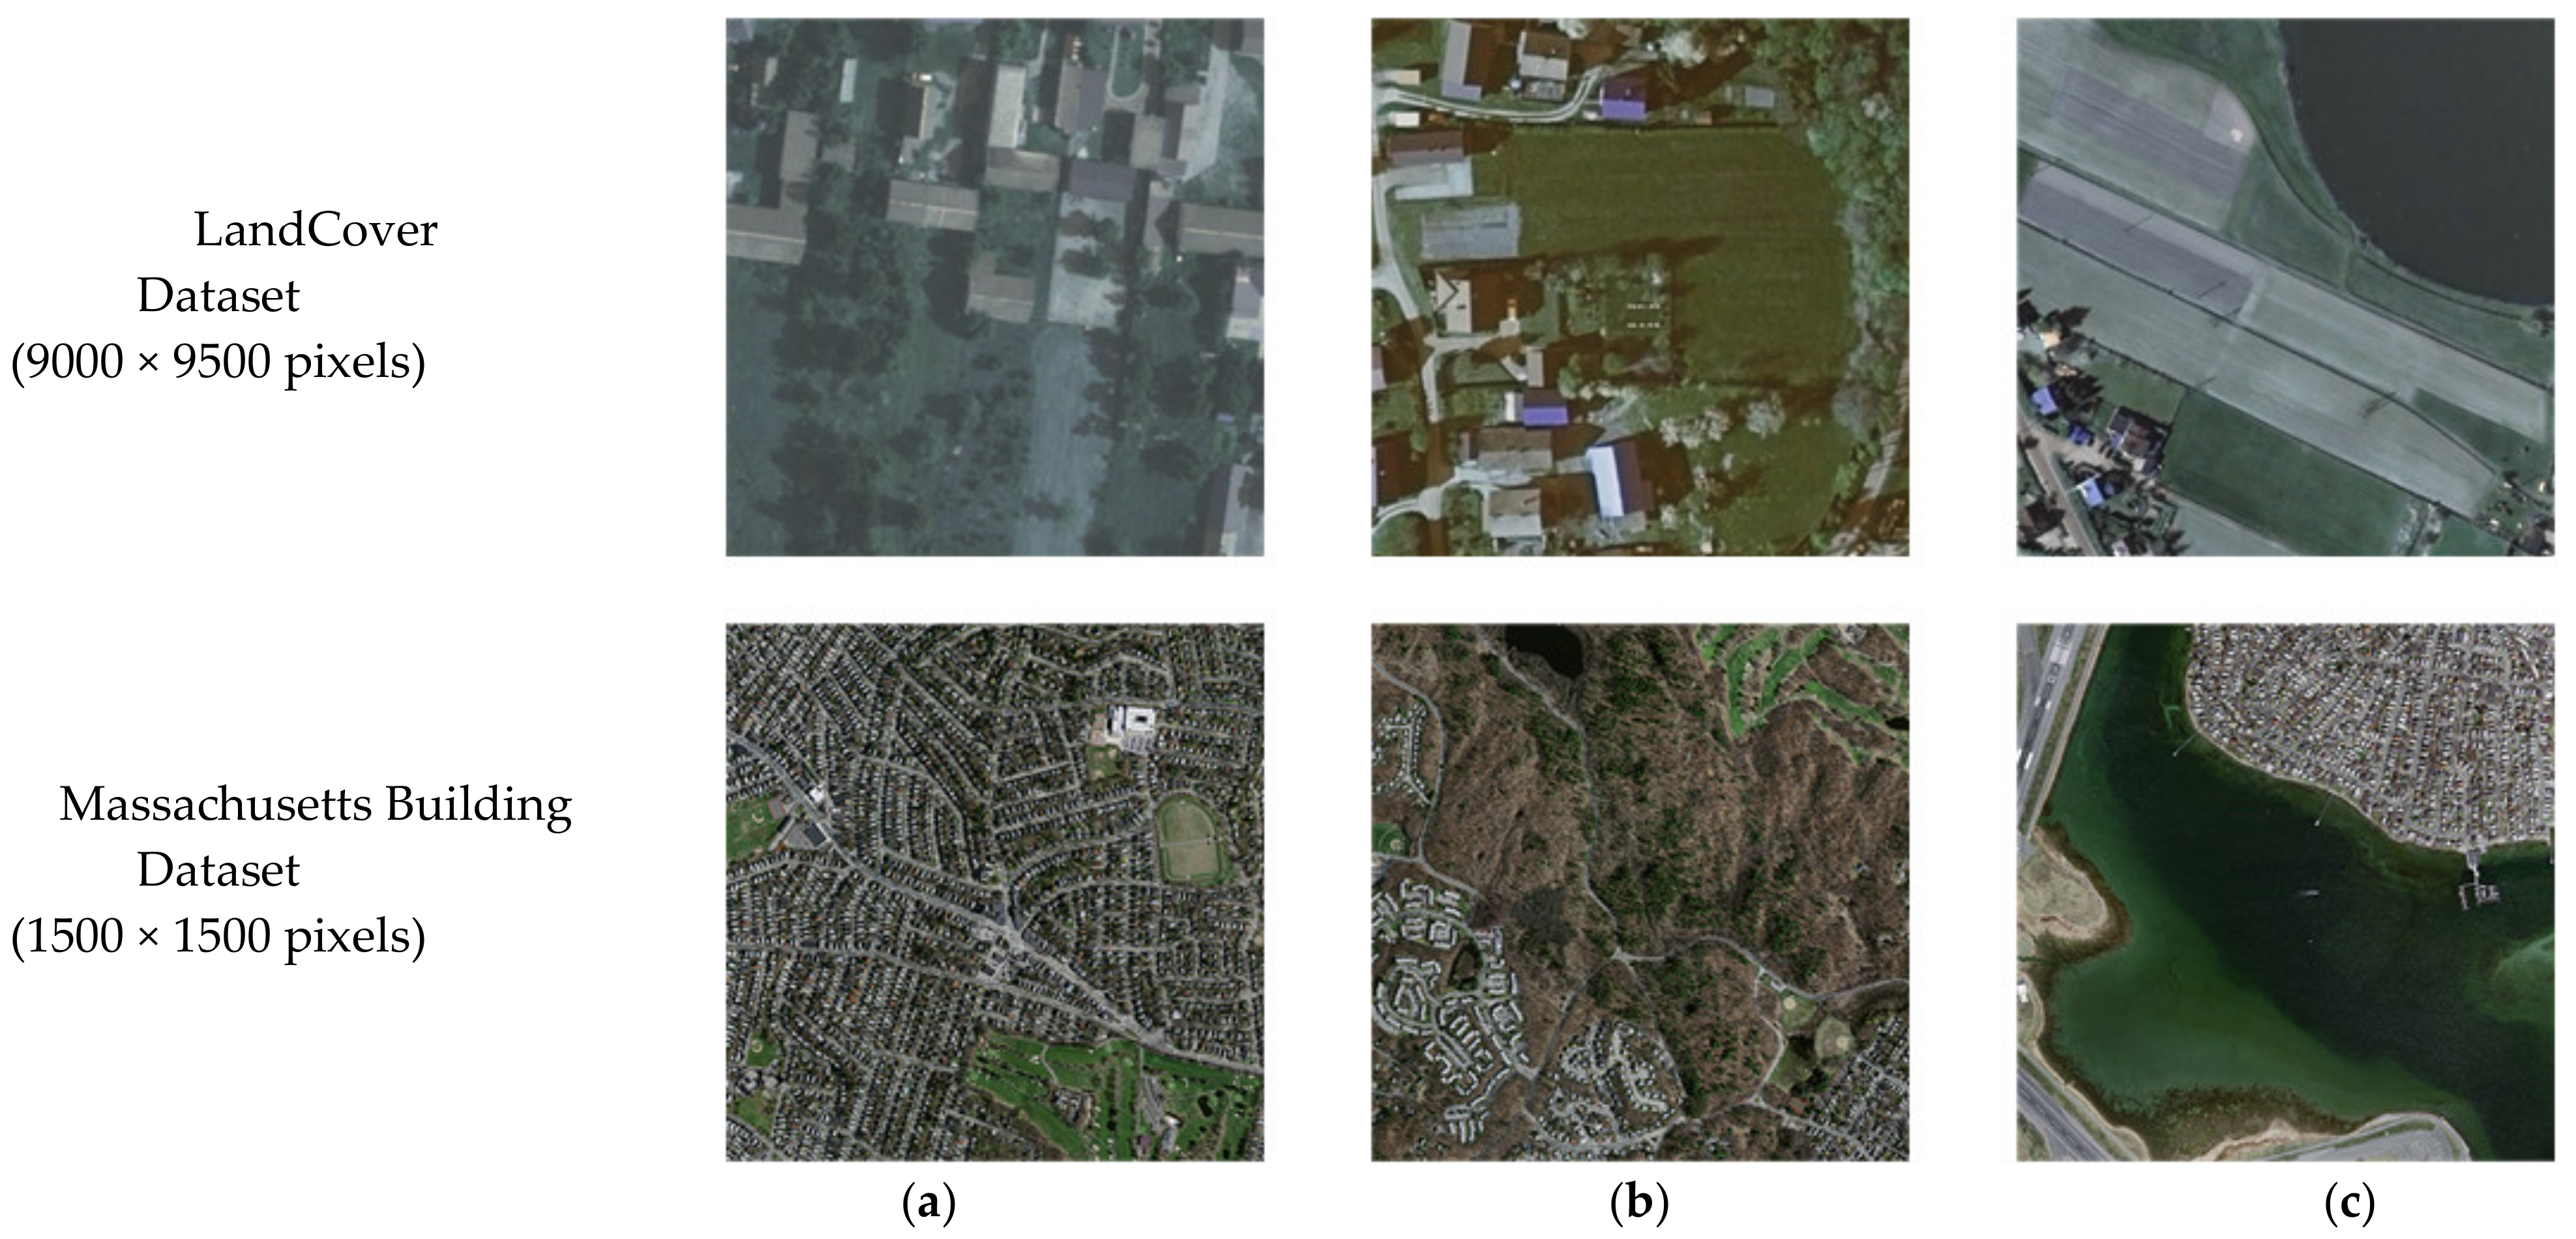
The Massachusetts building dataset consists of 151 aerial images of the Boston area, each of 1500 × 1500 pixels, covering an area of 2.25 square kilometers. In the Massachusetts building dataset, there are only two types: one is buildings, and the other is background. The whole dataset covers about 340 square kilometers [37]. The Massachusetts dataset is divided into 137 image training sets and 14 image verification sets. Compared with the LandCover dataset, the biggest feature of the Massachusetts building dataset is that the image pixels are only 1500 × 1500, while the image pixels of the LandCover dataset are 9000 × 9500 or 4200 × 4700. In the landcover dataset, there are three categories: vegetation, construction crops, and water body. The pixels of the two datasets are quite different. The training and prediction effects of the analysis model on different pixels are of great significance for studying the extraction of buildings in remote sensing images. Due to the different geographical locations of Massachusetts and Poland, there are big differences in geographical features and architectural styles. Figure 7 shows the comparison of the two datasets on the topography, in which the residents’ area, rural area, and seaside area in the two datasets are selected, respectively. Among them, the difference between the houses in residential areas is not great. In the rural area, Massachusetts has a higher terrain, not the flat terrain of Poland, which will also cause some interference to the feature extraction of the neural network. Poland, in the seaside area, is mainly composed of some factory buildings, which are scattered and can be easily distinguished. In contrast, the seaside in Massachusetts is mostly residential buildings, which are dense and difficult to partition.
3.2.3. Analysis of Results
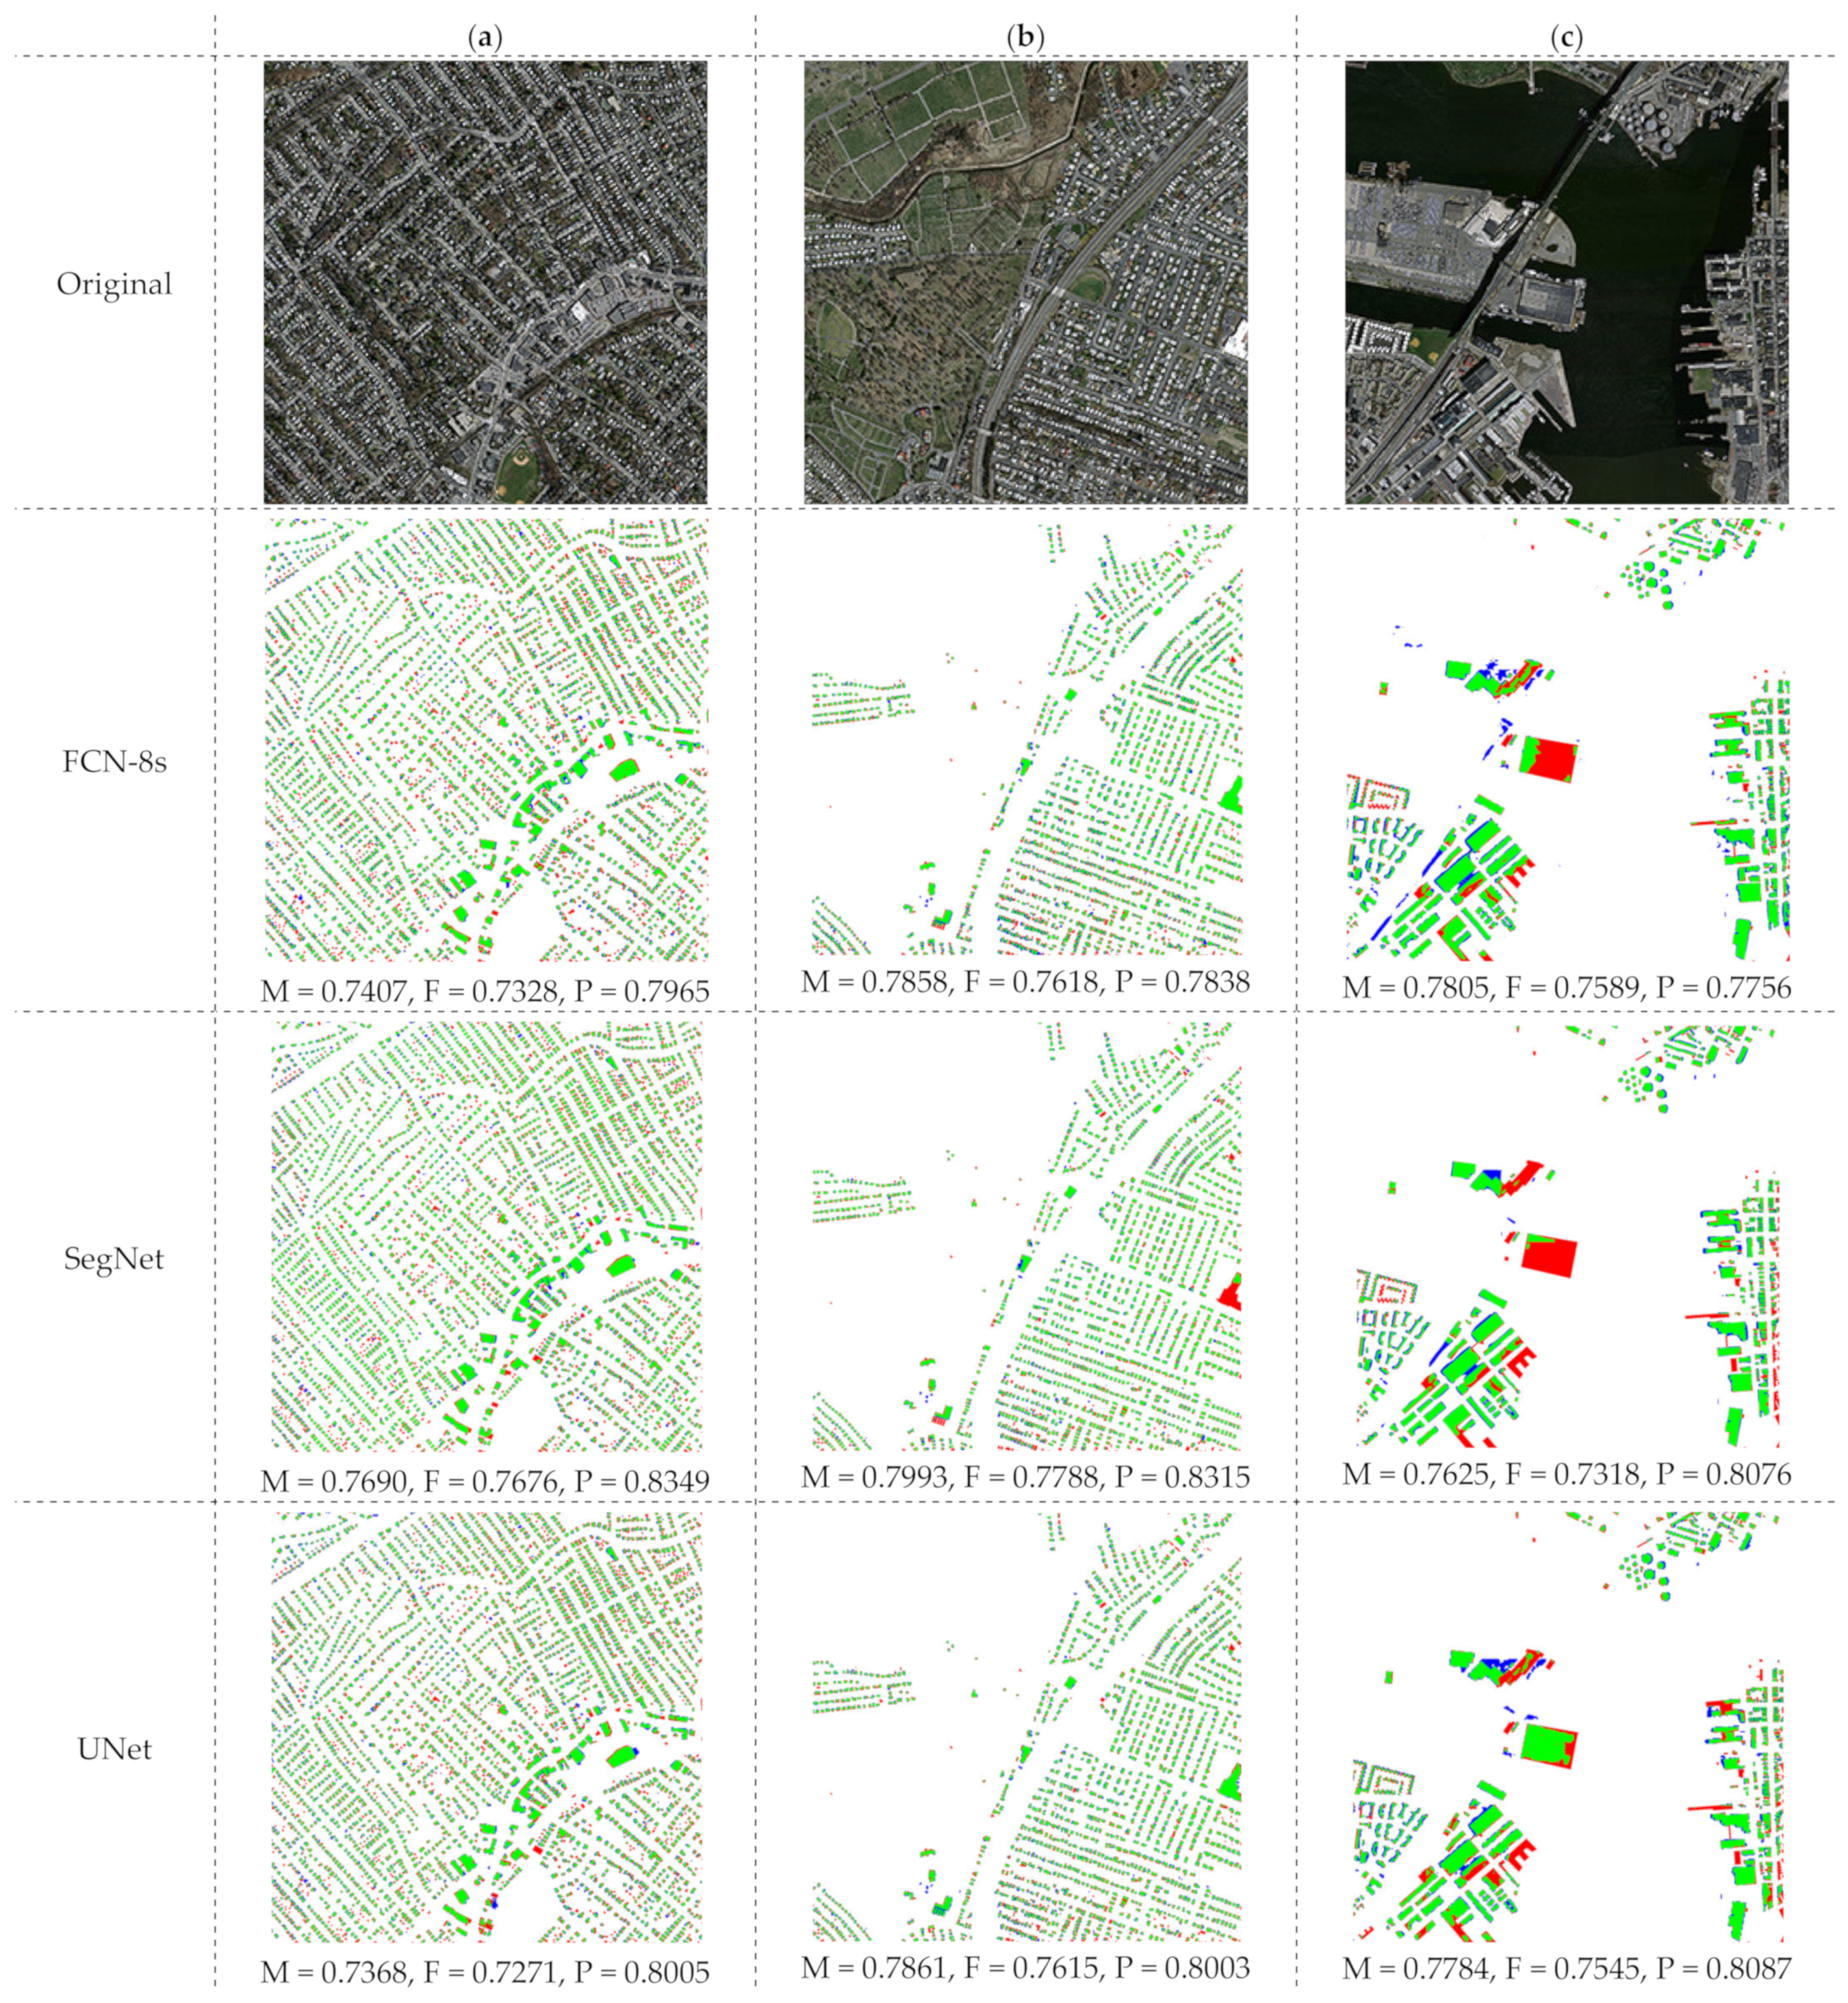
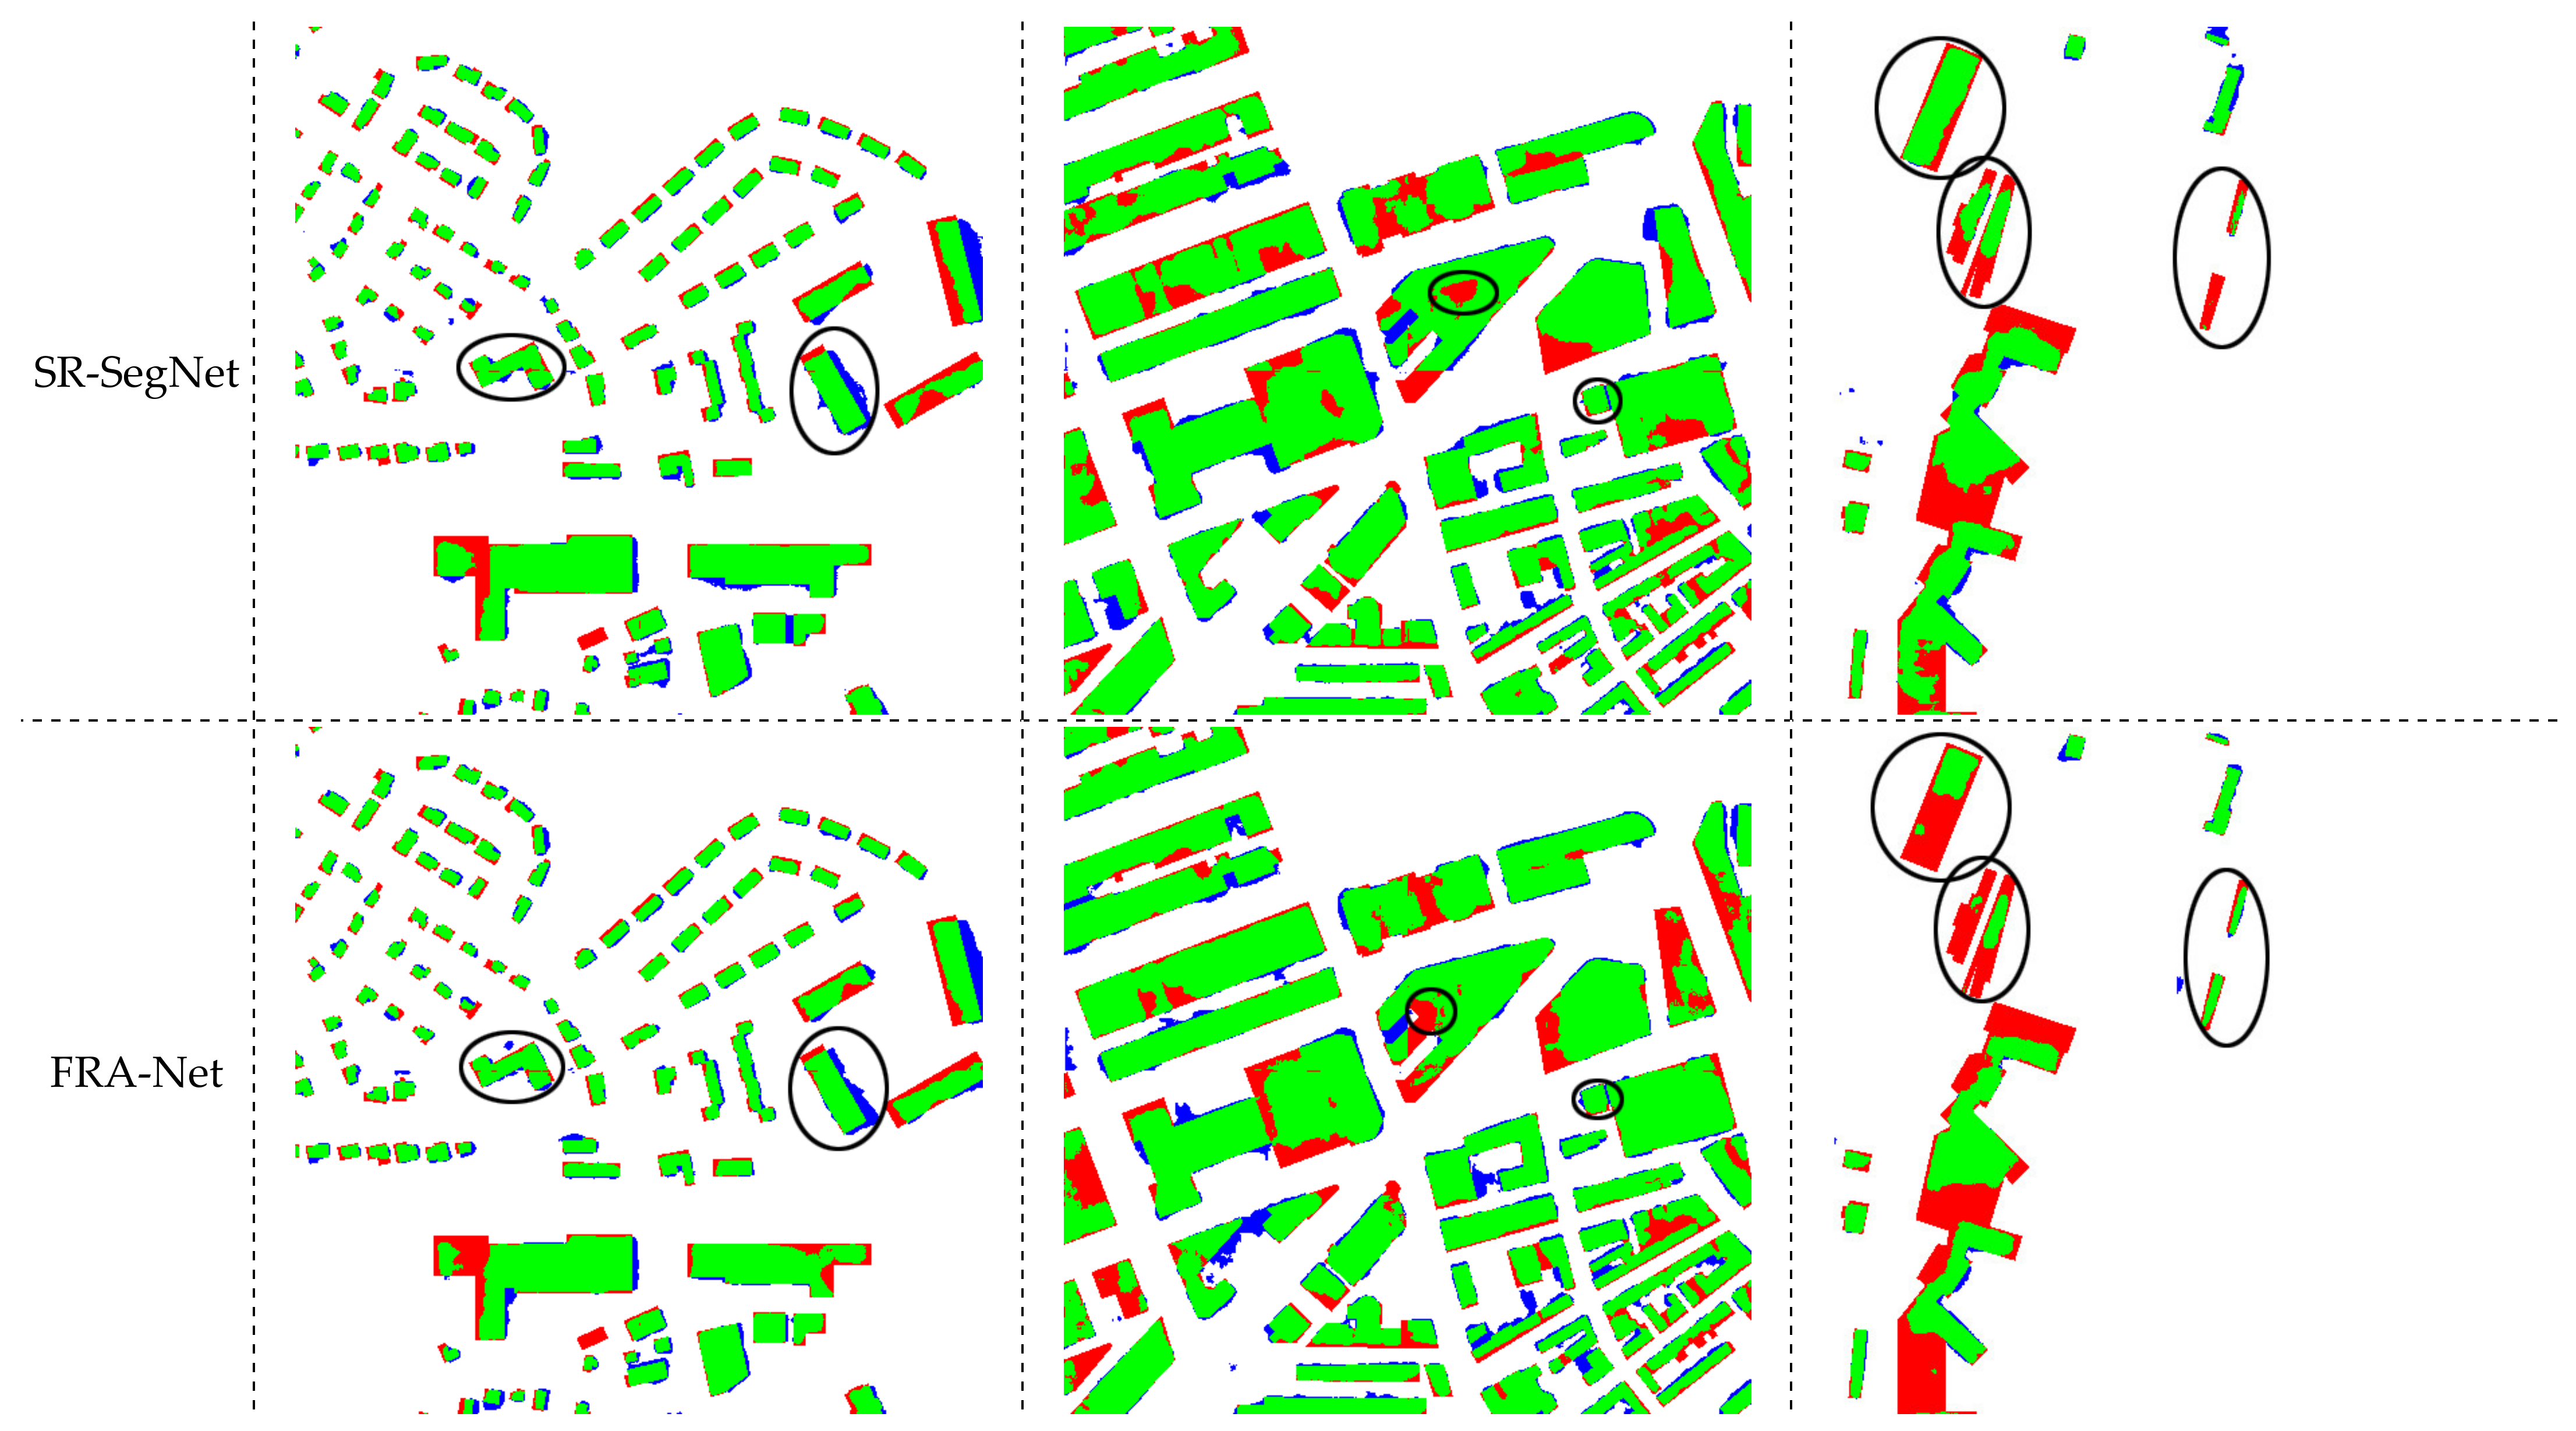
In order to further verify the effectiveness and generalization performance of the model proposed in this paper, the Massachusetts building dataset will be tested. We selected several representative areas, namely residential areas, rural areas, and complex areas, and received the prediction effect map as shown in Figure 8. In Figure 8, green represents true-positives (predicted as buildings, actual buildings); blue represents a false-positive (predicted as a building, but actually a non-building); white represents true-negatives (predicted to be non-building, but actually non-building); red represents false-negatives (predicted as non-buildings, actual buildings), M represents the mIoU, F represents the F1 score, and P represents the accuracy rate.
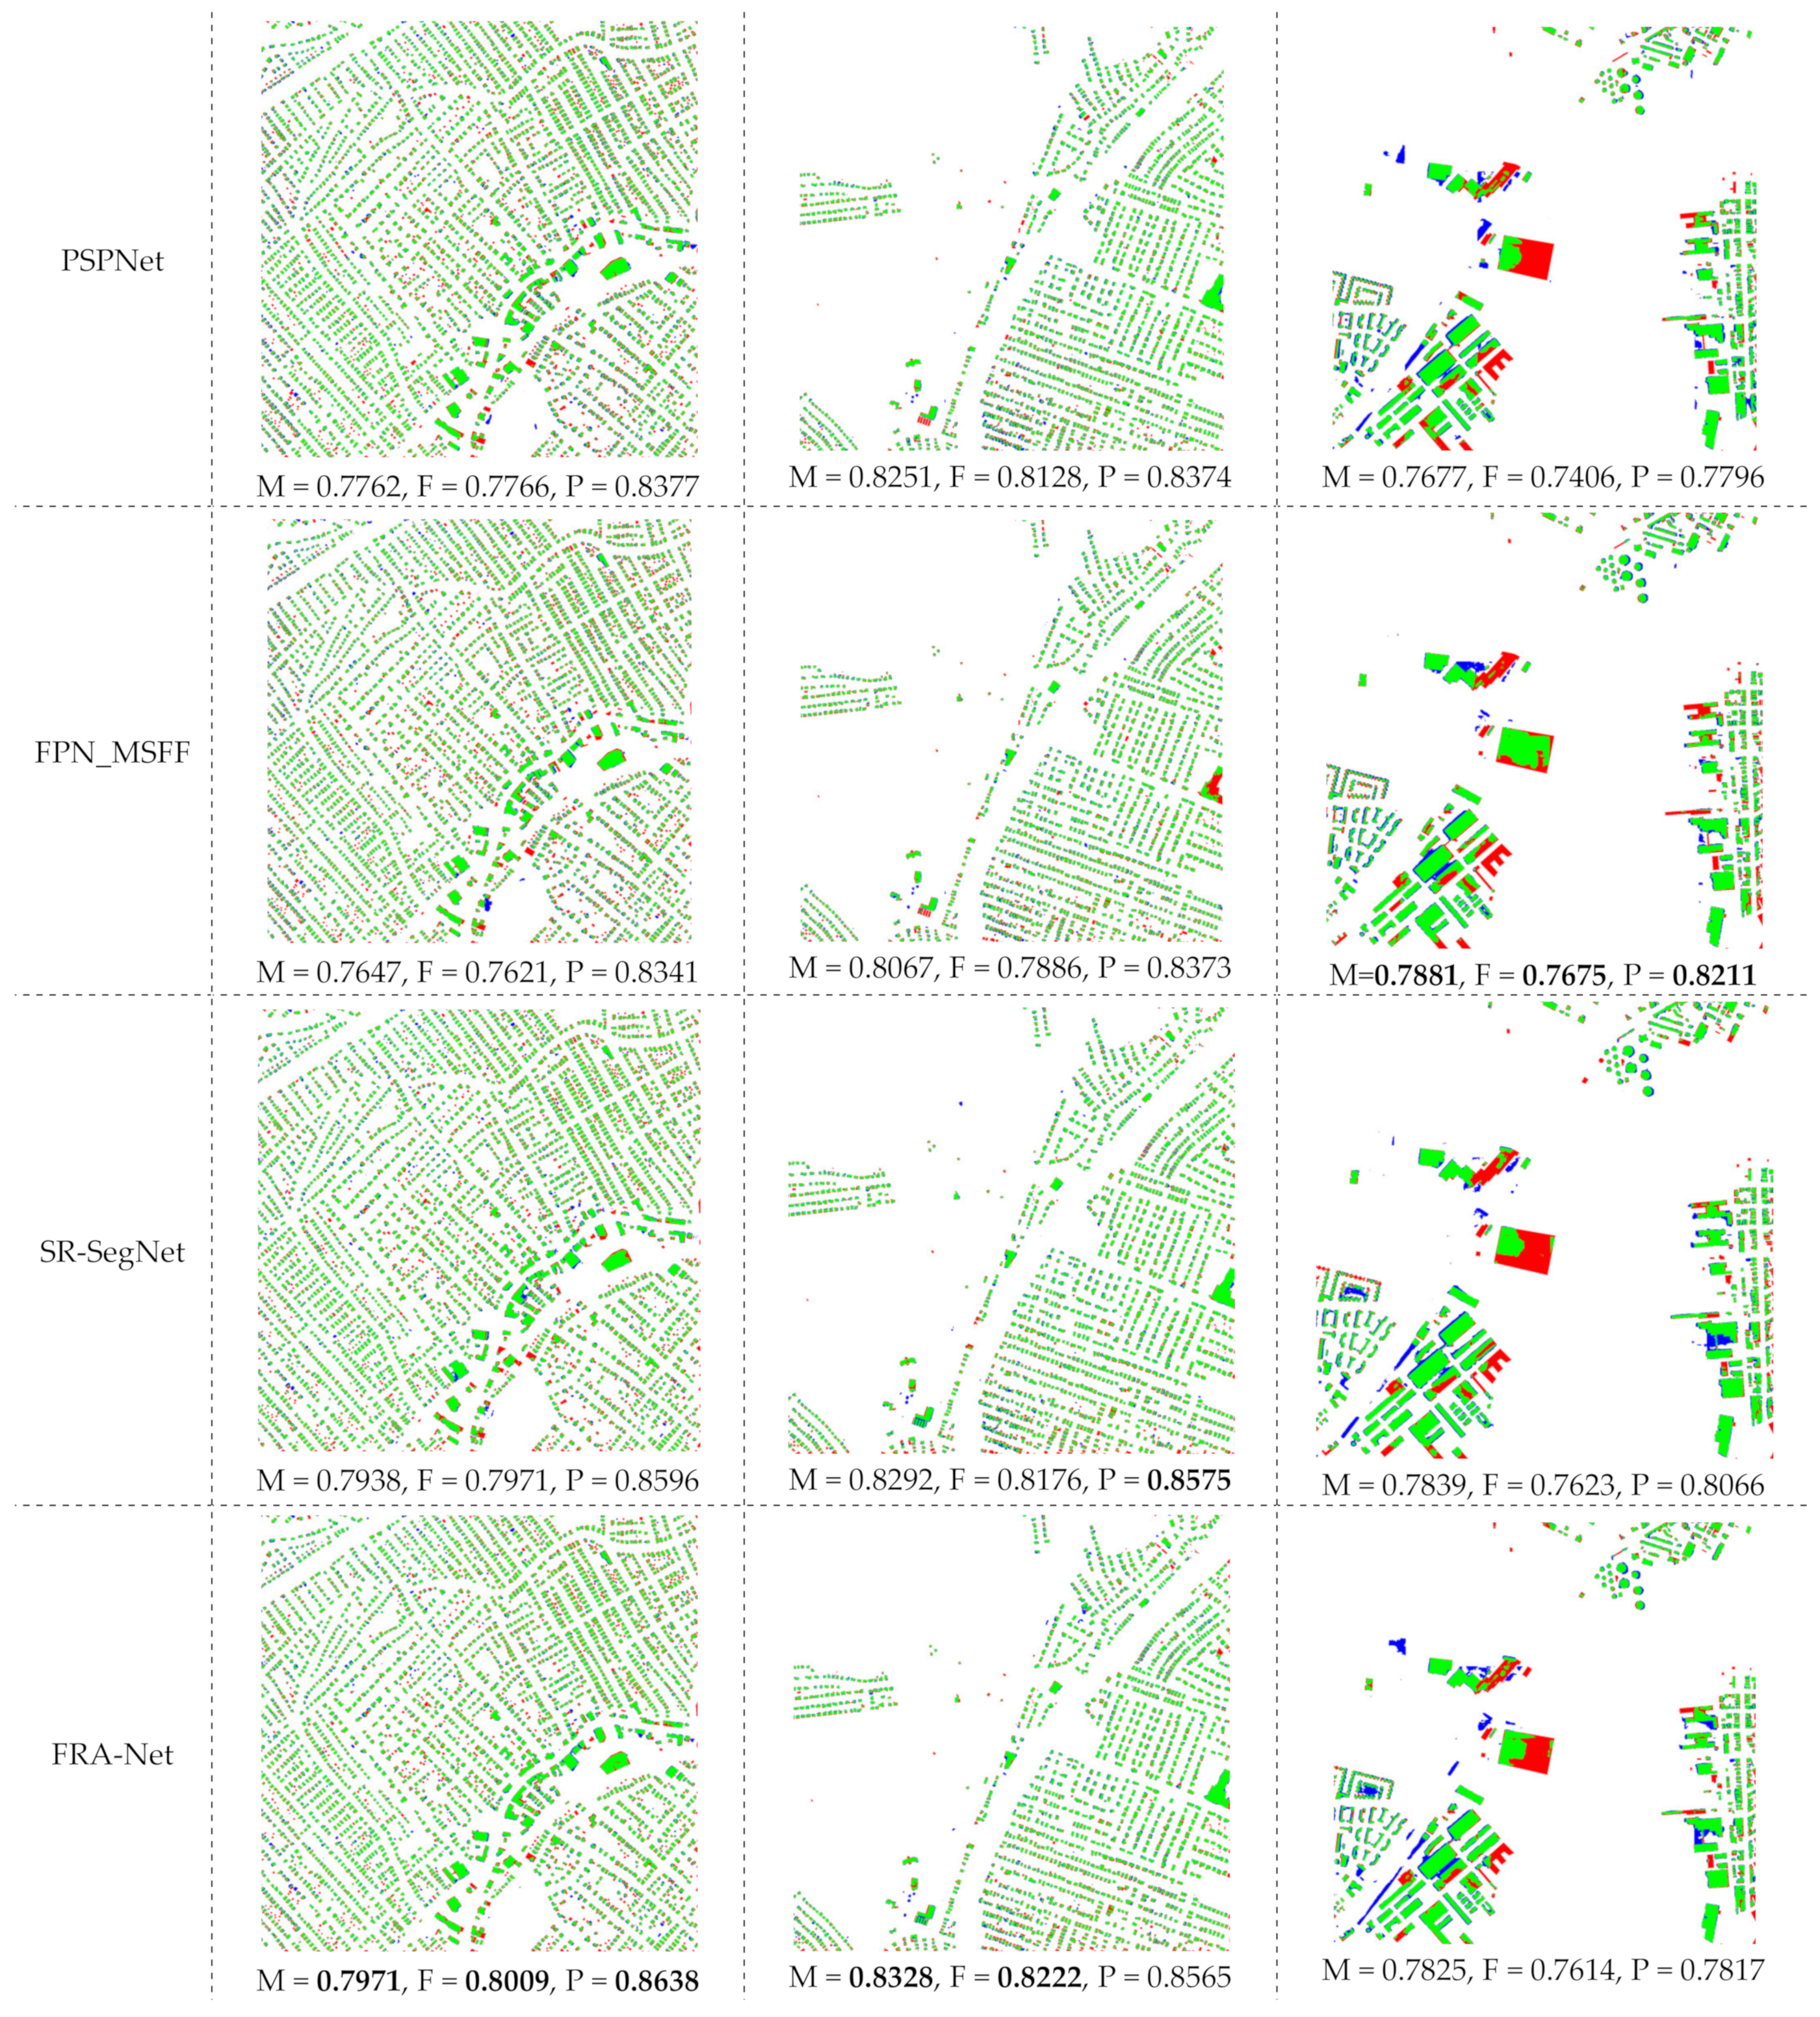
The residential area of the Massachusetts building dataset is very dense. From the evaluation index, SR-SegNet and FRA-Net are still slightly higher than several comparison models. There is a possible explanation. In such a large scene, the pixel of 1500 × 1500 cannot satisfy so many dense buildings, and it is difficult for the model to extract the different features. In rural areas, the segmentation difference of each model is more obvious. Both the SR-SegNet and FRA-Net proposed in this paper predict good results, but there are also some areas that are easy to miss, mainly because the features of missed buildings are quite different from other buildings. The number is small, which easily leads to insufficient model learning. For complex regions, the prediction effects of several models are not very good, and there are a lot of missed detections and false detections. Among them, FPN_MSFF has the best segmentation effect, followed by SR-SegNet and FRA-Net.
Table 4 shows the evaluation results of different models in the Massachusetts building test set. There are 10 remote sensing images with 1500 × 1500 in the Massachusetts building test set. It can be found from the table that the SR-SegNet model has the highest precision, 1.64% higher than the classic SegNet, and 4.96%, 3.71%, 1.99%, and 1.35% higher than FCN-8s, UNet, PSPNet, and FPN_MSFF, respectively. The F1 score also reached 0.8149, and the F1 score of FRA-Net proposed in this paper reached 0.8164, the highest among several models, indicating that the false detection rate is low. In the mIoU evaluation index, the five comparison models have very little difference, but SR-SegNet and FRA-Net reached highs of 0.8062 and 0.8049, respectively, indicating that the model’s segmentation is more accurate. It is worth noting that FRA-Net’s inference for a single remote sensing image is only 1.23 s in terms of prediction time, which is 3.17 times faster than FCN-8s. This will be verified again on the Massachusetts building dataset, indicating that the FRA-Net model has good generalization performance, and other comparison models SegNet, UNet, PSPNet, and FPN_MSFF are not as fast as FRA-Net predictions.
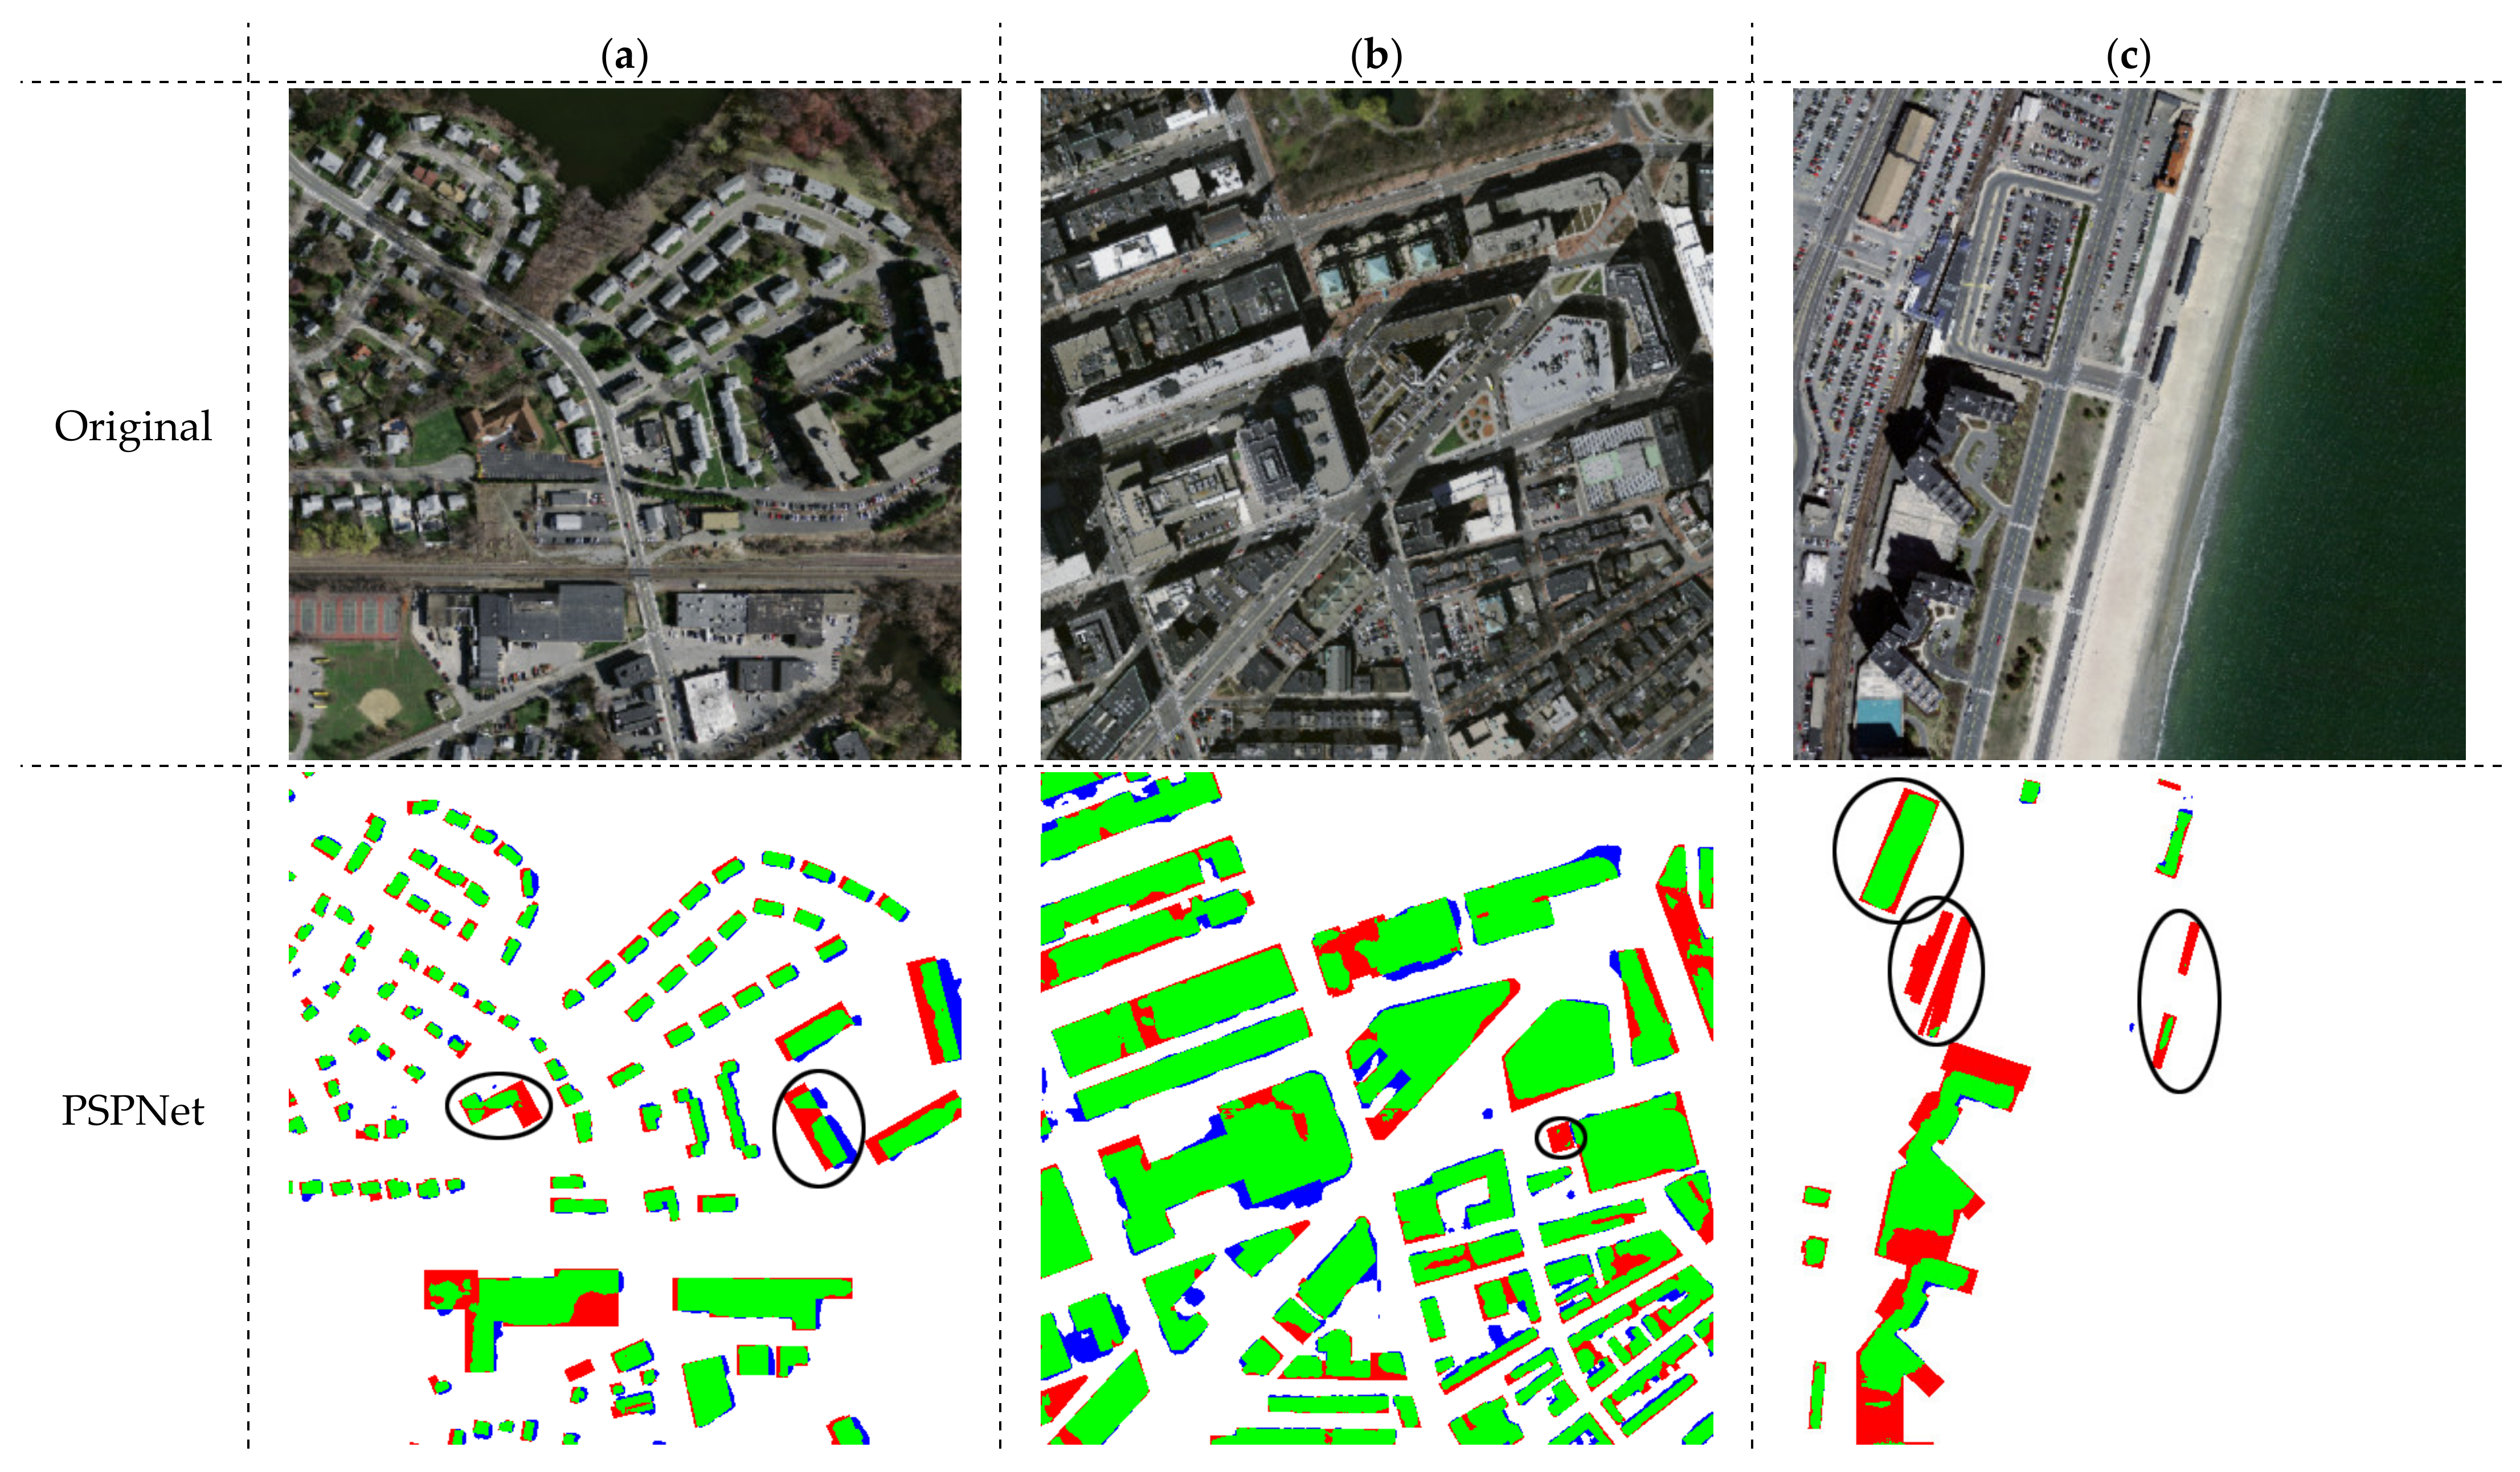
Compared with the LandCover dataset, the mIoU of all models is nearly 10% lower than the above index. The main reason is that the pixel resolution of the Massachusetts building dataset is only 1500 × 1500, and the buildings are very dense. Therefore, the visibility of the cropped 256 × 256 images is reduced, which causes the model to encounter resistance in feature extraction. In addition, the sample size of the dataset is also a large reason. The LandCover dataset has 857 original images with a resolution of 10,000 × 10,000 that have been cropped for training, while the Massachusetts building dataset has only 137 original images at 1500 × 1500. At the same time, the building scenes are not evenly distributed, so the training results are not as good as the LandCover dataset. Overall, the two models, SR-SegNet and FRA-Net, proposed in this paper have indeed achieved good results. From the evaluation indicators tested on the Massachusetts building dataset in Table 4, it can be seen that among the five comparative models, PSPNet’s overall indicators are the best. Therefore, this model and the two models proposed in this paper are selected for qualitative prediction and analysis, mainly from the feature extraction of small-size buildings and large-size buildings. In order to observe the detailed information of the test picture segmentation more intuitively, the three pictures in the test set are selected and cropped to a 512 × 512 size, and the local area map obtained by the model weight prediction is shown in Figure 8.
In Figure 9, green represents true-positives (predicted as buildings, actual buildings); blue represents false-positives (predicted as buildings, actual non-buildings); white represents true-negatives (predicted as non-buildings, actual non-building); red represents a false-negative (predicted as a non-building, but actually a building). In Figure 9a, the prediction of small-sized buildings in the Massachusetts building dataset is made. It can be found that the overall segmentation effect of the three models for small-sized buildings is still better, and most buildings can be accurately predicted. It can be observed in the black circled area in Figure 9a that for the yellow buildings in the original image, PSPNet missed a part of the detection, but the surrounding black and white buildings have been identified. In contrast, SR-SegNet and FRA-Net can perform good recognition, which also reflects that the generalization of these two models is better than PSPNet. Figure 9b shows the prediction effect of large buildings. There are more red and blue areas in the figure, indicating that the three models have more cases of missed and false detections. However, it is not difficult to find some details from the black circled area in Figure 9b. PSPNet missed the small size building next to the large building, while SR-SegNet and FRA-Net recognized this small size well. This shows, to a certain extent, that these two models can recognize buildings in more complex scenes. This may benefit from the symmetrical structure of the two models, which facilitates better recovery of the extracted features. In addition, the effect of PSPNet on building boundary restoration in Figure 9b is slightly better than that of SR-SegNet and FRA-Net. The scene in Figure 9c is more complicated, and the black circled area in the figure is part of the area that the three models missed. Because there are many distractors in this scene, such as cars and containers, and there are many irregularly shaped buildings, this makes the model judgment wrong, which is also one of the problems to be solved in the future.
4. Discussion
At present, many semantic segmentation algorithms for automatic extraction of buildings from remote sensing images have emerged, but most of these algorithms spend a lot of effort on extraction accuracy, and there is little research on extraction speed. This work designs FRA-Net from the two aspects of balancing extraction accuracy and extraction speed. First, in order to reduce the gradient disappearance phenomenon in the training process of the model, the depth residual learning method is used to extract the building features in the remote sensing image in the coding stage. In order to reduce a large number of parameters, the depth separable convolution is introduced to improve the efficiency, and the separable residual module is designed to complete the downsampling work. In addition, in order to obtain the multi-scale information of building remote sensing images, a feature pyramid pooling module is designed to focus on context and extract multi-layer features more effectively. In the decoding stage, on the one hand, the separable residual module is used to gradually recover the spatial information to generate the final building segmentation result. On the other hand, the idea of an attention mechanism is introduced, and a multi-feature attention module is designed to recover the context information learned in the coding stage from multiple scales in an aggregated way.
It can be seen from the experimental results that the accuracy of the method proposed in this paper can reach the premise of the latest method and can improve the operation efficiency of the model. Although FRA-Net has achieved better segmentation results than other semantic segmentation models, there are still many missed and false detections. On the one hand, due to the lack of training sets for special buildings, the segmentation effect can be improved by increasing the number of training sets. On the other hand, the semantic segmentation algorithm can be integrated with the target detection task to further optimize the network model.
5. Conclusions
Remote sensing technology has become more and more mature with the development of satellite technology. Obtaining high-quality remote sensing images is one of the applications of remote sensing technology. By analyzing remote sensing images of buildings and obtaining information to better formulate strategies, it is of great significance to better solve the problem of sustainable development [38]. In the past, it mainly relied on manual methods to extract feature information from remote sensing images of buildings. This method requires a lot of labor costs and is inefficient. Therefore, we are looking for a new high-efficiency and low-cost way to complete remote sensing images. The extraction of buildings has become a top priority.
This paper first introduces the structure of the proposed FRA-Net, including the designed SRM, FPP module, and MFA module. It mainly starts from two aspects: simplifying the model structure and improving the feature extraction ability of the model. Then related ablation experiments and model comparison experiments are carried out on the LandCover dataset. Compared with other methods (FCN, SegNet, UNet, PSPNet, and FPN_MSFF), the proposed method has advantages in accuracy and computational efficiency. After that, the two models proposed in this paper, SR-SegNet and FRA-Net, are verified on the Massachusetts building dataset, and the generalization performance and effectiveness of the model are proved once again.
Author Contributions
Conceptualization, Y.M. and S.J.; methodology, Y.M. and S.J.; software, Y.M., Y.X. and S.J.; validation, Y.M. and S.J.; formal analysis, Y.M. and S.J.; investigation, Y.M., Y.X. and S.J.; resources, S.J.; data curation, S.J.; writing—original draft preparation, Y.M. and. Y.X.; writing—review and editing, S.J. and D.W.; visualization, Y.M. and Y.X.; supervision, S.J.; project administration, S.J.; funding acquisition, S.J. All authors have read and agreed to the published version of the manuscript.
Funding
This research received no external funding.
Institutional Review Board Statement
Not applicable.
Informed Consent Statement
Not applicable.
Data Availability Statement
The data and the code of this study are available from the corresponding author upon request ([email protected]).
Conflicts of Interest
The authors declare no conflict of interest.
References
- Yang, T.; Jin, Y.; Yan, L.; Pei, P. Aspirations and realities of polycentric development: Insights from multi-source data into the emerging urban form of Shanghai. Environ. Plan. B Urban Anal. City Sci. 2019, 46, 1264–1280. [Google Scholar] [CrossRef]
- Pieterse, E. Building with Ruins and Dreams: Some Thoughts on Realising Integrated Urban Development in South Africa through Crisis. Urban Stud. 2006, 43, 285–304. [Google Scholar] [CrossRef]
- Huang, X.; Zhang, L.; Zhu, T. Building Change Detection From Multitemporal High-Resolution Remotely Sensed Images Based on a Morphological Building Index. IEEE J. Sel. Top. Appl. Earth Obs. Remote Sens. 2013, 7, 105–115. [Google Scholar] [CrossRef]
- Inglada, J. Automatic recognition of man-made objects in high resolution optical remote sending images by SVM classification of geometric image features. ISPRS J. Photogramm. Remote Sens. 2007, 62, 236–248. [Google Scholar] [CrossRef]
- Chen, R.; Li, X.; Li, J. Object-Based Features for House Detection from RGB High-Resolution Images. Remote Sens. 2018, 10, 451. [Google Scholar] [CrossRef] [Green Version]
- Liu, P.; Liu, X.; Liu, M.; Shi, Q.; Yang, J.; Xu, X.; Zhang, Y. Building Footprint Extraction from High-Resolution Images via Spatial Residual Inception Convolutional Neural Network. Remote Sens. 2019, 11, 830. [Google Scholar] [CrossRef] [Green Version]
- Ok, A.; Senaras, C.; Yuksel, B. Automated Detection of Arbitrarily Shaped Buildings in Complex Environments From Monocular VHR Optical Satellite Imagery. IEEE Trans. Geosci. Remote Sens. 2012, 51, 1701–1717. [Google Scholar] [CrossRef]
- Song, L.; Xia, M.; Jin, J.; Qian, M.; Zhang, Y. SUACDNet: Attentional change detection network based on siamese U-shaped structure. Int. J. Appl. Earth Obs. Geoinf. ITC J. 2021, 105, 102597. [Google Scholar] [CrossRef]
- Xia, M.; Liu, W.; Wang, K.; Song, W.; Chen, C.; Li, Y. Non-intrusive load disaggregation based on composite deep long short-term memory network. Expert Syst. Appl. 2020, 160, 113669. [Google Scholar] [CrossRef]
- Krizhevsky, A.; Sutskever, I.; Hinton, G.E. Imagenet classification with deep convolutional neural networks. NIPS 2012, 60, 84–90. [Google Scholar] [CrossRef]
- Simonyan, K.; Zisserman, A. Very Deep Convolutional Networks for Large-Scale Image Recognition. arXiv 2014, arXiv:1409.1556. [Google Scholar]
- He, K.; Zhang, X.; Ren, S.; Sun, J. Deep residual learning for image recognition. In Proceedings of the IEEE Conference on Computer Vision and Pattern Recognition, Las Vegas, NV, USA, 26 June–1 July 2016; pp. 770–778. [Google Scholar]
- Huang, G.; Liu, Z.; Maaten, L.; Weinberger, K. Densely connected convolutional networks. In Proceedings of the IEEE Conference on Computer Vision and Pattern Recognition, Honolulu, HI, USA, 21–26 July 2017; pp. 4700–4708. [Google Scholar]
- Xia, M.; Qu, Y.; Lin, H. PANDA: Parallel asymmetric network with double attention for cloud and its shadow detection. J. Appl. Remote Sens. 2021, 15, 046512. [Google Scholar] [CrossRef]
- Szegedy, C.; Vanhoucke, V.; Ioffe, S.; Shlens, J.; Wojna, Z. Rethinking the Inception Architecture for Computer Vision. In Proceedings of the IEEE Conference on Computer Vision and Pattern Recognition, Las Vegas, NV, USA, 27–30 June 2016; pp. 2818–2826. [Google Scholar]
- Szegedy, C.; Ioffe, S.; Vanhoucke, V.; Alemi, A. Inception-v4, Inception-ResNet and the Impact of Residual Connections on Learning. In Proceedings of the Thirty-First AAAI Conference on Artificial Intelligence, San Francisco, CA, USA, 2–9 February 2017; pp. 4278–4284. [Google Scholar]
- Qu, Y.; Xia, M.; Zhang, Y. Strip pooling channel spatial attention network for the segmentation of cloud and cloud shadow. Comput. Geosci. 2021, 157, 104940. [Google Scholar] [CrossRef]
- Long, J.; Shelhamer, E.; Darrell, T. Fully convolutional networks for semantic segmentation. In Proceedings of the IEEE Conference on Computer Vision and Pattern Recognition, Boston, MA, USA, 7–12 June 2015; pp. 3431–3440. [Google Scholar]
- Noh, H.; Hong, S.; Han, B. Learning Deconvolution Network for Semantic Segmentation. In Proceedings of the IEEE International Conference on Computer Vision, Santiago, CA, USA, 13–16 December 2015; pp. 1520–1528. [Google Scholar]
- Badrinarayanan, V.; Kendall, A.; Cipolla, R. Segnet: A deep convolutional encoder-decoder architecture for image segmentation. IEEE Trans. Pattern Anal. Mach. Intell. 2017, 39, 2481–2495. [Google Scholar] [CrossRef]
- Zhao, H.; Shi, J.; Qi, X.; Wang, X.; Jia, J. Pyramid scene parsing network. In Proceedings of the IEEE Conference on Computer Vision and Pattern Recognition, Honolulu, HI, USA, 21–26 July 2017; pp. 2881–2890. [Google Scholar]
- Tang, Y.; Zhang, L. Urban Change Analysis with Multi-Sensor Multispectral Imagery. Remote Sens. 2017, 9, 252. [Google Scholar] [CrossRef] [Green Version]
- Lu, T.; Ming, D.; Lin, X.; Hong, Z.; Bai, X.; Fang, J. Detecting Building Edges from High Spatial Resolution Remote Sensing Imagery Using Richer Convolution Features Network. Remote Sens. 2018, 10, 1496. [Google Scholar] [CrossRef] [Green Version]
- Zhang, X.; Xiao, Z.; Li, N.; Fan, M.; Zhao, L. Semantic Segmentation of Remote Sensing Images Using Multiscale Decoding Network. IEEE Geosci. Remote Sens. Lett. 2019, 16, 1492–1496. [Google Scholar] [CrossRef]
- Pan, X.; Yang, F.; Gao, L.; Chen, Z.; Zhang, B.; Fan, H.; Ren, J. Building Extraction from High-Resolution Aerial Imagery Using a Generative Adversarial Network with Spatial and Channel Attention Mechanisms. Remote Sens. 2019, 11, 917. [Google Scholar] [CrossRef] [Green Version]
- Luc, P.; Couprie, C.; Chintala, S.; Verbeek, J. Semantic segmentation using adversarial networks. In Proceedings of the Thirtieth Conference on Neural Information Processing Systems, Barcelona, Spain, 5–10 December 2016; pp. 1256–1270. [Google Scholar]
- Zhang, Z.; Wang, Y. JointNet: A Common Neural Network for Road and Building Extraction. Remote Sens. 2019, 11, 696. [Google Scholar] [CrossRef] [Green Version]
- Ji, S.; Wei, S.; Lu, M. Fully Convolutional Networks for Multisource Building Extraction From an Open Aerial and Satellite Imagery Data Set. IEEE Trans. Geosci. Remote Sens. 2018, 57, 574–586. [Google Scholar] [CrossRef]
- Chollet, F. Xception:Deep learning with depthwise separable Convolutions. In Proceedings of the IEEE Conference on Computer Vision and Pattern Recognition, Honolulu, HI, USA, 21–26 July 2017; pp. 1800–1807. [Google Scholar]
- Chen, L.-C.; Papandreou, G.; Kokkinos, I.; Murphy, K.; Yuille, A.L. DeepLab: Semantic Image Segmentation with Deep Convolutional Nets, Atrous Convolution, and Fully Connected CRFs. IEEE Trans. Pattern Anal. Mach. Intell. 2018, 40, 834–848. [Google Scholar] [CrossRef] [PubMed] [Green Version]
- Wang, H.; Wang, Y.; Zhang, Q.; Xiang, S.; Pan, C. Gated Convolutional Neural Network for Semantic Segmentation in High-Resolution Images. Remote Sens. 2017, 9, 446. [Google Scholar] [CrossRef] [Green Version]
- Li, H.; Xiong, P.; An, J.; Wang, L. Pyramid Attention Network for Semantic Segmentation. In Proceedings of the IEEE Conference on Computer Vision and Pattern Recognition, Long Beach, CA, USA, 16–20 June 2019; pp. 2451–2467. [Google Scholar]
- Xia, M.; Zhang, X.; Liu, W.; Weng, L.; Xu, Z. Multi-Stage Feature Constraints Learning for Age Estimation. IEEE Trans. Inf. Forensics Secur. 2020, 15, 2417–2428. [Google Scholar] [CrossRef]
- Xia, M.; Wang, Z.; Lu, M.; Pan, L. MFAGCN: A new framework for identifying power grid branch parameters. Electr. Power Syst. Res. 2022, 207, 107855. [Google Scholar] [CrossRef]
- Hu, J.; Shen, L.; Sun, G. Squeeze-and-excitation networks. IEEE Trans. Pattern Anal. Mach. Intell. 2018, 6, 7132–7141. [Google Scholar]
- Boguszewski, A.; Batorski, D.; Ziemba-Jankowska, N.; Dziedzic, T.; Zambrzycka, A. LandCover. ai: Dataset for automatic mapping of buildings, woodlands, water and roads from aerial imagery. In Proceedings of the IEEE/CVF Conference on Computer Vision and Pattern Recognition, Nashville, TN, USA, 19–25 June 2021; pp. 1102–1110. [Google Scholar]
- Mnih, V. Machine Learning for Aerial Image Labeling; University of Toronto: Toronto, ON, Canada, 2013. [Google Scholar]
- Degert, I.; Parikh, P.; Kabir, R. Sustainability assessment of a slum upgrading intervention in Bangladesh. Cities 2016, 56, 63–73. [Google Scholar] [CrossRef]
Figure 1.
FRA-Net model structure.

Figure 2.
Ordinary residual block and separable residual block. (a) Ordinary residual block; (b) separable residual block.
Figure 2.
Ordinary residual block and separable residual block. (a) Ordinary residual block; (b) separable residual block.

Figure 3.
FPP Module.

Figure 4.
MFA module.

Figure 5.
Local prediction of 1–4 sampling methods in the LandCover dataset, the meaning of colors is buildings (red), woodlands (green), water (grey), and backgrounds (black). (a–e) are the experimental results of 1-4 methods on images from the LandCover dataset.
Figure 5.
Local prediction of 1–4 sampling methods in the LandCover dataset, the meaning of colors is buildings (red), woodlands (green), water (grey), and backgrounds (black). (a–e) are the experimental results of 1-4 methods on images from the LandCover dataset.


Figure 6.
Local prediction of 5–6 sampling methods and FRA-Net in the LandCover dataset, the meaning of colors is buildings (red), woodlands (green), water (grey), and backgrounds (black). (a–e) are the experimental results of 5-6 methods and FRA-Net on images from the LandCover dataset.
Figure 6.
Local prediction of 5–6 sampling methods and FRA-Net in the LandCover dataset, the meaning of colors is buildings (red), woodlands (green), water (grey), and backgrounds (black). (a–e) are the experimental results of 5-6 methods and FRA-Net on images from the LandCover dataset.


Figure 7.
Comparison of two kinds of datasets. (a) residential area; (b) rural area; (c) seaside area.
Figure 7.
Comparison of two kinds of datasets. (a) residential area; (b) rural area; (c) seaside area.

Figure 8.
Comparison of the prediction results of each model in different regions of the Massachusetts building dataset. In the figure, green represents true-positive (predicted as a building, actually a building), blue represents false-positive (predicted as a building, actually a non-building), white represents true-negative (predicted as a non-building, actually a non-building), and red represents false-negative (predicted as a non-building, actually a building). (a) Residential area; (b) Rural area; (c) Complex area.


Figure 9.
The local prediction map of each model in the Massachusetts building dataset. In the figure, green represents true-positive (predicted as a building, actually a building), blue represents false-positive (predicted as a building, actually a non-building), white represents true-negative (predicted as a non-building, actually a non-building), and red represents false-negative (predicted as a non-building, actually a building). (a–c) are the experimental results of various methods on images from the Massachusetts building dataset.


Table 1.
Model hyperparameter settings.
| Parameter | Value |
|---|---|
| Initial learning rate | 0.0003 |
| Batch size | 10 |
| Training steps | 100,000 |
| Loss function | Cross entropy loss + L2 loss |
| Optimization method | Adam |
Table 2.
Evaluation results of different models in the LandCover test set.
| Net | Parameter/M | Floating Point Operations /GFLOPs | Average Prediction Time (Seconds/Frame) | mIoU |
|---|---|---|---|---|
| FCN-8s | 121.6 | 54.13 | 86.57 | 0.8233 |
| SegNet | 30.5 | 80.20 | 42.80 | 0.8275 |
| UNet | 35.0 | 34.61 | 41.20 | 0.8301 |
| PSPNet | 38.0 | 22.54 | 46.54 | 0.8424 |
| FPN_MSFF | 27.0 | 47.43 | 51.82 | 0.8687 |
| FRA-Net | 12.3 | 10.39 | 34.57 | 0.8678 |
Table 3.
Evaluation results of different sampling methods in the LandCover test set.
| Algorithm | Downsampling | Upsampling | F1 Score | mIoU | Prediction Time/s |
|---|---|---|---|---|---|
| Method 1 | VGG16 | RB | 0.8948 | 0.8189 | 31.26 |
| Method 2 | ResNet-101 | RB | 0.9054 | 0.8277 | 57.21 |
| Method 3 | RB | RB | 0.9119 | 0.8439 | 36.58 |
| Method 4 | SRM | SRM | 0.9157 | 0.8555 | 21.13 |
| Method 5 | SRM | SRM+ASPP | 0.9197 | 0.8586 | 24.02 |
| Method 6 | SRM | SRM+FPP | 0.9221 | 0.8604 | 23.60 |
| FRA-Net | SRM | SRM+FPP+MFA | 0.9267 | 0.8678 | 24.28 |
Table 4.
Evaluation results of different methods in the Massachusetts building test set.
| Model | Precision | Recall Rate | F1 Score | Average Inter-Section Ratio | Prediction Time (Seconds/Frame) |
|---|---|---|---|---|---|
| FCN-8s | 0.8095 | 0.7450 | 0.7757 | 0.7717 | 3.91 |
| SegNet | 0.8427 | 0.7192 | 0.7755 | 0.7727 | 2.56 |
| UNet | 0.8220 | 0.7158 | 0.7650 | 0.7630 | 2.23 |
| PSPNet | 0.8392 | 0.7587 | 0.7965 | 0.7899 | 2.72 |
| FPN_MSFF | 0.8456 | 0.7294 | 0.7827 | 0.7788 | 2.59 |
| SR-SegNet | 0.8591 | 0.7755 | 0.8149 | 0.8062 | 1.95 |
| FRA-Net | 0.8582 | 0.7739 | 0.8164 | 0.8049 | 1.23 |
Publisher’s Note: MDPI stays neutral with regard to jurisdictional claims in published maps and institutional affiliations. |
© 2022 by the authors. Licensee MDPI, Basel, Switzerland. This article is an open access article distributed under the terms and conditions of the Creative Commons Attribution (CC BY) license (https://creativecommons.org/licenses/by/4.0/).
Share and Cite
MDPI and ACS Style
Miao, Y.; Jiang, S.; Xu, Y.; Wang, D. Feature Residual Analysis Network for Building Extraction from Remote Sensing Images. Appl. Sci. 2022, 12, 5095. https://0-doi-org.brum.beds.ac.uk/10.3390/app12105095
AMA Style
Miao Y, Jiang S, Xu Y, Wang D. Feature Residual Analysis Network for Building Extraction from Remote Sensing Images. Applied Sciences. 2022; 12(10):5095. https://0-doi-org.brum.beds.ac.uk/10.3390/app12105095
Chicago/Turabian StyleMiao, Yuqi, Shanshan Jiang, Yiming Xu, and Dongjie Wang. 2022. "Feature Residual Analysis Network for Building Extraction from Remote Sensing Images" Applied Sciences 12, no. 10: 5095. https://0-doi-org.brum.beds.ac.uk/10.3390/app12105095
Note that from the first issue of 2016, this journal uses article numbers instead of page numbers. See further details here.