Article

Monitoring and Analysis of Deformation Refinement Characteristics of a Loess Tunnel Based on 3D Laser Scanning Technology

1
School of Civil Engineering, Central South University, Changsha 410075, China
2
Gansu Provincial Highway Aviation Tourism Investment Group Co., Ltd., Lanzhou 730031, China
3
Shanxi Road and Bridge Construction Group Co., Ltd., Taiyuan 030006, China
*
Author to whom correspondence should be addressed.
Submission received: 23 April 2022 / Revised: 18 May 2022 / Accepted: 18 May 2022 / Published: 19 May 2022
(This article belongs to the Special Issue Deep Rock Mass Engineering: Excavation, Monitoring, and Control)

Abstract

:
Loess tunnels often undergo large-scale deformation with complex spatial and temporal distribution. Mastering the characteristics of spatial and temporal deformation is conducive to precise policy implementation and the control of large deformation of the tunnel. In this study, relying on the Yulinzi Tunnel in Gansu Province, China, based on 3D laser scanning technology, the tunnel was monitored for a short period of 24 h and a long period of 36 days. The refined characteristics of the temporal and spatial deformation of the representative points of the interrupted surface, the tunnel face, and the excavation mileage during the excavation process of the three-bench and seven-step method of the tunnel were analyzed. The results show that the tunnel’s arch has large deformation, and there is twisting deformation. The distribution of the overall deformation of the tunnel is related to the excavation sequence, showing a stepped deformation law. With the construction of the following excavation process, the deformation rate of the tunnel always indicates the characteristics of significant in the early stage and small in the later stage, and the overall deformation changes with time in accordance with the distribution law of the exponential function. The research results provide a reference for predicting the deformation development trend of loess tunnels and providing reasonable deformation control methods.

1. Introduction

With the rapid development of highways and railways in various regions of the world, the number of loess tunnels has increased. More and more problems are exposed in the design, construction, operation, and maintenance of loess tunnels. Large deformation is expected, and the resulting rock collapse and structural cracking account for most of the damage [1,2]. Loess tunnels are extremely complex special soil tunnels. Researchers have carried out a lot of scientific research on the problem of large deformation and studied their deformation law in time and space.
Lai Jinxing [3], Zhao Dongping [4], and Bizjak et al. [5] used loess tunnels to track and monitor the deformation of multiple sections of the tunnel during the excavation process. The results show that a certain degree of overall subsidence occurs in the arch after tunnel excavation. The subsidence of the tunnel vault is more significant than the convergence in the horizontal direction. The study by Lu Junfu et al. [6] showed that the surrounding rock of a large-section deep-buried loess tunnel conforms to the spatial distribution law of slow deformation rate of the surrounding rock at the top of the arch and faster deformation rate of the surrounding rock at the sidewall. Through on-site monitoring and numerical simulation, Galli [7] and LI et al. [8] revealed the complex displacement characteristics of loess tunnels under different excavation steps during the construction process of the “sequential excavation method” [9]. Kontogianni [10,11] et al. monitored and analyzed the deformation of the tunnel during the excavation process by geodetic survey, and the results showed that the uncontrolled deformation of certain “weak” sections propagated bidirectionally to adjacent, previously stabilized sections producing a “chain effect”. Qiao Chunsheng et al. [12] studied the time law of the deformation of water-saturated loess tunnels. They concluded that the deformation of the surrounding rock in the early stage after the tunnel excavation develops rapidly, and it is supposed that the deformation of the surrounding rock will tend to be stable until the tunnel face leaves a distance of 35–40 m. On the basis of similar monitoring and analysis methods, Gu [13] and Cao et al. [14] divided the deformation of the tunnel into three stages: rapid deformation stage, continuous deformation stage, and slow growth stage. In addition, the variation characteristics of which function the surrounding rock conforms to overtime mainly focus on two aspects: logarithmic function and exponential function.
It can be seen from the above studies that the characteristics and mechanisms of the large deformation of loess tunnels are extremely complex. That is not only related to the complexity of the loess tunnel itself but also related to the backward monitoring methods and insufficient data on loess tunnel deformation. Most tunnel deformation monitoring still uses a level or total station to observe specific points at intervals. This kind of method is carried out by surveyors setting up instruments in the tunnel for observation, which has the characteristics of high environmental requirements, a small number of measuring points, slow data collection, and high safety risks, and cannot accurately obtain the spatiotemporal evolution law of tunnel deformation [15]. Three-dimensional laser scanning is automatic measurement equipment and technology that has emerged in recent years. It can quickly acquire massive point cloud data with a long measurement distance and low environmental requirements. It is applied to slope stability analysis, the geometric capture of bridges, and deformation monitoring of tunnels by relevant researchers, and good monitoring results are obtained [16,17,18].
To adapt to different monitoring environments, different excavation methods, and different section characteristics, the current application research of 3D laser scanning mainly focuses on two aspects. First, for different monitoring environments, some scholars combine digital images [19], traditional TPS/GPS [20], and other related technologies based on 3D laser scanning technology to achieve fast, flexible, and efficient geometry acquisition and deformation monitoring. Since the original point cloud collected by TLS cannot show the tunnel deformation, Xie [21] developed a new 3D modeling algorithm to measure and visualize the tunnel settlement, segment dislocation, and cross-section convergence. Walton and Delaloye [22] discussed terrestrial LiDAR scanning for the deformation mapping of a surface and cross-sectional closure measurements within an active tunnel using an elliptical fit to data for profile analysis, which ultimately improves monitoring accuracy in fine areas of large-diameter tunnels. Based on the research of Walton [22], Jiang [23] proposed a three-dimensional deformation reconstruction technology method of roadways based on an ellipse fitting algorithm, coordinate transformation, and Multi-scale Model-to-Model Cloud Comparison (M3C2) algorithm and applied this technology to a certain time and space deformation analysis of mine roadways. Based on discussing the adaptability of lidar scanning deformation monitoring in irregular geometry excavation, Walton [24] analyzed and discussed the applicable scopes of the global fitting algorithm and the local averaging algorithm.
For this reason, it is not difficult to find that these studies basically focus on the research of point cloud data processing and related algorithms extracted from 3D scanning to obtain high-density, high-precision, and highly automated measurement results. Undoubtedly, the results of these studies have improved the adaptability of 3D laser scanning for the deformation monitoring of tunnel deployment under complex conditions. However, it is worth noting that the analysis of tunnel deformation data after 3D laser scanning application is still not comprehensive enough, especially for loess tunnels with large deformation and complex deformation characteristics. More attention should be paid to the field application of 3D laser scanning and later data processing. In order to study the temporal and spatial distribution of deformation of loess tunnels finely and understand the characteristics and mechanisms of deformation of loess tunnels, an experimental study was carried out in this paper combined with the Yulinzi Tunnel of Tianyong Expressway in Gansu Province, which can be used as a reference for similar projects and related research.

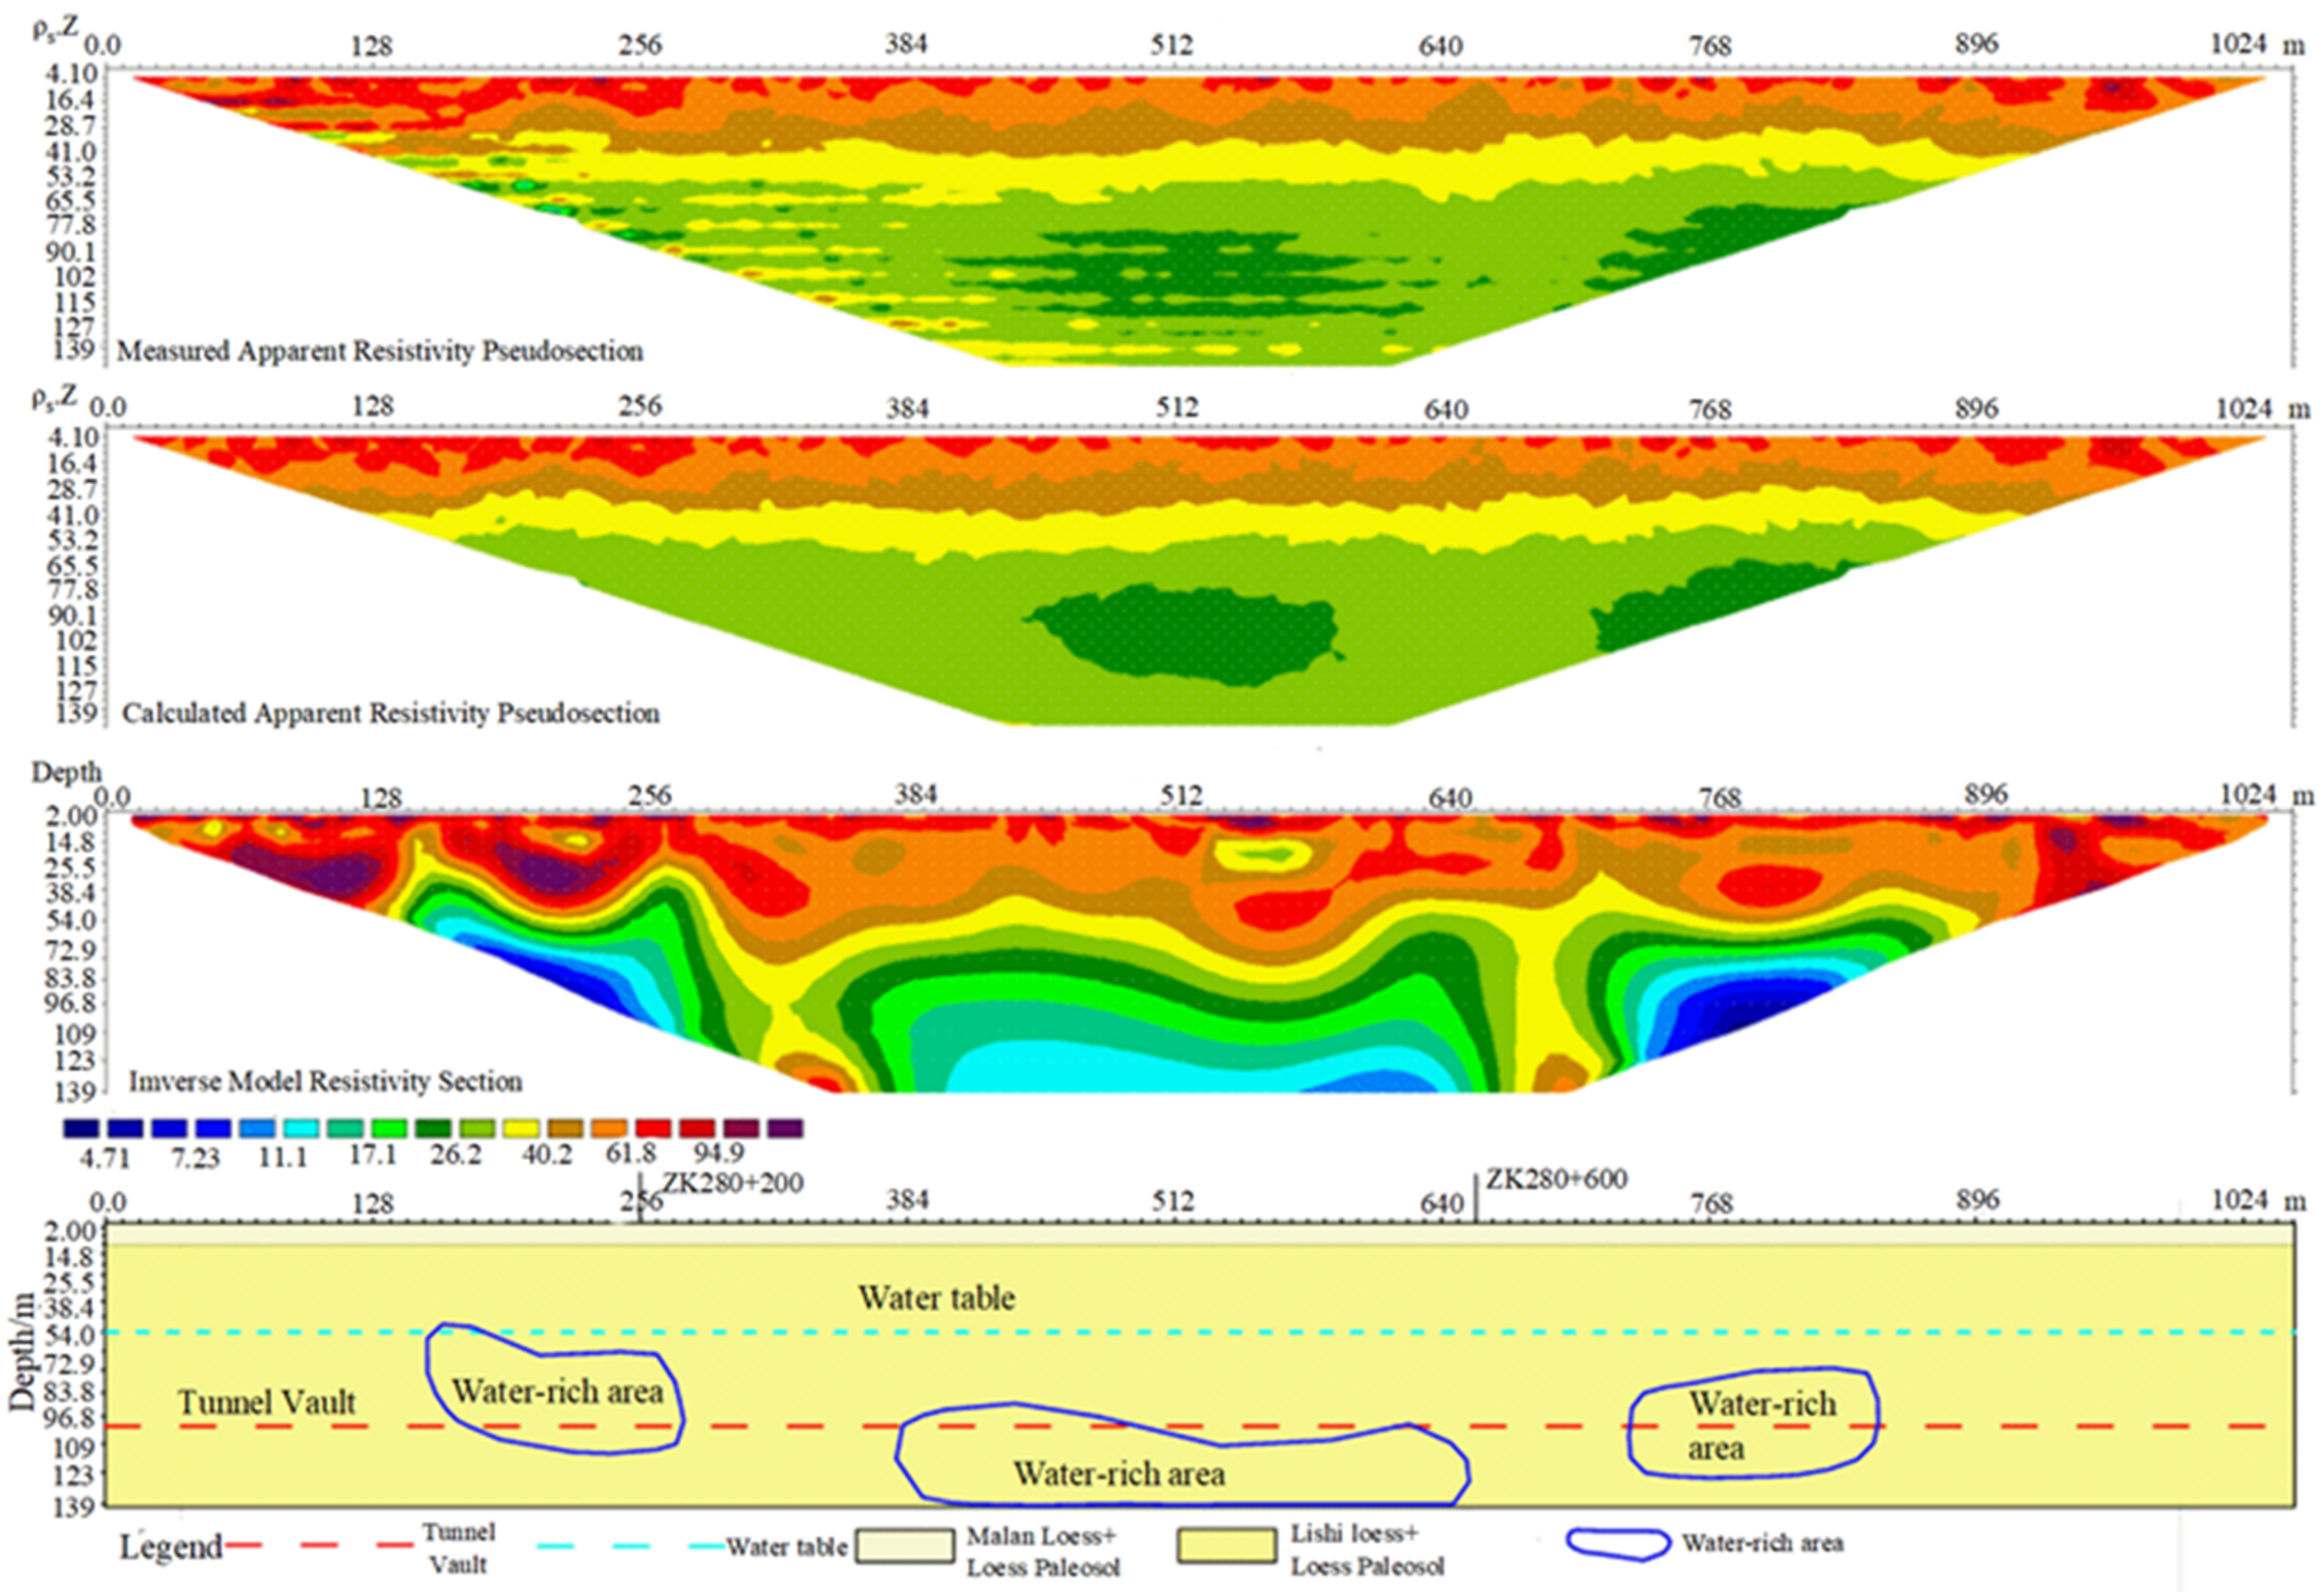
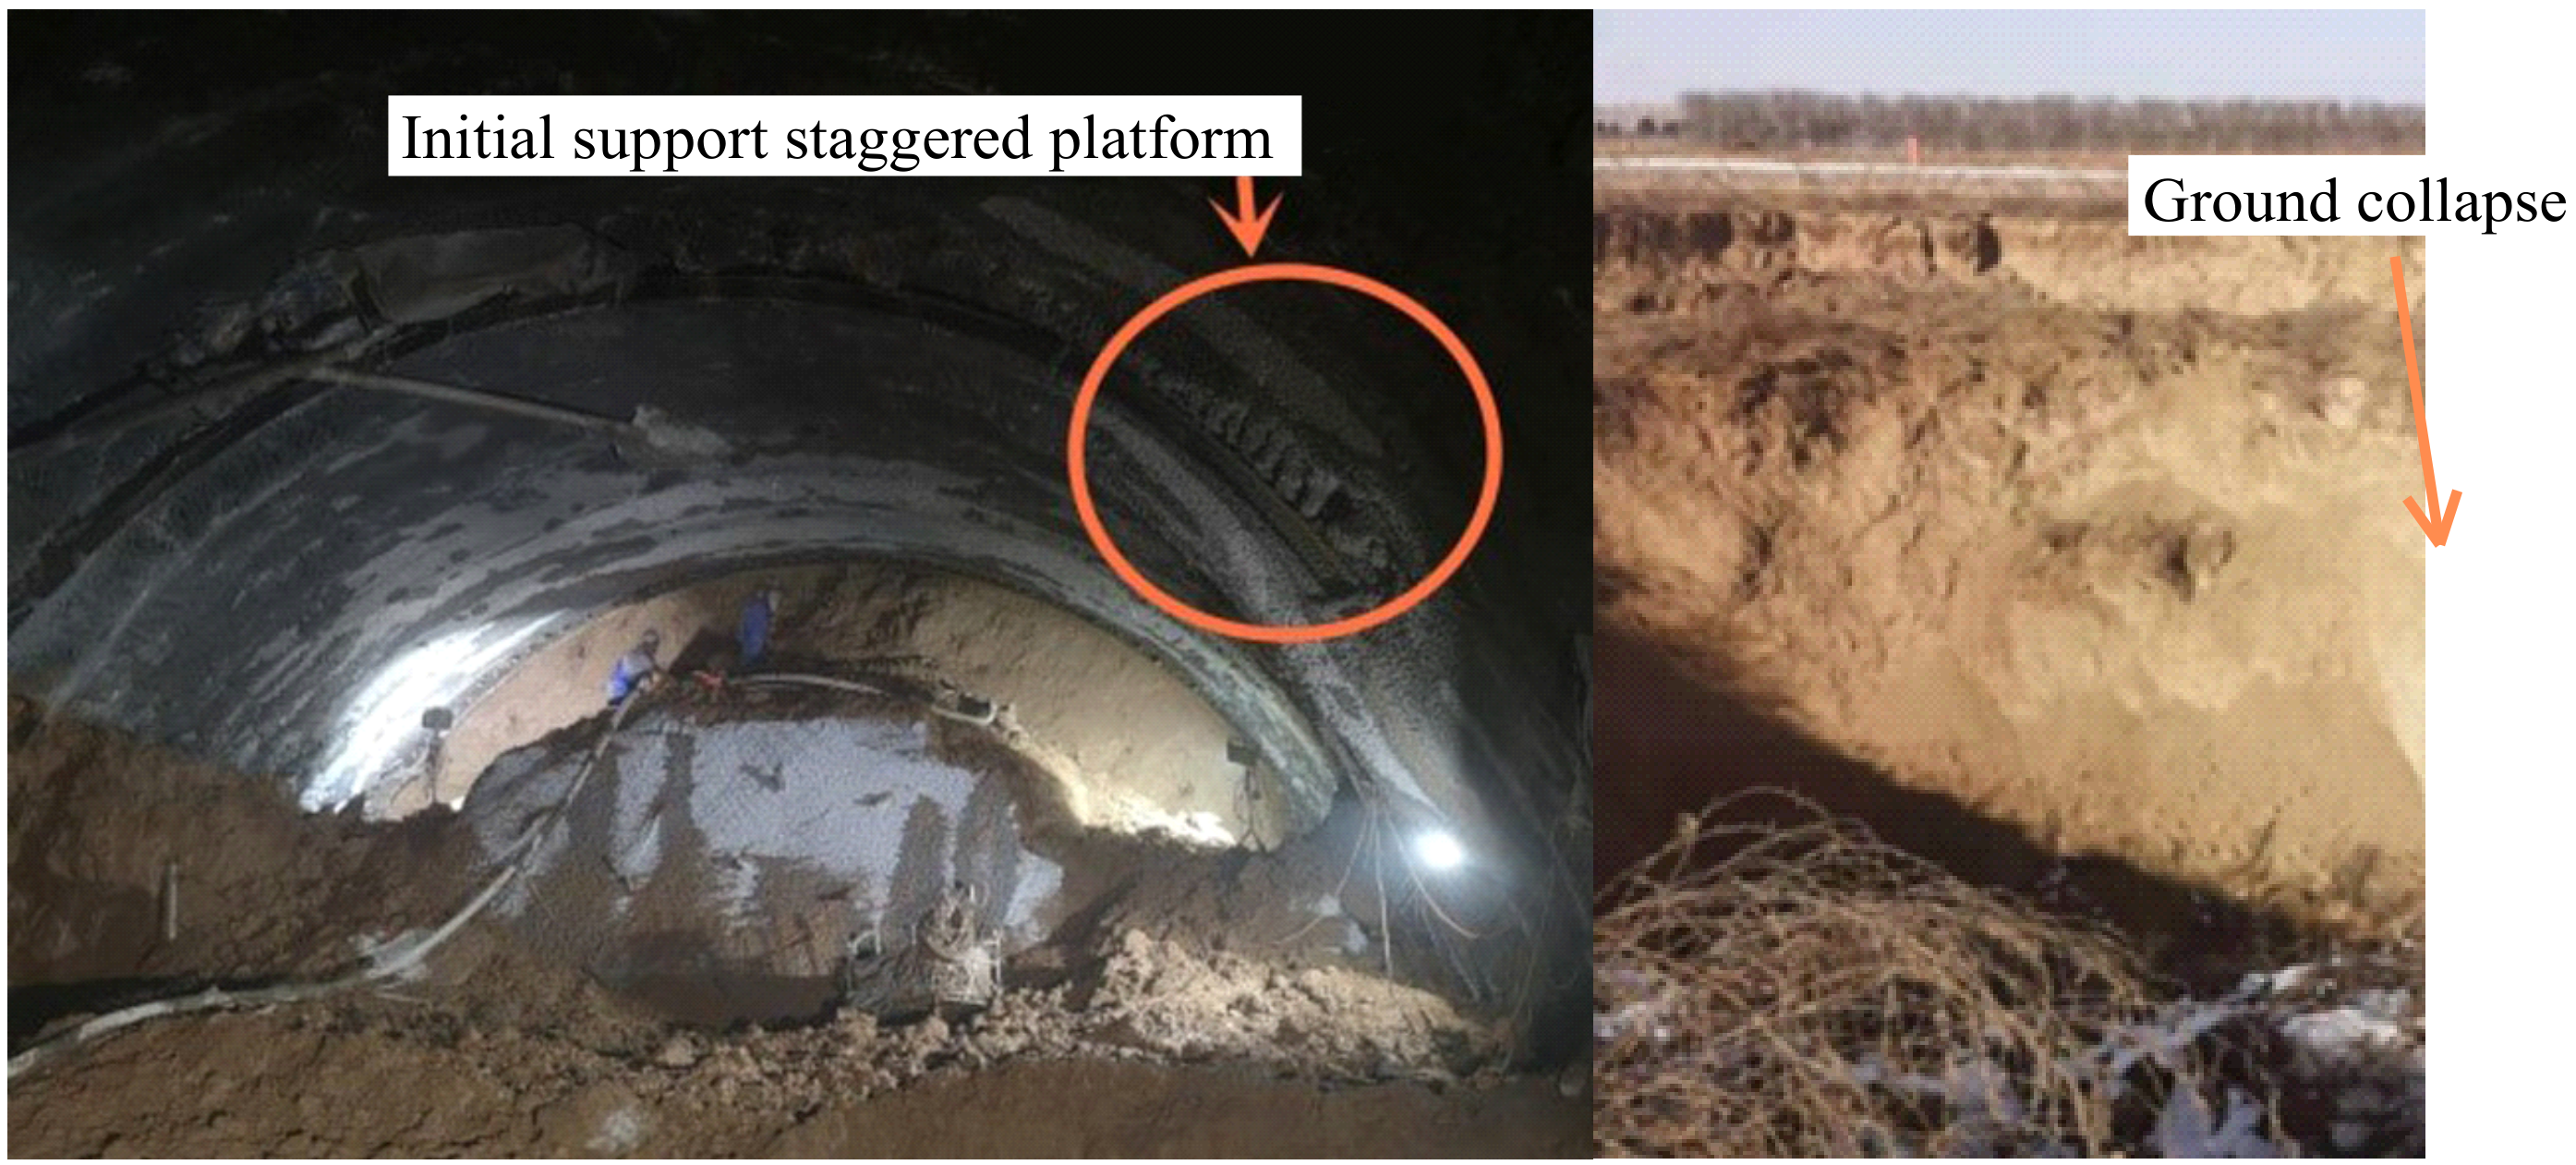
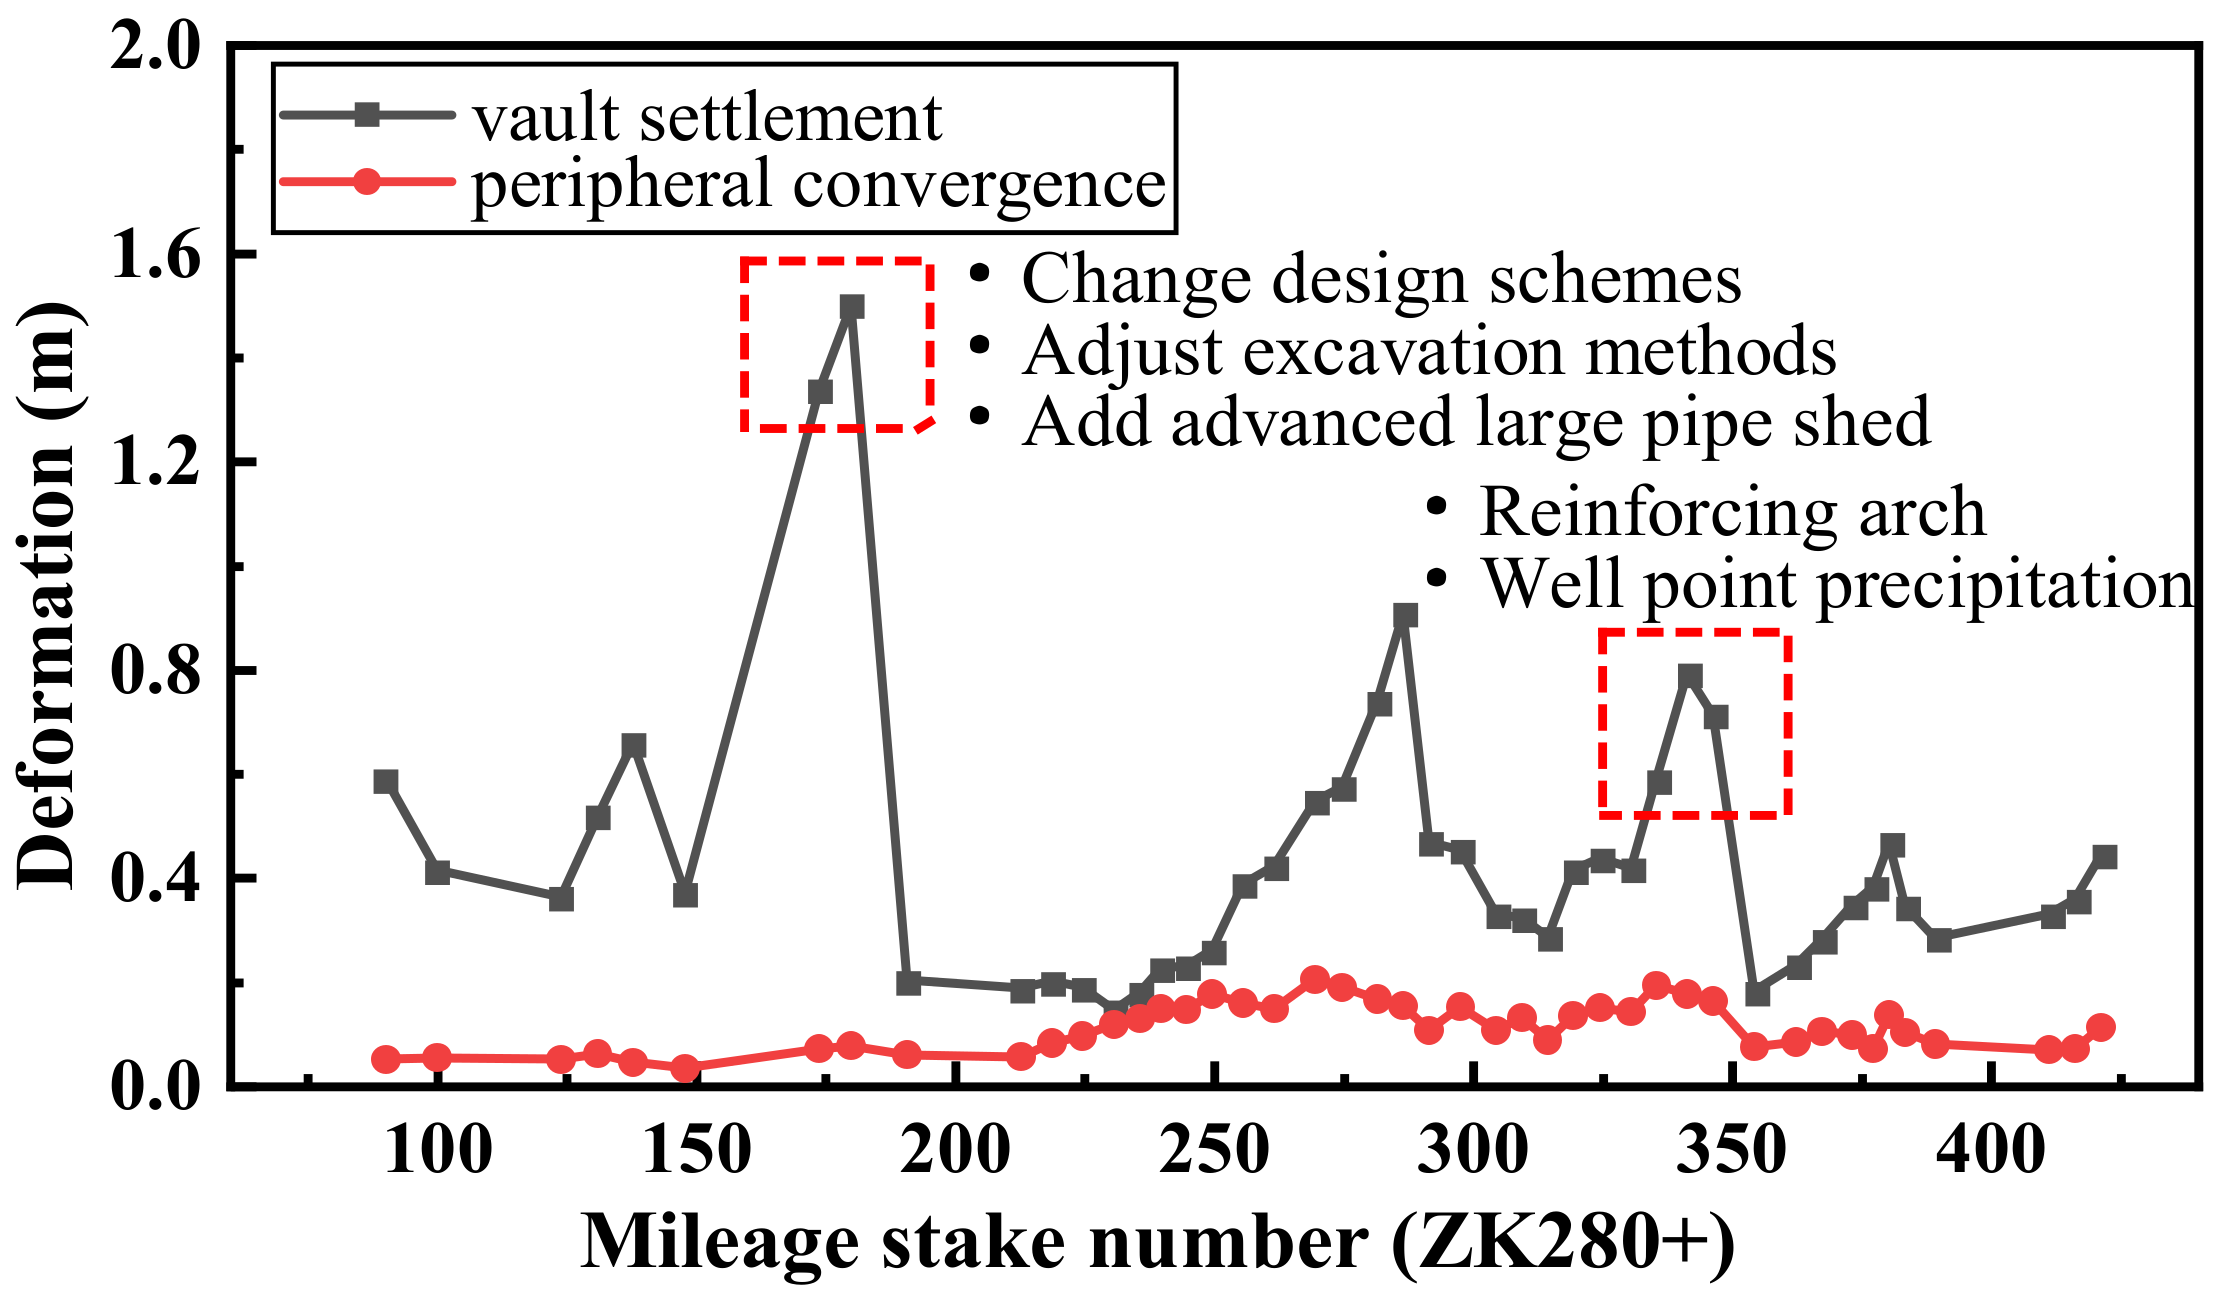
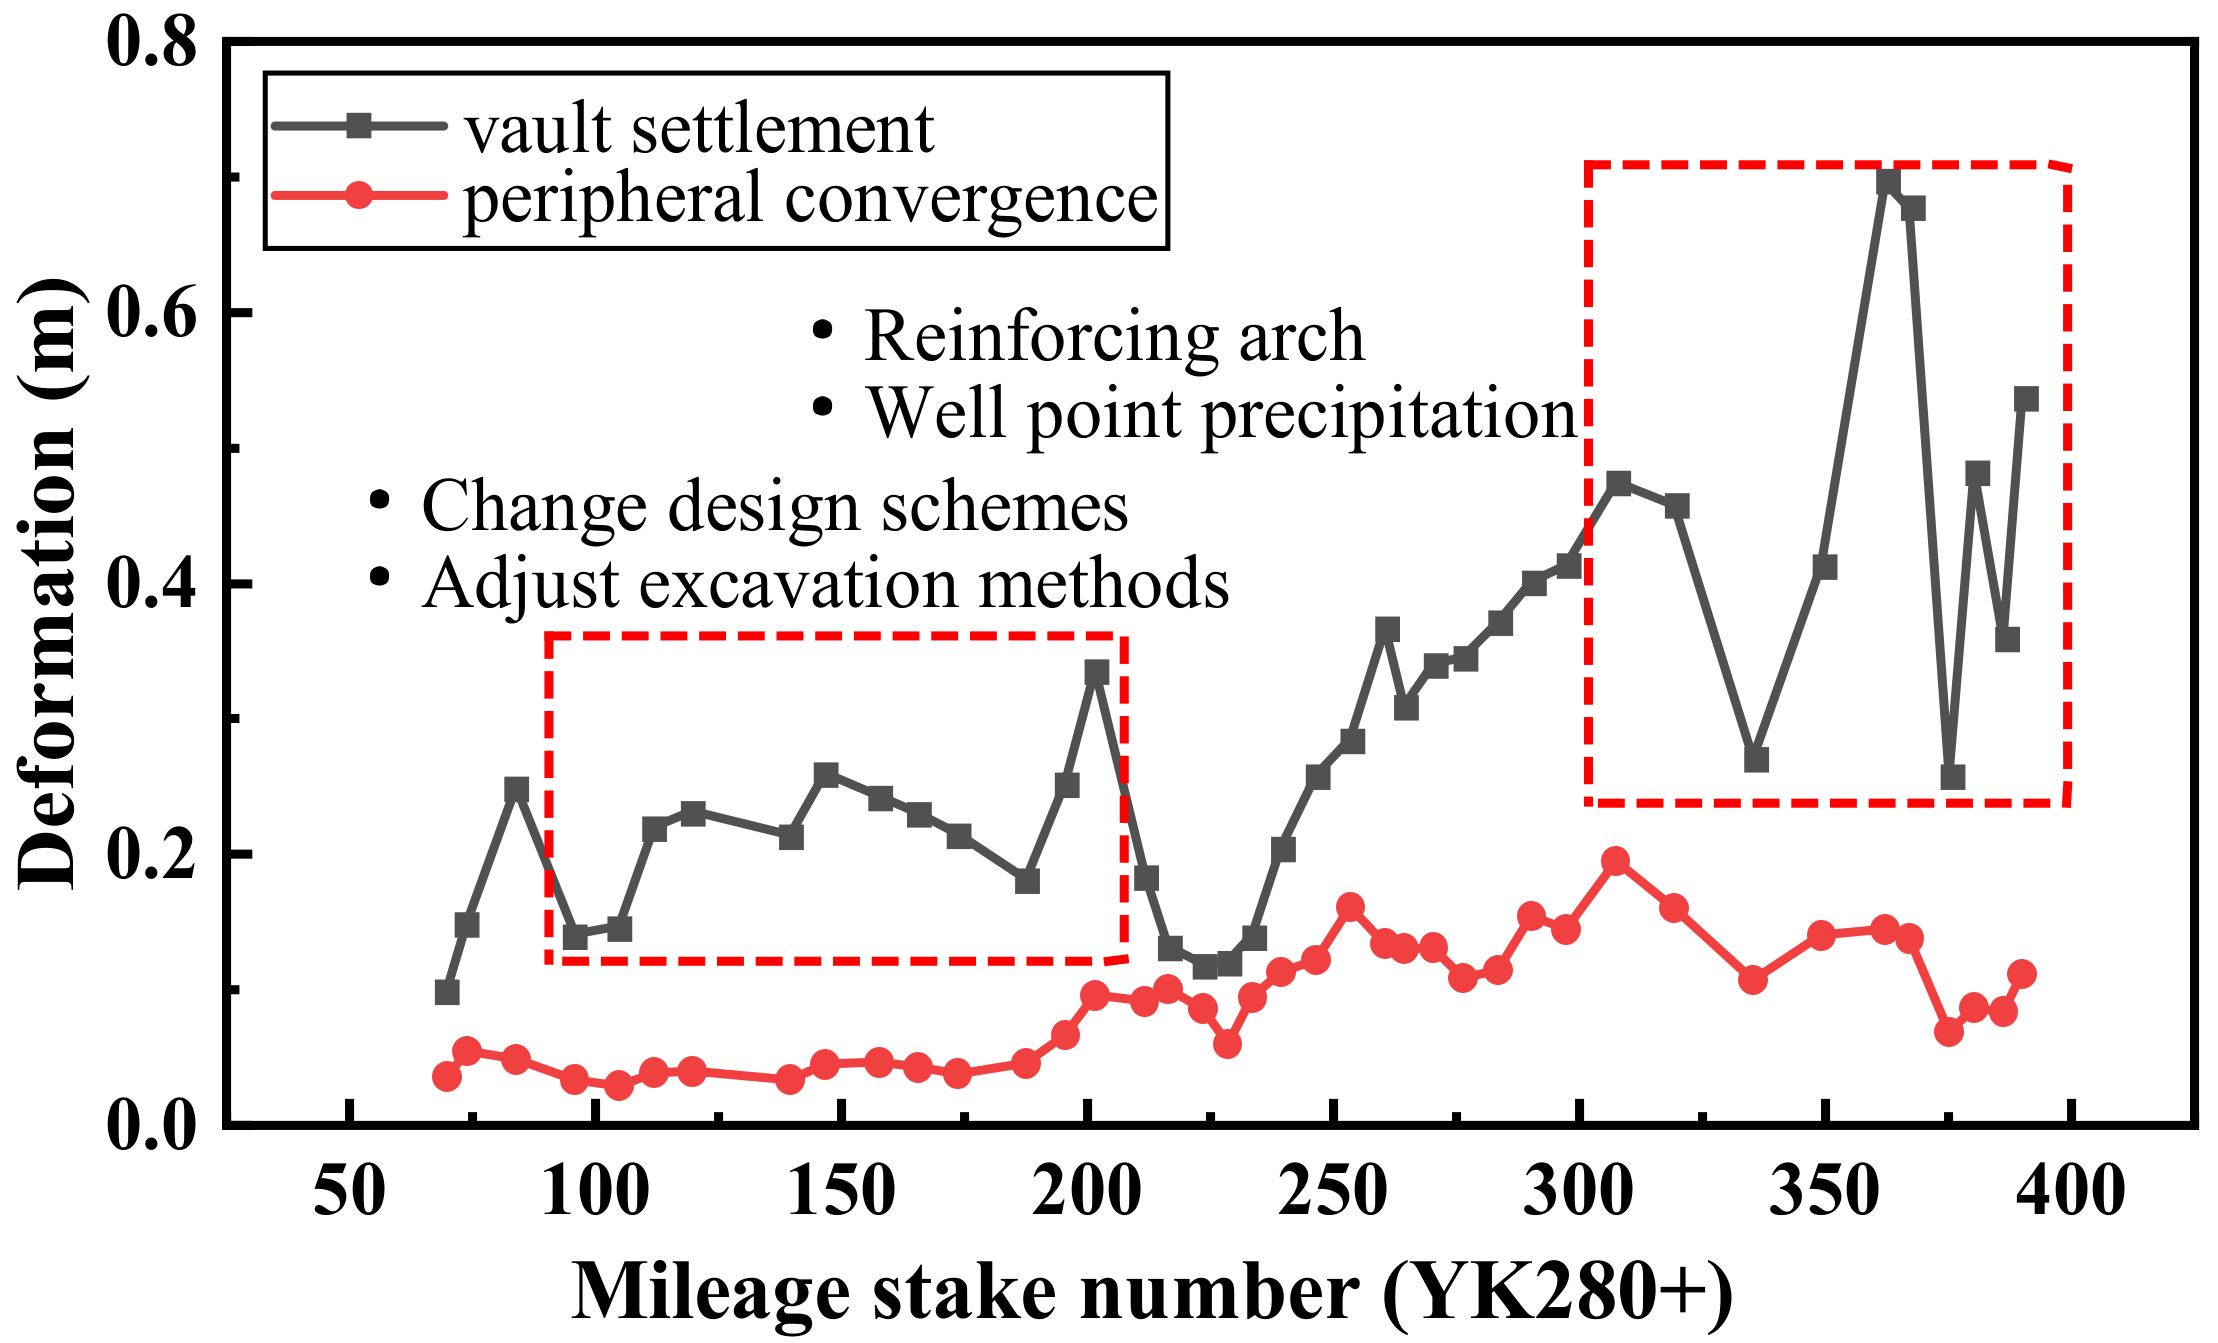
2. Engineering Backgrounding

The Yulinzi Tunnel is located in Qingyang City, Gansu Province, China. It is a typical loess tunnel in the Longdong area with a maximum buried depth of 112.35 m. The hydrogeological exploration of the tunnel shows that the tunnel body passes through the Quaternary Middle Pleistocene (Q2eol) Lishi loess with multiple layers of paleosol. The physical and mechanical indicators are shown in Table 1. The loess exposed at the inlet and outlet ends developed vertical joints, locally grown irregular extensional joints, and wide fissures. The groundwater in the tunnel site is loose rock pore water, atmospheric precipitation is the primary source of recharge, pores and vertical joints are the main runoff channels, and the maximum natural water content in the soil is 20.4%. Figure 1 is the schematic diagram of the geological section of the Yulinzi Tunnel, and Figure 2 is the distribution area of groundwater in the longitudinal section.
After excavating the Yulinzi Tunnel, the exposed loess stratum is consistent with the design, but the groundwater is abundant. After each excavation cycle, the soil on the face of the tunnel was initially dry, and then the water content gradually increased. The initial support surface gradually developed into seepage, dripping water, and local gushing water. The loess obviously softens when exposed to water, and the bearing capacity decreases rapidly, resulting in the initial support deformation much larger than the design value. The cumulative deformation of the shallow buried section of the tunnel is mostly 400–600 mm, and the deeply buried section is mostly 800–1000 mm. The large settlement of the tunnel induces a series of problems such as cracks in the initial support shotcrete, distortion of the steel support, and exposure of the large pipe shed. In addition, just above the centerline of the tunnel (YK280+596.8), a landslide penetrated the surface, forming a subsidence pit with a diameter of about 20 m (Figure 3), which brought great hidden dangers to the tunnel construction management. The deformation curves of some mileage sections of the tunnel and the corresponding large deformation control measures can be seen in the figures below (Figure 4 and Figure 5).
The test monitoring mileage section is the water-rich section, and the water content measured by the on-site in situ test is 19.2%. After excavation, there is a relatively serious water seepage phenomenon, and the soil body is seriously softened. Preliminary monitoring shows that this section has a large deformation, and there are serious potential safety hazards. Therefore, 3D laser scanning will be carried out on this mileage section to strengthen deformation monitoring in the later stage.
The Yulinzi Tunnel is supported by composite lining, whose initial support is composed of an I-beam, steel mesh, and shotcrete. The initial support cancels the system anchor rod and strengthens the foot-locking steel pipe. The secondary lining is made of reinforced concrete. The tunnel is excavated using the construction method of three-bench and seven-step (Figure 6), in which the tunnel face is divided into the upper, middle, and lower three benches for a total of seven different excavation faces for excavation. The seven excavation faces are supported step by step.

3. Three-Dimensional Laser Scanning Technology and Application Scheme

3.1. Fundamentals of 3D Laser Scanning

Three-dimensional laser scanning technology can capture the geometric information of the object from the light reflected from the object’s surface. During the measurement, the instrument actively acquires and stores the point cloud data of the tunnel entity, mainly including the 3D coordinates of the scanned entity, laser reflection intensity information, color information, and rich image information. The use of 3D laser scanning technology can actively, non-contact, and quickly acquire massive spatial point cloud data to obtain a 3D solid model of the tunnel space, as well as real-time, dynamic, and omnidirectional deformation characteristics of the tunnel section.
The scanning ranging of the tunnel section by the scanner is roughly divided into two processes. First, the scanner calculates the distance S between the two points by calculating the travel time of the laser light between the emission point (point O in Figure 7) and the object reflection point (point M in Figure 7) through the built-in laser rangefinder (as shown in the following formula [23]).
S = C × t 2
where s is the distance between the laser emission point of the scanner and the reflection point of the object (m), c is the speed of the laser (m/s), and t is the time (s) that the laser has elapsed from emission to reception.
Secondly, the scanner simultaneously records the horizontal rotation angle θ and vertical rotation angle ω of the instrument in the process of ranging and calculates the relative coordinates of the monitoring point as shown in the following figure according to Formula (2) [23].
X M = S cos ω cos θ Y M = S cos ω sin θ Z M = S sin ω

3.2. Three-Dimensional Laser Scanning Equipment

The Yulinzi Tunnel test section uses a Trimble SX10 scanner from Trimble, USA. The instrument integrates a 3D laser scanner, a total high-end station, and close-range photogrammetry technology, and no additional operation with a total station is required. It has a point cloud collection efficiency of 26,600 points per second and a maximum scanning distance of 600 m. The use of improved Trimble VISION technology allows for the quick and easy acquisition of high-resolution site imagery and is less susceptible to environmental disturbances. Post data and image processing are fully integrated with Trimble Access and Trimble Business Center (TBC). Compared with the conventional monitoring methods of tunnels, the instrument is more suitable for monitoring applications of tunnels in the test section. Table 2 compare the monitoring technology between 3D laser scanning technology and conventional monitoring methods. The main scanning technical parameters of the Trimble SX10 scanner are shown in Table 3.

3.3. On-Site Monitoring Scheme

In order to obtain the development process of tunnel deformation in a short time and long time and the distribution law in space, the following three aspects of work were carried out in this field monitoring:
(1)
Perform a static scan on the shape of the initial support of the four openings on the left and right lines of the Yulinzi Tunnel;
(2)
The deformation of the initial support at the typical mileage section at the entrance of the right line of the tunnel is selected for 24 h short-time dynamic tracking scanning, and the monitoring time is 0 h, 2 h, 4 h, 20 h, and 24 h, respectively;
(3)
In the long-term excavation cycle, the dynamic tracking and scanning of the entire initial support deformation in the excavation mileage are carried out for a long time.
The excavation status of the monitored mileage is shown in Figure 8.

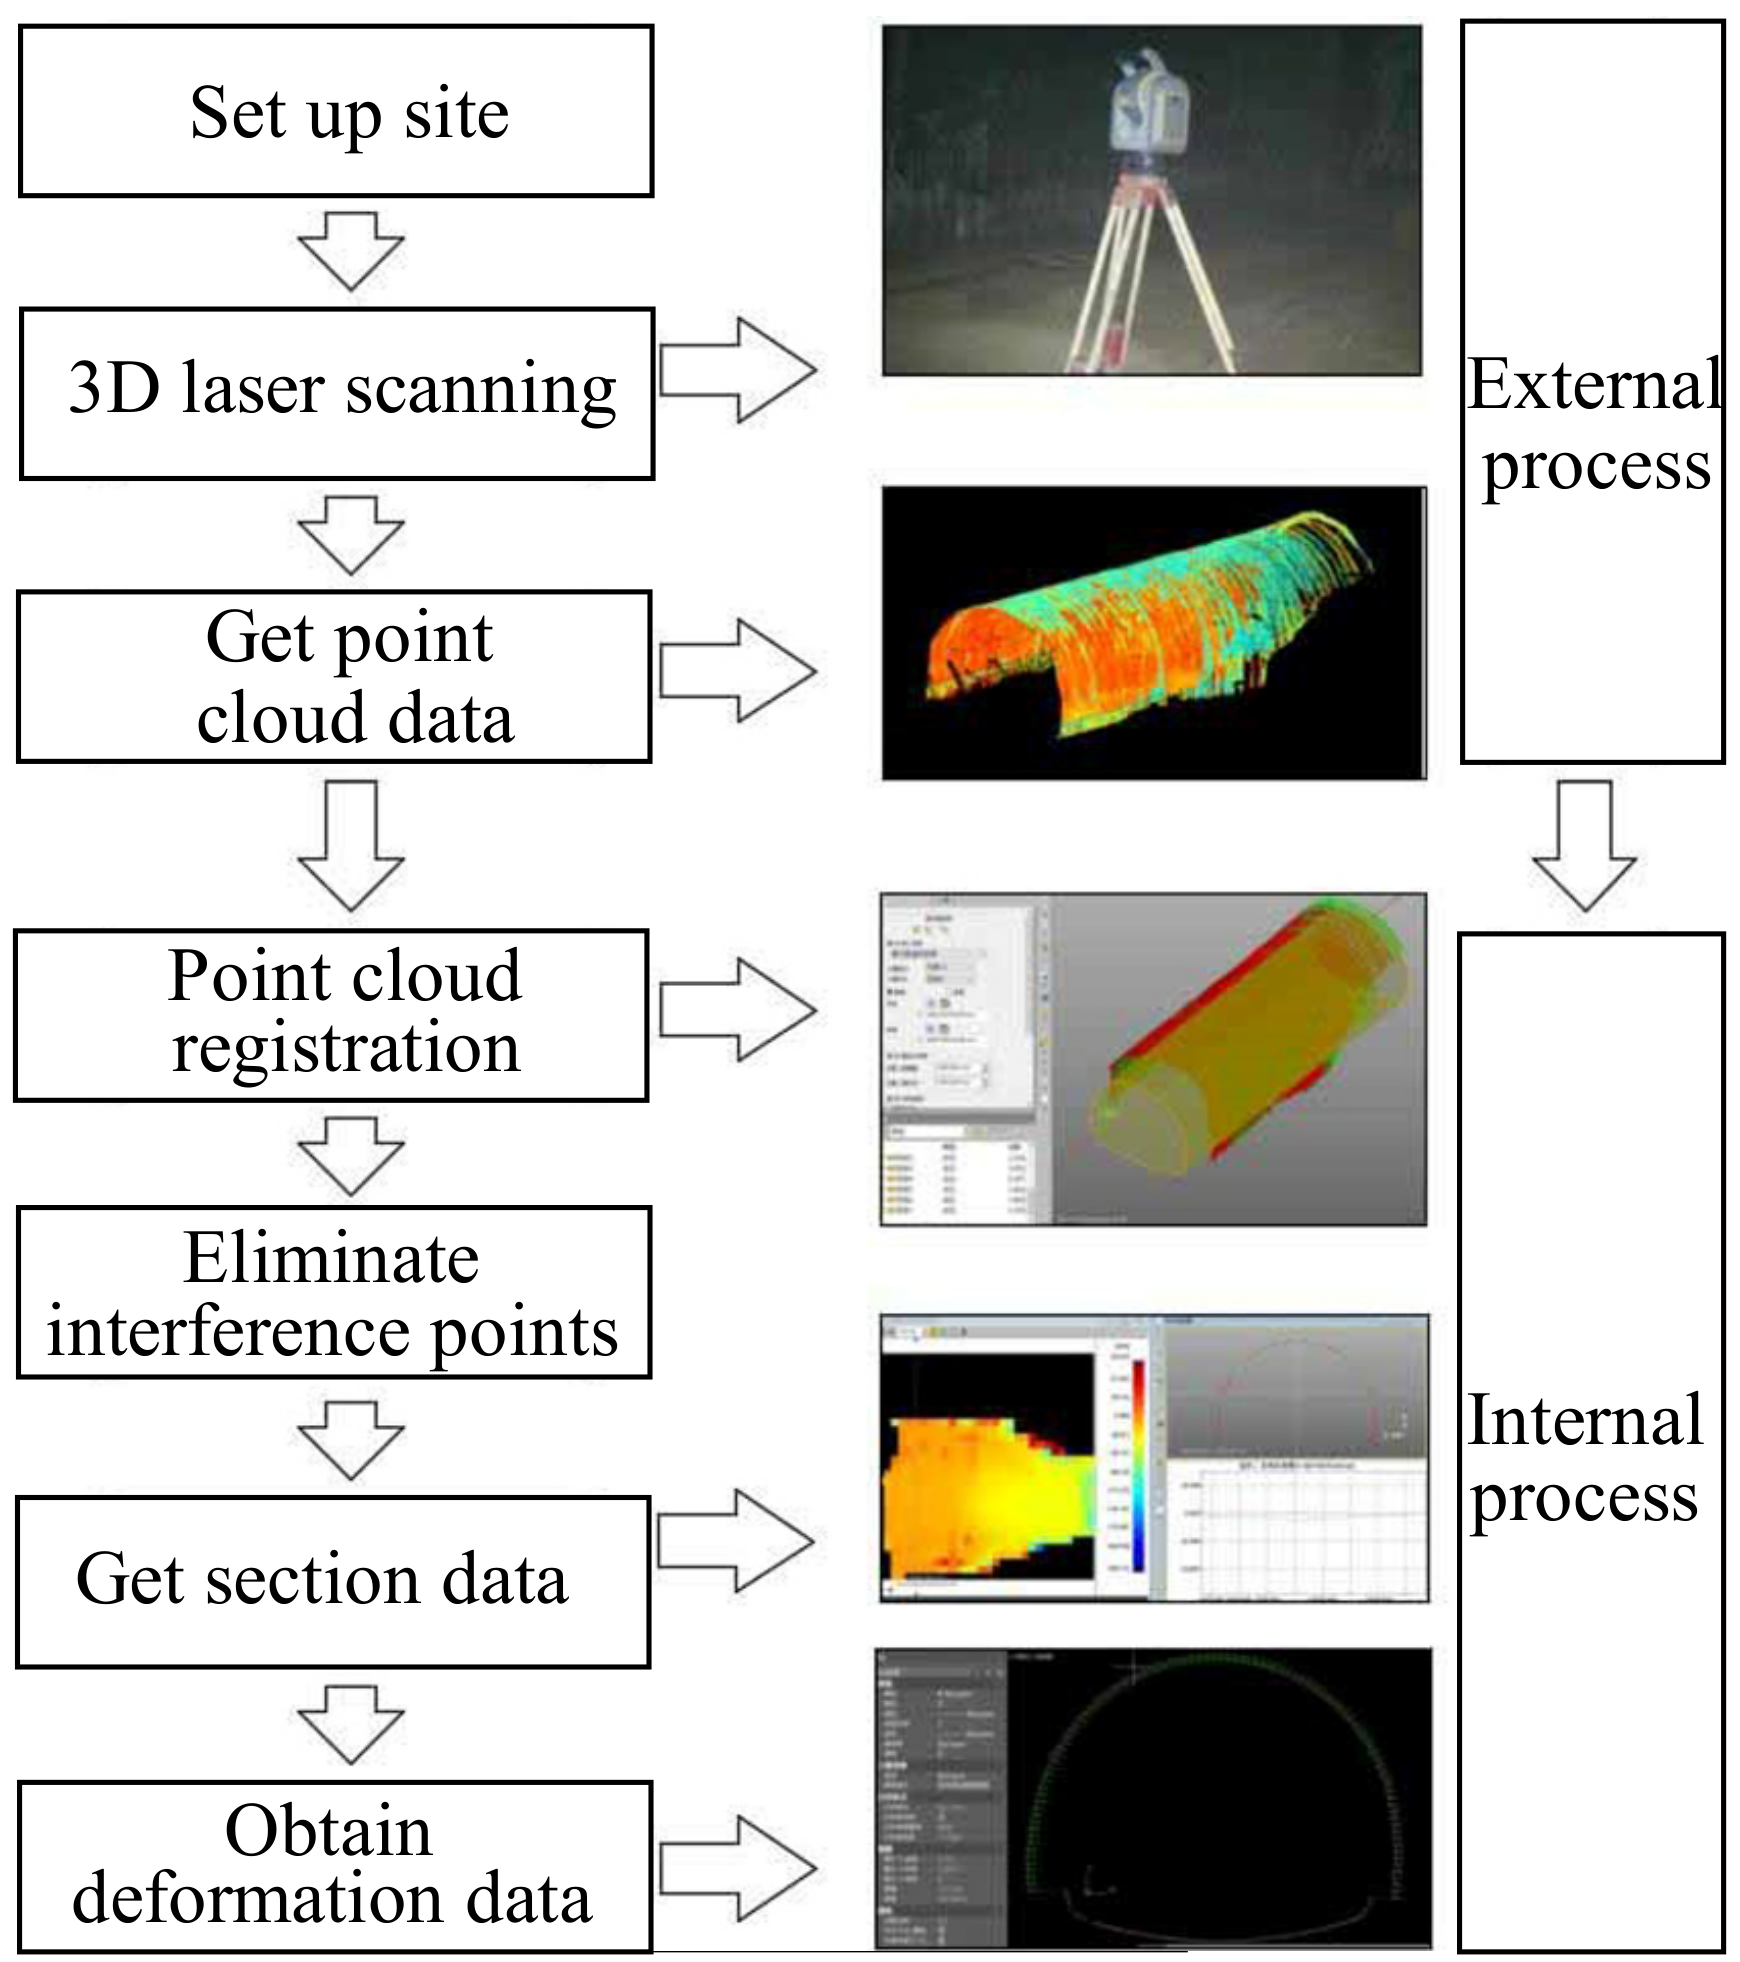
3.4. Internal and External Process of 3D Laser Scanning

3.4.1. External Process

The first is the selection of the station. Taking advantage of the long scanning distance of the SX10, the station is set up on a known point based on the existing control points in the tunnel. Since the data point density of the 3D laser scanner will decrease rapidly with the increase of the incident angle, the accuracy of the laser scanning result will be reduced. In order to ensure the accuracy of the data, the measurement point should be selected as a control point with a certain distance from the scanning position and stable geological conditions. After that, adjust the gear setting, and through the real-time image transmission on the controller screen, take a polygonal method to roughly scan the surrounding rock conditions in the mileage near the face. The hoop scanning density is 1 mrad, the longitudinal spacing is 50 mm, and the maximum scanning distance is set to 30 m. In such a scanning cycle, multiple repeated scans will be performed, and the time of each scan is 12 min, and the overlapping parts of the data segments can complement each other after each scan, thereby improving the accuracy of the point cloud data.

3.4.2. Internal Process

Perform technical processing on the obtained tunnel 3D scanning point cloud data (Figure 9). The first step is to register the point cloud data obtained at the same measurement time, which is a necessary step to obtain a complete tunnel point cloud dataset. Each station will input the geodetic coordinate points of the station in the instrument before scanning to unify the coordinate values of the point cloud data. Since the known control points are used to set up the station, the coordinates of the measuring points are easy to obtain, and then the overall point cloud of the tunnel is obtained by splicing local point clouds. The second step is to filter the interfering point cloud data. During the monitoring process of the tunnel, there are construction machinery, tools and equipment, and staff in the scanning monitoring section, which will generate some interference points unrelated to the scanning section. The existence of these points will affect the monitoring and calculation of deformation. In order to ensure the accuracy of the monitoring results, the large-volume interference data in the point cloud will be manually filtered. For minor interference points, use the Trimble Business Center tunnel module to make the design data into a simple tunnel design model, and then import the actual scanned point cloud and filter the noise. This module can also compare with the design model and output the analysis report of over and under excavation of any section that the user can customize and edit. The final step is to extract the tunnel section coordinate data. Based on the statistical principle, the statistical average value of the point cloud data of a certain surface around the required analysis point is extracted, and the deformation value of the point is obtained after processing.

4. Analysis of Deformation Characteristics of Loess Tunnel

4.1. Spatiotemporal Deformation Characteristics of Each Monitoring Area in a Short Time

In loess tunnels with fast deformation development and complex deformation characteristics, it is necessary for on-site personnel to quickly follow up deformation monitoring to take timely measures to prevent danger. To this end, based on the three-dimensional laser scanning monitoring technology, the monitoring frequency is increased, and more refined monitoring and analysis of the deformation of each area of the tunnel is carried out.

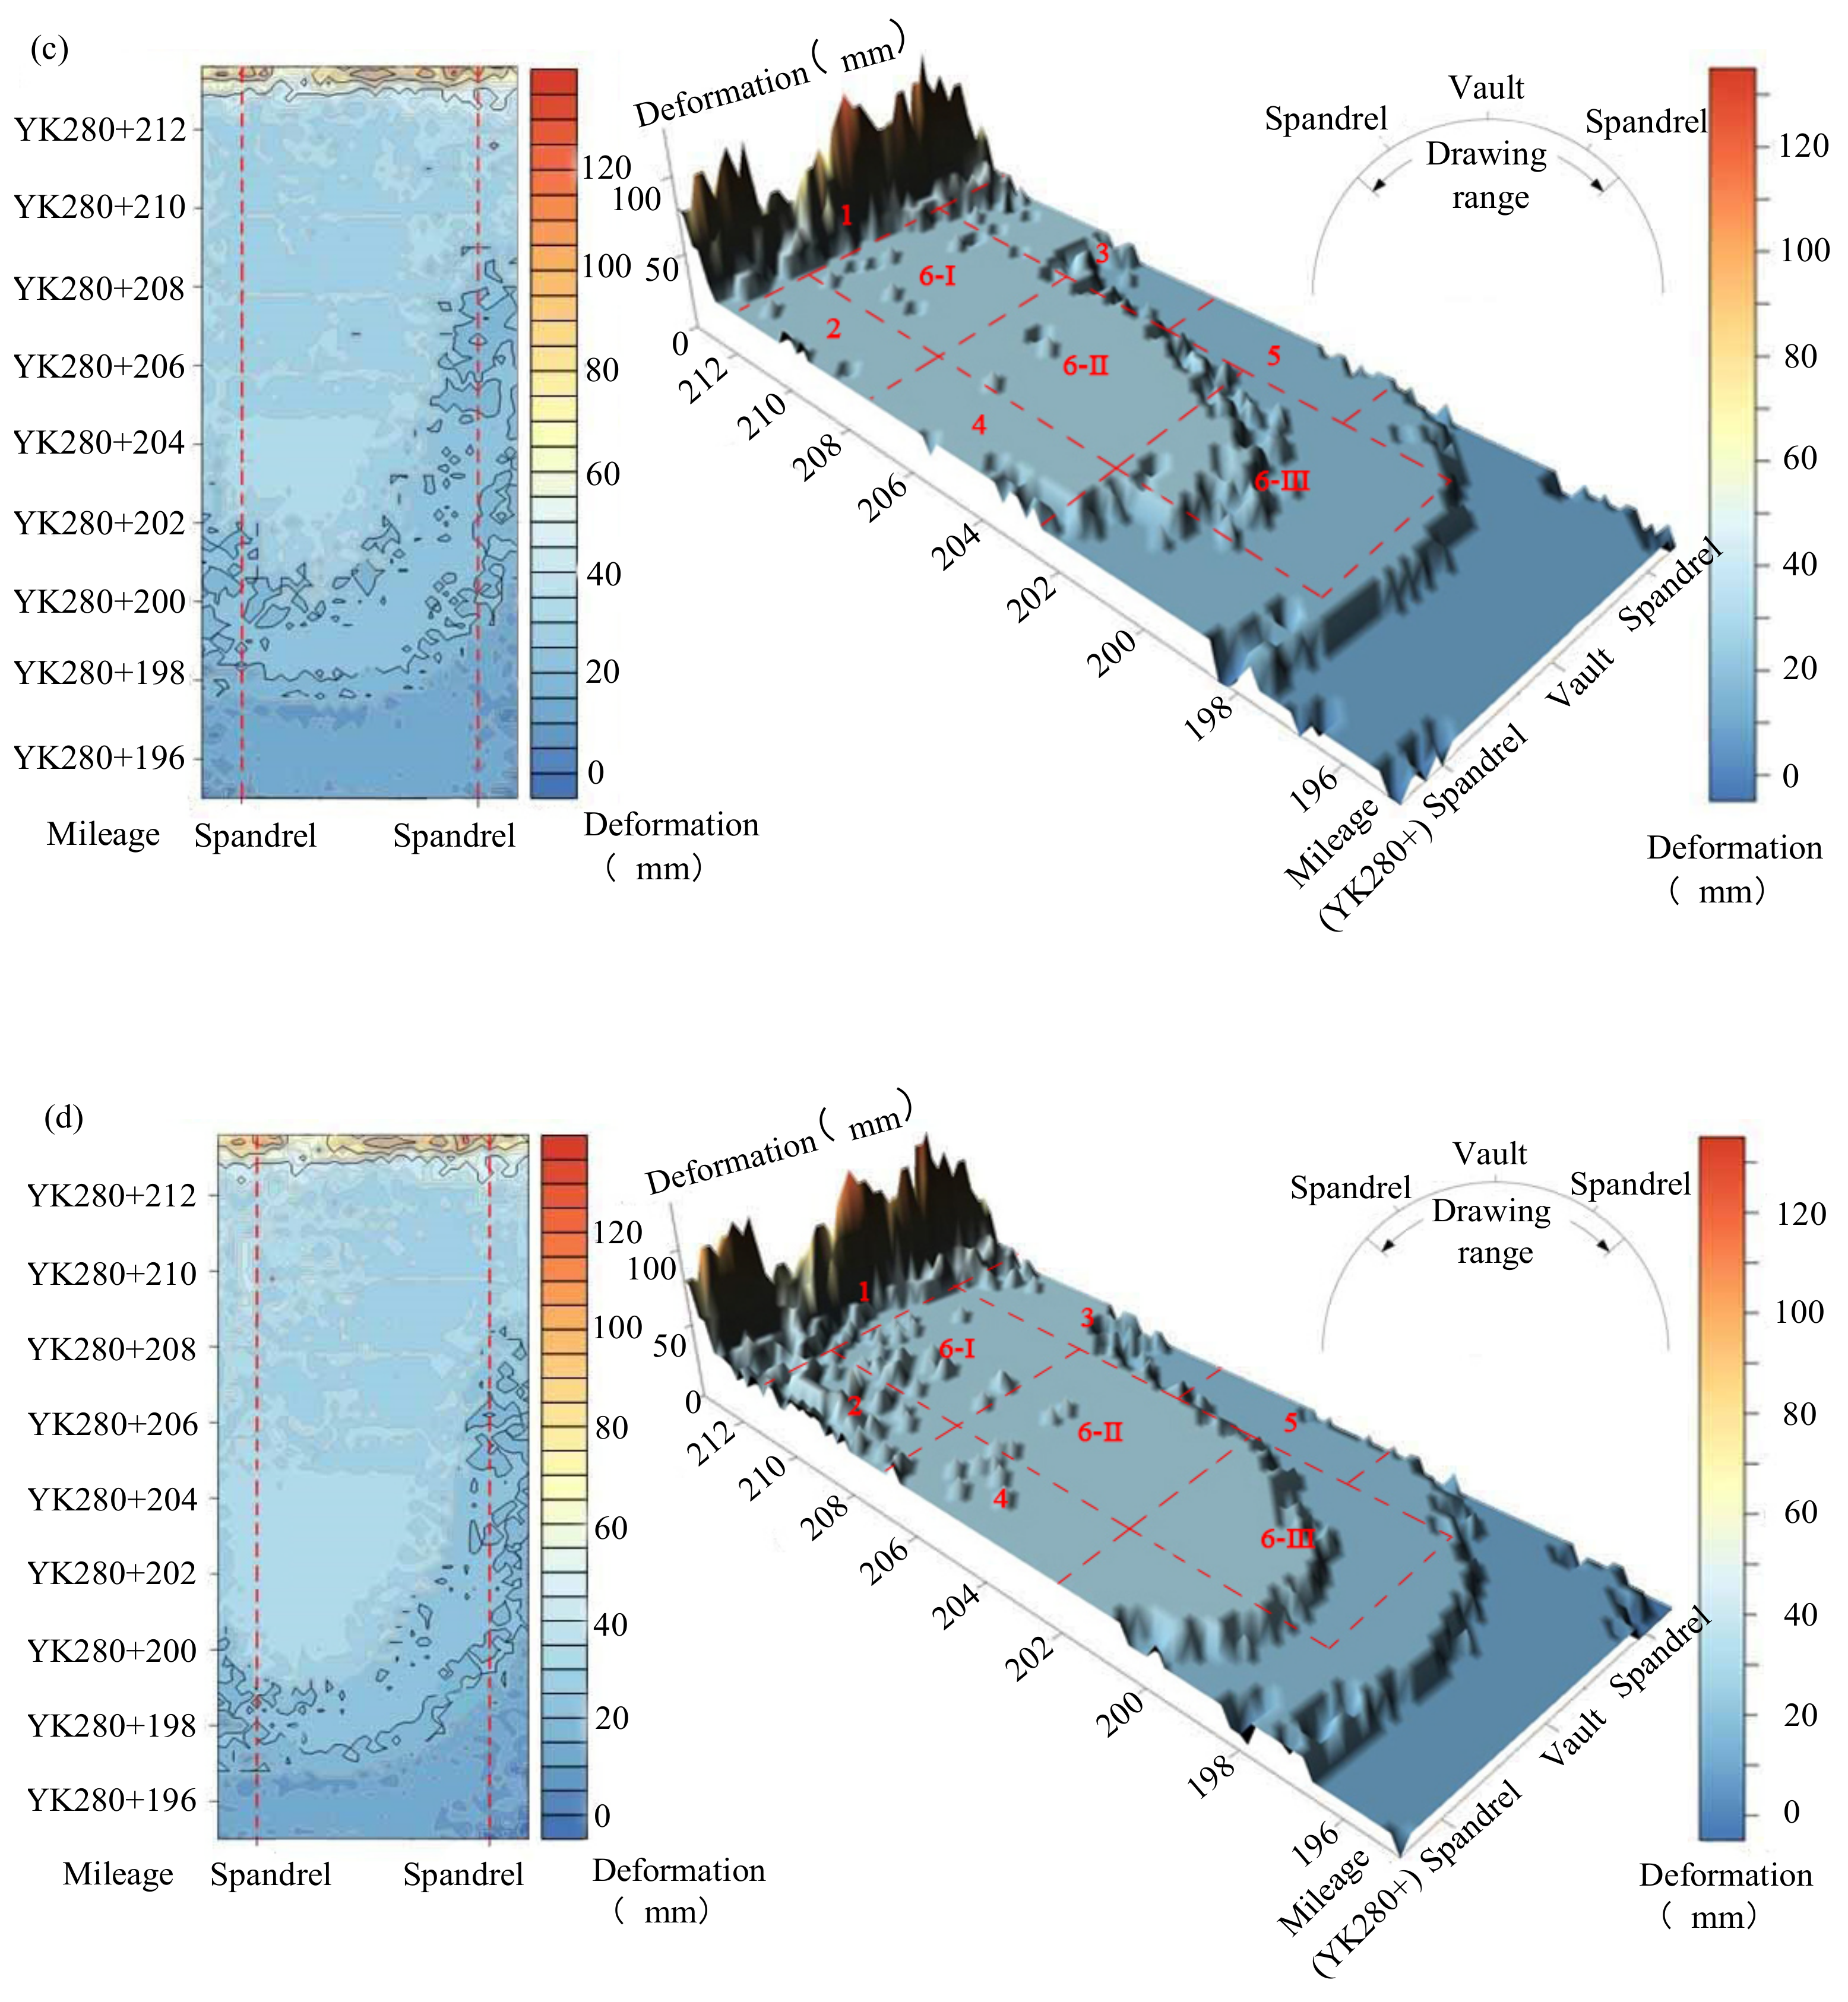
4.1.1. The Spatiotemporal Evolution Law of Deformation of Initial Support in the Scanning Section

The dynamic tracking scanning section for the initial support deformation in this test is the section from YK280+195 to YK280+214 at the entrance of the right line of the tunnel, with a total length of 19 m. Comparing the results of the second to fifth scans with the result of the first scan, the deformation value of the initial support of the tunnel within 24 h of the test section and the evolution process of the deformation with time is obtained. The deformation values in the range of 4 m on the left and right of the vault are selected for analysis, and then the deformation contour map of the tunnel vault is obtained. Finally, a three-dimensional deformation map reflecting the deformation is produced by the surfer software (Figure 10). The area delineated by the dotted line in the figure is the range corresponding to the construction step, and the deformation of each construction step range can be visually compared.
It can be analyzed from the figure that the deformation law of the tunnel is distributed asymmetrically from the same mileage section. The deformation value on the left side is generally larger than that on the right side, which is consistent with the fact that the left side of the actual construction sequence is excavated earlier than the right side. The existence of such distortion and deformation poses certain risks to the tunnel’s safety. In actual engineering, it can be considered to reverse the left and right construction steps of the lower steps to balance the deformation amount. In addition, while maintaining the same construction sequence, the site can also consider using supporting means such as strengthening the strength of the locking foot bolt of the left step to adjust the deformation amount to ensure that the overall deformation of the tunnel presents asymmetrical distribution law.
Judging from the total deformation of different construction parts in 24 h, the deformation value near the tunnel face is the largest, and the maximum value reaches 130 mm. The excavation and monitoring of the upper steps are the key parts in the monitoring and measurement of large deformation of the tunnel. It can also be analyzed that the maximum deformation of the arch around the tunnel face is on the right side, not at the top of the arch, so it is necessary to strengthen the monitoring of this area.
From the perspective of the overall deformation distribution of the tunnel, the range of the step phenomenon in the deformation change basically corresponds to the range of the actual construction step sequence. The construction process at this time can be judged by observing the deformation changes of each step range in the three-dimensional deformation map. From the monitoring results, the deformation around the tunnel face is the largest, followed by the left-middle step. It can be inferred that the excavation and support of the upper step and the left-middle step are being carried out in the tunnel during the monitoring period, which is consistent with the actual situation.

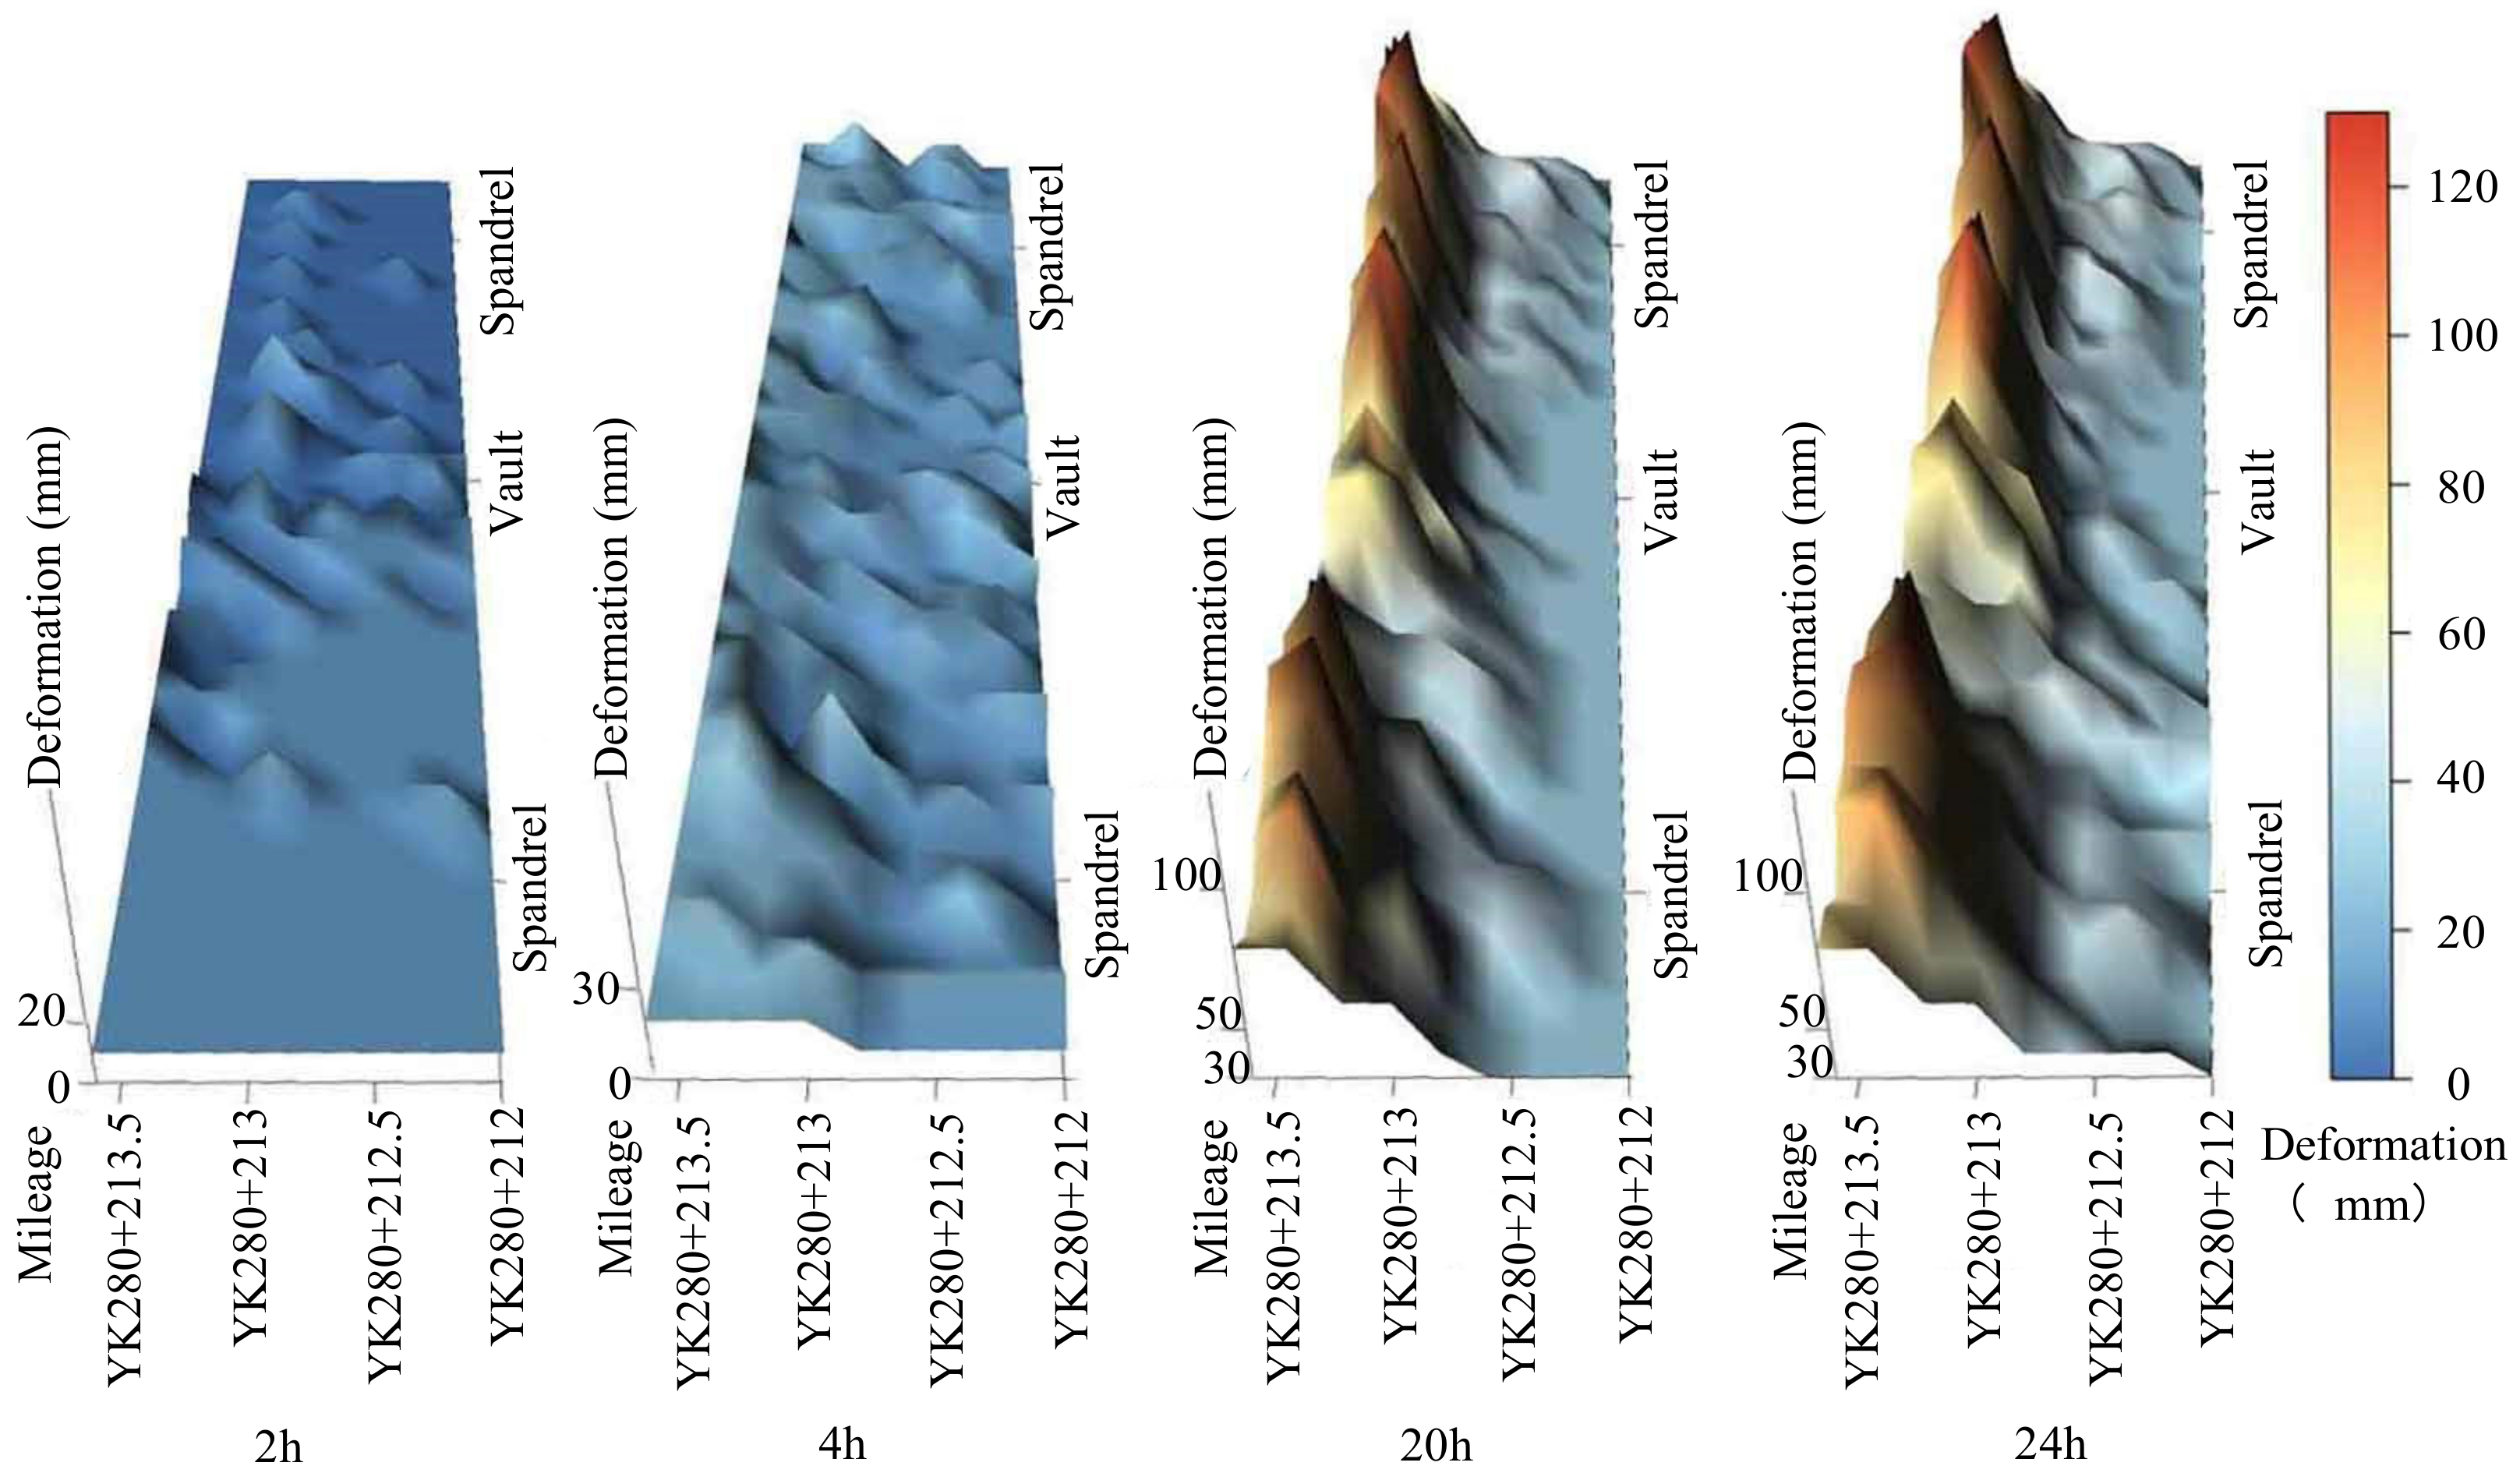
4.1.2. The Key Area of Tunnel Deformation Monitoring—The Spatiotemporal Evolution Law of the Initial Support Deformation of the Tunnel Face

From the above analysis, it can be concluded that the deformation rate around the tunnel face is the largest during the entire excavation process, which is the key area in the monitoring process.
Figure 11 is a three-dimensional subsidence diagram of the periphery of the tunnel face. According to the actual situation on-site, the excavation work of the upper steps is being carried out at the tunnel face during the scanning period of 24 h. By comparing and analyzing the scanning results of the initial support deformation of the upper step of the tunnel face, the section mileage is YK280+213.6, and the evolution diagram of the initial support deformation, as shown in Figure 12, is obtained. In order to quantitatively analyze the time change law of the initial support deformation of YK280+213.6 mileage, three representative points of the vault, the left spandrel and the right spandrel in the section are selected, and the deformation evolution diagram of each point at different scanning times is drawn as shown in Figure 13. In Figure 12 and Figure 13, the difference between the initial support shape curves of the section at each monitoring time represents the amount of deformation at each time.
From this analysis, it can be concluded that with the excavation of the upper steps of the tunnel, the surrounding rock begins to deform, and the displacement of the entire section develops in the direction of the free surface, that is, converges to the center of the tunnel. After the excavation of the upper steps, the deformation law of the left and right sides of the entire initial support is relatively symmetrical. The deformation of the spandrels on both sides is larger than that of the vault, and the deformation of the bottom of the excavation face restricted by the lower rock and soil is relatively small. The total 24 h deformation of the three representative points and the entire section show that the section has the largest cumulative deformation between the vault and the right spandrel, whose deformation amount is 130 mm. In addition, it can be seen from the figure that in the early stage of the excavation of the upper step, the deformation rate of the surrounding rock was relatively large. However, with the implementation of the initial support in this part, the deformation rate of the entire surrounding rock-initial support system gradually decreased and finally approached stability in this excavation sequence. However, this result is limited to this excavation sequence. From the analysis later, it can be known that during the excavation of other steps in this section, the initial support of the upper step will produce stepped deformation. Similarly, the deformation of other tunnel areas can be monitored and analyzed.

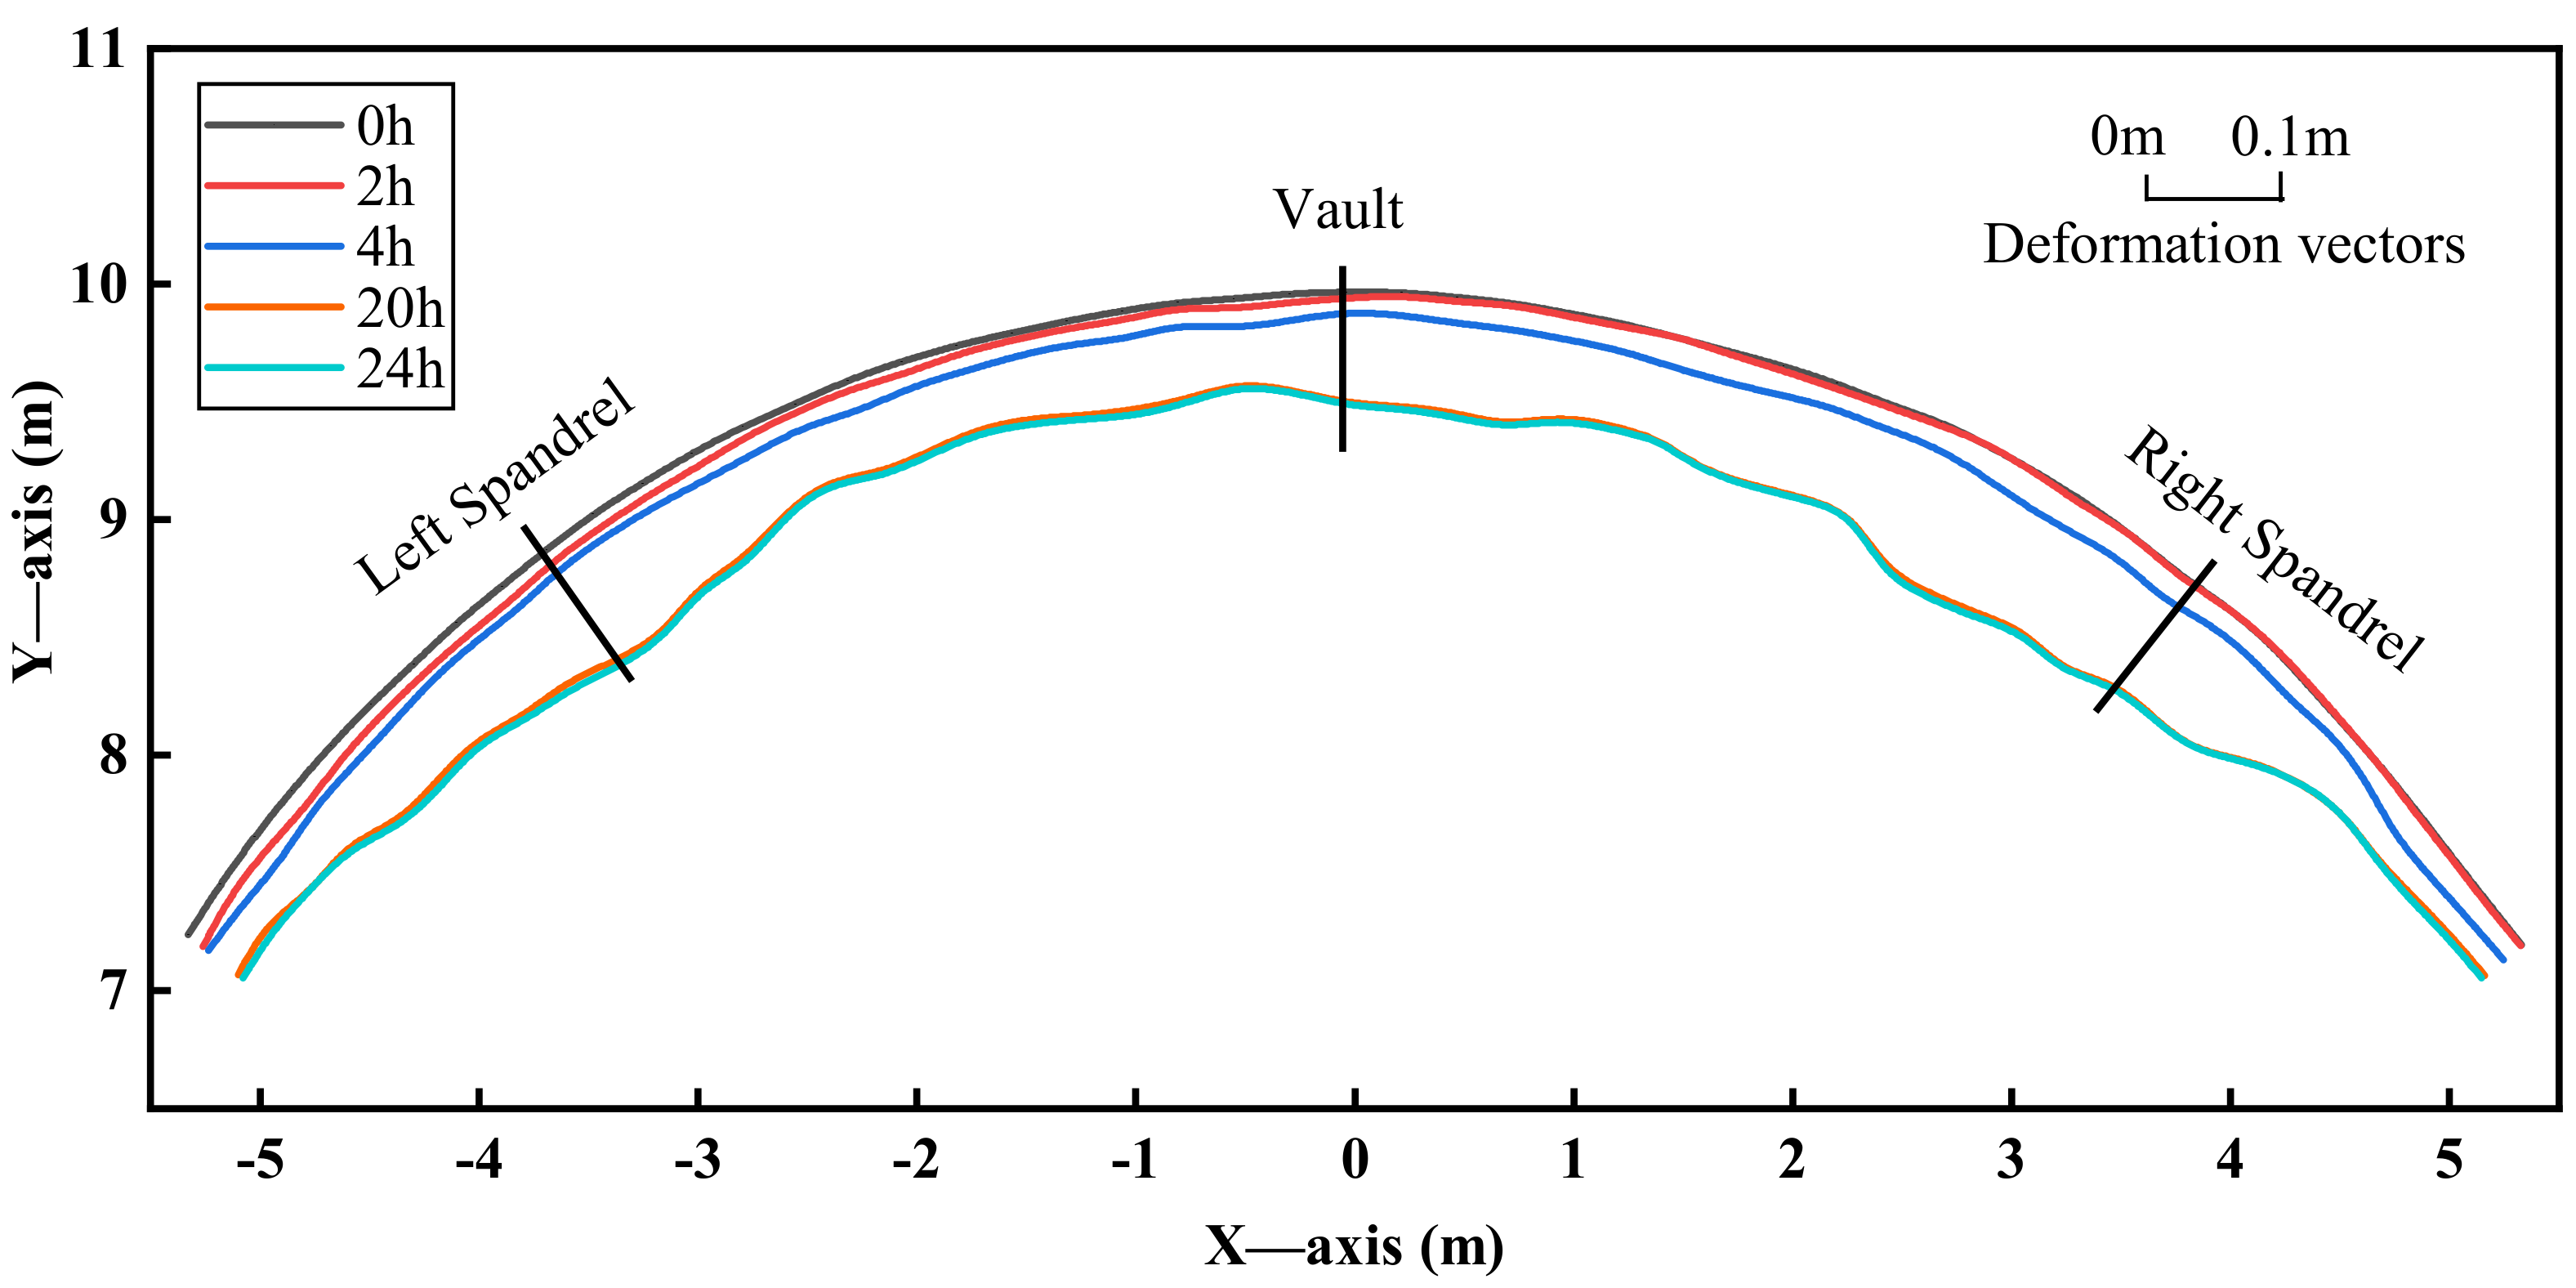
4.1.3. Spatiotemporal Deformation Characteristics of Representative Points of the Cross-Section

Three-dimensional laser scanning obtains the point cloud data of the whole section. Still, the deformation changes of some representative points, such as vaults and spandrels, are often concerned in the deformation analysis process. These points can reflect the dynamic information of the stress and deformation of the surrounding rock and supporting structure to monitor the stable state and deformation characteristics of the cavern and provide a basis for analyzing the reliability of the surrounding rock and supporting system. Therefore, on the basis of the above research, the spatiotemporal deformation characteristics of the representative points of each section within a certain mileage of the tunnel face are analyzed.
(1)
Deformation of the vault
Figure 14 show the change of the vault deformation along the longitudinal direction of the tunnel within 24 h of the monitoring mileage. It can be analyzed from the figure that the deformation of the tunnel vault within 24 h decreases with the increase of the distance from the face, and the deformation near the tunnel face changes most significantly, which is the key area in construction monitoring. After a certain distance from the tunnel face, the difference in the deformation change in each monitoring is relatively stable, indicating that the deformation is slowing down. Compared with the results of 3D laser scanning, there are fewer monitoring measuring points arranged when monitoring the total deformation of the vault in 24 h by the conventional method. According to the routine monitoring results, the change of the vault deformation is easy to be misjudged as the law of continuous linear increases with the advancing direction of the tunnel. However, the 3D laser scanning results show that the vault deformation actually presents a step-like decline. Such misjudgments will increase construction risks.
(2)
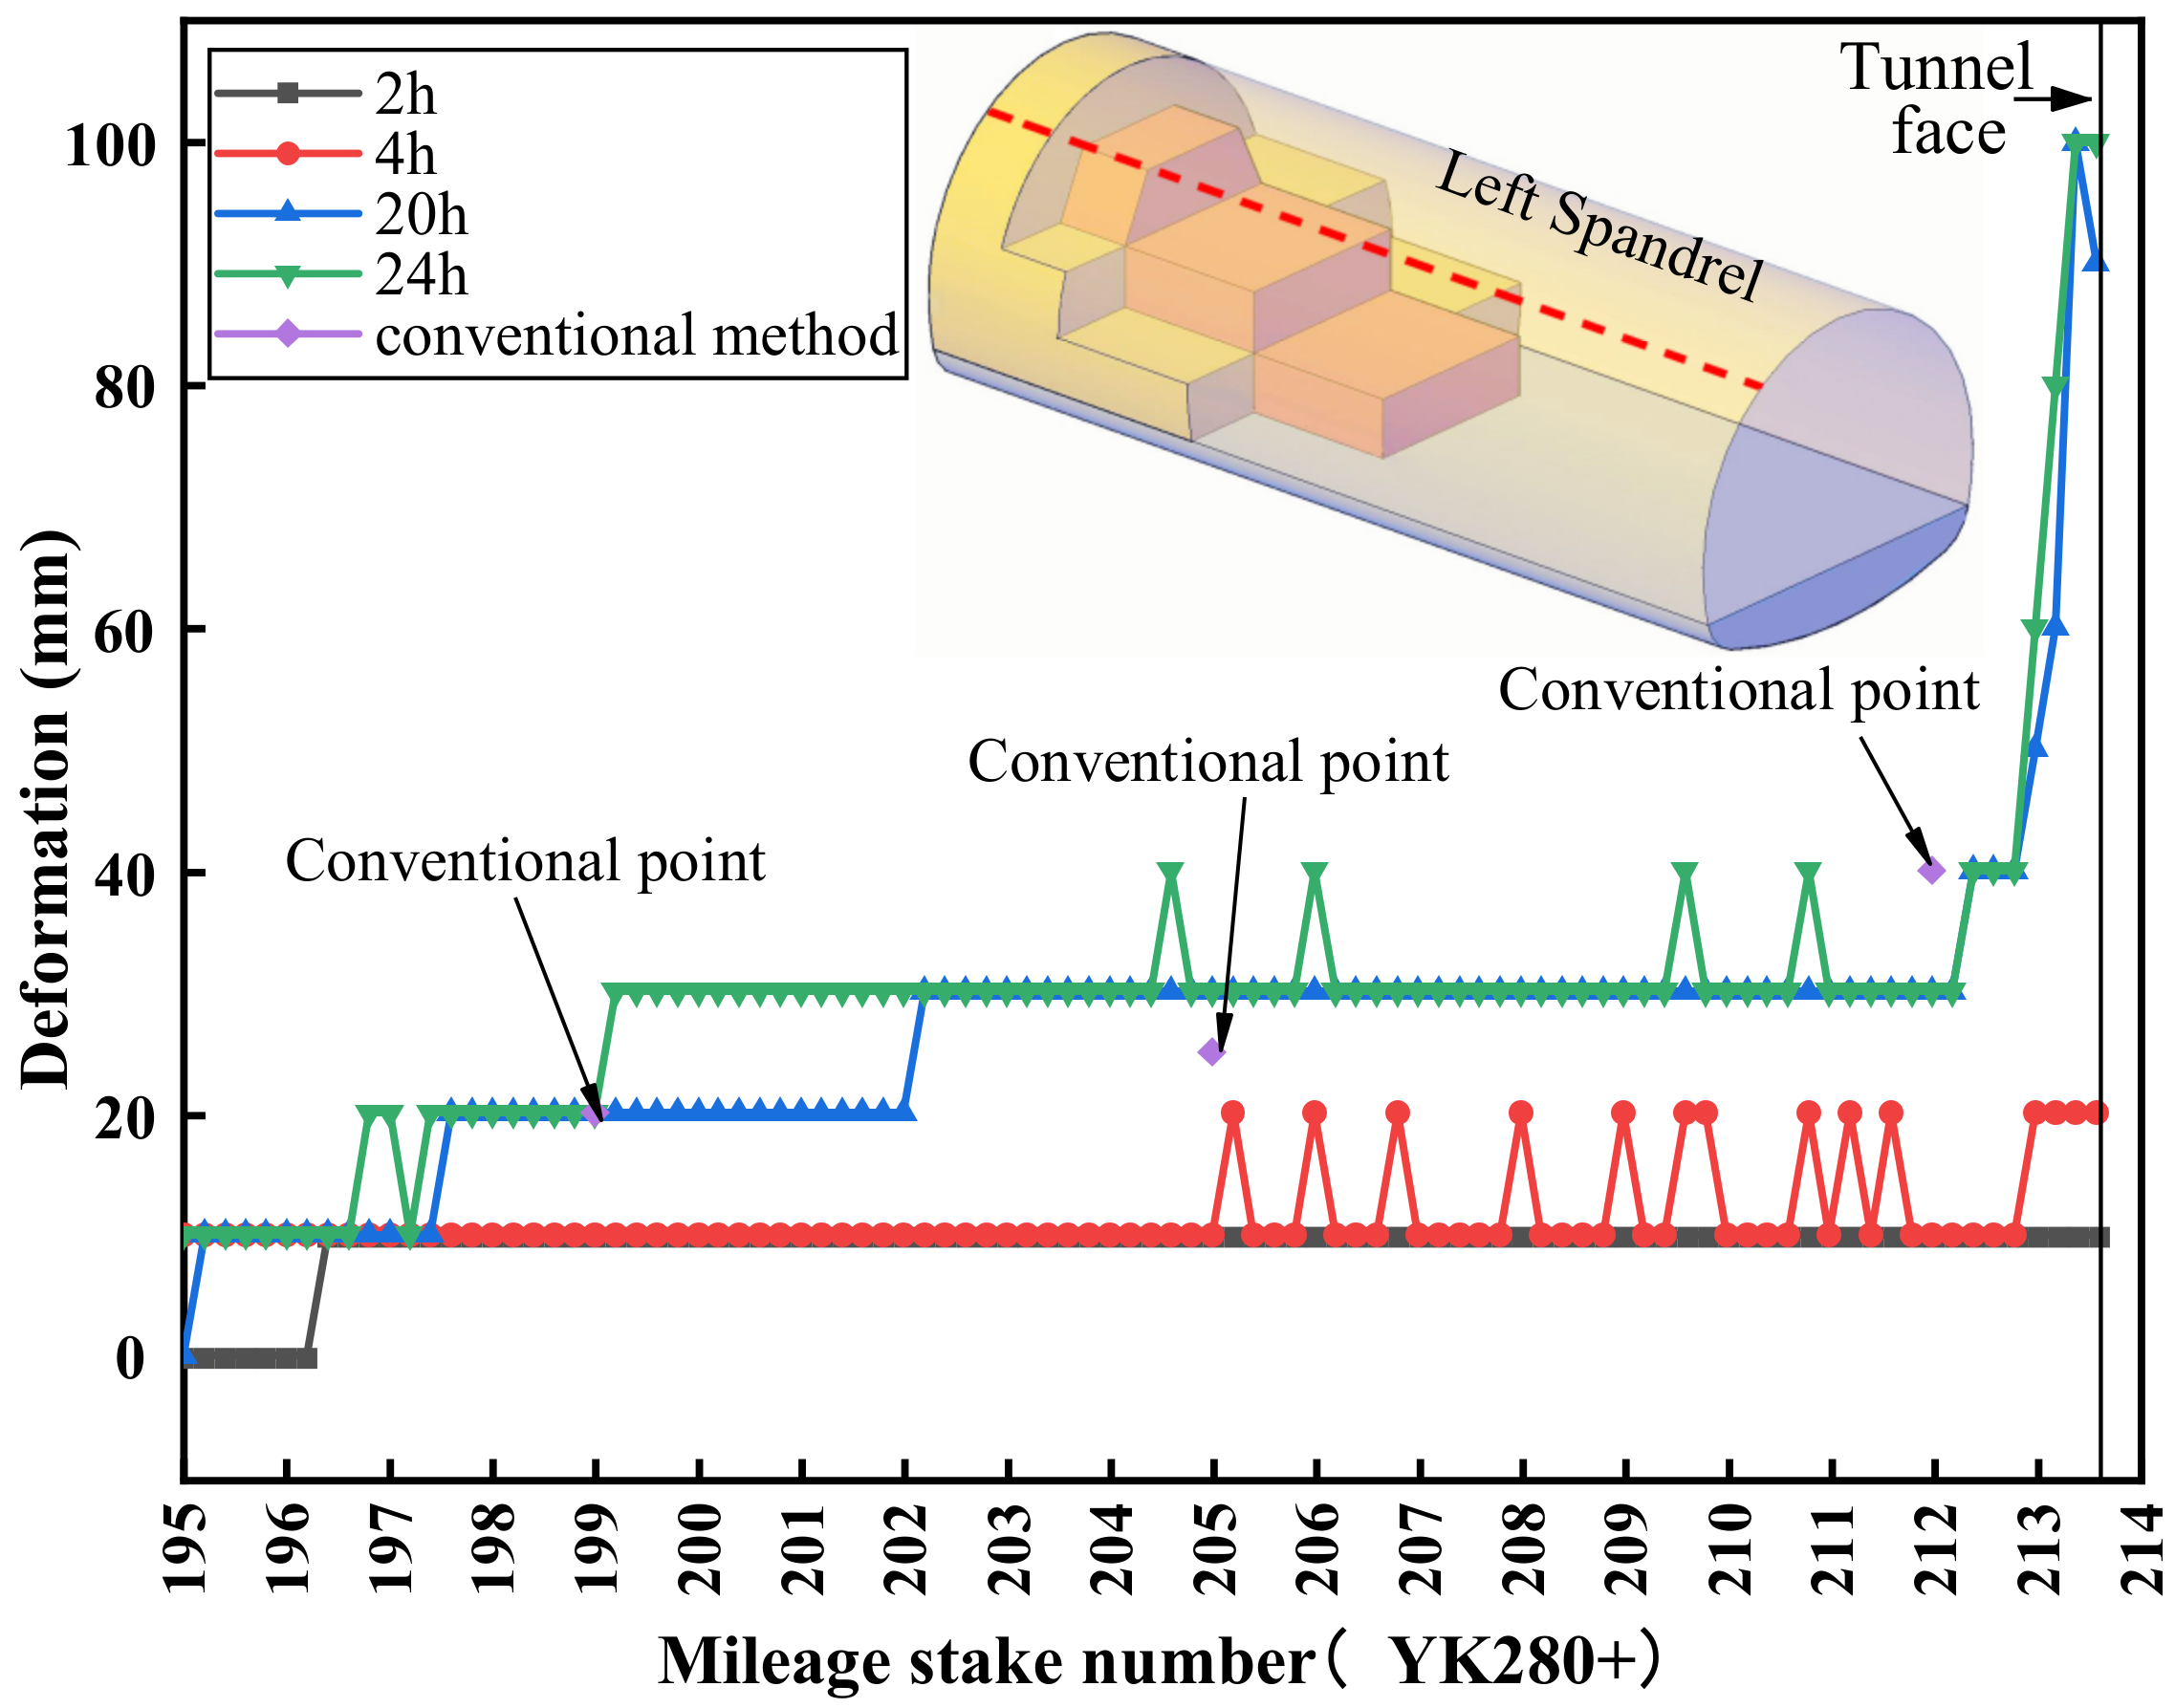
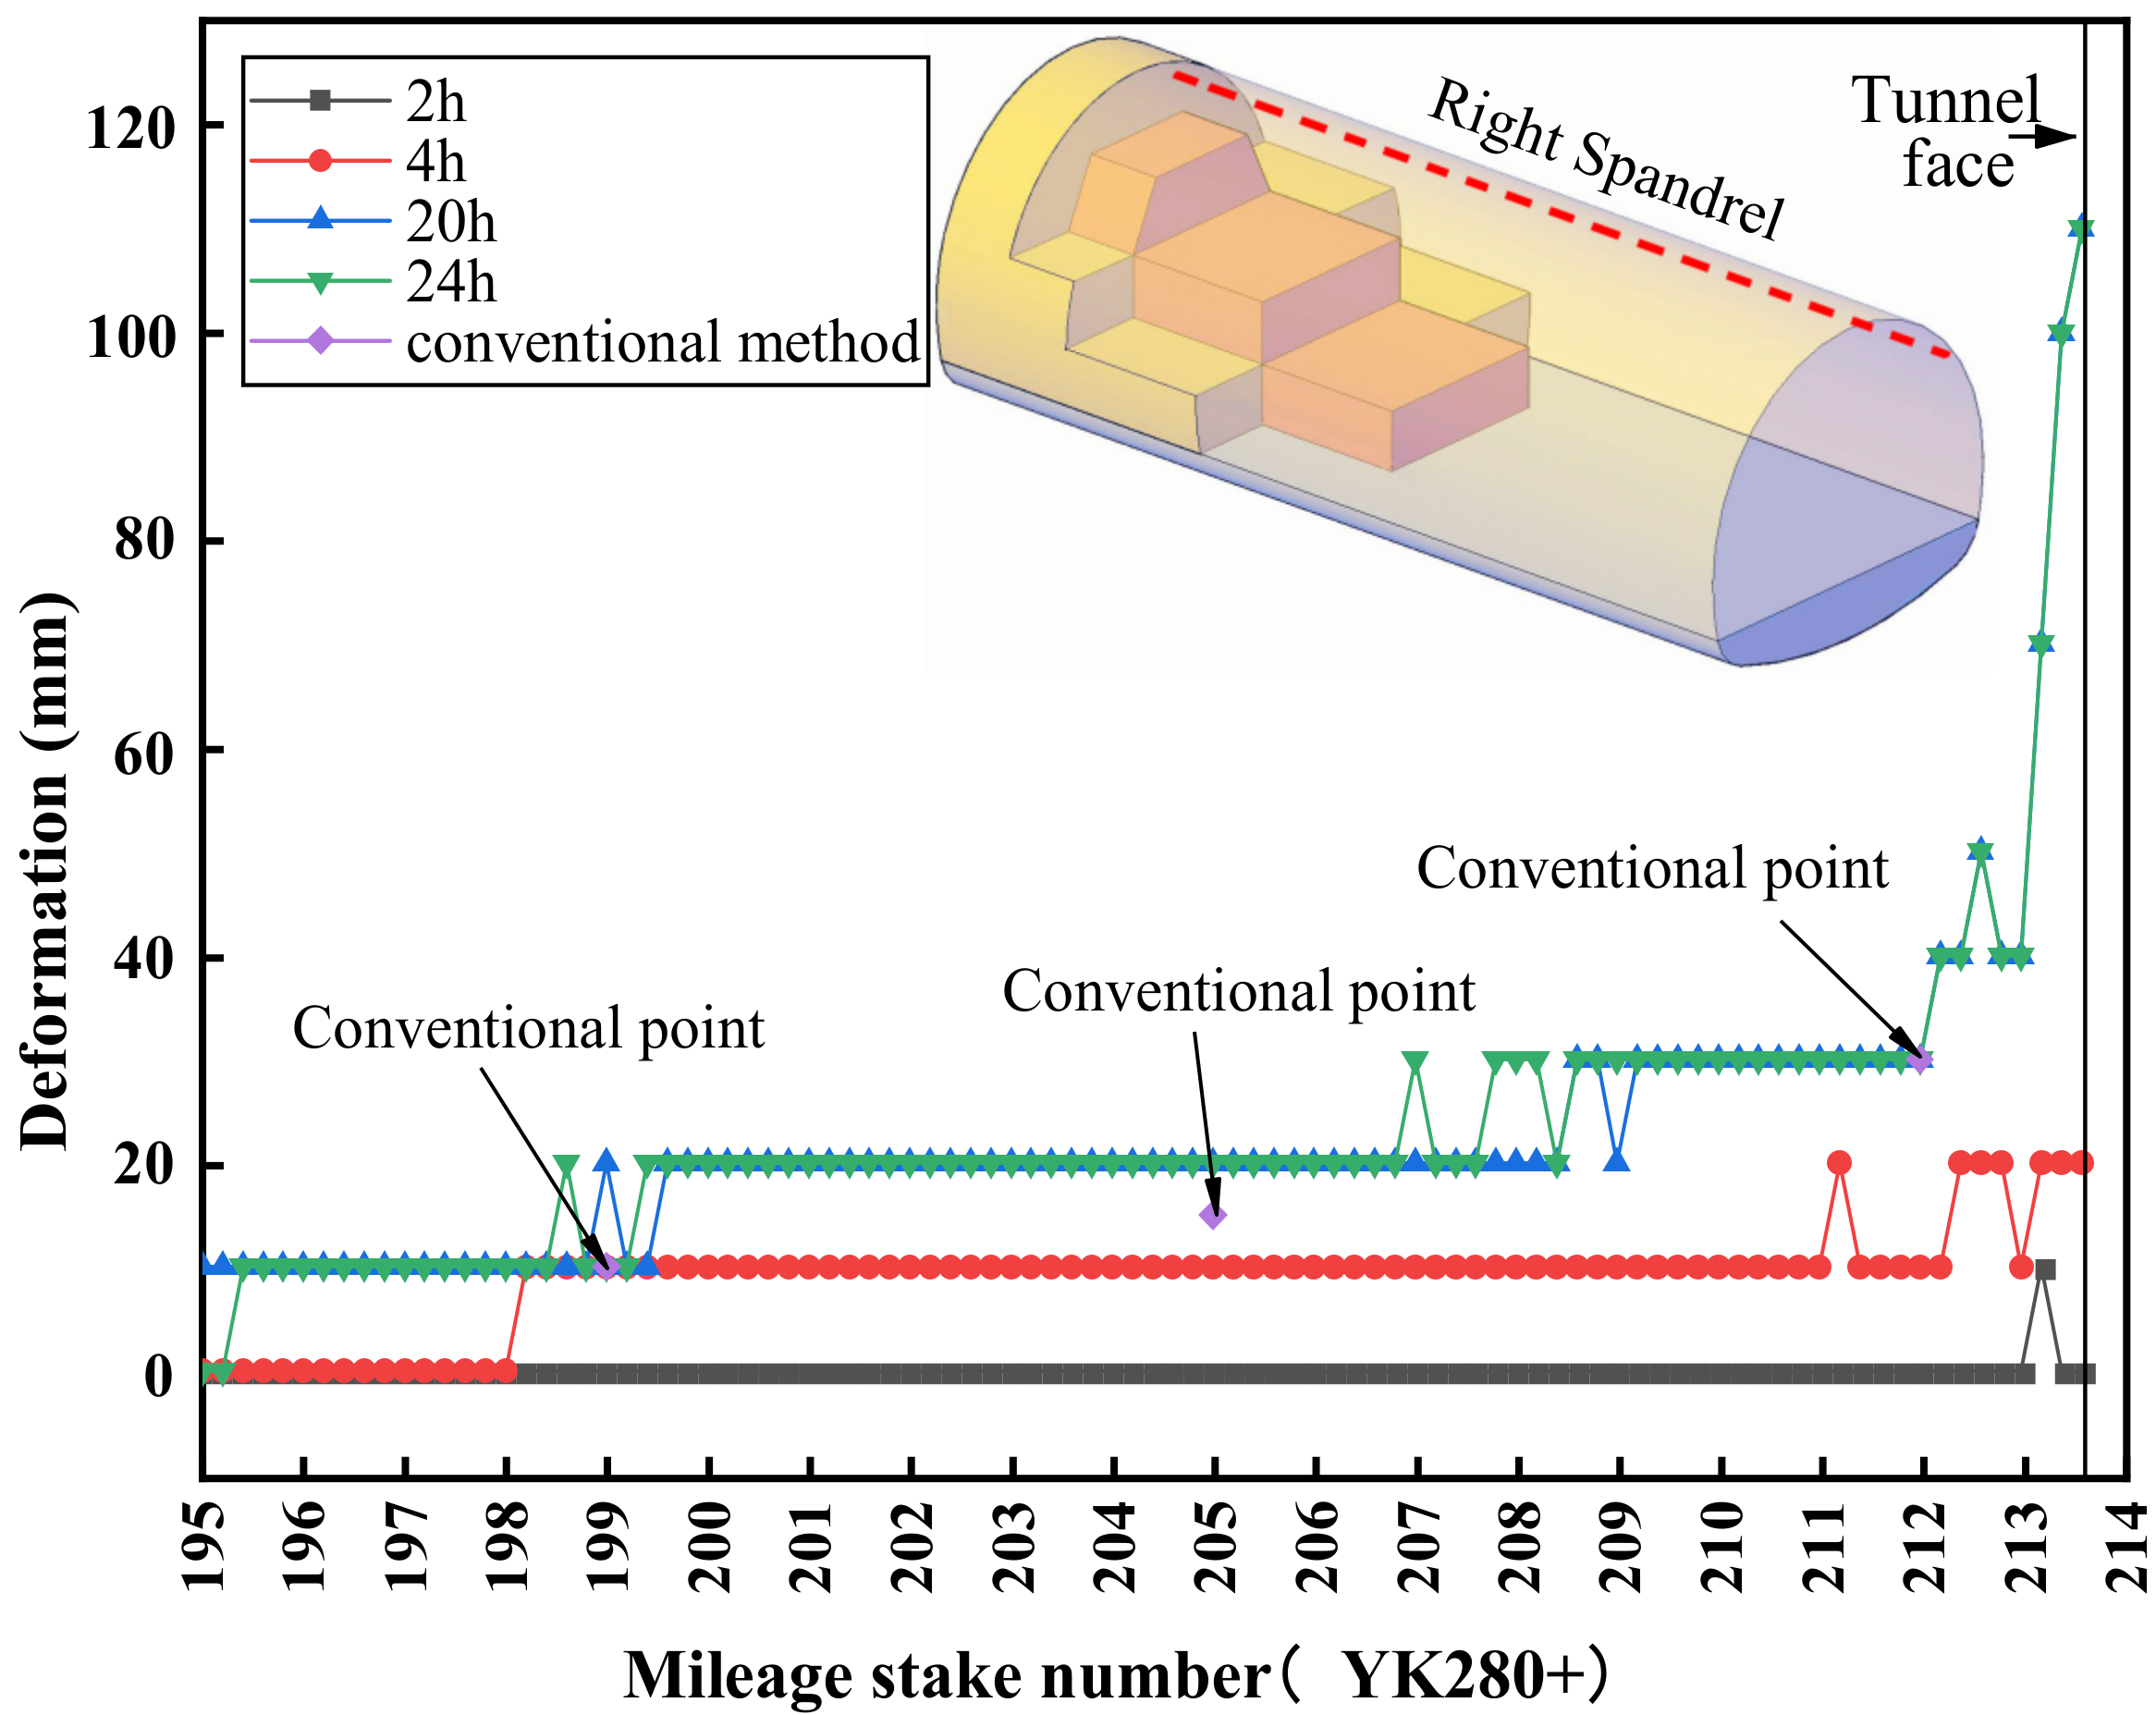
Deformation of left and right spandrels of the tunnel
Figure 15 and Figure 16 reflect the variation of the subsidence of the left and right spandrels along the longitudinal direction of the tunnel within 24 h of the monitoring mileage. The deformation of these two positions is related to the convergence of the tunnel circumference. It can be seen from the figure that the deformation law of the left and right spandrels is similar to that of the vault. The deformation of the right spandrel around the face is larger than that of the left spandrel, and there is distortion. The three-stage descending of the deformation of these representative points is also confirmed by the three-stage excavation method of the tunnel. Compared with the total deformation of the spandrels around 24 h monitored by the conventional method, the 3D laser scanning has more measuring points and more monitoring sections, which can better reflect the overall deformation trend of the left and right spandrels.

4.2. Analysis of Scanning Results for Long-Term Initial Support Deformation

From 6 December 2019 to 10 January 2020, a 36-day laser scan was performed on the entire tunnel excavation interval to monitor the spatiotemporal evolution of the initial support deformation of the tunnel during the excavation process.

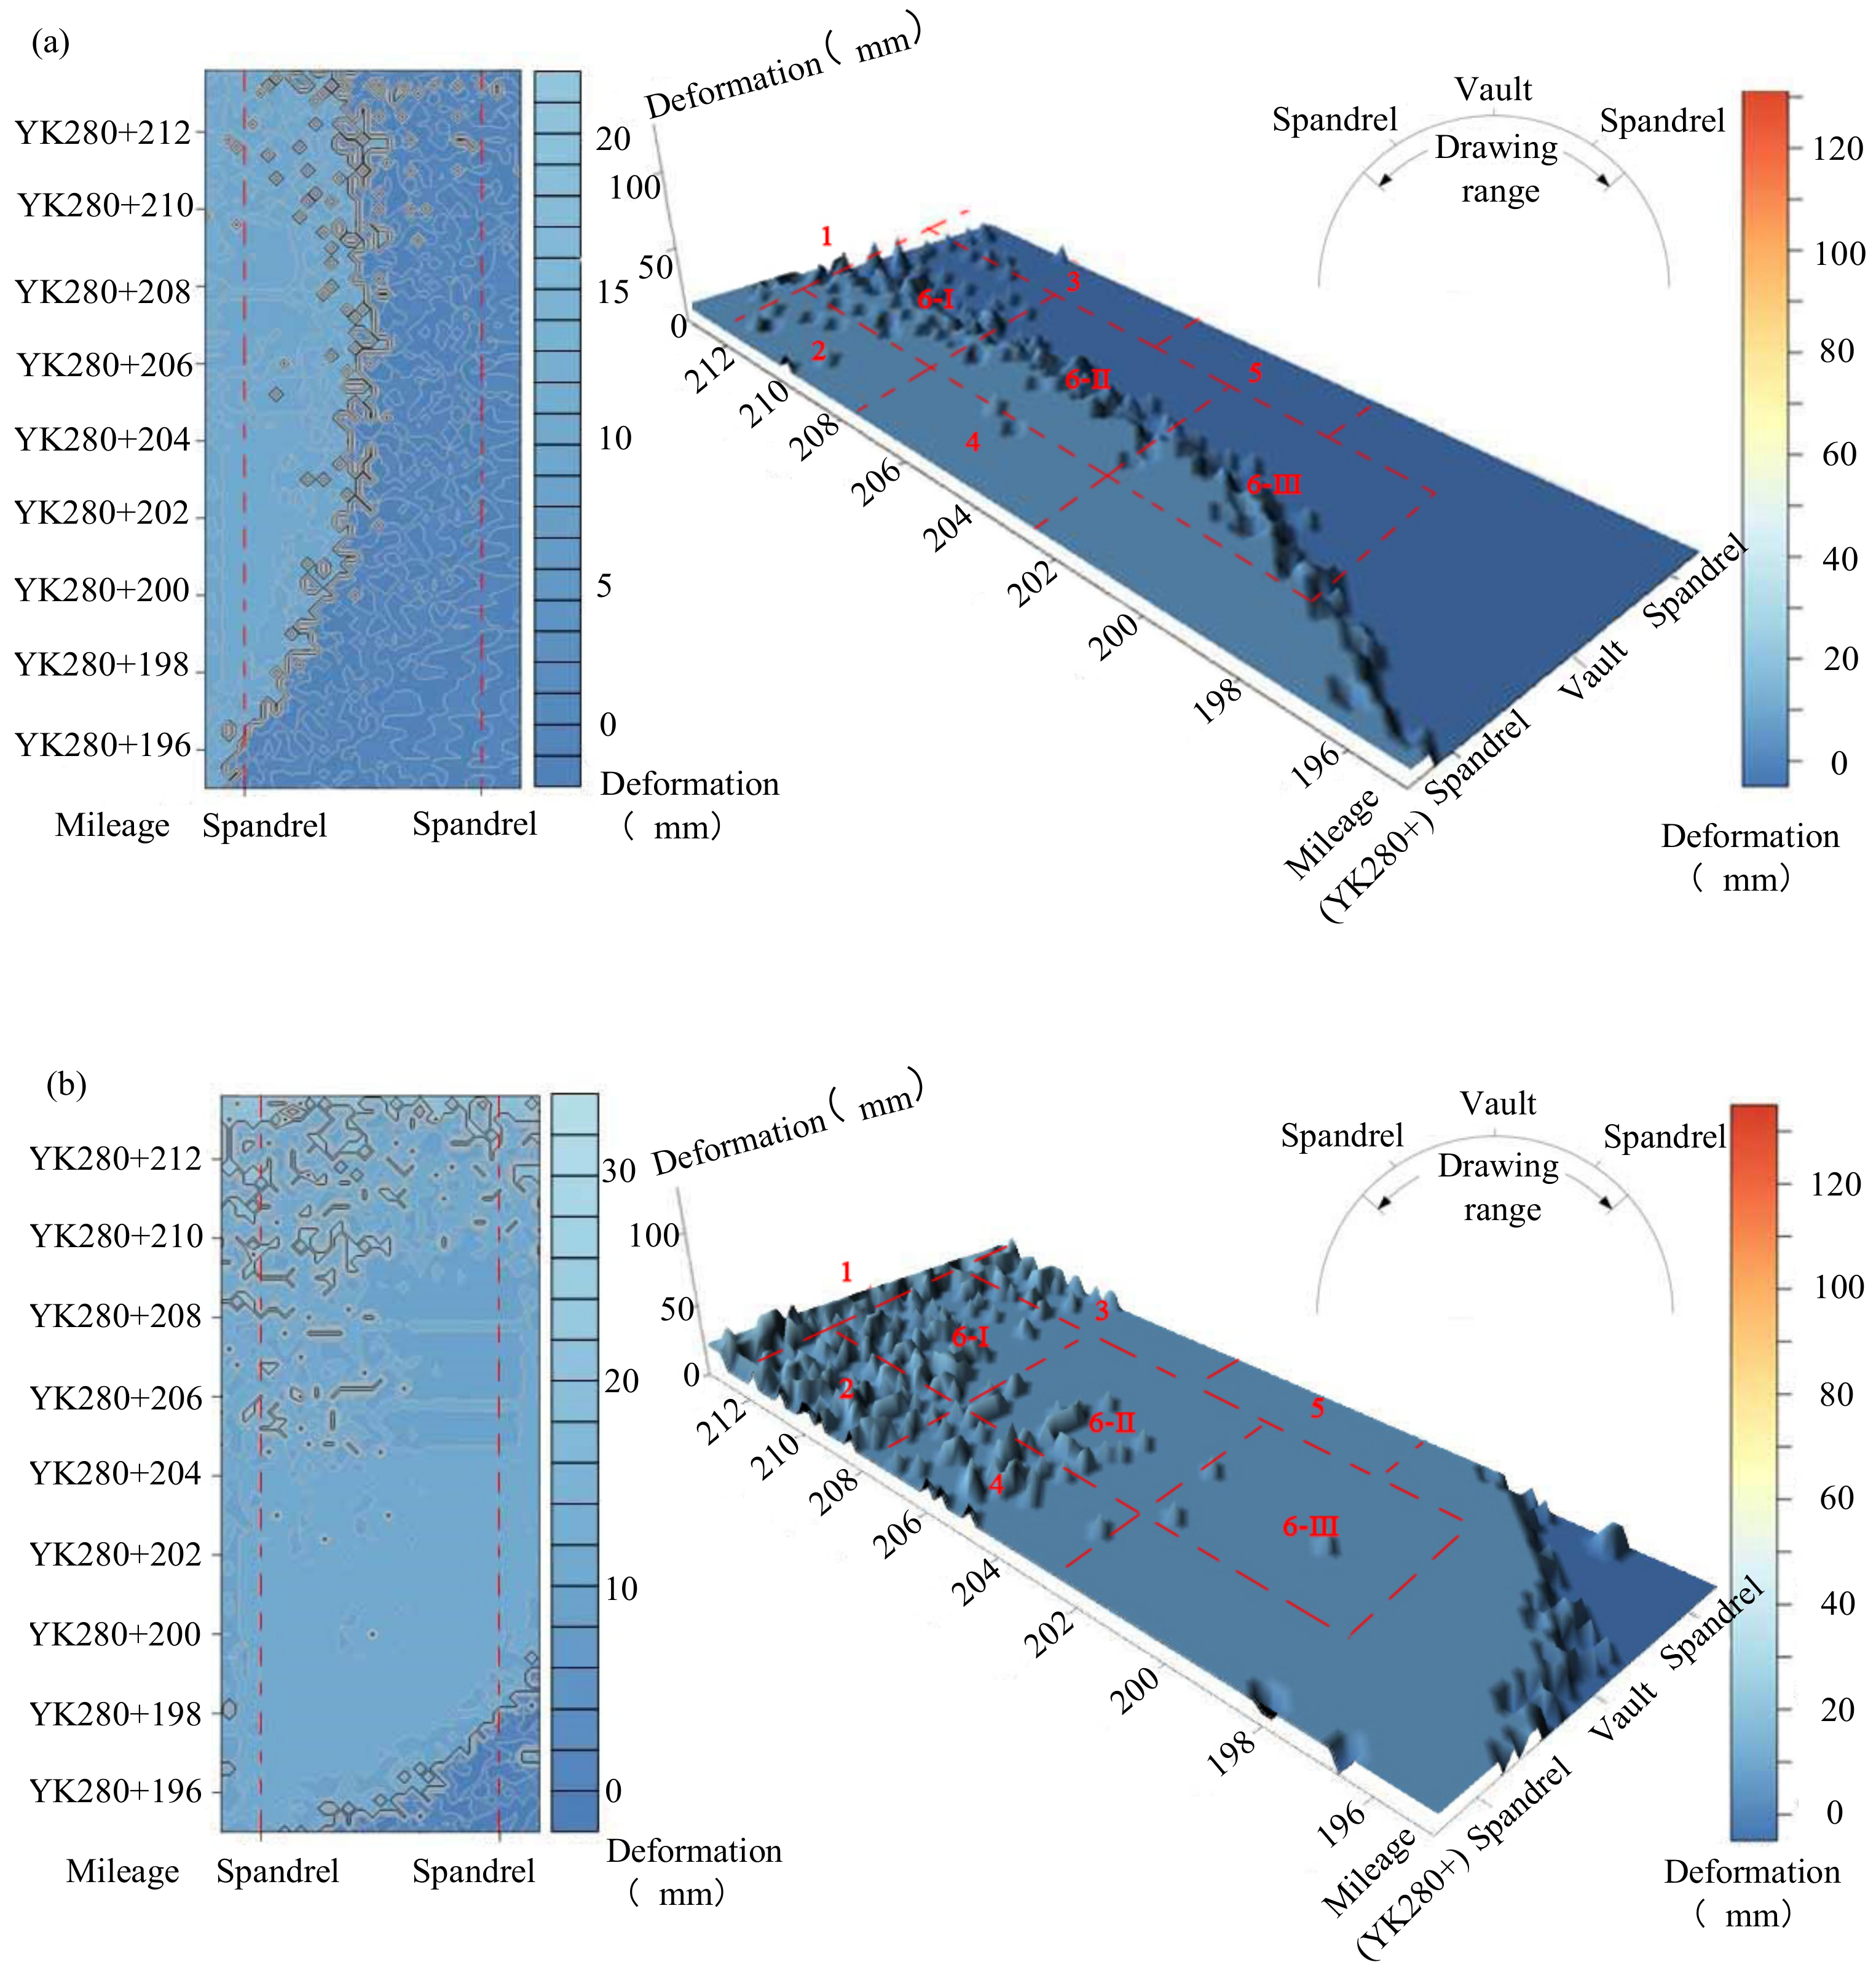
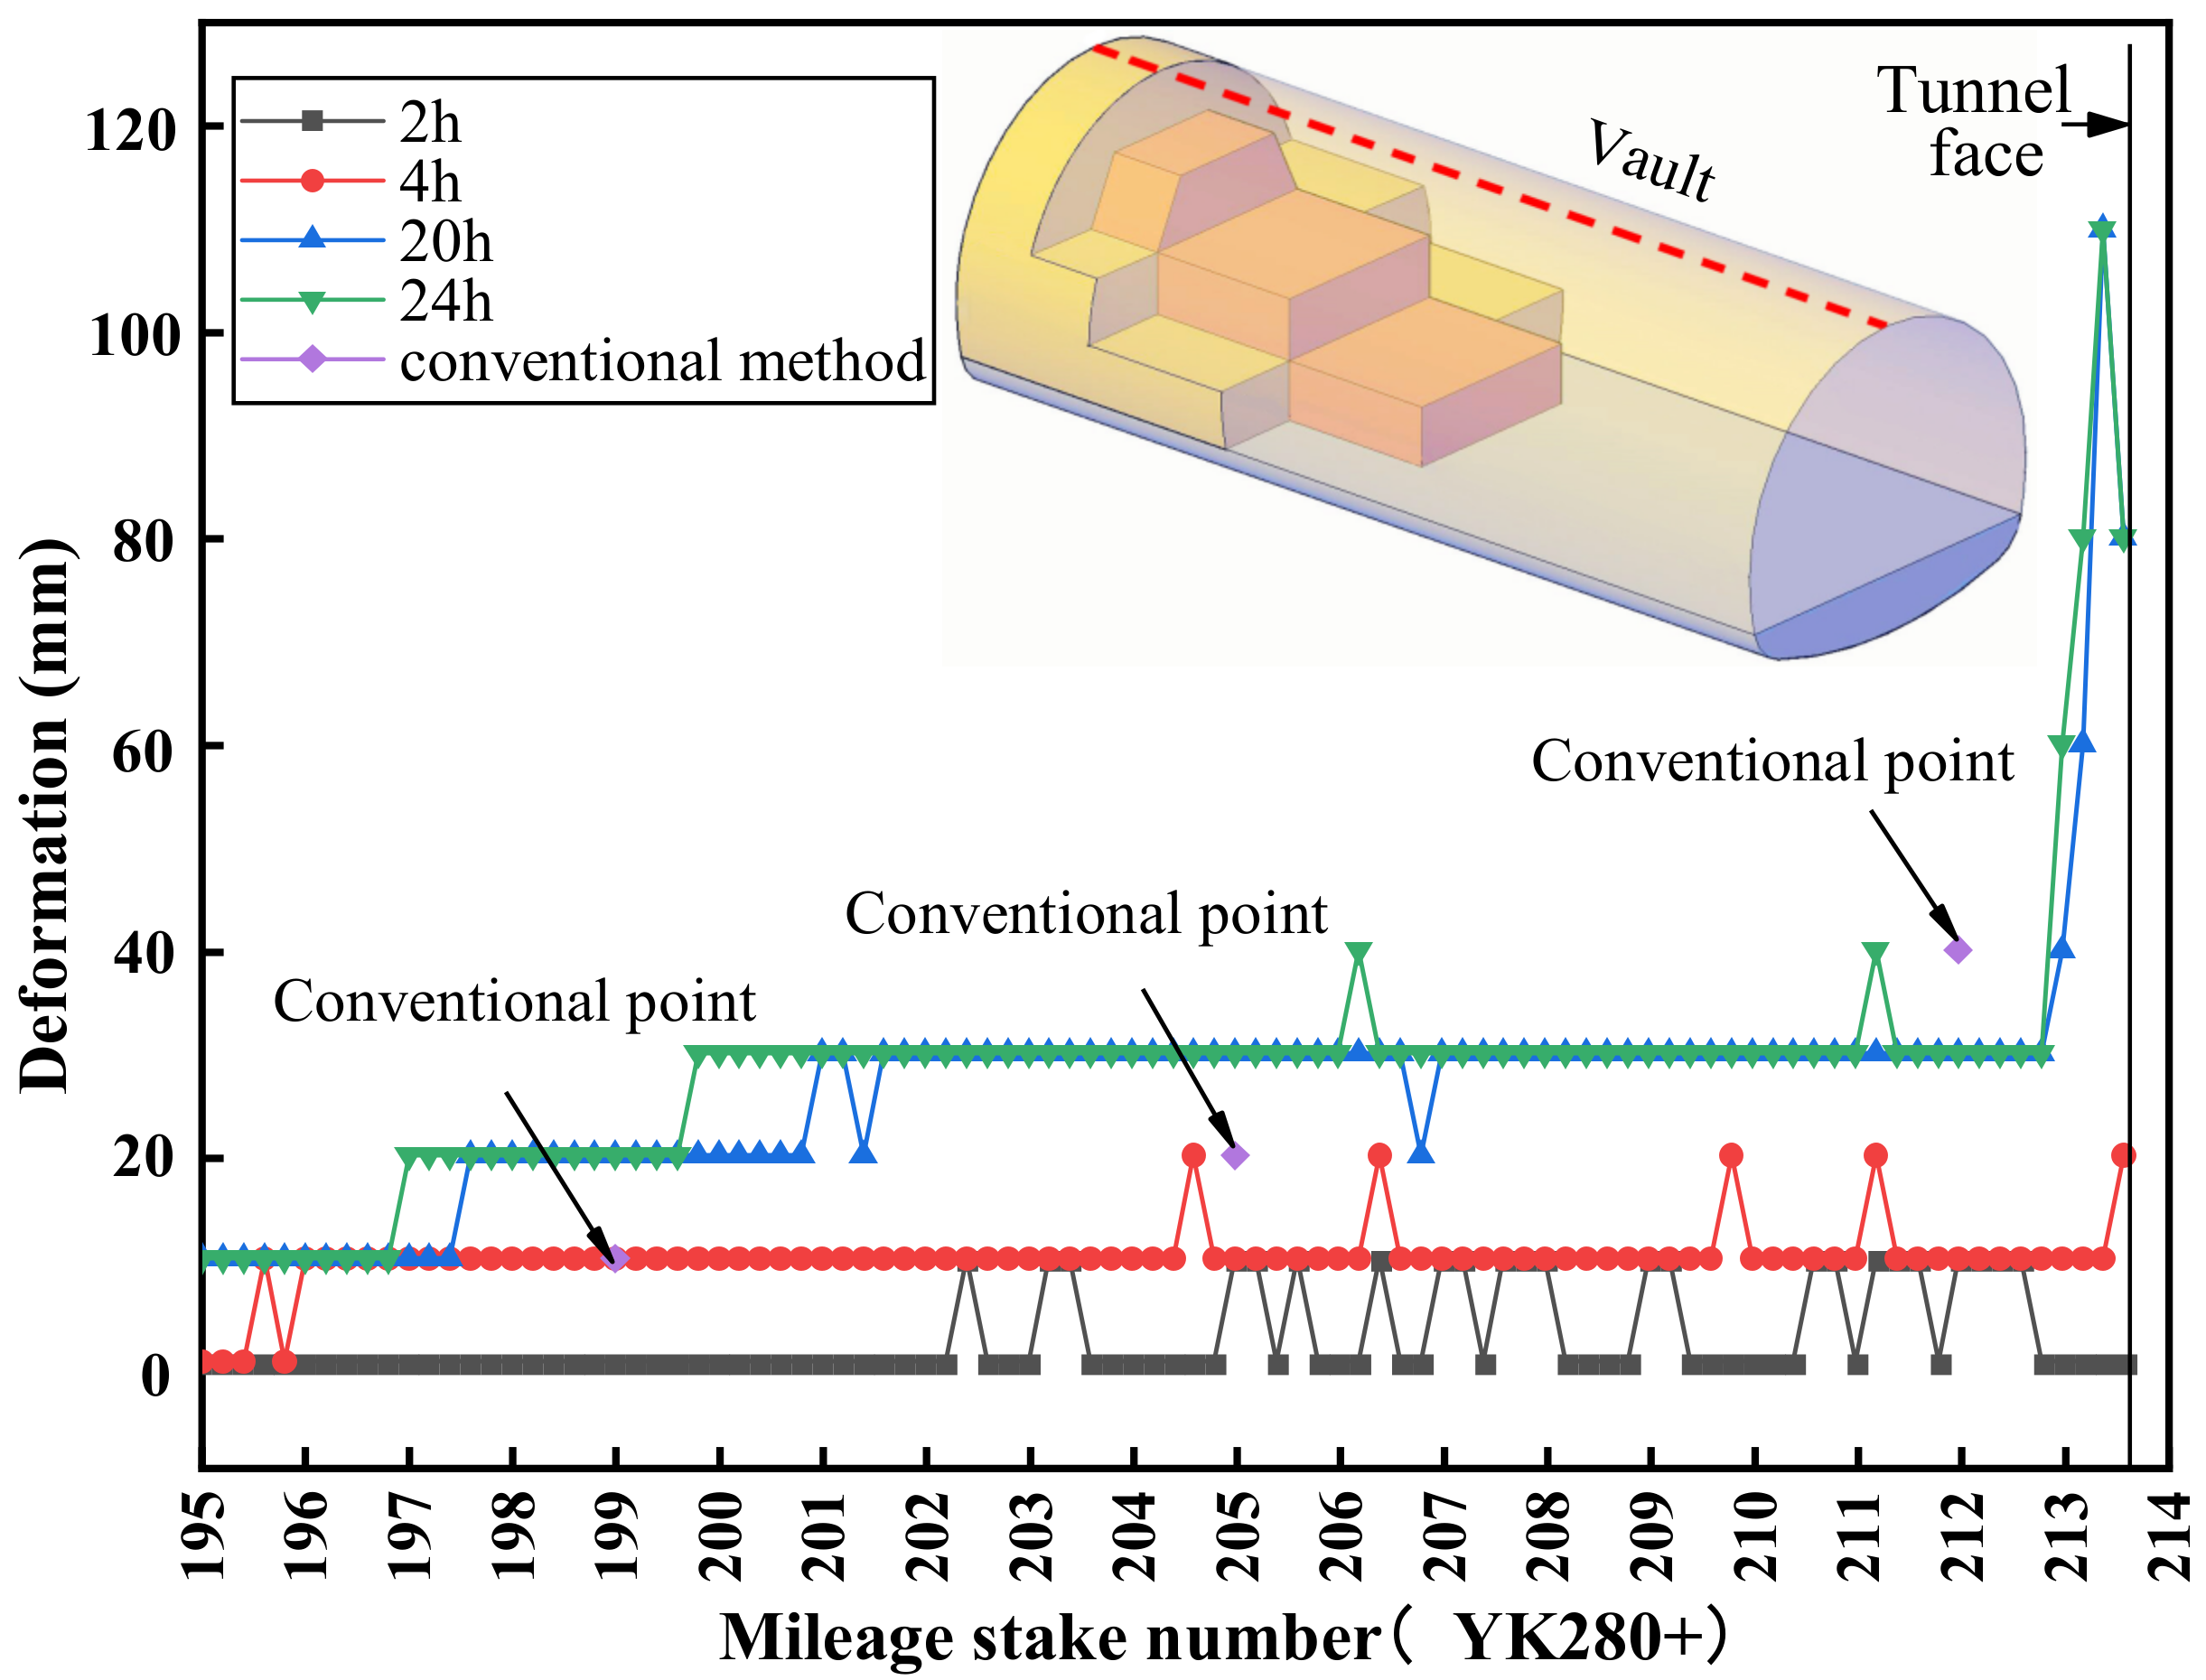
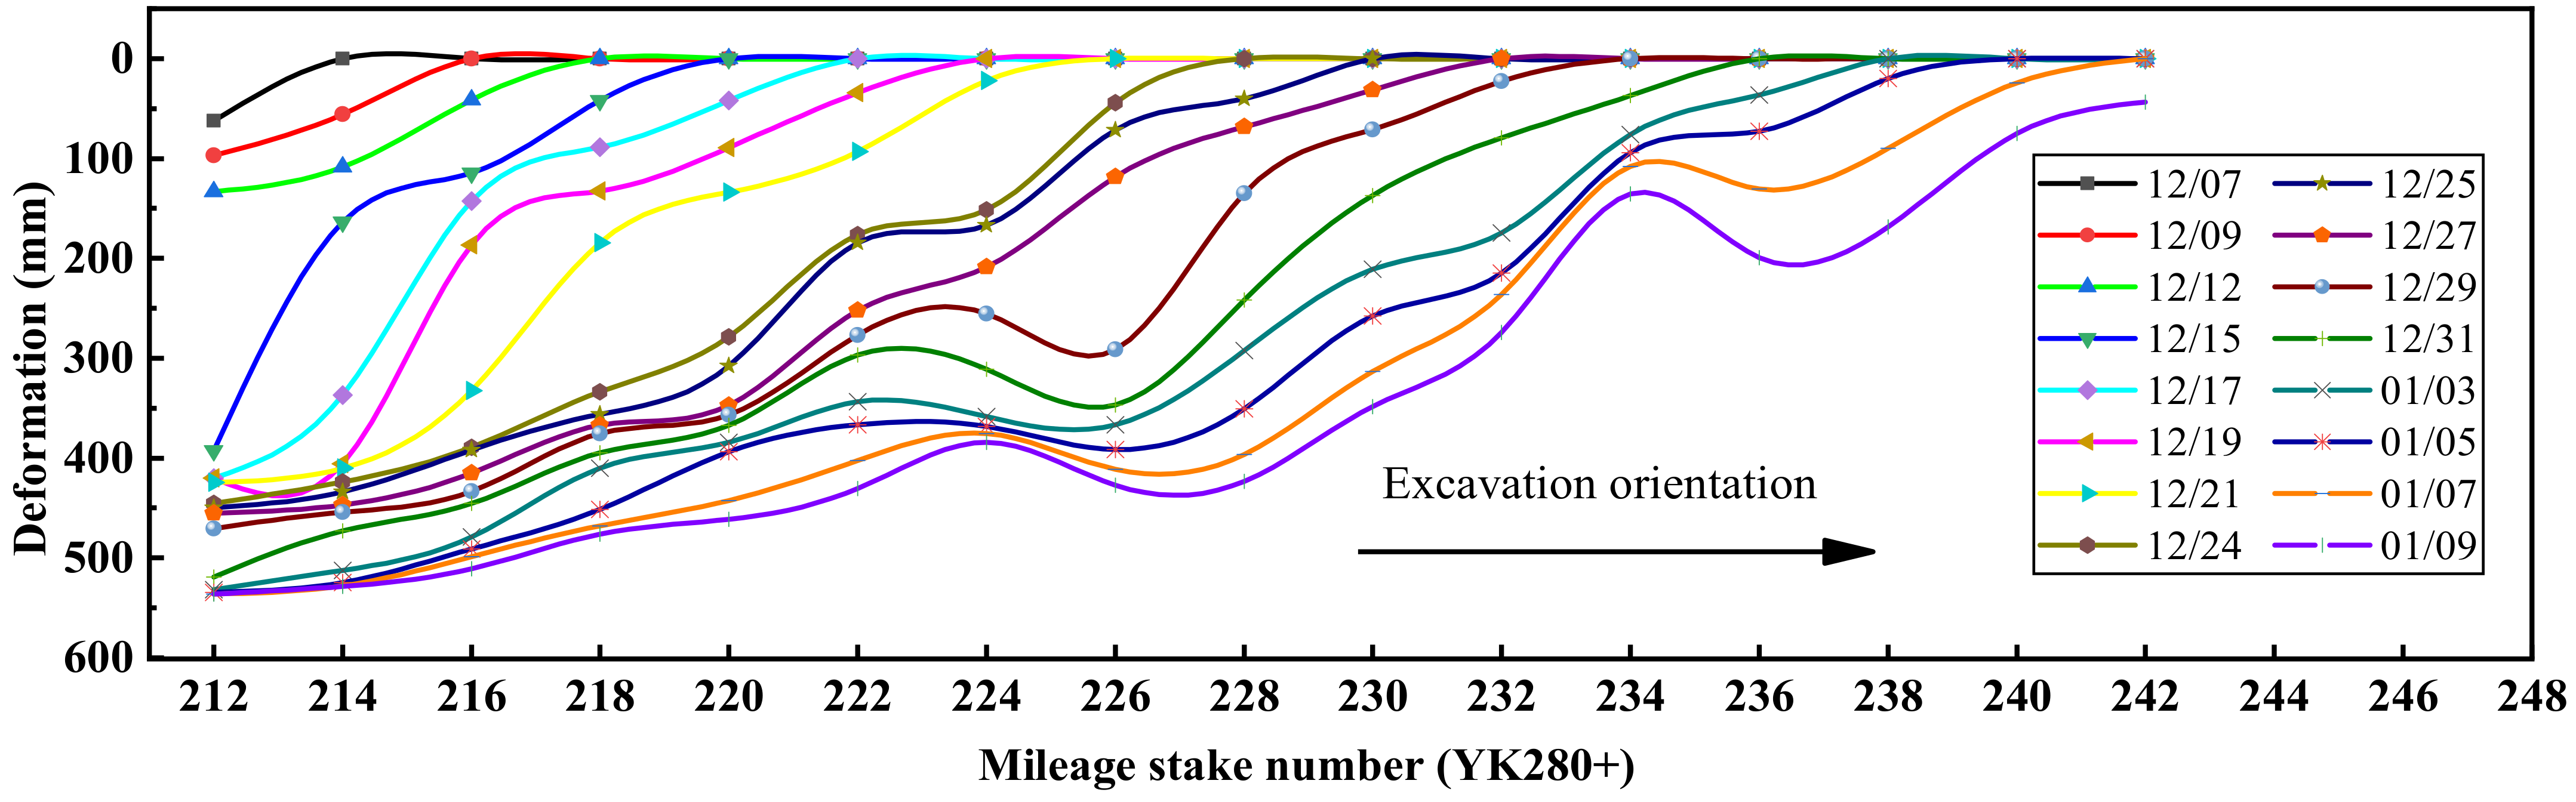
4.2.1. Spatial Evolution Law of Initial Support Deformation in the Excavation Stage

During the entire monitoring period, the 3D laser scanning results of the initial support deformation of the excavation mileage were extracted every 2 to 3 days. From the upper step of the YK280+212 mileage section excavated on December 7th to the end of the upper part of the YK280+242 mileage section excavated on January 9th, the spatial distribution of the initial support deformation in the mileage from YK280+212 to YK280+242 are shown in Figure 17.
It can be seen from the figure that with the continuous advancement of the face, the overall low-mileage deformation is large, and the high-mileage deformation is small. Compared with the high-mileage section, the low-mileage section is excavated earlier, making the initial support bear the surrounding loess load for a longer time, so the accumulated deformation is larger.
From the scanning results from 24 December to 9 January of the following year, when the excavation reaches the mileage of YK280+242, the closer to the excavation surface, the sparser the deformation curve of the initial support. The farther from the excavation surface, the denser the deformation curve of the initial support at each time. The density of the deformation curve shows that the deformation of the initial support near the face develops faster. However, with the increase in the distance between the section and the tunnel face, the development rate of the initial support is also decreasing. In addition, it can also be seen from the figure that when the distance between the monitoring section and the excavation surface exceeds 26 m, the deformation of the initial support grows slowly and begins to stabilize.

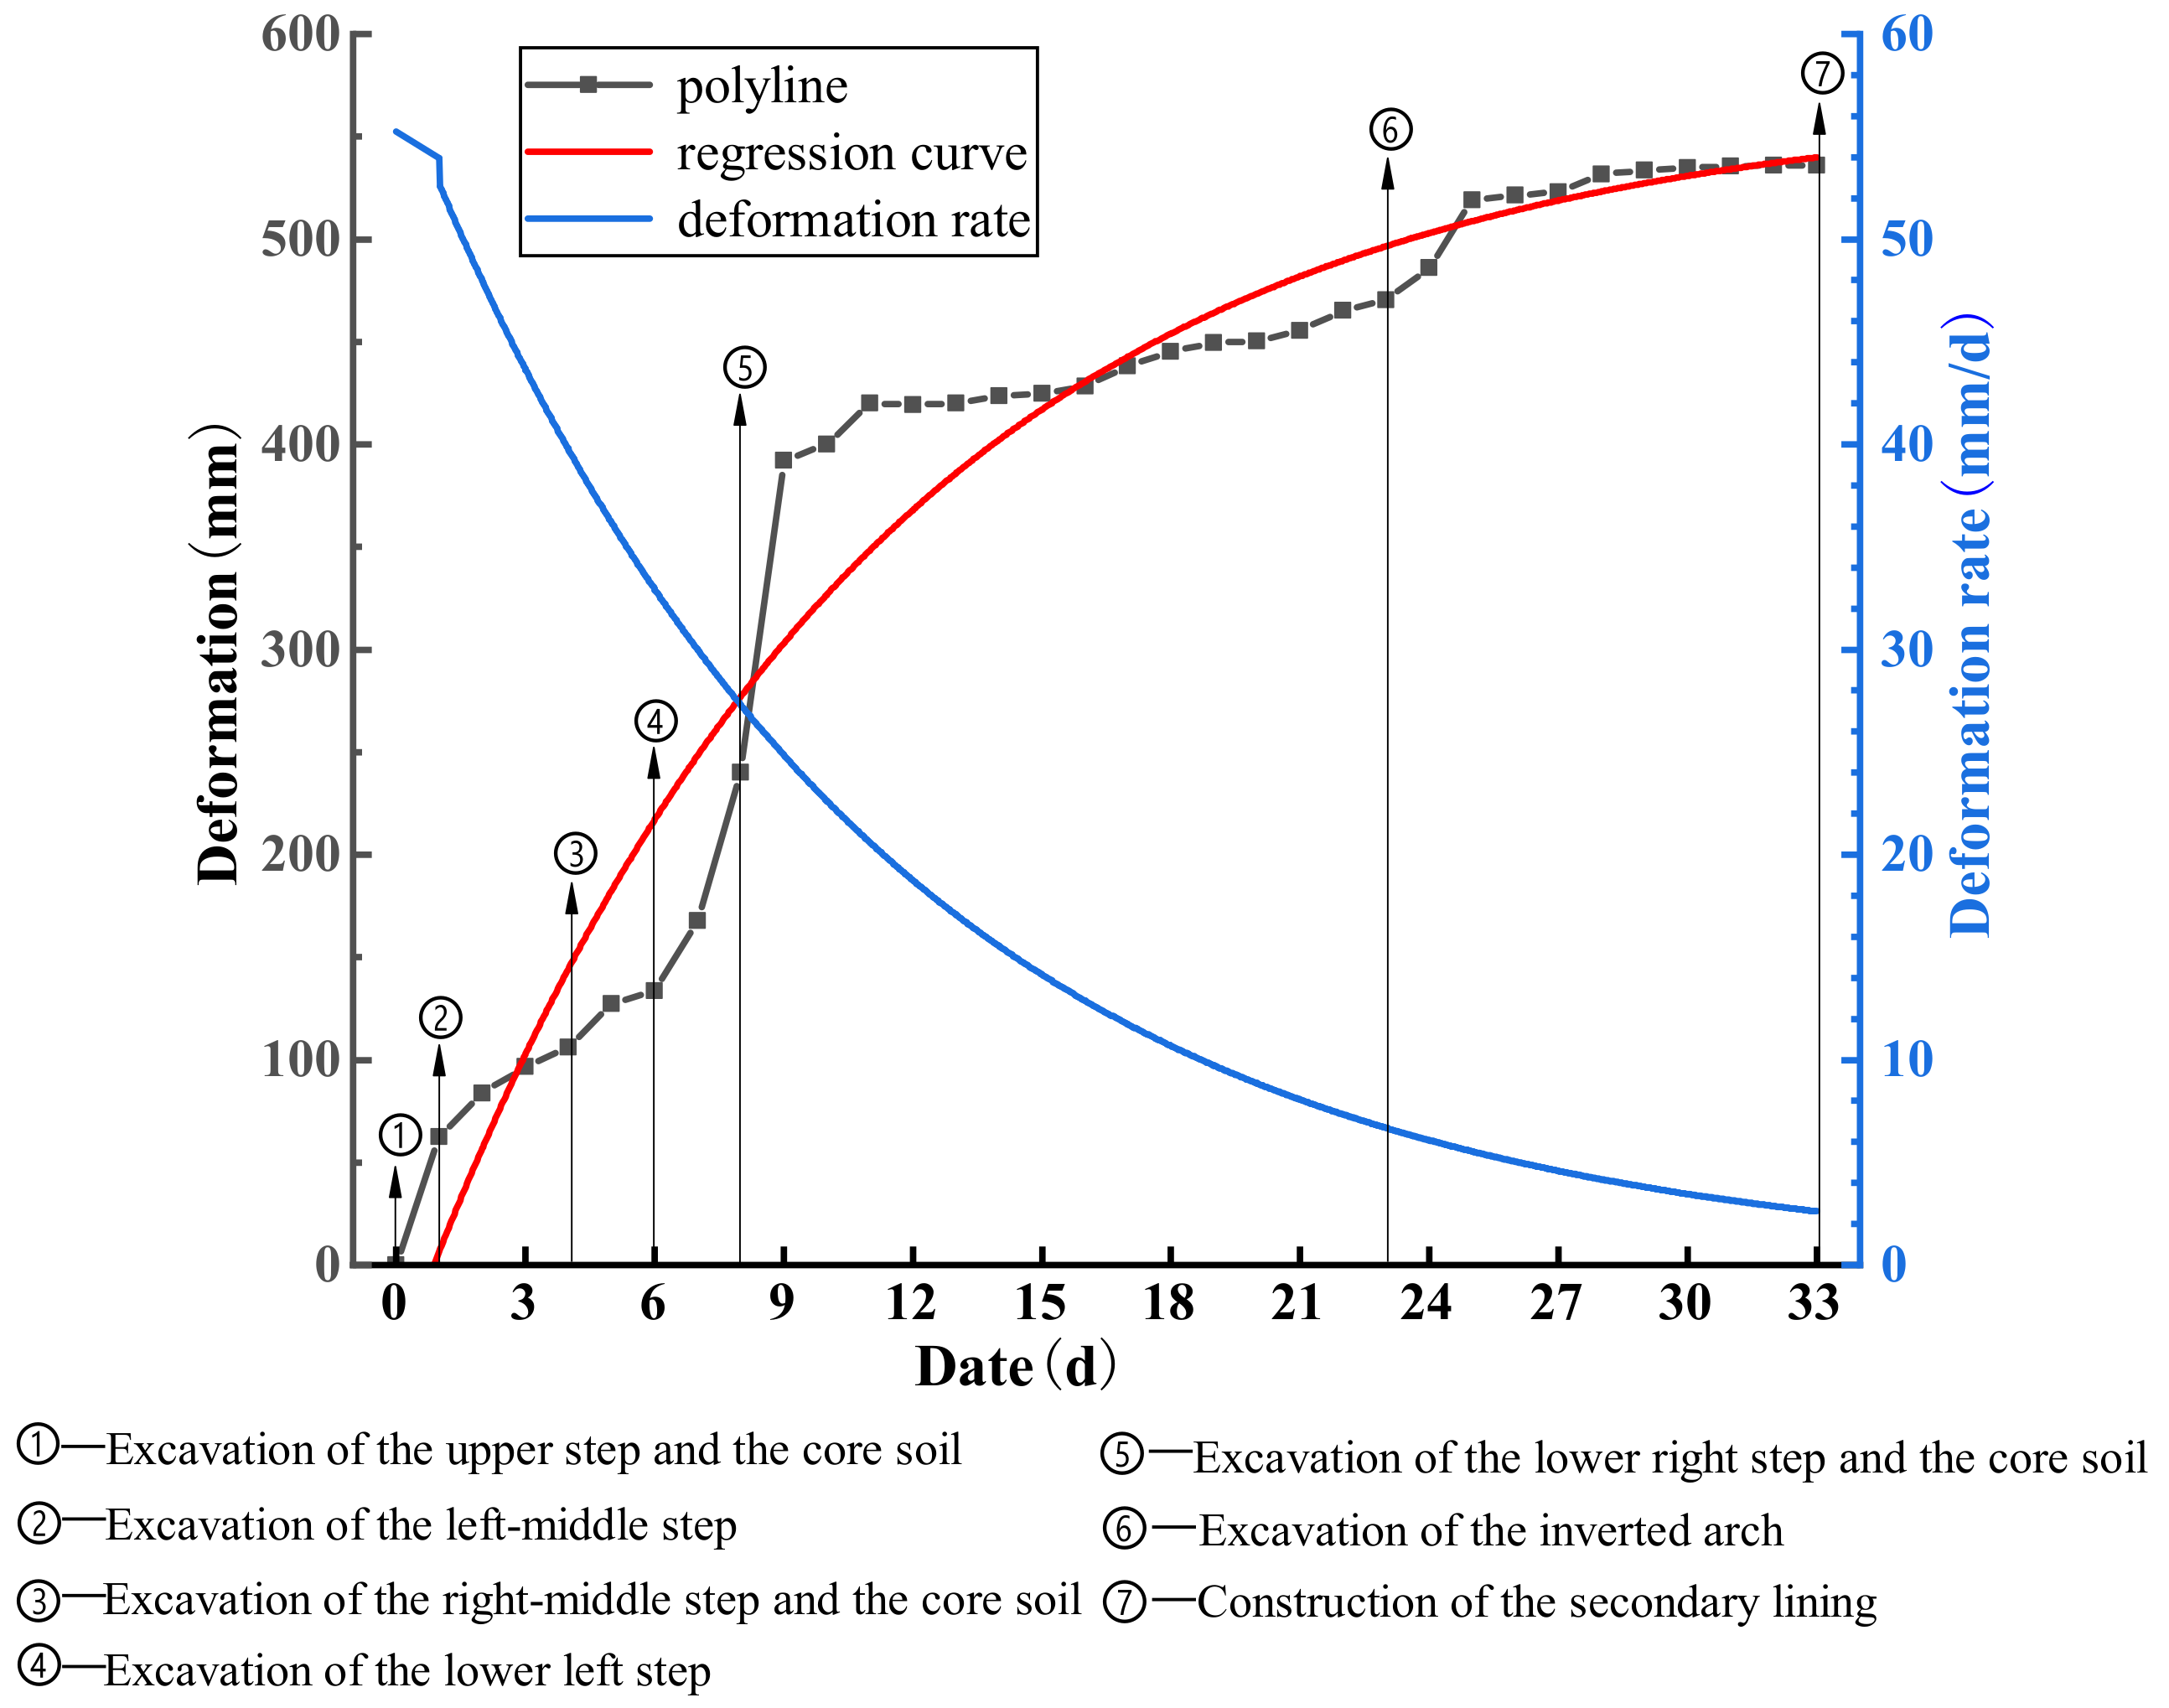
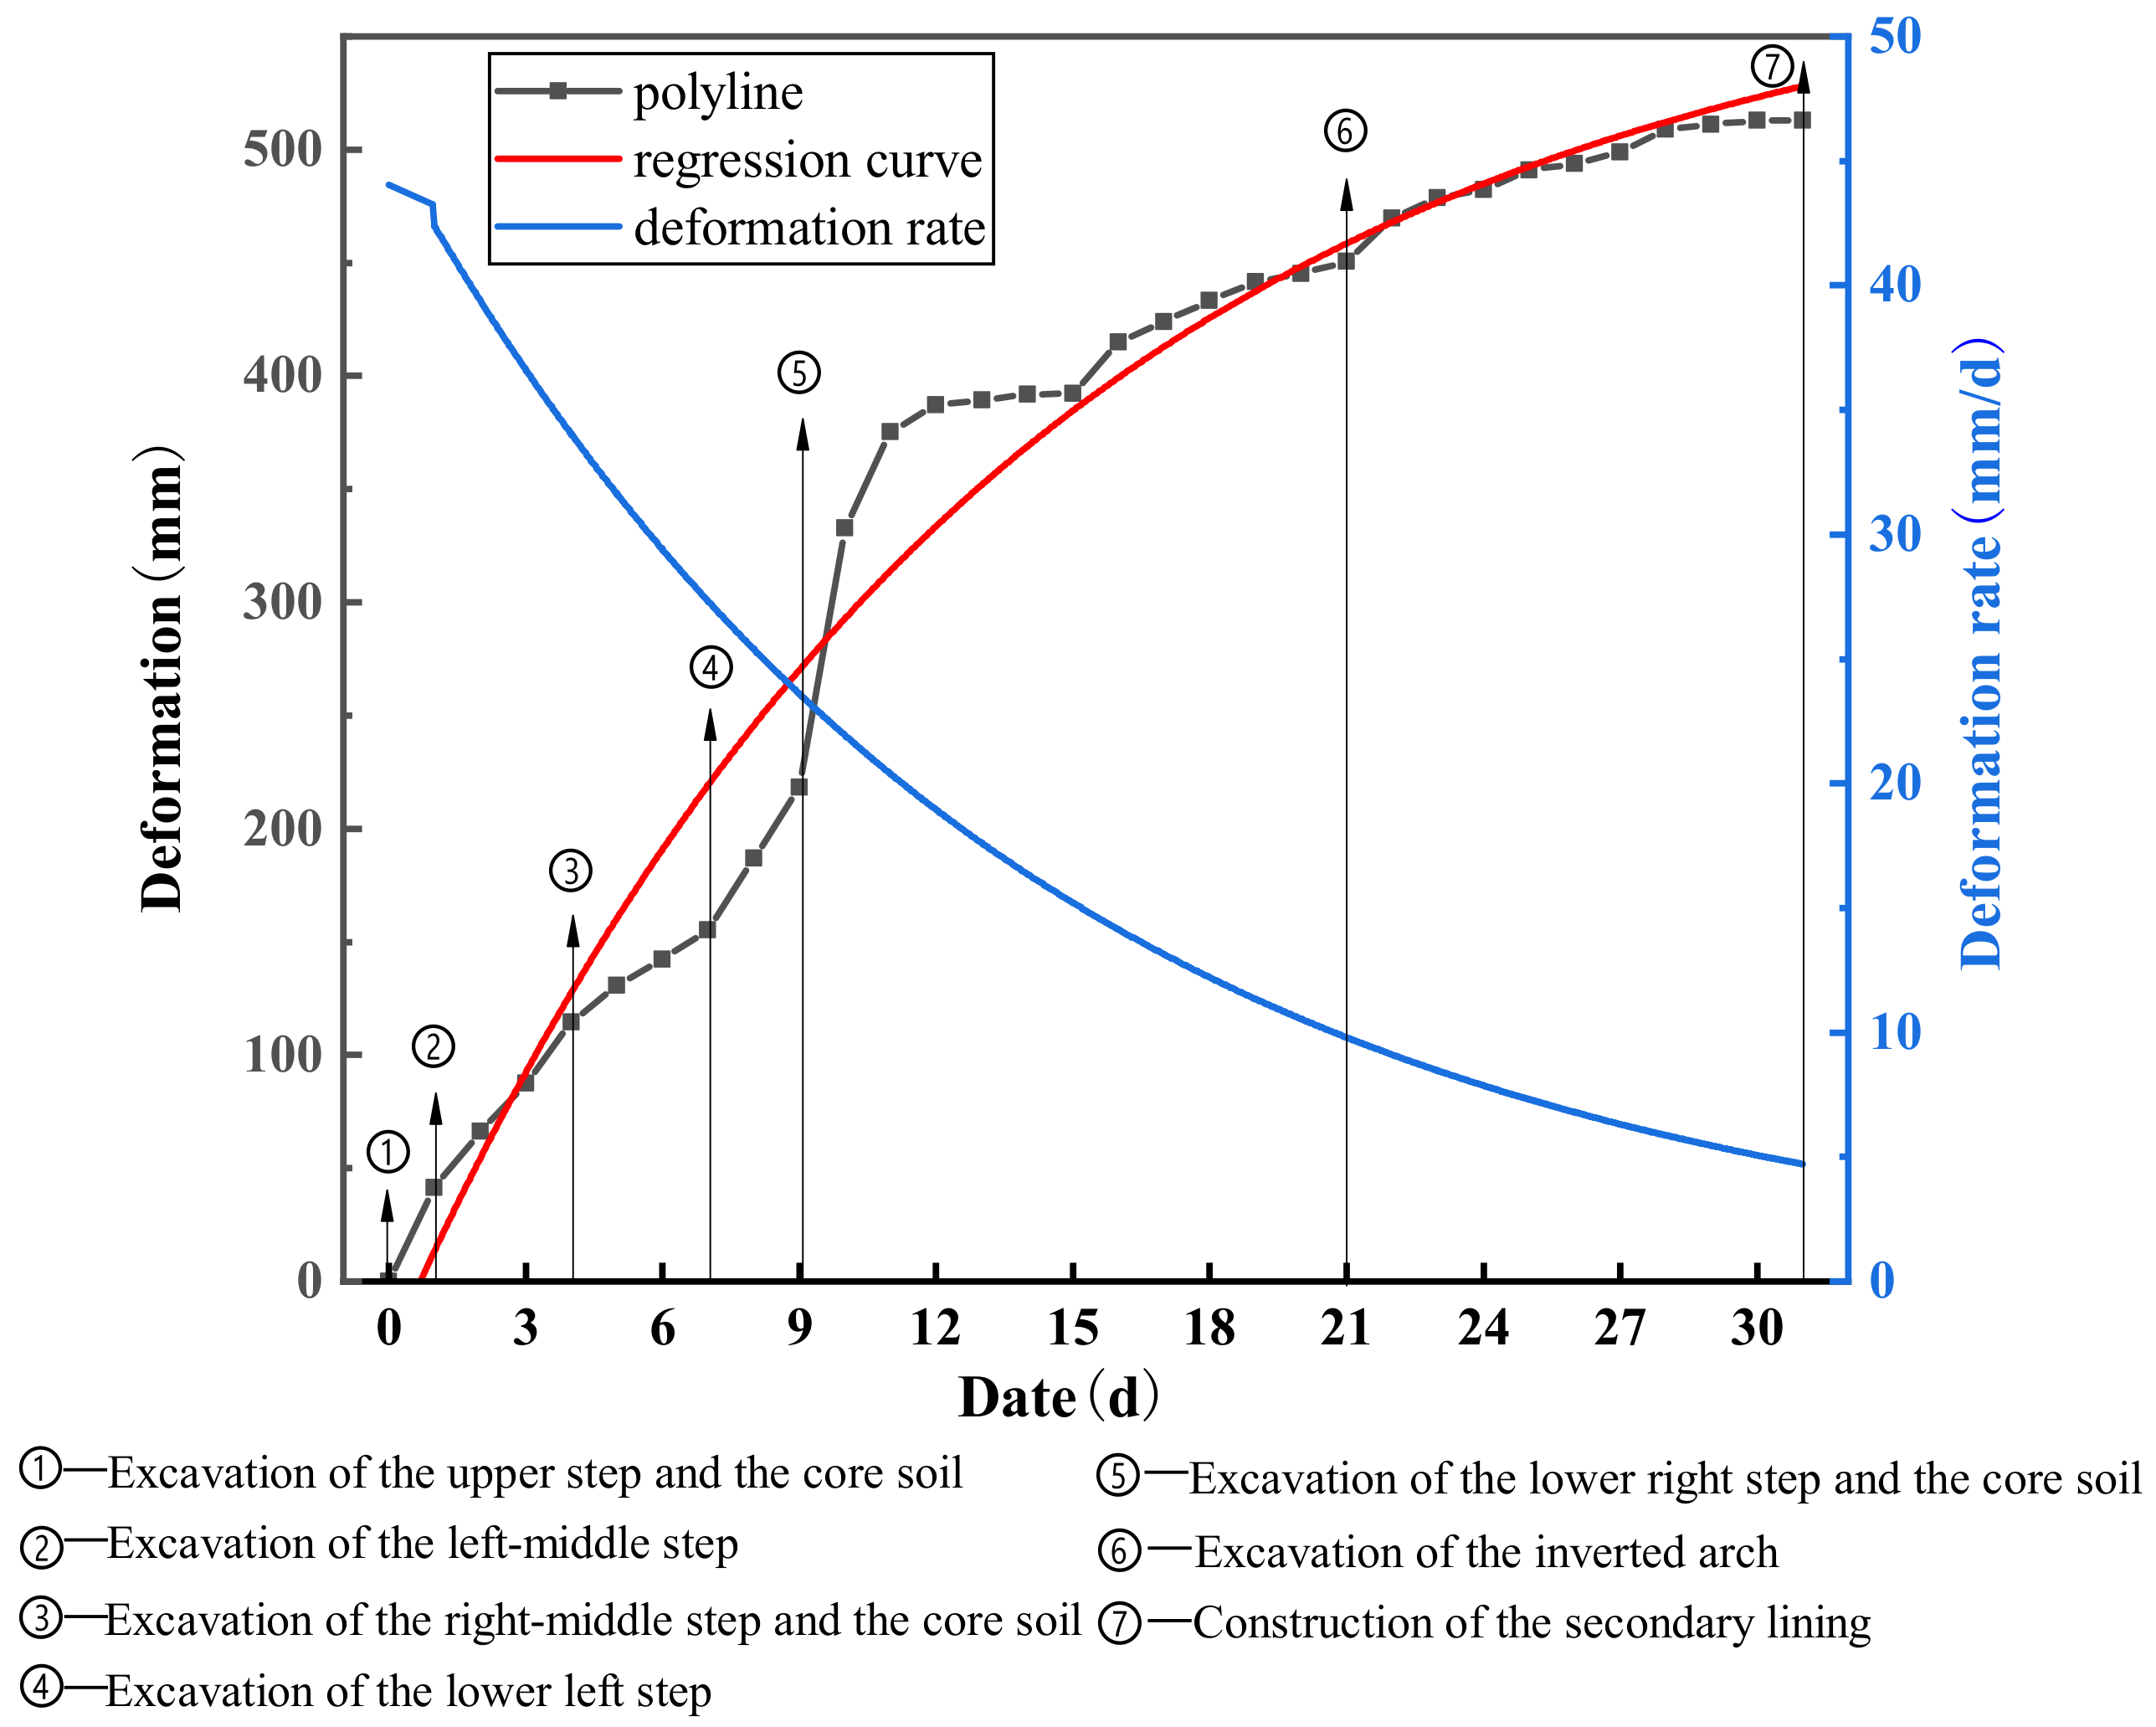
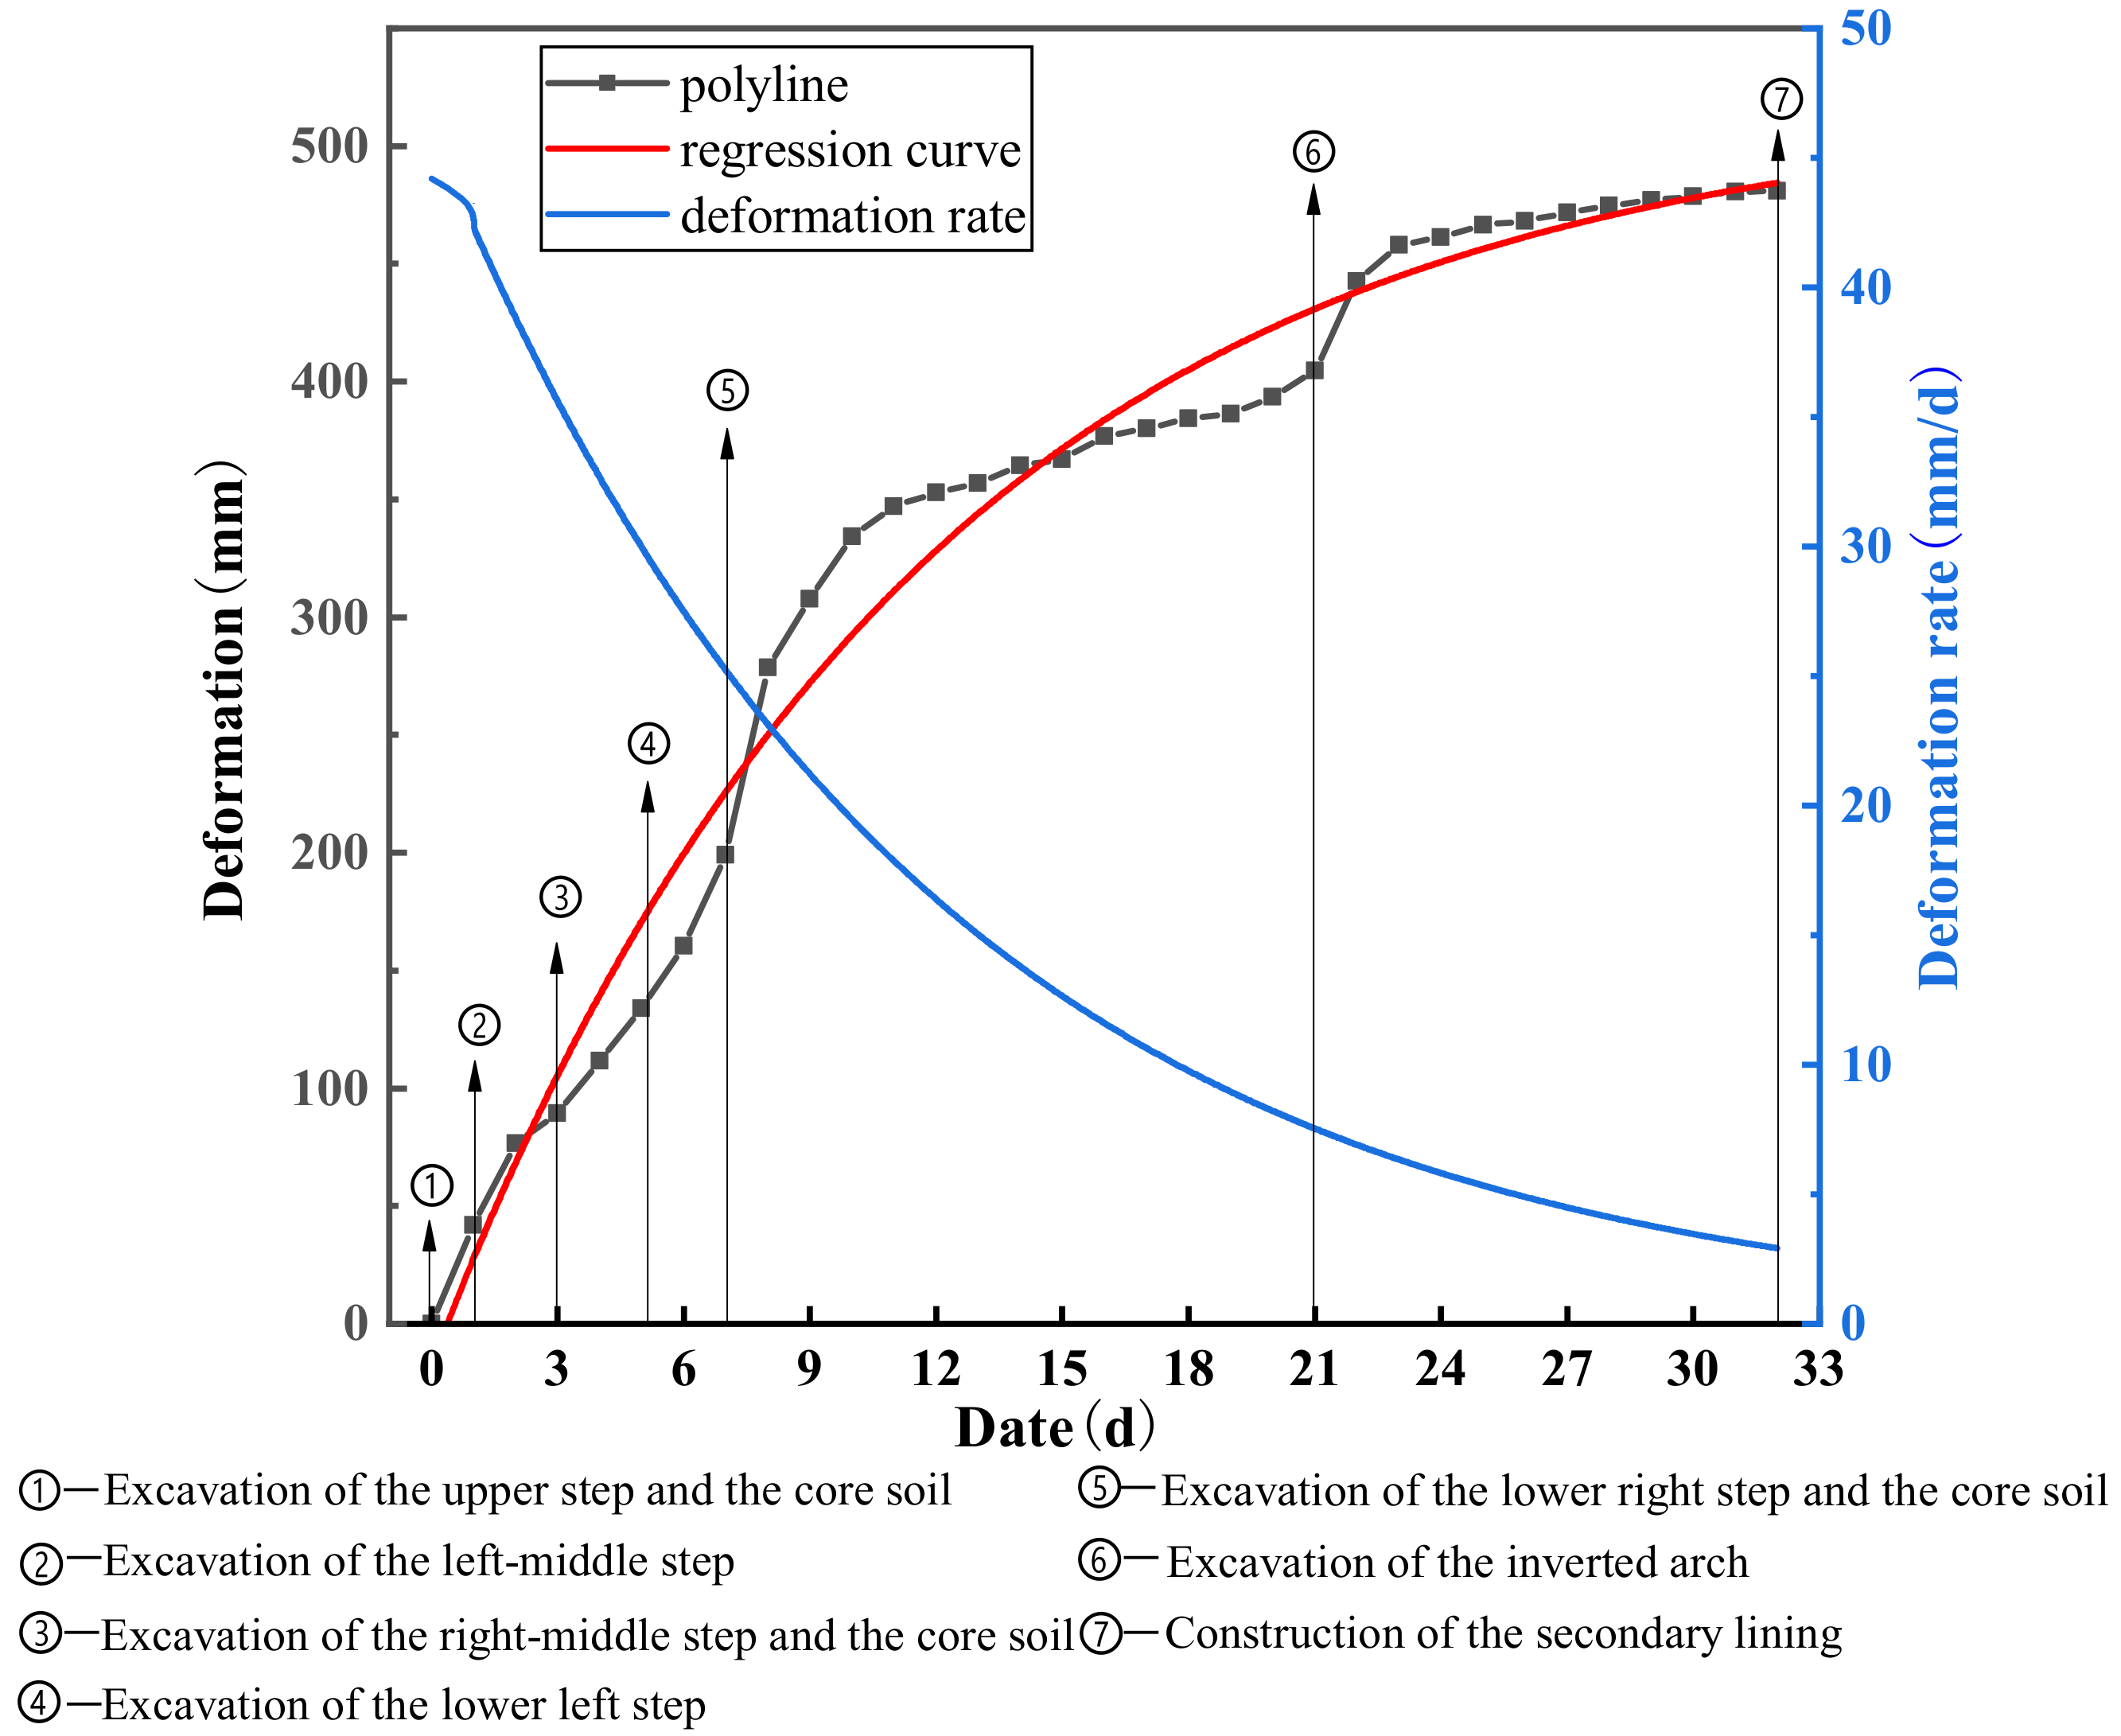
4.2.2. Time Evolution Law of Initial Support Deformation in the Excavation Stage

Three representative sections of YK280+212, YK280+216, and YK280+220 were selected for analysis, and the subsidence of the vault in the point cloud data was drawn as a scatter diagram. In order to study the time deformation law of loess tunnels, regression analysis was carried out on the time deformation characteristics of the vault subsidence in the three sections according to the point cloud data results. The selected regression function [3] is:
μ = A B e C t
where μ is the deformation (mm), t is the time (d), and A, B, and C are the regression coefficients.
The results of the deformation regression analysis are shown in Table 3. According to Table 4, the regression curve of the vault subsidence amount with time and the curve of the corresponding deformation rate with time distribution are made, as shown in Figure 18, Figure 19 and Figure 20.
From the deformation regression analysis results of the long-term scanning data in Table 4, it can be seen that the correlation coefficients of each regression function are all greater than 0.95, which indicates that the change of the vault deformation of the three selected sections with time conforms to the change law of the exponential function. The exponential function is a bounded function that can be used to predict the final deformation of the surrounding rock vault shown in Table 4. By comparing and analyzing the measured value of the subsidence of the vault in 30 days and the predicted value of the final subsidence, although the subsidence of each section of the vault within 30 days tends to be stable, there will be different degrees of increase in the future. In actual engineering, the slowly increasing deformation of the vault in the later stage must not be ignored. In addition, the application of the regression function also provides a certain reference for the design of the deformation reserve in the early stage of excavation.
Figure 18, Figure 19 and Figure 20 show that the tunnel’s initial support deformation and deformation rate are closely related to the excavation sequence and time. After each step of excavation, the subsidence of the vault will show the characteristics of rapid deformation in the early stage and a gradual decrease in the deformation rate in the later stage. During the whole monitoring period, the overall trend of the tunnel deformation rate gradually decreased and finally stabilized.
There are three stages of characteristics for the overall deformation of the section. The first stage is the rapid growth stage. In this stage, the deformation increases rapidly with the excavation sequence, and the deformation accounts for about 70–80% of the total deformation. The duration of deformation is related to the progress of the excavation and generally ends 3–5 days after the excavation of the core soil of the lower step. The deformation characteristics of this stage require that we do advance support measures and do quick excavation, quick support, and quick closure during construction to control the occurrence of large deformation as soon as possible. The second stage is the continuous growth stage. The deformation of this stage continues to grow slowly with time, and the deformation accounts for about 20–30% of the total deformation. In the case of fast excavation and fast support, the deformation growth continued to the time of the invert’s excavation and support. At this stage, the excavation support and backfilling of the inverted arch should be carried out as soon as possible to reduce the duration of the successive growth stage. The third stage is the slow growth stage. The deformation is still growing slowly, and the secondary lining should be applied as soon as possible.

5. Conclusions

A large number of engineering practices have shown that large-scale deformations with complex spatial and temporal distributions often occur in loess tunnels. Based on 3D laser scanning technology, this paper reveals the refined characteristics of loess tunnel deformation. According to the monitoring analysis results, the following conclusions can be drawn:
(1)
The deformation of loess tunnels has the characteristics of rapid mutation, continuous development, and complex distribution. The monitoring of 3D laser scanning technology has the characteristics of real-time, fast, and dynamic exchange, which solves the problems of less measurement point data, slow data acquisition, and incomplete monitoring data under conventional monitoring methods, which is of great significance for analyzing the deformation characteristics of loess tunnels;
(2)
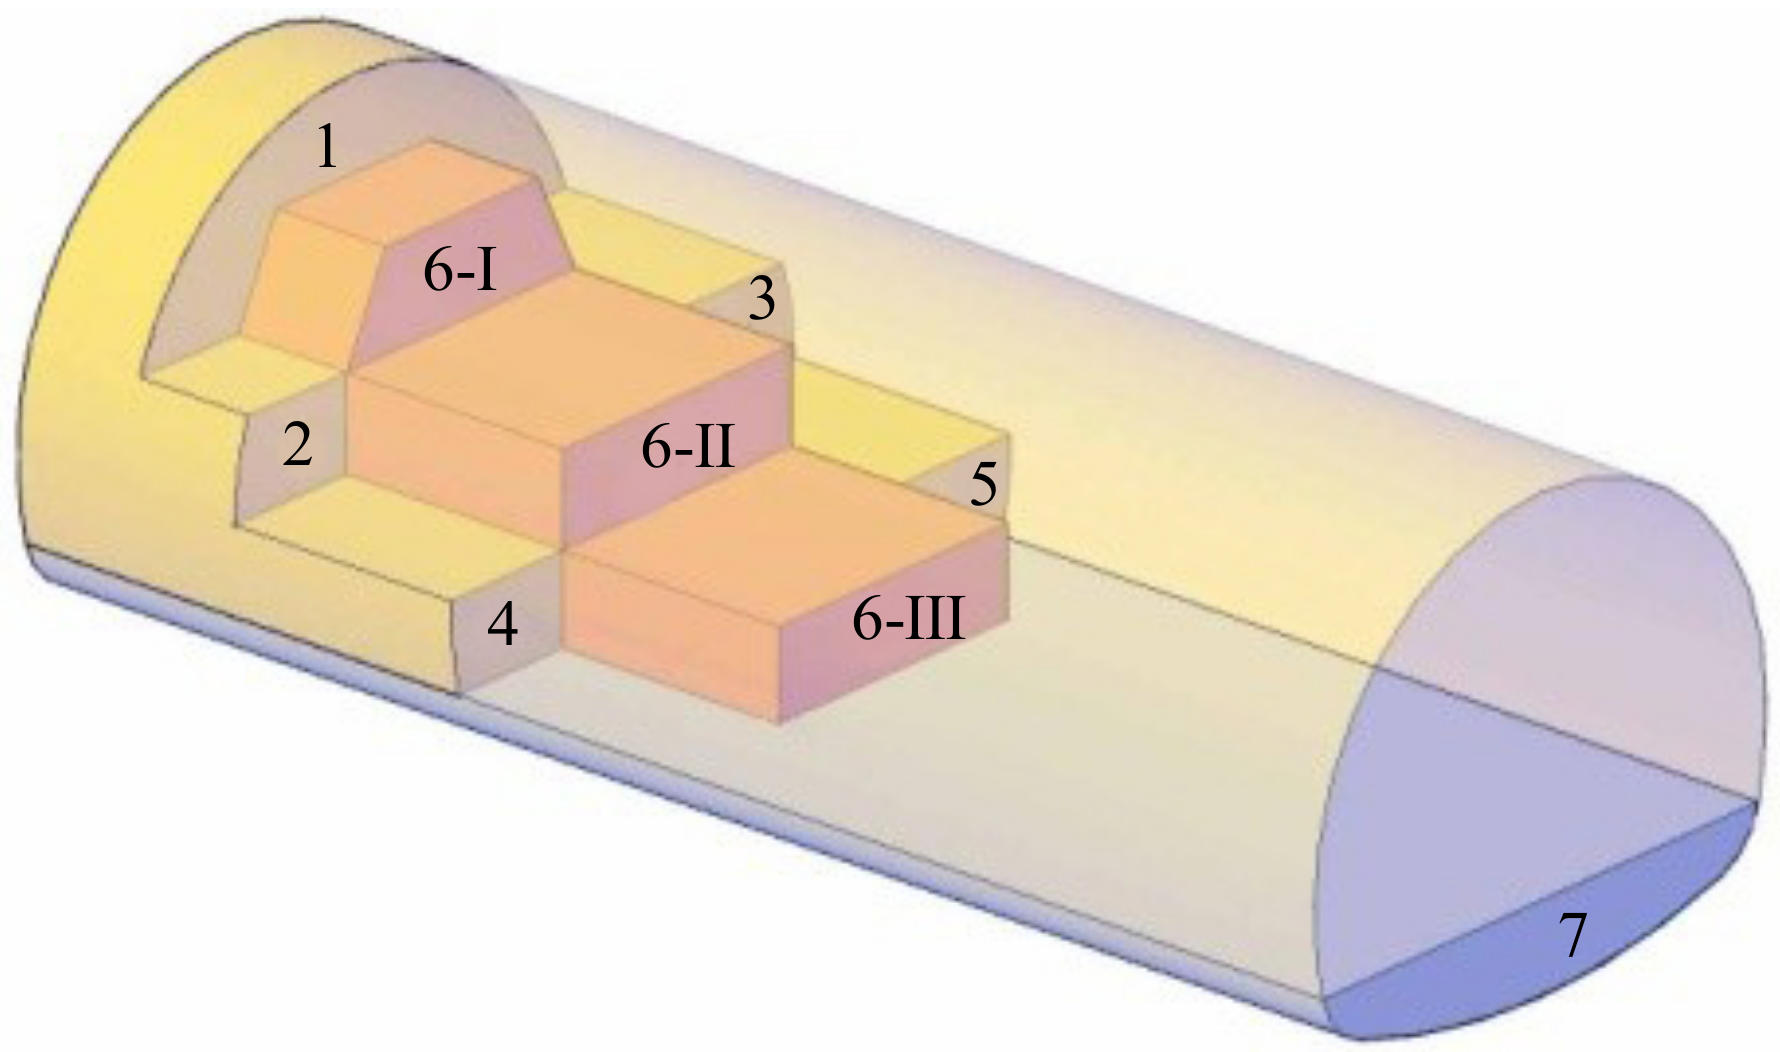
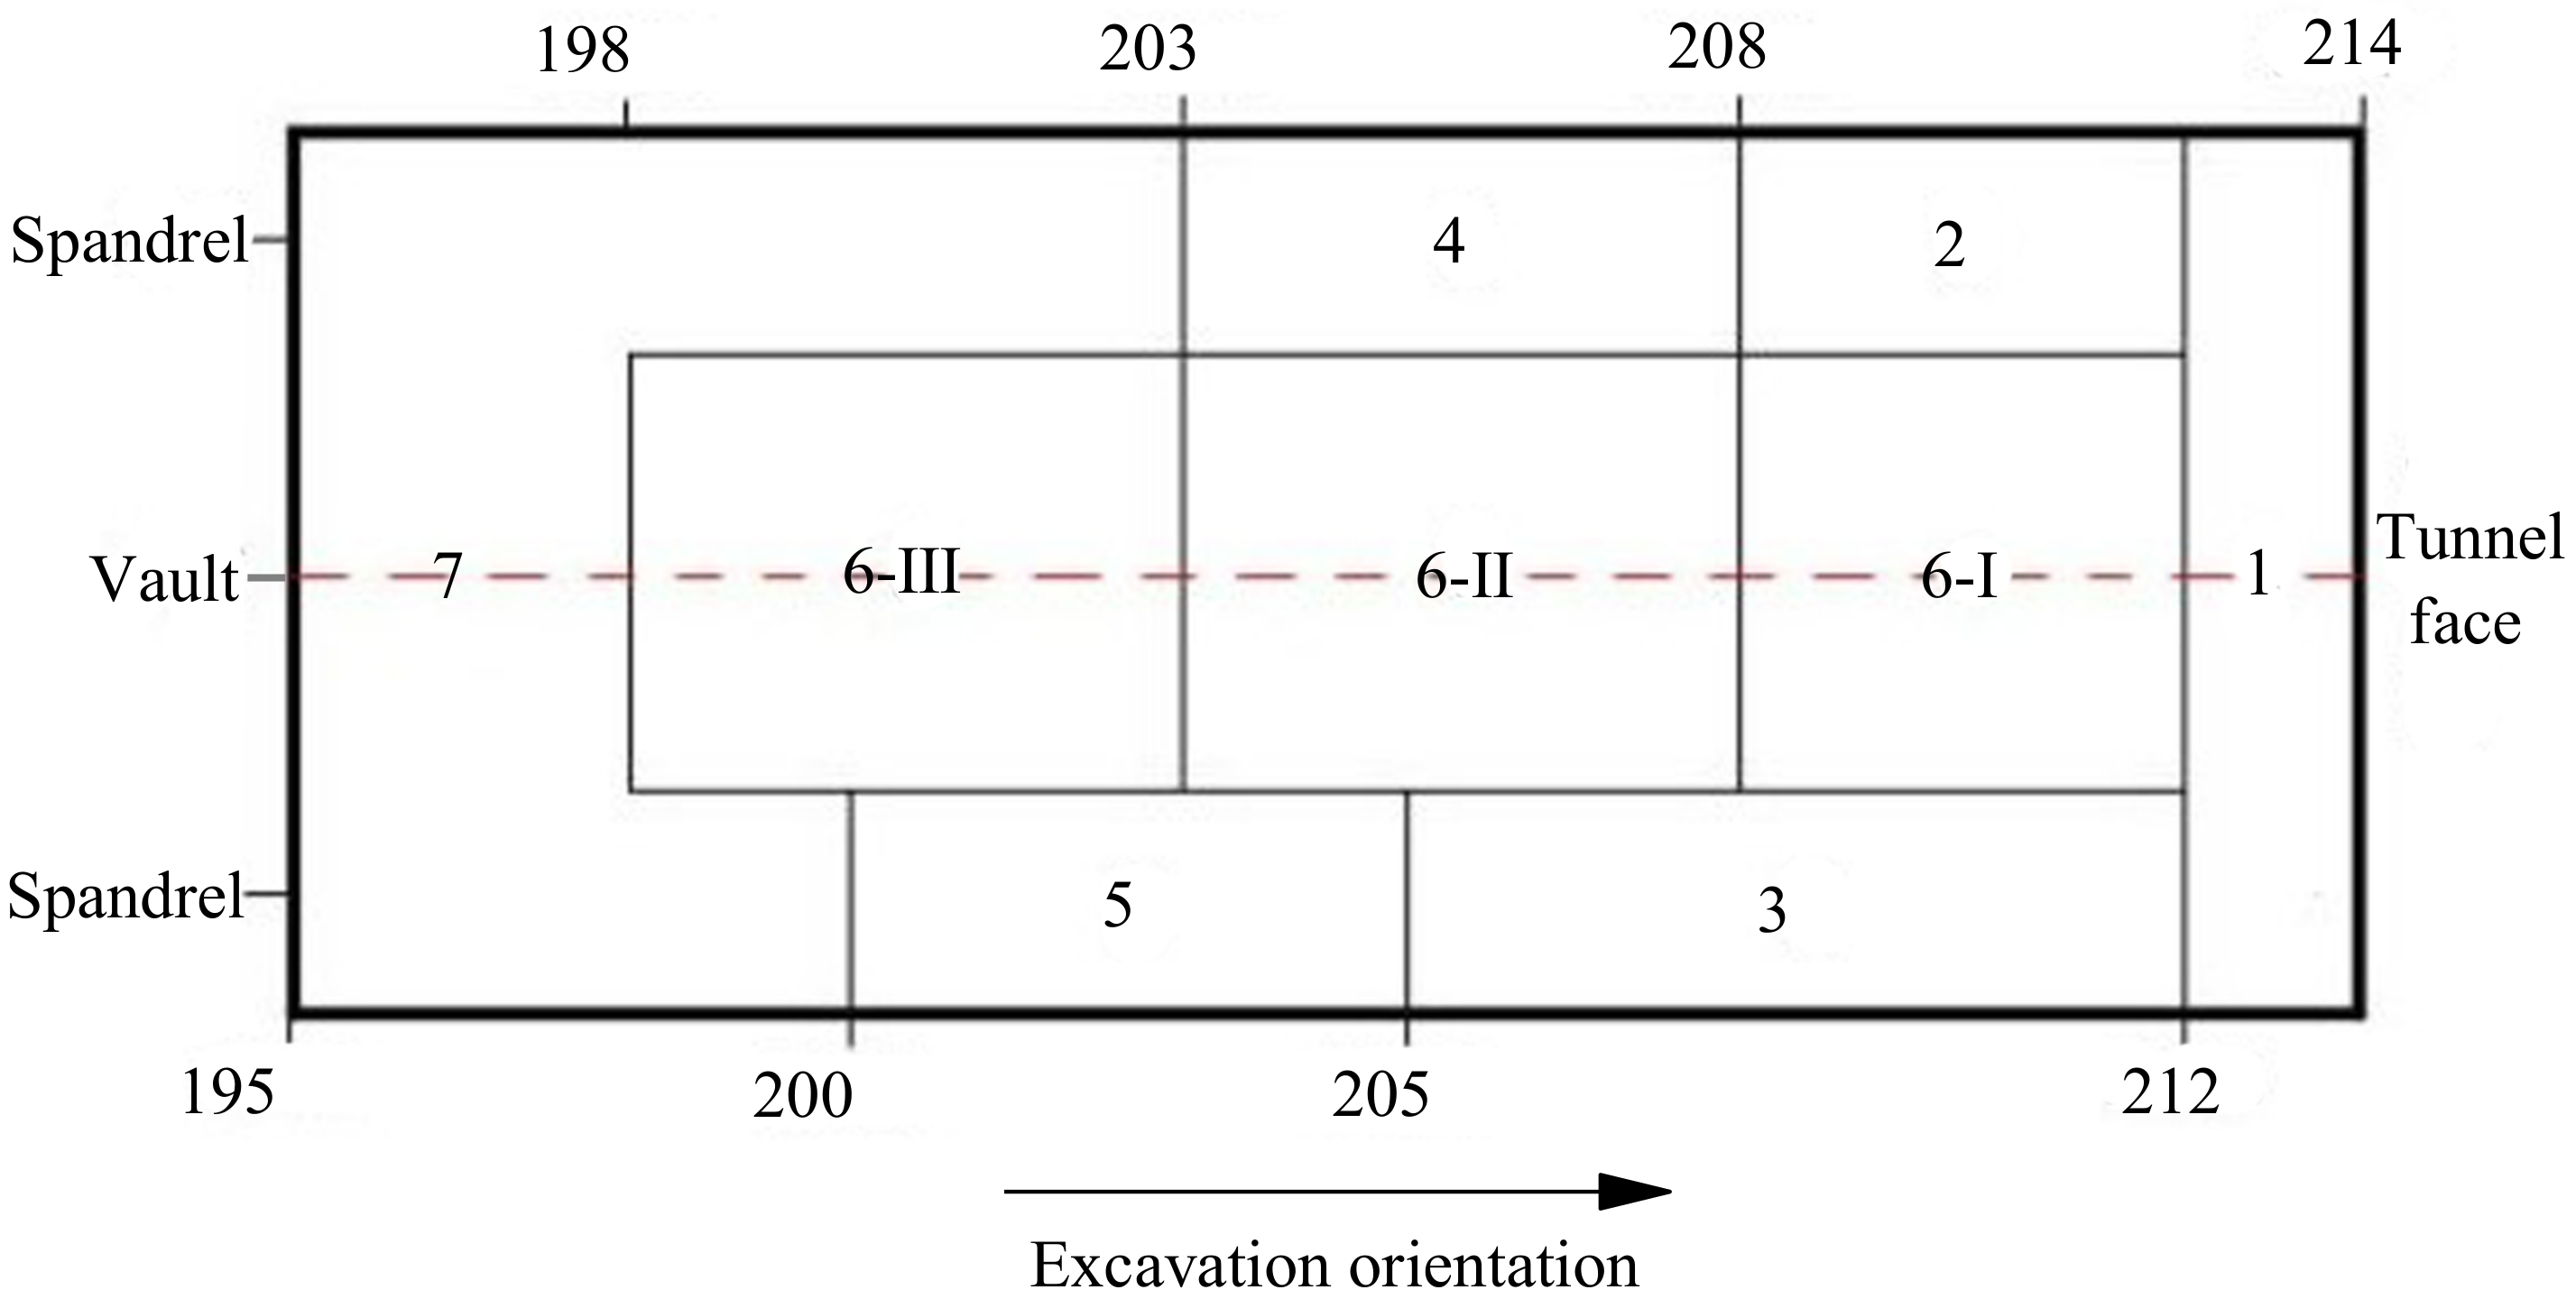
Different from the current application form of 3D laser scanning technology, it is no longer limited to the scanning frequency of once a day and adopts the form of short-term high frequency and long-term low frequency to focus on monitoring and analyzing the refined characteristics of the overall deformation of the tunnel after each construction process. The results show that in the construction process of three-bench and seven-step excavation methods, with the different excavation processes, differential deformation occurs on the left and right sides of the tunnel, and then certain distortion occurs, which may cause potential safety hazards. In the actual project, it can be considered to adjust the construction steps on the left and right sides or strengthen the supporting means, such as strengthening the locking anchor bolt on the side with a larger deformation, to ensure the coordination of the overall deformation of the tunnel. In addition, from the perspective of the deformation distribution in the mileage near the tunnel face, the general deformation distribution of the tunnel strongly correlates with the excavation process, showing a stepped deformation law;
(3)
From the long-term monitoring results of the loess tunnel section, the deformation rate of the initial support is mainly related to the excavation sequence and time. With the construction of the following excavation process, the deformation rate of the tunnel will always show the characteristics of large in the early stage and small in the later stage. During the whole monitoring period, the overall trend of the tunnel deformation rate gradually decreased and finally stabilized;
(4)
The monitoring data analysis results further verified that the variation of the loess tunnel deformation with time conforms to the distribution law of the exponential function. This characteristic can be used in practical engineering to predict the final deformation of surrounding rock at each position and provide a certain reference for the design of subsequent deformation reserves outside the specification.

Author Contributions

Conceptualization, Y.W.; methodology, Y.W.; formal analysis, Z.Z. (Zhuangzhuang Zhou); investigation, K.H.; resources, K.H.; data curation, Z.Z. (Zhuangzhuang Zhou); writing—original draft preparation, Z.Z. (Zhuangzhuang Zhou); writing—review and editing, S.S.; visualization, S.W.; project administration, Z.Z. (Zhizhong Zhao), and S.W.; funding acquisition, Z.Z. (Zhizhong Zhao). All authors have read and agreed to the published version of the manuscript.

Funding

This research was funded by the China Railway Corporation Science and Technology Research and Development Program, grant number 2018K019.

Institutional Review Board Statement

Not applicable.

Informed Consent Statement

Not applicable.

Data Availability Statement

All data are available from the author.

Conflicts of Interest

The authors declare no conflict of interest.

References

  1. Zhao, Y.; He, H.W.; Li, P.F. Key techniques for the construction of high-speed railway large-section loess tunnels. Engineering 2018, 4, 254–259. [Google Scholar] [CrossRef]
  2. Xie, Y.L. Problems and discussions of loess tunnel. In Proceedings of the 12th National Conference of Soil Mechanics and Geotechnical Engineering of China Civil Engineering Society, Shanghai, China, 17 July 2015. (In Chinese). [Google Scholar]
  3. Lai, J.X.; Fan, H.B.; Lai, H.P.; Xie, Y.L.; Hu, Z.; Qiu, J.L.; Cao, N.Q. In-situ monitoring and analysis of tunnel deformation law in weak loess. Rock Soil Mech. 2015, 36, 2003–2012. (In Chinese) [Google Scholar]
  4. Zhao, D.P.; Yu, Y.; Wang, M.N.; Yang, J.M. Study on the deformation regularity and preset deformations for large section tunnels in loess. Mod. Tunn. Technol. 2009, 46, 64–69. (In Chinese) [Google Scholar]
  5. Bizjak, K.F.; Petkovšek, B. Displacement analysis of tunnel support in soft rock around a shallow highway tunnel at Golovec. Eng. Geol. 2004, 75, 89–106. [Google Scholar] [CrossRef]
  6. Qiao, C.S.; Guan, Z.X.; Teng, W.Y. A study on deformation of tunnel excavated in saturated loess. Rock Soil Mech. 2003, 24, 225–230. (In Chinese) [Google Scholar]
  7. Galli, G.; Grimaldi, A.; Leonardi, A. Three-dimensional modelling of tunnel excavation and lining. Comput. Geotech. 2004, 31, 171–183. [Google Scholar] [CrossRef]
  8. Li, P.F.; Zhao, Y.; Zhou, X.J. Displacement characteristics of high-speed railway tunnel construction in loess ground by using multi-step excavation method. Tunn. Undergr. Space Technol. 2016, 51, 41–55. [Google Scholar] [CrossRef]
  9. Sharifzadeh, M.; Kolivand, F.; Ghorbani, M.; Yasrobi, S. Design of sequential excavation method for large span urban tunnels in soft ground—Niayesh tunnel. Tunn. Undergr. Space Technol. 2013, 35, 178–188. [Google Scholar] [CrossRef]
  10. Kontogianni, V.; Stiros, S. Induced deformation during tunnel excavation: Evidence from geodetic monitoring. Eng. Geol. 2005, 79, 115–126. [Google Scholar] [CrossRef]
  11. Kontogianni, V.; Tzortzis, A.; Stiros, S. Deformation and failure of the Tymfristos tunnel, Greece. J. Geotech. Geoenviron. Eng. 2004, 130, 1004–1013. [Google Scholar] [CrossRef]
  12. Lu, J.F.; Wang, M.N.; Guo, J.; Yu, Y.; Yang, J.M.; Tan, Z.S. Study on deformation model of deep-buried high-speed railway tunnel in loess stratum and working mechanisms of bolts. Tunn. Constr. 2009, 29, 405–410. (In Chinese) [Google Scholar]
  13. Gu, S.C.; Zhou, Y.P. Analysis and monitoring measurement of super-large section of the loess highway tunnel. Constr. Technol. 2014, 18, 82–86. [Google Scholar]
  14. Cao, C.Y.; Shi, C.H.; Lei, M.F.; Peng, L.M.; Bai, R.X. Deformation Characteristics and Countermeasures of shallow and Large-span Tunnel Under-crossing the Existing Highway in Soft Soil: A Case Study. Civil. Eng. 2018, 22, 3170–3181. [Google Scholar] [CrossRef]
  15. Xie, X.Y.; Lu, X.Z.; Tian, H.Y.; Ji, Q.Q.; Li, P. Development of a modeling method for monitoring tunnel deformation based on terrestrial 3D laser scanning. Chin. J. Rock. Mech. Eng. 2013, 32, 2214–2224. (In Chinese) [Google Scholar]
  16. Salvini, R.; Francioni, M.; Riccucci, S.; Bonciani, F.; Callegari, I. Photogrammetry and laser scanning for analyzing slope stability and rock fall runout along the Domodossola–Iselle railway, the Italian Alps. Geomorphology 2013, 185, 110–122. [Google Scholar] [CrossRef]
  17. Tang, P.; Akinci, B. Formalization of workflows for extracting bridge surveying goals from laser-scanned data. Autom. Constr. 2012, 22, 306–319. [Google Scholar] [CrossRef]
  18. Yoon, J.S.; Sagong, M.; Lee, J.S.; Lee, K. Feature extraction of a concrete tunnel liner from 3D laser scanning data. NDT E Int. 2009, 42, 97–105. [Google Scholar] [CrossRef]
  19. Farahani, B.V.; Barros, F.; Sousa, P.J.; Cacciari, P.P.; Tavares, P.J.; Futai, M.M.; Moreira, P. A coupled 3D laser scanning and digital image correlation system for geometry acquisition and deformation monitoring of a railway tunnel. Tunn. Undergr. Space Technol. 2019, 91, 102995. [Google Scholar] [CrossRef]
  20. Strach, M.; Dronszczyk, P. Comprehensive 3D Measurements of Tram Tracks in the Tunnel Using the Combination of Laser Scanning Technology and Traditional TPS/GPS Surveying. Transp. Res. Proc. 2016, 14, 1940–1949. [Google Scholar] [CrossRef] [Green Version]
  21. Xie, X.Y.; Lu, X.Z. Development of a 3D modeling algorithm for tunnel deformation monitoring based on terrestrial laser scanning. Undergr. Space 2017, 2, 16–29. [Google Scholar] [CrossRef]
  22. Walton, G.; Delaloye, D.; Diederichs, M.S. Development of an elliptical fitting algorithm to improve change detection capabilities with applications for deformation monitoring in circular tunnels and shafts. Tunn. Undergr. Space Technol. 2014, 43, 336–349. [Google Scholar] [CrossRef]
  23. Jiang, Q.; Shi, Y.E.; Yan, F.; Zheng, H.; Kou, Y.Y.; He, B.G. Reconstitution method for tunnel spatiotemporal deformation based on 3D laser scanning technology and corresponding instability warning. Eng. Fail. Anal. 2021, 125, 105391. [Google Scholar] [CrossRef]
  24. Walton, G.; Diederichs, M.S.; Weinhardt, K.; Delaloye, D.; Lato, M.J.; Punkkinen, A. Change detection in drill and blast tunnels from point cloud data. Int. J. Rock Mech. Min. Sci. 2018, 105, 172–181. [Google Scholar] [CrossRef]
Figure 1. Geological section of Yulinzi Tunnel.
Applsci 12 05136 g001
Figure 2. Groundwater distribution area in longitudinal section of tunnel.
Applsci 12 05136 g002
Figure 3. Problems caused by large deformation of tunnel.
Applsci 12 05136 g003
Figure 4. Deformation curves and control measures for the part of the mileage of the left line of the tunnel.
Applsci 12 05136 g004
Figure 5. Deformation curves and control measures for the part of the mileage of the right line of the tunnel.
Applsci 12 05136 g005
Figure 6. Construction steps in the tunnel.
Applsci 12 05136 g006
Figure 7. Schematic diagram of monitoring point coordinate calculation.
Applsci 12 05136 g007
Figure 8. The excavation status of the monitored mileage.
Applsci 12 05136 g008
Figure 9. Three-dimensional laser scanning and data processing flow.
Applsci 12 05136 g009
Figure 10. Isoline and 3D deformation map of tunnel deformation (Monitoring time: (a). 2 h; (b). 4 h; (c). 20 h; (d). 24 h).
Applsci 12 05136 g010aApplsci 12 05136 g010b
Figure 11. Three-dimensional deformation map of the upper step of the tunnel.
Applsci 12 05136 g011
Figure 12. Evolution diagram of the initial support deformation of the upper step of the tunnel face.
Applsci 12 05136 g012
Figure 13. Evolution diagram of deformation amount at each representative point.
Applsci 12 05136 g013
Figure 14. Longitudinal distribution of total deformation of the vault at right line entrance in 24 h.
Applsci 12 05136 g014
Figure 15. Longitudinal distribution of total deformation of the left spandrel at right line entrance in 24 h.
Applsci 12 05136 g015
Figure 16. Longitudinal distribution of total deformation of the right spandrel at right line entrance in 24 h.
Applsci 12 05136 g016
Figure 17. Distribution of initial support deformation curve of the tunnel with different scanning times.
Applsci 12 05136 g017
Figure 18. Deformation analysis diagram of the vault of the YK280+212 section of the tunnel.
Applsci 12 05136 g018
Figure 19. Deformation analysis diagram of the vault of the YK280+216 section of the tunnel.
Applsci 12 05136 g019
Figure 20. Deformation analysis diagram of the vault of the YK280+220 section of the tunnel.
Applsci 12 05136 g020
Table 1. Statistical table of physical and mechanical indicators of loess in the Quaternary Upper Pleistocene (Q2eol).
Statistics ProjectNatural Water ContentNatural DensityVoid RatioLiquid LimitPlastic LimitPlasticity IndexLiquid IndexCohesionInternal Friction AngleCompression Modulus
W (%)(g/m3)e0W1 (%)Wp (%)IpIlc (kPa)(°)(Mpa)
Minimum value6.301.050.8327.5017.2010.30−1.0712.9026.902.31
Maximum value11.201.651.7830.7018.6012.10−0.6020.2029.2016.59
Average value7.951.451.0428.7617.7210.90−0.8915.5528.059.65
Standard deviation1.350.130.221.000.430.590.132.651.154.26
Coefficient of variation0.170.090.210.030.020.05−0.140.170.040.44
Table 2. Comparison of monitoring technologies.
ProjectThe Monitoring Scheme of This TrialCommon Monitoring Schemes
Monitoring instrumentsTrimble SX10 scannerLevel/Total Station
The layout of measuring pointsFull cross-section monitoring; More intensive monitoring pointsFixed measuring points;
Fewer measuring points
Monitoring frequencyShort-term high frequency;
Long-term low frequency
Low, depending on the distance between the measuring section and the excavation surface and the displacement rate
Speed of data collectionFastSlow
Monitoring process safety risksLowHigh
Table 3. Main technical parameters of Trimble SX10 Scanner.
Scanning PerformanceProjectParameter
General Scanning specificationsScanning principleBand scanning using a rotating prism in the telescope
Measurement rate26.6 kHz
Point spacing6.25 mm, 12.5 mm, 25 mm, or 50 mm @ 50 m
Field-of-view360° × 300°
Coarse scan: full dome—360° × 300° (horizontal angle × vertical angle); Density—1 mrad, 50 mm spacing @ 50 mScan time: 12 min
Standard scan: area scan—90° × 45° (horizontal angle × vertical angle); Density—0.5 mrad, 25 mm spacing @ 50 mScan time: 6 min
Range MeasurementRange principleUltra-high-speed time-of-flight powered by Trimble Lightning technology
Range0.9 m–600 m
Range noise@ 50 m on 18–90% reflectivity, 1.5 mm
Scanning Angular Accuracy5″ (1.5 mgon)
3D position Accuracy @ 100 m82.5 mm
Table 4. Deformation regression analysis results.
Regression Analysis Project30 d Deformation Measured Value (mm)Predicted Value of Final Deformation (mm)Regression FunctionCorrelation Coefficient
The subsidence of the vault of YK280+212535.9567.72 μ = 567.72 616.45 e 0.09391 t 0.9506
The subsidence of the vault of YK280+216513.0592.36 μ = 592.36 622.83 e 0.07323 t 0.9690
The subsidence of the vault of YK280+220480.9518.24 μ = 518.24 534.78 e 0.08628 t 0.9786
Publisher’s Note: MDPI stays neutral with regard to jurisdictional claims in published maps and institutional affiliations.

