
Design and Verification of Large-Scaled Flapping Wings for High Altitude Environment


1
School of Aeronautics, Northwestern Polytechnical University, Xi’an 710072, China
2
Yangtze River Delta Research Institute, Northwestern Polytechnical University, Taicang 215400, China
*
Author to whom correspondence should be addressed.
Appl. Sci. 2022, 12(10), 5140; https://0-doi-org.brum.beds.ac.uk/10.3390/app12105140
Submission received: 5 April 2022
/
Revised: 15 May 2022
/
Accepted: 16 May 2022
/
Published: 19 May 2022
(This article belongs to the Section Aerospace Science and Engineering)
Abstract
:Large-scaled flapping wings for high altitude environments have great potential for border patrol and biodiversity exploration due to their high flight efficiency and concealment. In this paper, wind tunnel experimental techniques, neural network models, and flight tests are implemented to optimize and validate the performance of flapping wings. Numerical simulation methods were used to give recommendations for the flight state of the vehicle at high altitudes. From sea level to 4000 m altitude, the Reynolds number was subsequently reduced by 27.98%, and the time-averaged lift, drag, and pitching moment decreased by 33.31%, 33.08%, and 33.33%, respectively. A combination of planform with an increase in the internal area of the wing, six wing ribs, and linen film material was selected for its moderate stiffness to generate at least 1300 g of lift and considerable positive thrust, making it easier to reach a trim state. For high altitude environments, the vehicle needs to increase its flight speed and frequency to compensate for the loss of lift and drag due to reduced air density, but this is at the cost of power consumption, which results in reduced endurance, as verified by flight tests. Finally, this study aims to provide guidance on the design of large-scaled flapping wings for high-altitude environments.
1. Introduction
China has a vast and complex territory, where plateau areas account for about 26% of the total territory, mainly covering the frontier areas of key defense, where the environment is harsh and the airflow is unstable. At present, fixed-wing and rotary-wing UAVs have problems such as low energy utilization, poor mobility, and weak stealth capability, while bionic flapping-wing vehicles can actively adapt to and make use of different airflow environments. It has great development potential in terms of flight efficiency, mobility, and bionic concealment [1,2]. It can be used for border patrol, rescue and disaster relief, biodiversity exploration, and so on. As one of the core components of the plateau bionic flapping-wing vehicle, the performance of flapping wings greatly affects the flight properties and determines the flight performance of the vehicles.
For flapping-wing vehicles, different structures and materials of the wings can result in significant variation in the aerodynamic performance of the flapping wings. However, as we are limited by the backwardness of materials, actuators, propulsion systems, etc., directly replicating the kinematics and morphology of biological wings is far from sufficient to manufacture a flapping-wing vehicle with high lift and low power consumption. Therefore, the flapping-wing design, inspired by flying creatures, can only be used as a preliminary conceptual design, and the geometric parameters of the wing need to be further optimized, including wing shape, aspect ratio, root tip ratio, and other parameters.
In the past, most of the research on flapping-wing aircraft have focused on the small and micro scale fields. Although such flapping-wing vehicles have high lift efficiency and can perform missions in confined spaces, they have the limitations of poor load capacity and short flight distance. Therefore, large-scaled flapping-wing vehicles can meet the mission requirements for efficient low-speed cruise flights and far-range long-endurance flights. Among the flapping-wing vehicles with good flight performance that imitate birds of medium and large scale, “Smartbird” of the Festo company in Germany [3], “RoboRaven” of the University of Maryland [4,5], and “HIT-Hawk” of Harbin Institute of Technology [6] are outstanding. “SmartBird” has a wingspan of 2 m and a weight of 450 g; “RoboRaven” has a wingspan of 1.168 m and a weight of 290 g; and “HIT-Hawk” has a wingspan of 1.1 m and a weight of 455 g. “RoboRaven” adopts a single-stage flexible film flapping wing. The wing material is composed of polyester film and carbon fiber rods. The flapping wing with optimal aerodynamic performance is selected by adjusting the planform and iterating wind tunnel experiments. “HIT-Hawk” still adopts a single-stage flapping wing. The wing is composed of kite cloth and mast. Similarly, through experimental iteration, the wing film material, layout form, and planform of the wing are optimized.
The flapping wing is the main feature that distinguishes flapping-wing vehicles from other types of vehicles. The flapping wing provides all of the thrust and most of the lift of the vehicle. The aerodynamic characteristics of flapping wings determine the performance of the vehicle to a great extent. Although the existing flapping-wing designs and structures vary greatly, the single-stage flexible film flapping wing is adopted by a large number of flapping-wing vehicle prototypes because of its simple structure, light weight, and low requirements for a driving system. Meanwhile, this structural form of flapping wing has been proved to be the most practical configuration through the successful flight of a large number of flapping-wing vehicles. Due to the limitation of the accuracy of theoretical knowledge and the limitations of numerical simulation, the design of flapping-wing vehicles has always been mainly carried out through experimental iteration.
Based on the observation of flying organisms, high altitudes present various physiological challenges to organisms, including respiration, circulation, temperature regulation, and so on. Altshuler and Dudley et al. [7,8,9] pointed out that low-density conditions increase oxygen delivery to flight muscles when organisms fly at high altitudes to compensate for their reduced atmospheric partial pressures. They also stated that the low-density and low-oxygen content of the air will increase metabolic demand as well as create a reduced ability to generate aerodynamic force, limiting the ability to move at high altitudes. During their annual migration, birds select their flight altitudes according to certain criteria, such as minimum energy consumption and favorable wind gusts [10]. Different altitudes will bring about drastic changes in the aerodynamics and biological behavior of birds. The aerodynamic performance of aircraft depends heavily on the surrounding environment, with the lift and drag coefficient directly proportional to air density [11]. Air density decreases with an increase in altitude, thus reducing the air drag that impedes the movement of birds and reduces the lift force required for flight. Therefore, some birds can adjust their biological behavior according to the physical properties of the air, varying with altitude [12,13]. For example, when birds are in low-density environments at high altitudes, their flapping frequency, amplitude, and speed will increase to provide sufficient lift [14,15,16]. The focus of these experiments was to study the physiological adaptation of birds to altitudes while discarding the aerodynamic changes caused by changes in the physical properties of the air. Even today, measuring the aerodynamic coefficients of birds floating in the air is still a challenge, and the evolution of drag and lift is estimated through theoretical mathematical models and flapping-wing kinematics analysis. Numerical simulation and more accurate computational fluid dynamics (CFD) have been proven to be effective methods for studying the aerodynamics of fixed or flapping wings [17,18]. Most of the CFD studies of flapping wings have focused on the geometrical parameters of the wing [19], others on the influence of the ceiling [20] or the ground [21], but few seem to have addressed the influence of altitude on the aerodynamics of a flapping wing.
Sridhar M. et al. [22] established the design space of the high-altitude fluid-structure coupling effect of flapping wings, with atmospheric density and the stroke plane angle as design variables. The results show that the lift increases with the increment of the stroke plane angle and air density, while the net thrust remains close to zero. The required averaged power decreases with increasing altitude and eventually becomes negative at 3000 m above sea level. They also investigated the influence of vein structures on the fluid-structure interaction of flexible flapping wings at high altitudes [23]. The paper proposed that the lift and thrust improved with the increment of wing stiffness and stroke plane angle. For a more flexible wing, the force depends on the air density and decreases with an increase in altitude; additionally, the power consumption increases with increasing stiffness. Beaumont F. et al. [24] studied the aerodynamic effects of flapping amplitude, frequency, and airspeed on rigid Canada geese wings at different altitudes. The results showed that an increase in speed caused higher energy consumption. The 20% increase in amplitude increased the lift-to-drag ratio by about 22%; a 25% increase in frequency increased the lift-to-drag ratio by 158%.
In previous studies, there has been a lack of research on the impact of altitude on flying animals, and the relationship between the flapping-wing design and altitude has not been considered. Wind tunnel experimental techniques, CFD, and flight tests were used to investigate and verify the aerodynamic performance of flapping wings. The wind tunnel experiments were used to optimize the appropriate planform, structural layout, and film material. Backpropagation (BP) neural network models were built to perform the prediction of the trim state. CFD was used to provide recommendations for adjusting flight conditions in high-altitude environments. Flight tests at different altitudes were conducted to verify the performance of the flapping wing. This study broadens the existing knowledge of large-scale flapping-wing designs at high altitudes.
2. Materials and Methods
2.1. Experimental Set-Up
According to the same motion law, the inertial force of the flapping wing is intimately related to the planform and the distribution of the wing ribs. The deformation of the flapping wing is mainly caused by inertial force, and the variation of altitude has little effect on the inertial force except for the change of trim state. It can be approximately considered that the deformation at different altitudes is close, making it possible to optimize flapping wings suitable for high altitudes to low-altitude environments. Wind tunnel experimental methods were implemented to optimize the flapping wings at low altitudes.
The complete experimental set-up for the measurement of aerodynamic forces/moments is shown in Figure 1. A six-axis sensor (ME K6D40) of measurement range ±200 N and ±10 N-m was placed at the wing root to measure the forces and moments. For the force variation measurement, the wings were connected to a spatial crank and rocker mechanism, which was controlled by a DC brushless motor. The whole system was mounted on a large range load cell to obtain the entire force and torque variation. A global filter was used to denoise the experimental data. The cut-off frequency of the filter was set to 20 Hz, which is higher than the maximum flapping frequency of the mechanism, and the data were sampled at 1000 Hz. A series of performance tests was conducted to optimize the flight speed, flapping frequency, and angle of attack of the flapping model. The test parameters are summarized in Table 1.
2.1.1. Geometric Model
In this paper, the airfoil Eppler378, similar to that of migratory birds that are good at long-distance flight, is selected. The basic airfoil Eppler378 with a bionic shape was selected as the airfoil, shown in Figure 2, which has a relatively large leading-edge radius, large airfoil camber, and thin trailing edge. The maximum lift coefficient of the Eppler378 airfoil is 1.5 and the stall angle of attack is 12.5°, which has the obvious aerodynamic performance of high lift and low drag.
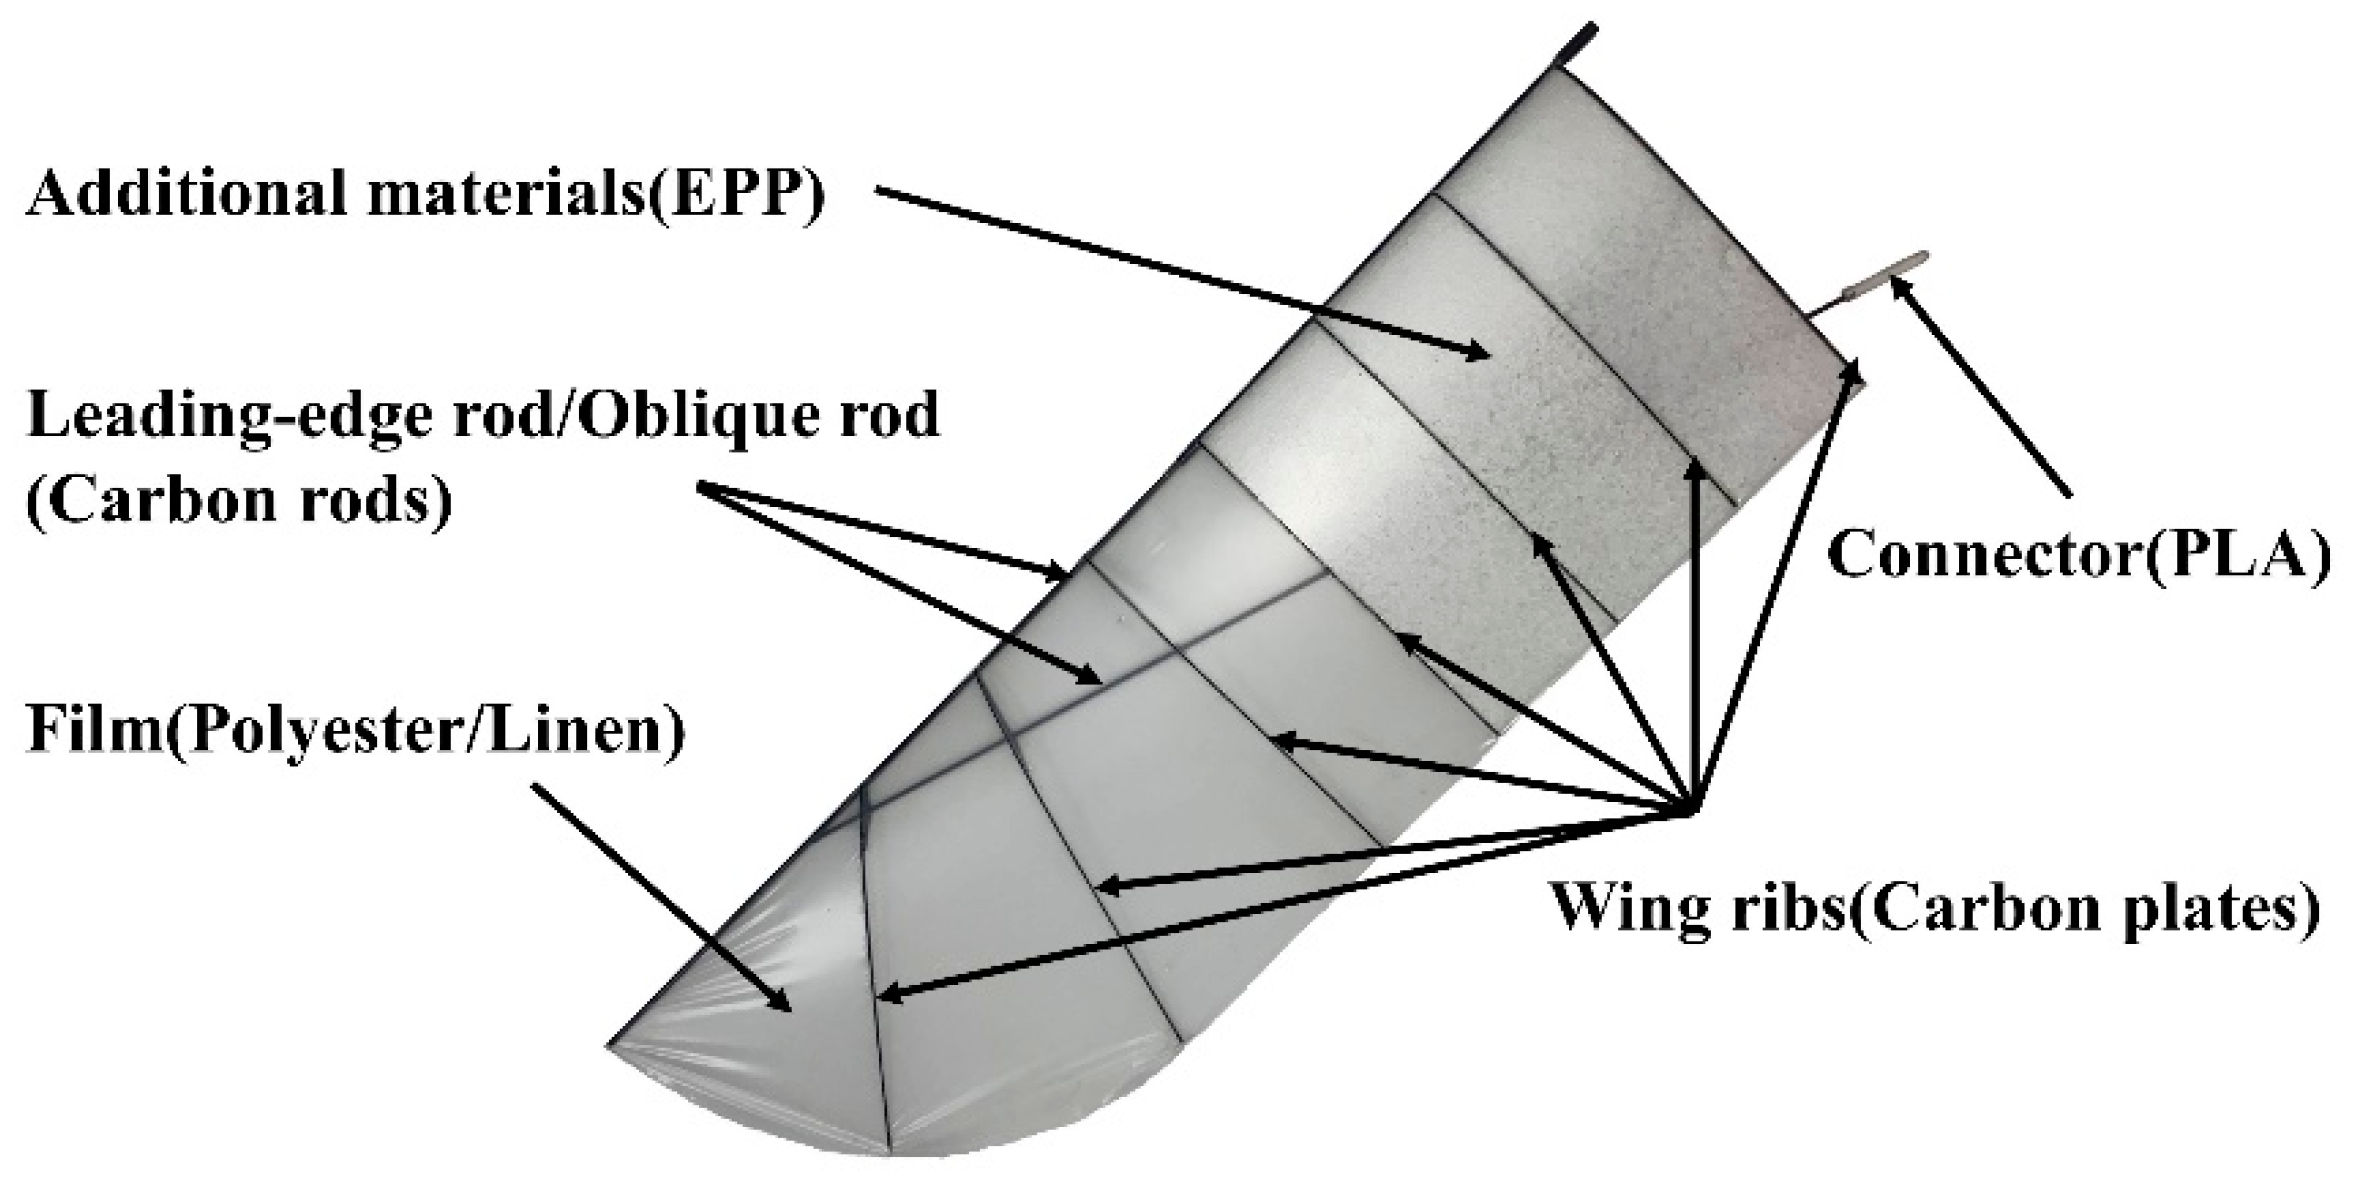
The geometric definitions of the wing are shown in Figure 3. The flapping wing mainly consists of film, carbon plates, and carbon rods. The choices of film material are polyester or linen material, then the wing ribs are cut from several pieces of carbon plates with a thickness of 1–2 mm. The leading edge and oblique rod are made of several circular carbon tubes with a diameter of 3, 6, and 8 mm, respectively. In addition, the connector between the oblique rod and the fuselage is made of a 3D-printed PLA. Moreover, in order to increase the lift generated by the wings, the additional materials of EPP are attached to the root of the wings. The inner area of the flapping wing is related to its lift generation, and the attachment of additional material increases the torsional stiffness of the wing.
As shown in Table 2, four planforms were selected for wing fabrication, i.e., the basic shape, increasing the inner area of the wing, increasing the outer area of the wing, and the elliptical shape, as shown in the figure below. The effects of film material and the number of wing ribs on the aerodynamic performance of the flapping wing were also investigated.
2.1.2. Definition of the Aerodynamic Performance
Random noise in the raw data from wind tunnel experiments of the flapping wing is eliminated or minimized as much as possible. Generally, the averaged values of aerodynamic force, torque, and power consumption of the flapping wing in a flapping cycle are meaningful for stable flight performance, while the data obtained from wind tunnel experiments are a series of instantaneous variation laws in several flapping cycles. Therefore, when analyzing the macro performance of flapping wings, it is necessary to calculate the periodic-averaged value. For example, the aerodynamic force/torque can be expressed as:
where , , and represent the periodic-averaged lift, drag, and pitching moment, respectively. It is worth noting that the thrust and drag of flapping wings are generated at the same time; it is difficult to separate them by experimental methods. here refers to the combined force of real thrust and drag. It should also be added that the reference point of the pitching moment is the leading edge of the wing. T is the flapping period, i.e., the reciprocal of the flapping frequency .
For discrete experimental data, the equation above cannot be directly applied, but since the sampling interval between each sampling point remains unchanged, the equation above can be modified as follows:
where s indicates the number of samples.
2.2. Numerical Simulation
2.2.1. Flow Solver
The transient simulations are investigated using the CFD software Fluent (Fluent 2020R2) by solving the three-dimensional Navier–Stokes equations. The motions of the flapping wings are simulated based on an overset mesh technique. The overset mesh, consisting of a background mesh and a component mesh, is considered to be suitable for large-scale motion simulations. During the dynamic movement, the background mesh remains stationary, while the entire component mesh moves as a rigid body. The motion of the flapping wings is adjusted by modifying a user-defined function in the form of a coordinate transformation. While the wing is moving, the mesh around the wing in the deformable zone is updated using a dynamic mesh technique. The Reynolds number is calculated from the forward flight speed. The Reynolds number (Re) is:
where and are the air density and dynamic viscosity corresponding to different altitudes, respectively, which are shown in Table 3. is the forward flight speed equal to 7 m/s; is the average chord equal to about 0.266 m. The Strouhal number () is a related dimensionless variable, defined as follows:
where A is the wingtip amplitude, defined as the vertical linear excursion of the wing tip above and below its position with wings level. f and v are the flapping frequency and the forward flight speed. gives an indication of the angle with which the wing tip moves up and down, relative to the flight path, and this can be seen as an advantage when describing wake geometries.
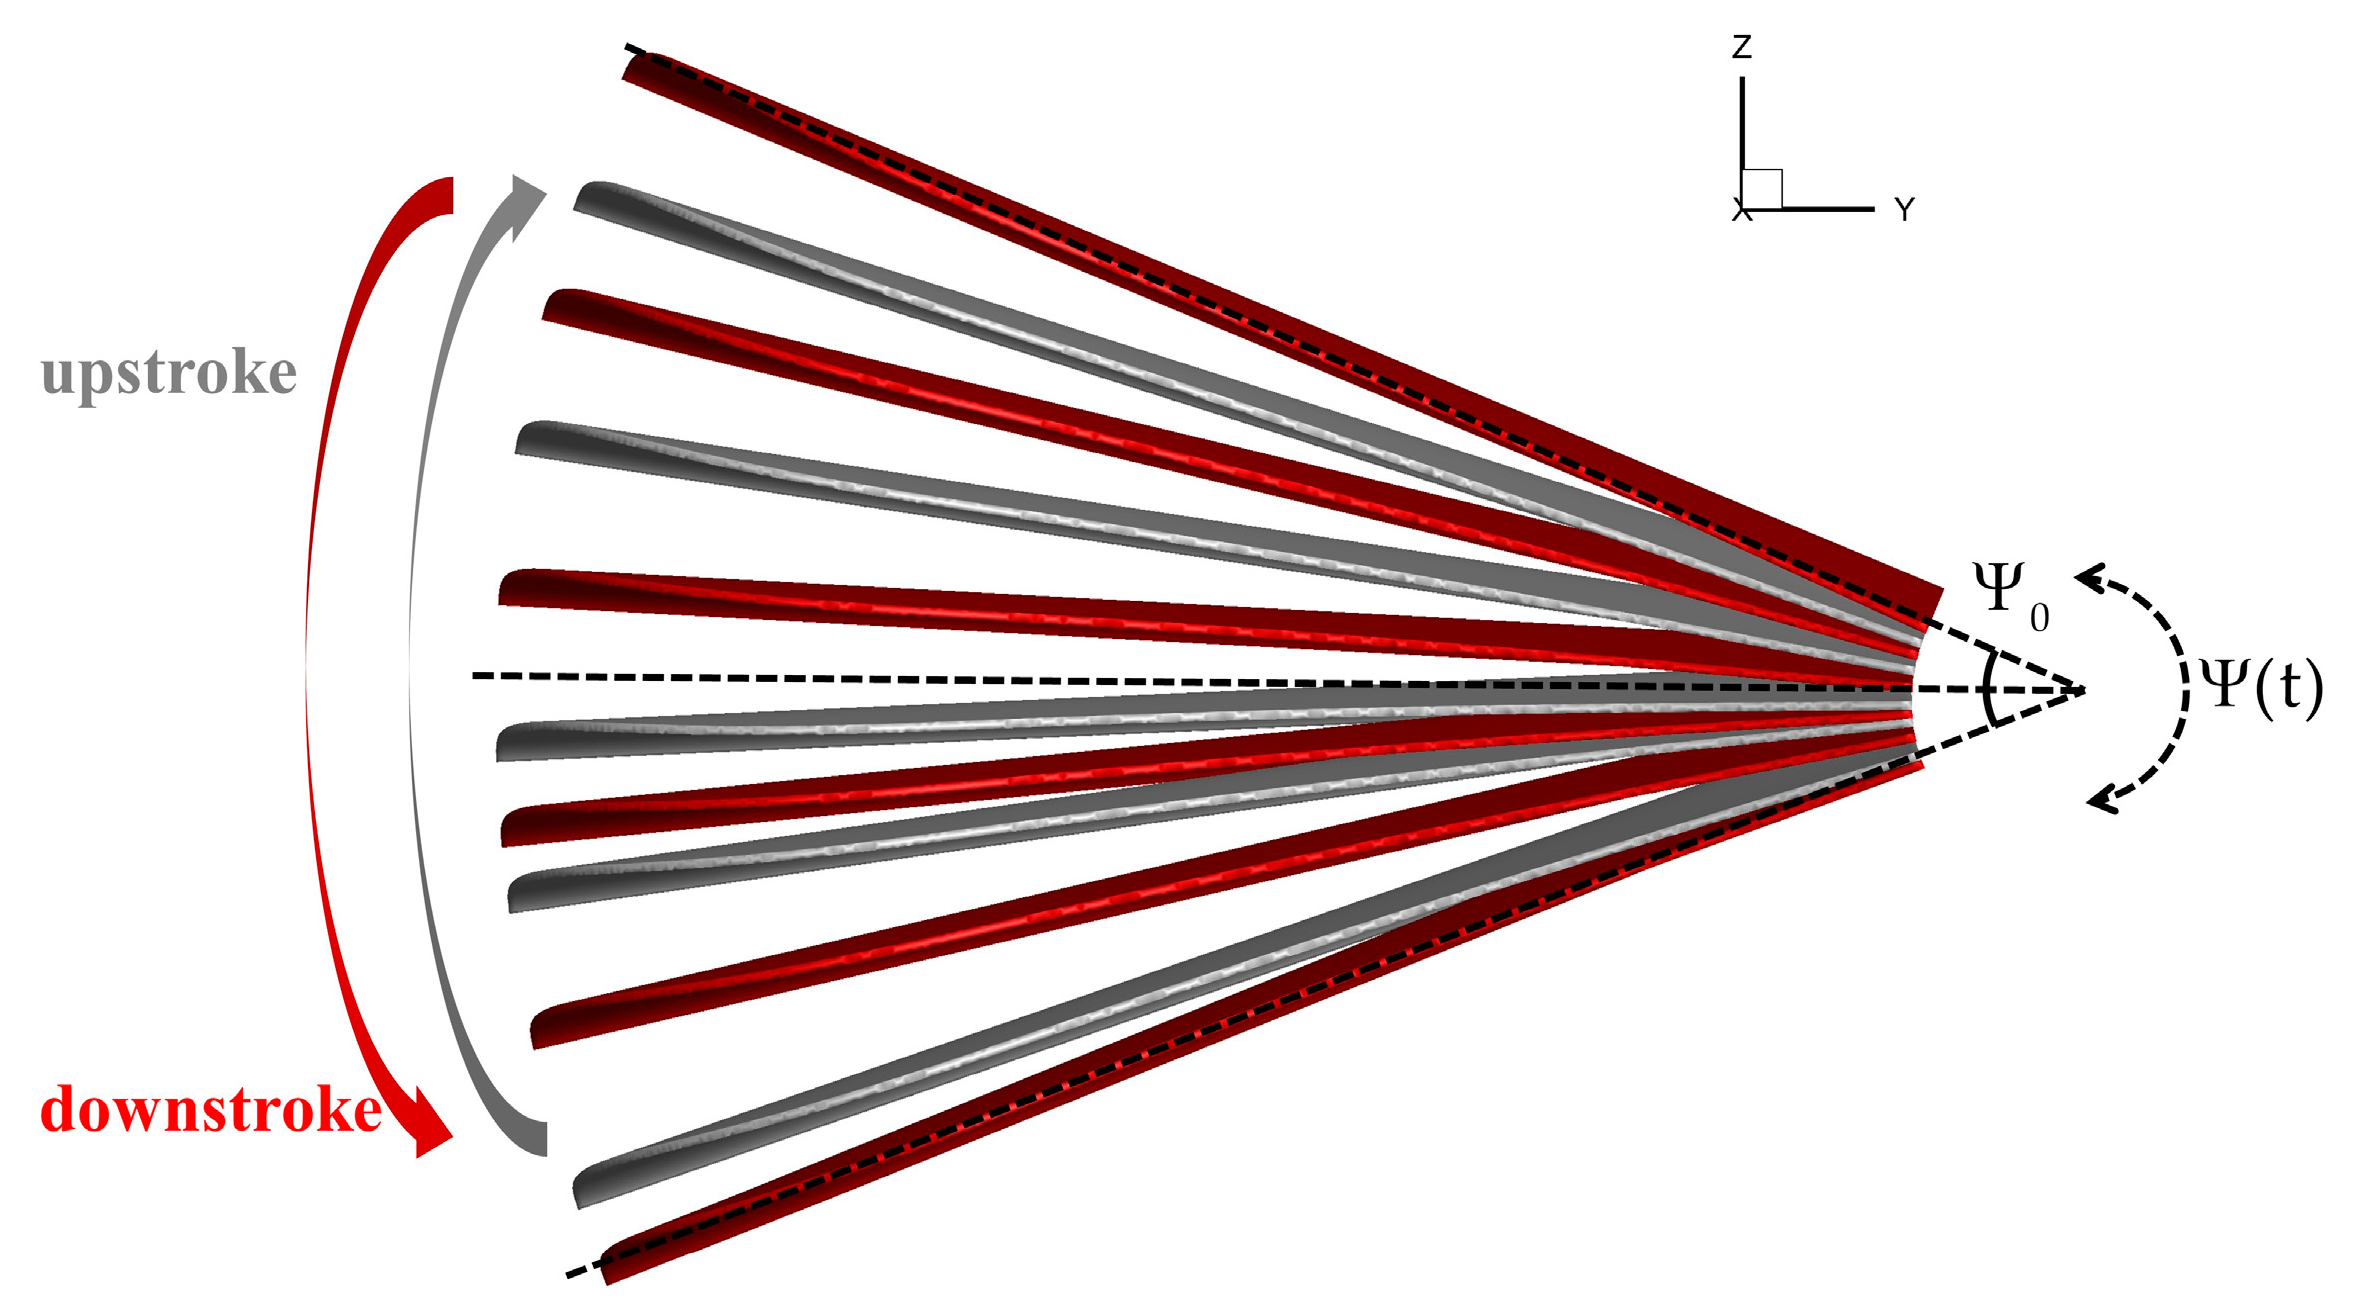
The model of the wing used for the calculation is the same airfoil and the planform of increasing the internal area of the wing as the real flapping wing. To simplify the model and improve numerical convergence, the wing was assumed to be a rigid body whose motion only consists of the rotation around the x-axis. The wing trajectory (i.e., flapping amplitude and frequency), which consists of a rotation, was implemented in the code using user-defined functions (UDFs).
Wing rotation is defined as follows:
where indicates that the amplitude is equal to 22.5°, f is the flapping frequency of 4 Hz, and the angle of attack of the wing is 15° (Figure 4).
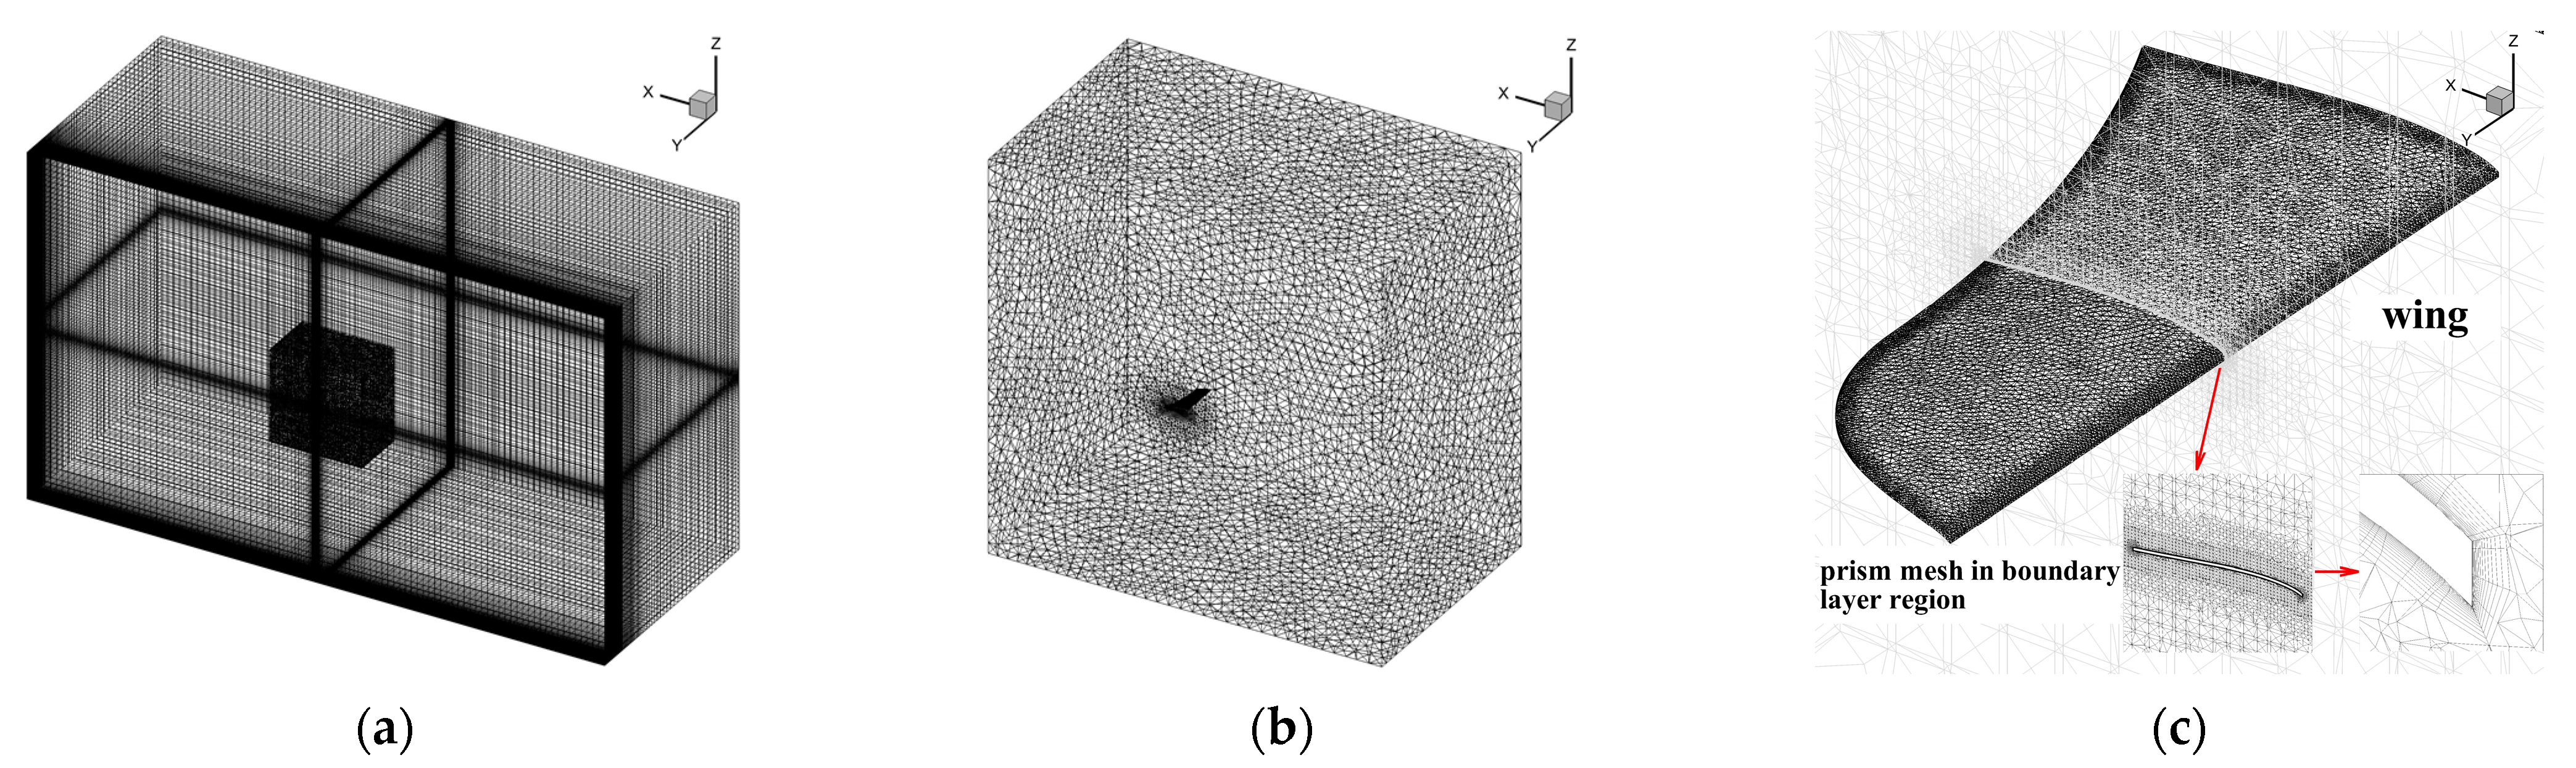
A model is adopted to simulate the high-Reynolds-number flow situation. The boundary condition of the outlet is a pressure outlet. The component zone uses an overset boundary. A no-slip wall condition is applied to the wing. Momentum, turbulent kinematic energy, and the specific dissipation rate are discretized with a second-order upwind scheme. Second-order accuracy is applied to calculate the pressure. A coupled algorithm is employed for the pressure–velocity coupling. The mesh strategy used in this research is shown in Figure 5.
2.2.2. Numerical Methods and Solver Validation
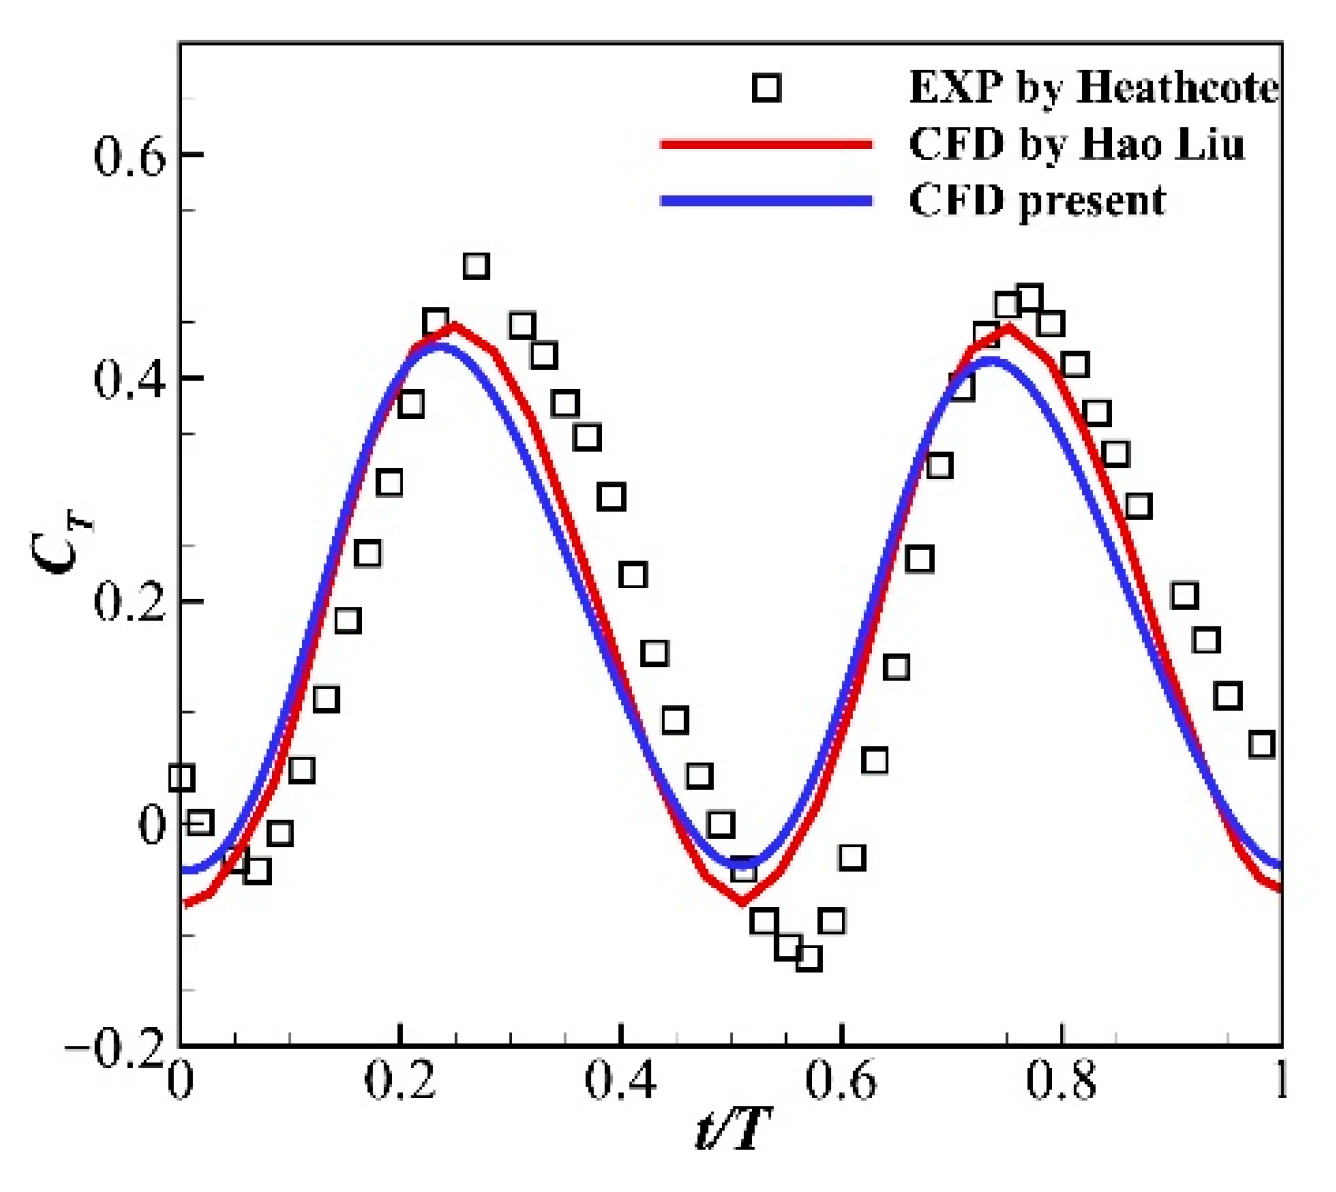
A test case to examine the accuracy of the numerical scheme considered a rigid wing oscillating in pure heave. The results were compared with those from an experiment conducted by Heathcote et al. [25], which was performed in a free-surface closed-loop water tunnel. This wing has a chord length of and an aspect ratio of . The flow has a Reynolds number of and a freestream velocity of . The kinematic parameters of motion are , and the reduced frequency is . The instantaneous thrust coefficient given by the numerical simulations is depicted in Figure 6. The overall trends of this coefficient are similar to Heathcote’s experimental data and Liu’s numerical results [26]. There are still some slight differences between the calculated and experimental values, indicating that the flexibility observed in Heathcote’s experiment, though very small, is responsible for a slight increase in the thrust forces and a slight phase delay. These differences were also observed in the study of Liu [26]. Hence, the present solver can be used to predict the unsteady lift performance in this study.
2.2.3. Mesh Quantity and Time Step Independence Validation
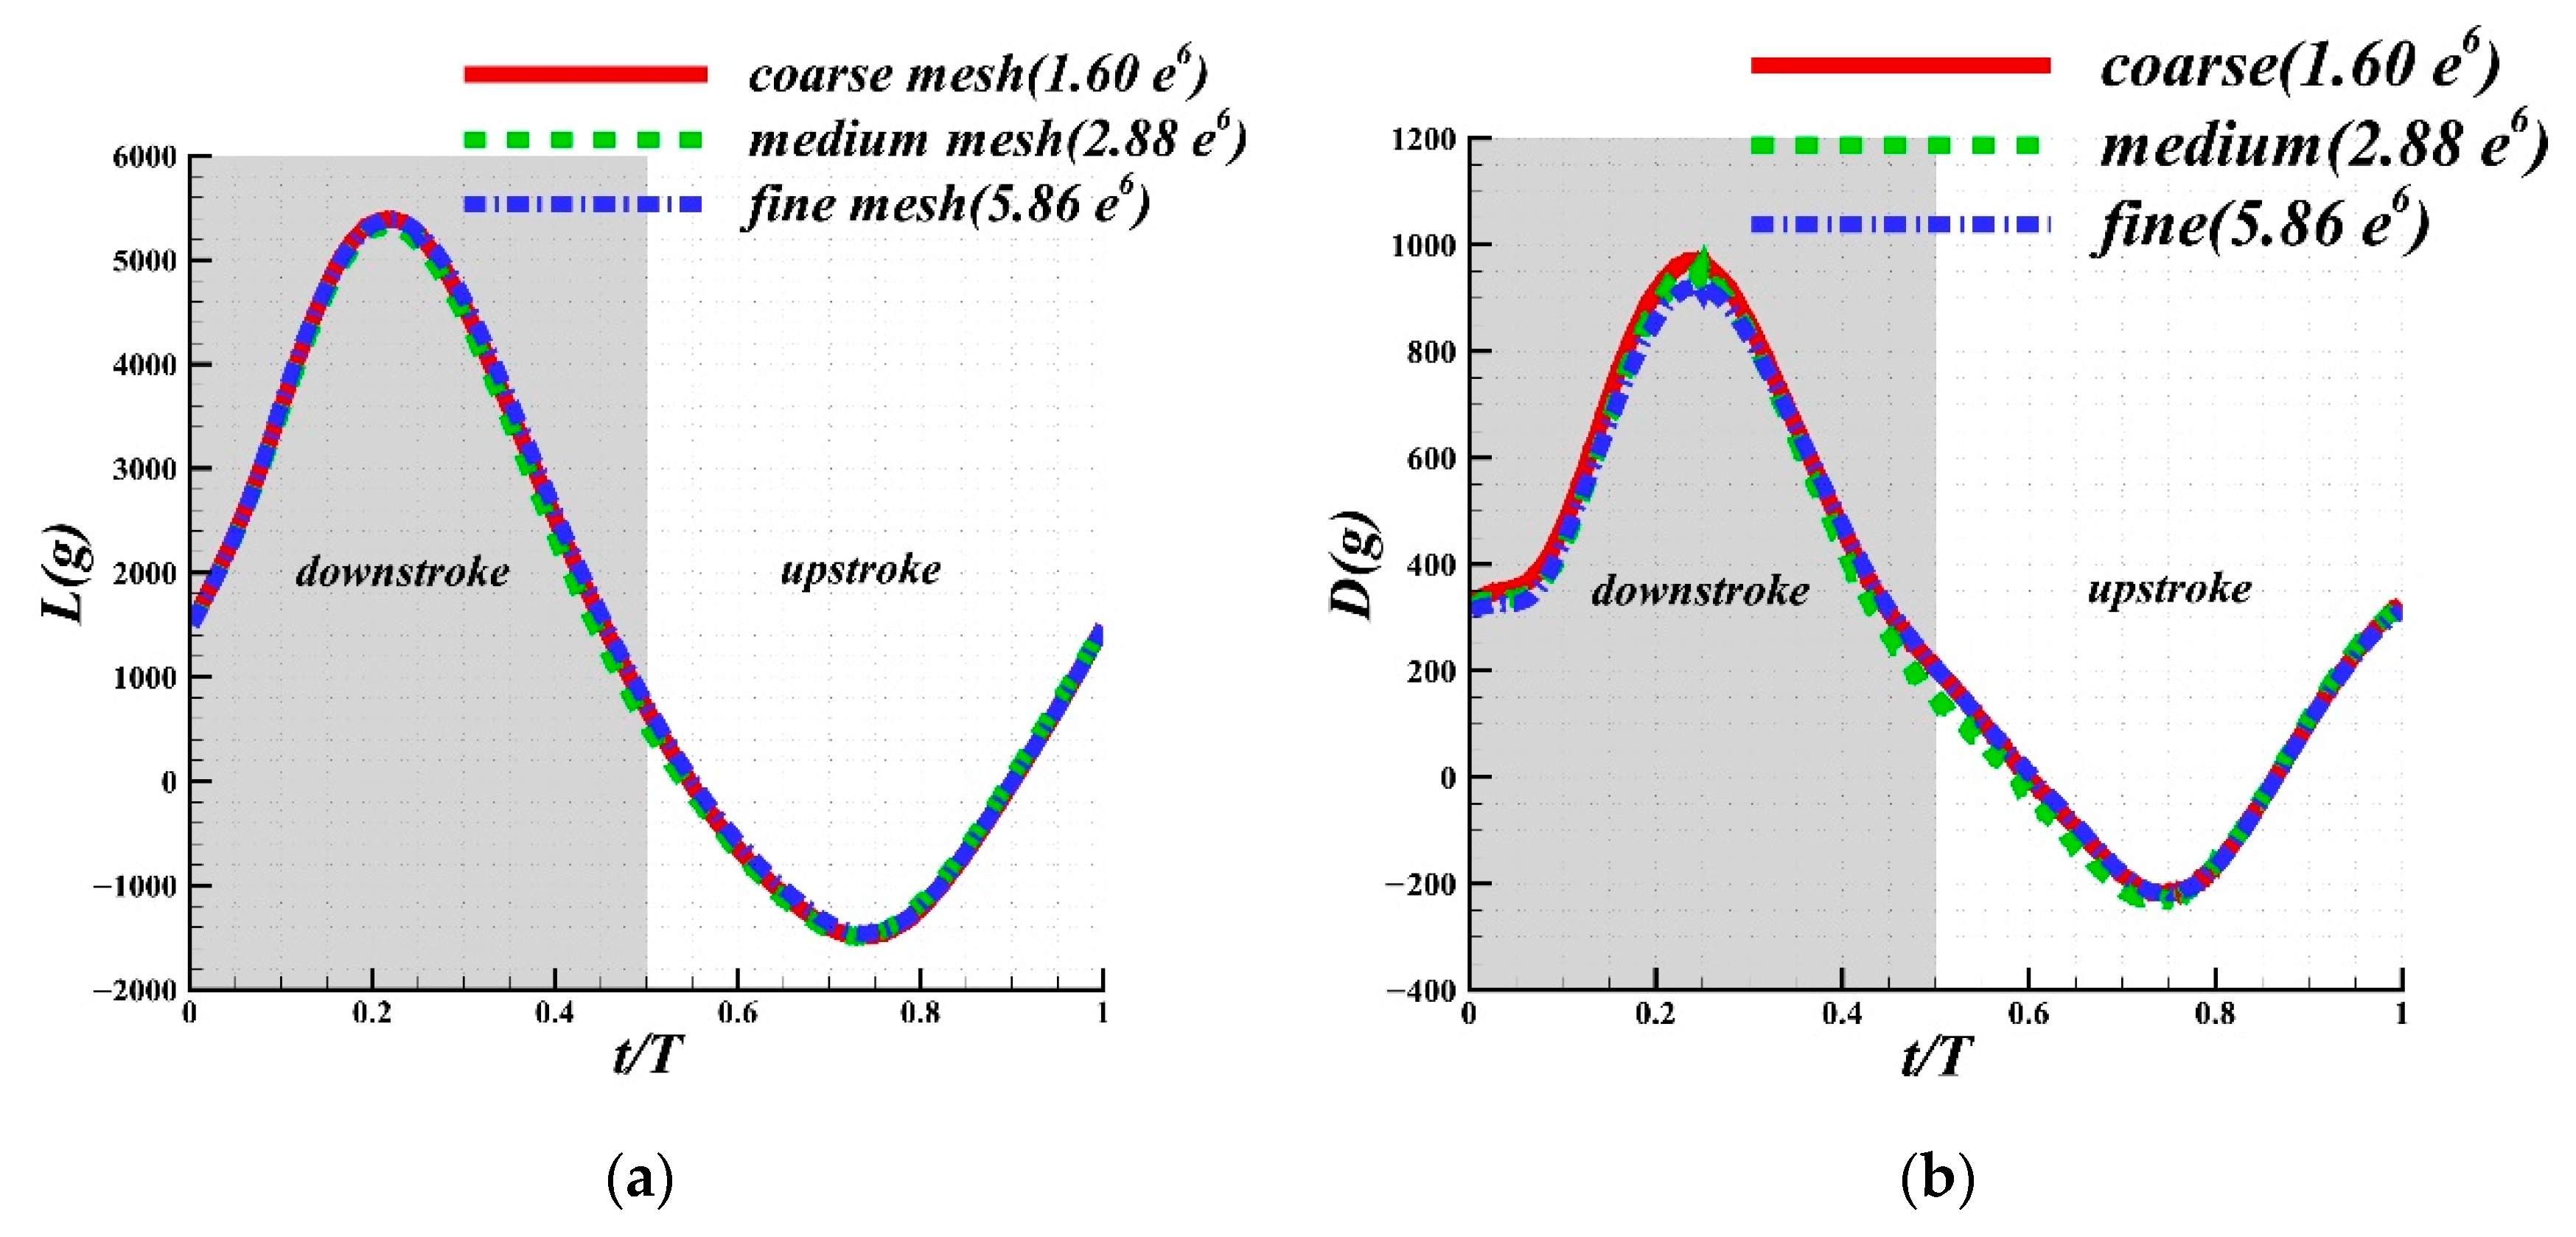
The mesh quantity and time step size were validated for the bionic wing model before CFD analysis. To eliminate the influence of mesh resolutions on the calculation results, the mesh dependence study was performed using three different mesh resolutions, i.e., around 1.60, 2.88, and 5.86 million, respectively. Table 4 shows the size of each component of three meshes. All three mesh systems were in similar topology, as shown in Figure 5 and were calculated for five cycles with 500 time steps per period. The form of component cells is a tetrahedron, the form of background cells is a hexahedron, and the form of the boundary layer is a prism. The height of the first grid of the boundary layer is maintained at 0.035 mm in both the validation and the subsequent calculation, which meets the requirement of Y+ = 1. The grid height ratio is 1:1 to meet the requirement of arranging enough layers of grids (layers > 10) in the boundary layer so that sufficient grid density is ensured. The results of the last cycle are presented in Figure 7, Figure 7a shows the time history of comparison of transient lift force and Figure 7b presents the time history of transient drag force. As can be seen, the results of forces under the three quantities do not differ much.
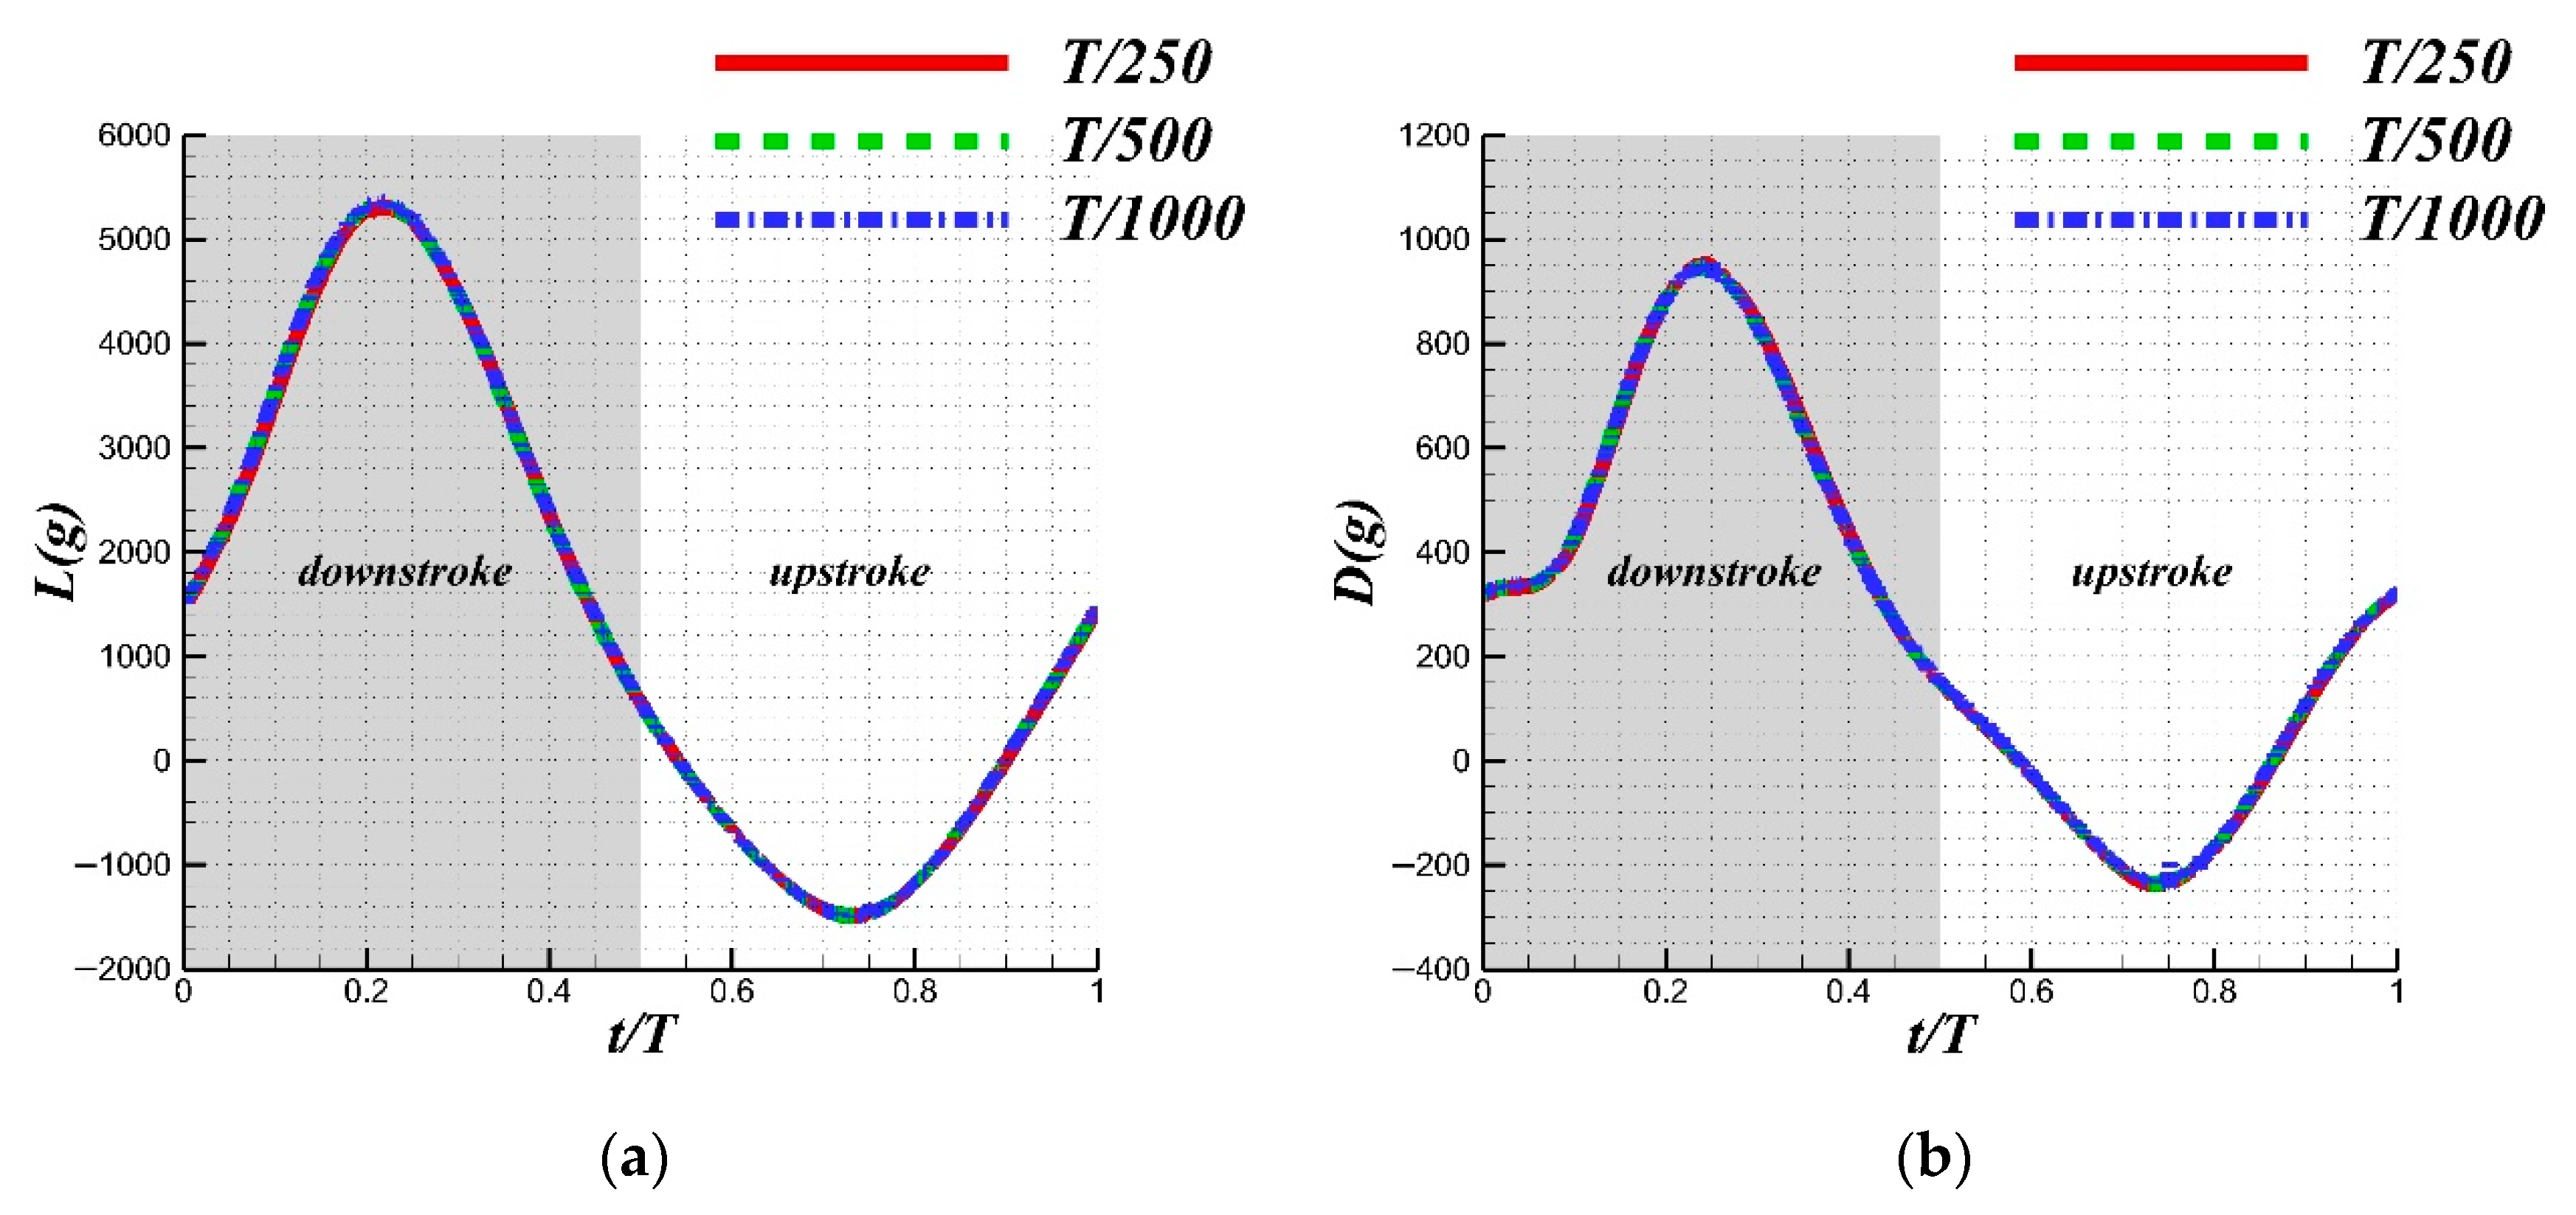
Time steps of T/250, T/500, and T/1000 were employed in the simulations. As shown in Figure 8, the transient lift and the transient drag for the three time-step sizes exhibit no obvious differences.
The results of these two validation cases indicated that a medium mesh quantity of 2.88 million and a time step size of T/500 should be employed for subsequent simulations in order to reduce the computation time while maintaining sufficient accuracy. The calculation was carried out for five periods, and the data from the final period were used for comparison.
3. Results
The results of the wind tunnel experiments for all the above flapping wings are discussed in this section. In this paper, the key non-dimensional control parameters include the Reynolds number (Re), Strouhal number (St), and angle of attack (AOA).
3.1. Effect of Planforms and the Function of the Additional Materials
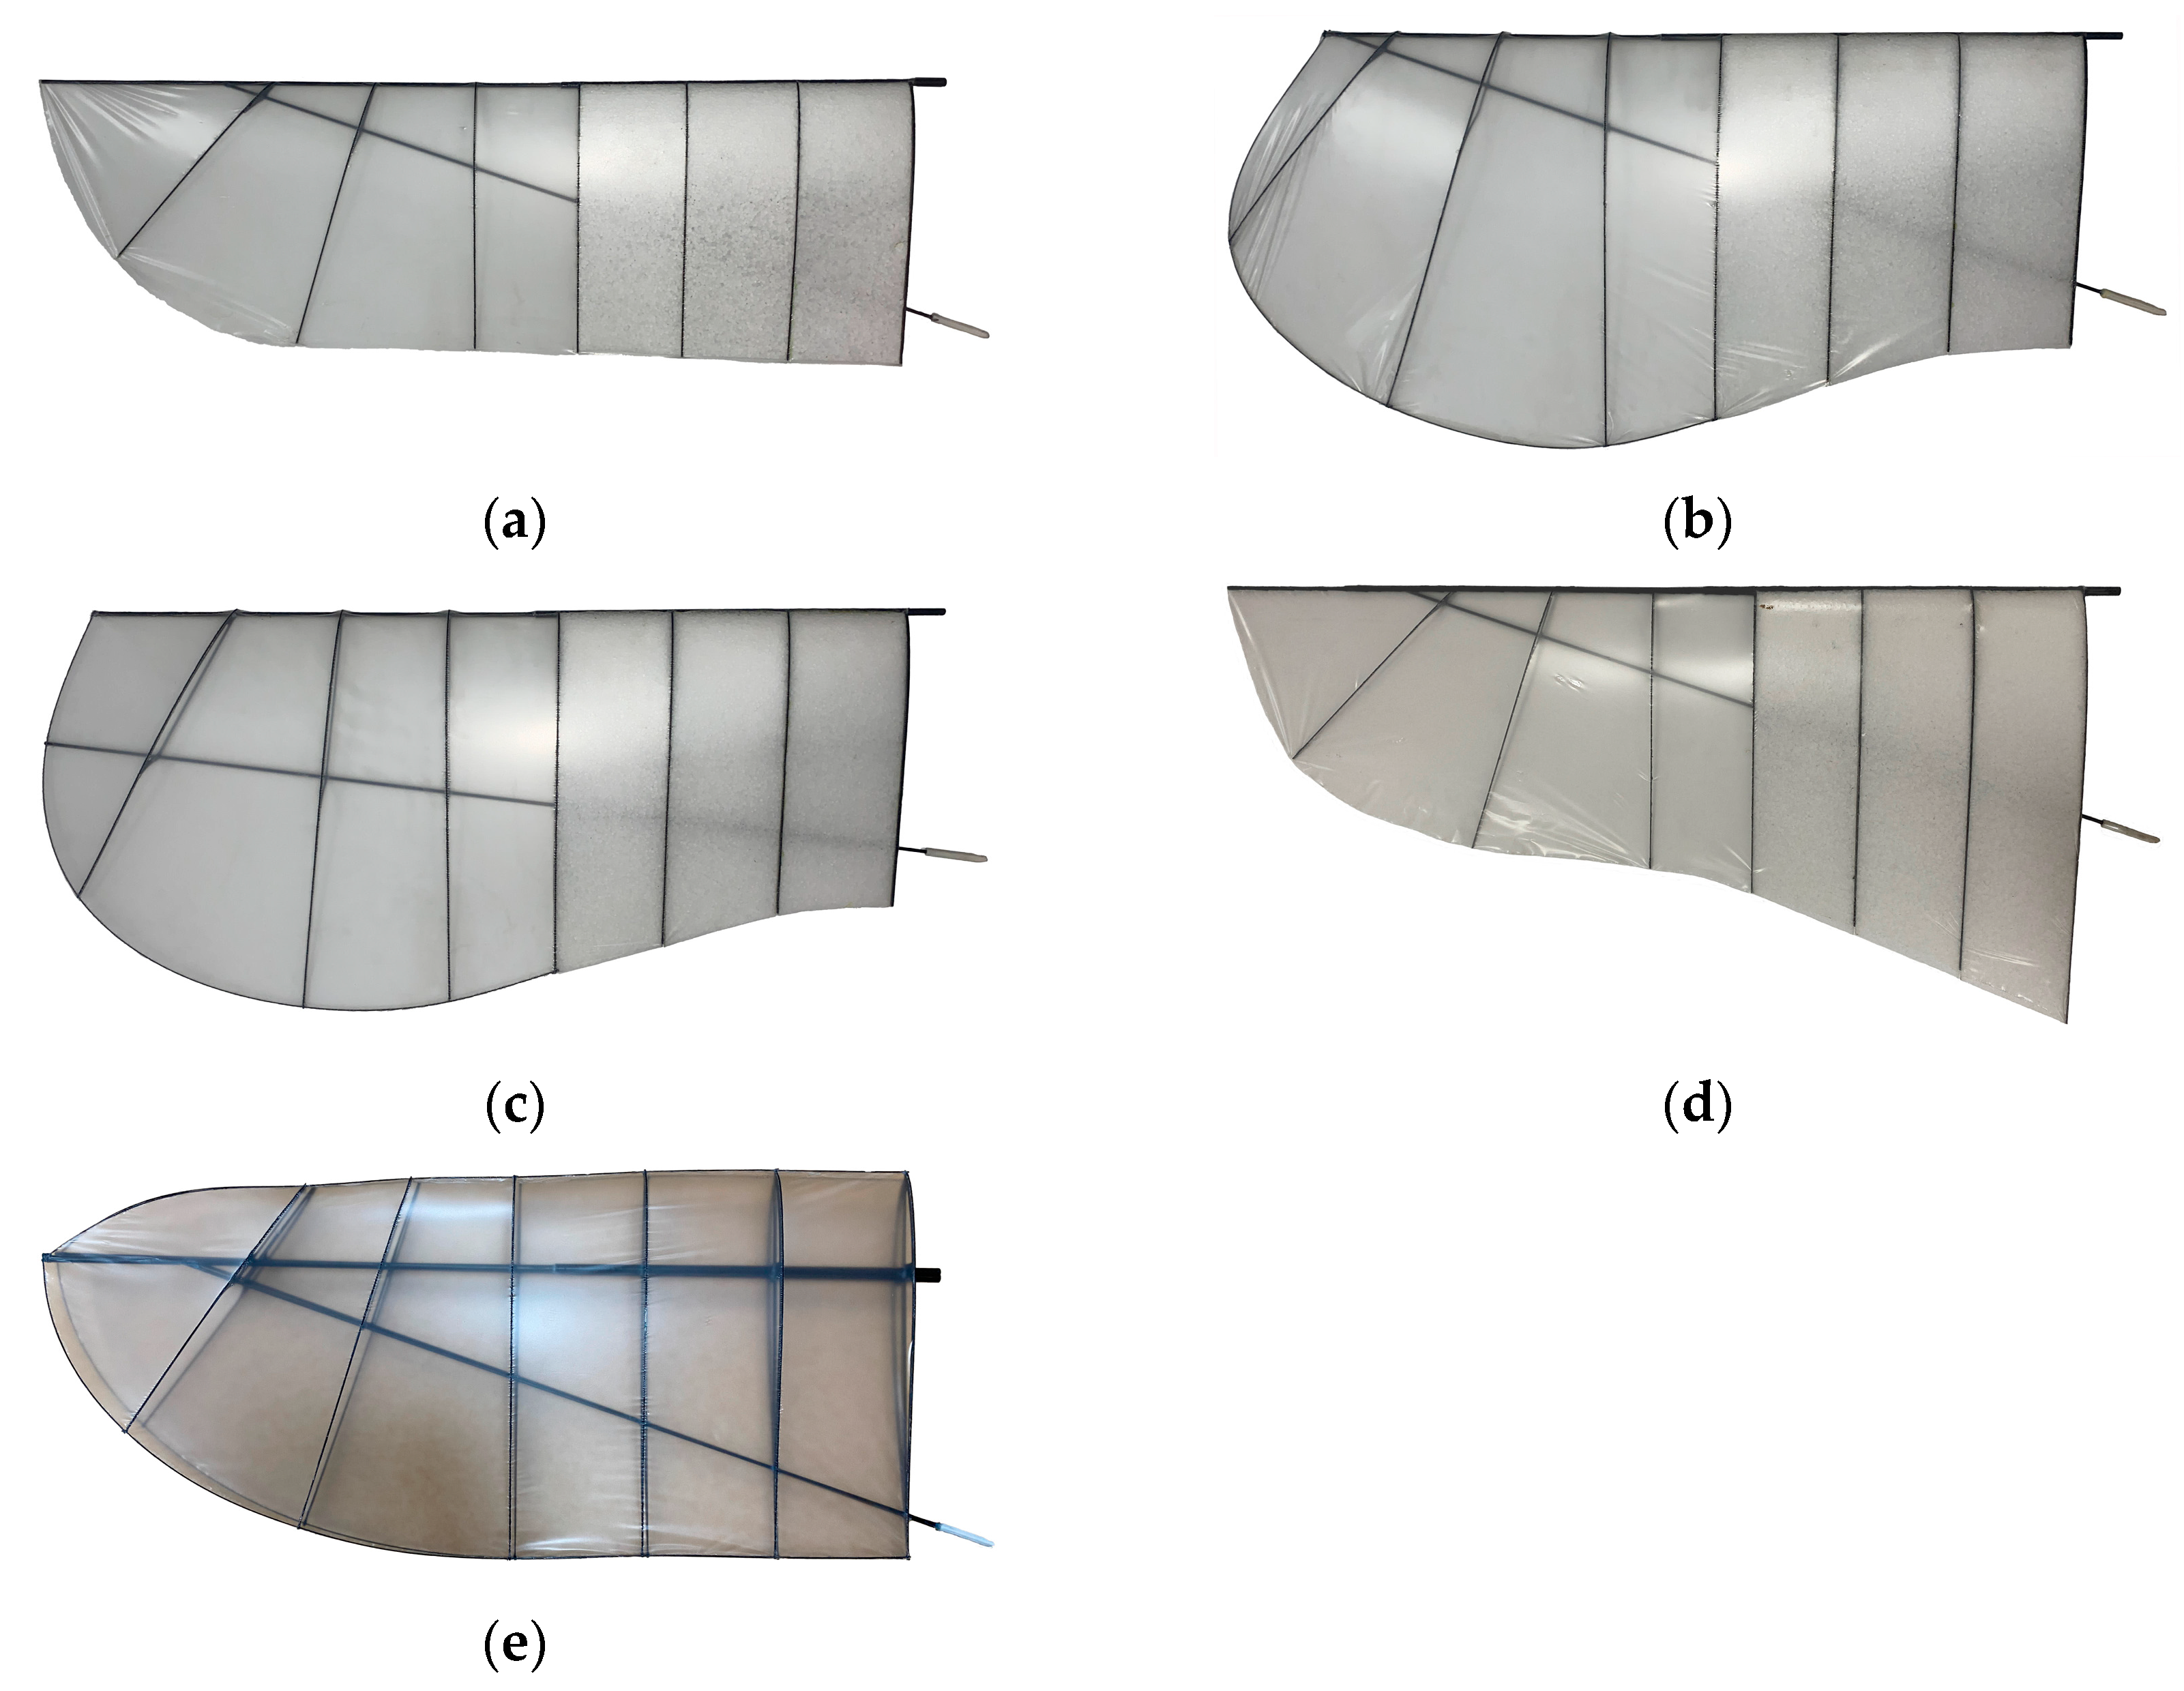
After complicated fabrication, the first to eighth wings in Table 2 were obtained. The eight wings were installed in the experimental set-up for wind tunnel experiments to investigate the effect of planforms and the effect of the additional materials (Figure 9).
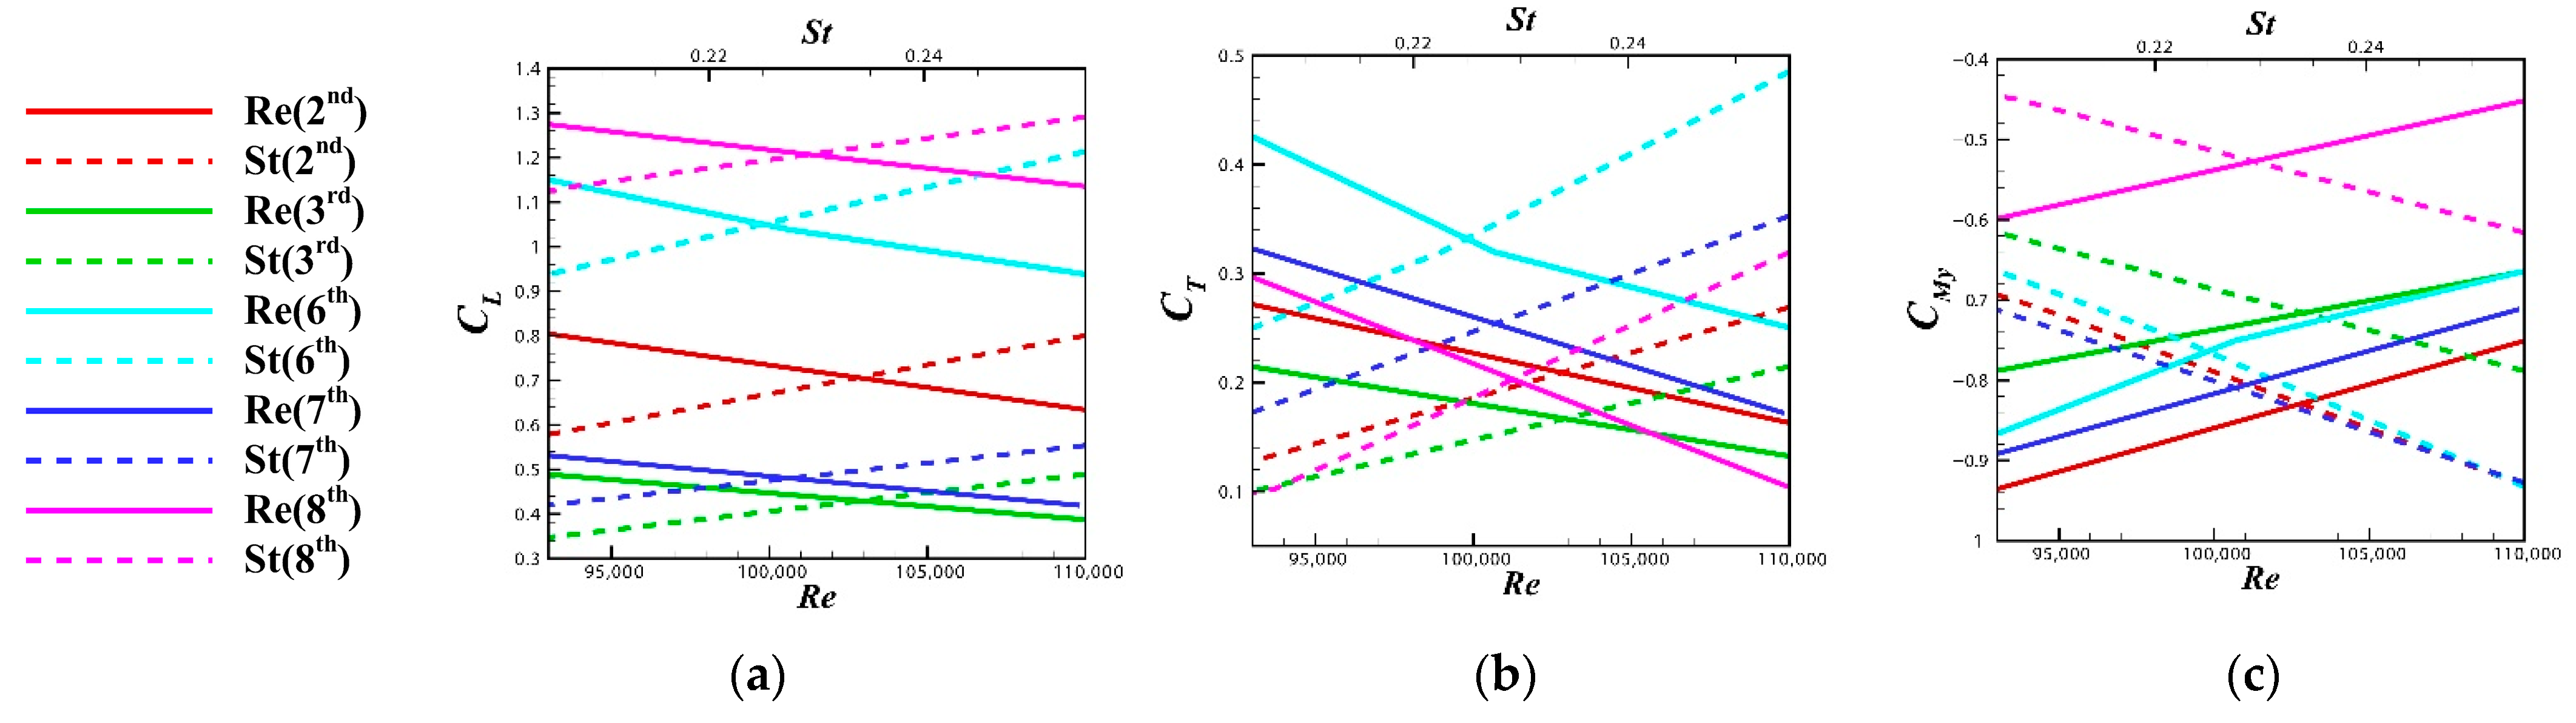
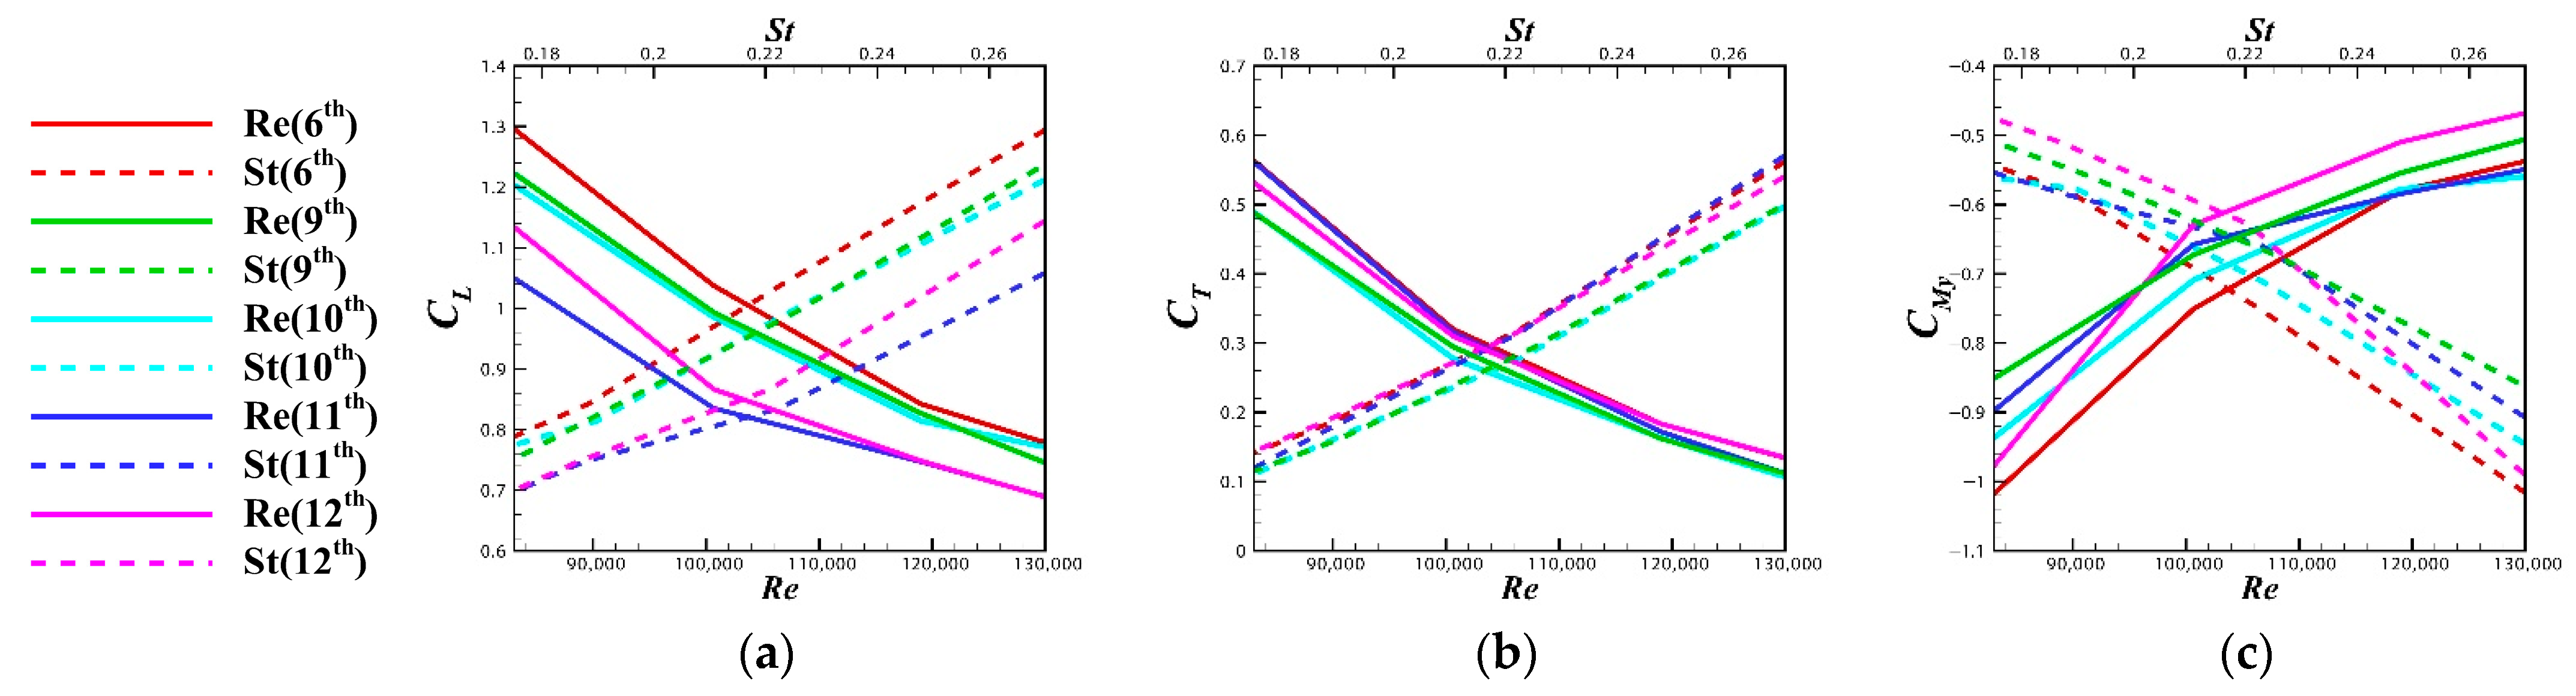
Figure 10 shows the effect of dimensionless parameters, i.e., the Reynolds number and the Strouhal number, on the force and moment coefficients. The solid and dashed lines each represent the effects of Re and St. The five different colors refer to some typical types of flapping wings and allow a clear comparison of the role of the planform and additional materials. A raise in Re will reduce the lift coefficient, thrust coefficient, and downward pitching moment, which is opposite to the effect of St. By comparing the curves of different colors, it can be found that the elliptical planform has the best lift coefficients and the minimum downward pitching moment in all Re and St ranges, but at the cost of thrust. The attachment of the additional materials also significantly enhances the lift and thrust coefficients in the full Re and St ranges.
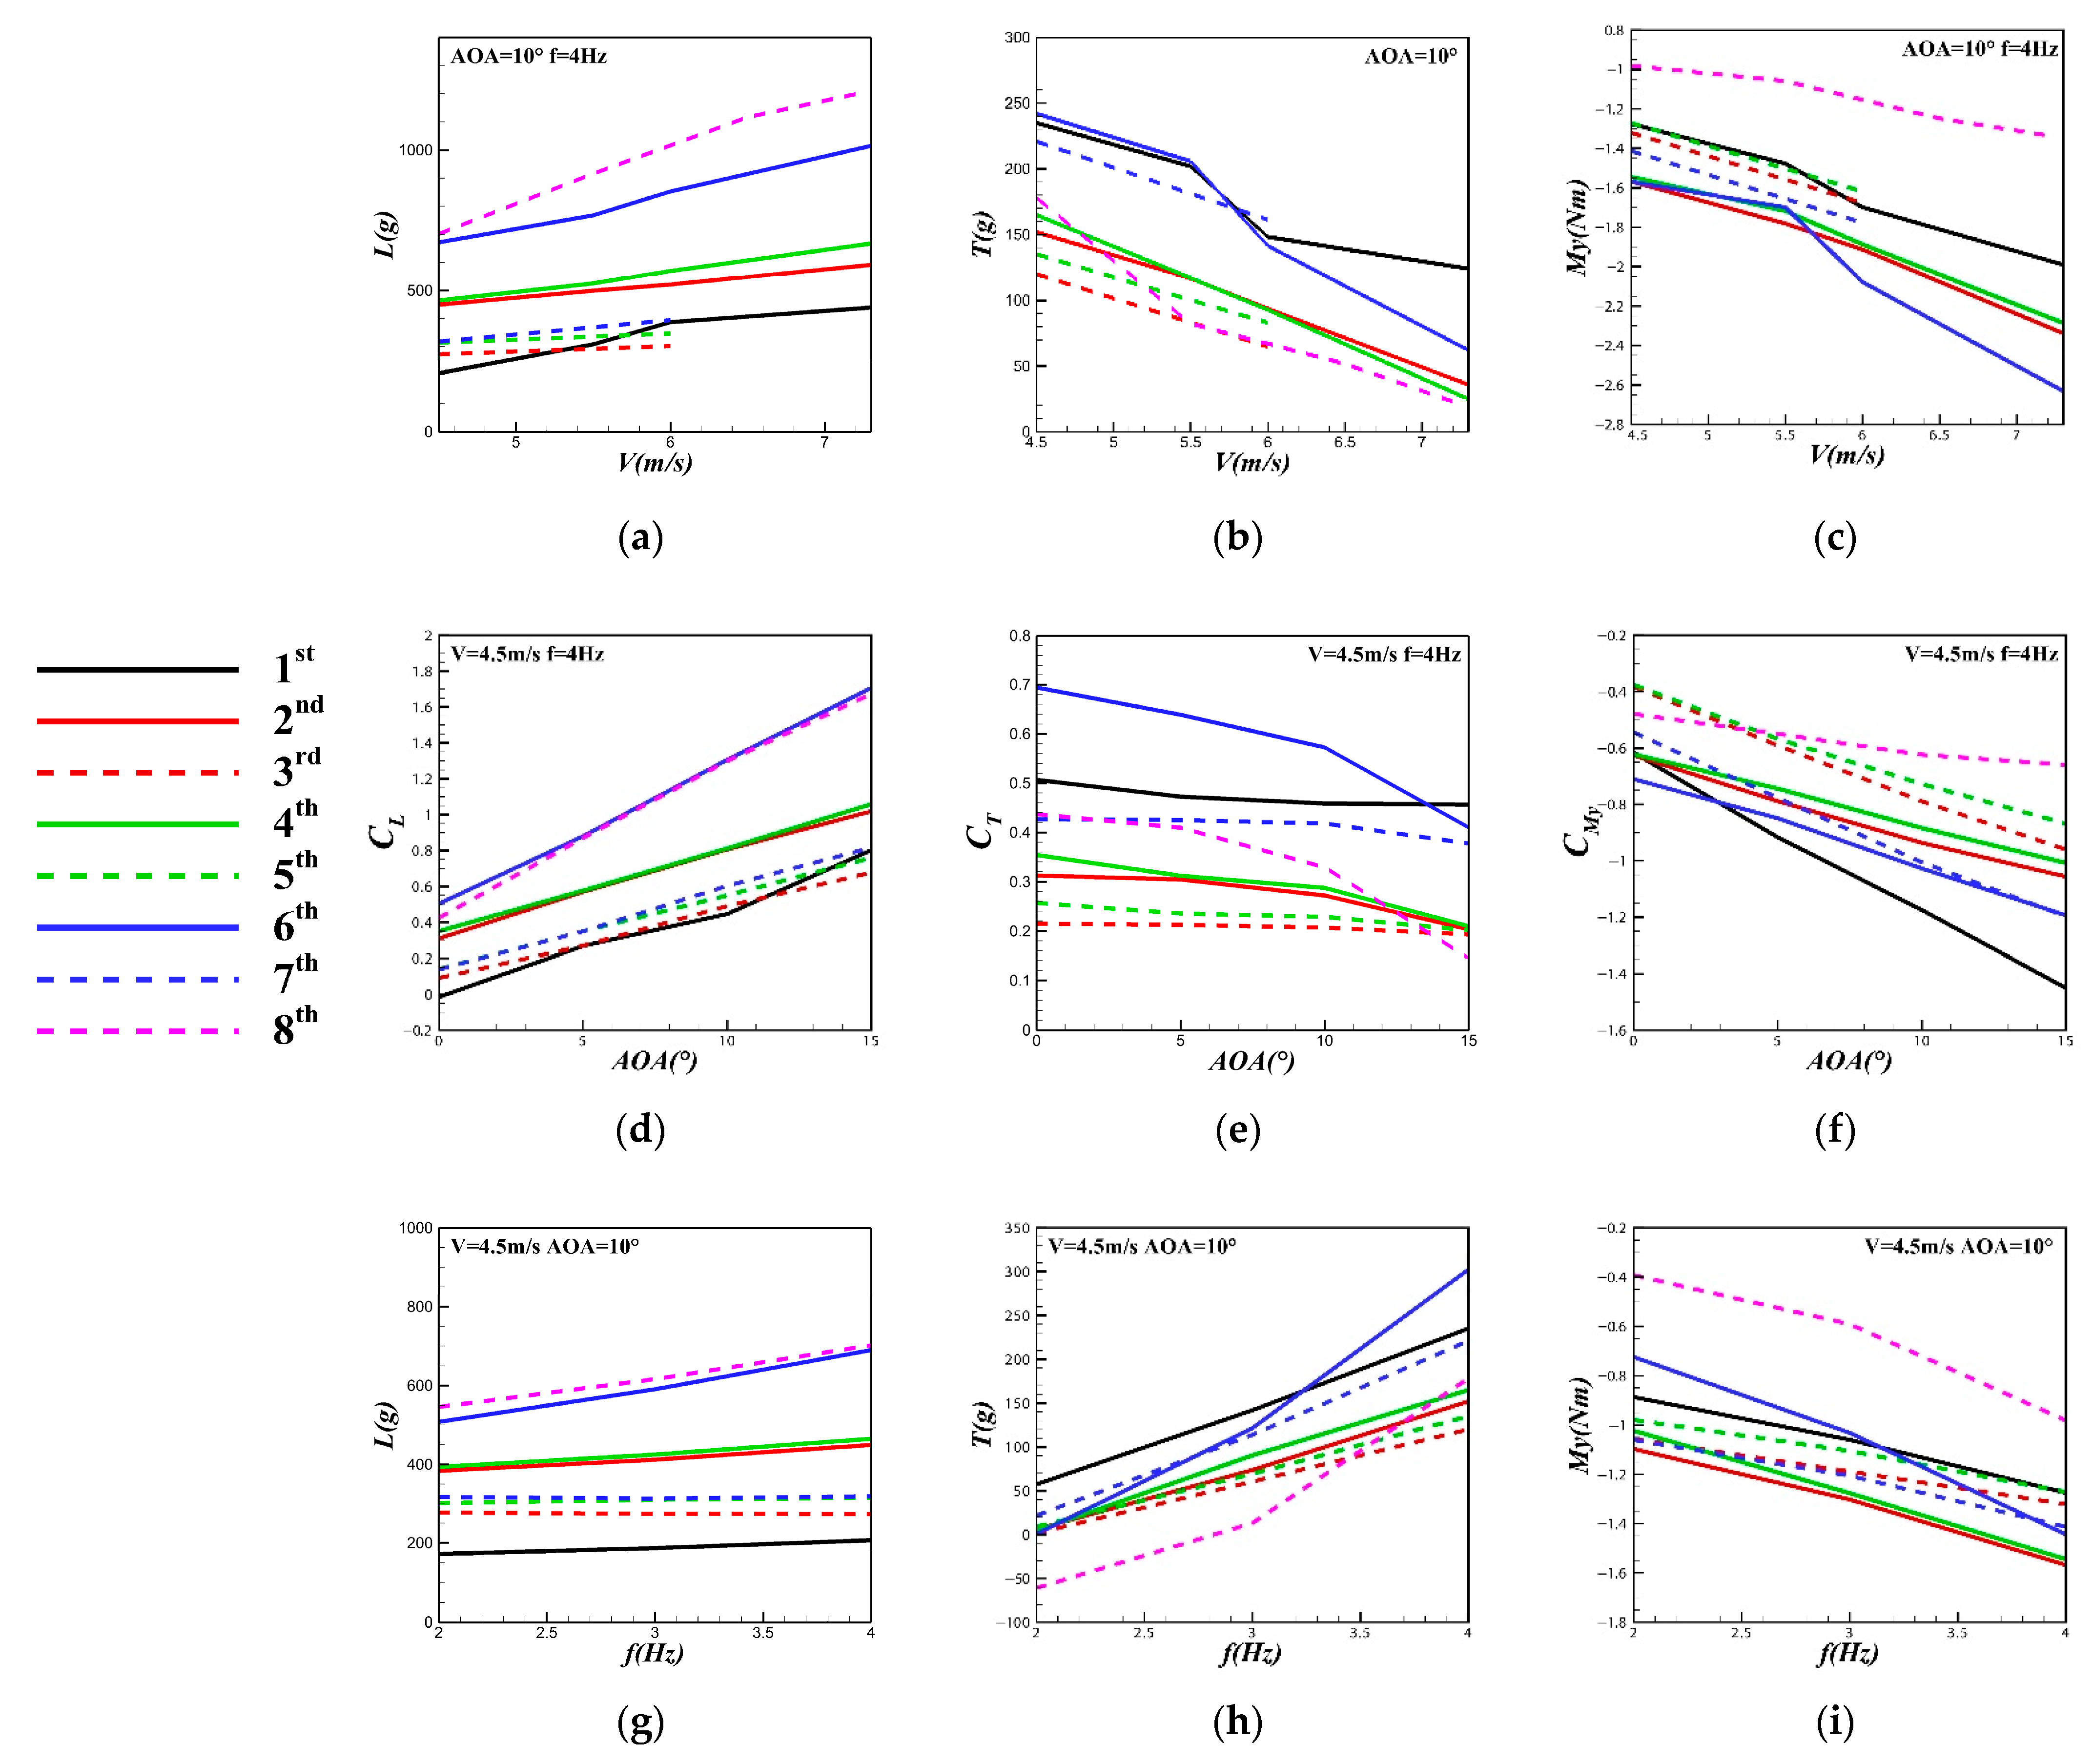
Figure 11 shows the results of experiments conducted with the first eight wings in Table 2 under the experimental parameter configurations in Table 1. The lift increases monotonously with increasing wind speed, angle of attack, and flapping frequency. Additionally, it is found that the thrust decreases with the increment of wind speed and attack of angle, which is opposite to the effect of frequency on thrust production. As for the pitching moment, it decreases with the increment of the above three parameters.
Comparing the force and moment performance of the first to the eighth flapping wings, the lift performance of the sixth and eighth flapping wings is more prominent compared to the other wings, indicating that the elliptical shape and increasing the internal area of the wing contribute to the generation of lift.
For the effect of the planforms of flapping wings on the lift, the elliptical one is slightly better than increasing the internal area of the wing; increasing the external area of the wing with an oblique rod setback, as shown in Figure 9c, is worse in comparison, and the planform shown in Figure 9b has the worst lift performance. The internal area of the flapping wing is mainly related to the generation of lift, so it is necessary to ensure that it has sufficient area, while the chord torsional stiffness of the wing needs to be moderate. Considering the function of the additional materials, as shown in Figure 11a,d,g, it is obvious that the lift of the solid line is always higher than that of the dashed line, which indicates that the periodic-averaged lift of the flapping wing is generally improved substantially when additional materials are attached. To be specific, the lift increases by at least 50%.
In terms of thrust, the first, sixth, and seventh wings perform significantly better than the other wings. The positive contribution of increasing the internal area of the wing to thrust is greater than the other two types of increasing the external area of the wing. It is worth noting that the elliptical planform of the flapping wing can only produce less thrust. According to the theory of fixed wings, the reduction of the induced drag of elliptical wings is not enough to compensate for the increment brought by the high lift coefficient. Through the comparison of solid and dashed lines, it can be found that the additional materials can have a beneficial impact on thrust. Numerically, the thrust increases by at least 20%.
The pitching moment at the root of the wing is shown in Figure 11c,f,i. Among these eight flapping wings, the elliptical planform results in the largest downward force moment. The downward force moment of the external area of the wing that is increased with an oblique rod setback is higher than that of the wing without an oblique rod setback, and the planform of increasing the internal area of the wing is lower. It can also be concluded that the attachment of additional materials can reduce the downward force moment to some extent.
Considering the influence of the above planform and additional materials on the lift, thrust, and pitching moment of the flapping wings (i.e., Figure 9d), increasing the internal area of the wing and attaching additional materials (weighing 163 g) are chosen for subsequent study.
3.2. Effect of Film Materials and Number of the Ribs
The takeoff weight is critical for the vehicle, so it is necessary to reduce the weight of the flapping wing. Therefore, on the basis of increasing the internal area of the wing, as determined above, the film material and the number of wing ribs will be discussed.
The planform of the wing, the position of the oblique rod, and the airfoil are guaranteed to be consistent. Without additional materials, six or seven wing ribs are combined with polyester or linen wing film material, respectively. The weight of all four wings in Figure 12 is around 120 g.
From Figure 13, it can be concluded that the solid and dashed lines show opposite trends for the flapping wing aerodynamic performance in the range of Re and St studied in this paper. The reduction in the number of wing ribs results in a significant increase in the lift coefficient and a slight decrease in the thrust coefficient. The wing membrane material affects the aerodynamic performance to a small extent, but the linen material creates a slight increase in the downward pitching moment.
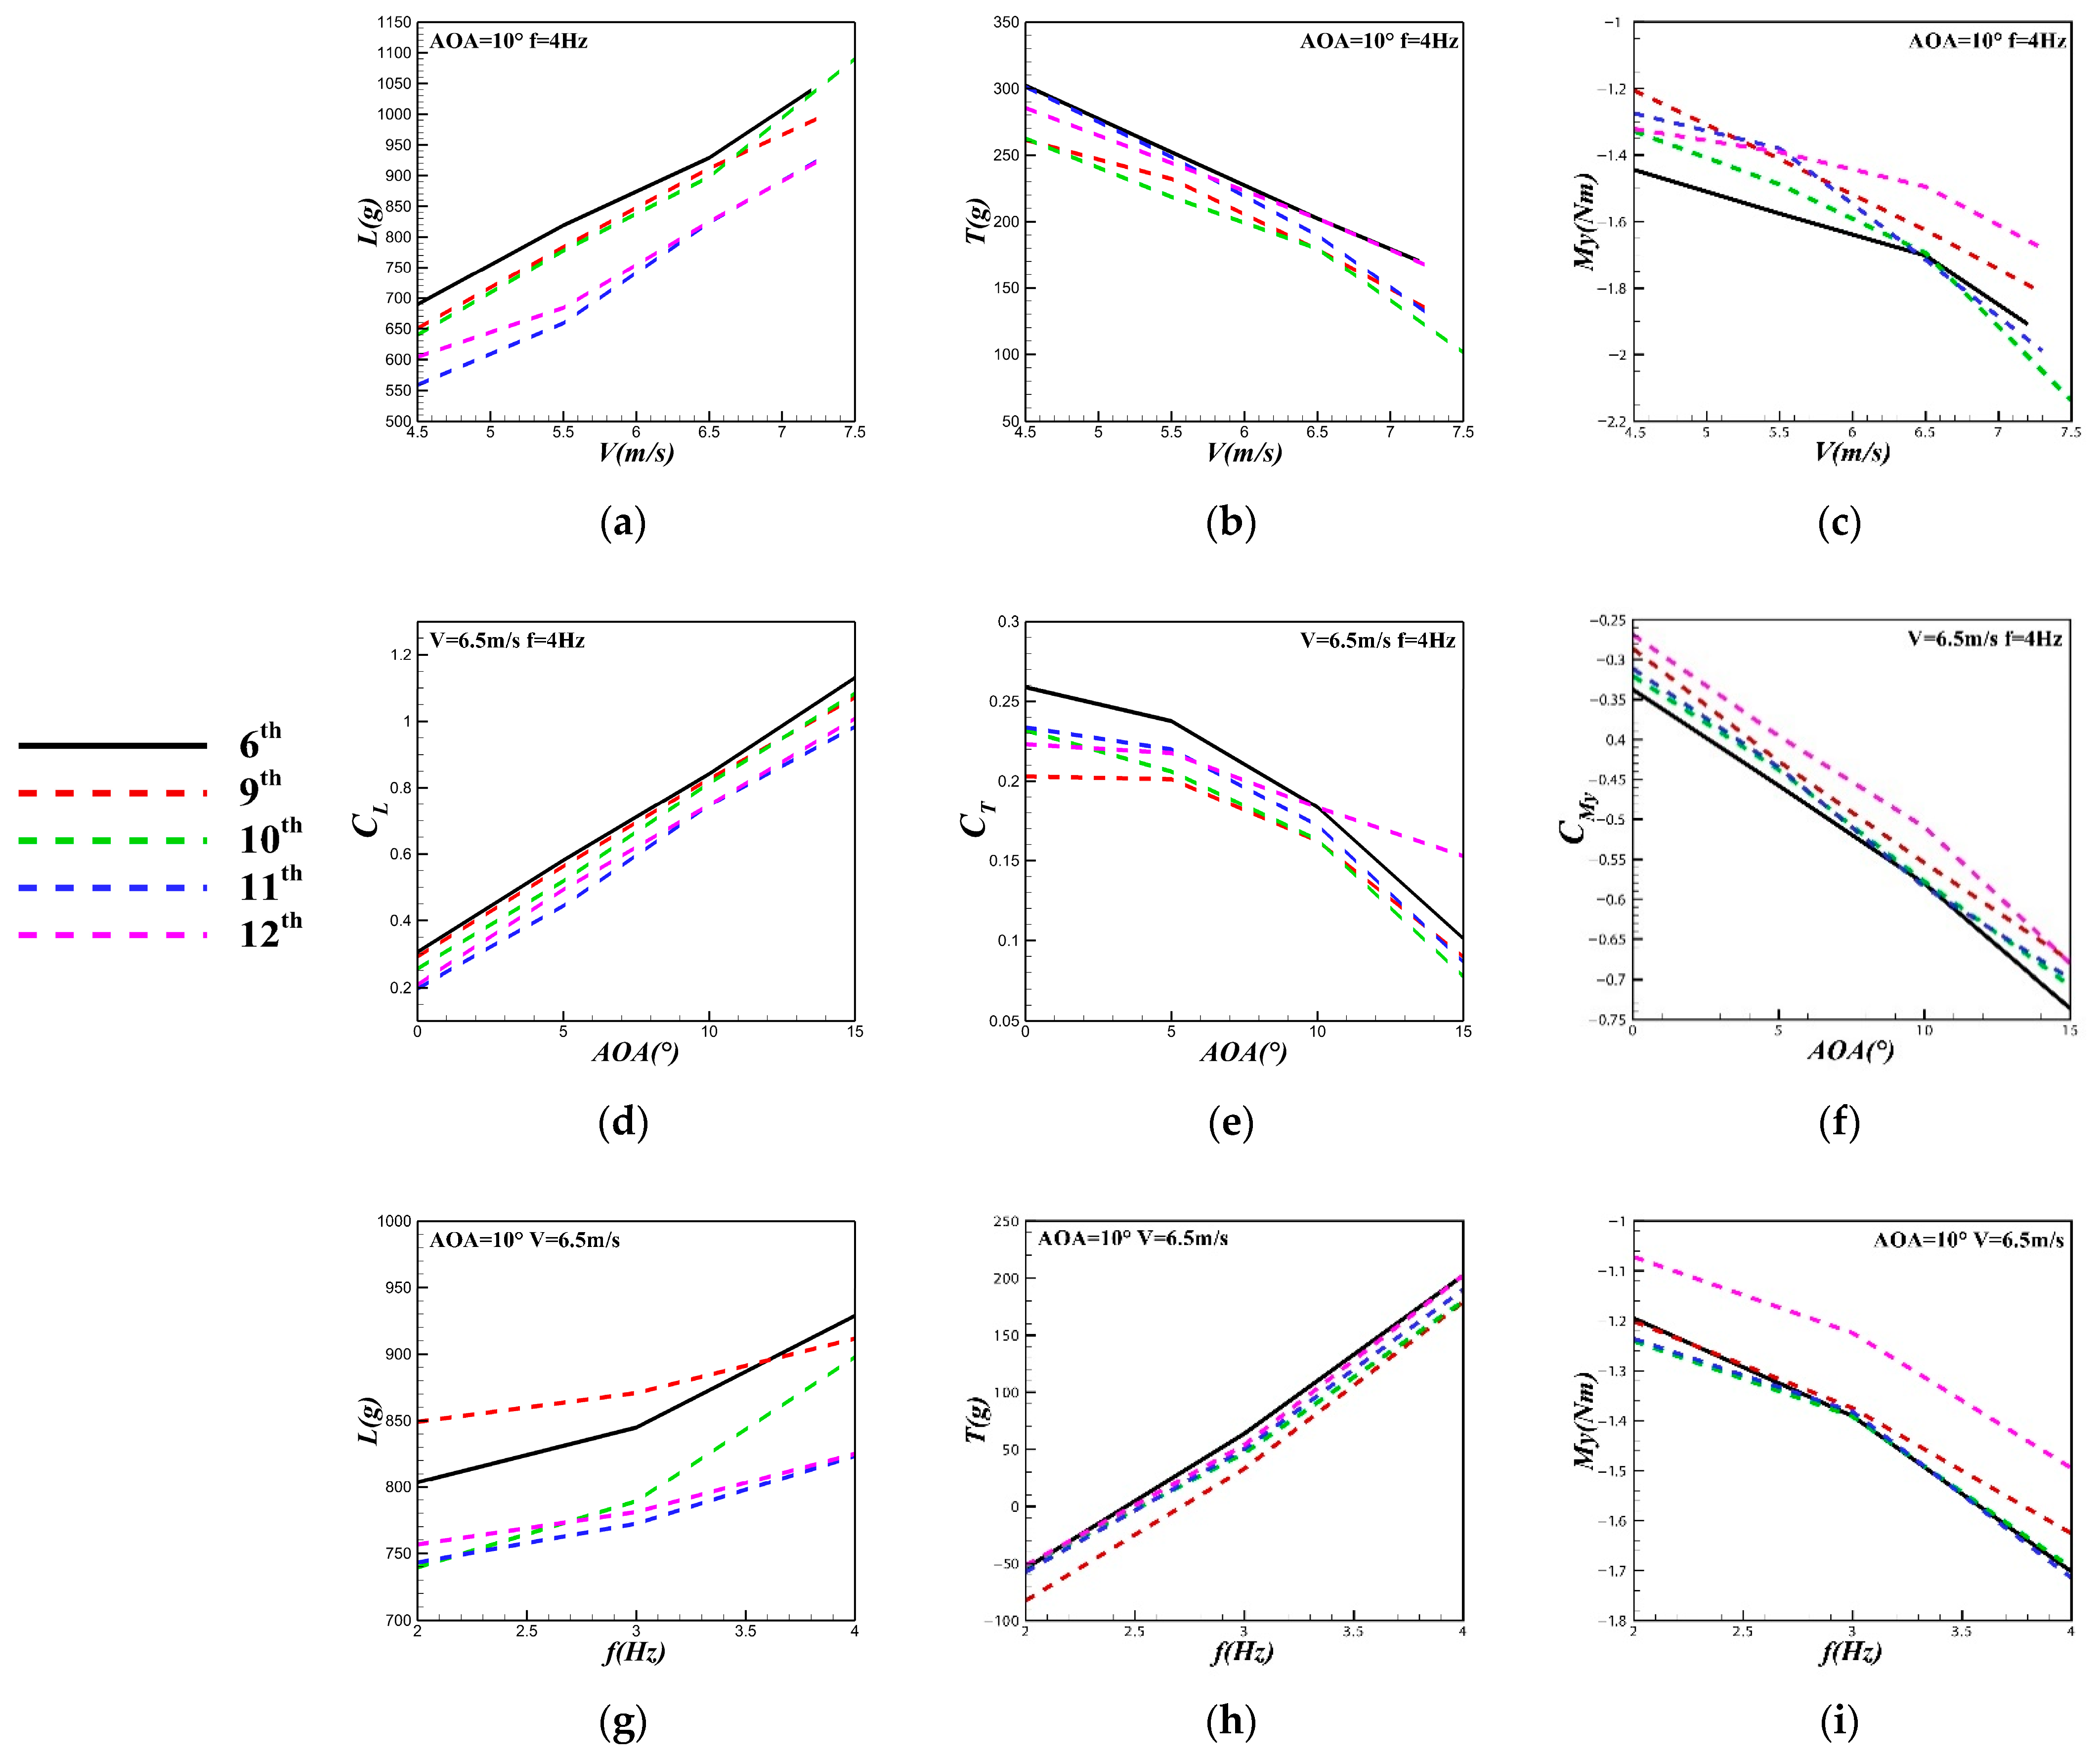
Figure 14 shows the lift, thrust, and pitching moment of the last four wings for different wind speeds, attack angles, and flapping frequencies. The solid black line indicates the 163 g wing before weight reduction.
In terms of lift, the performance of all four wings deteriorates after weight reduction. Comparing these four wings, the flapping wings with six wing ribs are better than those with seven wing ribs. While the material of the wing film has little influence on the lift, the flapping wings of linen material produce greater lift than that of polyester film. For flapping wings, lift generation is mainly related to wind speed and an effective angle of attack. In comparison, the increment of flapping frequency does not significantly improve the lift, if any, probably due to the flexible deformation of the wing, caused by high frequency, thus changing the effective angle of attack.
For thrust, it is obvious that the wing before weight reduction still performs better. In contrast to the effect of the number of wing ribs on lift, the reduction has a slight detrimental effect on thrust. The two materials of the wing film do not play a significant role in thrust. The main factor affecting thrust, while keeping the amplitude constant, is flapping frequency. Increasing the flapping frequency will effectively improve thrust at the cost of power consumption.
When referring to the pitching moment, it can be found that the wing after weight reduction is weakened in absolute values. The combination of seven wing ribs and linen film creates the minimum downward force moment.
Linen is about 2.6 g heavier than the polyester film material, which has a slight lift improvement and a certain degree of thrust increment at high speeds. The six ribs are about 7.1 g lighter compared to the seven ribs, with a significant lift and a slight decrease in thrust. The slow-motion video of the flapping motion shows that the six wing ribs are stiffer than the seven wing ribs in the chord direction of the wingtip, and the former deformation is not as pronounced as the latter. During stroke reversal, the chordwise twist of the wing with seven ribs is faster, which results in a greater chordwise twist angle at the wingtip at the initial moment of the downstroke. The greater downward chordwise twist angle during downstroke results in stronger thrust, while the higher speed during stroke reversal can reduce the downward fluid mass, resulting in less lift. The result is that for a single-stage flapping wing, the flapping motion should match the passive twisting motion in the chord direction, which benefits from the excellent stiffness design.
3.3. Periodic-Averaged Aerodynamic Performance Trim of Flapping Wings
The parameters of the trim state are so critical to the vehicle that it is necessary to use the available data for trim predictions. For the trim of flexible flapping wings, it is more accurate to use the data from wind tunnel experiments to establish the model. However, since the experimental state of the wind tunnel is discrete and not conducive to the solution of the leveling state, the neural network toolbox in Matlab needs to be used for interpolation first. The BP neural network is a multi-layer feed-forward neural network trained according to the error backpropagation algorithm, and it is one of the most widely used neural network models.
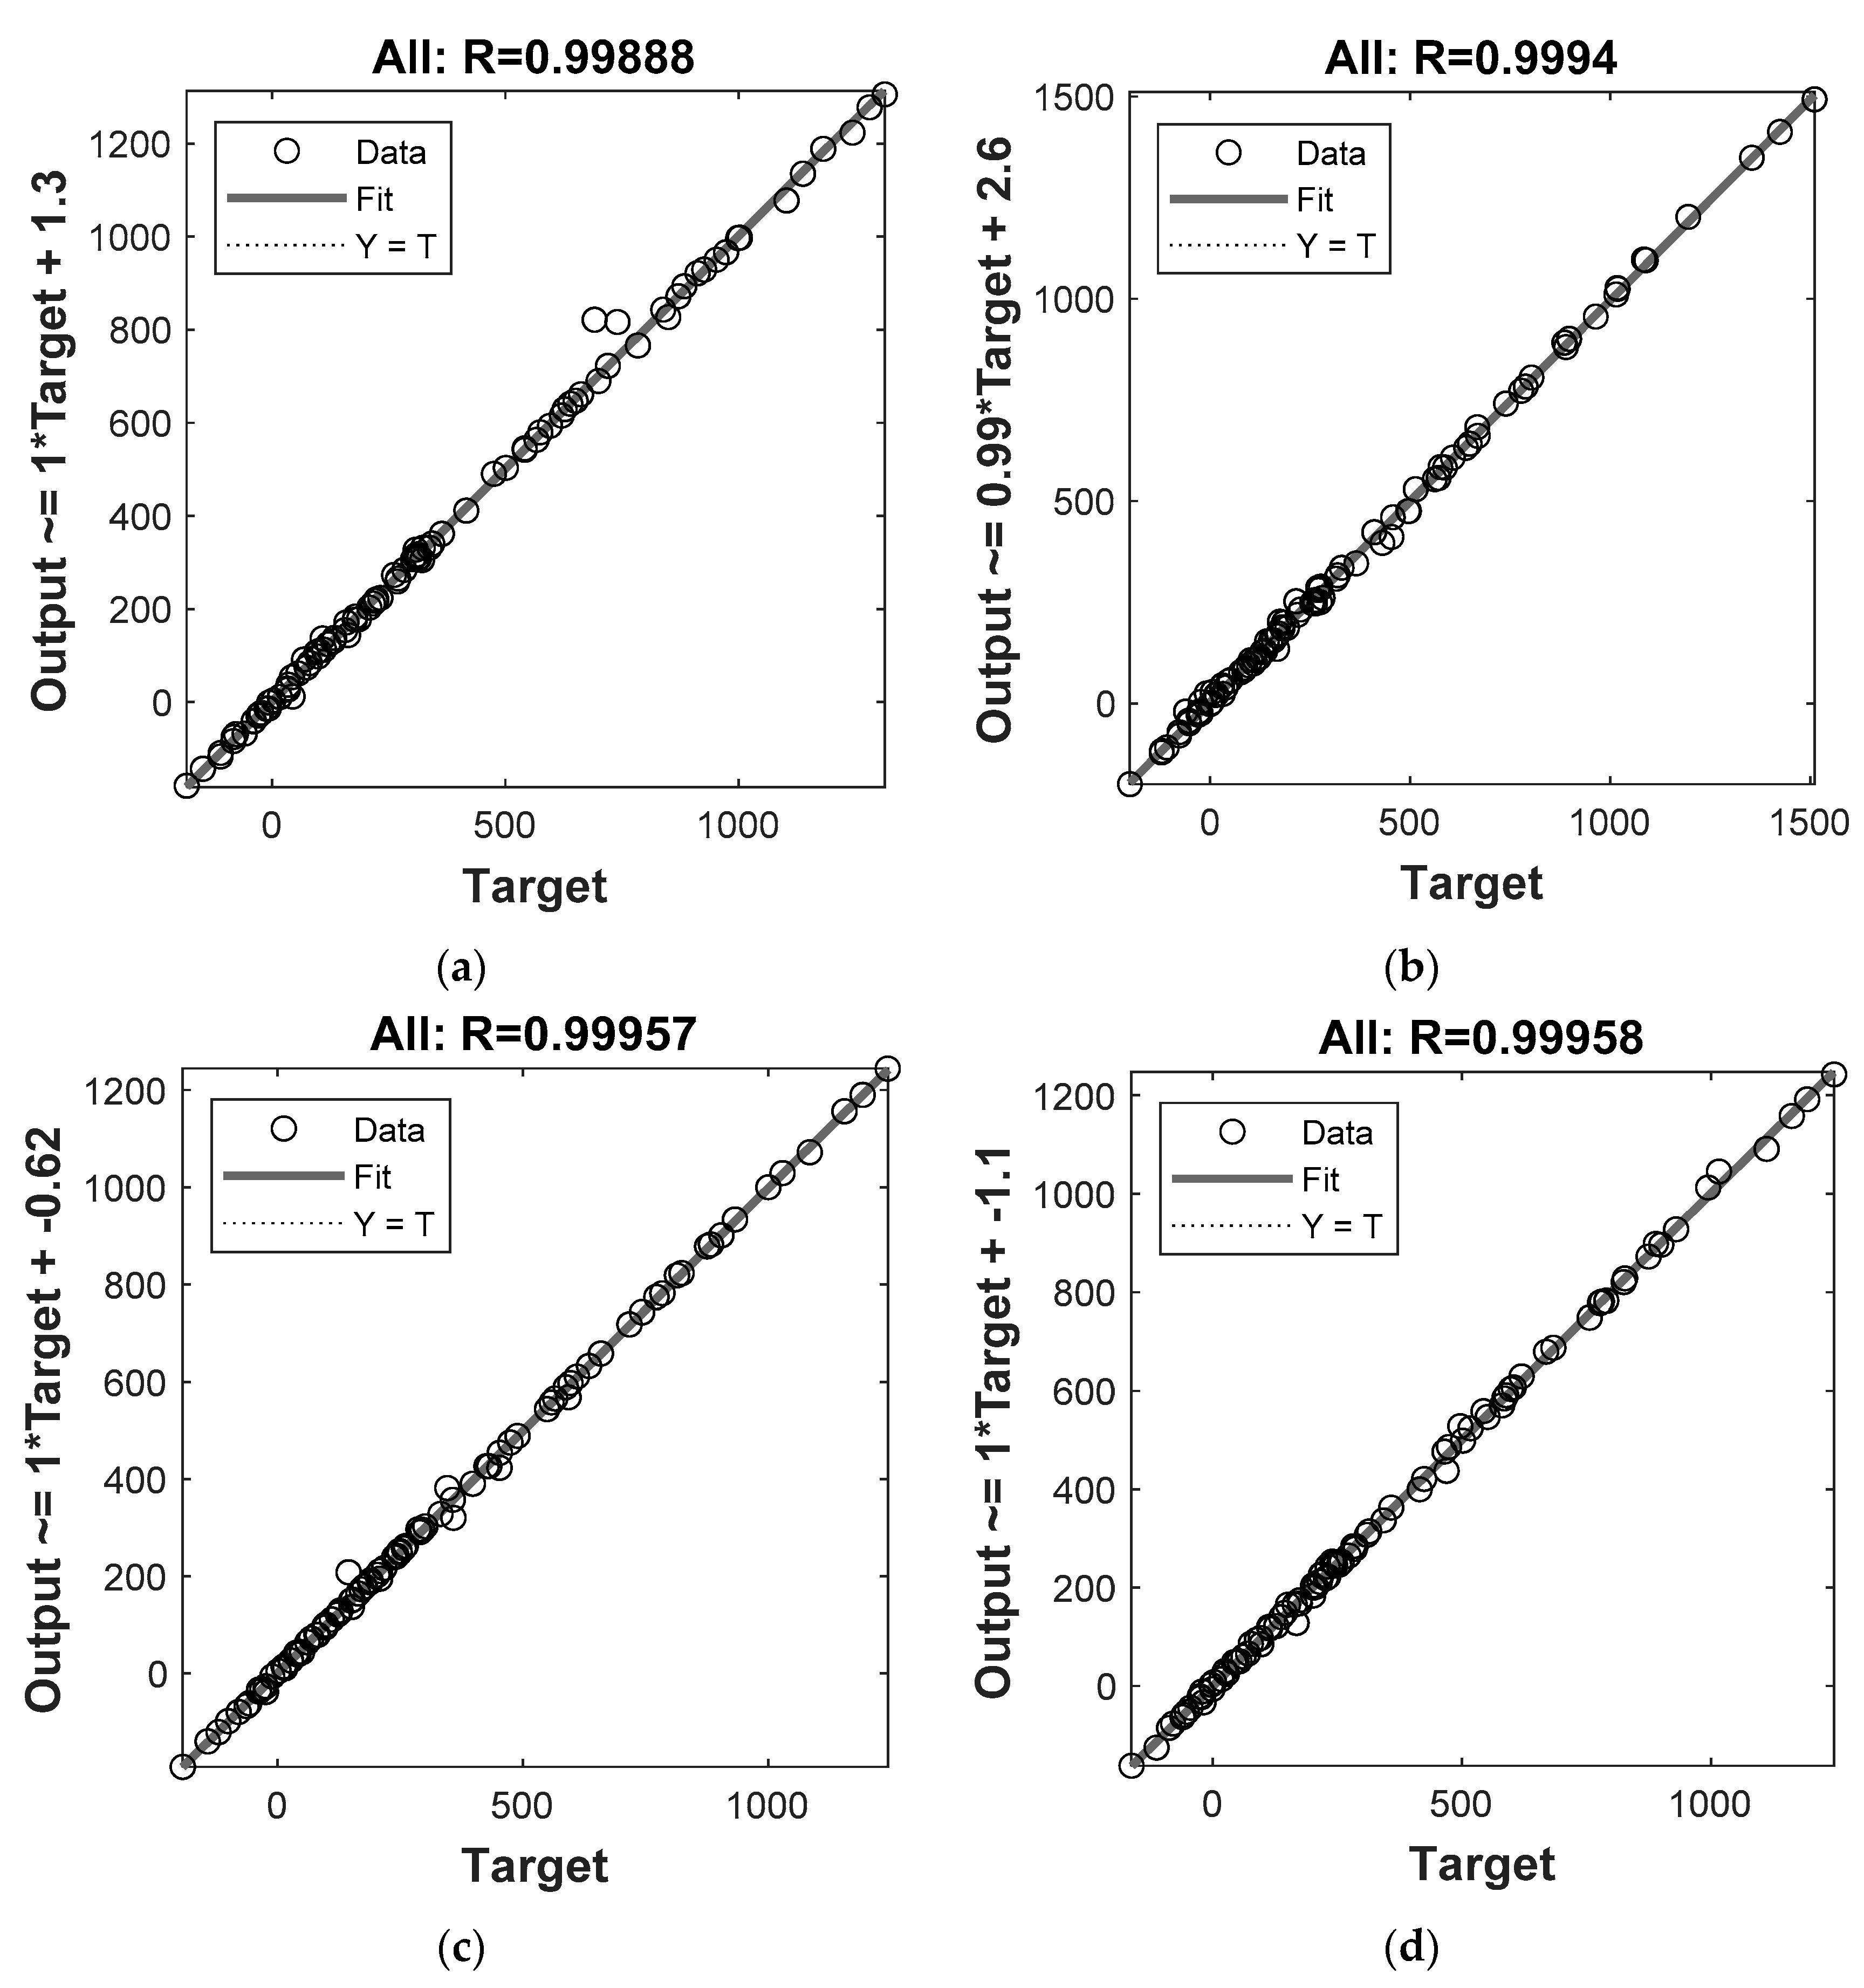
The wind tunnel experimental data of full state points were imported into Matlab for collation, and the correspondence between the independent variables (V, AOA, f) and the dependent variables (L, T, My) was established by using the Neural Network Fitting app. The percentages of training, validation, and testing samples are 70%, 15%, and 15%, respectively. The topology of the BP is further defined, where the number of hidden neuron layers is 10 and the number of output layers is 2. Levenberg-Marquardt was chosen as a training algorithm. As shown in Figure 15, the regression coefficients R between the output values and the target values are all close to 1, indicating that the predictions of the BP neural network model are relatively accurate.
The input values of the above neural network prediction model are then interpolated to traverse as many state points as possible. The condition that the lift force is equal to the gravity, i.e., 1300 g, the thrust force is balanced with the drag force, and the pitch moment value of 0 is used to end the traversal of the state points. The output value of the neural network model is constrained to obtain the value of the independent variables that satisfy the trim states in Table 5.
.
The prediction of the trim state can provide guidance for the flight of the vehicle in the cruise status. By comparing the speed, angle of attack, and flapping frequency of the four wings in cruise mode, it can be found that the wing film material has almost no effect on the flapping frequency in cruise mode, while the linen material reduces the angle of attack in this condition. The reduction in the number of wing ribs effectively weakens the cruising speed and flapping frequency. After comparing the performance of the four wings, a combination of six wing ribs and linen film material was selected for the prototype assembly.
3.4. Numerical Simulation of Large-Scaled Rigid Wings at High Altitudes
Before the flight test, it is necessary to numerically simulate the flapping wing at different altitudes and adjust the flight state at high altitudes. The numerical method is mainly used to predict the effect of altitude on the trim state and power consumption. This section aims to give guidance for subsequent flight tests.
The states of the flight parameters shown in Table 6 were selected for numerical calculation. The effects of altitude, flight speed, angle of attack, and flapping frequency on lift and drag were studied by intercomparison. Table 7 shows the time-averaged aerodynamic performance results for the calculated cases presented in Table 6. In order to visually compare the differences between the eight cases, the results of the second to eighth cases are expressed as percentages of the corresponding parameters compared to the first case, i.e., the plain environment.
Figure 16a,b indicate that altitude plays a significant role in the transient force during downstrokes. As the altitude increases, the peak positive lift in the middle of the downstroke decreases considerably, while the peak negative lift in the upstroke becomes slightly larger. The drag force shows the same trend as altitude. It is also known from the periodic-averaged aerodynamic performance in Table 7 that the increment of altitude leads to a slight decrease in the lift coefficient. The absolute values of the time-averaged lift, drag, and pitching moment all decrease remarkably with increasing altitude. Specifically, when the altitude increased from 0 to 4000 m, the Re was subsequently reduced by 27.98%, and the time-averaged lift, drag, and pitching moment decreased by 33.31%, 33.08%, and 33.33%, respectively. However, the lift coefficient decreased by only 0.25%, the drag coefficient increased by only 0.10%, and the pitching moment decreased by only 0.28%. The lack of lift will be one of the most serious problems for the vehicle at high altitudes if the flight state is kept constant.
The legend of Figure 16c,d, for example, V7AOA10f4, represents the calculated case, with a wind speed of 7 m/s, an angle of attack of 10°, and a flapping frequency of 4 Hz. As can be seen from Figure 16c,d, the increment in the angle of attack can boost the transient lift throughout the cycle, but this is at the cost of increased drag and a tendency to stall. The angle of attack affects the drag mainly in the downstroke, and the trend of the transient drag can be found in the fact that when the angle of attack increases from 10° to 15°, the sudden drop at the beginning of the downstroke is eliminated. The same problem is presented in terms of the time-averaged value in Table 7, and the increase in the absolute value of the pitching moment implies an increase in power consumption. A 1/3 reduction in the angle of attack results in a 27.19%, 62.34%, and 26.56% reduction in lift, drag, and pitching moment coefficients, respectively. The increase in flight speed will significantly increase the peak positive lift during the downstroke, when the peak value of drag also increases sharply. The change in flight speed, on the contrary, has less effect during the upstroke. From the time-averaged value, the absolute values of force and pitching moment coefficients are reduced. After dimensioning, the absolute values of force, moment, and consumed power increase obviously.
In order to compensate for the decrease in thrust performance due to the reduced density, the flapping frequency of the wings needs to be increased. The adjustment of the frequency brings about a larger absolute magnitude of the peak value in the cycle. The time-averaged results obtained for the two selected frequencies (i.e., 4 and 5 Hz) are presented for comparison in Table 7. It appears that a 25% increase in frequency and the Strouhal number produce an 11.38% increase in the averaged lift coefficient and a 9.53% decrease in the averaged drag coefficient. At the same time, the pitching moment coefficient increases by 12.31%.
In general, when flapping-wing vehicles with the same weight fly at high altitudes, it is necessary to improve the flapping frequency to realize trim flight at higher flight speeds. In addition, it is worth noting that compared with sea level, the increase in flapping frequency at high altitudes will increase power consumption, so how to adjust its abnormal state at high altitudes needs further flight tests. This paper does not consider the flexible deformation of real flapping wings and the gap between the numerical model and the real model, which will affect the aerodynamic force and power consumption in forward flights to a certain extent.
3.5. Test Flight at High Altitudes
The flight test of the assembled aircraft was carried out at different altitudes. On one hand, it is to verify whether the designed wing is suitable for different altitudes; on the other hand, it is to explore the influence of altitude.
The 163 g flapping wing before weight reduction (Figure 9d) was assembled with the prototype vehicle, and flight tests were conducted at different altitudes. The lower altitude area refers to Xi’an, Shaanxi Province, where the altitude is about 500 m (Figure 17a), while the higher altitude area is Lhasa, Tibet Autonomous Region, where the altitude is about 4500 m (Figure 17b).
The flight tests of the vehicle’s load capacity and endurance were carried out in the Xi’an area. The vehicle was equipped with an inverted T-tail and the same drive method as the wind tunnel experiment mechanism. As shown in Table 8, the assembled vehicle had an empty load of ~1150 g and a maximum takeoff weight of ~1300 g. A total of approximately one hour of flight testing was successfully completed, where the capacity of the battery was 106 Wh. The environmental conditions at this time were a temperature of approximately 20 °C and a wind speed rating of 1 level.
Subsequently, the flight tests were conducted in Lhasa, with an empty load of 1100 g and the same maximum takeoff weight. The flight time was reduced by 25% to 45 min compared to the altitude of 500 m, where the temperature was 13 °C and the wind speed was level 3.
After flight tests at two altitudes, the designed flapping wing was verified to possess excellent aerodynamic performance, capable of withstanding considerable loads and endurance.
4. Conclusions
In this paper, several flapping wings have been fabricated, including four planforms (basic shape, increasing the external area of the wing, and elliptical shape), whether to attach additional materials, two numbers of wing ribs (six and seven wig ribs), and two different materials of wing film (polyester and linen materials). Wind tunnel experiments were conducted on a total of twelve wings; then, a BP neural network model was built to predict the trim state of the flapping wings. Taking into account their weight and aerodynamic performance, the most outstanding flapping wing was eventually selected, which was the one with six wing ribs, linen film material, and the planform of increasing the internal area of the wing. In addition to the above study, a transient numerical method based on the overset mesh technique was used to investigate the influence of different altitudes and different states. Finally, the flight tests of the vehicle’s load capacity and endurance were carried out in the Xi’an area and Lhasa, respectively, to verify the performance of the flapping wing.
According to the wind tunnel experimental results, the lift is mainly affected by wind speed and the angle of attack. In contrast, the major factor in changing thrust is the flapping frequency. Regardless of the planform, the lift and thrust of the flapping wings show a significant upward trend after attaching additional materials, which is at the cost of increased pitching moment and power consumption. As for the effect of the planform, the elliptical flapping wing had the greatest lift performance but also the worst thrust performance, which is the reason for not continuing the follow-up study on it. Taking all factors into account, increasing the external area of the wing had the most superior aerodynamic performance.
The design of the vehicle has demanding weight requirements, so subsequent research is necessary to reduce the weight of the flapping wing as much as possible for less loss of aerodynamic performance. For the planform of increasing the external area of the wing, the influence of the number of wing ribs and the materials of wing film were explored. The results indicated that linen film plays a slight role in lift compared to the polyester one, and the thrust at high speed is also improved. The wings with six wing ribs have noticeably better lift performance than the wings with seven wing ribs, with a slight reduction in thrust.
The trim state is predicted by the BP neural network model, and the flight parameters under the trim state of different wings are compared. The wing with an increased internal area of the wing, six wing ribs, and linen film material is the wing that makes it easier to achieve the trim state.
Flight tests were conducted at low and high altitudes, respectively, to check out the performance of the flapping wings. The results show that the flapping wings with careful parameter design can meet the requirements of load capacity and flight time and have excellent flight ability.
Author Contributions
Conceptualization, Z.Z. and D.X.; methodology, Z.Z.; software, Z.Z.; validation, Z.Z., D.X. and B.S.; formal analysis, Z.Z.; investigation, Z.Z.; resources, B.S.; data curation, Z.Z.; writing—original draft preparation, Z.Z.; writing—review and editing, D.X.; visualization, Z.Z.; supervision, D.X.; project administration, B.S.; funding acquisition, B.S. All authors have read and agreed to the published version of the manuscript.
Funding
This study was supported by the National Natural Science Foundation of China, grants No.11902103 and 52175277.
Institutional Review Board Statement
Not applicable.
Informed Consent Statement
Not applicable.
Data Availability Statement
Not applicable.
Conflicts of Interest
The authors declare no conflict of interest. The funders had no role in the design of the study, in the collection, analyses, or interpretation of data, in the writing of the manuscript, or in the decision to publish the results.
References
- Hu, H.; Kumar, A.G.; Abate, G.; Albertani, R. An experimental investigation on the aerodynamic performances of flexible membrane wings in flapping flight. Aerosp. Sci. Technol. 2010, 14, 575–586. [Google Scholar] [CrossRef]
- Paranjape, A.A.; Chung, S.J.; Hilton, H.H.; Chakravarthy, A. Dynamics and performance of tailless micro aerial vehicle with flexible articulated wings. AIAA J. 2012, 50, 1177–1188. [Google Scholar] [CrossRef] [Green Version]
- Yoon, S.; Kang, L.H.; Jo, S. Development of air vehicle with active flapping and twisting of wing. J. Bionic Eng. 2011, 8, 1–9. [Google Scholar] [CrossRef]
- Gerdes, J.; Holness, A.; Perez-Rosado, A.; Roberts, L.; Greisinger, A.; Barnett, E. Robo Raven: A flapping-wing air vehicle with highly compliant and independently controlled wings. Soft Robot. 2014, 1, 275–288. [Google Scholar] [CrossRef]
- Holness, A.E.; Bruck, H.; Gupta, S.K. Design of propeller-assisted flapping wing air vehicles for enhanced aerodynamic performance. In Proceedings of the International Design Engineering Technical Conferences and Computers and Information in Engineering Conference, Boston, MA, USA, 2–5 August 2015; American Society of Mechanical Engineers: New York, NY, USA, 2015; Volume 57137. [Google Scholar]
- Pan, E.; Chen, L.; Zhang, B.; Xu, W. A kind of large-sized flapping wing robotic bird: Design and experiments. In International Conference on Intelligent Robotics and Applications; Springer: Cham, Switzerland, 2017; pp. 538–550. [Google Scholar]
- Altshuler, D.L.; Dudley, R. The physiology and biomechanics of avian flight at high altitude. Integr. Comp. Biol. 2006, 46, 62–71. [Google Scholar] [CrossRef] [PubMed]
- Altshuler, D.L.; Dudley, R. Kinematics of hovering hummingbird flight along simulated and natural elevational gradients. J. Exp. Biol. 2003, 206, 3139–3147. [Google Scholar] [CrossRef] [Green Version]
- Altshuler, D.L.; Dudley, R.; McGuire, J.A. Resolution of a paradox: Hummingbird flight at high elevation does not come without a cost. Proc. Natl. Acad. Sci. USA 2004, 101, 17731–17736. [Google Scholar] [CrossRef] [Green Version]
- Cooper, B.A.; Ritchie, R.J. The Altitude of Bird Migration in East-Central Alaska: A Radar and Visual Study (La Altitud de la Migración de Aves en la Alaska Centro-oriental: Un Estudio Visual y de Radar). J. Field Ornithol. 1995, 66, 590–608. [Google Scholar]
- Rayner, J.M.V. Form and function in avian flight. In Current Ornithology; Springer: Boston, MA, USA, 1988; pp. 1–66. [Google Scholar]
- Norberg, U.M. Vertebrate Flight: Mechanics, Physiology, Morphology, Ecology and Evolution; Springer Science & Business Media: Cham, Switzerland, 2012. [Google Scholar]
- Rayner, J.M.; Viscardi, P.W.; Ward, S.; Speakman, J.R. Aerodynamics and energetics of intermittent flight in birds. Am. Zool. 2001, 41, 188–204. [Google Scholar] [CrossRef]
- Pennycuick, C.J. Speeds and wingbeat frequencies of migrating birds compared with calculated benchmarks. J. Exp. Biol. 2001, 204, 3283–3294. [Google Scholar] [CrossRef]
- Bishop, C.M.; Spivey, R.J.; Hawkes, L.A.; Batbayar, N.; Chua, B.; Frappell, P.B. The roller coaster flight strategy of bar-headed geese conserves energy during Himalayan migrations. Science 2015, 347, 250–254. [Google Scholar] [CrossRef] [PubMed] [Green Version]
- Hedenström, A.; Alerstam, T.; Green, M.; Gudmundsson, G.A. Adaptive variation of airspeed in relation to wind, altitude and climb rate by migrating birds in the Arctic. Behav. Ecol. Sociobiol. 2002, 52, 308–317. [Google Scholar] [CrossRef]
- Hedenström, A.; Alerstam, T.; Green, M.; Gudmundsson, G.A. A modeling approach to energy savings of flying Canada geese using computational fluid dynamics. J. Theor. Biol. 2013, 320, 76–85. [Google Scholar]
- Barber, T. Aerodynamic ground effect: A case study of the integration of CFD and experiments. Int. J. Veh. Des. 2006, 40, 299–316. [Google Scholar] [CrossRef]
- Bao, H.; Song, B.; Yang, W.; Xue, D. The function of the alula with different geometric parameters on the flapping wing. Phys. Fluids 2021, 33, 101907. [Google Scholar] [CrossRef]
- Meng, X. Ceiling effects on the aerodynamics of a flapping wing at hovering condition. Phys. Fluids 2019, 31, 051905. [Google Scholar]
- Song, J. Fly low: The ground effect of a barn owl (Tyto alba) in gliding flight. Proc. Inst. Mech. Eng. Part C J. Mech. Eng. Sci. 2021, 235, 308–318. [Google Scholar] [CrossRef]
- Sridhar, M.; Kang, C.K.; Landrum, D.B. Fluid-structure Interaction of Flexible Flapping Wings at High Altitude Conditions. In Proceedings of the AIAA Scitech 2020 Forum, Orlando, FL, USA, 6–10 January 2020; p. 1781. [Google Scholar]
- Sridhar, M.; Pohly, J.A.; Kang, C.K.; Landrum, D.B.; Lee, T.; Aono, H. Effects of Vein Structures on Fluid-structure Interaction of Flexible Flapping Wings at High Altitudes. In Proceedings of the AIAA Scitech 2021 Forum, Online, 19–21 January 2021. [Google Scholar]
- Beaumont, F.; Murer, S.; Bogard, F.; Polidori, G. Aerodynamics of a flapping wing as a function of altitude: New insights into the flight strategy of migratory birds. Phys. Fluids 2021, 33, 127118. [Google Scholar] [CrossRef]
- Heathcote, S.; Wang, Z.; Gursul, I. Effect of spanwise flexibility on flapping wing propulsion. J. Fluid Struct. 2008, 24, 183. [Google Scholar] [CrossRef]
- Liu, H. Integrated modeling of insect flight: From morphology, kinematics to aerodynamics. J. Comput. Phys. 2009, 228, 439. [Google Scholar] [CrossRef] [Green Version]
Figure 1.
Measurement of wing forces and moments.

Figure 2.
E378 airfoil: (a) airfoil profile; (b) additional materials cut from EPP blocks.

Figure 3.
Flapping wing with each part marked.

Figure 4.
Complete flapping cycle of rotation around the x-axis.

Figure 5.
Mesh strategy: (a) background mesh, (b) component mesh, and (c) mesh details.

Figure 6.
Comparison of thrust coefficient loops between the experiment and CFD simulations.

Figure 7.
Validation of mesh quantity: (a) comparison of transient lift and (b) comparison of transient drag.
Figure 7.
Validation of mesh quantity: (a) comparison of transient lift and (b) comparison of transient drag.

Figure 8.
Validation of time step size: (a) comparison of transient lift and (b) comparison of transient drag.
Figure 8.
Validation of time step size: (a) comparison of transient lift and (b) comparison of transient drag.

Figure 9.
Flapping wings used in experiment: (a) basic planform + 7 wing ribs + additional material, (b) increasing the external area of the wing + 7 wing ribs + additional material, (c) increasing the external area of the wing + 7 wing ribs + additional material + oblique rod setback, (d) increasing the internal area of the wing + 7 wing ribs + additional material, and (e) elliptical shape + 6 wing ribs.

Figure 10.
The time-averaged lift coefficient (a), thrust coefficient (b), and pitching moment coefficient (c) of the first eight wings as a function of the Reynolds number and the Strouhal number, respectively.
Figure 10.
The time-averaged lift coefficient (a), thrust coefficient (b), and pitching moment coefficient (c) of the first eight wings as a function of the Reynolds number and the Strouhal number, respectively.

Figure 11.
The periodic-averaged lift (a,g), thrust (b,h), and pitching moment (c,i) of the first eight wings as a function of wind speed (V) and flapping frequency, respectively, plus the influence of the angle of attack on the corresponding coefficient (d–f).
Figure 11.
The periodic-averaged lift (a,g), thrust (b,h), and pitching moment (c,i) of the first eight wings as a function of wind speed (V) and flapping frequency, respectively, plus the influence of the angle of attack on the corresponding coefficient (d–f).

Figure 12.
Four types of flapping wings with the internal area of the wing increased for the experiment: (a) 6 wing ribs + wing film material of polyester, (b) 6 wing ribs + wing film material of linen, (c) 7 wing ribs + wing film material of polyester, and (d) 7 wing ribs + wing film material of linen.

Figure 13.
The time-averaged lift coefficient (a), thrust coefficient (b), and pitching moment coefficient (c) of the last four wings as a function of the Reynolds number and the Strouhal number, respectively.
Figure 13.
The time-averaged lift coefficient (a), thrust coefficient (b), and pitching moment coefficient (c) of the last four wings as a function of the Reynolds number and the Strouhal number, respectively.

Figure 14.
The periodic-averaged lift (a,g), thrust (b,h), and pitching moment (c,i) of the last four wings as a function of wind speed (V), attack angle, and flapping frequency, respectively, plus the influence of the angle of attack on the corresponding coefficient (d–f).
Figure 14.
The periodic-averaged lift (a,g), thrust (b,h), and pitching moment (c,i) of the last four wings as a function of wind speed (V), attack angle, and flapping frequency, respectively, plus the influence of the angle of attack on the corresponding coefficient (d–f).

Figure 15.
Neural network training regression (plot regression): (a) 6 wing ribs + wing film material of polyester, (b) 6 wing ribs + wing film material of linen, (c) 7 wing ribs + wing film material of polyester, and (d) 7 wing ribs + wing film material of linen.
Figure 15.
Neural network training regression (plot regression): (a) 6 wing ribs + wing film material of polyester, (b) 6 wing ribs + wing film material of linen, (c) 7 wing ribs + wing film material of polyester, and (d) 7 wing ribs + wing film material of linen.

Figure 16.
Comparison of transient lift and thrust: different altitudes(a,b), different flight states at 4000 m altitude (c,d).
Figure 16.
Comparison of transient lift and thrust: different altitudes(a,b), different flight states at 4000 m altitude (c,d).

Figure 17.
Flight tests in different regions: (a) Xi’an, Shaanxi Province, and (b) Lhasa, Tibet Autonomous Region.
Figure 17.
Flight tests in different regions: (a) Xi’an, Shaanxi Province, and (b) Lhasa, Tibet Autonomous Region.


Table 1.
The ranges of the experimental parameters for the wind tunnel test.
| Experimental Parameter | Value |
|---|---|
| Wind speed (m/s) | 4.5, 5.5, 6.5, 7.5 |
| Flapping frequency (Hz) | 2, 3, 4 |
| Flapping amplitude (°) | 45 |
| Angle of attack (°) | 0, 5, 10, 15, 20 |
Table 2.
Geometrical characteristics of tested flapping wings.
| Planforms | Film Material | Num of Ribs | Semispan(m) | Additional Material | |
|---|---|---|---|---|---|
| 1st |  | Polyester | 7 | 0.8 | ✓ |
| 2nd |  | Polyester | 7 | 0.75 | ✓ |
| 3rd | ✕ | ||||
| 4th |  | Polyester | 7 | 0.757 | ✓ |
| 5th | ✕ | ||||
| 6th |  | Polyester | 7 | 0.8 | ✓ |
| 7th | ✕ | ||||
| 8th |  | Polyester | 6 | 0.75 | ✕ |
| 9th |  | Polyester | 6 | 0.8 | ✕ |
| 10th |  | Linen | 6 | 0.8 | ✕ |
| 11th |  | Polyester | 7 | 0.8 | ✕ |
| 12th |  | Linen | 7 | 0.8 | ✕ |
Table 3.
Air density, dynamic viscosity, temperature, and Reynolds number at different altitudes.
| Temperature (K) | Reynolds Number (Re) | |||
|---|---|---|---|---|
| 0 | 1.225 | 288.15 | ||
| 1 | 1.112 | 281.65 | ||
| 2 | 1.006 | 275.15 | ||
| 3 | 0.909 | 268.65 | ||
| 4 | 0.819 | 262.15 |
Table 4.
Mesh magnitudes of three meshes.
| Component Cells | Background Cells | Wing Surface Cells | Total Cells | |
|---|---|---|---|---|
| Coarse mesh | 7376 | |||
| Medium mesh | 19490 | |||
| Fine mesh | 40521 |
Table 5.
The value of the independent variables that satisfy the trim state.
| Wind Speed | Attack Angle | Flapping Frequency | Re | St | |
|---|---|---|---|---|---|
| 9th | 7.5 | 14.3 | 3.6 | 137,296 | 0.1469 |
| 10th | 8.2 | 10.4 | 3.7 | 150,111 | 0.1381 |
| 11th | 9 | 12.9 | 4.5 | 164,756 | 0.1530 |
| 12th | 8.8 | 11.7 | 4.5 | 161,094 | 0.1565 |
Table 6.
Numerically calculated flight parameter states.
| Case | Altitudes (m) | Speeds (m/s) | Flapping Frequencies (Hz) | Angle of Attack (°) | Re | St |
|---|---|---|---|---|---|---|
| 1 | 0 | 7 | 4 | 15 | 127,470 | 0.1749 |
| 2 | 1000 | 7 | 4 | 15 | 117,785 | 0.1749 |
| 3 | 2000 | 7 | 4 | 15 | 108,527 | 0.1749 |
| 4 | 3000 | 7 | 4 | 15 | 99,933 | 0.1749 |
| 5 | 4000 | 7 | 4 | 15 | 91,805 | 0.1749 |
| 6 | 4000 | 10 | 4 | 15 | 131,150 | 0.1224 |
| 7 | 4000 | 7 | 4 | 10 | 91,805 | 0.1749 |
| 8 | 4000 | 7 | 5 | 10 | 91,805 | 0.2186 |
Table 7.
The periodic-averaged aerodynamic performance of the eight states in Table 6.
Table 7.
The periodic-averaged aerodynamic performance of the eight states in Table 6.
| Case | P | ||||||
|---|---|---|---|---|---|---|---|
| 1 | 1.35075 | 0.24894024 | −0.80316 | 1726.98 | 318.278 | −4.1075 | 103.2327 |
| 2 | 99.94% | 100.001% | 99.94% | 90.72% | 90.77% | 90.72% | 90.72% |
| 3 | 99.85% | 99.98% | 99.85% | 82.00% | 82.11% | 82.00% | 82.00% |
| 4 | 99.83% | 100.08% | 99.81% | 74.08% | 74.26% | 74.06% | 74.06% |
| 5 | 99.75% | 100.10% | 99.72% | 66.69% | 66.92% | 66.67% | 66.67% |
| 6 | 82.26% | 89.13% | 81.19% | 112.24% | 121.62% | 110.78% | 110.78% |
| 7 | 72.63% | 37.70% | 73.24% | 48.56% | 25.20% | 48.96% | 48.96% |
| 8 | 80.90% | 34.10% | 82.25% | 54.09% | 22.80% | 54.99% | 68.74% |
Table 8.
Flight data at different altitudes.
| Altitude (m) | No Load (g) | Max. Load (g) | Time (min) | Trim State (AOA/V/f) | Power Consumption (W) | Re | St |
|---|---|---|---|---|---|---|---|
| 500 | 1150 | 150 | 60 | 8°/7 m/s/5 Hz | 110 | 122,541 | 0.2186 |
| 4500 | 1100 | 200 | 45 | 10°/7 m/s/6 Hz | 140 | 87,941 | 0.2623 |
Publisher’s Note: MDPI stays neutral with regard to jurisdictional claims in published maps and institutional affiliations. |
© 2022 by the authors. Licensee MDPI, Basel, Switzerland. This article is an open access article distributed under the terms and conditions of the Creative Commons Attribution (CC BY) license (https://creativecommons.org/licenses/by/4.0/).
Share and Cite
MDPI and ACS Style
Zhu, Z.; Song, B.; Xue, D. Design and Verification of Large-Scaled Flapping Wings for High Altitude Environment. Appl. Sci. 2022, 12, 5140. https://0-doi-org.brum.beds.ac.uk/10.3390/app12105140
AMA Style
Zhu Z, Song B, Xue D. Design and Verification of Large-Scaled Flapping Wings for High Altitude Environment. Applied Sciences. 2022; 12(10):5140. https://0-doi-org.brum.beds.ac.uk/10.3390/app12105140
Chicago/Turabian StyleZhu, Zhichao, Bifeng Song, and Dong Xue. 2022. "Design and Verification of Large-Scaled Flapping Wings for High Altitude Environment" Applied Sciences 12, no. 10: 5140. https://0-doi-org.brum.beds.ac.uk/10.3390/app12105140
Note that from the first issue of 2016, this journal uses article numbers instead of page numbers. See further details here.