Review

Energy Use in Greenhouses in the EU: A Review Recommending Energy Efficiency Measures and Renewable Energy Sources Adoption

by
Bas Paris
1,*,
Foteini Vandorou
2,
Athanasios T. Balafoutis
2,
Konstantinos Vaiopoulos
2,
George Kyriakarakos
2,
Dimitris Manolakos
1 and
George Papadakis
1
1
Department of Natural Resources and Agricultural Engineering, Agricultural University of Athens, 75 Iera Odos Str., 11855 Athens, Greece
2
Institute of Bio-Economy & Agro-Technology, Centre of Research & Technology Hellas, Dimarchou Georgiadou 118, 38333 Volos, Greece
*
Author to whom correspondence should be addressed.
Submission received: 21 March 2022 / Revised: 30 April 2022 / Accepted: 16 May 2022 / Published: 20 May 2022

Abstract

:
This study conducts a review of energy use in the EU greenhouse agriculture sector. The studies presented illustrate that energy use in greenhouses is varied and generally dependent on fossil sources. High energy systems, which are more dominant in northern Europe, are generally heavily climate controlled and energy use is dominated by heating and cooling processes, while low energy systems, which are dominant in southern Europe, show a mixture of energy uses including heating, cooling, irrigation, lighting, fertilisers, and pesticides. Our review also provides a discussion of energy efficiency measures and renewable energy sources adoption for greenhouse production. Finally, our review indicates that accurate and reliable studies on energy use in greenhouse production are scarce and fragmented and that a range of differing methodologies are currently used to estimate on-farm energy use. The development of a comprehensive methodology and categorisation for measuring energy use in greenhouse agricultural production would, in our view, catalyse further studies in this sector, considerably improve our understanding of energy use in greenhouses and support the green transition. Based on this, this paper proposes a basic framework for measuring energy use in greenhouse agriculture.

1. Introduction

In the EU, greenhouse structure and cultivation show considerable variation, ranging from complex energy intensive structures that heavily regulate the indoor climate to simple structures that resemble open-field practices. This variation is dependent on a variety of factors, including, but not limited to, local climatic and socio-economic conditions [1]. According to the FAO, an estimated 405,000 hectares of greenhouses are spread throughout the EU [2], a figure that includes both glass and plastic covered structures. By contrast, data from Eurostat provide an overview of the area of vegetables, flowers and permanent crops under glass in the EU-27 from 2005–2013, highlighting that there are around 135,000 hectares of glass covered (excluding plastic covered) greenhouse cultivation in the EU [3].
Greenhouse agricultural production is generally seen as one of the most intensive parts of agricultural production [4,5] as compared to energy use in open-field agriculture [6], however the role of greenhouse agriculture in the European food systems is not well-documented [1], while a small number of studies have been conducted that document energy use in greenhouse production. In 2013, the European Commission published a report on greenhouse production, however this only includes only some minor energy use statistics [5]. Campioti et al. (2012) investigate some of the energy parameters in the greenhouse sector in four European countries [7]. Mohamed et al. (2017) investigate the energy profile of greenhouses in Cyprus [8], while Wageningen University releases an annual report monitoring energy use within the Dutch greenhouse sector [9]. Regarding geography, the Netherlands in particular has the largest and most relevant energy use data available [9]. Nikolaou et al. (2021) investigates energy parameters in greenhouse tomato and cucumber production in semiarid Mediterranean areas [10]. Other studies that look at agricultural production or energy use in the agricultural sector generally provide no data on energy use in greenhouses specifically [11].
In this context, where it is clear that greenhouse cultivation is a significant energy consumer but there is relatively little data available, and taking into account the implementation of EU climate targets and its farm to fork strategy in agriculture, it is apparent that there is a need to move towards sustainable production practices. In order to understand the future of greenhouse production in the EU and how they can contribute to a sustainable transformation of our agricultural systems, it is necessary to understand the energy use in greenhouses. As such, the goal of this paper is to provide an overview of the available data on energy use in the EU and to discuss significant transitions occurring in the sector. The rest of this section provides a brief overview of greenhouses in the EU and their energy use parameters, Section 2 discusses the methodology, Section 3 provides the results presenting available energy use data for greenhouse cultivation in the EU, and Section 4 provides an overall discussion, potential future scenarios, and a proposed framework for measuring energy use in greenhouse agriculture.

Greenhouses in the EU and Their Energy Use Parameters

Greenhouses are complex structures which aim to create ideal conditions for plant growth and production throughout the year, by controlling temperature, humidity, water, light, and carbon dioxide [12]. There are different types of greenhouses currently in operation in the EU, ranging from intensive structures that heavily regulate the internal environment to those that are solely plastic sheet covered structures in which production inputs are similar to open-field crops [5]. Over the last two decades, the technology associated with the construction of and agricultural production within advanced greenhouses has progressed considerably with significant changes in design, materials, agricultural techniques, etc. Consequently, the potential yield in ‘technology intensive’ greenhouses has seen dramatic increases, for instance, what is considered a ‘good’ tomato yield has increased from 100 tonnes per hectare to 600 tonnes per hectare in recent years [13].
There are a variety of options for heating a greenhouse, including air heaters, central heating through pipes, boilers, cogeneration, natural gas, electricity, heat pumps [14]. Energy sources vary, with small systems often running on direct fossil fuels, such as gas or oil, while larger systems may run on cogeneration/combined heat and power from power plants, or geothermal heat pumps. It is important to note that a large proportion of greenhouses, especially in Southern Europe, are not heated, while in temperate and northern European countries greenhouses often have large heating requirements. Conversely, there are a number of options for cooling a greenhouse, including shading, whitening, natural, mechanical or evaporative cooling/ventilation. One or a combination of these are utilised in areas that have high average temperatures for parts of the year [5].
All production in greenhouses requires irrigation for which there are a variety of systems, generally powered through fossil fuels directly or via the electricity network [5]. Other areas that consume direct energy include lighting and machinery use. Greenhouses generally are also dependent on a number of indirect sources of energy; energy that is not directly used in agricultural production but can clearly be assigned to the agricultural sector. Indirect energy use includes energy use associated with the building of greenhouses and greenhouse machinery, as well as energy embedded in the production of fertilizers and pesticides [15].
There are a number of trends and parameters that affect the energy inputs of greenhouses. Multiple studies highlight that older systems are generally less energy efficient and require higher energy inputs per output [16,17]. Geography and climate conditions also clearly play an important role [18], while the type and philosophy of agricultural practices and techniques-conventional, organic, conservation, soilless cultivation, hydroponic, etc., employed in greenhouses are also likely to impact energy inputs. In practice, greenhouse systems in the EU vary significantly ranging from commercial large-scale systems to small-scale subsistence systems and their design and structure varies considerably, having large implications on energy use and energy sources [5].
The extent of greenhouse production per country is not well documented. For most EU countries, other than the Netherlands, there are rough estimates on the extent of greenhouse cultivation, in particular regarding greenhouses with a low technological profile. Eurostat used to provide an indicator on the area of vegetables, flowers, and permanent crops under glass EU-27 (ha), this has now been discontinued. Based on the data presented in Table 1, from Eurostat, the countries covered in this study cover around 72% of the total area under glass in the EU. In addition, in order to overcome the general lack of detailed available information on greenhouse production this study focused on the ‘hubs’ that are part of the Horizon AgroFossilFree project as this allowed local agricultural experts in each country to provide us with relevant data.

2. Materials and Methods

2.1. Search Strategy and Selection Process

This study conducts a review of the available literature on energy use data in greenhouse cultivation within the EU. Our search strategy used a key word search of Google Scholar and SCOPUS and the selection criteria for a paper’s inclusion in this study were: the presentation of energy use data based on either LCA methodologies or surveys, whether they were peer-reviewed, and whether they were published by well-respected journals or institutions. In some cases, data from reports were used if they were extensively cited in existing literature. The methodology, relevancy and accuracy of each study was evaluated for relevancy and accuracy and the wider project partners of the AgroFossilFree consortium [20]. Overall, 24 relevant published articles and reports were located in the first part of the search process. Of these, after the evaluation process, 13 were discarded due to methodological issues. From the remaining 11 studies, data were extracted and used for this review.
For this study, energy use was defined according to operations and included direct energy uses—on-farm operations, heating and cooling, lighting, irrigation—and indirect energy uses—energy embedded in the production of fertilizers and pesticides. Energy assigned to the production and establishment of agricultural infrastructure, such as agricultural machinery and greenhouse constructions, was not included due to difficulties associated with accurately measuring and reporting on this and most studies do not provide data on this. This is mainly because agricultural infrastructure is often in use for multiple decades and undergoes a variety of production processes which makes it difficult to accurately assign a yearly energy use values to these components. These energy input data for greenhouse production were extracted from each study and compiled and compared to existing studies for verification.
The research questions that guided our research included: what are the specific energy sources in greenhouse production processes? What are the energy needs for different types (high intensive to low intensive) greenhouses? How do the energy needs of greenhouses vary depending on geography and climate across the EU?

2.2. Types of Greenhouses

It is widely accepted that significant variations in the energy intensity and overall energy use between greenhouses exist and are dependent on a variety of factors. In practice, this variation makes it difficult to collate results without further assigning greenhouses to conceptual categories. Due to this, this study divides results according to high and low energy intensity greenhouses. The benchmark employed for this is that all studies with energy inputs below a 1000 GJ/ha were assigned as low energy intensity greenhouses and everything above 1000 GJ/ha as high energy intensity greenhouses. In practice, such an approach works well for this study as all studies were either much lower or higher than 1000 GJ/ha allowing for more meaningful comparisons and is justified as it splits energy use into intensive systems that use extensive climatic control, generally energy inputs in these systems are around 8–12 times more in these systems, and non-intensive systems that implement minimal climatic control, generally energy inputs are around 8–12 times less in these systems.
In addition, it is important to note that data on the energy use in greenhouse cultivation in the EU are fragmented and that available data are extremely limited. Therefore, our results provide data on greenhouse energy use both on a country level, for which there is some data available (for The Netherlands, Italy, Spain, Germany, Ireland), and specifically for tomato production, a crop which has by far the most available data. For a more detailed breakdown of our results, please see the Appendix A.

2.3. Limitations and Bias Risk

A main risk of this study is the lack of data on energy use in greenhouse cultivation in the EU. As such, this study is dependent on a relatively small number of studies. In effect, our understanding of energy use in EU agriculture may be disproportionately influenced by these studies and in instances may not be representative of the EU as a whole. This is a crucial limitation and highlights the importance of future studies investigating energy use in greenhouses across crops and climatic conditions in the EU.
The studies that provide energy use data on greenhouses generally present data without any uncertainty attached, while there are no established standardised methodologies for accounting for energy use in greenhouses [15,21]. LCAs in greenhouse systems often employ simple yet heterogenous methodologies which render comparisons difficult [22,23,24]. In our view, in order to obtain a clearer understanding of the energy use in greenhouses in the EU, the development of standardized methodologies and terminologies for approaching the specific investigation is a prerequisite for future studies. Based on this review we discuss some of the prerequisites and framework needed for the development of such a methodology.
Furthermore, greenhouse agriculture as a term is used to refer to a wide array of production systems. In practice, this means that production systems that have little in common, except that they occur in covered structures, are labelled together. Further conceptual distinctions and categorisations, as used in this paper, would, allow for improved analysis of greenhouse production.

3. Results

3.1. Overview

The following section provides a review of energy use data for Spain, Greece, Italy, The Netherlands, and Germany, as well as according to tomato production in the EU. Overall, the data presented illustrates significant variation between varying production systems with significant ranges depending on the type of greenhouse, geographical area, and crop grown (Table 2).

3.2. Spain

Spain has the largest greenhouse sector by area in the EU with an estimated 43,964 hectares under greenhouse production and is the largest supplier of greenhouse vegetables in Europe. In total, 60% of Spain’s greenhouses (approximately 30,000 ha) are located in Almeria [25,26], which constitutes the largest concentration of greenhouses in the world. The main types of crops cultivated in these greenhouses are tomato with 26% of total area, pepper (22%), zucchini (16%), cucumber (11%), aubergine (4.5%), and green bean (3%) [27]. There is variation in the type of greenhouses, with a mixture of intensive and non-intensive greenhouses, while the average holding sizes are relatively small.
Two studies that document energy use in Spanish greenhouses were located; Baptista et al. (2012), which provides data on the heating and cooling greenhouses with tomato production [28], and Alonso and Guzman (2010), who investigate energy use in a range of Spanish production systems [22]. In Baptista et al.’s (2012) study, the greenhouses studied are heavily climatically controlled and exhibit large energy inputs (Figure 1 and Table A1), while the greenhouses covered by Alonso and Guzman (2010) are less climate-controlled and exhibit considerably—up to 150 times—less energy inputs per hectare (Figure 2 and Table A2). The largest energy use category for these greenhouses is the category ‘others,’ unfortunately the study does not provide a breakdown of what inputs/activities this refers to. In our view this category likely refers to ventilation and lighting.

3.3. Greece

In Greece, the area under greenhouse cultivation is approximately 5600 ha, which represents around 0.12% of the country’s total cultivated land area. The majority of this area, around 92%, is allocated to vegetable production, whereas the remaining 8% is allocated to the production of ornamental crops. The most common vegetable crops grown in Greek greenhouses are tomato, cucumber, and pepper. Geographically, Crete has the largest area of greenhouse production with 2166.5 ha (38.7%), followed by the Peloponnese with 1185.9 ha (21.2%) and Macedonia with 698 ha (12.5%) [29]. Around 93% of the total area are plastic covered greenhouses, whereas glasshouses are mainly used in floriculture. The limited use of glass coverage is due to two main factors; the very low mean area per greenhouse enterprise at 0.48 ha for vegetables, and the fact that the majority of the greenhouse area used for vegetables is occupied by high tunnels. Greenhouses in Greece are characterized by a relatively low level of automation. Generally, the productivity of Greek greenhouses has been shown to benefit from both heating and cooling systems. However, the cost of greenhouse heating fuel and cooling in Greece is relatively high and is a major barrier to the implementation of these systems [29].
Four studies were located that provide data on energy use in greenhouse production in Greece; De Visser et al. (2012) conduct two LCAs for low energy intensity greenhouse production [15] (Figure 3), while Kittas et al. (2014) [23], Trypanagnostopoulos et al. (2017) [30] and Vourdoubas (2015) [24] each provide data on energy use for a specific crop—tomato, lettuce, flowers—in a high energy intensity production (Figure 3 and Table A3). Figure 4 illustrates that for low energy intensive greenhouses, demand for energy inputs is spread across fertilizers, materials, irrigation, pesticide, lighting, heating, and cooling (Table A4). By contrast, in high energy intensity greenhouses, energy used for heating dominates the consumption. For both crops covered in the low energy intensity greenhouses, the energy inputs are around 250 GJ/ha, whereas in high energy intensity greenhouses they are many times higher, ranging from around 7000 GJ/ha to 11,500 GJ/ha.

3.4. Italy

The area under greenhouse cultivation in Italy is approximately 30,000 ha, with 6000 ha serving as permanent greenhouse structures [25]. The greenhouses in Italy are distributed all over the Italian peninsula with the majority, about 60%, located in southern regions. There are different types of greenhouses used, ranging from simple structures covered by plastic films to fully automated glass structures [31]. The former greenhouse type is predominant in southern regions due to favourable climatic conditions, which allow for the use of simple and inexpensive structures for winter cropping of warm season species, and are usually equipped with simple heating systems. On the other hand, greenhouses situated in the northern areas of Italy consist, mostly, of structures covered with glass. It is calculated that approximately 20–30% of the Italian greenhouses are equipped with heating and cooling systems [32]. Due to favourable growing conditions and reduced costs, greenhouse cultivation has been moving southward. The cultivation of pot plants occurs in glasshouses and is generally found in northern regions [31]. The Italian greenhouse sector is of considerable economic importance for the national agricultural systems and a significant energy consumer. Even though Italian greenhouse systems only represent around 0.032% of the EU UAA, Italian greenhouse crops account for a turnover of more than EUR 3 billion [33], and according to the Italian Ministry of Economy and Finance, heating for greenhouses powered by fuel accounts for 0.72 millions of tonnes of oil equivalent (Mtoe), which is equivalent to nearly 24% of the direct energy consumption in Italian agriculture, while electricity use in greenhouses accounts for only 0.02 Mtoe [25].
Data for Italy were only located for crops cultivated in low energy intensity greenhouses in central Italy (Figure 5 and Table A5). Within these data, energy use ranges between 60 GJ/ha to 140 GJ/ha and suggest that electricity accounts for around half of all energy inputs, followed by diesel at around a quarter of all energy inputs [34].

3.5. The Netherlands

In the Netherlands, 9688 ha are covered by greenhouses; around 45% of this is devoted to vegetable production, 25% to flower production, and 15% to fruit production. Production is generally intensive and yields are high, especially as compared to greenhouse production in other countries, with average production per m2 in 2019 at 50 kg for tomatoes and 68 kg for cucumbers [35]. Due to this production intensity, The Netherlands produces 21% of the peppers, 20% of the cucumbers and 17% of the tomatoes grown in Europe [36]. Dutch greenhouses are generally characterized by large permanent structures that are heavily climate controlled, with large scale heating, cooling, lighting, and ventilation facilities. In recent years, large transitions have occurred that have started to improve efficiency and dramatically cut the amounts of inputs used, such as water and pesticides.
According to the annual publication of the energy monitor of the Dutch greenhouse sector, the total current energy consumption in the Dutch greenhouse sector stands at 106.8 petajoules (PJ) [9]. Most energy consumption is associated with heating, accounting for around 74% of the total energy inputs, and electricity at 26%. Overall, energy use is dominated by energy from natural gas (accounting for 99.9% of the total fossil sources). Around 58% of electricity was produced at the greenhouses by cogeneration, while 42% was purchased. In 2019, 10 PJ (9.4%) of the energy consumed in the Dutch greenhouse sector came from renewable sources. Energy from renewable sources has been growing rapidly in recent years and increased by 35% between 2017 and 2018. In particular, sustainable (mainly geothermal) heat has been growing rapidly, a trend that is likely to continue [9].
On a per crop basis, for the studies that have detailed data, the vast majority of the total energy inputs are connected with heating, accounting for over 99% of energy use, while other inputs, such as fertilizers, are minor (Figure 6 and Table A6). It is important to note that these energy requirements are amongst the highest recorded for all greenhouses in the EU-27. The most important activities for greenhouses in the Netherlands are heating, ventilation and air circulation, cooling, humidification, irrigation, pesticides, CO2 enrichment, and others [9,37].

3.6. Germany

Data on greenhouse production in Germany is relatively scarce. Voss (2011) suggest that only 3689 hectares are covered by greenhouses, of which an estimated 80% are glass greenhouses, 15% foil, and 5% stiff plastics, while 2500 hectares are heated [38]. The main crops cultivated in the German greenhouses are tomato, cucumber, certain plants and other crops. It is important to note that most of the facilities are relatively old; 43.1% of the total number of greenhouses, which corresponds to almost 1600 ha, were built before 1982. Even though some of these facilities were upgraded to comply with the modern-day standards, most of them are still outdated and only 10.6% of the total facilities were built after 2000. Furthermore, most of the production area under glass which is specialized for vegetable crops is owned by “small” farmers. Regarding holding size, 3800 facilities are 1000 m2, almost 5600 facilities cover between 1000 m2 and 5000 m2 and the remainder of facilities are larger than 5000 m2 [38].
For Germany, Visser et al. (2012) investigates the energy consumption in greenhouses for tomato and cucumber production. The biggest share of the energy inputs is attributed to heating purposes, whereas a small portion of the energy inputs account for fertilizers (Figure 7). The available data suggest that close to 13,000 GJ/ha are consumed in the greenhouse cultivation of both crops, of which 99.6% accounts for heating purposes. According to Kuntosch et al. (2020), black coal is the largest source of energy for heating purposes followed by natural gas and renewables (Figure 8 and Table A7) [39].

3.7. Tomatoes

Figure 9 and Figure 10 provide an overview of the energy data of high and low energy intensity greenhouse tomato production. They are presented according to country and in cases where multiple data points are available for one country simple averages were calculated (Table A8 and Table A9). These data show some variations within categories, with energy inputs for high energy systems ranging from around 8000 GJ/ha in Greece to around 15,000 GJ/ha in the Netherlands. In the high energy intensity systems, the vast majority of energy inputs are associated with heating and cooling activities, while in the low energy intensity systems fertilizers are the largest energy inputs. Importantly, this illustrates that energy inputs in high energy intensive tomato production systems are around 50 times greater per hectare than in low energy intensive systems. This energy intensity translates into large differences in final yield, for instance, in the Netherlands the average tomato yield is around 50 kg/m2 while in southern Italy it is 7.6 kg/m2 [18].

4. Discussion

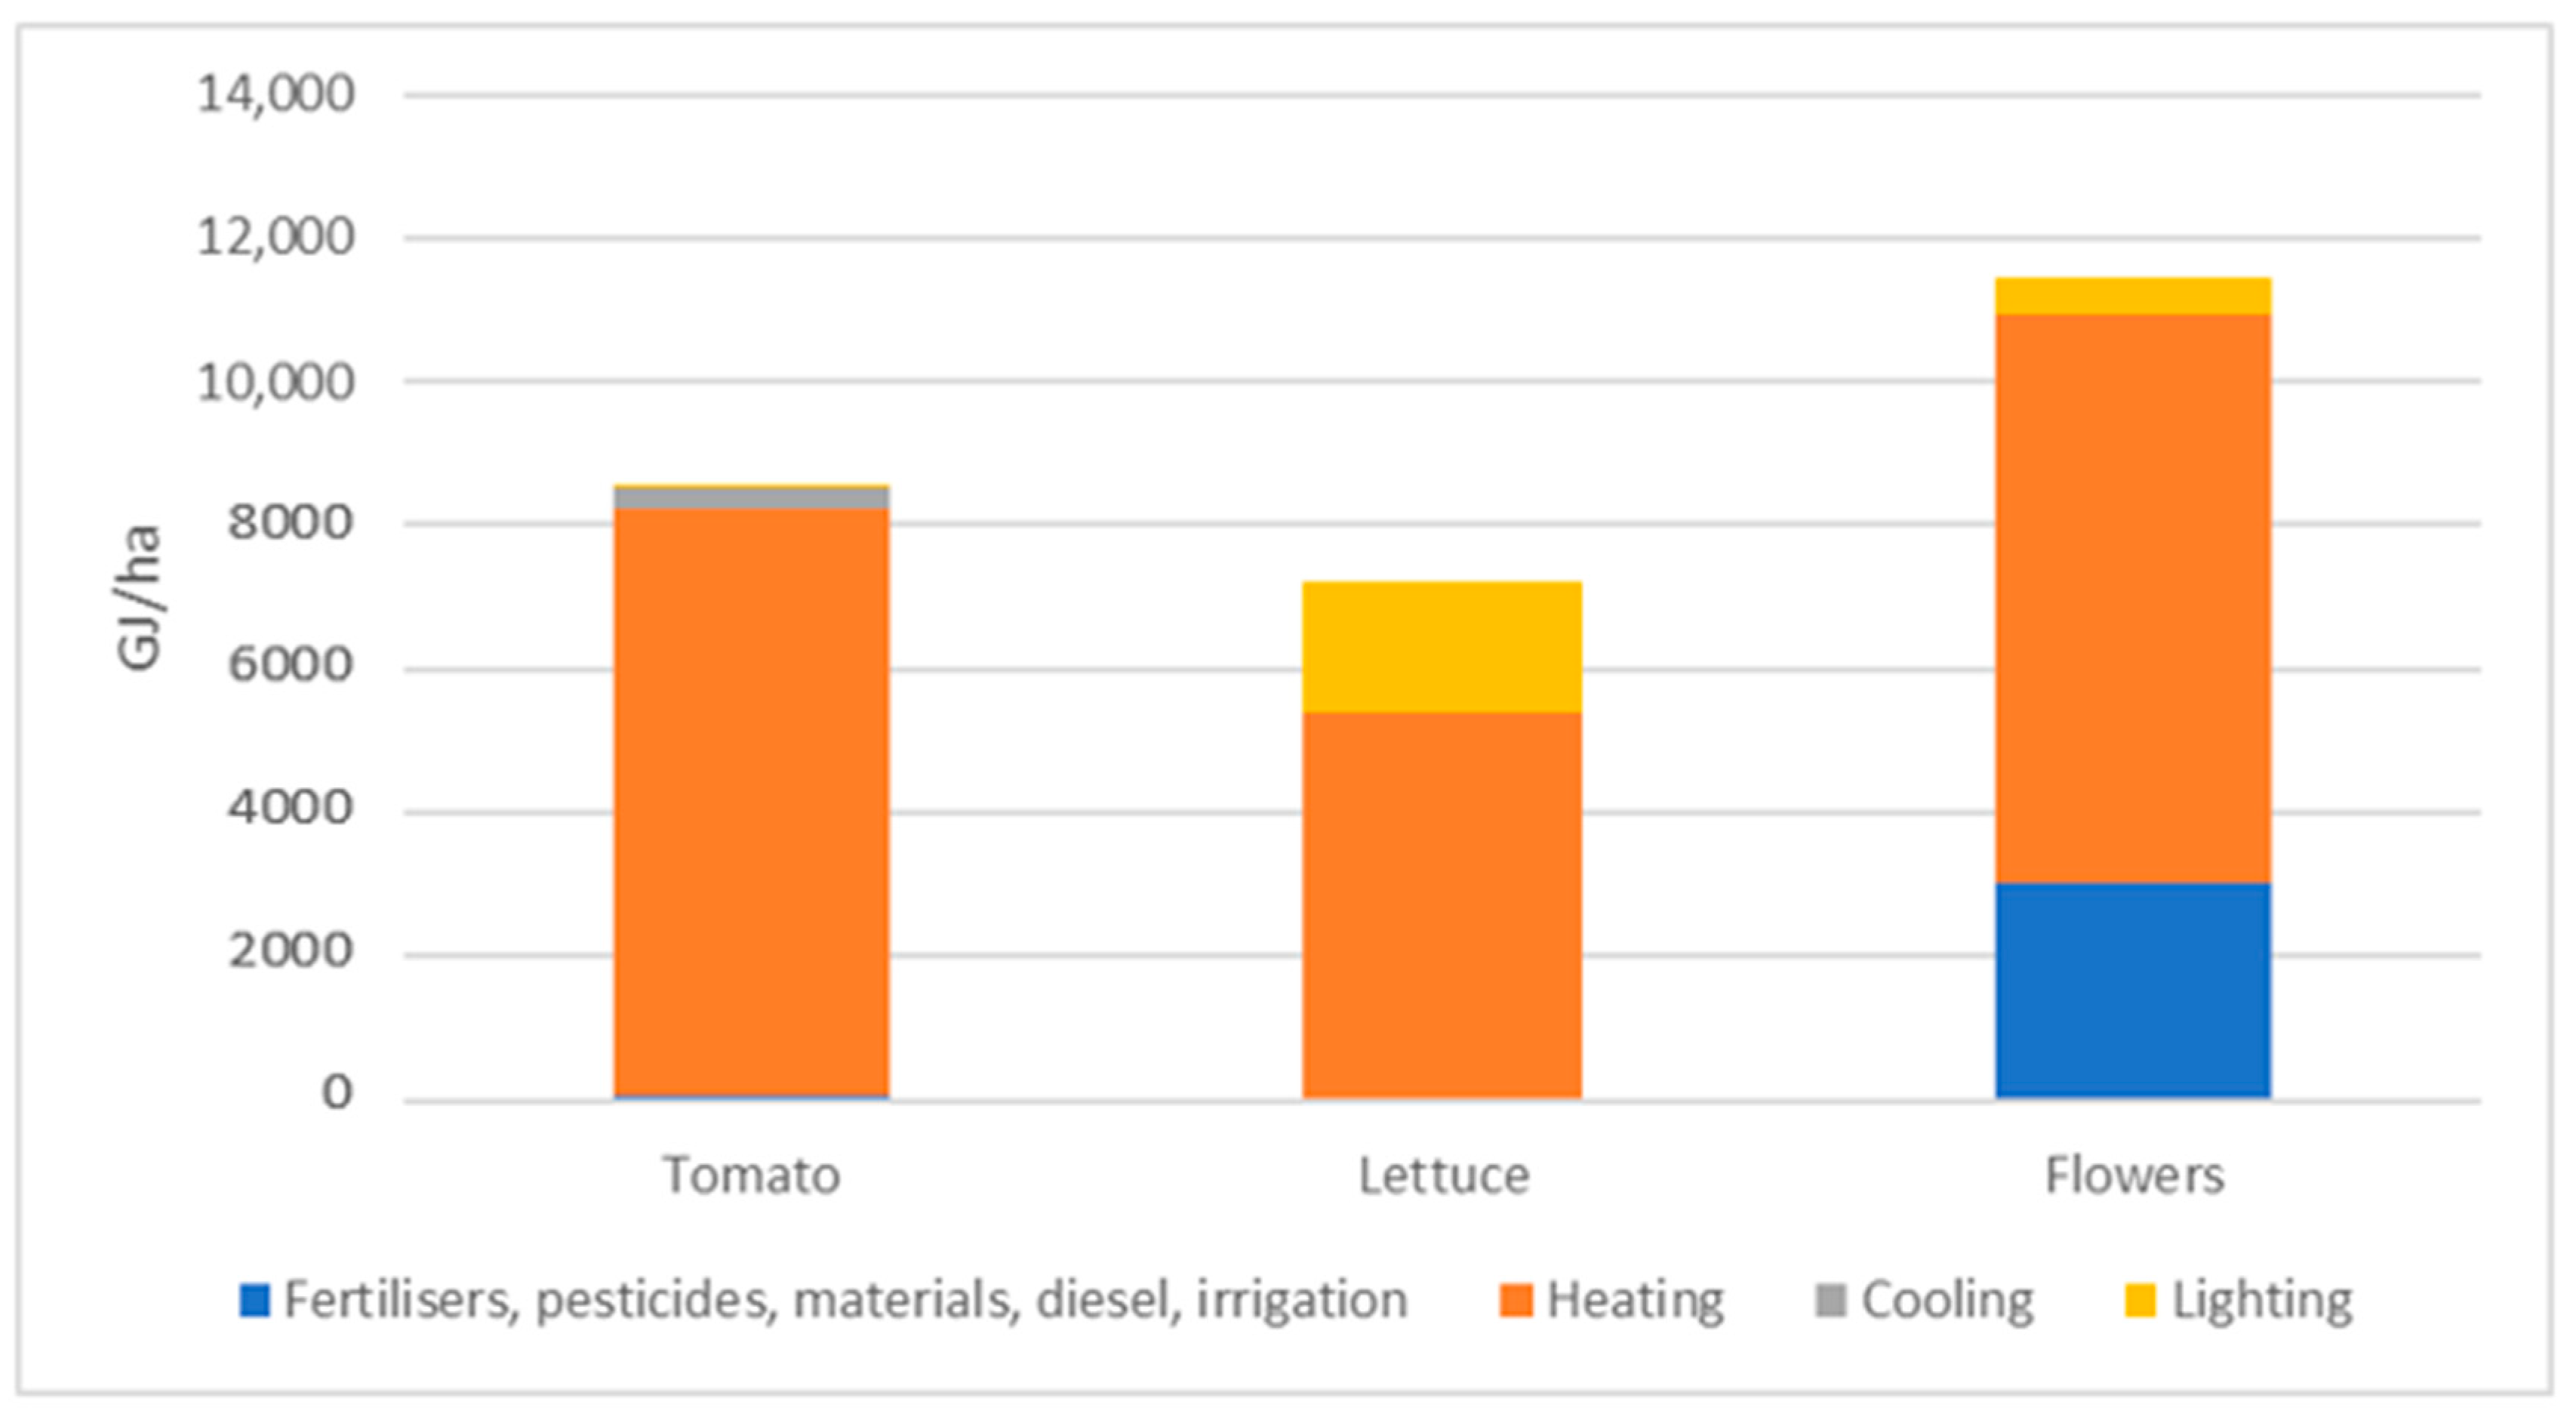
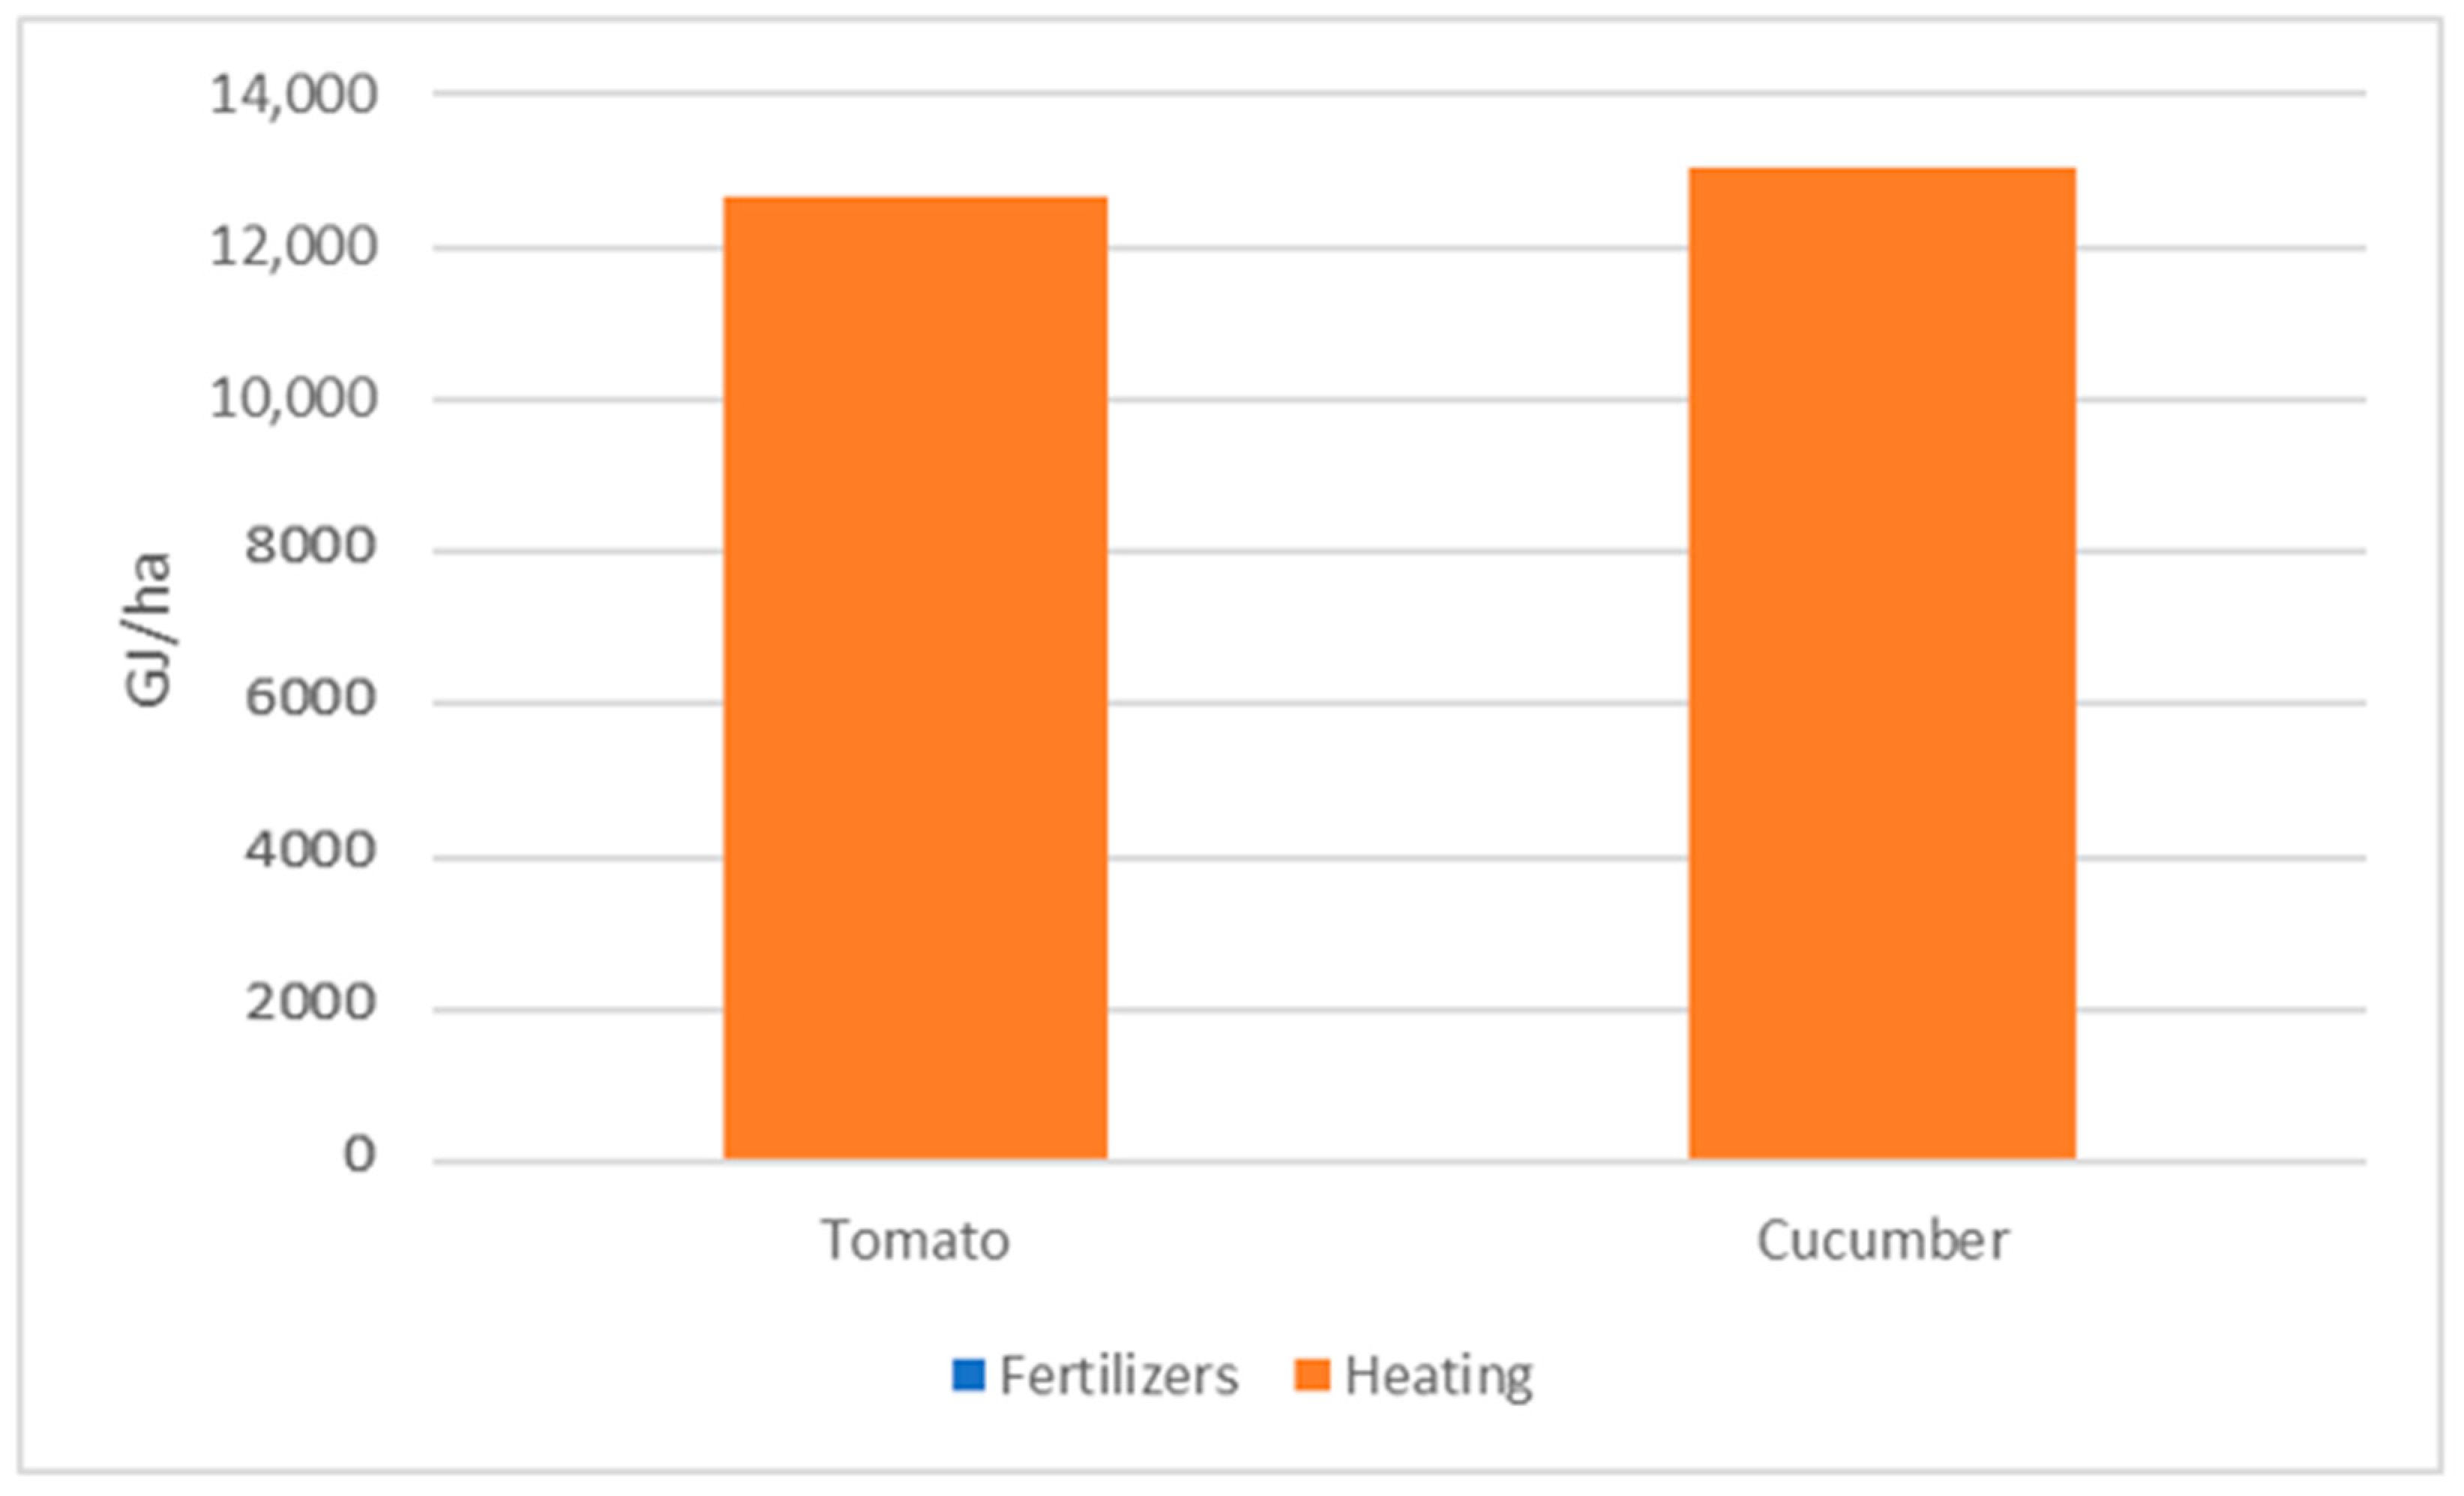
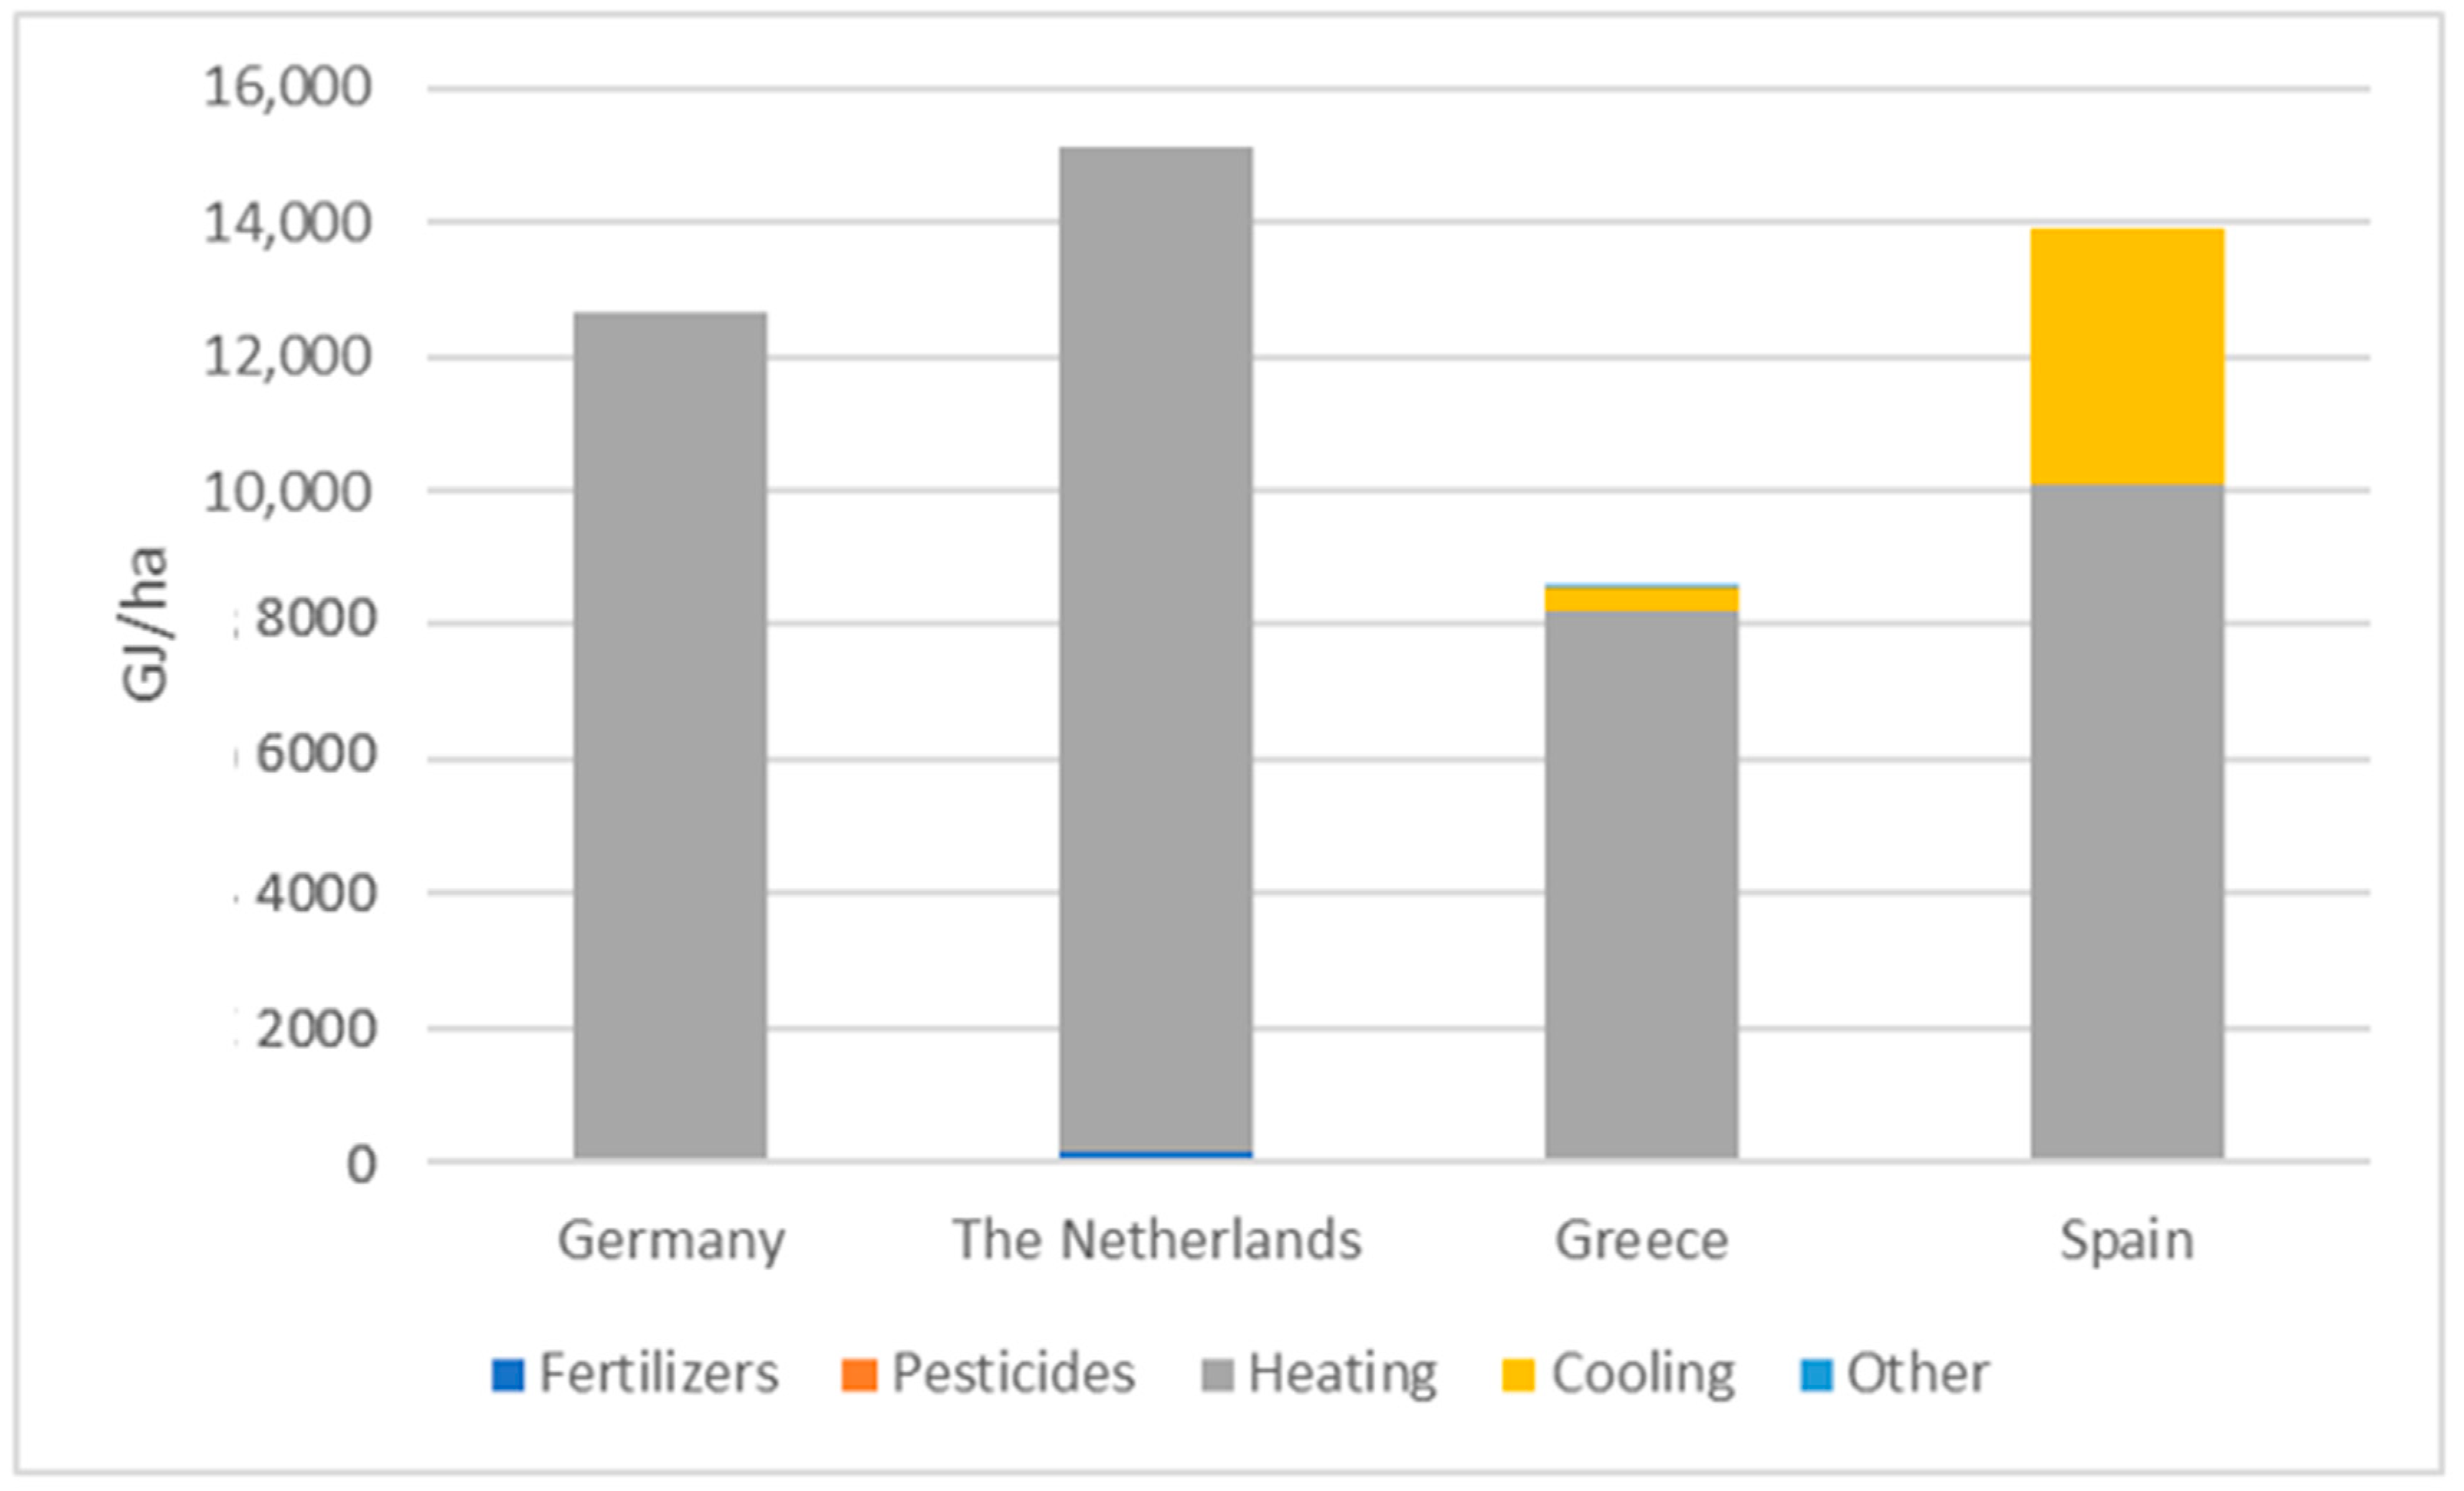
The data presented in this study illustrate that energy use in greenhouses in the EU varies considerably depending on the type of greenhouse, geographical area, and crop grown. In advanced greenhouse systems, heating is the dominant energy requirement and in some studies accounts for up to 99% of all energy inputs. In our view this needs more detailed research with more data points from accepted methodologies as 99% appears high. In any case, our review indicates that energy requirements for heating and cooling in energy intensive systems are so considerable that other energy inputs, such as fertilizers, are extremely minor. Indeed, it has been estimated that the heating and cooling of greenhouses represents 1.5% of Europe’s total energy consumption [
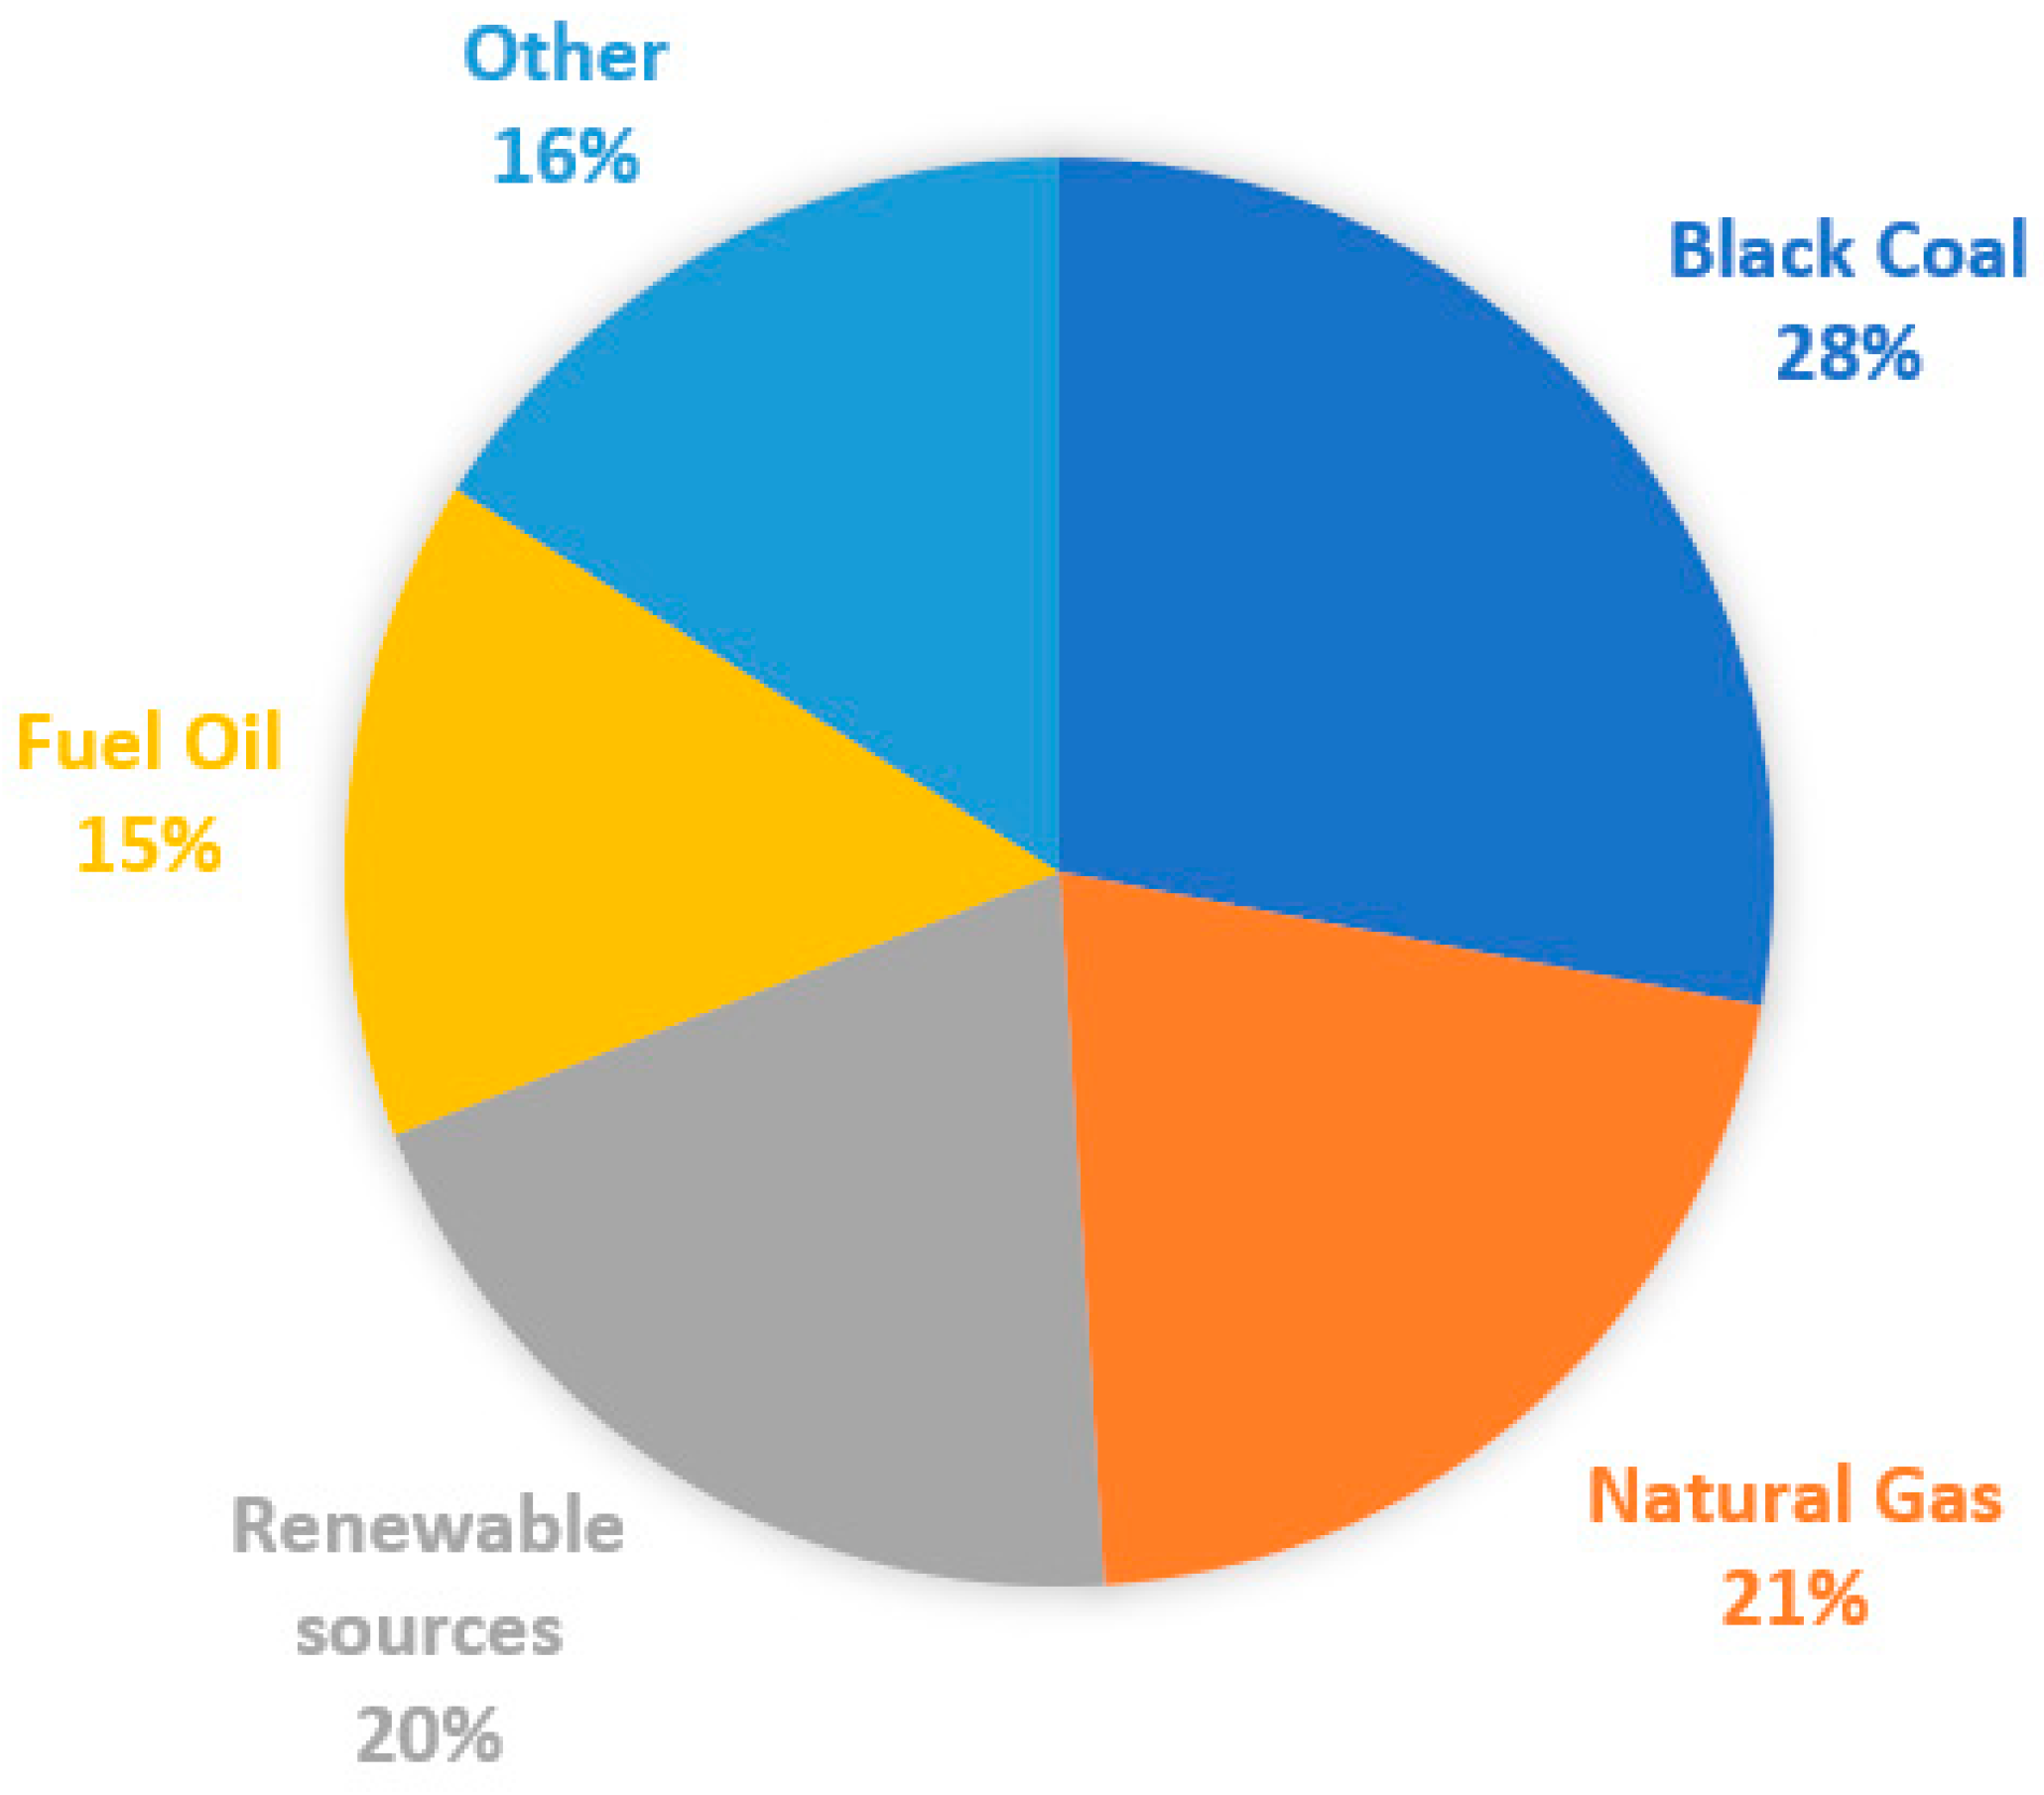
41]. Methods of heating greenhouses vary throughout the EU; gas boilers are generally popular, as are air-unit heaters for small scale installations [42], as well as cogeneration (Combined Heat and Power) in certain countries (mainly The Netherlands) [9]. In most cases, heating and cooling systems are powered by energy from fossil fuels but in recent years sustainable sources of heat, mainly geothermal, have been growing rapidly.
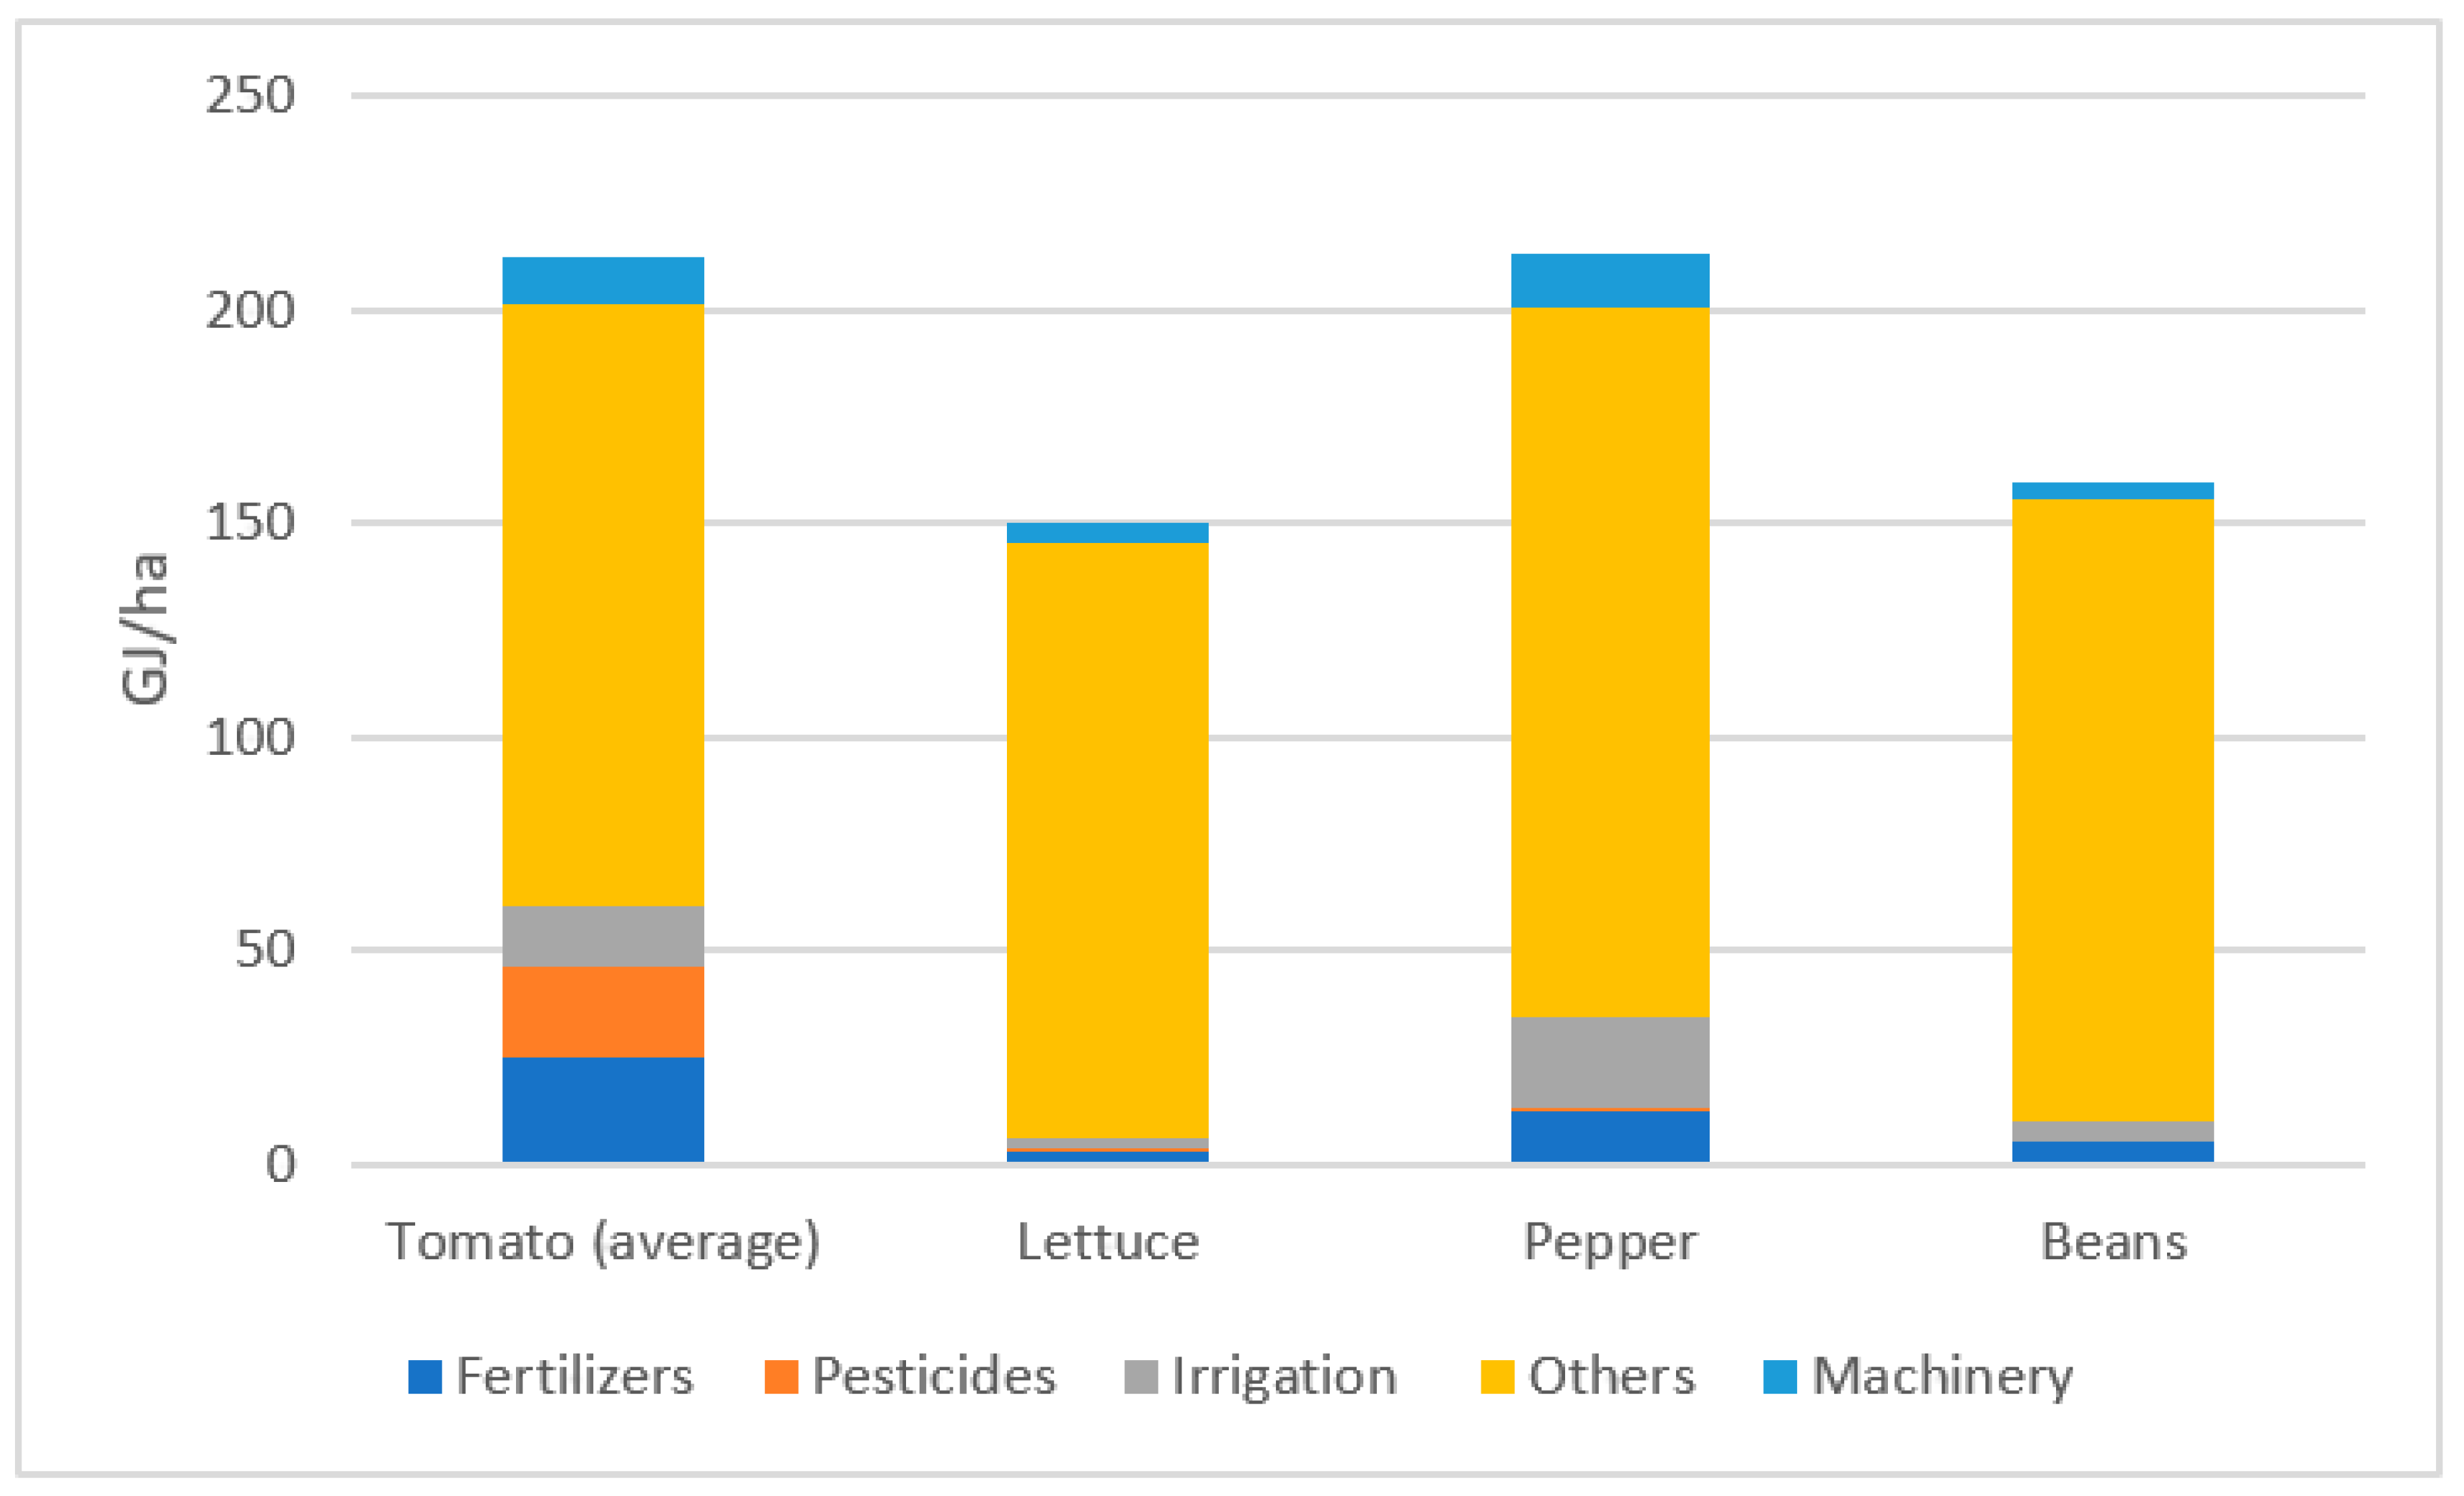
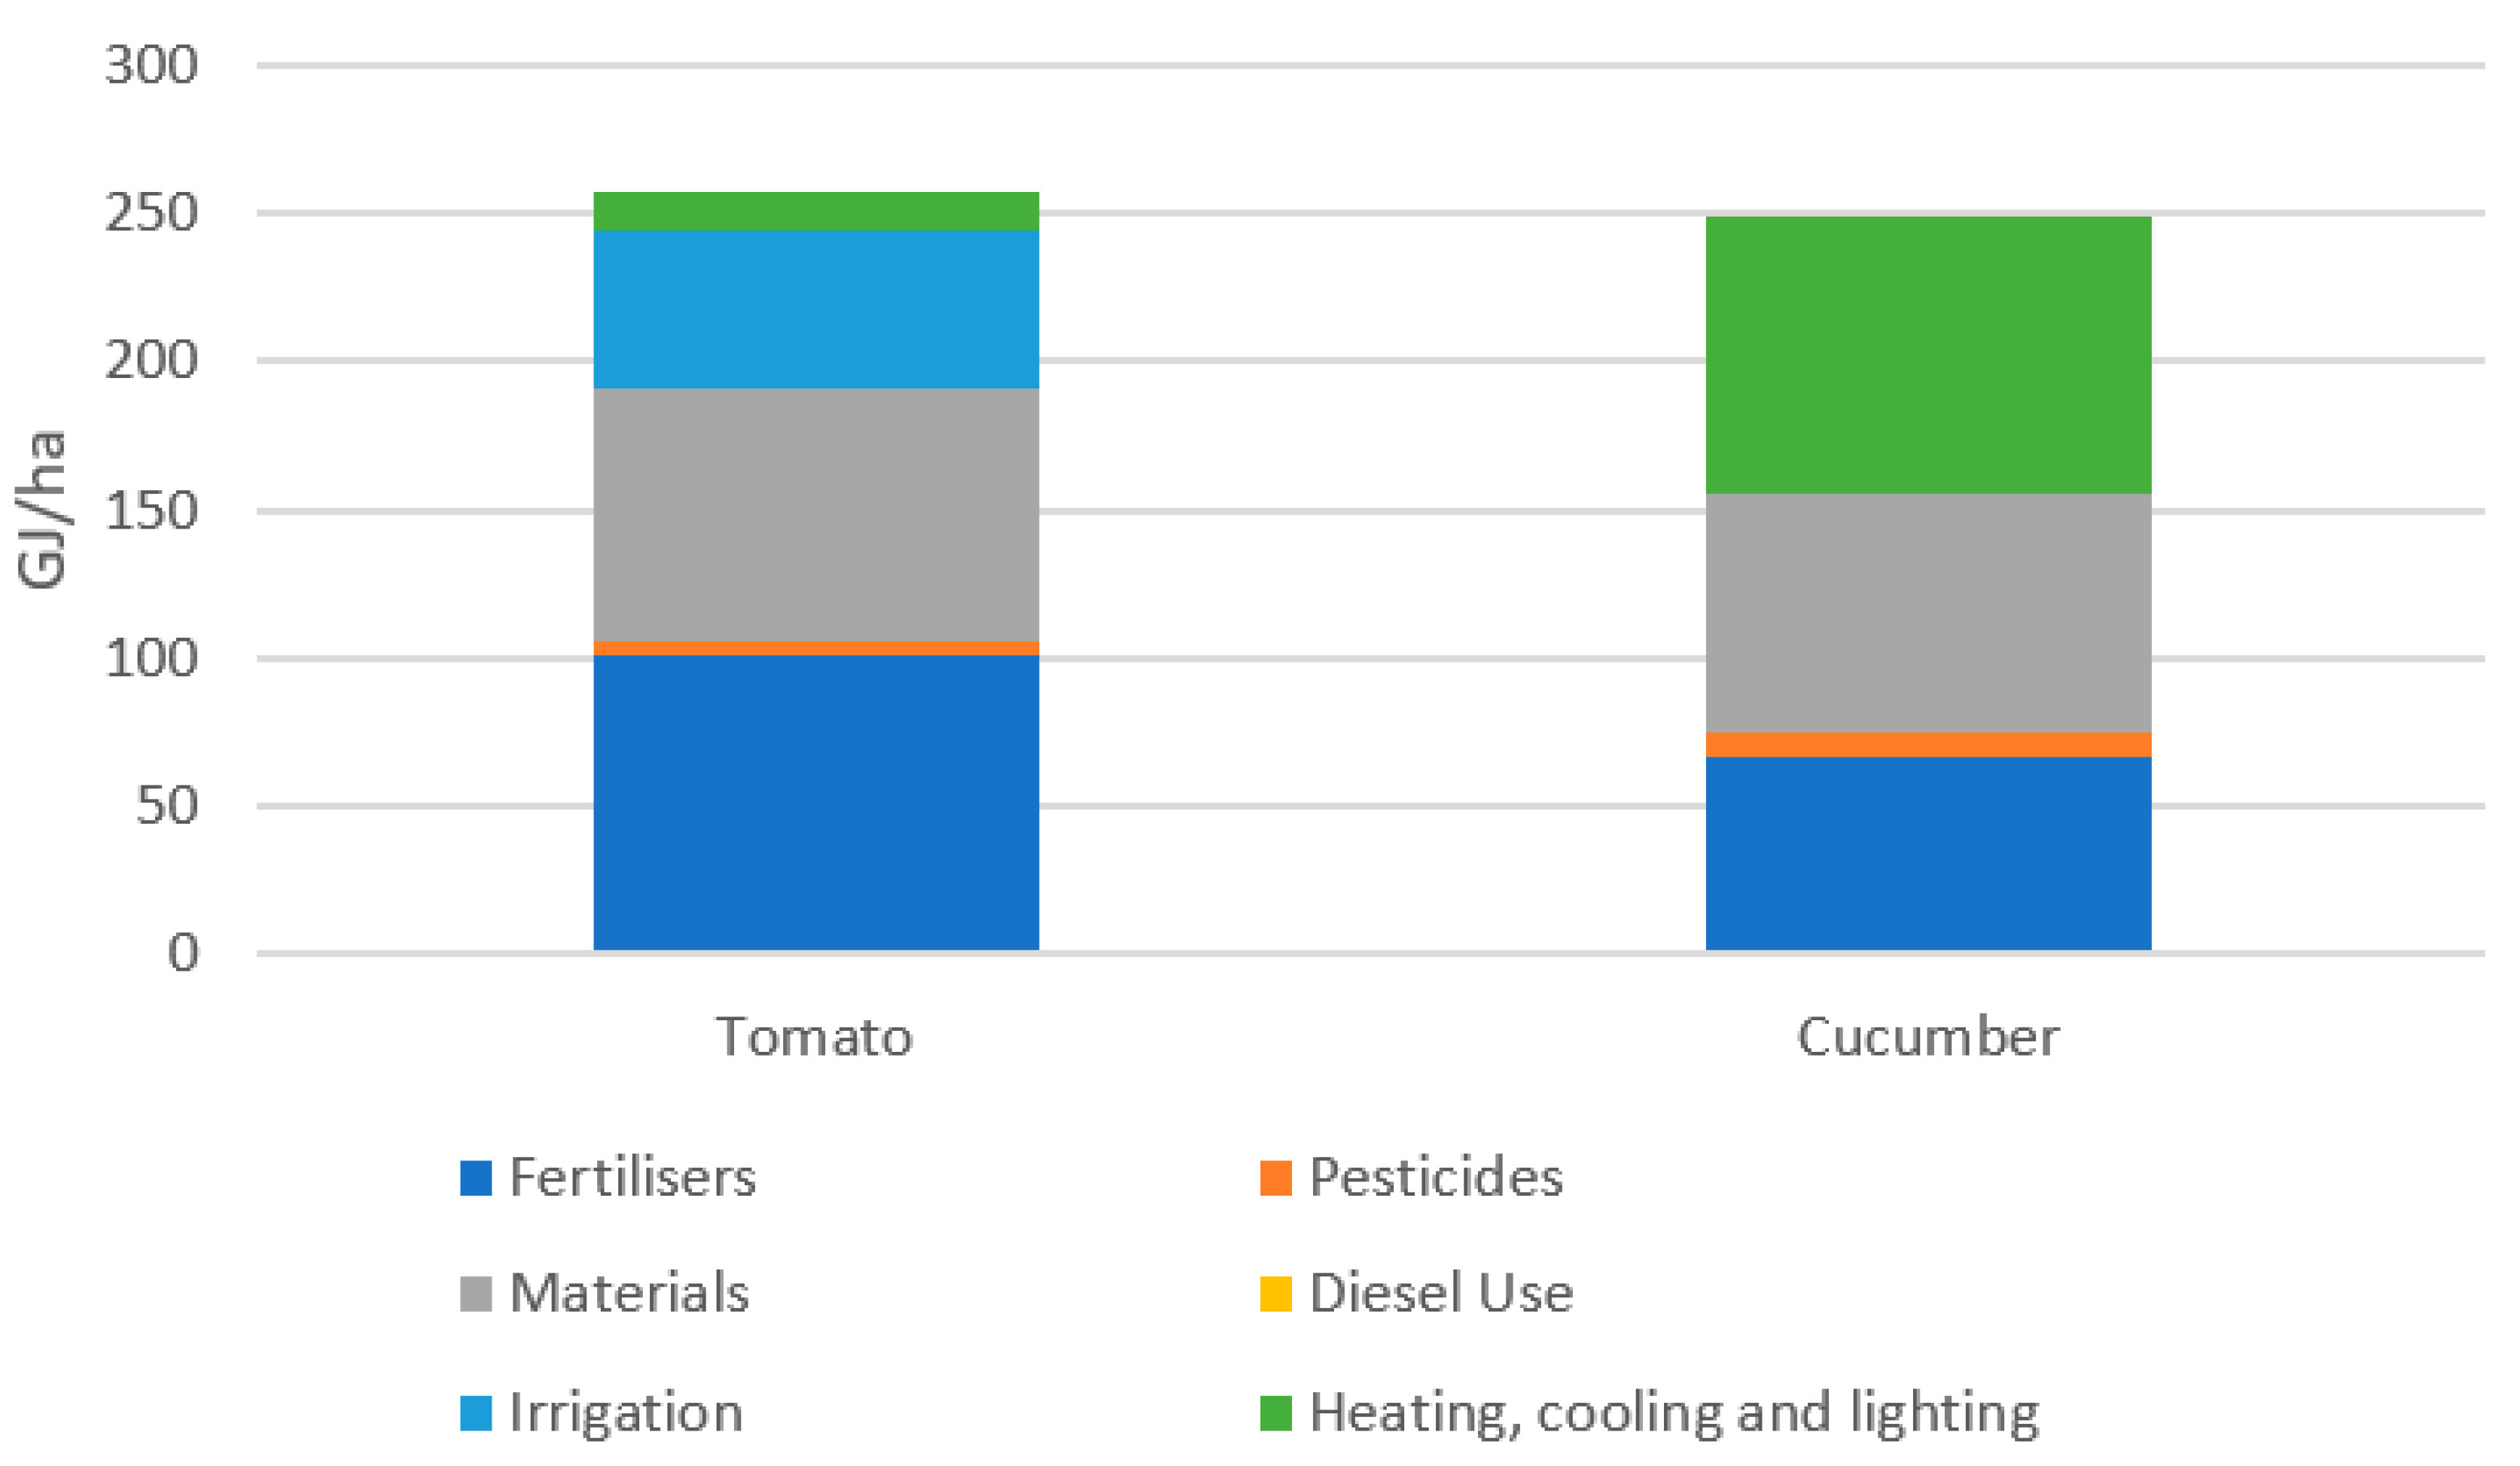
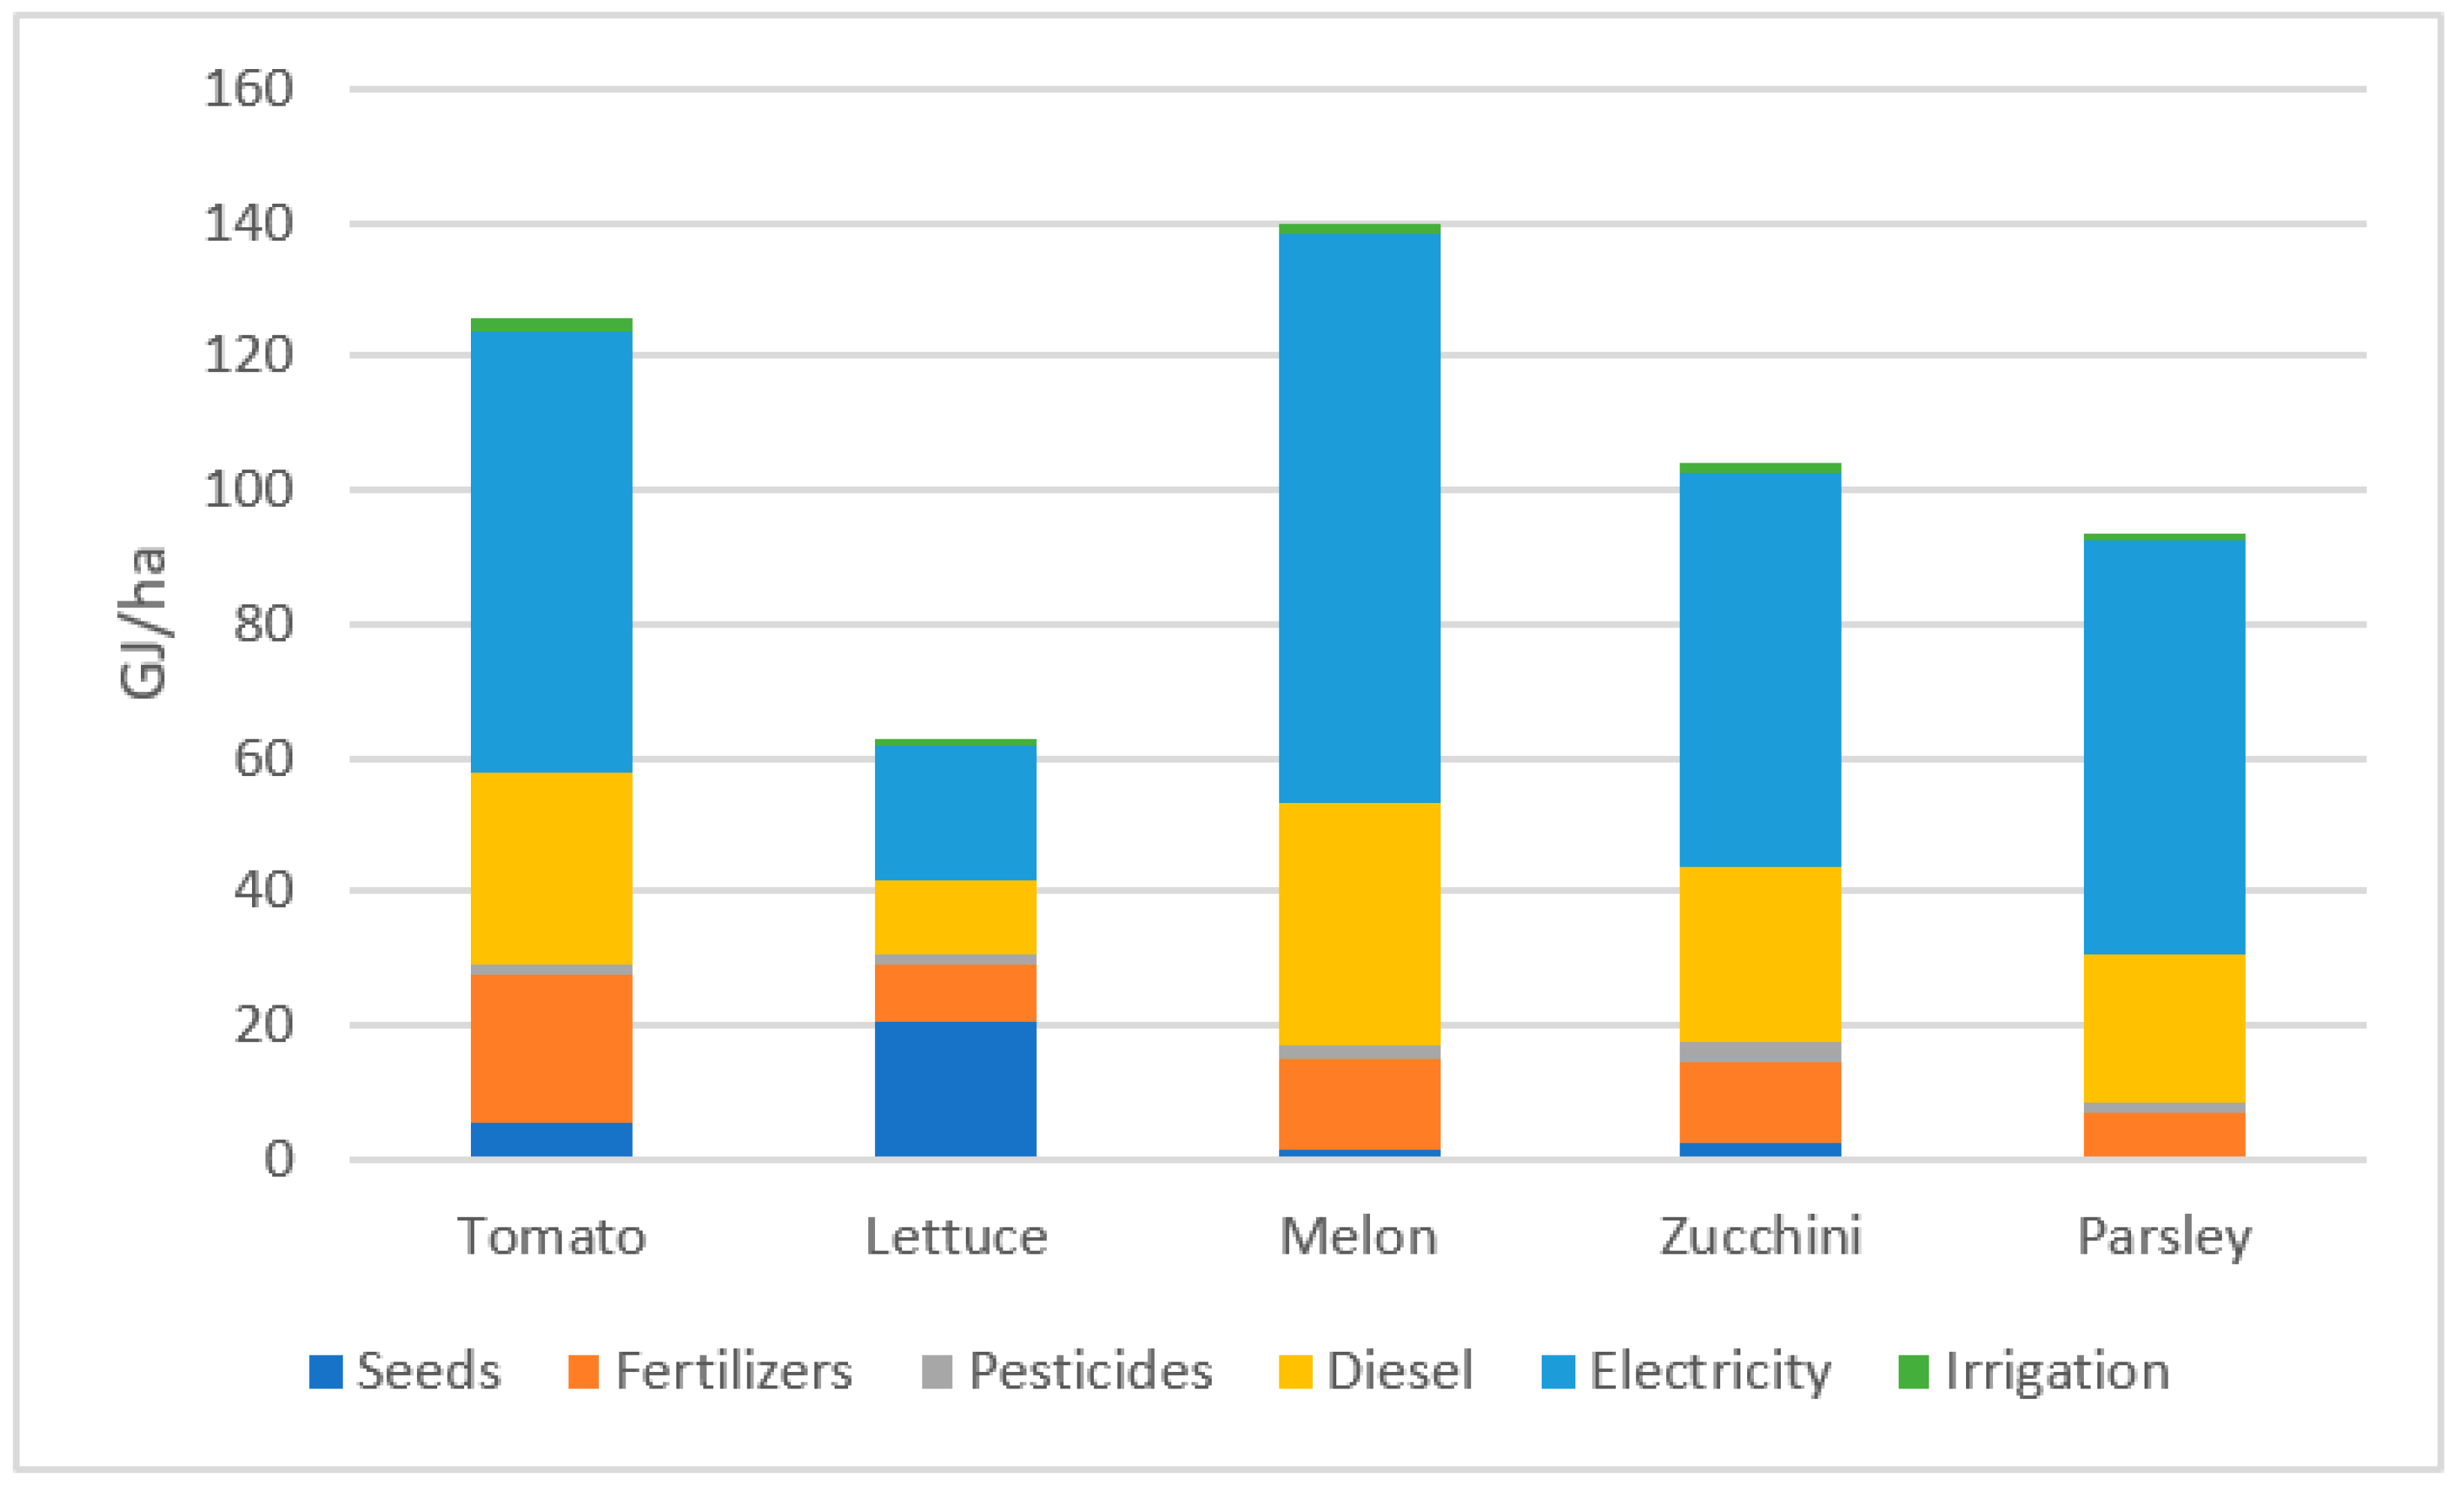
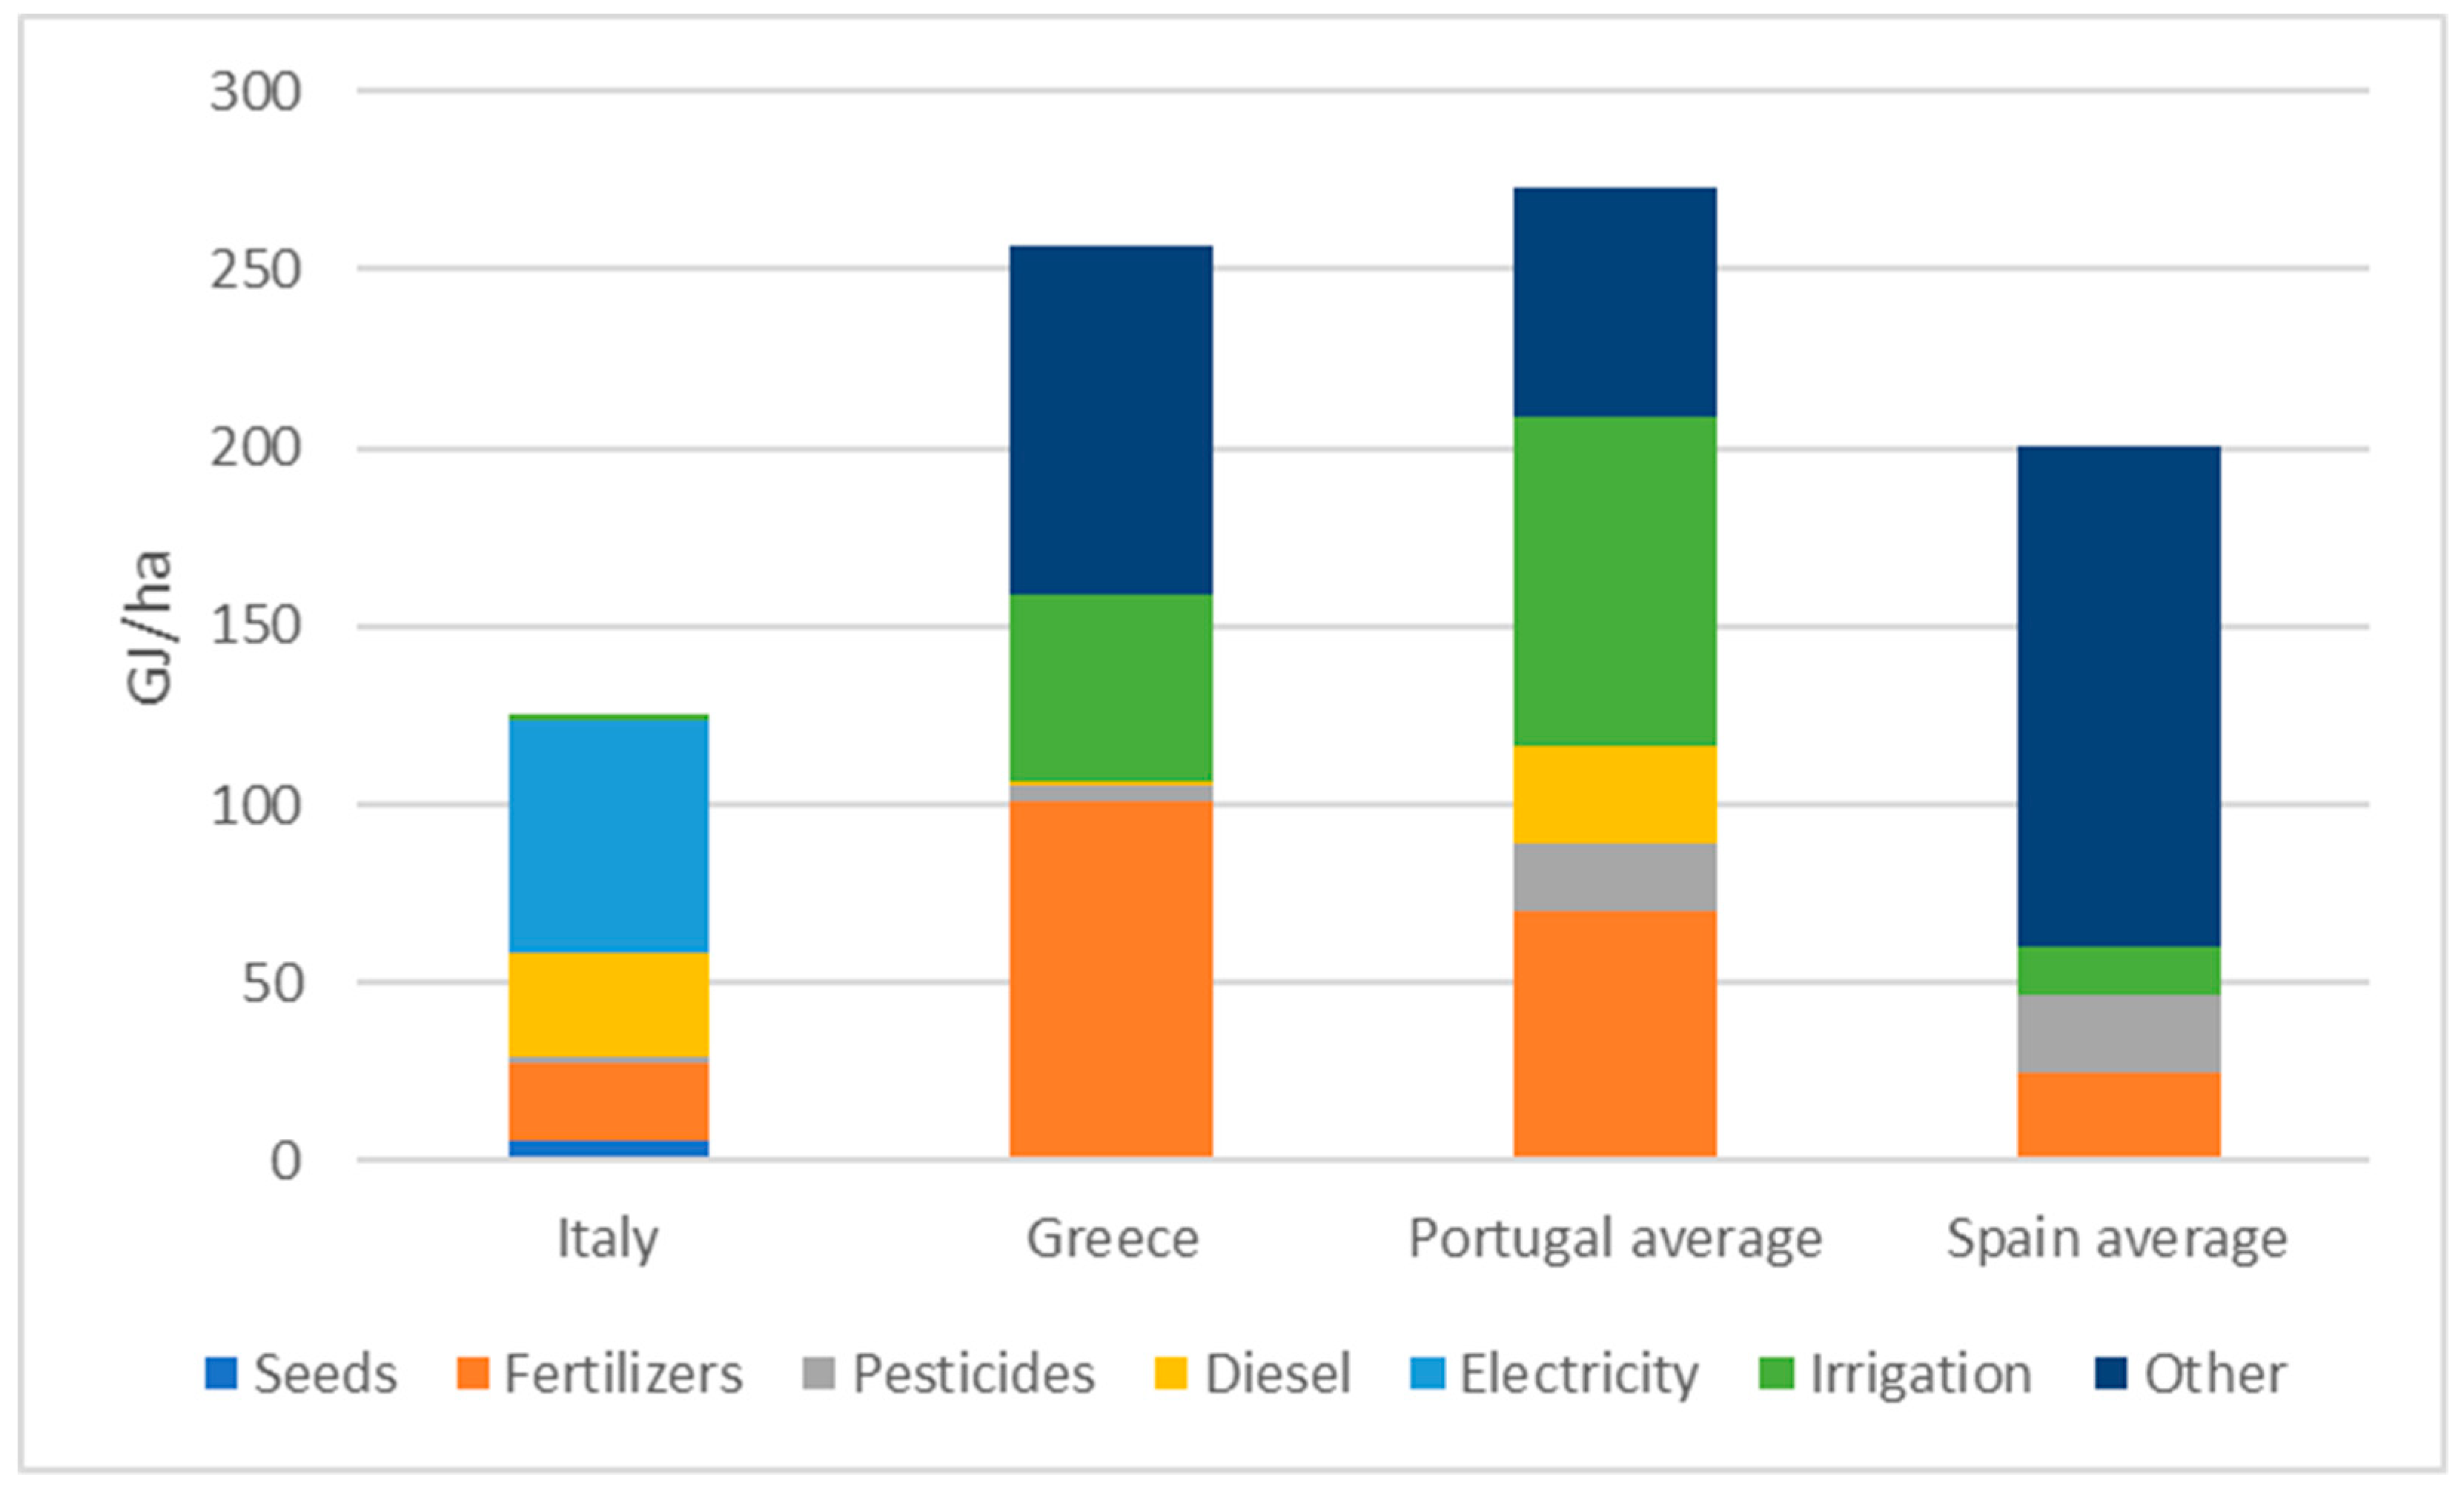
In less energy intensive systems, overall energy requirements per hectare are significantly less (50–70 times less energy per hectare) as compared to high energy systems, but generally still multiple times higher than the energy requirements of open-field agriculture. The mixture of energy inputs in these systems are split more evenly, depending on the crop and production system, between direct (lighting, heating/cooling, irrigation, machinery use) and indirect (fertilizers and pesticides). It is important to note that indirect energy sources, mainly fertilizers, constitute a considerable amount of energy inputs in low energy intensity greenhouses (6–27%).
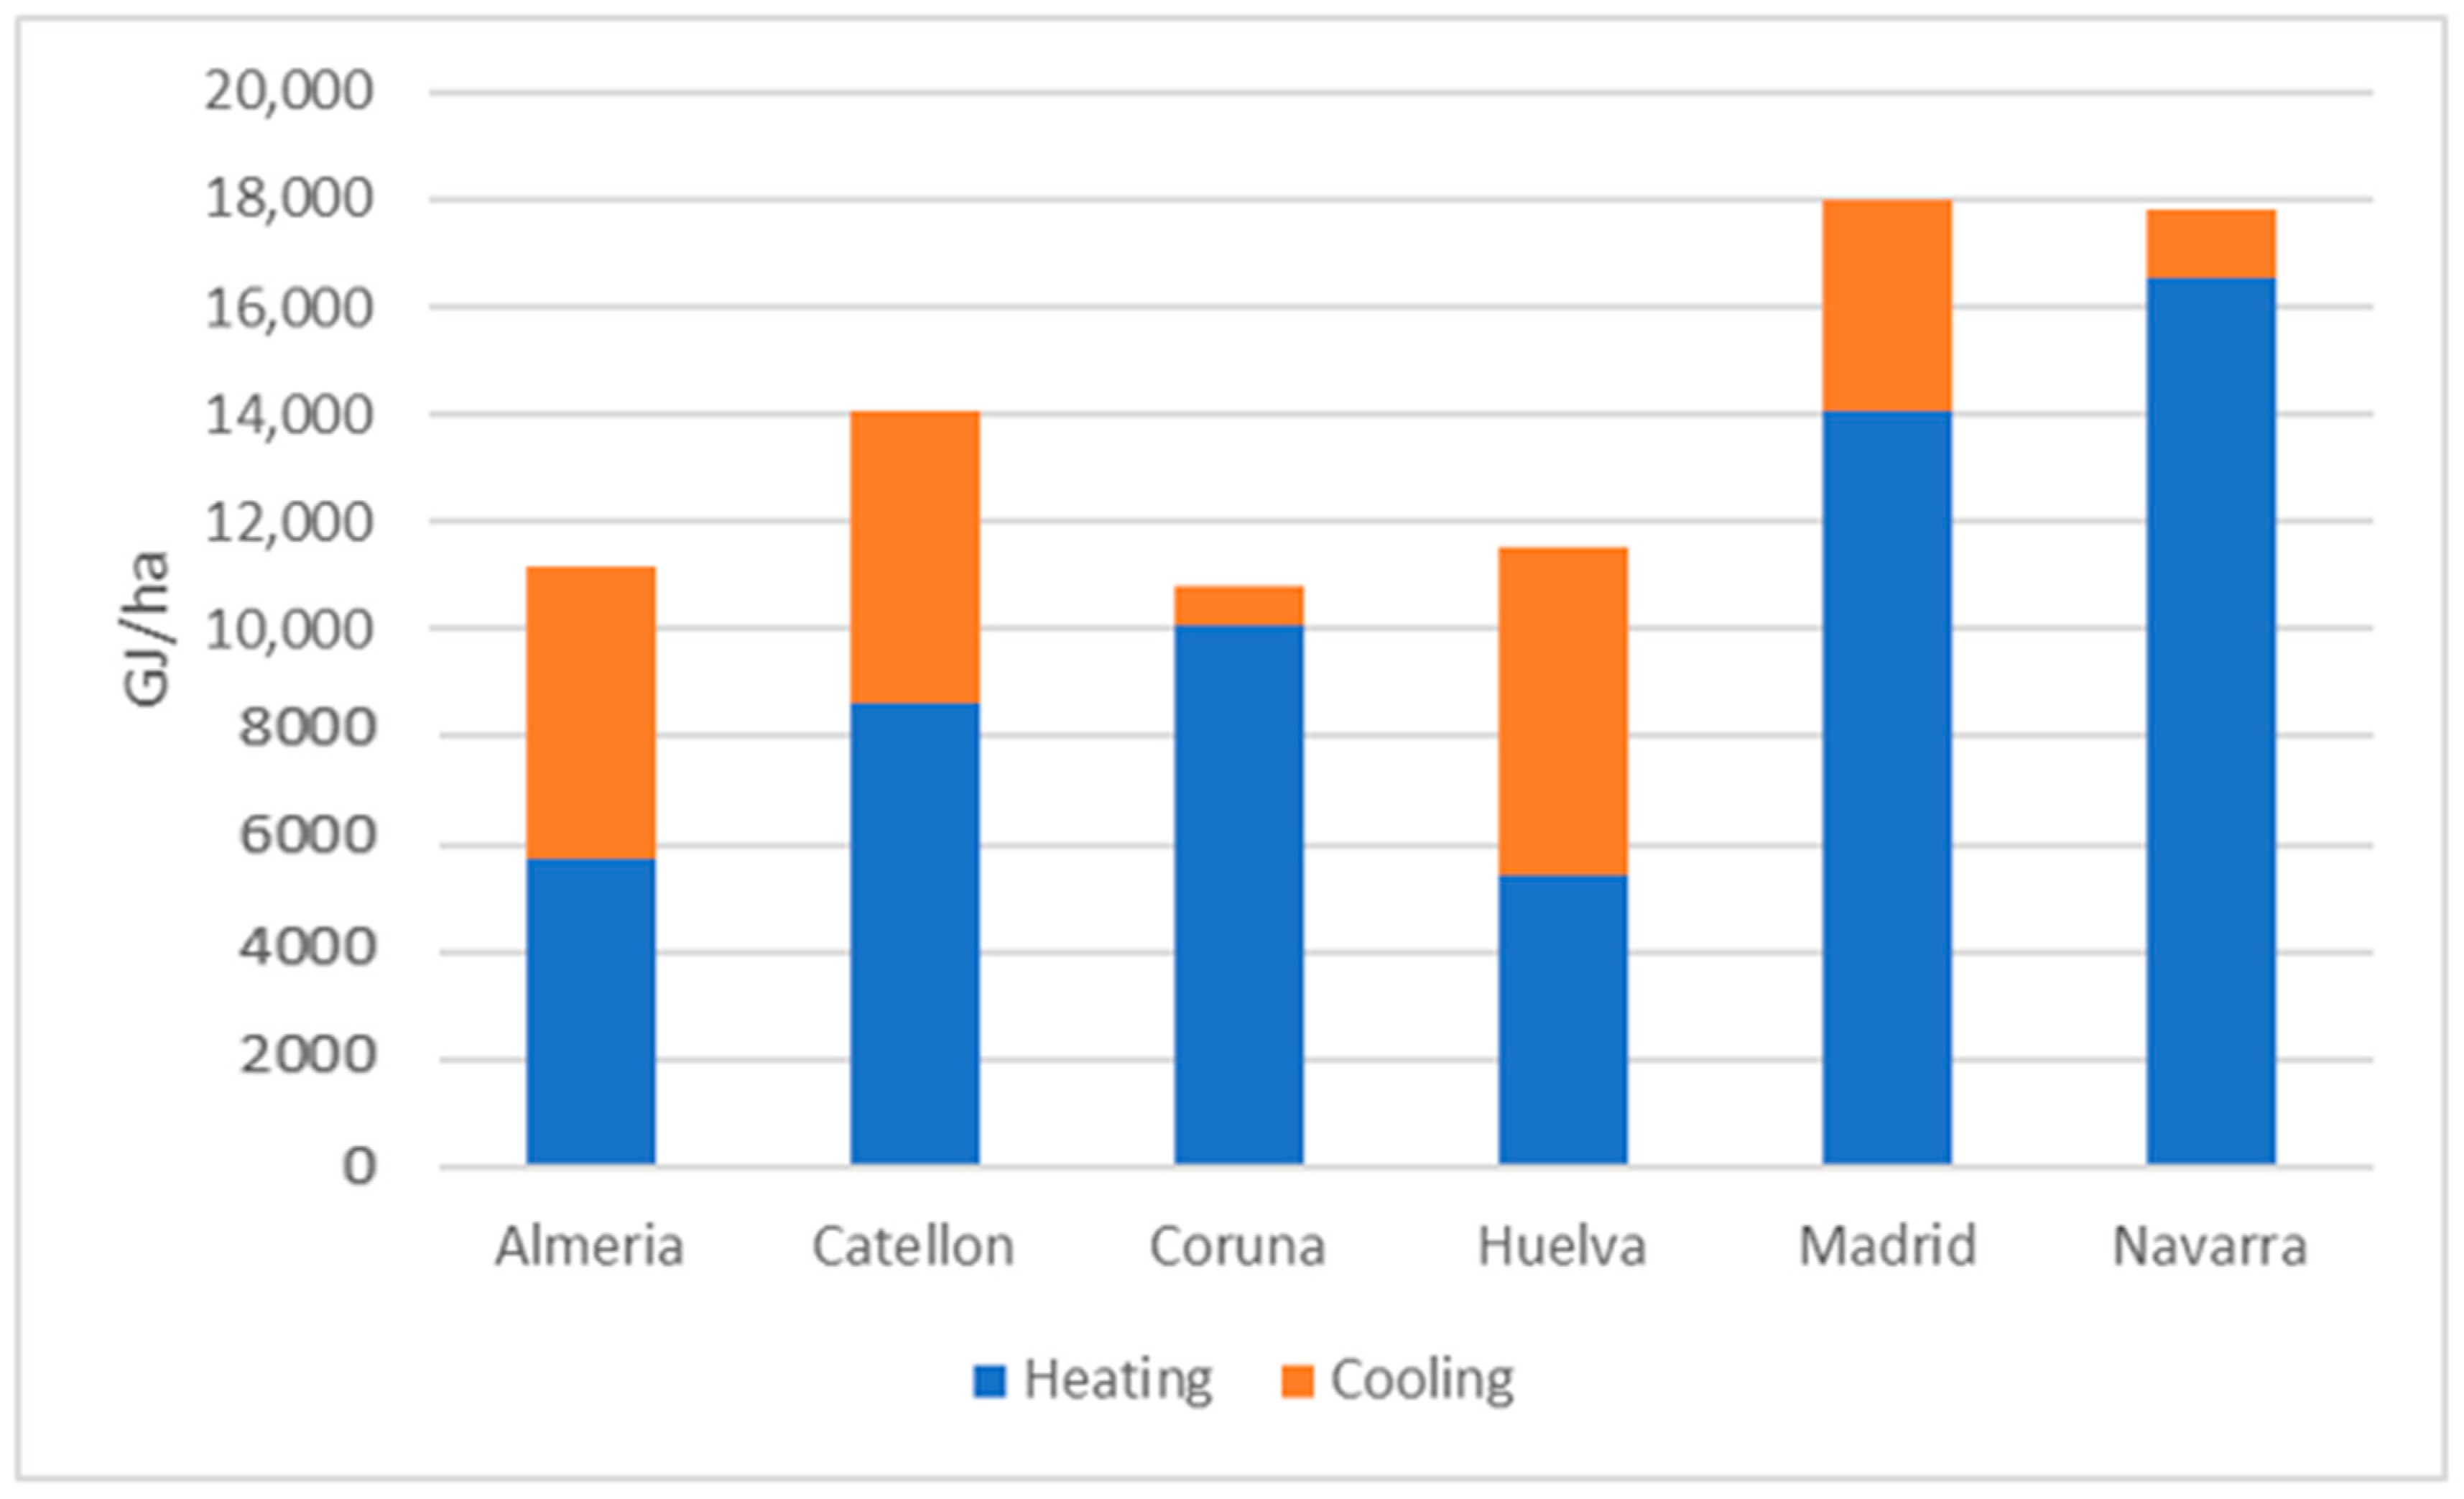
Studies also indicate that there is significant geographical variation in energy intensity between greenhouses in the EU as, in general, more advanced greenhouses are located in northern Europe and basic greenhouse structures in southern Europe. An FAO study which focuses on greenhouse production in South-Eastern Europe (including non-EU countries) highlights that around 18% of greenhouses are glasshouses and 82% plastic greenhouses (a higher proportion than the EU average), and that of all area under greenhouses in the region 97% are not heated. By contrast, in Northern Europe, especially in the Netherlands, where most greenhouses are heavily managed, it is normal for greenhouse cultivation to be heated, consuming around 11,000 GJ/ha [9]. This difference can to a large extent be attributed to climatic conditions as crops grown in Northern European greenhouses for large parts of the year are dependent on external heating sources. However, it is likely that other factors, including market conditions, accessibility, knowledge, also play a role.
Identifying these areas where energy use is concentrated can help support the development and implementation of energy efficiency measures (EEM) and renewable energy sources (RES) interventions that support a transition of the entire greenhouse sector. In recent years, various studies have investigated and proposed EEM in different forms: Nikolaou et al. (2021) discuss a range of practical EEM for greenhouses located in Mediterranean countries [10], while Fabrizio (2012) finds that energy demand in greenhouses in northern Italy can be reduced by 30% by the usage of better insulated transparent materials. [17]. Zhang et al. (2020) conduct a review of different control strategies for improving the energy efficiency of greenhouses finding that traditional control strategies combined with intelligent algorithms have become a popular way to reduce the energy demand of greenhouses and can lead to substantial energy savings [43]. Chen et al. (2012) show that such a system can improve energy efficiencies by up to 15.1% [44]. Various studies highlight that traditional light sources in greenhouses are relatively energy inefficient and generally generate radiant heat and highlight that switching to LED sources can lead to considerable energy savings [45,46,47]. Studies generally show that improving the design, operation, and technology used in greenhouses can also significantly improve overall energy efficiency [43]. However, implementing these systems can be expensive and, due to variation in greenhouses, EEM interventions are often context specific, highlighting that further research in these areas would be useful [43]. Various studies investigate the transition to RES for greenhouse production, including the potential for: integrating solar technologies within greenhouse production [17,32,48]; biogas and bioenergy [49]; and geothermal [14,16,50]. Regarding geothermal, Arpa et al. (2016) find that geothermal are economically comparable with conventional systems [14] and Russo et al. (2014) find that geothermal heat pumps are environmentally beneficial over conventional systems. Other recent research indicates that the installation of these can also be economically advantageous as compared to alternatives [51]. This suggests that the transition to RES, which is already occurring at a rapid pace in certain European countries, could open the door to major reductions in the dependency on fossil sources in the greenhouse sector. Similar to EEM measures, RES interventions are likely dependent on context specificity and economics, while various factors need to be taken into account to support a sustainable transition. For instance, one of the reasons fossil fuels are used to provide energy in greenhouses is that they are source of CO2 that can be used to enhance productivity [4].
Taking local and international contexts into account there are various policy interventions that will likely support the transition to the use of RES and EEM in greenhouse production. In our view, these include increased taxes for fossil fuels, subsidies for RES adoption EEM interventions and higher carbon prices. For instance, direct subsidies as implemented in the Netherlands can accelerate this transition for greenhouse heating [52]. The new CAP is generally supportive of this by including a range of policies that support the targets of the Green deal including considerable funding for eco-schemes and climate supportive policies [53].
Despite our findings, there are relatively little data available and few studies were identified that investigated energy use in greenhouses in the EU, the studies that do exist employ varying methodologies and boundaries for measuring energy use ranging from LCAs to surveys to advanced models. Although this is similar to data and methodological issues experienced in other agricultural sectors [6,54], in the greenhouse sector the lack of data is more considerable. In our view, the development of a widely accepted methodology for measuring energy use in agriculture is of utmost importance and its establishment will catalyse future studies on energy use. In addition, one of the limitations highlighted by this review is that greenhouse agriculture shows extreme variation but is often labelled under one term or category. In our view, an approach that further categorises greenhouse production into, for instance, low and high energy intensity greenhouses is useful for our understanding and for comparing greenhouse production across agro-climatic conditions. Our review also highlights a few other general areas for further research, including the potential of EEM and RES technologies, especially in the context of the European Green Deal, as well as on energy demands per crop and within different geographical and agro-climatic areas.

Proposed Framework for Measuring Energy Use in Greenhouse Agriculture

Based on these limitations we propose a framework that would, in our view, allow for considerably more accurate measurement and understanding of energy use in greenhouse production systems and indeed in all agricultural systems. We propose that this framework is centred around conducting several LCAs at regular intervals for all crops in different production systems in all countries. In practice this would first require the categorization of production systems and the identification of ‘standard’ systems in each country. At a later stage non-standard and non-conventional production systems can also be considered. We also recommend that a wide, accurate and measurable definition of direct and indirect energy is included in these studies. Though indirect energy is consumed prior to the farm it can clearly be attributed to the agricultural sector and is important to be included.
In such a system, an effective approach to conducting individual LCA for crops in each production system needs to be developed. For energy use we propose that the LCA methodology uses a wide, standardized, and detailed categorisation of energy inputs. The categories that we propose include energy use for: seeds; soil; growing media; pesticides; fertilizers; diesel use for machinery, heating and ventilation; electricity use for machinery, heating, ventilation, irrigation, storage, machinery. Such a process that also differentiates between the likely main energy sources, diesel and electricity, would support a detailed understanding of energy inputs in greenhouses. We consider this overall categorisation particularly important as, currently, a small number of non-standardized energy use categories are generally used between LCAs. For instance, one LCA might have the categories fertilizers, pesticides, diesel use, and lighting, while another one might have fertilizers pesticides, machinery use, and electricity. In practice, this makes effective comparisons extremely difficult and prone to errors as these categories often overlap, are not exclusive and often there is little transparency on what was included in each of these inputs.
In addition, it would be useful if results are presented as energy use per hectare, as well as energy use per kilogram/tonne and also include uncertainty and confidence intervals. A major drawback of existing LCAs in agriculture is that they generally do not include any degrees of uncertainty. This entire methodology would need to rely on detailed data that rely on accurate real-world parameters and/or accurate database reference values. For this to occur considerable effort is required for the finding of accurate and updatable parameters and reference values. Once a large number of LCAs have been conducted, using appropriate statistic tools, an effective meta-analysis can be conducted that provides accurate greenhouse energy use profiles in different countries and production systems.
In our view such a framework can also be applied to the open-field agriculture and livestock sectors. This is a large piece of work that requires significant funding to be carried out but would support a more detailed understanding of energy use in agriculture and support effective policy and interventions for the transition away from fossil-based agriculture.

5. Conclusions

In conclusion, the review presented in this paper illustrates that energy use in greenhouses is variable and generally dependent on fossil sources. High energy systems, which are more dominant in northern Europe, are generally heavily climate controlled and energy use is dominated by heating and cooling processes, while low energy systems, dominant in southern Europe, show a mixture of energy uses. Our review also provides a discussion of trends in EEM and RES adoption for greenhouse production. Finally, our review indicates that accurate and reliable studies on energy use in greenhouse production is scarce and fragmented and that a range of differing methodologies are currently used to estimate on-farm energy use. The development of a comprehensive methodology and further categorisation for measuring energy use in greenhouse production, based on the framework presented in this paper, would, in our view, catalyse further studies in this sector and significantly improve our understanding of energy use in greenhouses, further supporting the green transition.

Author Contributions

Conceptualization, A.T.B., D.M. and G.P.; methodology, B.P., F.V. and A.T.B.; validation, B.P. and F.V., formal analysis, B.P. and F.V.; investigation, B.P. and F.V.; data curation, B.P. and F.V.; writing—original draft preparation, B.P. and F.V.; writing—review and editing, B.P., F.V., A.T.B., K.V., G.K., D.M. and G.P.; visualization, B.P.; supervision, A.T.B., D.M. and G.P.; project administration, A.T.B. and K.V.; funding acquisition, A.T.B., D.M. and G.P. All authors have read and agreed to the published version of the manuscript.

Funding

This study has received funding from the European Union’s Horizon 2020 research and innovation programme under grant agreement ID 101000496 (H2020 AgroFossilFree).

Institutional Review Board Statement

Not applicable.

Informed Consent Statement

Not applicable.

Data Availability Statement

No new data were created or analyzed in this study. Data sharing is not applicable to this article.

Acknowledgments

This study has been developed as part of the Horizon 2020 Agrofossilfree (www.agrofossilfree.eu accessed on 21 March 2022) project. We would like to thank the following people and partners for contributions and insight into developing this article: Agricultural and Environmental Solutions (AGENSO), Erik Fløjgaard Kristensen at Aarhus Universitet (AU), Vanja Bisevac and Ivo Hostens at the Comite Europeen Des Groupements De Constructeurs Du Machinisme Agricole (CEMA), Michael Moraitis, Vassiliki Gavidou and Dimitrios Fakis at the Center for Research and Technology Hellas (CERTH), Daniele Rossi and Elisa Tomassi at the Confederazione Generale Dell Agricoltura Italiana (CONFAGRICOLTURA), Lucas Mencke at DELPHY, Chris Cavalaris at the European Conservation Agriculture Federation (ECAF), Maite Zarranz and Camino Fabregas at Iniciativas Innovadoras Sal (INI), Magdalena Borzęcka at the Instytut Uprawy Nawozenia I Gleboznawstwa, Panstwowy Instytut Badawczy (IUNG-PIB), Landbrug and Fodevarer F.M.B.A. (L&F), Martyna Próchniak at Lubelski Osrodek Doradztwa Rolniczego W Konskowoli (LODR), Daan Creupelandt at RESCOOP EU ASBL, Barry Caslin at the Agriculture and Food Development Authority (TEAGASC), Marilena Lazopoulou at Trama Tecnoambiental S.L. (TTA) and Felix Colmorgen and Dominik Rutz at Wirtschaft Und Infrastruktur Gmbh & Co Planungs Kg (WIP).

Conflicts of Interest

The authors declare no conflict of interest.

Appendix A

Table A1. Energy consumption in high energy intensity tomato greenhouse production in Spain (GJ/ha) (based on [28]).
SourceZoneCropHeating CoolingTotal
Baptista et al., 2012 [28]AlmeriaTomato5760540011,160
Baptista et al., 2012 [28]CatellonTomato8640540014,040
Baptista et al., 2012 [28]CorunaTomato10,08073810,818
Baptista et al., 2012 [28]HuelvaTomato5400612011,520
Baptista et al., 2012 [28]MadridTomato14,040397818,018
Baptista et al., 2012 [28]NavarraTomato16,560126017,820
Table A2. Energy consumption in low energy intensity greenhouse production in Spain (GJ/ha) (based on [22]).
SourceCropFertilizersPesticidesIrrigation OthersTotal
Alonso & Guzman 2010 [22] Tomato (average)24.9721.5413.91140.60201.03
Alonso & Guzman 2010 [22] Lettuce2.660.893.00138.49145.03
Alonso & Guzman 2010 [22] Pepper12.091.0321.00166.11200.23
Alonso & Guzman 2010 [22] Beans5.290.244.70145.12155.35
Table A3. Energy consumption in high energy intensity greenhouse production in Greece (GJ/ha) (based on [23,24,30]).
SourceZoneCropFertilisers, Pesticides, Materials, Diesel, IrrigationHeatingCoolingLightingTotal
Kittas et al., 2014 [23] ThessalyTomato76.868137.8328.327.28550.18
Trypanagnostopoulos et al., 2017 [30] PyrgosLettuce 5400 18007200
Vourdoubas 2015 [24]CreteFlowers30247920 50411,448
Table A4. Energy consumption in low energy intensity greenhouse production in Greece (GJ/ha)(based on [15]).
SourceCropFertilisersPesticidesMaterialsDiesel UseIrrigationHeating, Cooling and LightingTotal
de Visser et al., 2012 [15]Tomato1014.5850.55313257
de Visser et al., 2012 [15]Cucumber677.580.51 92.5248.5
Table A5. Energy consumption low-energy intensity greenhouse production in Italy (GJ/ha) (based on [34]).
SourceCropSeedsFertilizersPesticidesDieselElectricityIrrigationTotal
Campiglia et al., 2007 [34]Tomato5.5221.951.7628.8365.621.97125.63
Campiglia et al., 2007 [34]Lettuce20.708.231.5211.0920.460.8762.87
Campiglia et al., 2007 [34]Melon1.4413.562.1236.2685.091.39139.86
Campiglia et al., 2007 [34]Zucchini2.3012.412.7126.3559.071.28104.13
Campiglia et al., 2007 [34]Parsley0.017.181.4221.7962.100.9193.41
Table A6. Greenhouse energy consumption for selected crops in the Netherlands (GJ/ha) (based on [15,37]).
SourceCropFertilizersPesticidesHeatingTotal
de Visser et al., 2012 [15]Sweet pepper112.62.511,42411,539
Stanghellini et al., 2016Sweet Pepper 15,540
de Visser et al., 2012 [15]Tomato119114,99015,110
Stanghellini et al., 2016Tomato 11,480
de Visser et al., 2012 [15]Cucumber0014,24514,360
Stanghellini et al., 2016 [37]Cucumber 11,320
Stanghellini et al., 2016 [37]Strawberry 6310
Stanghellini et al., 2016 [37]Eggplant 11,320
Stanghellini et al., 2016 [37]Zucchini 9510
Stanghellini et al., 2016 [37]Radish 1550
Stanghellini et al., 2016 [37]Lettuce 2820
Table A7. Energy consumption in the German greenhouse sector (GJ/ha) (based on [15]).
SourceCountryCropFertilizersHeatingTotal
de Visser et al., 2012 [15]GermanyTomato4212,61212,654
de Visser et al., 2012 [15]GermanyCucumber5313,00013,053
Table A8. Energy inputs in high energy intensity tomato production systems (GJ/ha) (based on [15,28,40]).
SourceCountryFertilizersPesticidesHeatingCoolingOtherTotal
de Visser et al., 2012 [15]Germany42.00 12,612.00 12,654.00
de Visser et al., 2012 [15]The Netherlands119.001.0014,990.00 15,110.00
Kittas et al., 2014 [40]Greece58.868137.80328.3225.208550.18
Baptista et al., 2012 [28]Spain 10,080.003816.000.0013,896.00
Table A9. Energy inputs in low energy intensity tomato production systems (GJ/ha) (based on [15,22,34]).
SourceCountrySeedsFertilizersPesticidesDieselElectricityIrrigationOtherTotal
Campiglia et al., 2007 [34]Italy5.5221.951.7628.8365.621.970.00125.63
de Visser et al., 2012 [15]Greece 1014.50.5 5398257
de Visser et al., 2012 [15]Portugal average 7019.526.5 92.564.5273
Alonso & Guzman 2010 [22]Spain average 24.9721.54 13.91140.60201.03

References

  1. Popsimonova, G.; Benko, B.; Karic, L.; Gruda, N. Production systems in southeastern European greenhouses. Acta Hortic. 2017, 137–144. [Google Scholar] [CrossRef]
  2. Baudoin, W.; Nersisyan, A.; Shamilov, A.; Hodder, A.; Gutierrez, D.; Nicola, S.; Chairperson, V.; Duffy, R. Good Agricultural Practices for Greenhouse Vegetable Production in the South East European Countries Food and Agriculture Organization of the United Nations Plant Production and Protection Division Principles for Sustainable Intensification of Smallholder Farms; FAO: Rome, Italy, 2017; ISBN 978-92-5-109622-2. [Google Scholar]
  3. Eurostat Area under Glass by NUTS 2 Regions. Available online: http://appsso.eurostat.ec.europa.eu/nui/show.do?dataset=ef_lus_unglass&lang=en (accessed on 14 December 2021).
  4. Tittarelli, F. Organic Greenhouse Production: Towards an Agroecological Approach in the Framework of the New European Regulation—A Review. Agronomy 2020, 10, 72. [Google Scholar] [CrossRef] [Green Version]
  5. EGTOP. Final Report On Greenhouse Production (Protected Cropping); EGTOP: Brussels, Belgium, 2013. [Google Scholar]
  6. Paris, B.; Vandorou, F.; Balafoutis, A.T.; Vaiopoulos, K.; Kyriakarakos, G.; Manolakos, D.; Papadakis, G. Energy use in open-field agriculture in the EU: A critical review recommending energy efficiency measures and renewable energy sources adoption. Renew. Sustain. Energy Rev. 2022, 158, 112098. [Google Scholar] [CrossRef]
  7. Campiotti, C.; Viola, C.; Alonzo, G.; Bibbiani, C.; Giagnacovo, G.; Scoccianti, M.; Tumminelli, G. Sustainable greenhouse horticulture in europe. J. Sustain. Energy 2012, 3, 159–163. [Google Scholar]
  8. Mohamed, E.; Markou, G.; Balafoutis, T.; Papadakis, G.; Michael, P.; Janssen, R. The Cyprus Energy Profile for the Greenhouses Sector: Current Situation and Energy Saving Measures in Combination with RES; European Commission: Brussels, Belgium, 2017. [Google Scholar]
  9. Van der Velden, N.; Smit, P. Energiemonitor van de Nederlandse glastuinbouw 2018; Wageningen Economic Research: Wageningen, The Netherlands, 2019. [Google Scholar]
  10. Nikolaou, G.; Neocleous, D.; Christou, A.; Polycarpou, P.; Kitta, E.; Katsoulas, N. Energy and Water Related Parameters in Tomato and Cucumber Greenhouse Crops in Semiarid Mediterranean Regions. A Review, Part I: Increasing Energy Efficiency. Horticulturae 2021, 7, 521. [Google Scholar] [CrossRef]
  11. Eurostat. Agri-Environmental Indicator—Energy Use. Available online: https://ec.europa.eu/eurostat/statistics-explained/index.php?title=Agri-environmental_indicator_-_energy_use&oldid=322997#Analysis_at_EU_and_country_level (accessed on 20 March 2021).
  12. Von Elsner, B.; Briassoulis, D.; Waaijenberg, D.; Mistriotis, A.; Von Zabeltitz, C.; Gratraud, J.; Russo, G.; Suay-Cortes, R. Review of structural and functional characteristics of greenhouses in European Union countries: Part I, design requirements. J. Agric. Eng. Res. 2000, 75, 1–16. [Google Scholar] [CrossRef] [Green Version]
  13. Aznar-Sánchez, J.A.; Velasco-Muñoz, J.F.; López-Felices, B.; Román-Sánchez, I.M. An Analysis of Global Research Trends on Greenhouse Technology: Towards a Sustainable Agriculture. Int. J. Environ. Res. Public Health 2020, 17, 664. [Google Scholar] [CrossRef] [Green Version]
  14. D’Arpa, S.; Colangelo, G.; Starace, G.; Petrosillo, I.; Bruno, D.E.; Uricchio, V.; Zurlini, G. Heating requirements in greenhouse farming in southern Italy: Evaluation of ground-source heat pump utilization compared to traditional heating systems. Energy Effic. 2016, 9, 1065–1085. [Google Scholar] [CrossRef]
  15. De Visser, C.; de Buisonje, F.; Ellen, H.; Stanghellini, C.; van der Voort, M. State of the Art on Energy Efficiency in Agriculture, Country Data on Energy Consumption in Different Agroproduction Sectors in the European Countries; agrEE: Wageningen, The Netherlands, 2012. [Google Scholar]
  16. Anifantis, A.S.; Pascuzzi, S.; Scarascia-Mugnozza, G. Geothermal source heat pump performance for a greenhouse heating system: An experimental study. J. Agric. Eng. 2016, 47, 164–170. [Google Scholar] [CrossRef] [Green Version]
  17. Fabrizio, E. Energy reduction measures in agricultural greenhouses heating: Envelope, systems and solar energy collection. Energy Build. 2012, 53, 57–63. [Google Scholar] [CrossRef]
  18. Palmitessa, O.D.; Paciello, P.; Santamaria, P. Supplemental LED increases tomato yield in mediterranean semi-closed greenhouse. Agronomy 2020, 10, 1353. [Google Scholar] [CrossRef]
  19. Eurostat Crops under Glass: Number of Farms and Areas by Agricultural Size of Farm (UAA) and Size of Crops under Glass Area. Available online: http://appsso.eurostat.ec.europa.eu/nui/show.do?dataset=ef_poglass&lang=en (accessed on 29 April 2022).
  20. AgroFossilFree. AgroFossilFree—The Path towards an Effective De-Fossilisation of the EU Agriculture. Available online: https://www.agrofossilfree.eu/ (accessed on 27 July 2021).
  21. Baptista, F.; Silva, L.L.; De Visser, C.; Gołaszewski, J.; Meyer-Aurich, A.; Briassoulis, D.; Mikkola, H.; Murcho, D. Energy Efficiency in Agriculture. In Proceedings of the 5th International Congress on Energy and Environment Engineering and Management, Lisbon, Portugal, 17–19 July 2013. [Google Scholar]
  22. Alonso, A.M.; Guzmán, G.J. Comparison of the Efficiency and Use of Energy in Organic and Conventional Farming in Spanish Agricultural Systems. J. Sustain. Agric. 2010, 34, 312–338. [Google Scholar] [CrossRef]
  23. Kittas, C.; Elvanidi, A.; Katsoulas, N.; Ferentinos, K.P.; Bartzanas, T. Reflectance indices for the detection of water stress in greenhouse tomato (Solanum lycopersicum). In Proceedings of the Acta Horticulturae; International Society for Horticultural Science: Leuven, Belgium, 2016; Volume 1112, pp. 63–70. [Google Scholar]
  24. Vourdoubas, J. Overview of Heating Greenhouses with Renewable Energy Sources a Case Study in Crete-Greece. J. Agric. Environ. Sci. 2015, 4, 2334–2412. [Google Scholar] [CrossRef] [Green Version]
  25. Bibbiani, C.; Fantozzi, F.; Gargari, C.; Campiotti, C.A.; Schettini, E.; Vox, G. Wood Biomass as Sustainable Energy for Greenhouses Heating in Italy. Agric. Agric. Sci. Procedia 2016, 8, 637–645. [Google Scholar] [CrossRef]
  26. Valera, D.L.; Belmonte, L.J.; Molina-Aiz, F.D.; López, A.; Camacho, F. The greenhouses of Almería, Spain: Technological analysis and profitability. In Proceedings of the Acta Horticulturae; International Society for Horticultural Science: Leuven, Belgium, 2017; Volume 1170, pp. 219–226. [Google Scholar]
  27. Aguilar, M.; Vallario, A.; Aguilar, F.; Lorca, A.; Parente, C. Object-Based Greenhouse Horticultural Crop Identification from Multi-Temporal Satellite Imagery: A Case Study in Almeria, Spain. Remote Sens. 2015, 7, 7378–7401. [Google Scholar] [CrossRef] [Green Version]
  28. Baptista, F.J.; Silva, A.T.; Navas, L.M.; Guimarães, A.C.; Meneses, J.F. Greenhouse energy consumption for tomato production in the Iberian Peninsula countries. In Proceedings of the Acta Horticulturae; International Society for Horticultural Science: Leuven, Belgium, 2012; Volume 952, pp. 409–416. [Google Scholar]
  29. Savvas, D.; Ropokis, A.; Ntatsi, G.; Kittas, C. Current situation of greenhouse vegetable production in Greece. Acta Hortic. 2016, 1142, 443–448. [Google Scholar] [CrossRef]
  30. Trypanagnostopoulos, G.; Kavga, A.; Souliotis, M.; Tripanagnostopoulos, Y. Greenhouse performance results for roof installed photovoltaics. Renew. Energy 2017, 111, 724–731. [Google Scholar] [CrossRef]
  31. Pardossi, A.; Tognoni, F. Greenhouse industry in Italy. Acta Hortic. 1999, 481, 769–770. [Google Scholar] [CrossRef]
  32. Carlini, M.; Honorati, T.; Castellucci, S. Photovoltaic greenhouses: Comparison of optical and thermal behaviour for energy savings. Math. Probl. Eng. 2012, 2012, 743764. [Google Scholar] [CrossRef]
  33. Campiotti, C.A.; Latini, A.; Scoccianti, M.; Viola, C. Certificati Bianchi Guida Operativa per la Scheda 40E; ENEA: Rome, Italy, 2014. [Google Scholar]
  34. Campiglia, E.; Colla, G.; Mancinelli, R.; Rouphael, Y.; Marucci, A. Energy balance of intensive vegetable cropping systems in central Italy. In Proceedings of the Acta Horticulturae; International Society for Horticultural Science: Leuven, Belgium, 2007; Volume 747, pp. 185–191. [Google Scholar]
  35. FAOSTAT. FAOSTAT Crops. Available online: http://www.fao.org/faostat/en/#data/QC/ (accessed on 17 March 2021).
  36. Lambregts, E.; Bakker, R.; Van Hoof, V. Intensive Horticulture in the Netherlands and Europe; Berenschot Groep B.V.: Utrecht, The Netherlands, 2019. [Google Scholar]
  37. Stanghellini, C.; Baptista, F.; Eriksson, E.; Gilli, C.; Giuffrida, F.; Kempkes, F.; Muñoz, P.; Stepowska, A.; Ignacio Montero, J.; Arkestijn, P.; et al. Sensible use of primary energy in organic greenhouse production. BioGreenhouse COST Action 2016, 1105, 1–54. [Google Scholar] [CrossRef] [Green Version]
  38. Voss, J. Market Special: Greenhouse Farming in Germany; EVD International: Hague, The Netherlands, 2011. [Google Scholar]
  39. Kuntosch, A.; König, B.; Bokelmann, W.; Doernberg, A.; Siebert, R.; Schwerdtner, W.; Busse, M. Identifying system-related barriers for the development and implementation of eco-innovation in the german horticultural sector. Horticulturae 2020, 6, 33. [Google Scholar] [CrossRef]
  40. Kittas, C.; Katsoulas, N.; Bartzanas, T.; Bakker, J.C. Greenhouse Climate Control and Energy Use; FAO: Rome, Italy, 2013; pp. 63–95. [Google Scholar]
  41. Santamouris, M.; Mihalakakou, G.; Balaras, C.A.; Lewis, J.O.; Vallindras, M.; Argiriou, A. Energy conservation in greenhouses with buried pipes. Energy 1996, 21, 353–360. [Google Scholar] [CrossRef]
  42. Tataraki, K.; Giannini, E.; Kavvadias, K.; Maroulis, Z. Cogeneration economics for greenhouses in Europe. Energies 2020, 13, 3373. [Google Scholar] [CrossRef]
  43. Zhang, S.; Guo, Y.; Zhao, H.; Wang, Y.; Chow, D.; Fang, Y. Methodologies of control strategies for improving energy efficiency in agricultural greenhouses. J. Clean. Prod. 2020, 274, 122695. [Google Scholar] [CrossRef]
  44. Chen, J.; Xu, F.; Tan, D.; Shen, Z.; Zhang, L.; Ai, Q. A control method for agricultural greenhouses heating based on computational fluid dynamics and energy prediction model. Appl. Energy 2015, 141, 106–118. [Google Scholar] [CrossRef]
  45. Singh, D.; Basu, C.; Meinhardt-Wollweber, M.; Roth, B. LEDs for energy efficient greenhouse lighting. Renew. Sustain. Energy Rev. 2015, 49, 139–147. [Google Scholar] [CrossRef] [Green Version]
  46. Jiang, J.; Mohagheghi, A.; Moallem, M. Energy-Efficient Supplemental LED Lighting Control for a Proof-of-Concept Greenhouse System. IEEE Trans. Ind. Electron. 2020, 67, 3033–3042. [Google Scholar] [CrossRef]
  47. Viršile, A.; Olle, M.; Duchovskis, P. LED Lighting in Horticulture; Gupta, D., Ed.; Springer: Kharagpur, India, 2017; ISBN 9789811058073. [Google Scholar]
  48. Gorjian, S.; Calise, F.; Kant, K.; Ahamed, M.S.; Copertaro, B.; Najafi, G.; Zhang, X.; Aghaei, M.; Shamshiri, R.R. A review on opportunities for implementation of solar energy technologies in agricultural greenhouses. J. Clean. Prod. 2021, 285, 124807. [Google Scholar] [CrossRef]
  49. Esen, M.; Yuksel, T. Experimental evaluation of using various renewable energy sources for heating a greenhouse. Energy Build. 2013, 65, 340–351. [Google Scholar] [CrossRef]
  50. Russo, C.; Cappelletti, G.M.; Nicoletti, G.M.; Di Noia, A.E.; Michalopoulos, G. Comparison of European olive production systems. Sustainability 2016, 8, 825. [Google Scholar] [CrossRef] [Green Version]
  51. Kinney, C.; Dehghani-Sanij, A.; Mahbaz, S.; Dusseault, M.B.; Nathwani, J.S.; Fraser, R.A. Geothermal Energy for Sustainable Food Production in Canada’s Remote Northern Communities. Energies 2019, 12, 4058. [Google Scholar] [CrossRef] [Green Version]
  52. Government of the Netherlands. Government Stimulates Geothermal heat | Renewable Energy | Government.nl. Available online: https://www.government.nl/topics/renewable-energy/government-stimulates-geothermal-heat (accessed on 29 April 2022).
  53. European Commission. The New Common Agricultural Policy: 2023–27 | European Commission. Available online: https://ec.europa.eu/info/food-farming-fisheries/key-policies/common-agricultural-policy/new-cap-2023-27_en (accessed on 29 April 2022).
  54. Paris, B.; Vandorou, F.; Tyris, D.; Balafoutis, A.T.; Vaiopoulos, K.; Kyriakarakos, G.; Manolakos, D.; Papadakis, G. Energy Use in the EU Livestock Sector: A Review Recommending Energy Efficiency Measures and Renewable Energy Sources Adoption. Appl. Sci. 2022, 12, 2142. [Google Scholar] [CrossRef]
Figure 1. Energy consumption in high energy intensity tomato greenhouse production in Spain (GJ/ha) (based on [28]).
Applsci 12 05150 g001
Figure 2. Energy consumption in low energy intensity greenhouse production in Spain (GJ/ha) (based on [22]).
Applsci 12 05150 g002
Figure 3. Energy consumption in high energy intensity greenhouse production in Greece (GJ/ha) (based on [23,24,30]).
Applsci 12 05150 g003
Figure 4. Energy consumption in low energy intensity greenhouse production in Greece (GJ/ha) (based on [15]).
Applsci 12 05150 g004
Figure 5. Energy consumption low-energy intensity greenhouse production in Italy (GJ/ha) (based on [34]).
Applsci 12 05150 g005
Figure 6. Greenhouse energy consumption for selected crops in the Netherlands (GJ/ha) (based on [15,37]).
Applsci 12 05150 g006
Figure 7. Energy consumption in the German greenhouse sector (GJ/ha) (based on [15]).
Applsci 12 05150 g007
Figure 8. Percentages of the energy sources used for greenhouse heating in Germany (based on [39]).
Applsci 12 05150 g008
Figure 9. Energy inputs in high energy intensity tomato production systems (GJ/ha) (based on [15,28,40]).
Applsci 12 05150 g009
Figure 10. Energy inputs in low energy intensity tomato production systems (GJ/ha) (based on [15,22,34]).
Applsci 12 05150 g010
Table 1. Area of vegetables, flowers, and permanent crops under glass EU-27 (ha) [19].
Country2005200720102013
Belgium2140212020601800
Bulgaria900114010901080
Czechia18019000
Denmark450470460400
Germany (until 1990 former territory of the FRG)3370343031703110
Estonia60604040
Ireland603060180
Greece4670534042904730
Spain52,17052,72045,70045,200
France96209790:11,190
Croatia:250410500
Italy28,64026,50039,10038,910
Cyprus420430450420
Latvia110805040
Lithuania1010450310330
Luxembourg01000
Hungary1910176019602260
Malta707080100
Netherlands10,54010,37098209330
Austria290580620720
Poland7170756066308080
Portugal2310222023602490
Romania2790325030203300
Slovenia170180170160
Slovakia250190150100
Finland450440420400
Sweden420180200260
Total130,170129,810122,620135,130
Table 2. Range of energy consumption per category in EU greenhouses (%).
Energy Consumption per CategoryRange of Total Energy Consumption
Heating and cooling0–99%
Irrigation1–19%
Fertilizers1–27%
Pesticides0–6%
Lighting1%
Publisher’s Note: MDPI stays neutral with regard to jurisdictional claims in published maps and institutional affiliations.

