
qEEG Analysis in the Diagnosis of Alzheimer’s Disease: A Comparison of Functional Connectivity and Spectral Analysis


1
Department of Communication & Cognition, Tilburg University, 5037 AB Tilburg, The Netherlands
2
Department of Cognitive Science & Artificial Intelligence, Tilburg University, 5037 AB Tilburg, The Netherlands
*
Author to whom correspondence should be addressed.
Appl. Sci. 2022, 12(10), 5162; https://0-doi-org.brum.beds.ac.uk/10.3390/app12105162
Submission received: 25 March 2022
/
Revised: 9 May 2022
/
Accepted: 17 May 2022
/
Published: 20 May 2022
(This article belongs to the Special Issue Application of Electroencephalography (EEG) Signal Analysis in Disease Diagnosis)
Abstract
:Alzheimer’s disease (AD) is a brain disorder that is mainly characterized by a progressive degeneration of neurons in the brain and decline of cognitive abilities. This study compared an FFT-based spectral analysis against a functional connectivity analysis for the diagnosis of AD. Both quantitative methods were applied on an EEG dataset including 20 diagnosed AD patients and 20 age-matched healthy controls (HC). The obtained results showed an advantage of the functional connectivity analysis when compared to the spectral analysis; while the latter could not find any significant differences between the AD and HC groups, the functional connectivity analysis showed statistically higher synchronization levels in the AD group in the lower frequency bands (delta and theta), suggesting a ‘phase-locked’ state in AD-affected brains. Further comparison of functional connectivity between the homotopic regions confirmed that the traits of AD were localized to the centro-parietal and centro-temporal areas in the theta frequency band (4–8 Hz). This study applies a neural metric for Alzheimer’s detection from a data science perspective rather than from a neuroscience one and shows that the combination of bipolar derivations with phase synchronization yields similar results to comparable studies employing alternative analysis methods.
1. Introduction
Alzheimer’s disease (AD) is a brain disorder that is mainly characterized by a progressive degeneration of neurons in the brain. As the disease progresses, a cortical disconnection occurs, causing a deficit in memory and a decline in other cognitive capabilities [1]. AD-related effects on the patient’s brain can be identified with various tools, one option being the electroencephalogram (EEG), which measures the electrical activity of the brain. EEG is a fast and non-invasive method that provides a high temporal resolution. However, it lacks in spatial resolution, meaning that it is not the most precise method for the diagnosis of a brain disorder.
Quantitative EEG (qEEG) analysis takes EEG recordings, commonly interpreted by clinicians using visualization tools, one step further, giving the possibility of digitally processing and presenting the signal characteristics in spectral and spatial domains [2]. In a spectral analysis, a given signal is broken down and examined in the frequency domain. This type of analysis is useful when finding differences between patients who are diagnosed with a disorder and healthy individuals, by examining the relevant frequency bands to identify a noticeable change in the activity within a particular frequency band [3]. A very common yet powerful tool used in spectral analysis is the fast Fourier transformation (FFT) [4]. This algorithm can be used to find band-specific differences by calculating the power of each band separately.
When conducting a spectral analysis, the power spectral density (PSD) is often used to determine differences in brain activity between frequency bands. Previous studies have shown that when compared to healthy controls (HC), AD patients show an increase of PSD in the theta band and a decrease in the alpha band [3,5,6]. In AD diagnosis specifically, a spectral analysis can show discrepancies between AD and other types of dementia, such as vascular dementia (VaD) [1].
However, while these studies suggest that EEG spectral analysis may differentiate AD patients from HC [7], several other studies that have examined the process of AD have concluded that this brain disorder is involved with changes in the distributed networks related to memory [8] and that the changes observed in the frequency bands may not sufficiently reflect this. In addition, it is known that the FFT is not the most adequate tool for non-stationary signals such as the EEG [9,10]. Moreover, as mentioned above, patients suffering from AD experience a cortical disconnection. It is therefore important to examine various regions of interest (ROIs) that are affected by the disease. Hence, more reliable signal processing methods are required to capture the complexity of this disorder and investigate the processes that underlie the occurring symptoms [11,12]. An alternative to a spectral analysis is the connectivity analysis; a method which allows one to study the communications between different regions of the brain [12].
Functional connectivity analysis measures the degree of synchronization between two EEG signals; a higher connectivity indicates more effective communication between the examined brain regions [13]. There are several ways of conducting a functional connectivity analysis. For instance, Coherence analysis has been used exhaustively in detecting differences between AD patients and HC. Recent studies indicated a decrease in the coherence levels between ROIs for AD [3,14]. Although coherence has brought some novelty in studies involving AD patients, it is worth mentioning that it solely accounts for linear correlations, thus not considering nonlinear interactions.
Nonlinear correlations, on the other hand, can give crucial information in a functional connectivity analysis. A widely used method for this is the phase synchronization (PS) analysis. PS looks at the oscillatory activity in two brain regions in terms of their phases [15]. The oscillations are therefore said to be synchronized if their phases are similar. PS excels over coherence analysis in terms of being able to account for nonlinearity [16]. Moreover, a study has shown that differences have been found in terms of the synchronization between within-band connections and between-band connections (e.g., within the delta band; between the delta and theta bands) [17]. This study in particular also discovered that AD patients showed much a lower strength of synchronization for between-frequency band analysis when compared to HC.
PS has several indices of measurement, with the phase-lag index (PLI) and phase-locking value (PLV) being the most-used measures [18]. The PLI takes a time-series of phase differences and computes the asymmetry corresponding to the distribution of these phase differences [19]. In a recent PS study using the PLI as the index of choice, results showed that in AD patients, the lower alpha band presented a decrease in functional connectivity situated in the posterior region [20]. On the other hand, PLV looks at the consistency in phase difference. The PLV value ranges from zero, indicating random phase differences, to one, indicating a fixed phase difference [21]. For example, a study performing cross-frequency coupling (CFC), using PLV on AD patients, reached the conclusion that oscillations in the alpha band, and more specifically around the dominant peak, are phase-locked with the gamma band power [22]. Results were observable in the posterior region of the brain, suggesting that AD elicits a region-specific change in functional connectivity.
It is noteworthy that functional connectivity entails its own drawbacks too. In a comprehensive review of different methods for functional connectivity analysis and their caveats, Bastos and Schoffelen indicated that many of the connectivity measures are prone to volume conduction and hence can yield false positive results [16]. This is particularly the case for methods using unipolar derivations with a common reference. However, as it will be further explained in this paper, this study employed bipolar EEG montages, thus greatly diminishing the issue. The same review study [16] highlighted another disadvantage of functional connectivity, namely the signal-to-noise ratio (SNR) problem; an excessive amount of noise in the signal of interest during the EEG signal retrieval may cause false connectivity results.
In sum, the current state-of-the-art calls for a comparison between computational methods that are used for diagnosis of Alzheimer’s disease. The reviewed literature focusing on spectral analysis and functional connectivity demonstrates a scarcity of studies employing both methods in diagnosis of AD. It should be mentioned that although spectral analysis and functional connectivity analysis have different applications from a physiological perspective, applying both methods on a single dataset can be useful in determining the more accurate method in the diagnosis of AD based on brain activity. This is the gap that this study aimed to address. So far, several studies have reported the outcomes of either of the two methods [23,24]. However, conducting a connectivity analysis and comparing it with a spectral analysis using the same dataset presents two advantages; (1) it shows which method can yield the most accurate and complete information in AD diagnosis [3], and (2) it can identify the affected ROIs instead of solely looking at whether the patient suffers from AD, which is believed to help predicting AD in its early stages of development [12].
The proposed study serves as a comparison between two methods in qEEG, namely the spectral and functional connectivity analyses. Having highlighted the advantages of PS over other connectivity measures, this study aimed to investigate the performance of PS in differentiating AD patients from HCs as compared to conventional FFT. This is done with the goal of identifying the most efficient method in implementation of machine-assisted diagnosis tools in the future clinical assessment of AD. The two types of analysis were conducted on a set of EEG recordings obtained from patients suffering from AD and from their respective healthy controls (HC), in an attempt to address the following research question:
RQ1.
How does a functional connectivity analysis perform against a spectral analysis in finding differences between patients diagnosed with Alzheimer’s disease (AD) and healthy controls (HC)?
Moreover, this study attempted to answer a secondary research question:
RQ2.
Can a functional connectivity analysis localize the differences identified in the brain activity of AD subjects when compared to that of the HCs?
To answer this question, a series of statistical tests were performed using the results provided by the connectivity analysis.
2. Materials and Methods
2.1. Dataset and Preprocessing
The EEG dataset was provided by the University of Sheffield, from an open study and under a relevant NDA. All subjects were informed about the experiment and signed an informed consent form. The dataset consists of 12 s, eyes-open recordings of 20 AD-diagnosed patients and 20 age-matched HC, younger than 70 years of age (Table 1).
The participants’ EEGs were recorded using the International 10–20 system [25]. To reduce volume conduction effects from a common reference [26], 23 bipolar derivations were used in this study. Figure 1 gives an overview of the electrodes and bipolar channels. More specifically, the following bipolar channels were used: F8-F4, F7-F3, F4-C4, F3-C3, F4-FZ, FZ-CZ, F3- FZ, T4-C4, T3-C3, C4-CZ, C3-CZ, CZ-PZ, C4-P4, C3-P3, T4-T6, T3-T5, P4-PZ, P3-PZ, T6-O2, T5-O1, P4-O2, P3-O1, and O2-O1. These bipolar channels are the most commonly used in clinical practice [27]. During the recording, the participants were instructed to reduce their movements and not to think of anything in particular (i.e., resting state EEG).
The raw EEG signals were preprocessed in EEGLAB (v.2021.0), MATLAB. First, the signals were downsampled to 500 Hz. Next, a band-pass filter was applied between 0.1 and 100 Hz using EEGLAB functions. This was done following the requirements used for the phase synchronization (see Section 2.3. ‘Functional Connectivity Analysis’) to avoid phase distortion. Additionally, a notch filter was used to attenuate signals in the 48–52 Hz range.
2.2. Spectral Analysis
The power spectral density (PSD) of the entire signal for each of the bipolar montages was calculated using EEGLAB’s spectopo() function. This function makes use of the FFT algorithm to extract and plot the PSD. The signal was subsequently divided into five frequency bands: delta (1–4 Hz), theta (4–8 Hz), alpha (8–13 Hz), beta (13–30 Hz), and gamma (36–44 Hz) and the mean power in each band was computed. These ranges were selected according to [28] and were also used in the connectivity analysis. A Shapiro–Wilk test was applied to the data to check for normality and subsequently, a Mann–Whitney U-test was used to compare band power medians between the AD and HC groups.
2.3. Functional Connectivity Analysis
Functional connectivity analysis was carried out using the PLV index [28]. First, a continuous wavelet transform was applied (i.e., the complex Morlet wavelet), with this wavelet being used as a kernel to compute the PLV, which is defined by Equation (1):
where n is an index for the trial number and θ indicates the phase difference. The phase-locking value yielded by PLV ranges from 0 to 1, with 1 indicating that two signals have an identical relative phase across N trials. Conversely, values that approach 0 indicate little to no phase synchrony between the signals. For every subject, the PLV was calculated for all possible 253 bipolar channel combinations in five frequency bands as defined above. Next, inspired by [29], ‘Global Connectivity’ and ‘Homotopic Pair Connectivity’ were computed using the extracted PLV values and were compared between the groups.
2.3.1. Global Connectivity
Global connectivity was computed by averaging all 253 PLV values that were obtained per frequency band. This led to a total of five PLVmean values per subject (i.e., one PLVmean per frequency band). Following the Shapiro–Wilk test, a Mann–Whitney U-test was used to compare the mean PLVs between the AD and HC groups. The aim of this evaluation was to determine whether band-specific differences could be found in the global functional connectivity of the AD subjects against the HCs.
2.3.2. Homotopic Pair Connectivity
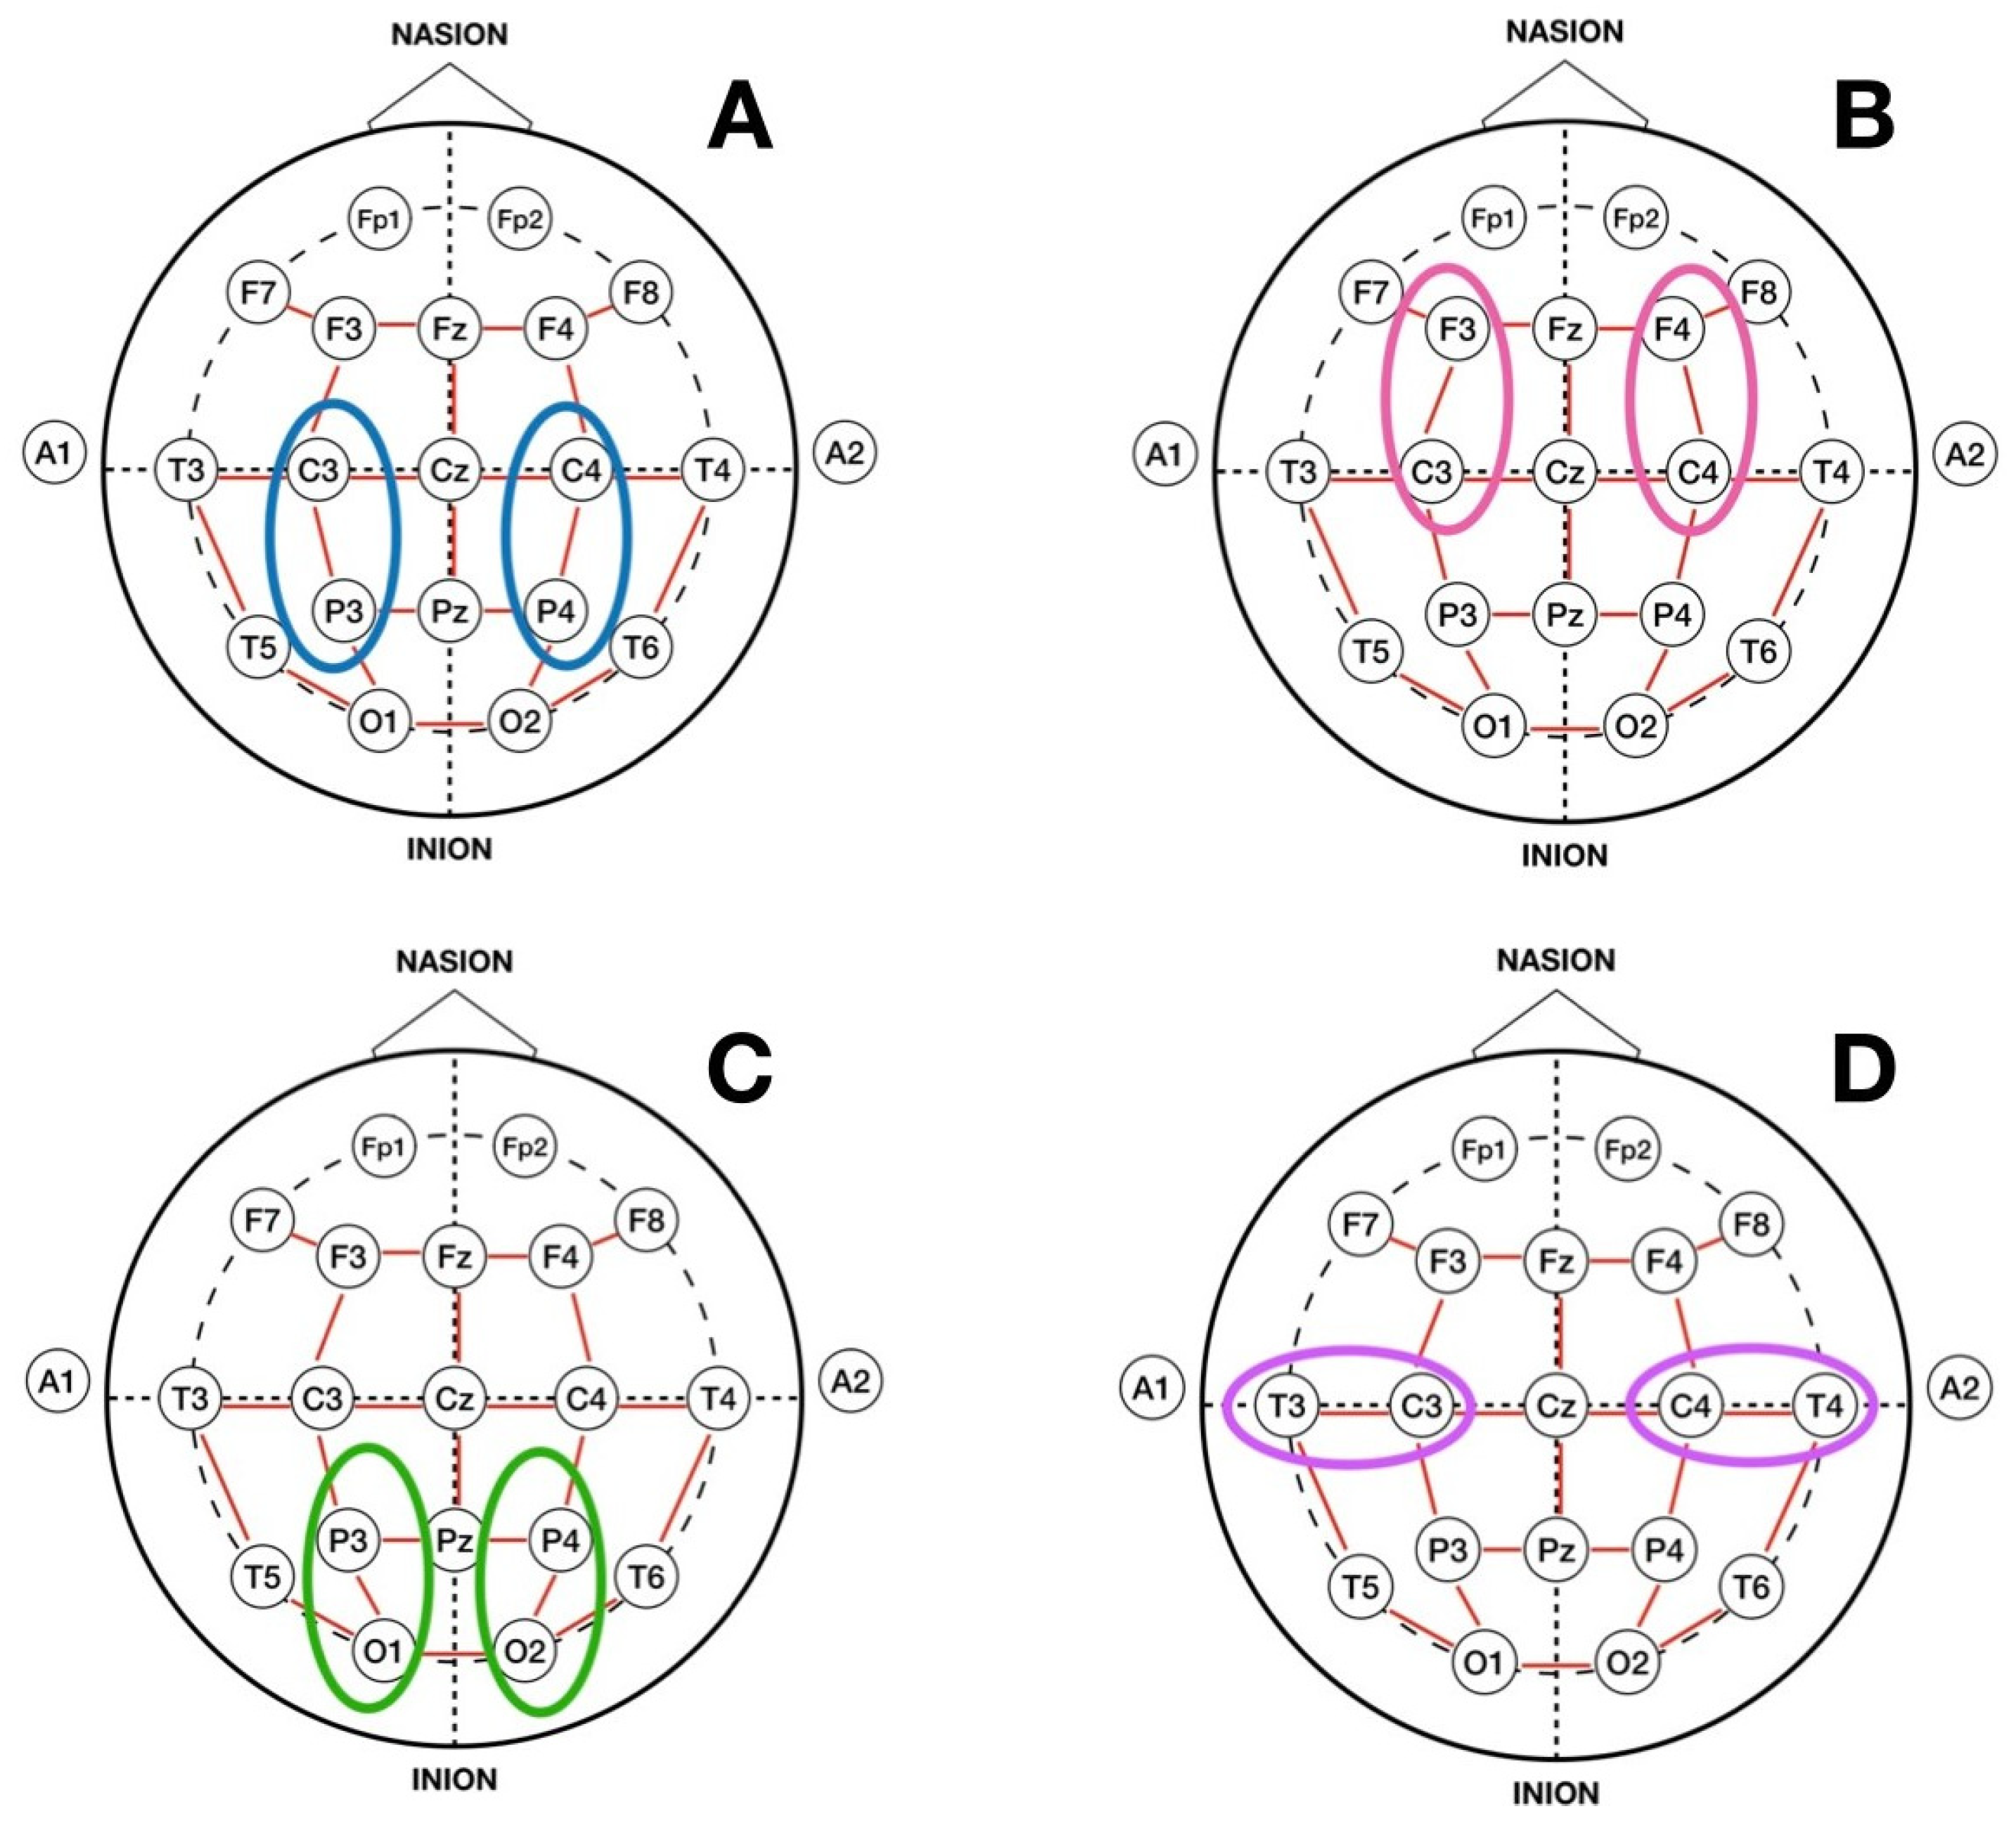
Homotopic Pair Connectivity was computed by focusing on certain pairs of bipolar derivations that were homotopic in the left and right brain hemispheres (mirror areas of the brain hemispheres). Based on previous classifications [30,31], four pairs that have been, in part, shown to be most affected by Alzheimer’s disease were selected. These pairs are depicted in Figure 2. Pair A consisted of the homotopic pair located in the centro-parietal region of the brain (C3-P3 and C4-P4). Pair B corresponded to the pair in the fronto-central area (F3-C3 and F4-C4), Pair C consisted of electrodes located in the parieto-occipital region (P3-O1 and P4-O2), and Pair D consisted of electrodes placed in the centro-temporal area (C3-T3 and C4-T4). For each pair, the PLV was computed in the five frequency bands and a Mann Whitney U–test was carried out to compare the band-specific PLVs between the two AD and HC groups.
2.3.3. Localization of AD Using Homotopic Pair Connectivity
To answer the secondary RQ, the four homotopic pairs were compared against each other to ascertain as to which areas displayed a significant connectivity difference between the two groups. To do this, the PLV values obtained from both subject groups in each of the above-mentioned homotopic pairs were compared using linear mixed effects (LME) regression models. LME was fitted in RStudio (v.2021.09.10) using the lme4() package [32] and was chosen for this analysis because the repeated measure from the homotopic pairs was correlated, violating the assumptions of other tests, such as ANOVA.
The analysis included two steps; first, the LME model was fitted with PLVs as the response variable and pair and group as predictors. Participants were included as a random factor in the model. The interaction term was included to prevent the overly enthusiastic outcome that there is a difference in connectivity between HC and AD for all pairs. Next, following verification of the main effects, post-hoc comparisons were conducted between pairs to examine which brain regions showed significant differences between the two groups. These steps were only applied to the frequency bands that showed a statistically significant difference between the AD and HC groups in at least one of the homotopic pairs in the ‘Homotopic Pair Connectivity’ analysis.
3. Results
3.1. Spectral Analysis
The Shapiro–Wilk test applied to the band power data rejected the null hypothesis of normal populations distributions (p < 0.05). Therefore, the non-parametric Mann–Whitney U-test was used to compare the groups in each frequency band. The test did not find any significantly different delta power for the AD subjects (Mdn = 4.23) than the healthy controls (Mdn = 4.07), U = 174, p = 0.45. Similar results were observed for the theta (Mdn = 2.42 vs. Mdn = 4.30, U = 146, p = 0.15), alpha (Mdn = 1.88 vs. Mdn = 2.29, U = 162, p = 0.31), beta (Mdn = 1.67 vs. Mdn = 1.76, U = 152, p = 0.2), and gamma bands (Mdn = 0.67 vs. Mdn = 0.90, U = 158, p = 0.26). Therefore, it can be concluded that the spectral analysis yielded no significant differences between the AD subjects versus HC in any of the five frequency bands.
3.2. Functional Connectivity Analysis
3.2.1. Global Connectivity
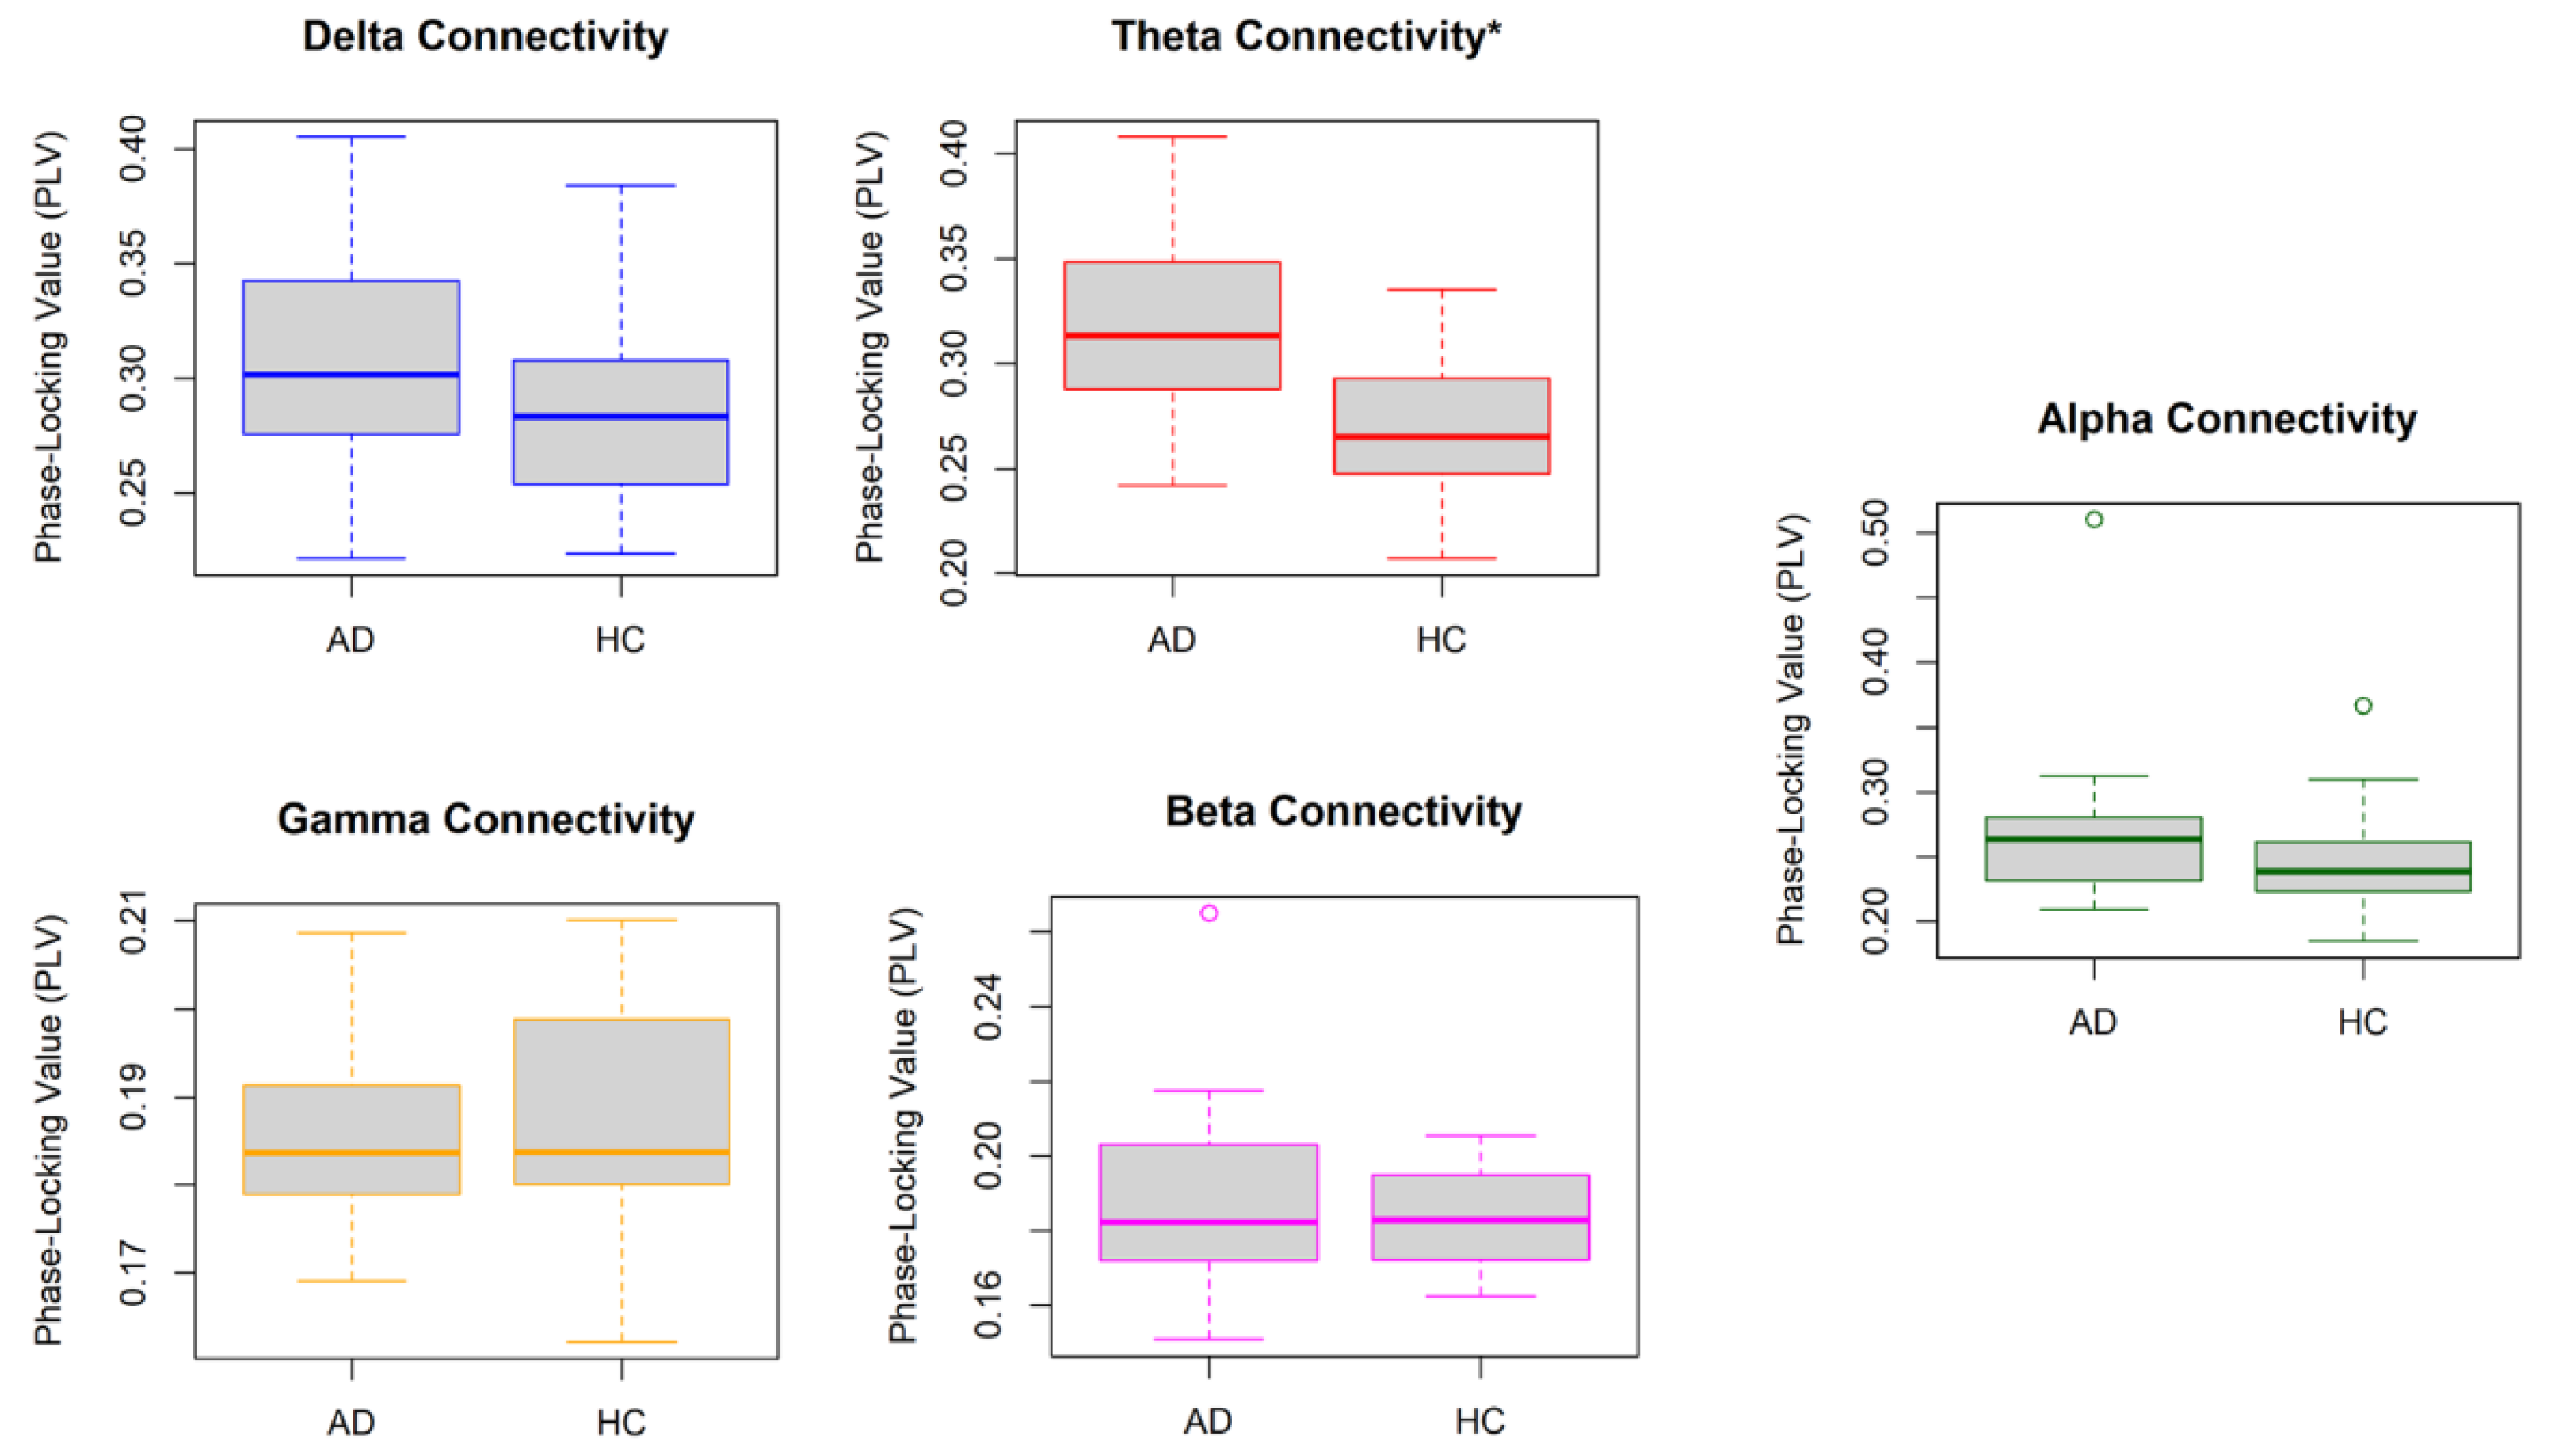
Figure 3 illustrates the distribution of PLVmean from all subjects in the AD and HC groups in all five frequency bands. The result of the Mann–Whitney U-test indicated that the average PLVs from all channel combinations were significantly higher in the theta band for the AD participants (Mdn = 0.31) when compared to the HCs (Mdn = 0.26), U = 326, p = 0.0004. This was not the case for the delta (Mdn = 0.30 vs. Mdn = 0.28, U = 258, p = 0.12), alpha (Mdn = 0.26 vs. Mdn = 0.24, U = 264, p = 0.09), beta (Mdn = 0.18 vs. Mdn = 0.18, U = 226, p = 0.50), and gamma bands (Mdn = 0.18 vs. Mdn = 0.18, U = 181, p = 0.62).
3.2.2. Homotopic Pair Connectivity
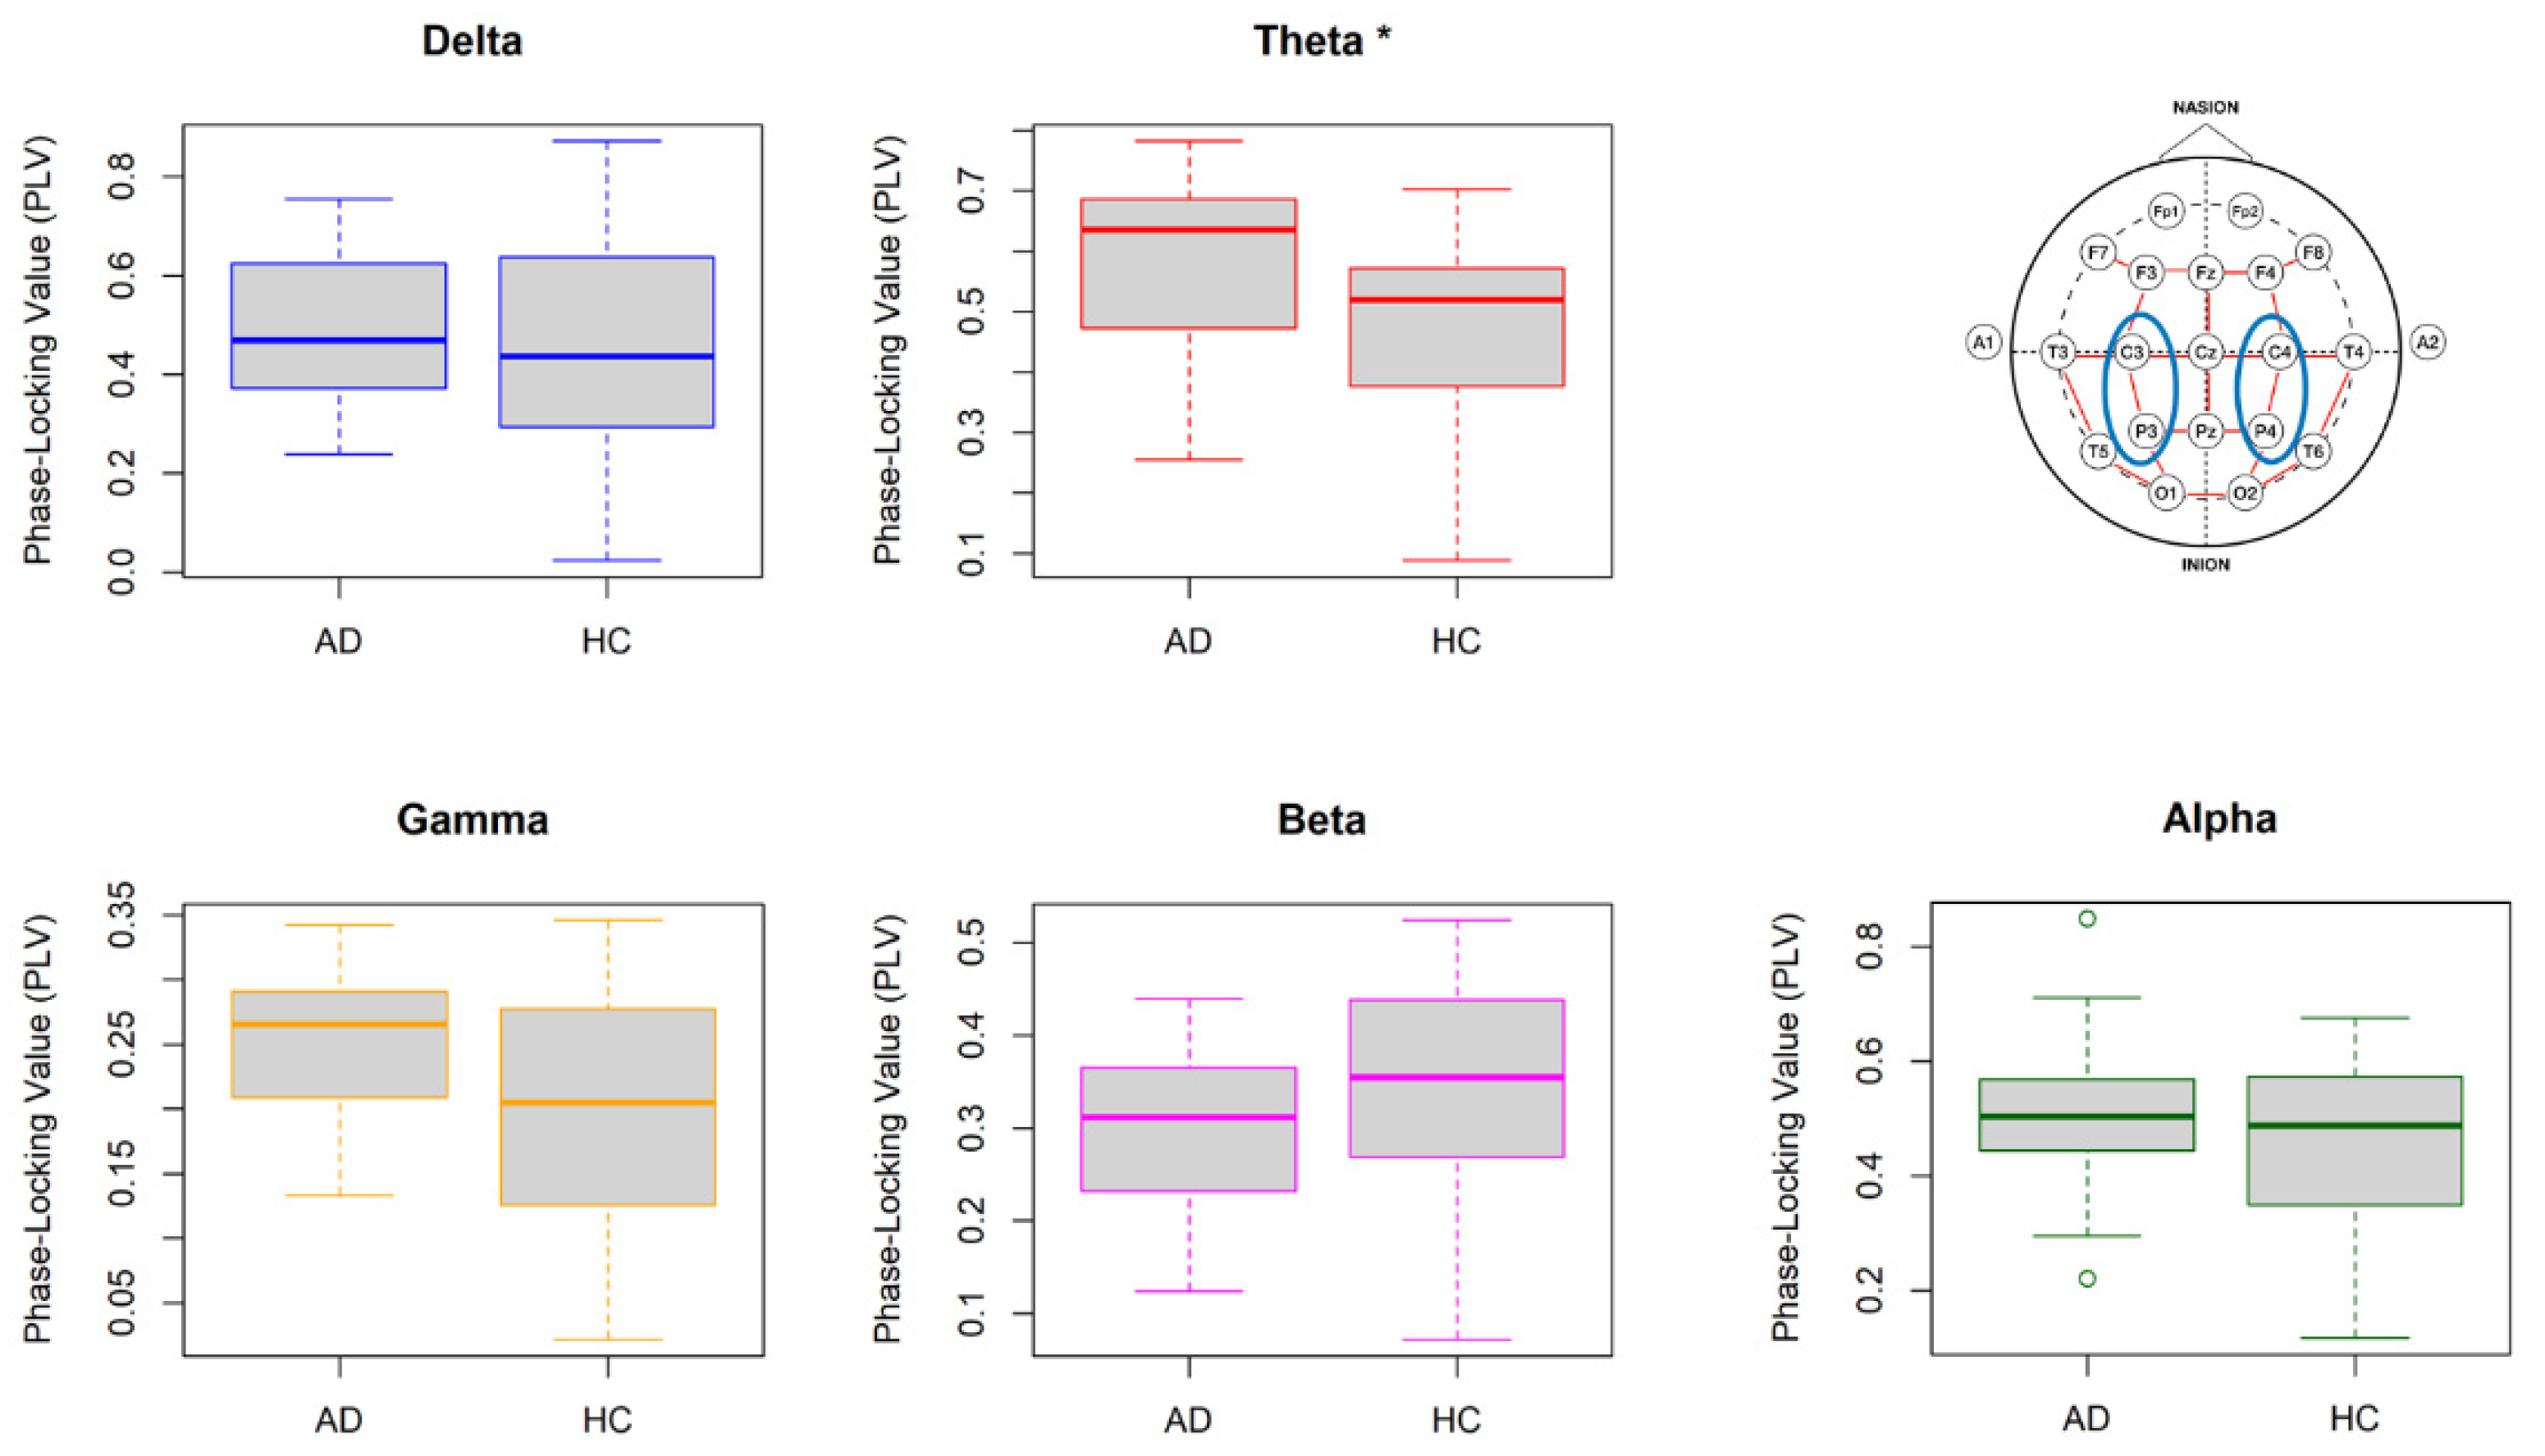
Figure 4 illustrates the PLV values obtained from the homotopic pair in the centro-parietal area (Pair A) of the AD and HC groups in the five frequency bands. The Mann–Whitney U-test displayed a significantly higher PLV in the theta band for AD participants (Mdn = 0.64) as compared to HCs (Mdn = 0.52), U = 292, p = 0.01. No significant results were found for the other four frequency bands.
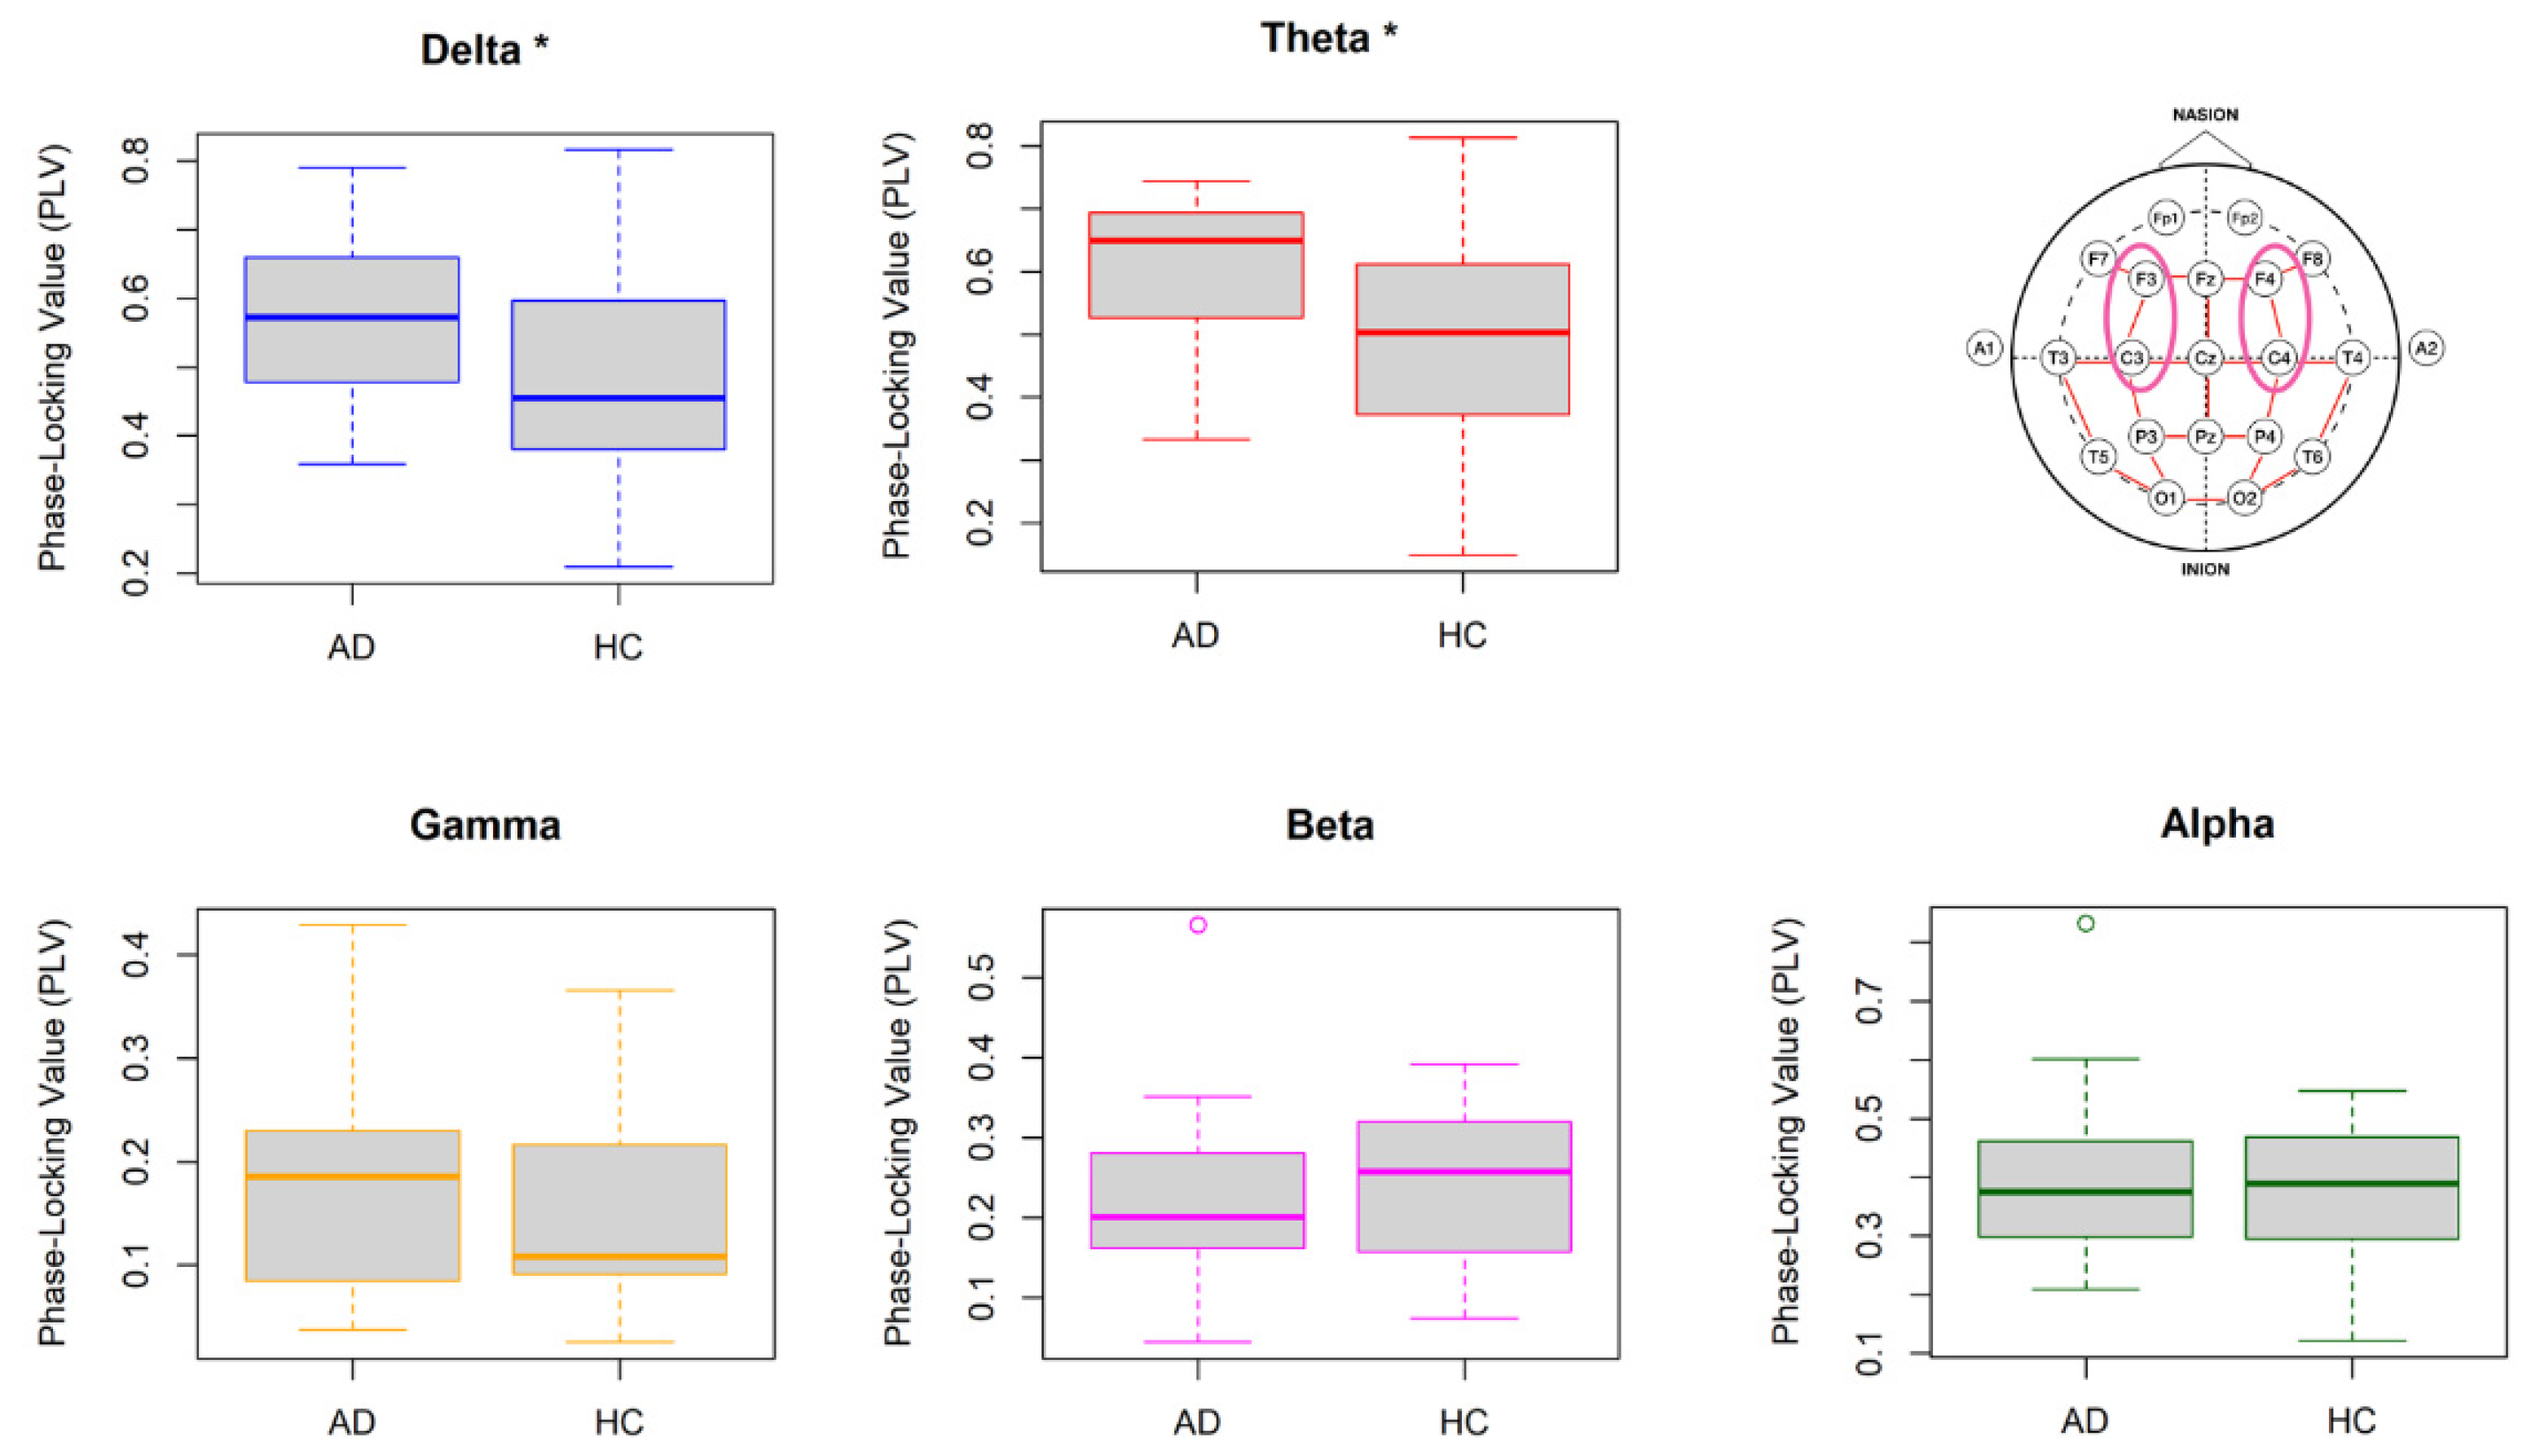
Figure 5 illustrates the PLV values obtained from the homotopic pair in the fronto-central region (Pair B) of the AD and HC groups in the five frequency bands. The Mann–Whitney U-test displayed a significantly higher PLV for AD participants in both the delta (AD Mdn = 0.57, HC Mdn = 0.45, U = 275, p = 0.04) and theta bands (AD Mdn = 0.65, HC Mdn = 0.50, U = 282, p = 0.03). No significant results were found for the other three frequency bands.
Figure 6 illustrates the PLV values obtained from homotopic pairs in the parieto-occipital region (Pair C) of the AD and HC groups in the five frequency bands. The Mann–Whitney U-test indicated a significantly higher PLV for the AD group (Mdn = 0.64) as compared to the HCs (Mdn = 0.49), solely in the delta band (U = 293, p = 0.01). The test resulted in an insignificant outcome for the other four frequency bands.
Lastly, Figure 7 shows the PLV values obtained from homotopic pairs in the centro-temporal region (Pair D) of the AD and HC groups in the five frequency bands. The Mann–Whitney U-test indicated a significantly higher PLV solely in the theta band of AD participants (Mdn = 0.48) as compared to the HCs (Mdn = 0.40, U = 280, p = 0.03). The results of group comparisons in the other four frequency bands remained insignificant.
Summing up, the comparison of PLV in the selected homotopic pairs resulted in observing the main differences in the low frequency bands of delta and theta.
3.2.3. Localization of AD Using Homotopic Pair Connectivity
To compare the connectivity across homotopic pairs and to identify the most relevant brain region affected by AD, LME regression models were applied to the homotopic PLVs in the theta and delta frequency bands. The model confirming main effects for both pair and group was selected, and a post-hoc analysis using the Tukey’s adjusted pairwise comparisons of least-squares means were conducted. Table 2 summarizes the outcome of the post-hoc comparisons.
In the theta band, the pairwise difference between AD patients and HCs reached significance for Pair A (LSM difference = 0.115, SE = 0.0517, p = 0.028) and Pair D (LSM difference = 0.101, SE = 0.0517, p = 0.038). While not statistically significant, trends were observed for Pair B (LSM difference = 0.097, SE = 0.0517, p = 0.064), whereas the difference between the AD and the HC group did not reach significance for Pair C. No significance was observed in the delta band.
4. Discussion
The current study explored differences in the brain activity of patients afflicted with Alzheimer’s disease compared to a healthy control cohort, using the quantitative analyses of EEG signals. In particular, two types of analyses were conducted and compared. First, a conventional spectral analysis was conducted to find spectral band power differences between AD subjects and healthy controls. The second approach employed a functional connectivity analysis using phase synchronization across five frequency bands to compare the intra-brain connectivity (global or local) between healthy brains and the ones affected by AD-induced dementia. The results indicated that the spectral analysis did not yield any significant differences between the AD and HC groups, suggesting that it is not an ideal method for the diagnosis of AD based on the EEG. On the other hand, the functional connectivity analysis using the PLV measure showed significant differences between the groups, both in terms of global connectivity and homotopic connectivity. The further analysis of homotopic pairs revealed significantly higher theta-band connectivity localized in the centro-parietal and centro-temporal regions.
The dataset used in this study consisted of bipolar derivations, instead of unipolar channel values that are more commonly used in the qEEG analysis [22,29]. The use of bipolar derivations is seen as a more advantageous method when compared to unipolar or average referencing methods [33], as it can mitigate the issues associated with common active referencing such as volume conduction [34]. Volume conduction, which refers to the leakage of electrical potentials to the neighboring electrodes, can complicate the interpretation of connectivity metrics. Therefore, the use of bipolar derivations in the computation of functional connectivity is highly recommended, as was demonstrated in a recent study in the field of AD detection [30].
The spectral analysis, although being a powerful tool for analyzing specific types of signals, could not confirm any differences between the Alzheimer’s patients recruited in this study and their age-matched healthy controls. This is inconsistent with previous reports in which the development of AD was associated with an increase of delta and theta activity as well as a decrease in alpha and beta activity [5,6,17]. An explanation for the lack of evidence in the current study could be that the AD subjects included in the sample were only moderately affected by this disorder. In addition, the use of bipolar derivations could have affected the results observed, since past studies made use of unipolar derivations to obtain the spectral powers of the specific EEG channels [3,5]. Another reason could be due to the number of participants in the selected dataset; had it been higher, different results might have emerged. For example, the study by Fraga et al., [5] made use of 75 participants, split into three categories (i.e., 27 with mild AD, 22 with moderate AD, and 27 HCs). While this leaves room for future research to confirm the most suitable computational approach for the detection of severe cases, this study proposes functional connectivity as being a promising tool in detection of early signs of AD from EEG signals [35].
The two connectivity analyses that were subsequently carried out, namely ‘Global Connectivity’ and ‘Homotopic Pair Connectivity’, displayed increased communication between brain networks in the AD subject group when compared to the HCs. These findings were first identified in the global connectivity analysis and subsequently confirmed in the homotopic pair connectivity analysis. The global connectivity analysis gave an overview of the AD process in the brain. Although it resulted in identifying higher connectivity that was distributed in the brains of the AD group, it could not localize the effect. Indeed, the effect of Alzheimer’s disease tends to be more prominent in some areas of the brain than others [30,31], hence justifying a motive to pursue a further analysis with the homotopic pair connectivity. Similar to the band division performed to retrieve the PSD in a spectral analysis, in functional connectivity studies involving AD subjects, electrode pairs can be singled out and evaluated separately, instead of combining them all together [36]. The analysis of homotopic pairs revealed a significant difference of connectivity in the delta band of the pairs in the fronto-central and the parieto-occipital regions, whereas these effects were diminished in the global connectivity analysis, which only found a significant difference between the groups in the theta band.
The result indicating a higher functional connectivity of the AD brains conflicts with the study of Hata et al. [12], who reported a lower lagged phase synchronization in the delta and theta bands of AD patients. Indeed, a decreased connectivity between brain regions can be expected, as AD is known to cause neuronal loss and the damage of neural pathways [1,8,22]. However, other studies suggest that the impact of such damage is only reflected in fast signals, as healthy participants have a higher brain connectivity in alpha and beta bands [19,20] but not in the lower frequency bands. On the other hand, it has been shown in the past that patients suffering from neuropsychiatric disorders such as schizophrenia and epilepsy display an increased functional activity between brain networks as a sign of anomaly in information communication [37,38]. In the study of Cai et al. [17], similar patterns were reported for AD patients, where the connectivity within the same frequency band (intra-band connectivity) was stronger in AD brains than in the healthy brain, whereas the connectivity between the frequency bands (inter-band connectivity) was significantly weaker. Observing higher synchronization values in the lower frequency bands for AD subjects can therefore be interpreted as a sign of brain dysfunction [17,20]. More specifically, this study demonstrated that the brains affected by Alzheimer’s disease seemed to be in a ‘phase-lock’ state, causing a high connectivity in the low frequency bands; this is an observation that is well in line with the existing literature [6,17,19,30,36].
The localization of AD analysis reached the conclusion that there was a significant difference in the connectivity between the AD and HC groups in the theta band for two out of four homotopic pairs. The answer to the secondary research question (RQ2) is therefore positive; it is possible to localize to some extent the differences between a healthy brain and one suffering from AD-induced dementia. The findings of this study therefore provide further evidence for damaged neural connections and, consequently, abnormal network dynamics in AD-affected brains, particularly in the centro-parietal and centro-temporal regions. While older studies such as [39] suggested that the effects of AD are not situated in one specific area of the brain, the regions identified by this study are in line with the report of more recent studies such as Deng et al. [40] which observed a significant decrease in signal complexity of the AD group in the occipito-parietal and temporal regions of the brain using ‘multivariate multi-scale weighted permutation entropy’ (MMSWPE) [40]. It is important to note that the findings of this study do not suggest that other brain regions should be excluded in future comparisons between the AD and HC groups. In fact, several studies have indicated that patients suffering from AD tend to have a disruption in brain connectivity in various areas of the brain, as well as in various stages of the disease [41]. The results of the proposed study, although solely being able to identify AD in the areas mentioned above, do not reject the hypothesis that AD can affect connectivity in other regions of the brain and hence this provides opportunity for future studies to confirm.
Clearly, this study is not without limitations. A first limitation arises from the duration of the epochs that were available in the dataset (12 s per subject). Longer epochs would have provided more EEG samples for phase synchronization analysis, as well as an opportunity to evaluate the dynamic changes of connectivity over time, as had been previously done in Zhao et al. [30]. Another limitation involved the number of participants, as previously mentioned. The dataset used in this research consisted of 20 AD participants and 20 age-matched HCs. Given the individual differences inherent to the progress of AD, a larger dataset would have been optimal to yield more reliable results. Moreover, this study made use of the phase-locking value as an index for phase synchronization, as the data was recorded in a bipolar manner, and therefore the analysis was considered to be robust to the common source effects [27,30]. Future research could use other indices of functional connectivity, such as coherence and phase-lag index (PLI), to investigate their efficacy in detecting AD impacts on the brain activity.
Finally, it shall be noted that this study applies a neural metric for Alzheimer’s Disease detection from a data science perspective rather than a neuroscience one. This implies that the methodology employed in this study strived to find an accurate tool for the detection of AD from EEG brain activity, rather than attempting to explain the cognitive and neural mechanisms that underlie the observed differences between AD patients and healthy controls. In this case, the findings of this research are well in line with the existing literature regarding AD detection and brain connectivity and show that the combination of bipolar derivations with phase synchronization can yield comparable results to studies that used other connectivity methods. This qEEG analysis could therefore be considered as secondary tool, to be used alongside the visual EEG analysis that is employed by clinicians. Furthermore, as solely post-mortem studies can identify AD with perfect accuracy [6], the authors are aware that the proposed methods in this study may not yield the most accurate results in the prediction of AD from EEG. However, the data science perspective proposed in this study leaves room for more advanced techniques, such as machine learning (ML), which has been growing in the field of AD detection over the past years. Promising results have been observed in regular support vector machine (SVM) models [42], as well as in new, innovative ML methods [43], leaving fertile ground for future research in this domain.
5. Conclusions
This research served to find a promising tool for the diagnosis of early signs of Alzheimer’s Disease (AD), through the interpretation of brain activity. This was done by comparing two quantitative EEG methods, namely spectral analysis and functional connectivity analysis, in two groups of AD patients and age-matched healthy controls. The results indicated that the old-school spectral analysis failed to yield any statistically significant results that could help differentiate a brain that is affected by AD from a healthy one, whereas the functional connectivity analysis using phase synchronization found a significantly stronger global ‘phase-locked’ state in the theta activity of AD-affected brains. Moreover, by extracting the functional connectivity metrics in four homotopic pairs of electrodes, it was possible to localize significant differences concerning the theta band in the centro-parietal and centro-temporal areas of the brain. To conclude, the findings of this research show that functional connectivity analysis using phase synchronization offers a promising quantitative method for future research in the area of AD detection. This method in combination with the standard cognitive tests that are commonly employed in dementia screening can put forward a more accurate diagnosis for patients who suffer from early symptoms of AD.
Author Contributions
Conceptualization, M.S.F. and M.A.; methodology, M.S.F. and M.A.; formal analysis, M.S.F.; writing—original draft preparation, M.S.F.; writing—review and editing, M.S.F. and M.A.; visualization, M.S.F.; supervision, M.A.; funding acquisition, M.A. All authors have read and agreed to the published version of the manuscript.
Funding
This research was funded by Department of Cognitive Science and AI, Tilburg University.
Institutional Review Board Statement
The study was conducted in accordance with the Declaration of Helsinki and approved by the Yorkshire and The Humber (Leeds West) Research Ethics Committee (reference number 14/YH/1070).
Informed Consent Statement
Informed consent was obtained from all subjects involved in the study.
Data Availability Statement
The raw dataset used for this study is under a Non-Disclosure Agreement (NDA) and is therefore not available to the public. The code used to support the findings of this study has been deposited in the GitHub repository, and can be accessed at https://github.com/SemeliF/AD_paper (accessed on 24 February 2022).
Acknowledgments
Authors would like to thank Daniel J. Blackburn and Ptolemaios G. Sarrigiannis from University of Sheffield for providing the EEG dataset used is this research, Sue Yoon from Eindhoven University of Technology for sharing her experience with the functional connectivity analysis and Peter Hendrix from Tilburg University for his guidance regarding the statistical analysis.
Conflicts of Interest
The authors declare no conflict of interest.
References
- Neto, E.; Allen, E.A.; Aurlien, H.; Nordby, H.; Eichele, T. EEG Spectral Features Discriminate between Alzheimer’s and Vascular Dementia. Front. Neurol. 2015, 6, 25. [Google Scholar] [CrossRef] [PubMed] [Green Version]
- Smailovic, U.; Jelic, V. Neurophysiological Markers of Alzheimer’s Disease: Quantitative EEG Approach. Neurol. Ther. 2019, 8 (Suppl. 2), 37–55. [Google Scholar] [CrossRef] [PubMed] [Green Version]
- Wang, R.; Wang, J.; Yu, H.; Wei, X.; Yang, C.; Deng, B. Power Spectral Density and Coherence Analysis of Alzheimer’s EEG. Cogn. Neurodyn. 2015, 9, 291–304. [Google Scholar] [CrossRef]
- Heideman, M.; Johnson, D.; Burrus, C. Gauss and the History of the Fast Fourier Transform. IEEE ASSP Mag. 1984, 1, 14–21. [Google Scholar] [CrossRef] [Green Version]
- Fraga, F.J.; Falk, T.H.; Kanda, P.A.M.; Anghinah, R. Characterizing Alzheimer’s Disease Severity via Resting-Awake EEG Amplitude Modulation Analysis. PLoS ONE 2013, 8, e72240. [Google Scholar] [CrossRef]
- Cassani, R.; Estarellas, M.; San-Martin, R.; Fraga, F.J.; Falk, T.H. Systematic Review on Resting-State EEG for Alzheimer’s Disease Diagnosis and Progression Assessment. Dis. Markers 2018, 2018, e5174815. [Google Scholar] [CrossRef] [Green Version]
- Hampel, H.; Lista, S.; Teipel, S.; Garaci, F.; Nisticò, R.; Blennow, K.; Zetterberg, H.; Bertram, L.; Duyckaerts, C.; Bakardjian, H.; et al. Perspective on Future Role of Biological Markers in Clinical Therapy Trials of Alzheimer’s Disease: A Long-Range Point of View beyond 2020. Biochem. Pharmacol. 2014, 88, 426–429. [Google Scholar] [CrossRef] [Green Version]
- Sperling, R.A.; Dickerson, B.C.; Pihlajamaki, M.; Vannini, P.; LaViolette, P.S.; Vitolo, O.V.; Hedden, T.; Becker, J.A.; Rentz, D.M.; Selkoe, D.J.; et al. Functional Alterations in Memory Networks in Early Alzheimer’s Disease. Neuromol. Med. 2010, 12, 27–43. [Google Scholar] [CrossRef] [Green Version]
- Al-Fahoum, A.S.; Al-Fraihat, A.A. Methods of EEG Signal Features Extraction Using Linear Analysis in Frequency and Time-Frequency Domains. ISRN Neurosci. 2014, 2014, 730218. [Google Scholar] [CrossRef] [Green Version]
- Arrufat-Pié, E.; Estévez-Báez, M.; Estévez-Carreras, J.M.; Machado-Curbelo, C.; Leisman, G.; Beltrán, C. Comparison between Traditional Fast Fourier Transform and Marginal Spectra Using the Hilbert–Huang Transform Method for the Broadband Spectral Analysis of the Electroencephalogram in Healthy Humans. Eng. Rep. 2021, 3, e12367. [Google Scholar] [CrossRef]
- Leuchter, A.F.; Cook, I.A.; Newton, T.F.; Dunkin, J.; Walter, D.O.; Rosenberg-Thompson, S.; Lachenbruch, P.A.; Weiner, H. Regional Differences in Brain Electrical Activity in Dementia: Use of Spectral Power and Spectral Ratio Measures. Electroencephalogr. Clin. Neurophysiol. 1993, 87, 385–393. [Google Scholar] [CrossRef]
- Hata, M.; Kazui, H.; Tanaka, T.; Ishii, R.; Canuet, L.; Pascual-Marqui, R.D.; Aoki, Y.; Ikeda, S.; Kanemoto, H.; Yoshiyama, K.; et al. Functional Connectivity Assessed by Resting State EEG Correlates with Cognitive Decline of Alzheimer’s Disease—An ELORETA Study. Clin. Neurophysiol. 2016, 127, 1269–1278. [Google Scholar] [CrossRef] [Green Version]
- Lombardi, A.; Tangaro, S.; Bellotti, R.; Bertolino, A.; Blasi, G.; Pergola, G.; Taurisano, P.; Guaragnella, C. A Novel Synchronization-Based Approach for Functional Connectivity Analysis. Complexity 2017, 2017, e7190758. [Google Scholar] [CrossRef] [Green Version]
- Babiloni, C.; Lizio, R.; Marzano, N.; Capotosto, P.; Soricelli, A.; Triggiani, A.I.; Cordone, S.; Gesualdo, L.; Del Percio, C. Brain Neural Synchronization and Functional Coupling in Alzheimer’s Disease as Revealed by Resting State EEG Rhythms. Int. J. Psychophysiol. 2016, 103, 88–102. [Google Scholar] [CrossRef]
- Fell, J.; Axmacher, N. The Role of Phase Synchronization in Memory Processes. Nat. Rev. Neurosci. 2011, 12, 105–118. [Google Scholar] [CrossRef]
- Bastos, A.M.; Schoffelen, J.-M. A Tutorial Review of Functional Connectivity Analysis Methods and Their Interpretational Pitfalls. Front. Syst. Neurosci. 2015, 9, 175. [Google Scholar] [CrossRef] [Green Version]
- Cai, L.; Wei, X.; Wang, J.; Yu, H.; Deng, B.; Wang, R. Reconstruction of Functional Brain Network in Alzheimer’s Disease via Cross-Frequency Phase Synchronization. Neurocomputing 2018, 314, 490–500. [Google Scholar] [CrossRef]
- Lachaux, J.P.; Rodriguez, E.; Martinerie, J.; Varela, F.J. Measuring Phase Synchrony in Brain Signals. Hum. Brain Mapp. 1999, 8, 194–208. [Google Scholar] [CrossRef] [Green Version]
- Yu, M.; Gouw, A.A.; Hillebrand, A.; Tijms, B.M.; Stam, C.J.; van Straaten, E.C.W.; Pijnenburg, Y.A.L. Different Functional Connectivity and Network Topology in Behavioral Variant of Frontotemporal Dementia and Alzheimer’s Disease: An EEG Study. Neurobiol. Aging 2016, 42, 150–162. [Google Scholar] [CrossRef]
- Engels, M.M.A.; Stam, C.J.; van der Flier, W.M.; Scheltens, P.; de Waal, H.; van Straaten, E.C.W. Declining Functional Connectivity and Changing Hub Locations in Alzheimer’s Disease: An EEG Study. BMC Neurol. 2015, 15, 145. [Google Scholar] [CrossRef] [Green Version]
- Bruña, R.; Maestú, F.; Pereda, E. Phase Locking Value Revisited: Teaching New Tricks to an Old Dog. J. Neural Eng. 2018, 15, 056011. [Google Scholar] [CrossRef]
- Poza, J.; Bachiller, A.; Gomez, C.; Garcia, M.; Nunez, P.; Gomez-Pilar, J.; Tola-Arribas, M.A.; Cano, M.; Hornero, R. Phase-Amplitude Coupling Analysis of Spontaneous EEG Activity in Alzheimer’s Disease. In Proceedings of the 2017 39th Annual International Conference of the IEEE Engineering in Medicine and Biology Society (EMBC), Jeju, Korea, 11–15 July 2017; Volume 2017, pp. 2259–2262. [Google Scholar] [CrossRef] [Green Version]
- Gallego-Jutgla, E.; Elgendi, M.; Vialatte, F.; Sole-Casals, J.; Cichocki, A.; Latchoumane, C.; Jeong, J.; Dauwels, J. Diagnosis of Alzheimer’s Disease from EEG by Means of Synchrony Measures in Optimized Frequency Bands. In Proceedings of the 2012 Annual International Conference of the IEEE Engineering in Medicine and Biology Society, San Diego, CA, USA, 28 August–1 September 2012; pp. 4266–4270. [Google Scholar] [CrossRef] [Green Version]
- Elgendi, M.; Vialatte, F.; Cichocki, A.; Latchoumane, C.; Jeong, J.; Dauwels, J. Optimization of EEG Frequency Bands for Improved Diagnosis of Alzheimer Disease. In Proceedings of the 2011 Annual International Conference of the IEEE Engineering in Medicine and Biology Society, Boston, MA, USA, 30 August–3 September 2011; pp. 6087–6091. [Google Scholar] [CrossRef] [Green Version]
- Jasper, H. The Ten-Twenty Electrode System of the International Federation. Electroencephalogr. Clin. Neurophysiol. 1958, 10, 370–375. [Google Scholar]
- Rutkove, S.B. Introduction to Volume Conduction. In The Clinical Neurophysiology Primer; Humana Press: Totowa, NJ, USA, 2007; pp. 44–53. [Google Scholar]
- Blackburn, D.; Zhao, Y.; De Marco, M.; Bell, S.; He, F.; Wei, H.-L.; Lawrence, S.; Unwin, Z.; Blyth, M.; Angel, J.; et al. A Pilot Study Investigating a Novel Non-Linear Measure of Eyes Open versus Eyes Closed EEG Synchronization in People with Alzheimer’s Disease and Healthy Controls. Brain Sci. 2018, 8, 134. [Google Scholar] [CrossRef] [Green Version]
- Yoon, S.; Alimardani, M.; Hiraki, K. The Effect of Robot-Guided Meditation on Intra-Brain EEG Phase Synchronization. In Proceedings of the Companion of the 2021 ACM/IEEE International Conference on Human-Robot Interaction, Boulder, CO, USA, 8–11 March 2021; ACM: New York, NY, USA, 2021; pp. 318–322. [Google Scholar] [CrossRef]
- Leeuwis, N.; Yoon, S.; Alimardani, M. Functional Connectivity Analysis in Motor-Imagery Brain Computer Interfaces. Front. Hum. Neurosci. 2021, 15, 732946. [Google Scholar] [CrossRef]
- Zhao, Y.; Zhao, Y.; Durongbhan, P.; Chen, L.; Liu, J.; Billings, S.A.; Zis, P.; Unwin, Z.C.; De Marco, M.; Venneri, A.; et al. Imaging of Nonlinear and Dynamic Functional Brain Connectivity Based on EEG Recordings With the Application on the Diagnosis of Alzheimer’s Disease. IEEE Trans. Med. Imaging 2020, 39, 1571–1581. [Google Scholar] [CrossRef]
- Durongbhan, P.; Zhao, Y.; Chen, L.; Zis, P.; De Marco, M.; Unwin, Z.C.; Venneri, A.; He, X.; Li, S.; Zhao, Y.; et al. A Dementia Classification Framework Using Frequency and Time-Frequency Features Based on EEG Signals. IEEE Trans. Neural Syst. Rehabil. Eng. 2019, 27, 826–835. [Google Scholar] [CrossRef] [Green Version]
- Bates, D.; Mächler, M.; Bolker, B.; Walker, S. Fitting Linear Mixed-Effects Models Using Lme4. J. Stat. Soft. 2015, 67, 1–48. [Google Scholar] [CrossRef]
- Acharya, J.N.; Acharya, V.J. Overview of EEG Montages and Principles of Localization. J. Clin. Neurophysiol. 2019, 36, 325–329. [Google Scholar] [CrossRef]
- Trongnetrpunya, A.; Nandi, B.; Kang, D.; Kocsis, B.; Schroeder, C.E.; Ding, M. Assessing Granger Causality in Electrophysiological Data: Removing the Adverse Effects of Common Signals via Bipolar Derivations. Front. Syst. Neurosci. 2016, 9, 189. [Google Scholar] [CrossRef] [Green Version]
- Rossini, P.M.; Di Iorio, R.; Vecchio, F.; Anfossi, M.; Babiloni, C.; Bozzali, M.; Bruni, A.C.; Cappa, S.F.; Escudero, J.; Fraga, F.J.; et al. Early Diagnosis of Alzheimer’s Disease: The Role of Biomarkers Including Advanced EEG Signal Analysis. Report from the IFCN-Sponsored Panel of Experts. Clin. Neurophysiol. 2020, 131, 1287–1310. [Google Scholar] [CrossRef]
- Sankari, Z.; Adeli, H.; Adeli, A. Intrahemispheric, Interhemispheric, and Distal EEG Coherence in Alzheimer’s Disease. Clin. Neurophysiol. 2011, 122, 897–906. [Google Scholar] [CrossRef]
- Yin, Z.; Li, J.; Zhang, Y.; Ren, A.; Von Meneen, K.M.; Huang, L. Functional Brain Network Analysis of Schizophrenic Patients with Positive and Negative Syndrome Based on Mutual Information of EEG Time Series. Biomed. Signal Process. Control 2017, 31, 331–338. [Google Scholar] [CrossRef]
- Quraan, M.A.; McCormick, C.; Cohn, M.; Valiante, T.A.; McAndrews, M.P. Altered Resting State Brain Dynamics in Temporal Lobe Epilepsy Can Be Observed in Spectral Power, Functional Connectivity and Graph Theory Metrics. PLoS ONE 2013, 8, e68609. [Google Scholar] [CrossRef] [Green Version]
- Adeli, H.; Ghosh-Dastidar, S.; Dadmehr, N. A Spatio-Temporal Wavelet-Chaos Methodology for EEG-Based Diagnosis of Alzheimer’s Disease. Neurosci. Lett. 2008, 444, 190–194. [Google Scholar] [CrossRef]
- Deng, B.; Cai, L.; Li, S.; Wang, R.; Yu, H.; Chen, Y.; Wang, J. Multivariate Multi-Scale Weighted Permutation Entropy Analysis of EEG Complexity for Alzheimer’s Disease. Cogn. Neurodyn. 2017, 11, 217–231. [Google Scholar] [CrossRef]
- Krajcovicova, L.; Marecek, R.; Mikl, M.; Rektorova, I. Disruption of Resting Functional Connectivity in Alzheimer’s Patients and At-Risk Subjects. Curr. Neurol. Neurosci. Rep. 2014, 14, 491. [Google Scholar] [CrossRef]
- Bari Antor, M.; Jamil, A.H.M.S.; Mamtaz, M.; Monirujjaman Khan, M.; Aljahdali, S.; Kaur, M.; Singh, P.; Masud, M. A Comparative Analysis of Machine Learning Algorithms to Predict Alzheimer’s Disease. J. Healthc. Eng. 2021, 2021, e9917919. [Google Scholar] [CrossRef]
- Liu, L.; Zhao, S.; Chen, H.; Wang, A. A New Machine Learning Method for Identifying Alzheimer’s Disease. Simul. Model. Pract. Theory 2020, 99, 102023. [Google Scholar] [CrossRef]
Figure 1.
EEG signals were collected from 23 bipolar channels based on the 10–20 international system.
Figure 1.
EEG signals were collected from 23 bipolar channels based on the 10–20 international system.

Figure 2.
Homotopic pair connectivity was examined in four mirror regions in the left and right hemispheres including (A) centro-parietal (C3-P3 and C4-P4), (B) fronto-central area (F3-C3 and F4-C4), (C) parieto-occipital (P3-O1 and P4-O2) and (D) centro-temporal (C3-T3 and C4-T4) connections.
Figure 2.
Homotopic pair connectivity was examined in four mirror regions in the left and right hemispheres including (A) centro-parietal (C3-P3 and C4-P4), (B) fronto-central area (F3-C3 and F4-C4), (C) parieto-occipital (P3-O1 and P4-O2) and (D) centro-temporal (C3-T3 and C4-T4) connections.

Figure 3.
The average PLVs obtained from all connectivity pairs for the five frequency bands (global connectivity). Plots marked with * indicate a statistically significant difference (p < 0.05) between AD patients and HCs.
Figure 3.
The average PLVs obtained from all connectivity pairs for the five frequency bands (global connectivity). Plots marked with * indicate a statistically significant difference (p < 0.05) between AD patients and HCs.

Figure 4.
The PLVs obtained from the homotopic pair in the centro-parietal region (Pair A). Plots marked with * indicate a statistically significant difference (p < 0.05) between AD patients and HCs.
Figure 4.
The PLVs obtained from the homotopic pair in the centro-parietal region (Pair A). Plots marked with * indicate a statistically significant difference (p < 0.05) between AD patients and HCs.

Figure 5.
The PLVs obtained from the homotopic pair in the fronto-central region (Pair B). Plots marked with * indicate a statistically significant difference (p < 0.05) between AD patients and HCs.
Figure 5.
The PLVs obtained from the homotopic pair in the fronto-central region (Pair B). Plots marked with * indicate a statistically significant difference (p < 0.05) between AD patients and HCs.

Figure 6.
The PLVs obtained from the homotopic pair in the parieto-occipital region (Pair C). Plots marked with * indicate a statistically significant difference (p < 0.05) between AD patients and HCs.
Figure 6.
The PLVs obtained from the homotopic pair in the parieto-occipital region (Pair C). Plots marked with * indicate a statistically significant difference (p < 0.05) between AD patients and HCs.

Figure 7.
The PLVs obtained from the homotopic pair in the centro-temporal region (Pair D). Plots marked with * indicate a statistically significant difference (p < 0.05) between AD patients and HCs.
Figure 7.
The PLVs obtained from the homotopic pair in the centro-temporal region (Pair D). Plots marked with * indicate a statistically significant difference (p < 0.05) between AD patients and HCs.


Table 1.
General information of the AD and HC groups including sample size, age mean with standard deviation, and gender ratio per group.
Table 1.
General information of the AD and HC groups including sample size, age mean with standard deviation, and gender ratio per group.
| AD | HC | |
|---|---|---|
| Size | N = 20 | N = 20 |
| Age | 60 (SD = 4.40) | 61 (SD = 6.67) |
| Gender (F/M) | 8/12 | 12/8 |
Table 2.
Summary of the results of the post-hoc analysis of the LME regression.
| Homotopic Pair | Delta Band (1–4 Hz) | Theta Band (4–8 Hz) |
|---|---|---|
| A | ✘ | √ |
| B | ✘ | ✘ |
| C | ✘ | ✘ |
| D | ✘ | √ |
Publisher’s Note: MDPI stays neutral with regard to jurisdictional claims in published maps and institutional affiliations. |
© 2022 by the authors. Licensee MDPI, Basel, Switzerland. This article is an open access article distributed under the terms and conditions of the Creative Commons Attribution (CC BY) license (https://creativecommons.org/licenses/by/4.0/).
Share and Cite
MDPI and ACS Style
Frangopoulou, M.S.; Alimardani, M. qEEG Analysis in the Diagnosis of Alzheimer’s Disease: A Comparison of Functional Connectivity and Spectral Analysis. Appl. Sci. 2022, 12, 5162. https://0-doi-org.brum.beds.ac.uk/10.3390/app12105162
AMA Style
Frangopoulou MS, Alimardani M. qEEG Analysis in the Diagnosis of Alzheimer’s Disease: A Comparison of Functional Connectivity and Spectral Analysis. Applied Sciences. 2022; 12(10):5162. https://0-doi-org.brum.beds.ac.uk/10.3390/app12105162
Chicago/Turabian StyleFrangopoulou, Maria Semeli, and Maryam Alimardani. 2022. "qEEG Analysis in the Diagnosis of Alzheimer’s Disease: A Comparison of Functional Connectivity and Spectral Analysis" Applied Sciences 12, no. 10: 5162. https://0-doi-org.brum.beds.ac.uk/10.3390/app12105162
Note that from the first issue of 2016, this journal uses article numbers instead of page numbers. See further details here.