Article

Performance Prediction of Composite Marine Propeller in Non-Cavitating and Cavitating Flow

1
Department of Naval Architecture and Marine Engineering, College of Engineering, Changwon National University, Changwon 51140, Korea
2
Maritime Research Institute, Hyundai Heavy Industries (HHI), Seoul 03058, Korea
3
Advanced Technology Research Institute, Korea Shipbuilding & Offshore Engineering (KSOE), Seongnam 13591, Korea
4
Korea Research Institute of Ships and Ocean Engineering (KRISO), Deajeon 34103, Korea
*
Author to whom correspondence should be addressed.
Submission received: 22 April 2022 / Revised: 12 May 2022 / Accepted: 18 May 2022 / Published: 20 May 2022

Abstract

:
The purpose of this study is to compare the performance of specific composite propellers with different ply angles from a cavitation inception speed (CIS) perspective. Composite propellers have a relatively large deformation compared to existing propellers manufactured using nickel aluminum bronze alloys. Therefore, it is necessary to understand the correlation between the stacking method of the composite materials and the propeller performance in order to design composite propellers that provide sufficient strength and generate the desired deformation. In addition, in the case of composite propellers, the deformation is closely related to the CIS because it can delay or accelerate the occurrence of tip vortex cavitation (TVC). Fluid-structure interaction (FSI) analysis of the model-scale composite propellers is performed using a coupled computational fluid dynamics (CFD)-finite element method (FEM) to examine the influence of the lamination direction on the deformation of the composite propeller. Finally, a hydroacoustic analysis of the noise generated and propagated by a composite propeller in non-cavitating and cavitating flows is conducted. The study found that some deformed parameters of the propeller affect the performance, the deformation of the composite propeller itself has no significant effect on the sound pressure level, and the volume change of cavitation has a decisive effect on the variation of the sound pressure level radiated from the composite propeller. These results can improve the feasibility, conceptual design, performance, and manufacturing methods for composite propellers.

1. Introduction

Composite marine propellers have many advantages over existing metal propellers, such as improved propulsion efficiency, light weight, excellent corrosion performance, and low vibration and noise induced by cavitation. They were applied to leisure vessels such as yachts in the 1990s and equipped on naval vessels requiring low underwater radiated noise, including submarines, in the Netherlands, Germany, and United Kingdom in the early 2000s [1]. However, there is little information available about these propellers because they are a technical development for military purposes. Chen et al. carried out model tests of rigid and flexible composite propellers at the Naval Surface Warfare Center, Carderock Division 36-inch water tunnel [2]. They discovered that the propeller efficiency and cavitation performance of the flexible propeller were superior to those of the rigid propeller. Young et al. presented a coupled boundary element method (BEM)-finite element method (FEM) approach to study the fluid-structure interaction of flexible composite propellers in subcavitating and cavitating flows [3]. They also determined that the bending-twisting coupling effects of anisotropic composites and the load-dependent self-adaptation behavior of composite blades are the primary sources for the performance improvement of composite propellers [4,5]. In addition, Airborne Composite of the Netherlands manufactured composite propellers for their naval vessels, and Howaldtswerke-Deutsche Werft, a German shipbuilding company, confirmed the effects of weight and noise reduction by manufacturing composite propellers for submarines [6]. Lee et al. manufactured composite propellers using compression molding process, and their hydrodynamic performances and radiation noise were measured [7,8]. Jang et al. developed a new design procedure for a flexible propeller under steady conditions, using a coupled vortex lattice method (VLM)-FEM, and analyzed a simply supported flexible plate under a uniformly distributed load [9,10]. Recently, the application of composite propellers has been extended to commercial vessels that require high fuel efficiency and lighter shafts. Nakashima Propeller in Japan succeeded in commercializing the world’s first composite propeller with a diameter of 2 m in 2014 after seven years of research. At present, the Nakashima propeller has a track record of applying composite propellers to more than five medium and small vessels such as tankers and ferries in Japan. Excellent performance was reported from full-scale trials, such as a 6% improvement in fuel consumption and a 40% reduction in engine room vibration. In addition, Nakashima Propeller obtained the approval for a composite propeller with a diameter of over 4 m from ClassNK in 2016 and plans to develop a composite propeller for a 60 k DWT bulk carrier with a diameter of approximately 7 m [11]. Hyundai Heavy Industries has derived a conceptual design and manufacturing method for composite propellers through a feasibility study of a composite marine propeller. BEM and computational fluid dynamics (CFD)-based hydroelastic analysis methods have also been proposed to derive a preliminary design for composite propellers. In addition, further opportunities to improve the propulsion performance during off-design operating conditions were identified by adapting the composite material to the marine propeller [12,13,14]. Kim et al. developed lifting surface theory (LST)-FEM coupling method to predict the hydroelastic performance of a flexible composite propeller in a non-uniform wake and examined the influence of the lamination direction on the deformation of the flexible composite propeller [15]. In addition, a design methodology of the specific flexible composite propeller was suggested [16].
The hydrodynamic benefits of applying composite propellers have already been discussed through many studies as above. The advantages of composite propellers mentioned above can be divided into two categories. First, the strength of composite propeller can be enough even with a thin thickness compared to the existing metallic propeller. Then propeller design with higher efficiency is possible, such as, by reducing the thickness or expanded area of propeller. Second, since deformation occurs in the case of a composite propeller, the hydrodynamic performance can be improved by performing reverse design process so that deformation occurs in the direction of increasing the propeller efficiency. In this study, deviating from both perspectives, the hydrodynamic performance of the propeller remains almost same even if deformation occurs. The purpose of our study is to examine the difference in the amount of cavitation occurring at the tip of the blade according to the deformation of the blade, especially the pitch change, and to investigate the noise reduction effect. It is expected that this advantage is useful especially for naval vessels that are more sensitive in terms of noise than general vessels and is expected to that performance improvement in terms of noise is possible through CIS delay.
Here, a CFD-FEM-based two-way iterative-coupling FSI method is used, and the effects of the stacking method on the performance of composite propellers are discussed from a CIS perspective. The development of vortical flow near the tip region has a strong effect on the CIS, and the propeller noise increases due to the occurrence of cavitation. In addition, it is important to consider the performance change of a composite propeller in a cavitating flow because the deformation leads to volume changes of sheet cavitation with pressure variation. Here, a hydroacoustic analysis of the noise generated and propagated by a composite propeller was conducted, and the predicted underwater radiated noise expressed as sound pressure level (SPL) was compared between rigid and composite propellers in non-cavitating and cavitating flows.

2. Methodology and Results
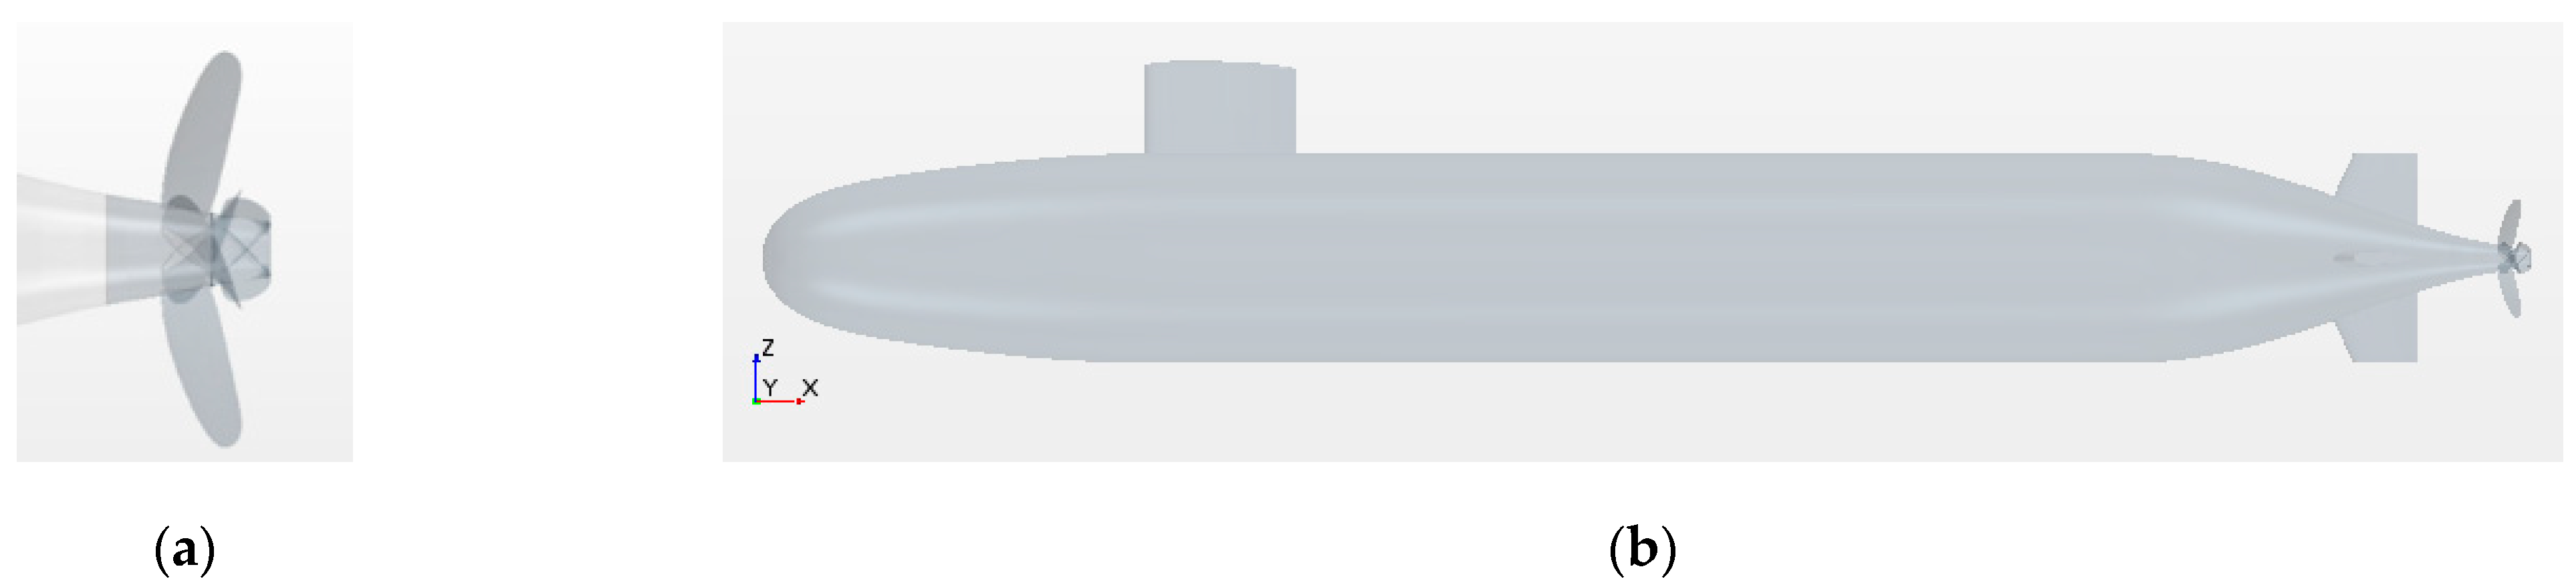
2.1. Test Model

TVC is first observed behind the tip of a propeller blade at full scale. The cavitation occurrence pattern in the case of the model test can be different from the propeller in full scale due to the scale effect [17,18]. A propeller mounted on a submerged body (DTRC, DARPA SUBOFF) was designed such that tip vortex cavitation occurred first, similarly simulating a full-scale propeller. The geometric details of the designed propeller are shown in Table 1 and Figure 1. Here, propeller boss cap fins were also designed to prevent the occurrence of hub vortex, and it was confirmed that hub vortex did not occur through experiments and numerical analysis (Figure 2).

2.2. Flow Simulation

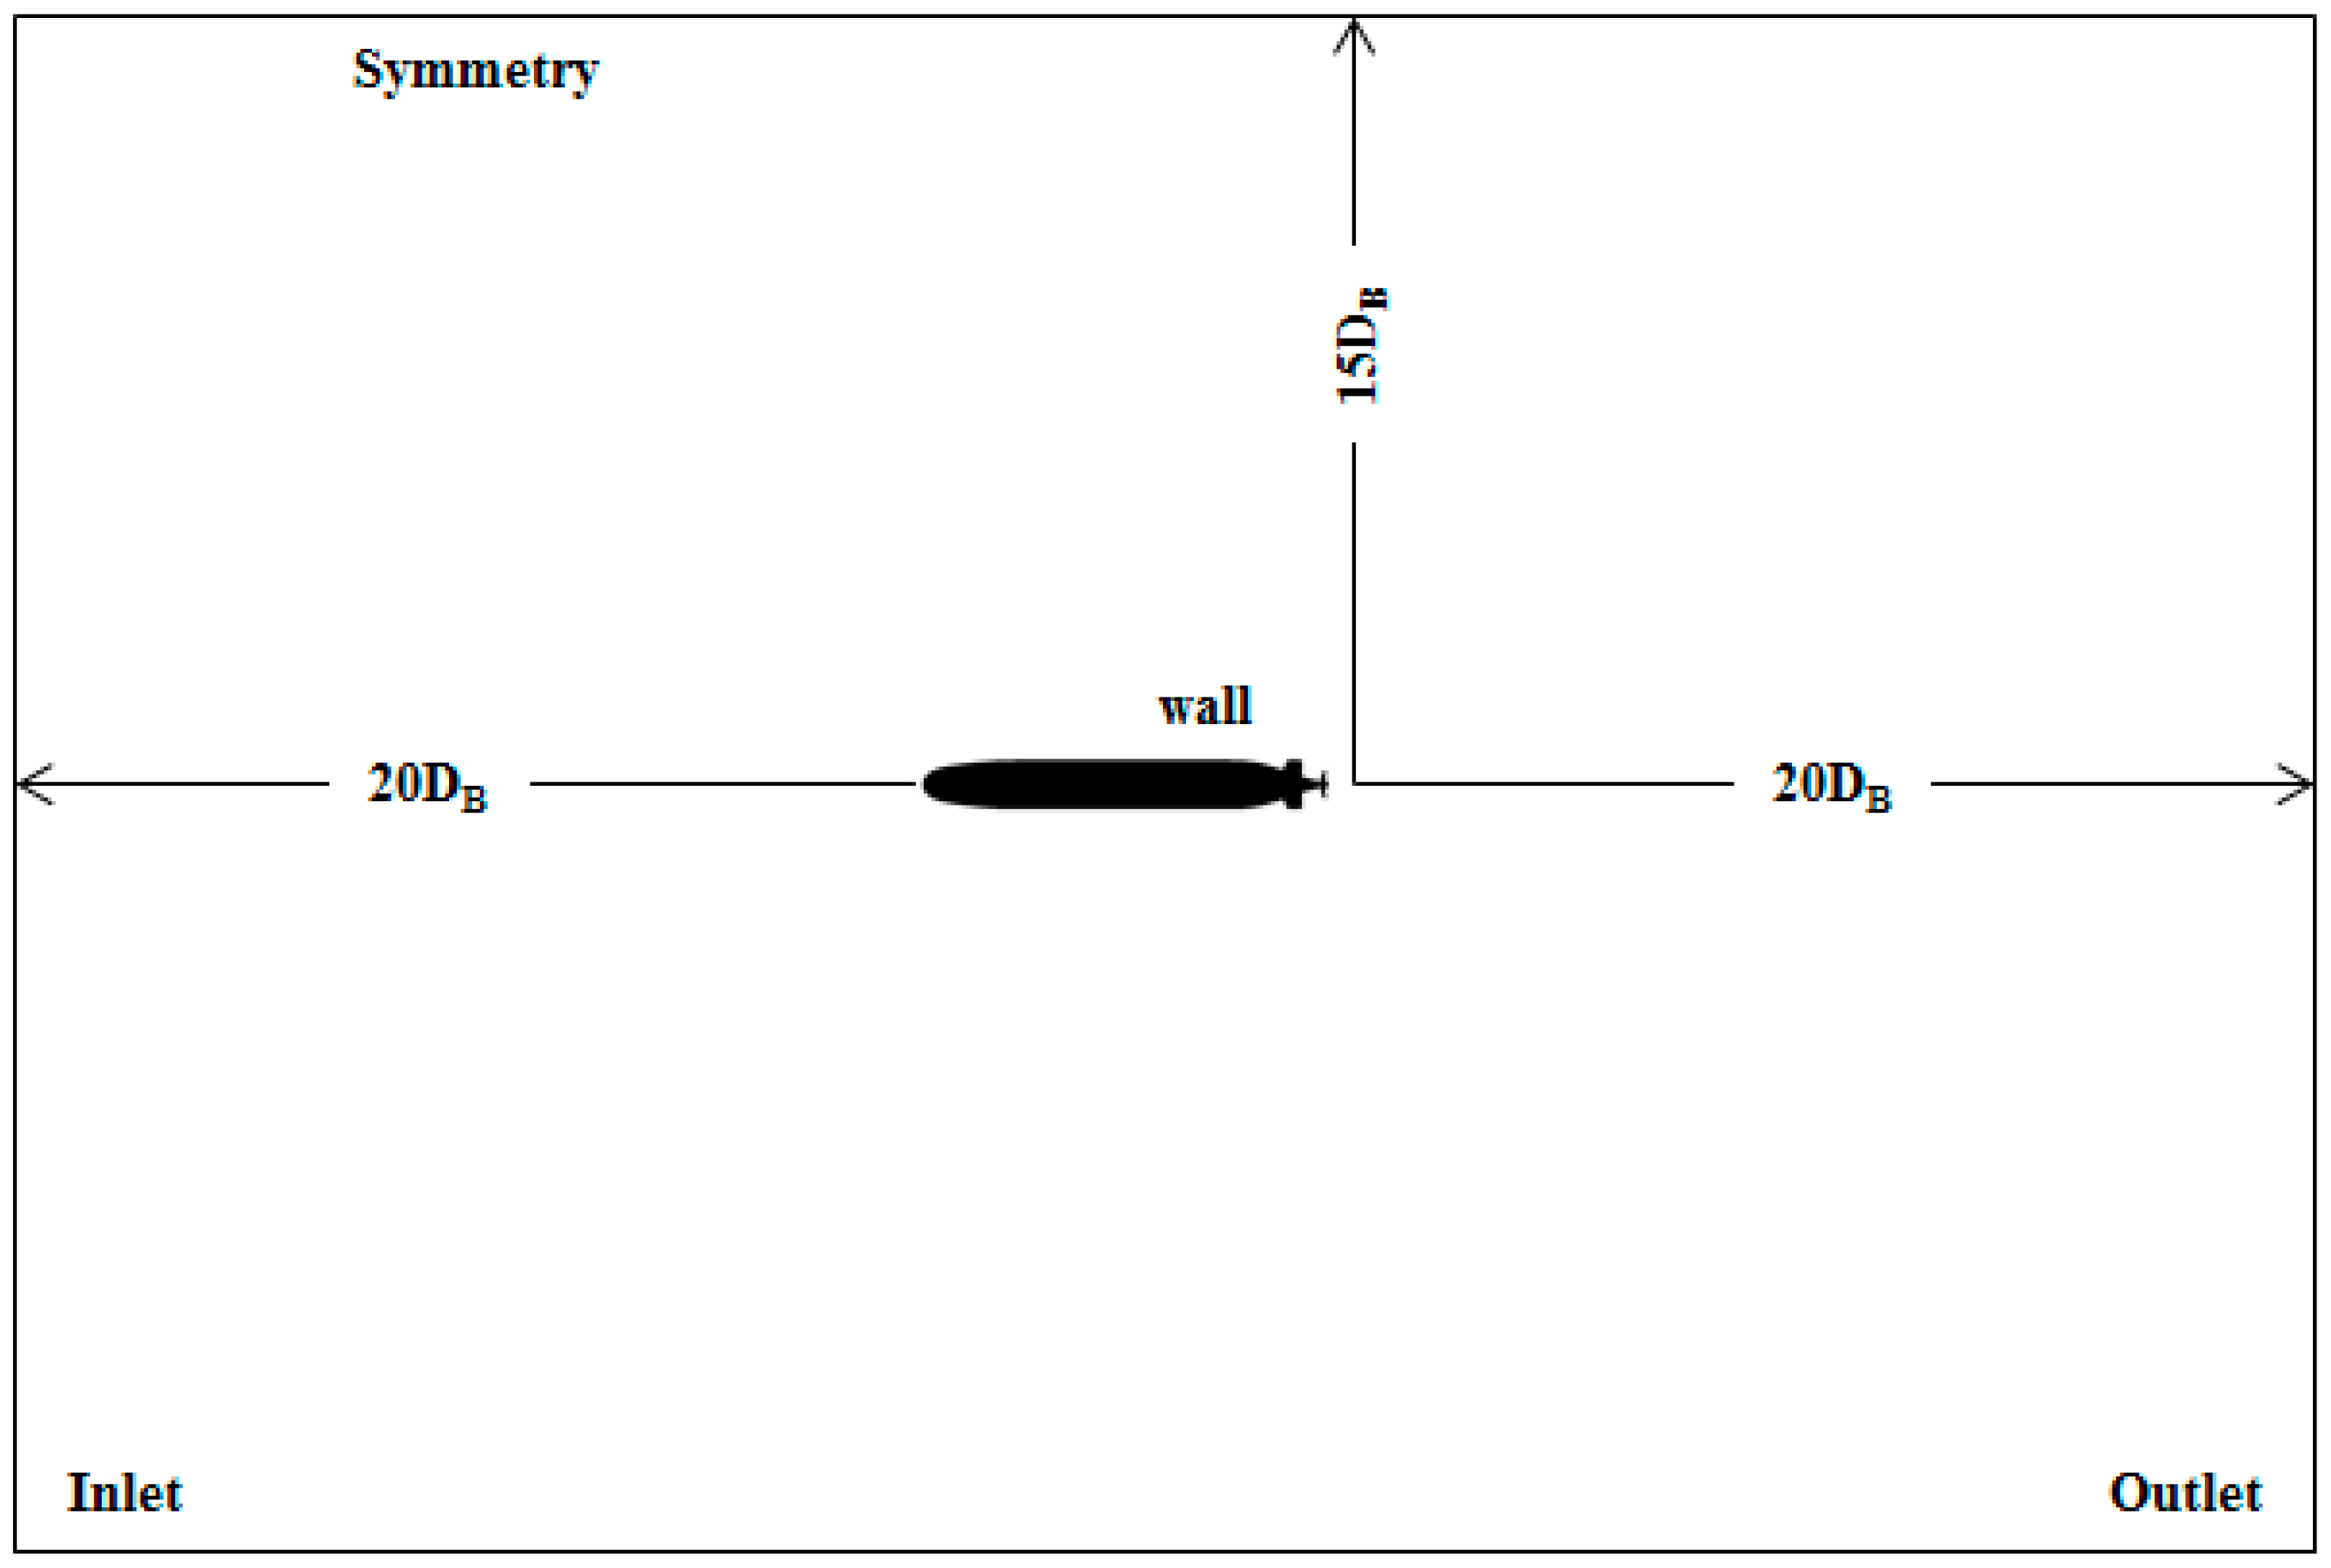
2.2.1. Governing Equation and Boundary Condition

For the analysis of the unsteady flow around the composite propeller, each cell in the control volume satisfies the governing equations, including the continuity equation, expressed as:
ρ t + ( ρ V ¯ ) = 0
and the Reynolds Averaged Navier-Stokes (RANS) momentum equation, expressed as:
t ( ρ V ¯ ) + ( ρ V ¯ V ¯ ) = p ¯ I + ( T + T R A N S ) + f b
where ρ ,   V ¯ ,   and   p ¯ are the density, mean velocity, and pressure, respectively, and I , T   and   f b are the identity tensor, viscous stress tensor, and the resultant of the body forces. Here, T R A N S is a tensor quantity, known as the Reynolds stress tensor. A commercial program, STAR-CCM+ ver. 14.06.013, was used for the flow analysis of the submerged body with the composite propeller. The diffusion and convection terms of the governing equations were discretized to second-order accuracy, and the velocity and pressure were analyzed using the SIMPLE algorithm. A turbulence model was applied to the realizable k-ω shear stress transport model, and a wall function was used for the boundary condition of the submerged body with the composite propeller.

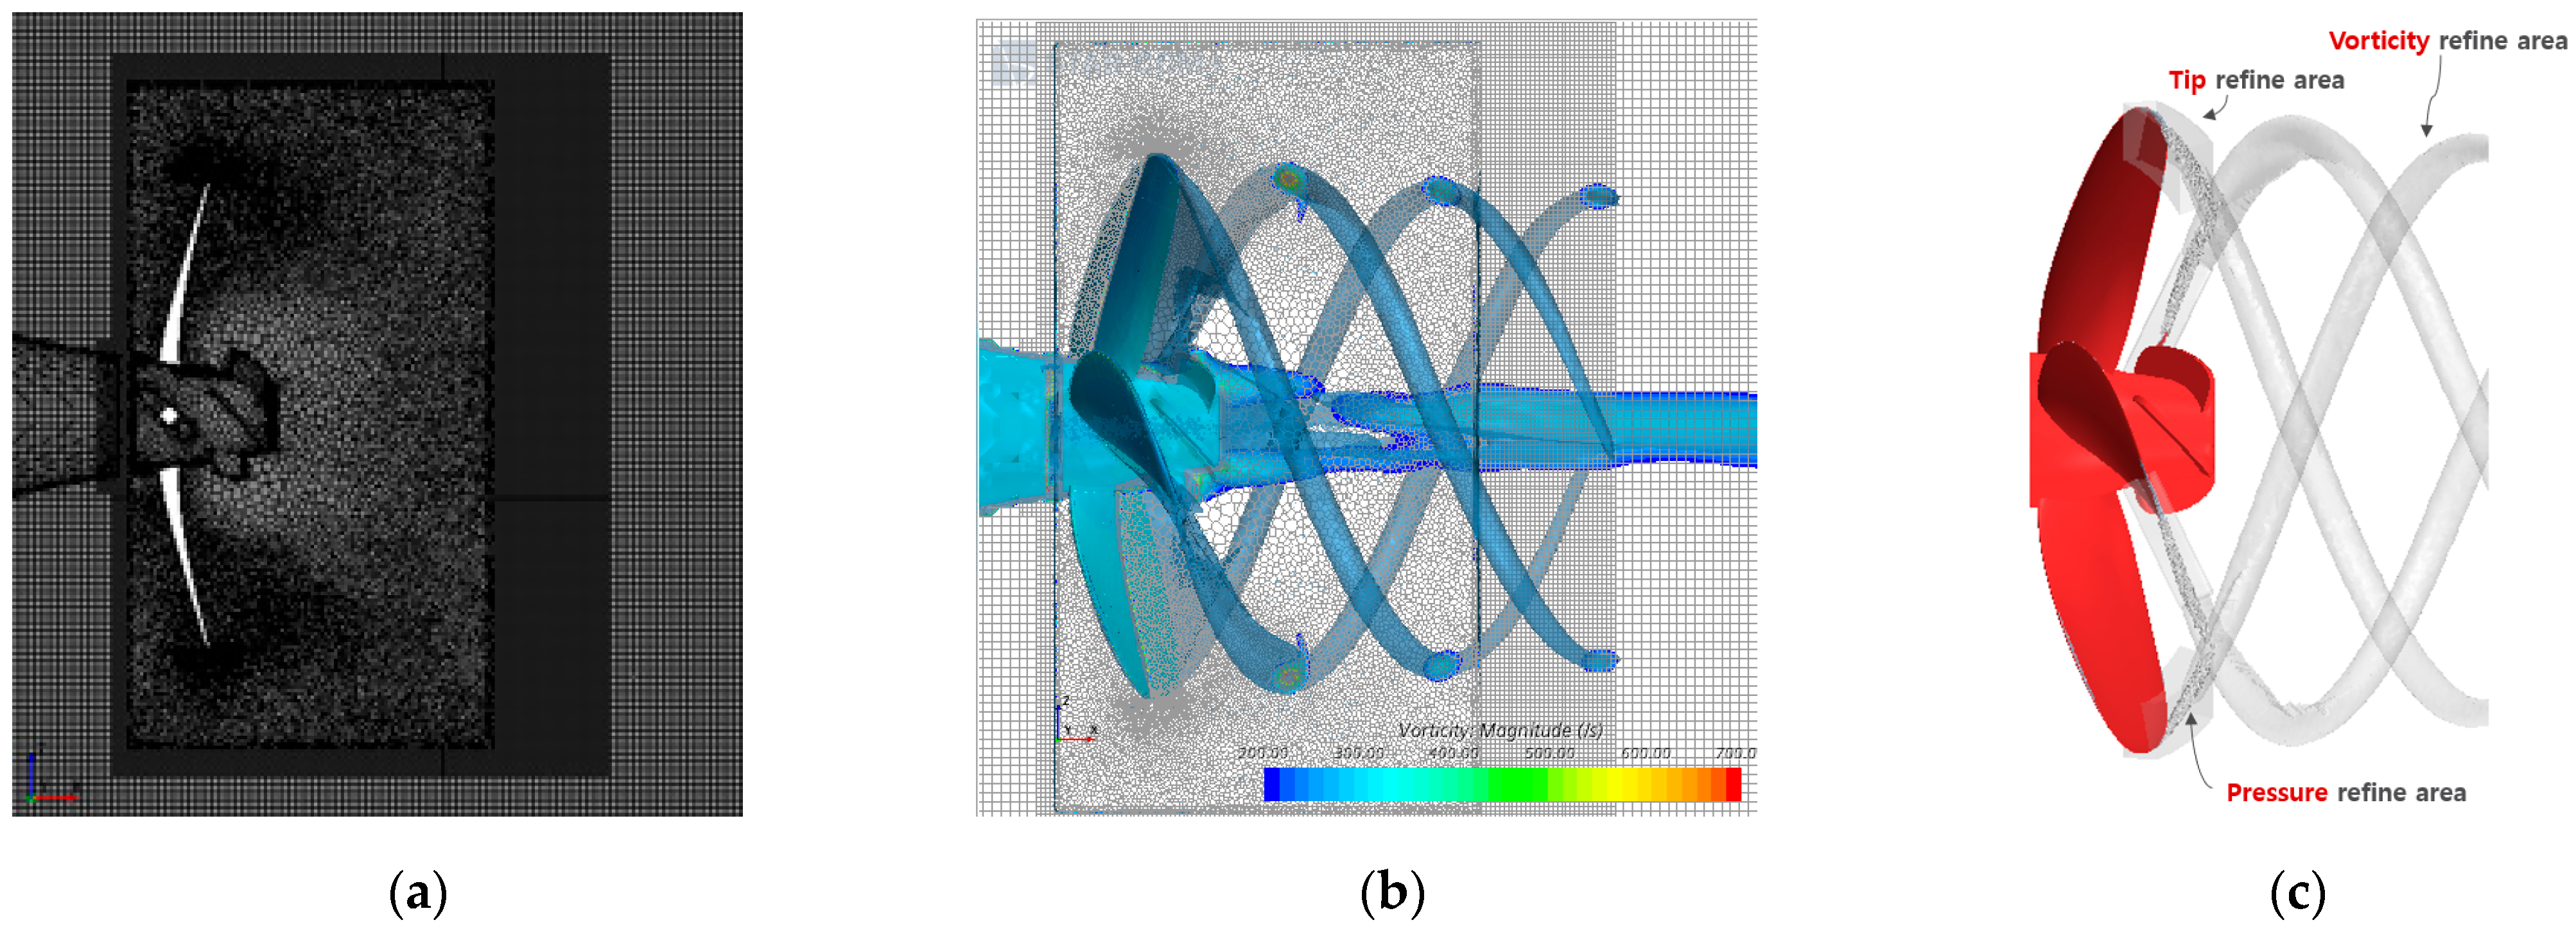
2.2.2. Simulation Set-Up

The numerical simulation domain is shown in Figure 3, where DB is the maximum diameter of the submerged body. Flow analysis was performed prior to the FSI analysis without considering the deformation in a non-cavitating flow. A convergence test was performed to select the number of grids for numerical analysis, as shown in Table 2 (KT = T/ρn2D4). The final selected grid number was approximately 23.2 million, and the unsteady analysis was performed in two stages.
First, the solution was performed using the moving reference frame approach. Second, a time-accurate solution was completed with the sliding mesh method every 0.5° per time step. For the comparison of the results with the model test later, the flow analysis was carried out under the test condition of Table 3, which is the same with the experiments carried out in a Large Cavitation Tunnel (LCT) located at the Korea Research Institute of Ships and Ocean Engineering (KRISO). The noise reduction effect of the composite propeller was attributed to the difference in the development of cavitation caused by the deformation of the blade. In particular, it can be predicted that the development characteristics of TVC, which determine the CIS of the propeller, will be greatly influenced by the amount of deformation of the composite propeller. The propeller rotating component (interface area) was expanded to simulate the vortical flow generated from the propeller tip region, and the mesh refinement area was constructed as shown in Figure 4. The extracted volume regions with specific vorticity and pressure values are included in the rotating component. The RANS method has low accuracy in simulating vortical flow generated from the propeller tip region due to the averaging of the Navier-Stokes equation and excessive numerical diffusion [19]. However, applying large or detached eddy simulation methods excessively increases the time required for FSI analysis. Therefore, rather than using a quantitative comparison of the cavitation area, we found a compromise that simulated the TVC as much as possible by considering the time required for FSI analysis. Thus, the Eulerian multiphase model was employed with the volume of fluid method for the cavitation modeling. The Schnerr and Sauer cavitation model was also used [20], which is based on the asymptotic form of the Rayleigh–Plesset equation. Here, the bubble dynamics, viscous diffusion, and surface tension were not considered.

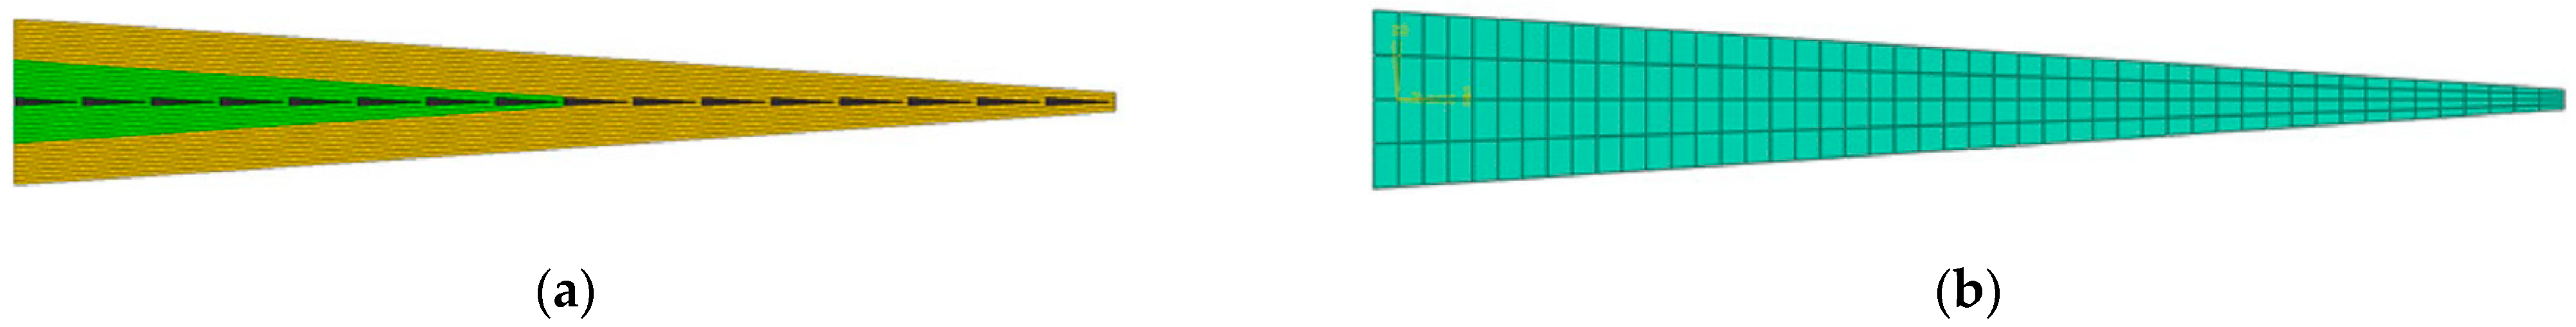
2.3. Structural Modeling

2.3.1. Governing Equation

A discrete equation of motion in the FEM model can be solved in the commercial program Abaqus 2016, and is expressed as:
M d ¨ + C d ˙ + k d = F S T
where M, C, k, d, and FST are the structural mass, damping, stiffness, displacement, and total load acting on the blade structure, respectively. The quasi-static option of the Abaqus standard (implicit) was used for unsteady analysis.

2.3.2. Material Properties

In this study, the material properties of the composite propellers are described below. The composite material has isotropic like material properties without the distinction of core and skin.
Young’s modulus: E1 = 52.1 GPa, E2 = E3 = 18.3 GPa
Shear modulus: G12 = G13 = G23 = 5.2 GPa
Poisson’s ratio: v12 = 0.29
Density: ρ = 1498 kg/m3

2.3.3. Stacking Method

Although the FE analysis model should be applied to consider the internal lamination structures [21], designing a propeller using a real FE analysis need a long computation time. Therefore, the 3D 8-node continuum shell element of Abaqus was applied proportionally to lamination properties of a composite material in the thickness direction [14]. For example, if an element thickness and ply sheet thickness are known, ply layers could be stacked in proportion to ‘one’ element. Figure 5 shows the comparison of a material beam between the real FE model and simple ply stack model.
In this study, the ply sheet thickness is 0.13 mm and the number of ply layers can be calculated based on the element thickness of each model. The experiment was performed on only model 1, and model 2 to 5 were designed with different ply angles from model 1. Among them, model 5 showed the greatest difference in terms of deformation compared to model 1. In the case of models 1 and 5, the lamination reference lines were rotated 30° and −60°, respectively, in the propeller rotation direction on the propeller generator line. Based on this, the internal lamination angle was 90°, which is the same in all layers as shown in Figure 6. Ply angles were decided to examine more obvious relationship between lamination angle and displacement of composite propellers and minimize the manufacturing error when performing experiments scheduled for the next step.

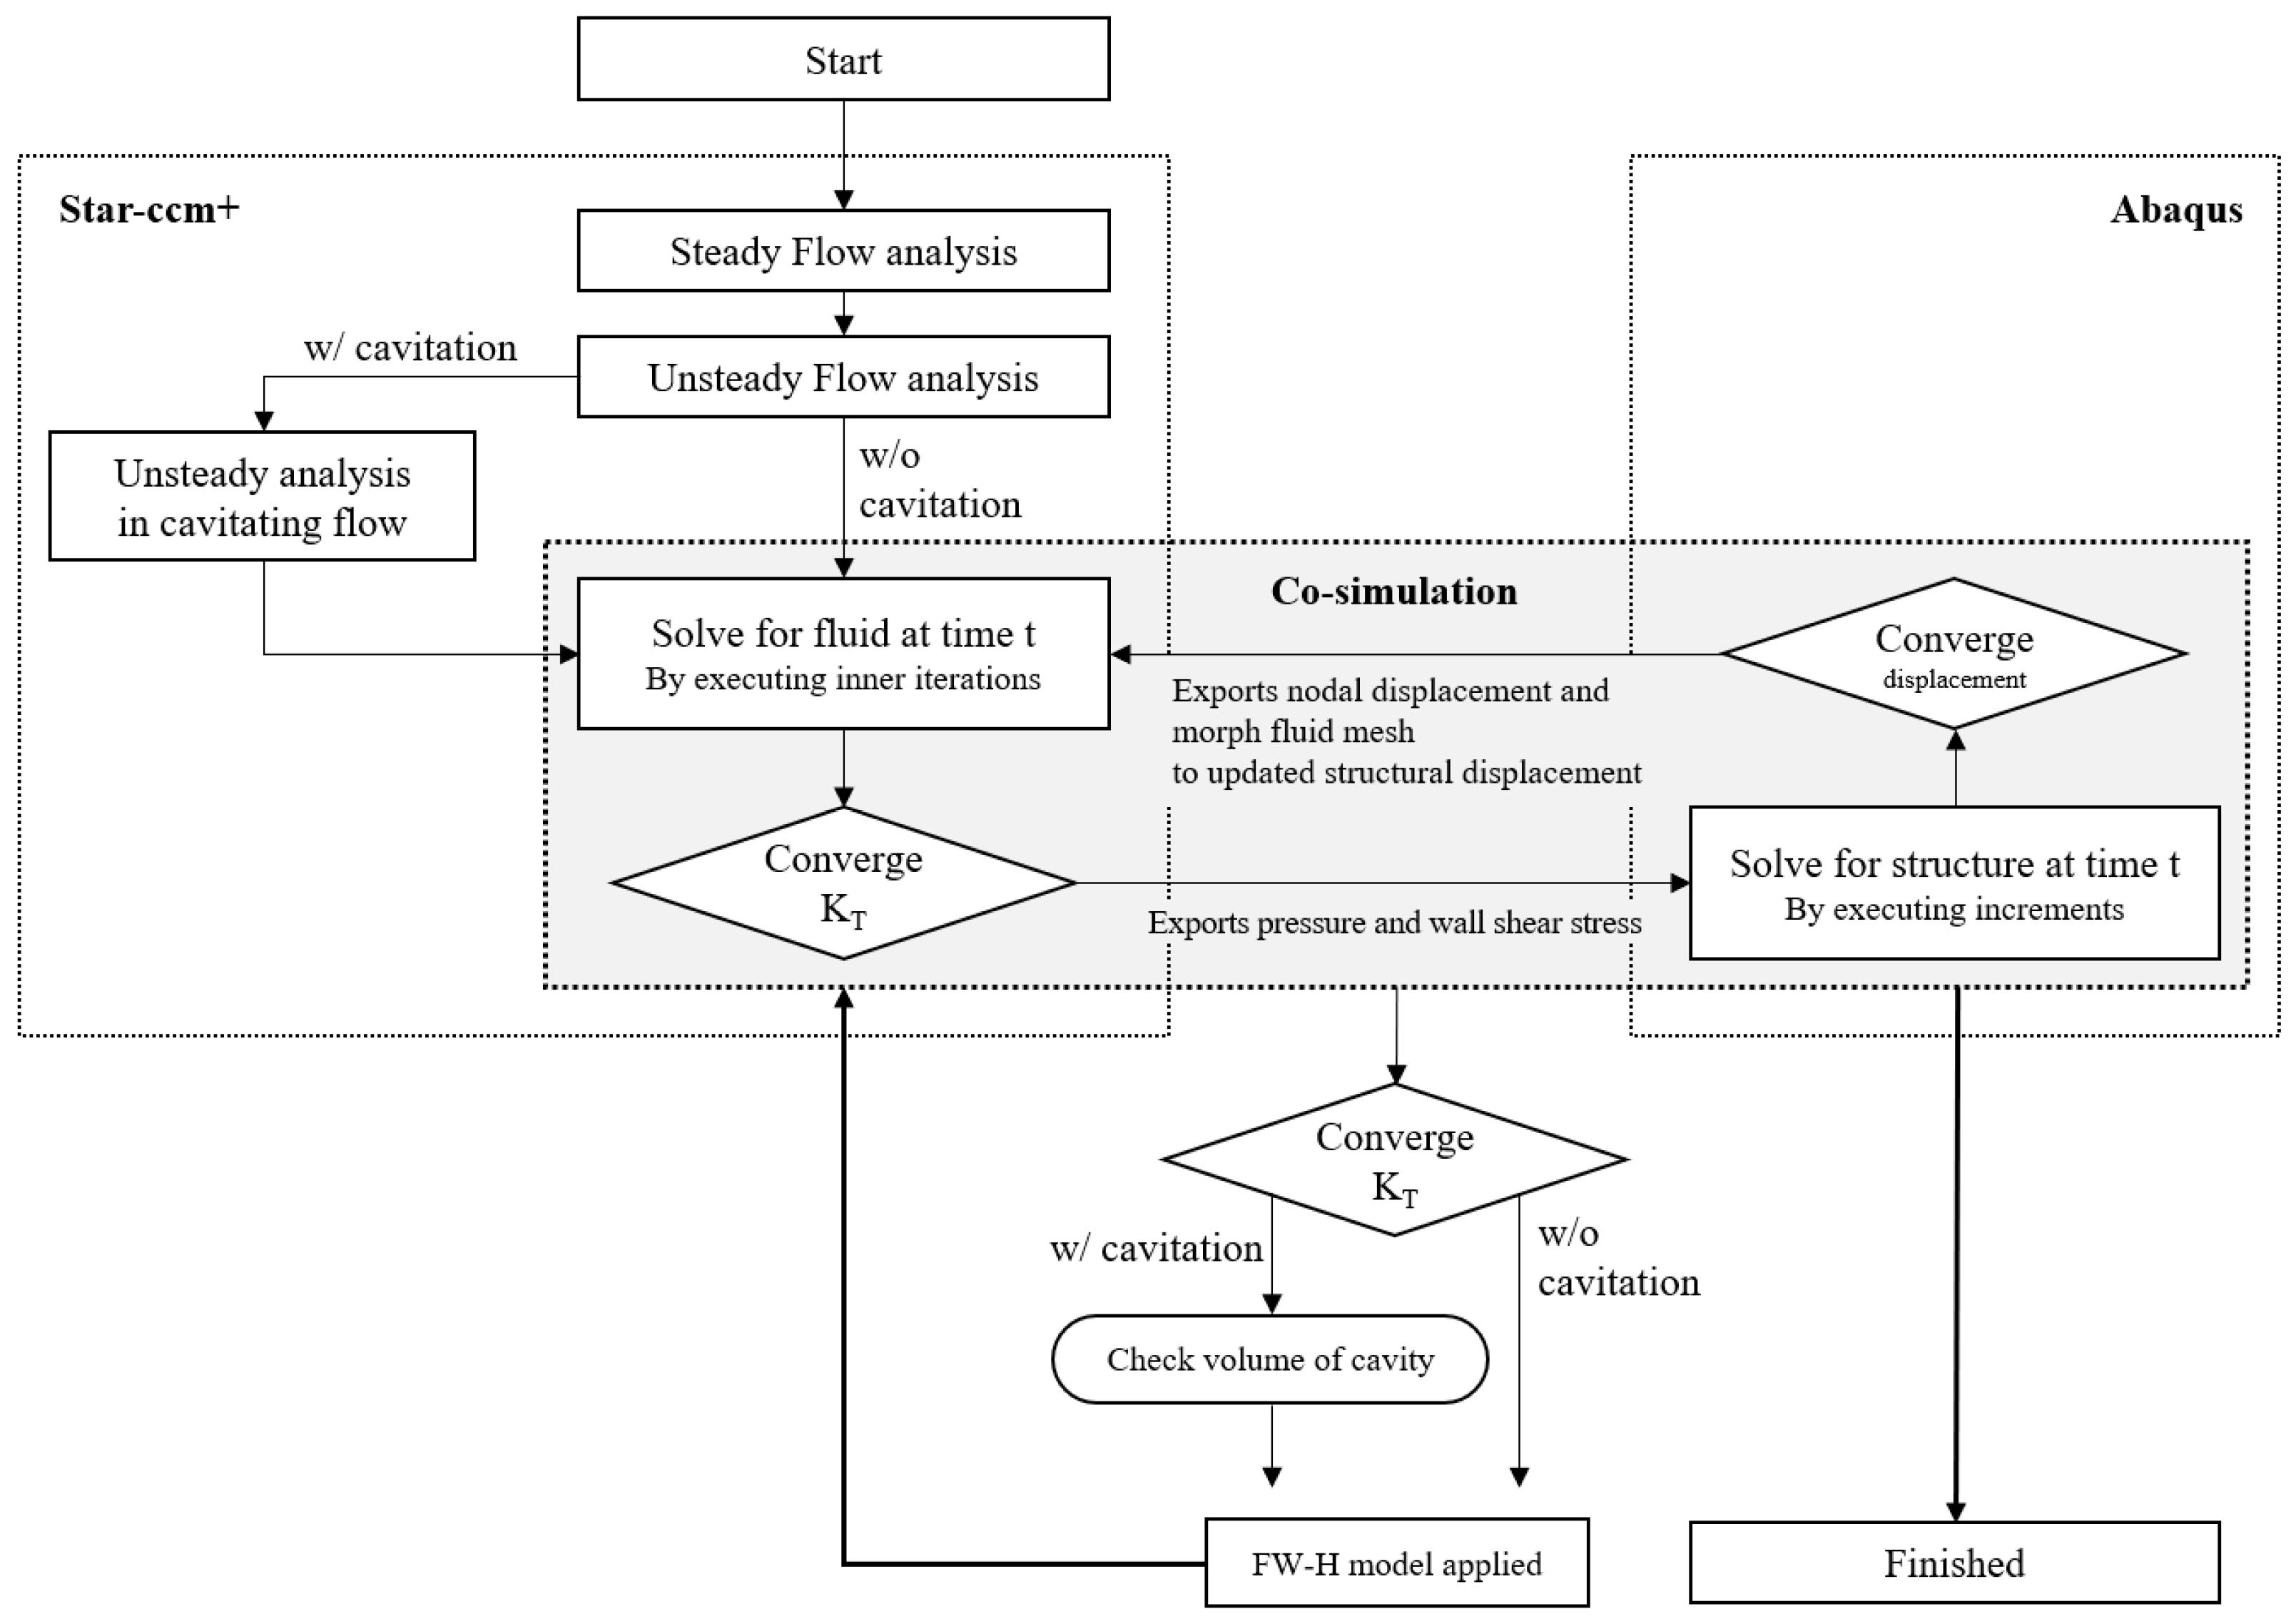
2.4. Coupled CFD-FEM FSI Analysis

Two-way coupled FSI was performed using the SIMULIA co-simulation engine, which allowed the two programs to be directly coupled without third-party interface software. The results were exchanged between STAR-CCM+ and Abaqus at each time step. Pressure and wall shear stress were exported from STAR-CCM+ while nodal displacements were exported from Abaqus. The outer surface of the propeller blade was defined as the coupling interface for the two programs. Figure 7 shows the flow chart for the coupled CFD-FEM fsi analysis and the convergence criteria are thrust coefficient, displacement, and volume of cavity for each process.

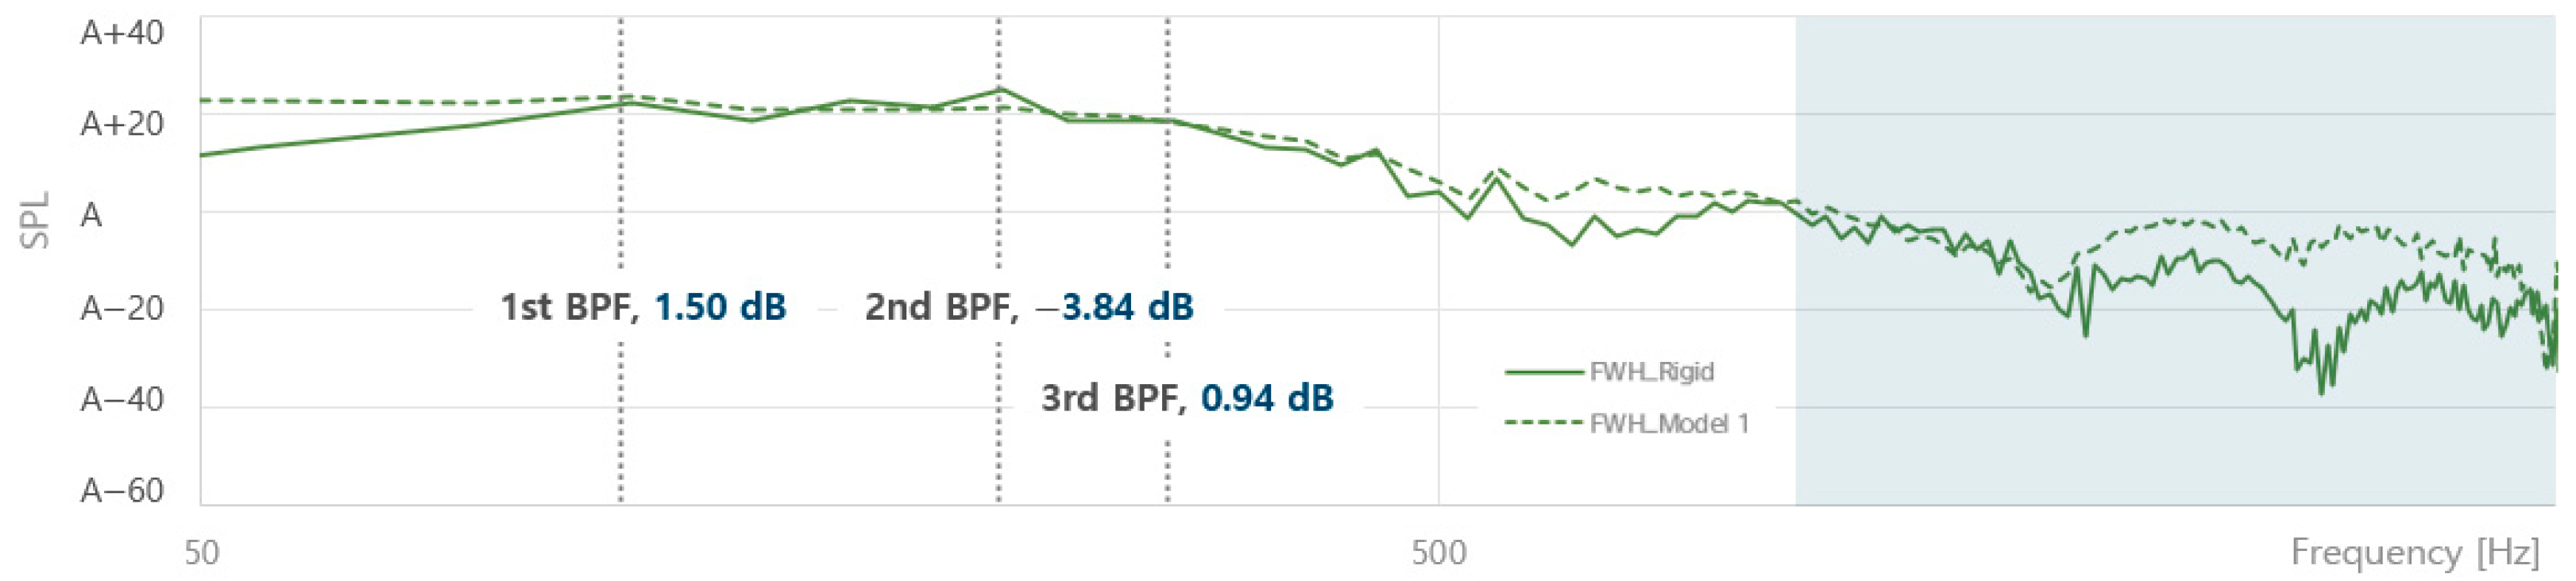
2.4.1. Non-Cavitating Flow

The pitch distributions of models 1 and 5 in a non-cavitating flow, which vary as the blade rotates at specific radial positions (r/R = 0.630, 0.729, 0.816, 0.918, 0.965), are shown in Figure 8 and Figure 9, respectively. Deformed pitch distributions were compared with the fixed pitch values of a rigid (pre-deformed) propeller at specific radial positions. For model 1, pitch distributions at all radial positions increased compared to the rigid propeller. Additionally, the pitch difference between the rigid and model 1 propellers was prominent at the tip of the propeller. Conversely, for model 5, the pitch distributions at all radial positions decreased compared to the original value. It appears that the stacking angle was closely related to the direction of deformation.
Additionally, the elastic bending-twisting coupling effect of orthotropic composites especially affected the change of pitch [22]. The influence of wake was insignificant because the submerged body was symmetrical [23], as shown in the radial charts in Figure 7 and Figure 8. However, appendages as shown in the right picture in Figure 1, including a conning tower and 4 control planes, had an effect on the local deformation according to the blade position in the radial direction.
The Ffowcs Williams-Hawkings (FW-H) model is used here, which is the generalized form of Lighthill’s acoustic analogy [24,25,26]. The pressure fluctuations in the near field around the propeller were calculated in STAR-CCM+. The SPL at a specific position (receiver point) was compared for rigid and composite propellers and calculated by integrating the fluctuating pressure received from the propeller blade, defined as an impermeable surface. Farassat 1A is an integral form of the FW-H equation that omits the volume source term [25].
The total acoustic pressure (P) can be expressed as:
P = P T ( x , t ) + P L ( x , t )
where x, t, PT, and PL are the position and time of the receiver, thickness noise, and loading noise term, respectively. In this study, the position of the receiver point (1.0, 1.1, −0.43) was based on the center of the propeller (0, 0, 0).
The sound pressure levels of rigid and composite propellers in the non-cavitating flow were compared, as shown in Figure 10 and Figure 11. Although the composite propellers (models 1 and 5) were deformed in opposite directions, the noise characteristics of rigid and composite propellers did not demonstrate significant differences in the non-cavitating flow based on the first blade passing frequency (BPF). Additionally, the deformation of the composite propeller itself did not significantly affect the underwater noise characteristics.

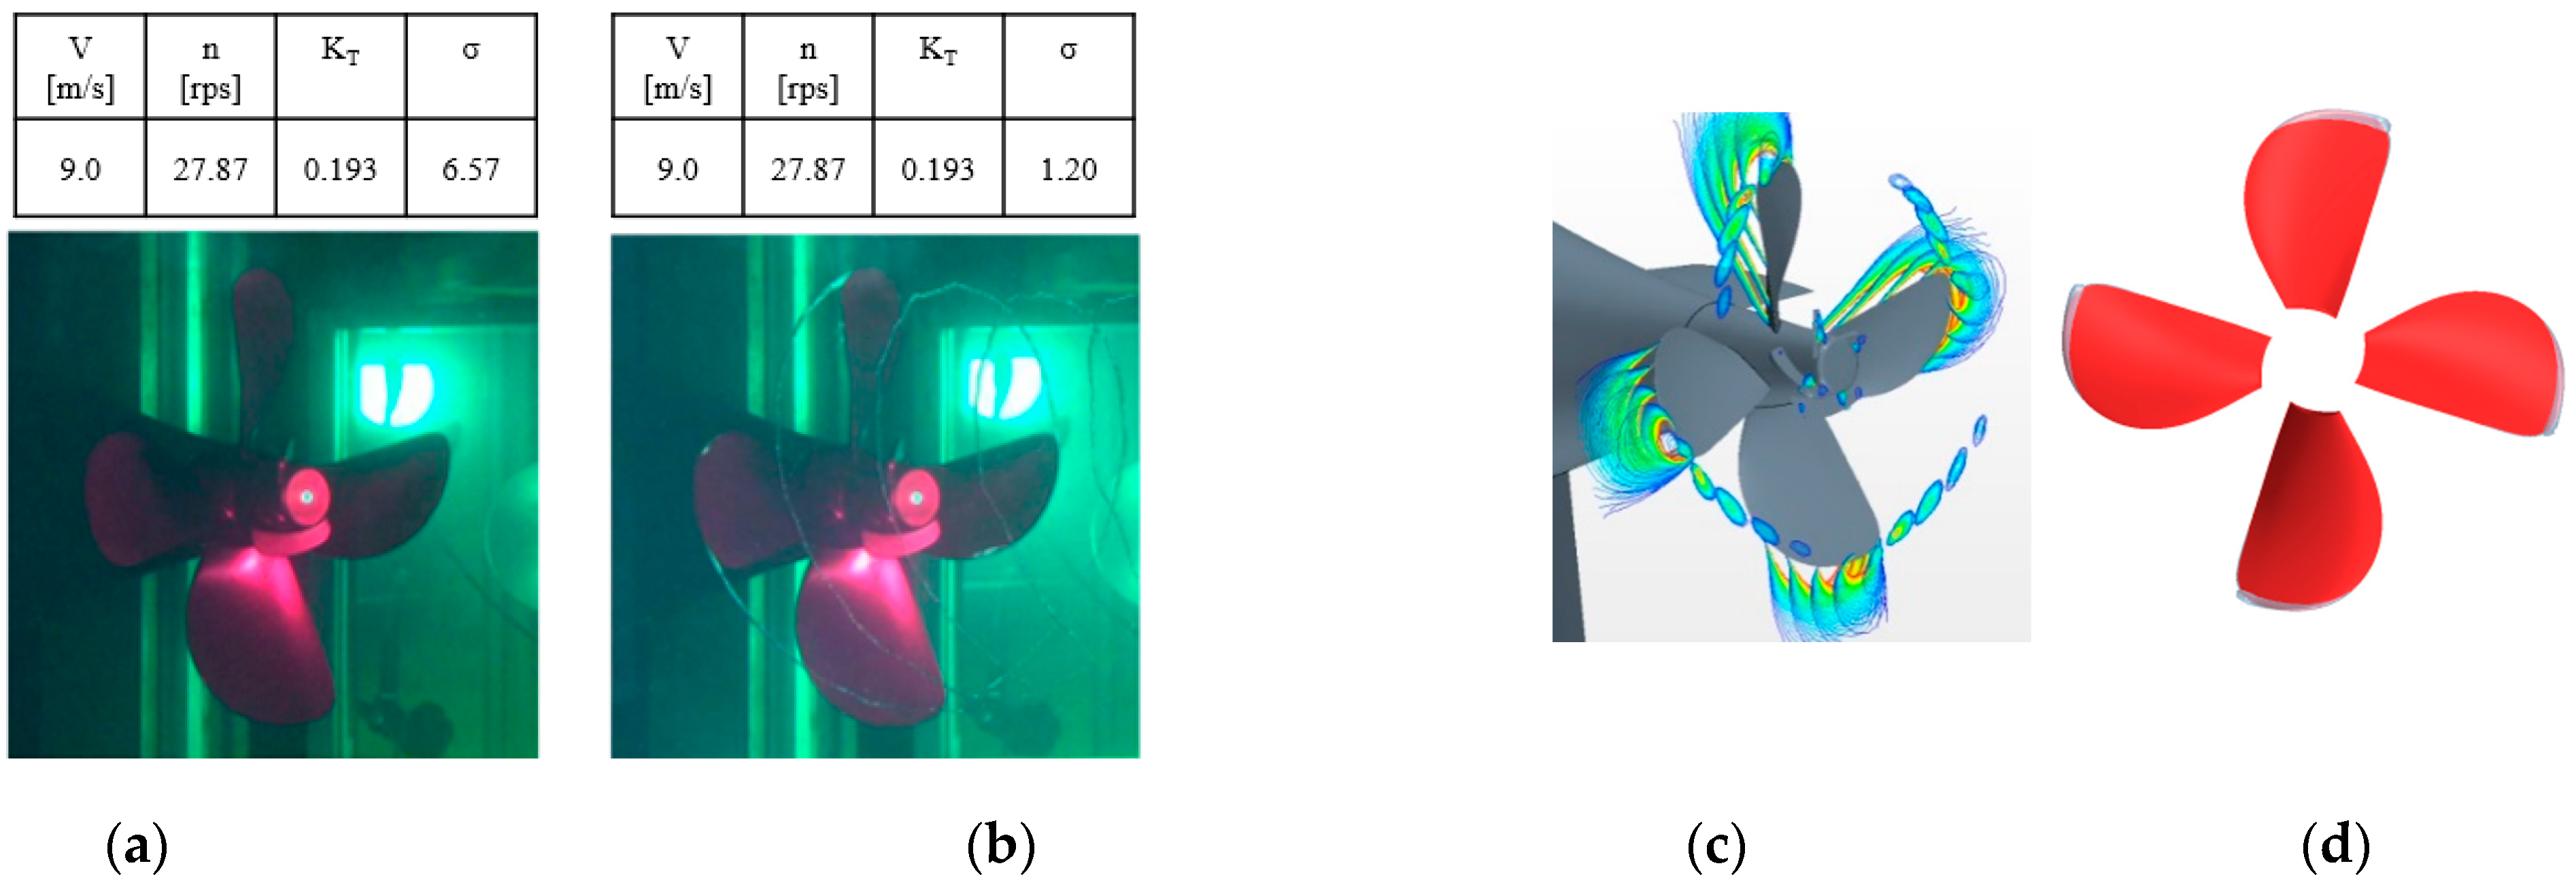
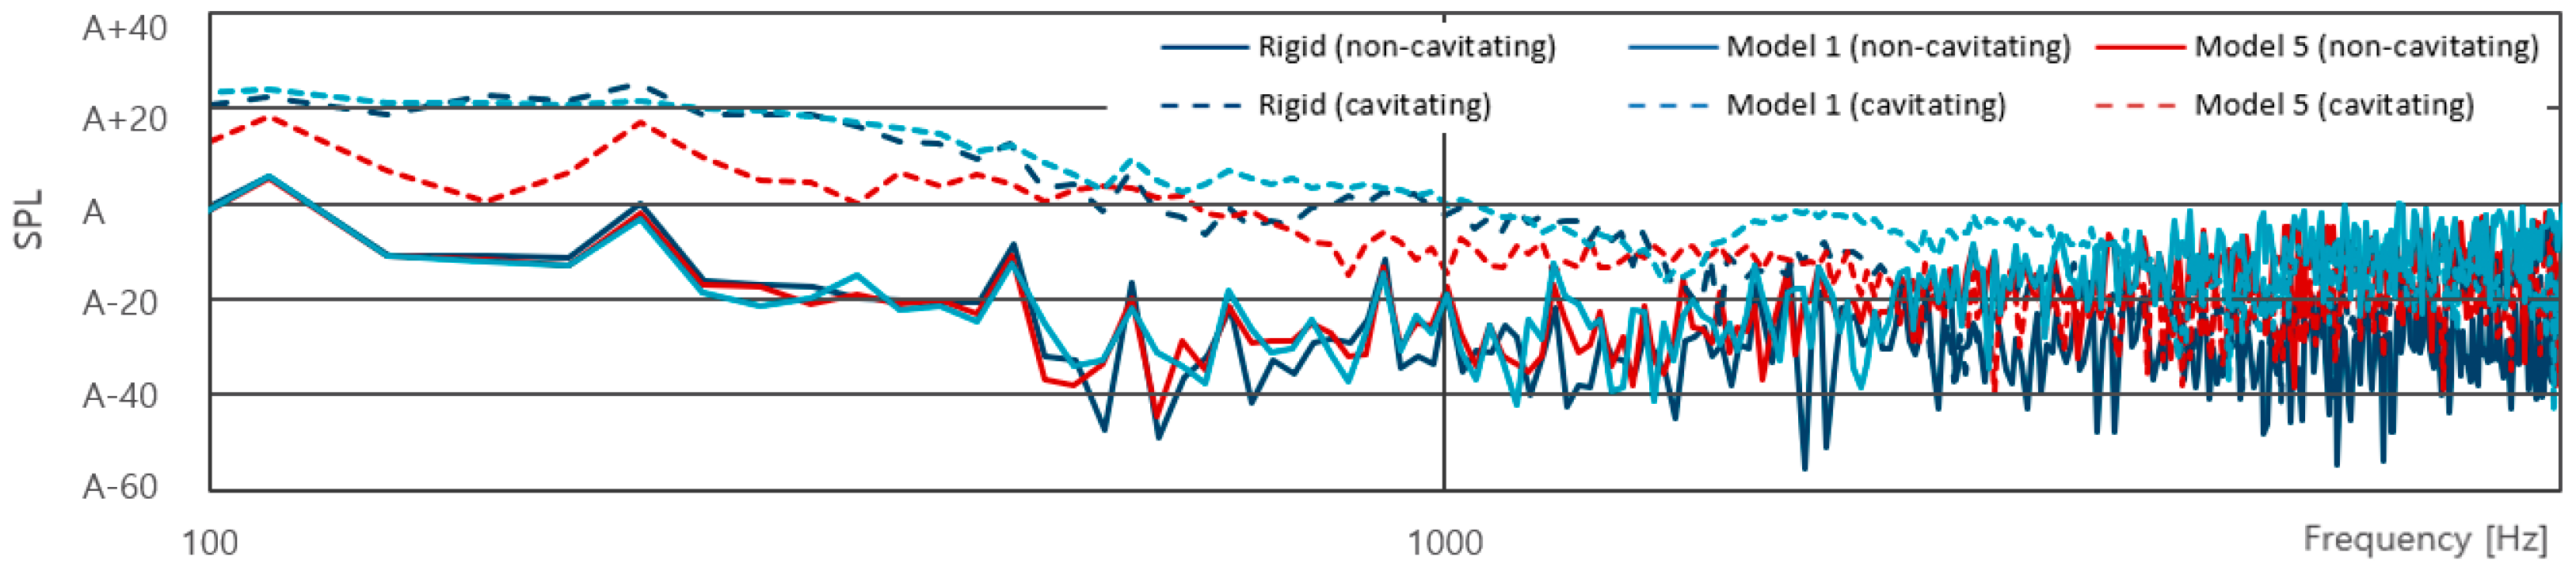
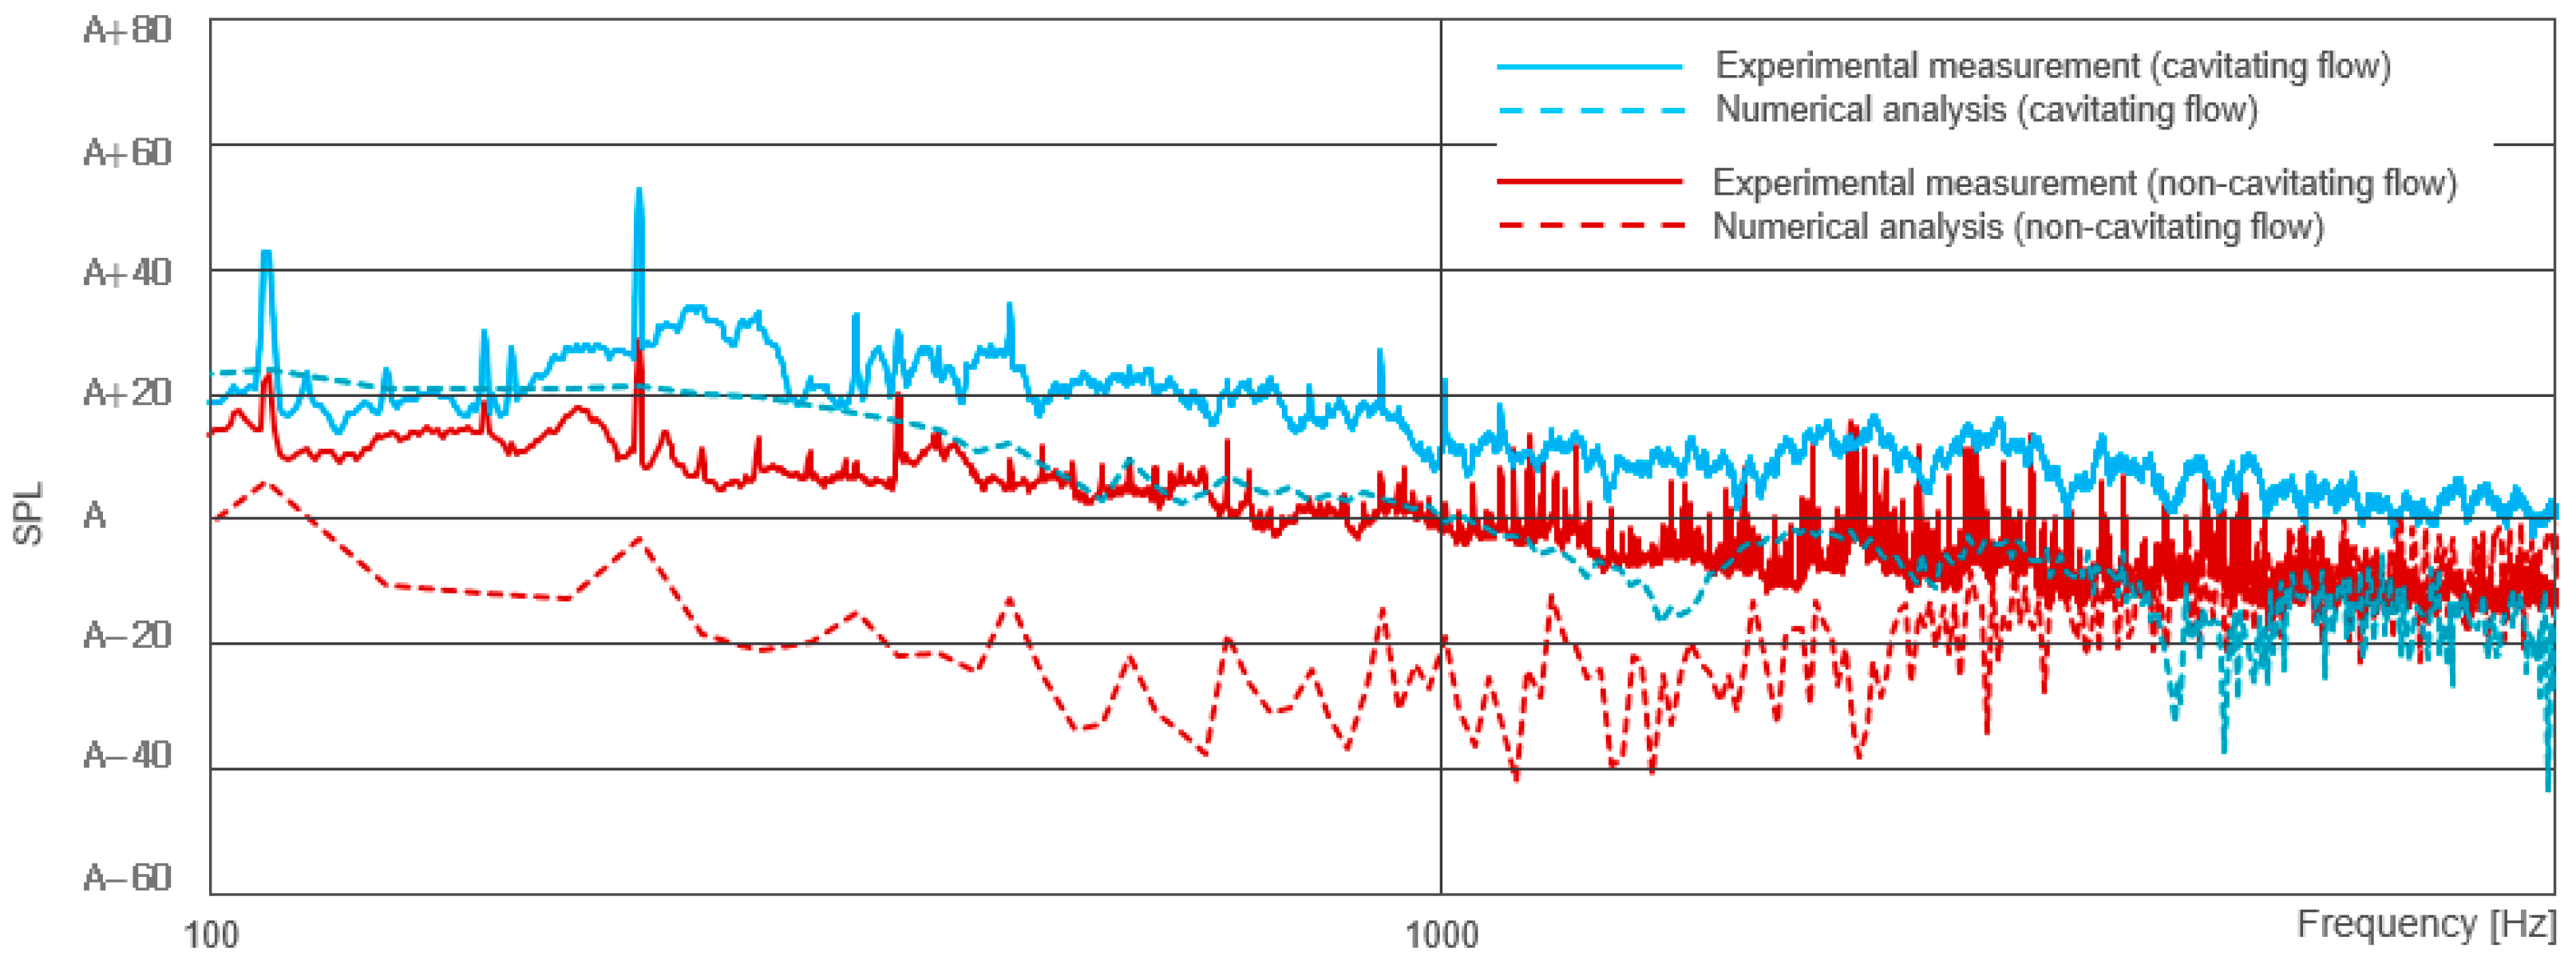
2.4.2. Cavitating Flow
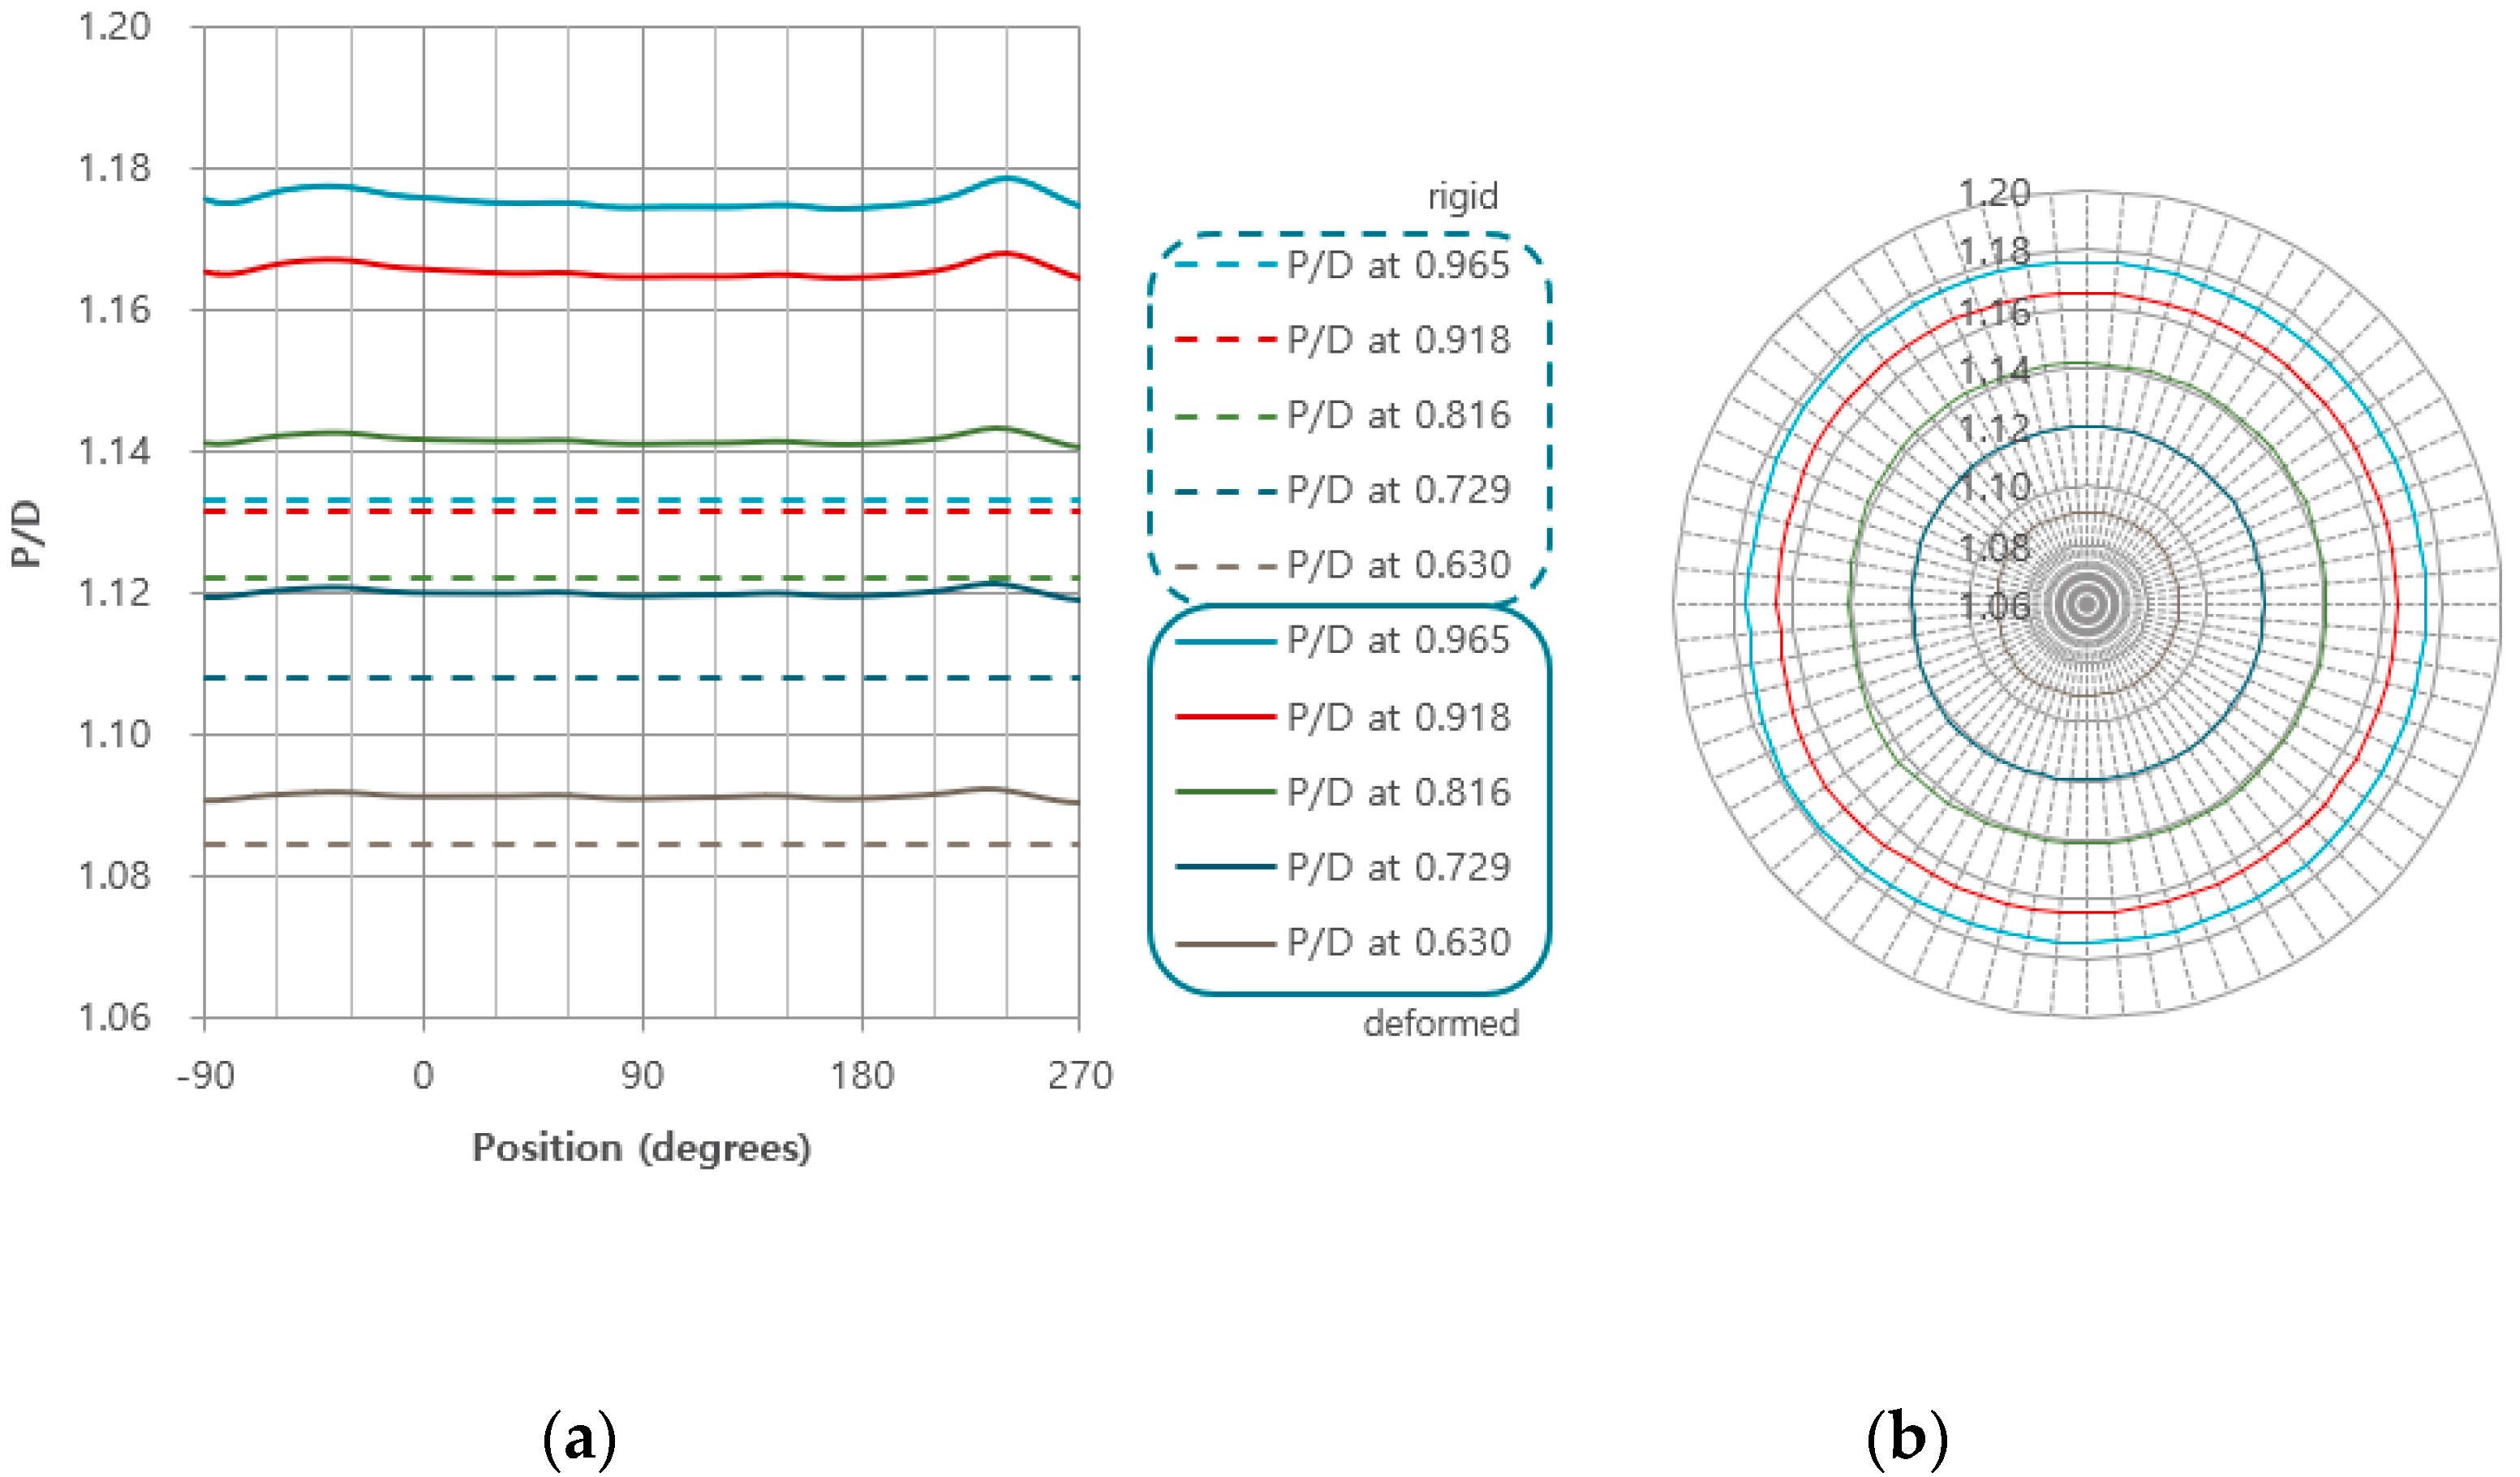
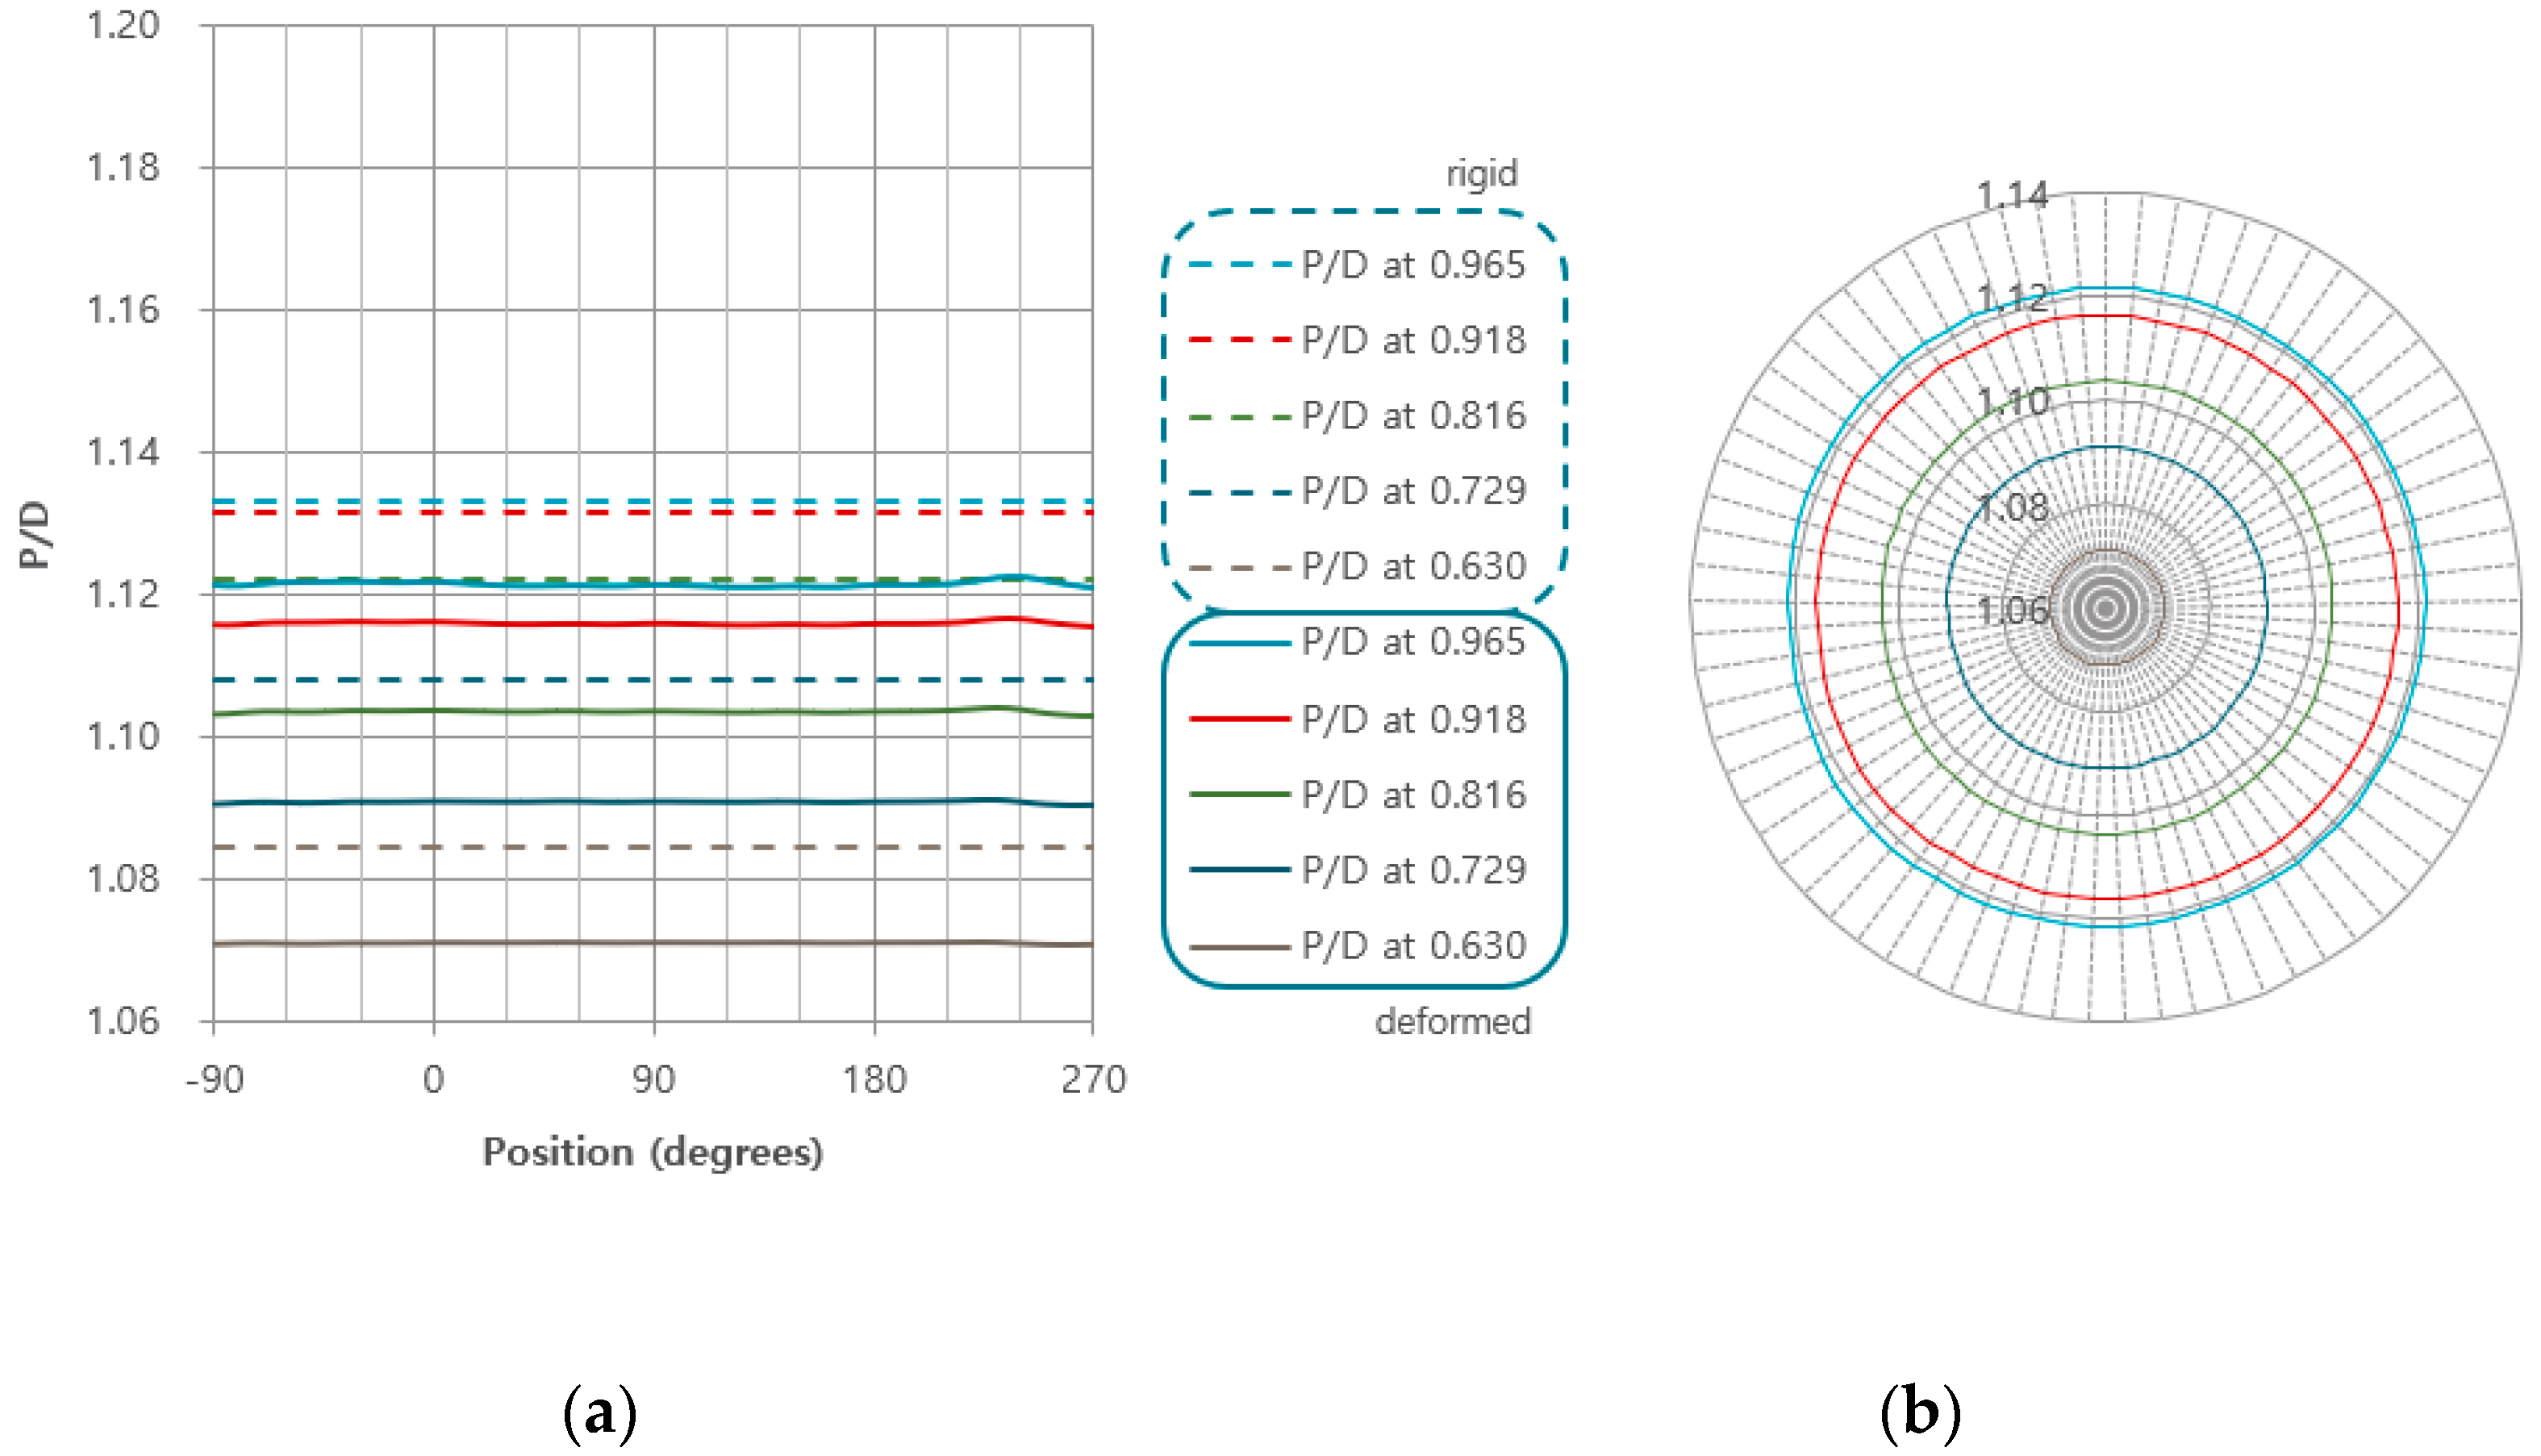
The deformed shapes of the composite propellers (models 1 and 5) in the cavitating flow were also predicted and compared with the rigid propeller. The test conditions were the same as for the non-cavitating flow, except for the cavitation number (non-cavitating flow: σ = 6.57, cavitating flow: σ = 1.2). The pitch distribution changes of the composite propellers in the cavitating flow showed no significant difference compared to the non-cavitating flow, as shown in Figure 8 and Figure 9. The shape parameters of the rigid and composite propellers for the non-cavitating and cavitating flows in a radial direction are compared in Figure 12.

3. Discussion

Changes in the pitch and rake are noticeable compared with the skew. In the case of rake, it is reduced after deformation due to the bending force upstream of the propellers. Here, the maximum displacements of models 1 and 5 are 2.93 and 2.18 mm, respectively, in the flow direction. Model 1 undergoes a greater change in the rake distribution than model 5. In the case of pitch, the deformation direction of the two models is opposite to that of the rigid propeller, as shown in Figure 8 and Figure 9. This is obvious, especially near the tip region, and results from the different elastic bending-twisting coupling effect of orthotropic composites, which is closely related to the stacking angle. In addition, the amount of change of propeller shape parameters including pitch, rake, and skew appears to be relatively smaller in the cavitating flow than in non-cavitating. It is predicted to be due to the thrust deduction caused by the occurrence of cavitation. However, the difference is not large, so the cavitation itself does not seem to have a significant effect on the amount of deformation of the composite propellers.
The development of TVC on rigid and composite propellers is shown in Figure 13. It appears that the change in cavity volume depends on the deformation of the composite propellers and is strongly affected by the pitch difference, based on the rigid propeller. In the case of model 1, the pitch increased after deformation, and the cavity volume also increased compared with that of the rigid propeller. In contrast, in the case of model 5, the cavity volume decreased as the pitch decreased after deformation. Consequently, the pitch was directly related to the angle of attack of the propeller, and it had a strong effect on the volume change of cavitation.
The contours of the vorticity magnitude and iso-surface of the Q-Criteria (Q = 1/2 ||ω||2||D’||2) for composite propellers (models 1 and 5) in the cavitating flow at the same rotation speed are shown in Figure 14, where ω and D’ are the vorticity tensor and rate-of-strain tensor, respectively. The strength of the tip vortex from the model 5 propeller was weaker than that of the model 1 propeller. The sound pressure levels of the rigid and composite propellers in the cavitating flow were compared, as shown in Figure 15 and Figure 16.
The cavity volume increases after the deformation of model 1 due to the increase in pitch, and the 1st BPF SPL increases by 1.5 dB, as shown in Figure 15. The increase in SPL of between 1 and 4 kHz (max. 30 dB) appears to be related to the TVC volume change [27,28,29]. Model 5 is designed to de-pitch after the deformation and strength of the vortical flow near the tip region, and the cavity volume is also lower than that of the rigid propeller. The 1st BPF SPL of the model 5 propeller decreases by 4.06 dB compared with the rigid propeller, as shown in Figure 16.
The thrust of the composite propellers before and after the deformation in the cavitating flow are shown in Figure 17 and Figure 18. The mean thrust also increased by approximately 8.5% as the pitch increased after the deformation for model 1. In case of model 5, the de-pitch behavior had a strong effect on the volume change of cavitation while the thrust of the composite propeller remained unchanged after deformation. This shows the possibility that the CIS can be delayed by using deformation of propeller while maintaining performance of propeller.
The sound pressure levels of the rigid and composite propellers in non-cavitation and cavitating flows are shown in Figure 19.
The sound pressure level of the propellers in the cavitating flow was higher by 15 to 20 dB compared with the non-cavitating flow condition. In general, the sound pressure level increased by 10 to 20 dB compared with the non-cavitating flow condition when cavitation occurred in the propeller due to the enhancement of the flow fluctuation characteristics [30]. Figure 20 show the sound pressure level of model 1 in non-cavitating and cavitating flows. Numerical results are compared with the experimental measurement data from KRISO. Here, BPF is clearly observed, however, SPL from the numerical analysis is underestimated compared to the experimental measurements. This underestimation may be related to the difference of deformation and the amount of cavitation, the lack of machinery noise etc. This study was limited to applying a high-order scheme or solver to improve the prediction accuracy of cavity development and noise characteristics due to the higher computational cost of FSI analysis. However, we attempted a hydroacoustic analysis of the noise generated and propagated by a composite propeller in non-cavitating and cavitating flows for the first time and obtained meaningful relative evaluation results between rigid and composite propellers.
In the future, improved mesh, solver, and acoustic models should be considered to increase the prediction accuracy of the deformation of composite propellers and cavitation-induced noise. It is expected that a method for validation with the experimental results can be developed in the next research stage.

4. Conclusions

The purpose of this study was to compare the performance of specific composite propellers with different ply angles from a CIS perspective. FSI analysis of model-scale composite propellers was performed using a coupled CFD-FEM to examine the influence of the lamination direction on the deformation of the composite propeller. Additionally, the effects of the stacking method on the performance of composite propellers were discussed and a hydroacoustic analysis of the noise generated and propagated by a composite propeller in non-cavitating and cavitating flows was conducted. Simulations of the hydrodynamic noise of composite propellers under cavitation conditions were performed to clarify the delay in the CIS speed due to the deformation. The results were as follows:
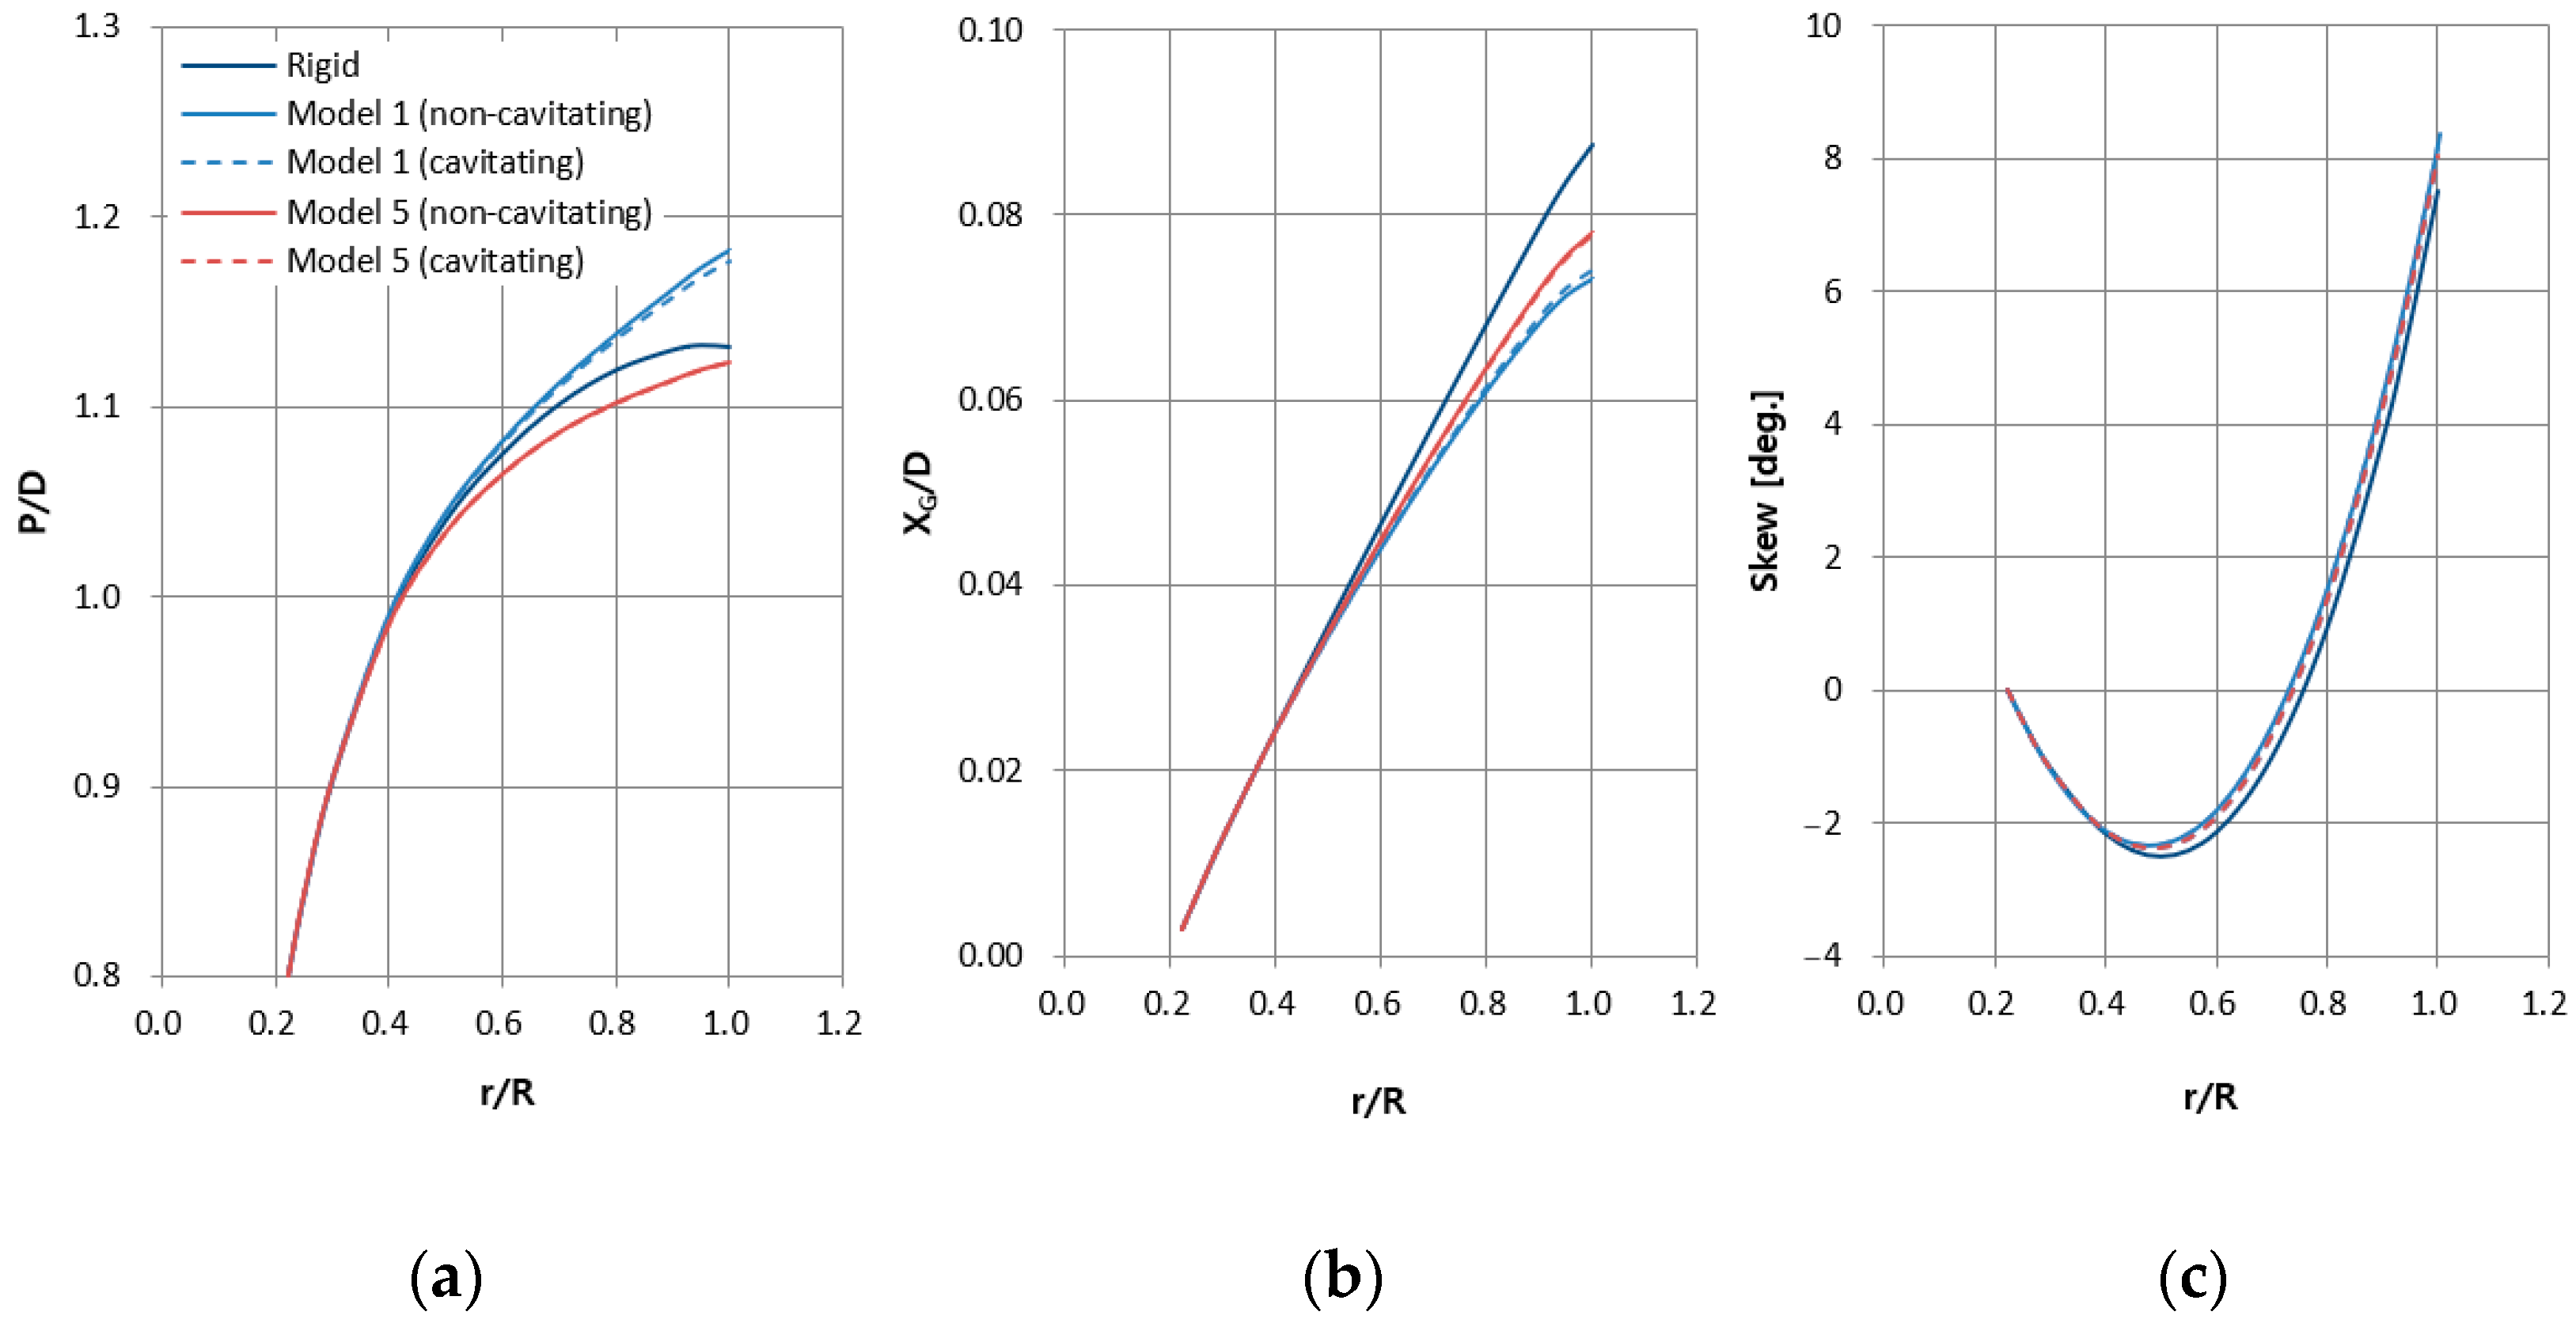
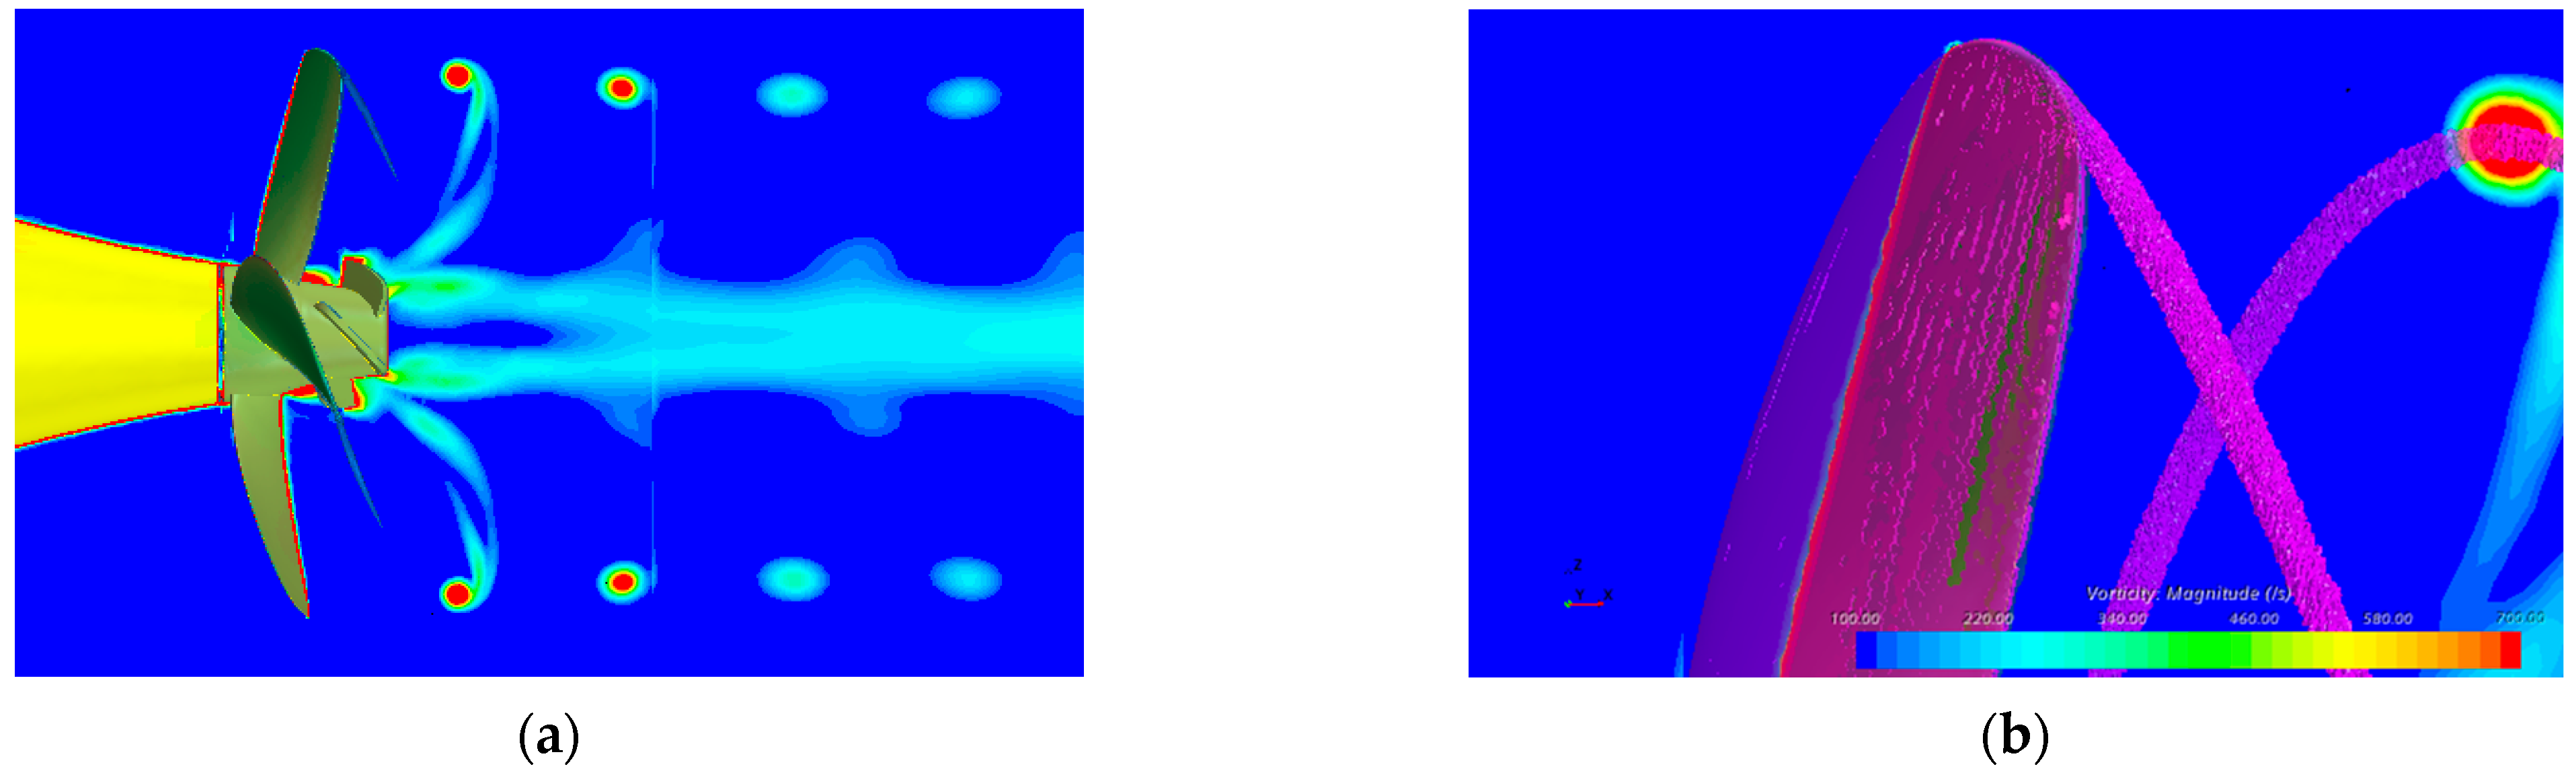
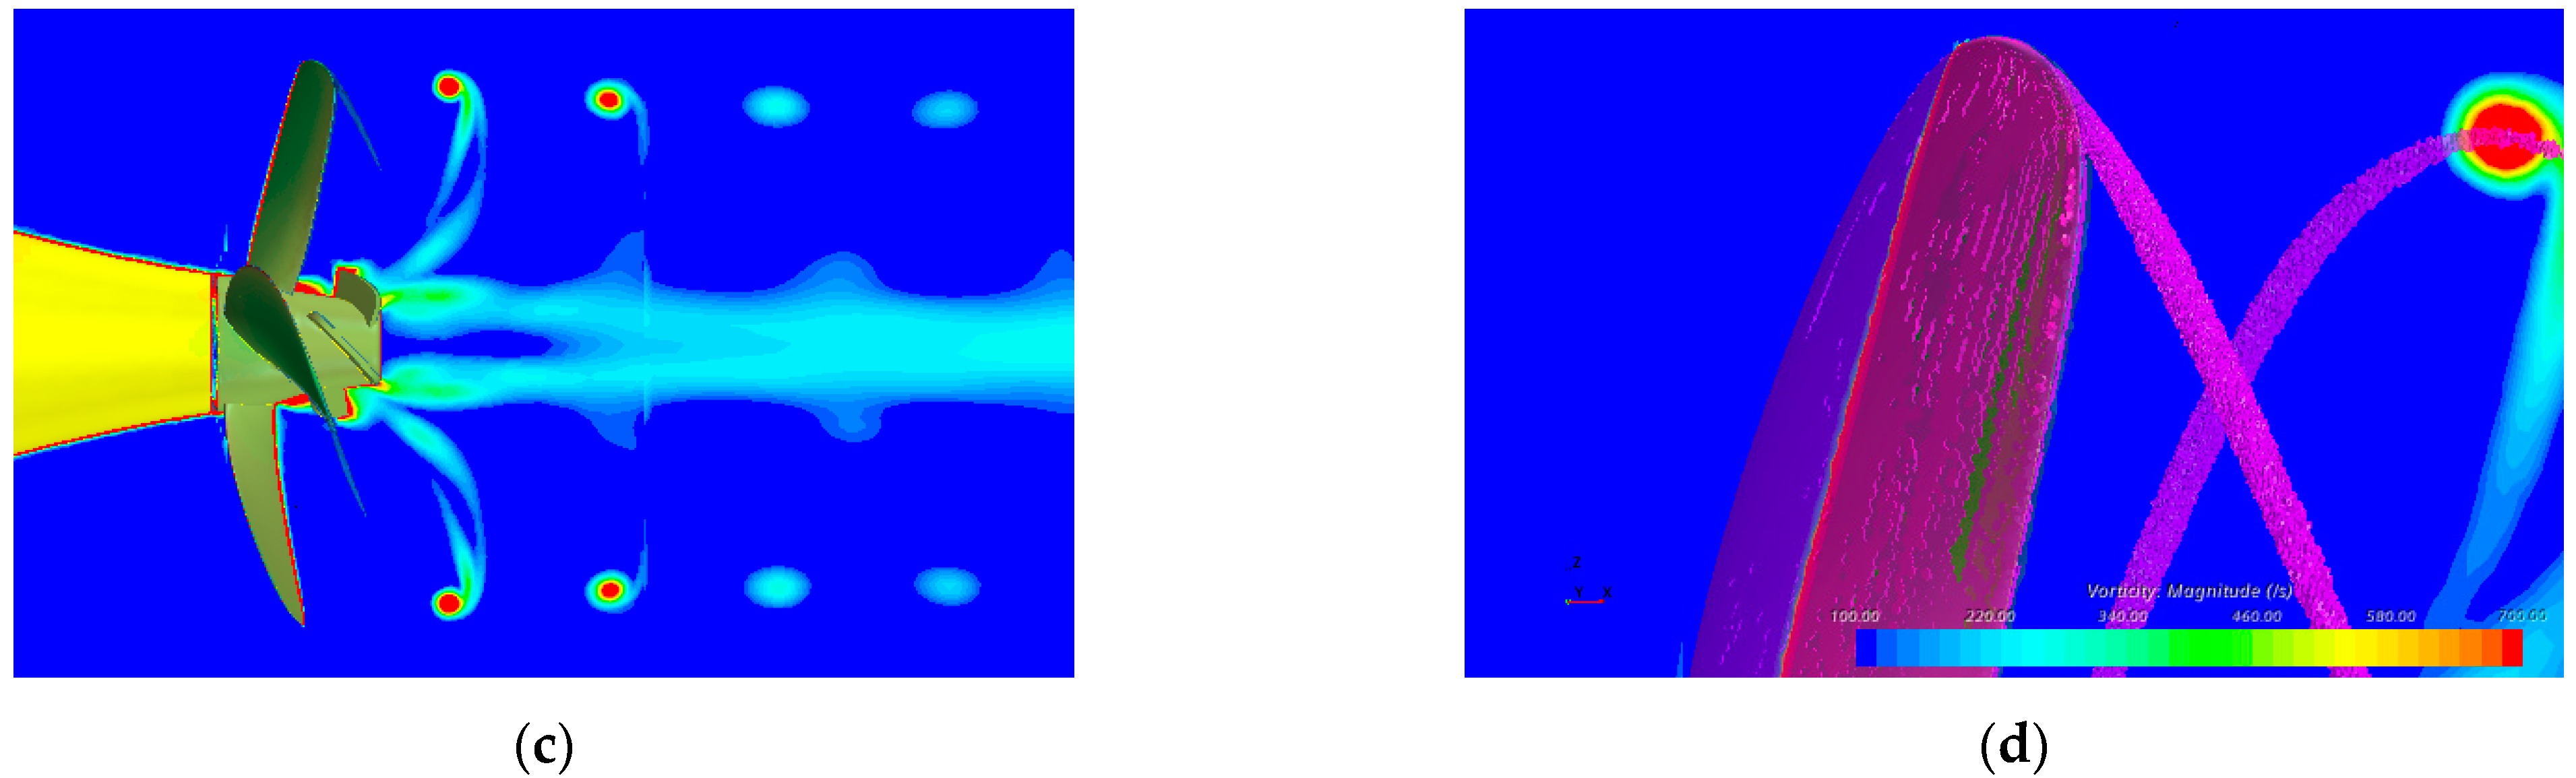
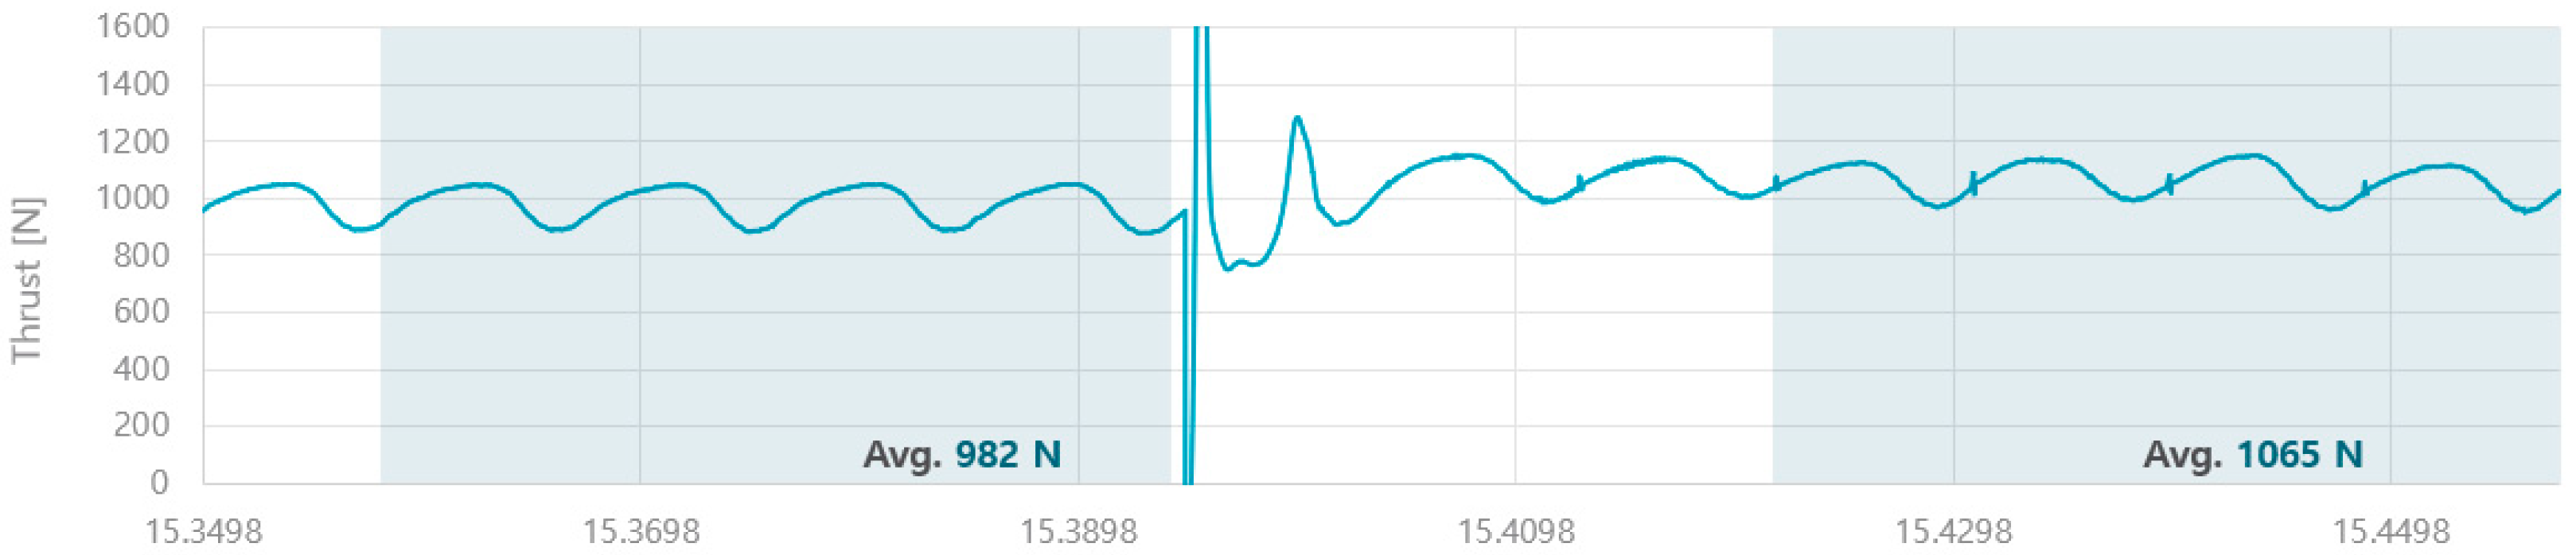
  • Some deformed parameters of the propeller, such as the pitch and rake, affected the performance of the propeller. In particular, it was confirmed that the deformation pattern of the pitch is directly related to the change in the strength of the vortical flow near the tip region.
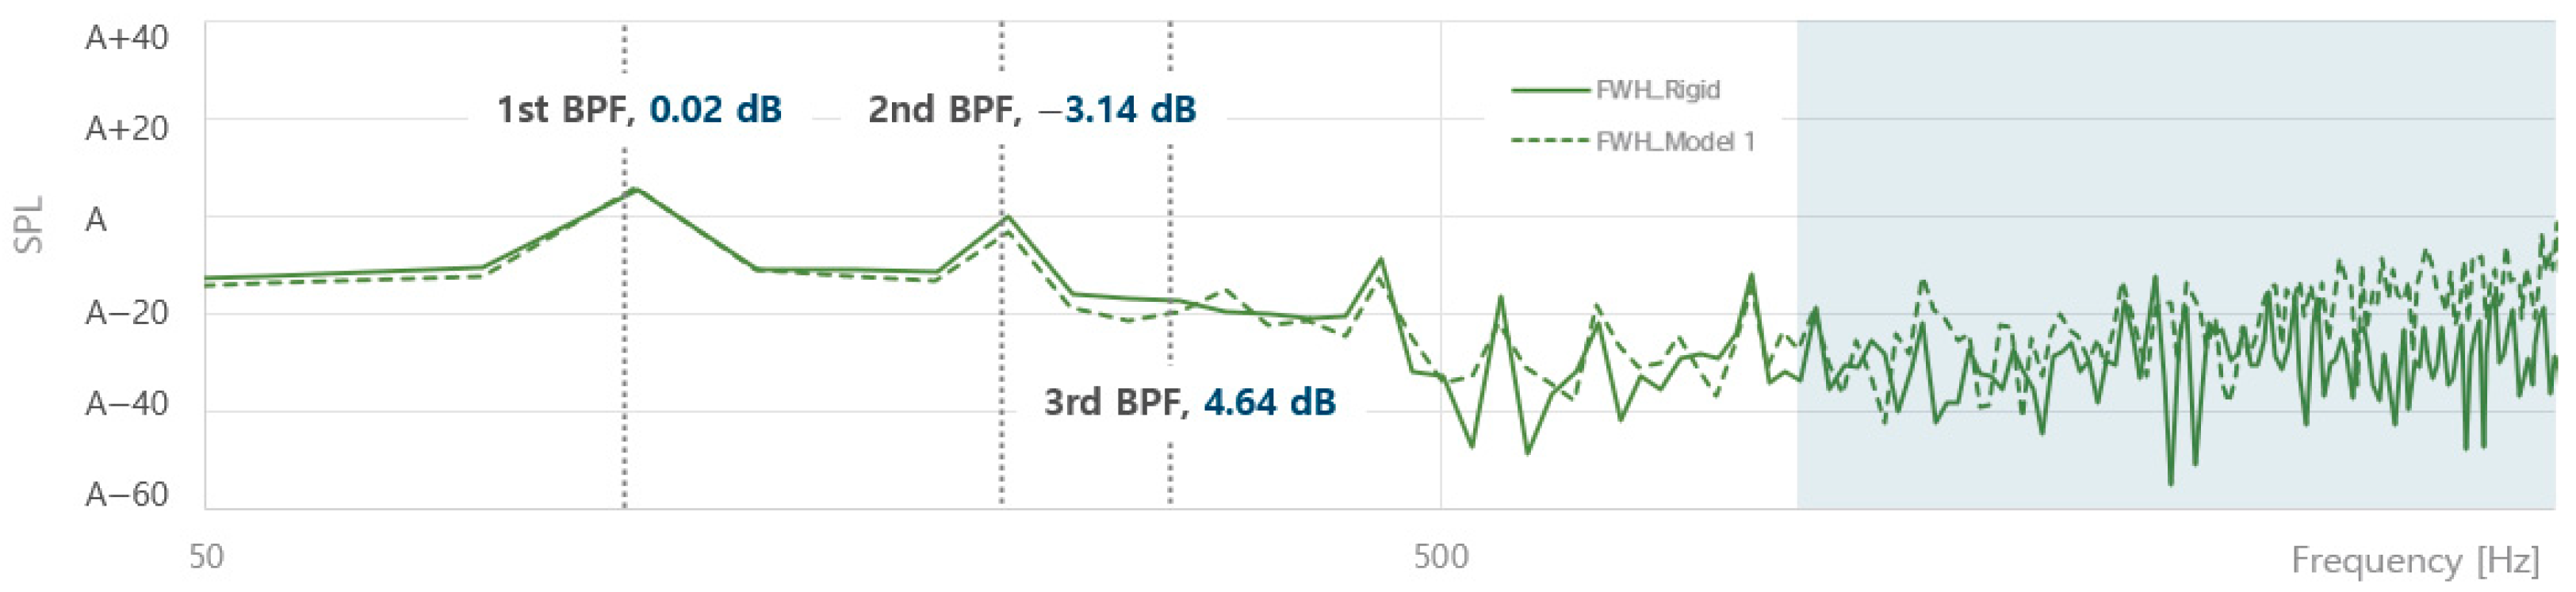
  • The deformation of the composite propeller itself did not have a significant effect on the sound pressure level, but the volume change of cavitation caused by the pitch change had a decisive effect on the variation of sound pressure level radiated from the composite propeller.
These results can improve the feasibility, conceptual design, performance, and manufacturing methods for composite propellers.

Author Contributions

Conceptualization and writing, J.-H.K.; methodology, H.L. and S.-H.K. of Hyundai Heavy Industries (HHI); resources, H.-Y.C. and Z.-H.H. of Korea Shipbuilding and Offshore Engineering (KSOE); validation, H.-S.S. of Korea Research Institute of Ships and Ocean Engineering (KRISO). All authors have read and agreed to the published version of the manuscript.

Funding

This research received no external funding.

Institutional Review Board Statement

Not applicable.

Informed Consent Statement

The study did not involve humans.

Data Availability Statement

The data presented in this study are available on request from the corresponding author.

Acknowledgments

This research was supported by Hyundai Heavy Industries (HHI) and Korea Shipbuilding and Offshore Engineering (KSOE). In addition, I appreciate Korea Research Institute of Ships and Ocean Engineering (KRISO) for technical support.

Conflicts of Interest

The authors declare no conflict of interest. The funders had no role in the design of the study; in the collection, analyses, or interpretation of data; in the writing of the manuscript, or in the decision to publish the results.

References

  1. Mouritz, A.P.; Gellert, E.; Burchill, P.; Challis, K. Review of advanced composite structures for naval ships and submarines. Compos. Struct. 2001, 53, 21–42. [Google Scholar] [CrossRef]
  2. Chen, B.; Neely, S.; Michael, T.; Gowing, S.; Szwerc, R.; Buchler, D.; Schul, R. Design, fabrication and testing of pitch-adapting (flexible) composite propellers. In Proceedings of the Propeller/Shafting 2006 Symposium, Williamsburg, VA, USA, 12 September 2006. [Google Scholar]
  3. Young, Y.L. Fluid-structure interaction analysis of flexible composite marine propeller. J. Fluids Struct. 2008, 24, 799–818. [Google Scholar] [CrossRef]
  4. Motley, M.R.; Liu, Z.; Young, Y.L. Utilizing fluid-structure interactions to improve energy efficiency of composite marine propellers in spatially varying wake. Compos. Struct. 2009, 90, 304–313. [Google Scholar] [CrossRef]
  5. Motley, M.R.; Young, Y.L. Performance-based design and analysis of flexible composite propulsors. J. Fluids Struct. 2011, 27, 1310–1325. [Google Scholar] [CrossRef]
  6. Paul, A.; Schmidt, A.; Wolf, E. Acoustically optimized propeller made from composite materials. ThyssenKrupp Techforum 2011, 1, 58–63. [Google Scholar]
  7. Lee, S.G.; Hwang, J.O.; Byun, J.H. Material & Structural Characteristics of Composite Material Flexible Propeller. J. Soc. Nav. Archit. Korea 2009, 46, 203–217. [Google Scholar]
  8. Lee, S.G.; Nam, J.H.; Hyun, B.S.; Paik, B.G.; Lee, C.S.; Jang, H.G.; Nho, I.S. Enhanced manufacturing and performance analysis of flexible composite propeller. J. Soc. Nav. Archit. Korea 2012, 49, 521–527. [Google Scholar] [CrossRef]
  9. Jang, H.G.; Nho, I.S.; Hong, C.H.; Lee, C.S. Design algorithm of flexible propeller by fluid-structure interactive analysis. J. Soc. Nav. Archit. Korea 2012, 49, 528–533. [Google Scholar] [CrossRef] [Green Version]
  10. Jang, H.G.; Nho, I.S.; Hong, C.H.; Lee, C.S. Natural frequency analysis of cantilever plates with added mass. J. Soc. Nav. Archit. Korea 2013, 50, 1–7. [Google Scholar] [CrossRef] [Green Version]
  11. Nakashima Propeller Co., Ltd. Benefits of Carbon Composite Marine Propeller. Available online: https://www.classnk.or.jp/classnk-rd/assets/pdf/katsudou201511_D.pdf (accessed on 12 May 2022).
  12. Lee, H.; Song, M.C.; Suh, J.C.; Kim, Y.J.; Chang, B.J. Hydro-elastic analysis of marine propellers based on a BEM-FEM coupled FSI algorithm. Int. J. Nav. Arch. Ocean 2014, 6, 562–577. [Google Scholar] [CrossRef] [Green Version]
  13. Lee, H.; Song, M.C.; Suh, J.C.; Cha, M.C.; Chang, B.J. A numerical study on the hydro-elastic behavior of composite marine propeller. In Proceedings of the 4th International Symposium on Marine Propulsors, Austin, TX, USA, 31 May 2015. [Google Scholar]
  14. Lee, H.; Song, M.C.; Han, S.H.; Chang, B.J.; Suh, J.C. Hydro-elastic aspects of a composite marine propeller in accordance with ply lamination methods. J. Mar. Sci. Technol. 2017, 22, 479–493. [Google Scholar] [CrossRef]
  15. Kim, J.H.; Ahn, B.K.; Lee, C.S.; Kim, G.D. Numerical prediction of hydroelastic performance of the flexible propeller. Int. J. Offshore Polar Eng. 2019, 29, 339–346. [Google Scholar] [CrossRef]
  16. Kim, J.H.; Ahn, B.K.; Kim, G.D. Design of Flexible Composite Propellers considering Fluid-structure Interaction. J. Soc. Nav. Archit. Korea 2020, 57, 61–69. [Google Scholar] [CrossRef]
  17. Mccormick, B.W. On Cavitation Produced by a Vortex Trailing From a Lifting Surface. J. Basic Eng. 1962, 83, 369–379. [Google Scholar] [CrossRef]
  18. Kuiper, G. Cavitation Inception on Ship Propeller Models. Ph.D. Thesis, Delft University of Technology, Delft, The Netherlands, 1981. [Google Scholar]
  19. Sezen, S.; Atlar, M.; Fitzsimmons, P. Prediction of cavitating propeller underwater radiated noise using RANS & DES-based hybrid method. Ships Offshore Struct. 2021, 16, 93–105. [Google Scholar]
  20. Schnerr, G.H.; Sauer, J. Physical and Numerical Modeling of Unsteady Cavitation Dynamics. In Proceedings of the 4th International Conference on Multiphase Flow, New Orleans, LA, USA, 27 May 2001. [Google Scholar]
  21. Kroger, H.; Frohlingsdorf, W. Simulation-based optimization of the manufacturing process for a composite marine propeller. In Proceedings of the CFK-Valley Stade Convention, Stade, Germany, 12 June 2012. [Google Scholar]
  22. Motley, M.R.; Kramer, M.R.; Young, Y.L. Free surface and solid boundary effects on the free vibration of cantilevered composite plates. Compos. Struct. 2013, 96, 365–375. [Google Scholar] [CrossRef]
  23. Suh, S.B.; Park, I.R. Numerical Simulation of the Flow Around the SUBOFF Submarine Model Using a DES Method. J. Soc. Nav. Archit. Korea 2021, 58, 73–83. [Google Scholar] [CrossRef]
  24. Ffowcs Williams, J.; Hawkings, D. Sound generation by turbulence and surface in arbitrary motion. Philosophical. Trans. R. Soc. Lond. Ser. Math. Phys. Sci. 1969, 264, 321–342. [Google Scholar]
  25. Lighthill, M. On sound generated aerodynamically Ⅰ. General theory. Proc. R. Soc. Lond. A Math. Phys. Sci. 1952, 211, 564–587. [Google Scholar]
  26. Farassat, F. Derivation of Formulations 1 and 1A of Farassat; Technical Memorandum TM-2007-214853; NASA, Langley Research Center USA: Hampton, VA, USA, 2007. [Google Scholar]
  27. Kuiper, G. New developments around sheet and tip vortex cavitation on ships. In Proceedings of the 4th International Symposium on Cavitation, Pasadena, CA, USA, 20 June 2001. [Google Scholar]
  28. Lee, J.H.; Seo, J.S. Application of spectral kurtosis to the detection of tip vortex cavitation noise in marine propeller. Mech. Syst. Signal Process. 2013, 40, 222–236. [Google Scholar] [CrossRef]
  29. Seol, H.S.; Kim, S.Y. Study on the analysis of model propeller tip vortex cavitation inception. J. Acoust. Soc. Korea 2018, 37, 387–395. [Google Scholar]
  30. Wu, Q.; Huang, B.; Wang, G.; Cao, S.; Zhu, M. Numerical modelling of unsteady cavitation and induced noise around a marine propeller. Ocean Eng. 2018, 160, 143–155. [Google Scholar] [CrossRef]
Figure 1. Submerged body (b) with design propeller and boss cap fins (a).
Applsci 12 05170 g001
Figure 2. Experimental observation in non-cavitating (a) and cavitating flow (b) with flow simulation results: (c) Q-criterion contour, (d) iso-surface of Q-criterion (grey) on the blade (red).
Applsci 12 05170 g002
Figure 3. Numerical simulation domain.
Applsci 12 05170 g003
Figure 4. Mesh refinement of rotating region: (a) refined mesh, (b) vorticity contour, (c) refined mesh region.
Applsci 12 05170 g004
Figure 5. The comparison of a material beam between (a) the real FE model and (b) simple ply stack model. (Reprinted with permission from Ref. [14]. Copyright 2017 Hyoungsuk Lee).
Applsci 12 05170 g005
Figure 6. Lamination drawings of models 1 and 5.
Applsci 12 05170 g006
Figure 7. Flow Diagram for the coupled CFD-FEM fsi analysis.
Applsci 12 05170 g007
Figure 8. Pitch distribution changes of model 1 in the non-cavitating flow: (a) pitch distribution change according to the blade position, (b) radial chart of pitch distribution of composite propeller.
Applsci 12 05170 g008
Figure 9. Pitch distribution changes of model 5 in the non-cavitating flow: (a) pitch distribution change according to the blade position, (b) radial chart of pitch distribution of composite propeller.
Applsci 12 05170 g009
Figure 10. Sound pressure level of rigid and composite propellers (model 1) in a non-cavitating flow.
Applsci 12 05170 g010
Figure 11. Sound pressure levels of rigid and composite propellers (model 5) in a non-cavitating flow.
Applsci 12 05170 g011
Figure 12. Shape parameters of rigid and composite propellers in non-cavitating and cavitating flows: (a) pitch distribution, (b) rake distribution, (c) skew distribution.
Applsci 12 05170 g012
Figure 13. Development of TVC (a: rigid, b: model 1, c: model 5, σ = 1.2).
Applsci 12 05170 g013
Figure 14. Vorticity contour and iso-surface of Q-Criteria of composite propellers for: (a,b) model 1, and (c,d) model 5, respectively, in the cavitating flow.
Applsci 12 05170 g014aApplsci 12 05170 g014b
Figure 15. Sound pressure level of rigid and composite propellers (model 1) in the cavitating flow.
Applsci 12 05170 g015
Figure 16. Sound pressure level of rigid and composite propellers (model 5) in the cavitating flow.
Applsci 12 05170 g016
Figure 17. Thrust of composite propeller (model 1) before and after the co-simulation in the cavitating flow.
Applsci 12 05170 g017
Figure 18. Thrust of composite propeller (model 5) before and after the co-simulation in the cavitating flow.
Applsci 12 05170 g018
Figure 19. Sound pressure levels of rigid and composite propellers in non-cavitating and cavitating flows.
Applsci 12 05170 g019
Figure 20. Sound pressure levels of model 1 in non-cavitating and cavitating flows.
Applsci 12 05170 g020
Table 1. Geometric details of test model.
ParametersValue
Diameter, D [m]0.2882
Hub ratio0.2233
Pitch ratio at r/R = 0.7, (P/D)r/R=0.71.1018
Mean pitch ratio, (P/D)mean1.0777
Expanded area ratio 0.4959
Number of blades, Z4
Tip skew angle [°]7.5000
Tip rake [mm]0.0252
Table 2. Convergence test.
No. of GridsThrust [N]KT
CoarseApprox. 6.7 million942.190.1761
MediumApprox. 14.3 million977.990.1828
FineApprox. 23.2 million996.030.1862
Table 3. Test conditions.
Velocity, V [m/s]9.00
Propeller rotating speed, n [rps]27.87
Thrust coefficient, KT0.193
Cavitation number at the center of propeller shaft, σn,center6.57
Pressure, P [Pa]212,500
RemarksNon-cavitation condition
Publisher’s Note: MDPI stays neutral with regard to jurisdictional claims in published maps and institutional affiliations.

