Article

Investigation of the Flow Field and Aerodynamic Load on Impellers under Guide Vanes with a Self-Induced Slot in Compressor Radial Inlet

1
Naval Architecture and Ocean Engineering College, Dalian Maritime University, Dalian 116026, China
2
Pakistan Navy Engineering College, National University of Sciences and Technology, Islamabad 75300, Pakistan
3
School of Energy and Power Engineering, Dalian University of Technology, Dalian 116024, China
*
Author to whom correspondence should be addressed.
Submission received: 3 May 2022 / Revised: 16 May 2022 / Accepted: 17 May 2022 / Published: 20 May 2022

Abstract

:
The flow field and the efficiency of the compressor can be improved and increased by the guide vane in the radial inlet chamber. However, the guide vane generates the wake and results in the rotor–stator interaction, which threatens the safety of the impeller. This paper investigated the guide vane with a self-induced slot (SIS) in a radial inlet, and the self-induced slot was a passive flow control method. Through computational fluid dynamics (CFD) simulation, the radial inlet containing unevenly distributed guide vanes (UGVs) in the hydrogen compressor was studied to clarify the flow phenomenon in the radial inlet and the aerodynamic load on the impellers. The simulation results showed that the self-induced slot did not affect the compressor performance but improved the pure wake style to the weak wake near the shroud region. The aerodynamic load on the impeller leading edge was obtained under different radial inlets through unsteady simulation. The dominant frequency and the pulse amplitude of aerodynamic load were obtained by fast Fourier transforms (FFTs). The SIS model had lower amplitude values at the impeller passing frequency, and the reduction in amplitude was about 18% compared to the UGV model near the impeller shroud region.

1. Introduction

Most compressors currently use the radial inlet as the upstream component [1]. As the radial inlet transports working fluids from the pipelines to the impeller inlet, it should provide a uniform flow field for the impeller to guarantee the compressor good performance. Due to the complex configuration of the radial inlet, the flow field in it shows complicated three-dimensional characteristics, which means that a uniform flow field can barely be obtained in the radial inlet, and it harms the performance of the compressor [2]. Generally, the radial inlet causes a 1% to 4% and a 2% to 4% decrease in efficiency and total pressure of the compressor, respectively, compared with the axial flow inlet [3,4]. Therefore, researchers investigating the flow characteristic of the radial inlet through experiments and numerical simulations is meaningful for the compressor.
Tan et al. [5] reviewed the radial inlet from the internal flow in the radial inlet and its effects on the compressor performance [6], and summarized the design of the structure and optimum method in the radial inlet [7]. Using three-hole probes, Flathers et al. [8] measured the flow parameter distribution at the exit of the radial inlet and compared the experiment and simulation. Han et al. [9] measured the flow in the radial inlet and observed the flow loss and distortions caused by flow separations and vortices. Through different conditions, Zhang et al. [10] analyzed the relationship between the bent torsional methods and the compressor performance based on the experiments. MacManus et al. [11] and Yamada et al. [12] respectively investigated the effects of upstream and swirling distortions based on S-duct and bent pipes in the single-stage centrifugal compressor and found that the geometry greatly influenced the downstream flow field.
Based on the development of technology, the optimization methods are suitable for engineering design. Wu et al. [13] simplified the structure of the radial inlet by parameterized design model analysis, which improved the precision and efficiency of the radial inlet design. With the assistance of the computational fluid dynamics technique, an optimization approach for the radial inlet design of the meridian plane was developed by Chen [14] to obtain a 1.26% improvement in the polytropic efficiency. Yagi et al. [15] optimized the radial inlet structure by proposing an optimization method to increase the efficiency by a new design parameter. The parameter had a significant impact on the total pressure loss and the circumferential non-uniformity in the radial inlet.
In addition, adding the guide vane could improve the flow field and weaken the negative impact of the radial inlet [16]. Wang et al. [17] added the vanes in the radial inlet, which resulted in the flow loss increasing and the flow distortion decreasing. Through optimizing the profile of vanes in the radial inlet, the flow separation loss was further reduced, which increased the efficiency of the compressor. Han et al. [18] added the guide vanes in the radial inlet and increased the efficiency by 4.97% over different operating conditions for the compressor.
Most of the literature indicates that the radial inlet has a significant effect on the safety of the downstream impeller. By reviewing the unsteady aerodynamic loads in the centrifugal compressor, Wang et al. [19] considered that the flow characteristic in the radial inlet is an essential factor for analyzing the safety of the impeller that cannot be ignored. During the compressor operation, Han et al. [20] found that the radial inlet excited aerodynamic load on the impeller, but the impeller had a slight effect on the flow field of upstream the impeller, i.e., in the radial inlet. In the radial inlet, Xin et al. [21] added the guide vanes to protect the impeller by providing a uniform flow field and decreasing the aerodynamic load on the impeller at the machine rotation frequency.
Setting guide vanes in the radial inlet is beneficial for improving the flow field. However, the guide vane wake generates one more aerodynamic load on the impeller due to the rotor–stator interaction (RSI) [22]. Furthermore, hydrogen as the working fluid can easily raise the hydrogen embrittlement in the compressor. Therefore, the RSI and hydrogen embrittlement threaten hydrogen compressor safety. The trailing edge blowing (TEB) proposed by Park and Cimbala [23] is an active control method to reduce the effect of wake and RSI. According to the wake characteristics, the wakes can divide into four categories: the pure wake, the weak wake, the momentumless wake, and the jet.
Wu et al. [24] measured the mean velocity profiles of the wake and indicated that the momentumless wake made the inlet flow of the rotor more uniform and improved the inlet flow angle of the rotor. By adding an extra 2% flow rate for TEB, Lewis et al. [25] decreased about 43% of the amplitude at the blade passing frequency in the Francis turbine. Based on the centrifugal compressor with TEB on the guide vanes, Xin et al. [26] analyzed the flow field and aerodynamic load on the impeller. When obtaining the momentumless wake, the aerodynamic loads on the impeller had reduced significantly. Combined with the TEB method, Xin et al. [27] investigated the effect of the radial inlet guide vane. The results showed that the TEB reduced the wake intensity and decreased the aerodynamic load, which ensured a smooth operation and provided a long lifetime for the compressor. Moreover, the passive control method was suitable for reducing the total pressure loss and decreasing the wake intensity in turbomachinery. Eberlinc et al. [28] set the slot in the rotor for the axial fan and led the fluid flow from the root to the tip by centrifugal force. This performance improved the flow field near the tip region, decreased the boundary layer separation, and increased the fan efficiency. Based on a cavity for flow recirculation, Cravero et al. [29] adopted the ported shroud on the centrifugal compressor to avoid blade passage blocking in near-surge conditions. Xin et al. [30] added a two-slot configuration in the inlet guide vane of the compressor, and the results showed that the slot changed the wake distribution under different operation conditions [31]. Under winter conditions, i.e., the angle of 38.6°, the slot produced a nearly 13% reduction of the amplitude of the impeller passing frequency at the leading edge.
As the TEB method needs extra power from the outside of the compressor, this study adopted a passive control method, which employs the self-induced slot (SIS) on the guide vane. The hydrogen compressor with radial inlet was engaged in this paper to evaluate the effects of the SIS method on compressor performance and aerodynamic load on the impeller. Meanwhile, the TEB method was used for comparison in this study. Through the analysis using numerical simulation, the effects of the SIS method on the compressor performance, flow field in the radial inlet, and the aerodynamic load on the impeller were investigated.
The organization of this paper is as follows. The second section describes the hydrogen compressor and the computational consideration, which includes the scheme of TEB and SIS methods. The aerodynamic load and the flow field in TEB and SIS models are analyzed in the third section compared with the UGV model. Lastly, the fourth section provides some conclusions.

2. Description of Compressor and Computational Considerations

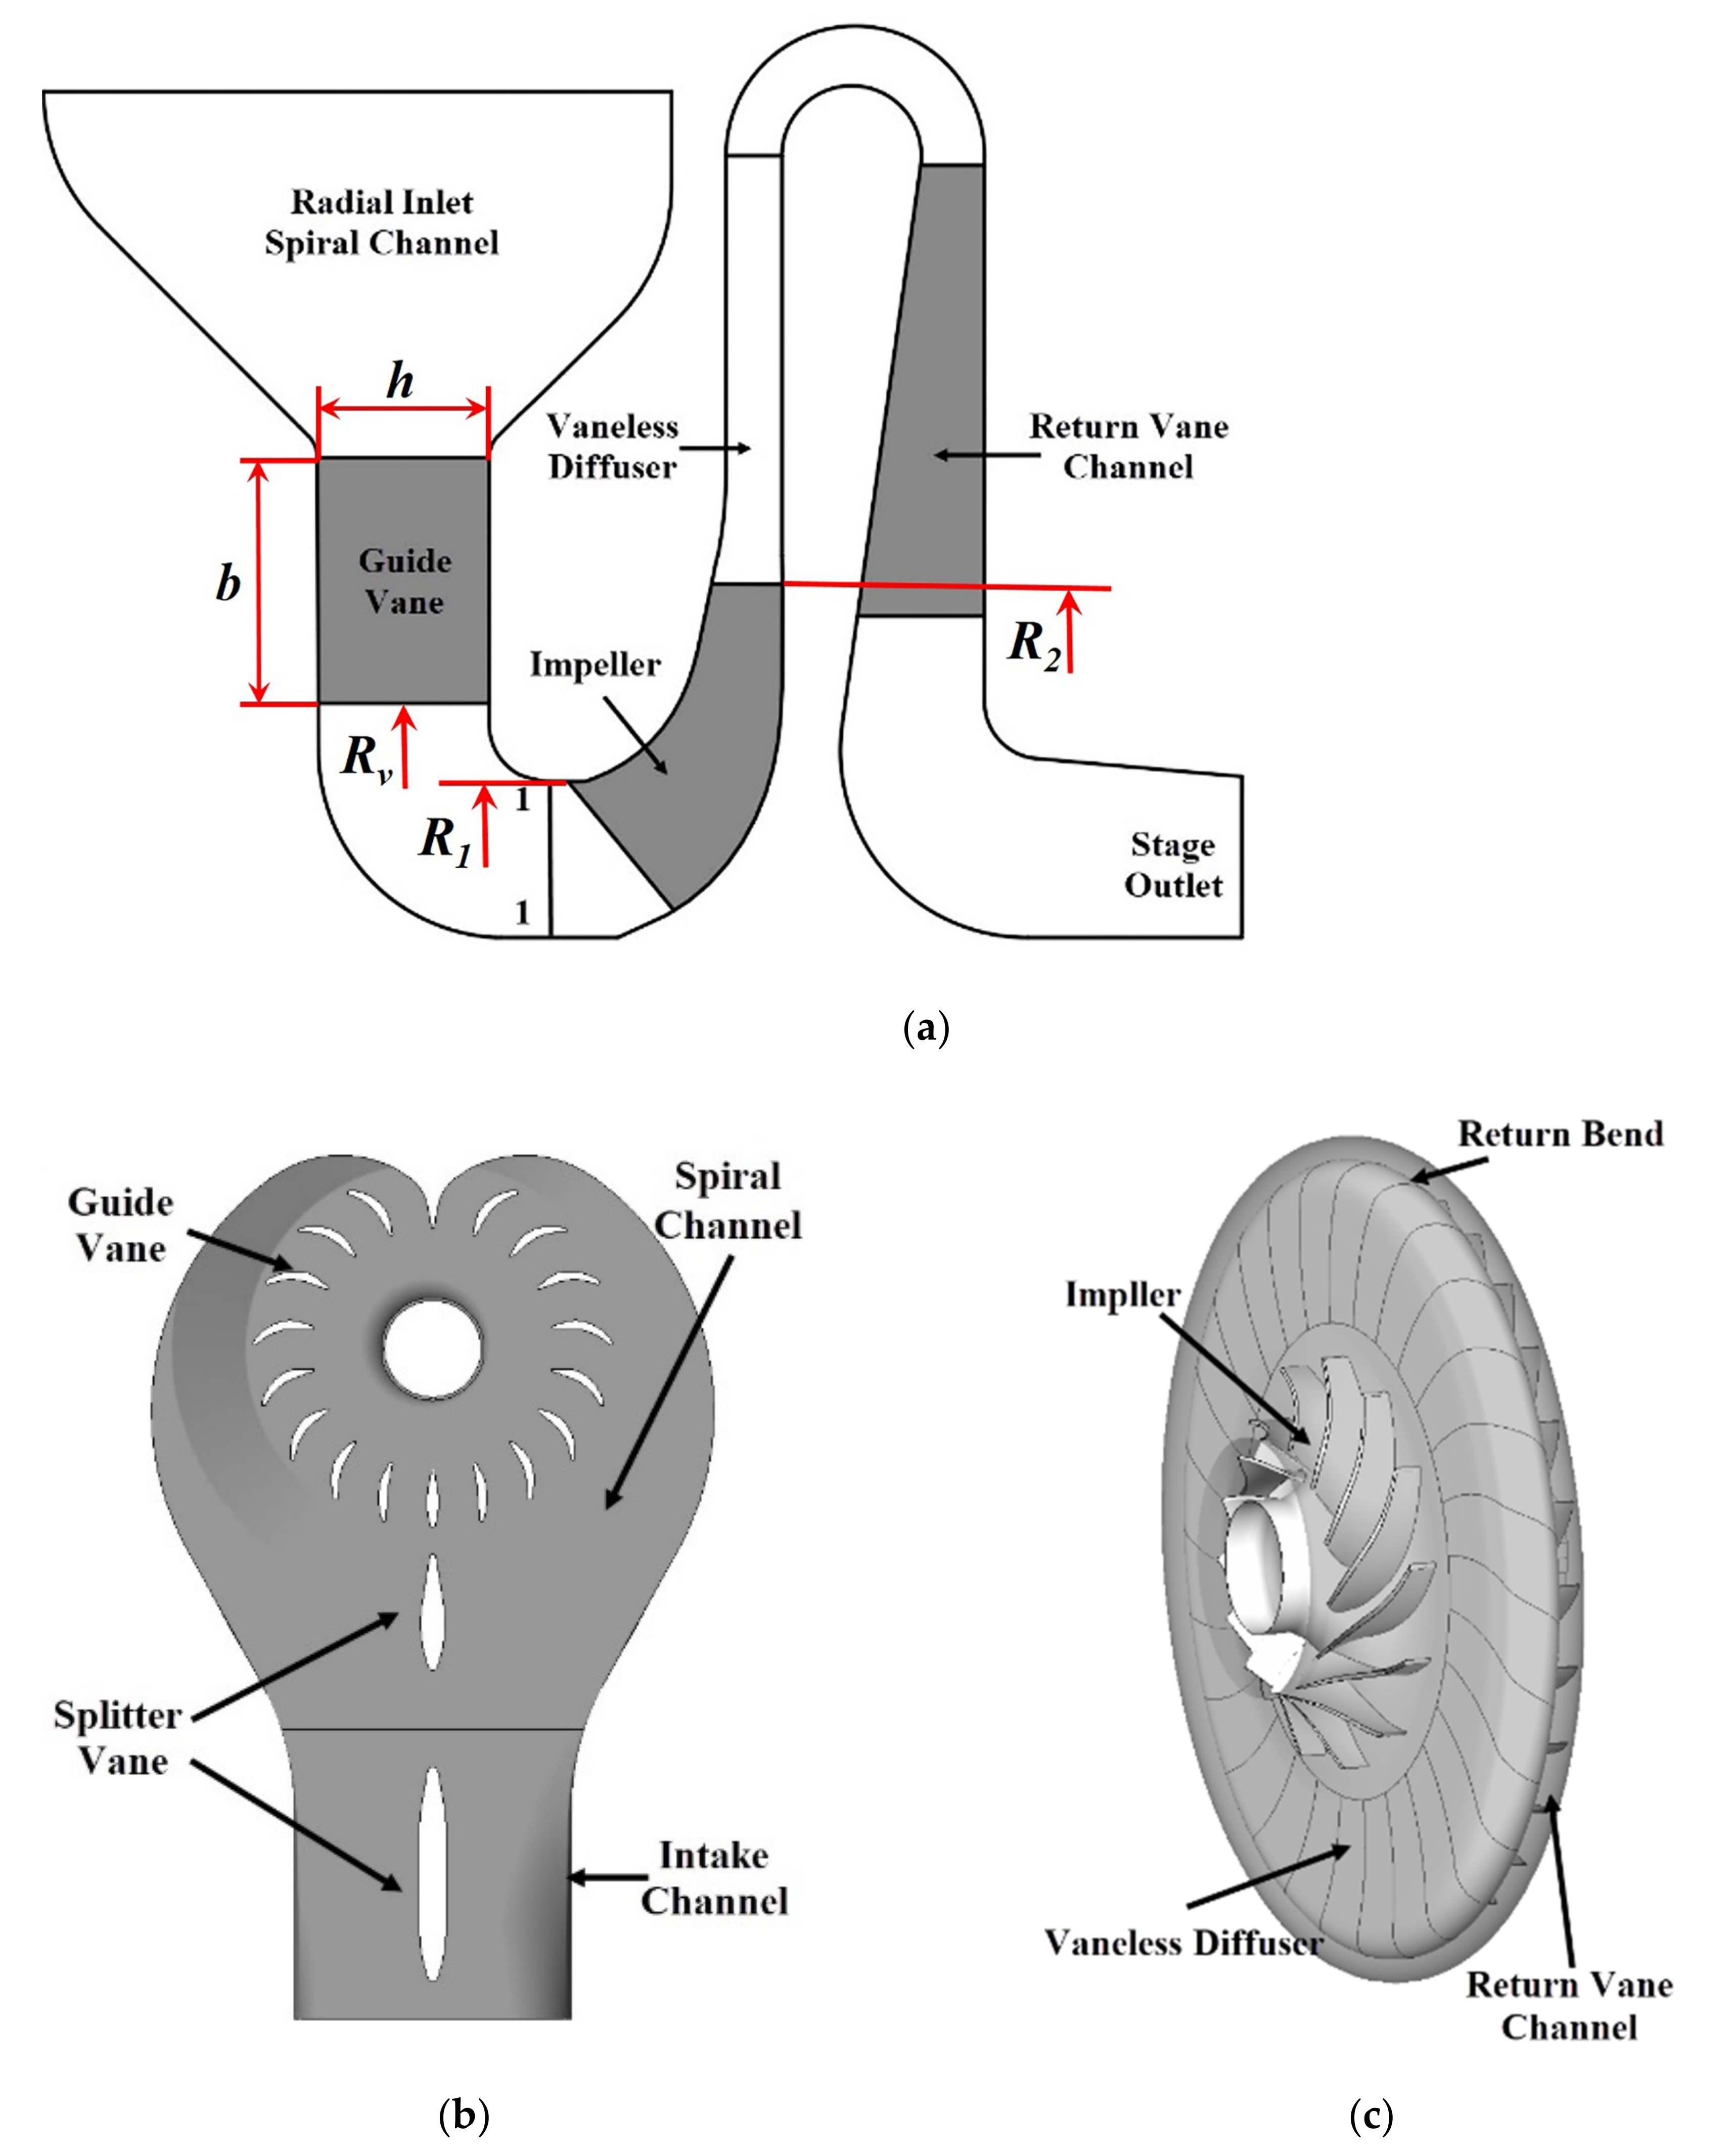
2.1. The Geometry of Hydrogen Compressor with Radial Inlet

Figure 1 illustrates the hydrogen compressor in a methanol process which was used to compress the recycled gas. The composition of the recycled gas is summarized in Table 1, and the main component was hydrogen, which was about 89 in terms of mole fraction. The parameters of the recycled gas were calculated by the Refprop program (National Institute of Standards and Technology, Gaithersburg, MD, USA) based on the GERG-2004 natural gas mixture model, which was used as the working fluid in the subsequent simulation.
The compressor is a double-sided symmetrical structure. Figure 1a shows the compressor meridian plane, which comprises four components: the radial inlet, the first stage impeller, the vaneless diffuser, and the return channel. Figure 1b shows the radial inlet with 18 unevenly distributed guide vanes. Figure 1c presents the first stage with 13 shrouded impeller blades where the diffuser is vaneless and there are 28 vanes in the return channel. The parameters of the compressor are listed in Table 2.
Table 3 summarizes the compressor performance at the design condition, and the parameters refer to the first stage, not taking into account the seal leakage loss. Since hydrogen was the main component of the recycled gas, which is hard to compress, the compressor pressure ratio was low, with a value of 1.045. Under the hydrogen brittleness effect and high pressure, the impeller was working in a bad environmental condition, which can easily raise the issue of impeller failure.
The efficiency and pressure ratio of the compressor are defined [32], respectively, as:
η = γ - 1 ln P o u t / P i n / γ ln T o u t / T i n
ε = P o u t / P i n
where γ represents the specific heat ratio, and Pout and Tout represent the discharge total pressure and the discharge total temperature, respectively.

2.2. Computational Considerations

All the numerical simulations were performed by CFX software (Pittsburgh, PA, USA) in this study. Based on the compressor model, the radial inlet, the first stage, the vaneless diffuser, and the return channel were selected as the simulation domain, which ensured the computing efficiency of the CFD. However, this study focused on the effect of the radial inlet on the flow field and the aerodynamic load, with the seal area ignored in this simulation.
The heat transfer method adopts the total energy equation, and the turbulence model is the k-ω model based on the shear-stress transport (SST). The SST model depends on the turbulence energy and the turbulence diffusion rate equations [33], and it is widely adopted in turbomachinery [34,35,36]. Under the adverse pressure gradients, the SST model could provide highly accurate predictions for onset and flow separation. The high-resolution advection was used in the simulation, and the target of the root mean square (RMS) residual was 10−5 for variable components. The difference value between the inlet and outlet mass flow should be less than 0.2%, and the calculation of variables that should be stable are the two conditions for the standard of convergence.
The RSI effect should be caught by the unsteady simulation. The steady simulation result is used as the initial value for the unsteady simulation. During the unsteady simulation, the total computing time is set to 10 circles of the impeller rotation for the compressor to record stable and precise aerodynamic data on the impeller. The time step size is related to the compressor operation condition [37]. Based on the verification of time step independence, one rotation cycle of the impeller contains 180 time steps, i.e., the length of the time step is 4.176 × 10⁻⁵ s. The time step coefficient loops are set from 3 to 10 to ensure simulation convergence.
As the radial inlet is an upstream component of the impeller, the leading edge of the impeller is a primary region affected by the RSI. Therefore, from the hub to the shroud, the monitoring points are kept along a single impeller blade leading edge at an equal distance to record the data during the unsteady simulation. Figure 2 shows the location of the monitoring points where 12 points (P1 to P12) are on the pressure side, and 12 points (S1 to S12) are on the suction side. The monitoring points are associated with the rotating coordinate system related to the impeller operation and record the data on the impeller.
The boundary conditions in this investigation were defined as follows. The Pin and Tin were set at the inlet with medium turbulence, i.e., 5% turbulence intensity, and the Qd at the outlet was defined. The general grid interface (GGI) was used to connect each component. The frozen rotor and transient rotor–stator interfaces were selected for the steady and the unsteady simulations, respectively, to ensure accurate transmission of the flow field between the rotor and stator. For the wall and impeller surface, the non-slip condition was used.
In this article, the impeller passage structured meshes were generated by Turbo-grid. After that, this periodic passage was copied to the whole wheel model meshes. The commercial mesh generator ICEM generates structured and unstructured meshes in the radial inlet, as shown in Figure 3.
Usually, a gird independent study can give the proper mesh number of simulations, and we adopted the grid convergence index (GCI) method [38]. Three sets of grids were used in our verification, and their numbers were N1 = 10 million, N2 = 6.4 million, and N3 = 3 million. The corresponding discharge total pressures were Φ1 = 6,823,850 Pa, Φ2= 6,824,503 Pa, Φ3 = 6,830,380 Pa, respectively. The results of the grid convergence study based on the GCI method are shown in Table 4. The GCI21 and GCI32 were less than 1%, indicating that the solutions were within the asymptotic range of convergence, and the exact solution was approximately obtained.
Notably, a gird independent study for the whole compressor was verified with experimental data in previous research [39]. Thus, in subsequent calculations, the 6.4 × 10⁶ elements were employed with minimum orthogonality of 23.45°. The number of elements for the four simulation domains was as follows. The radial inlet contained 3.2 × 10⁶ elements, the first stage impeller had 0.8 × 10⁶ elements, the vaneless diffuser contained 0.3 × 10⁶ elements, and finally, the return channel contained 2.1 × 10⁶ elements. Meanwhile, the Y plus was less than 1, the max aspect ratio was less than 1000, and the max expansion ratio was less than 3 in the simulation domains. Thus, the meshes satisfied the requirement of the SST turbulence model and guaranteed good resolution of the viscous sub-layer.

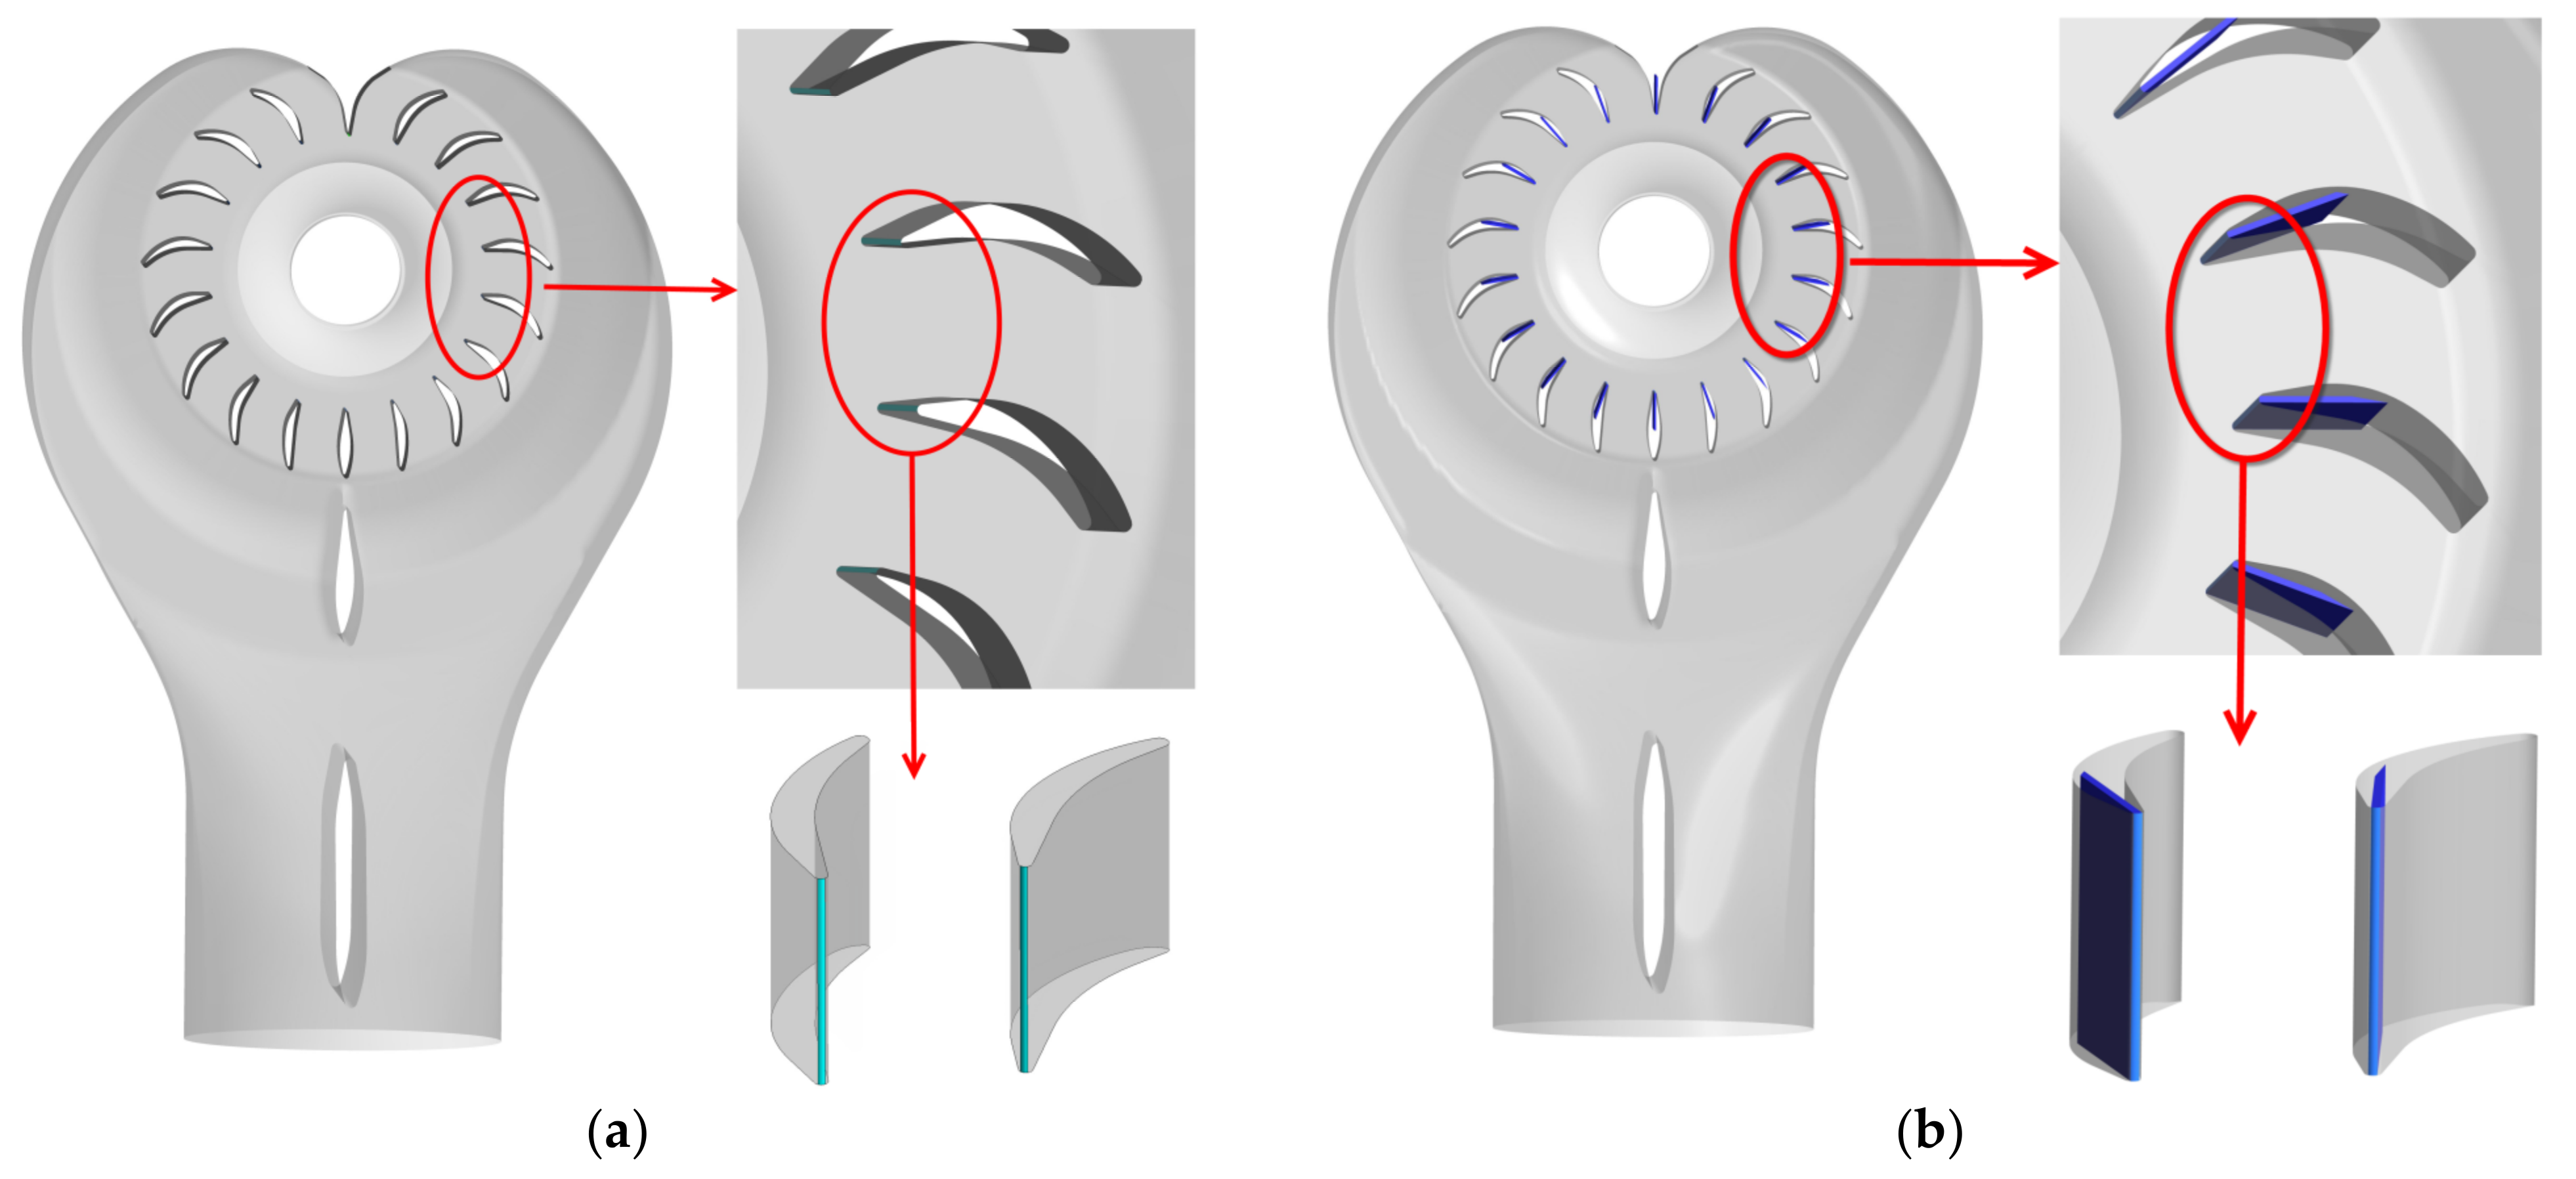
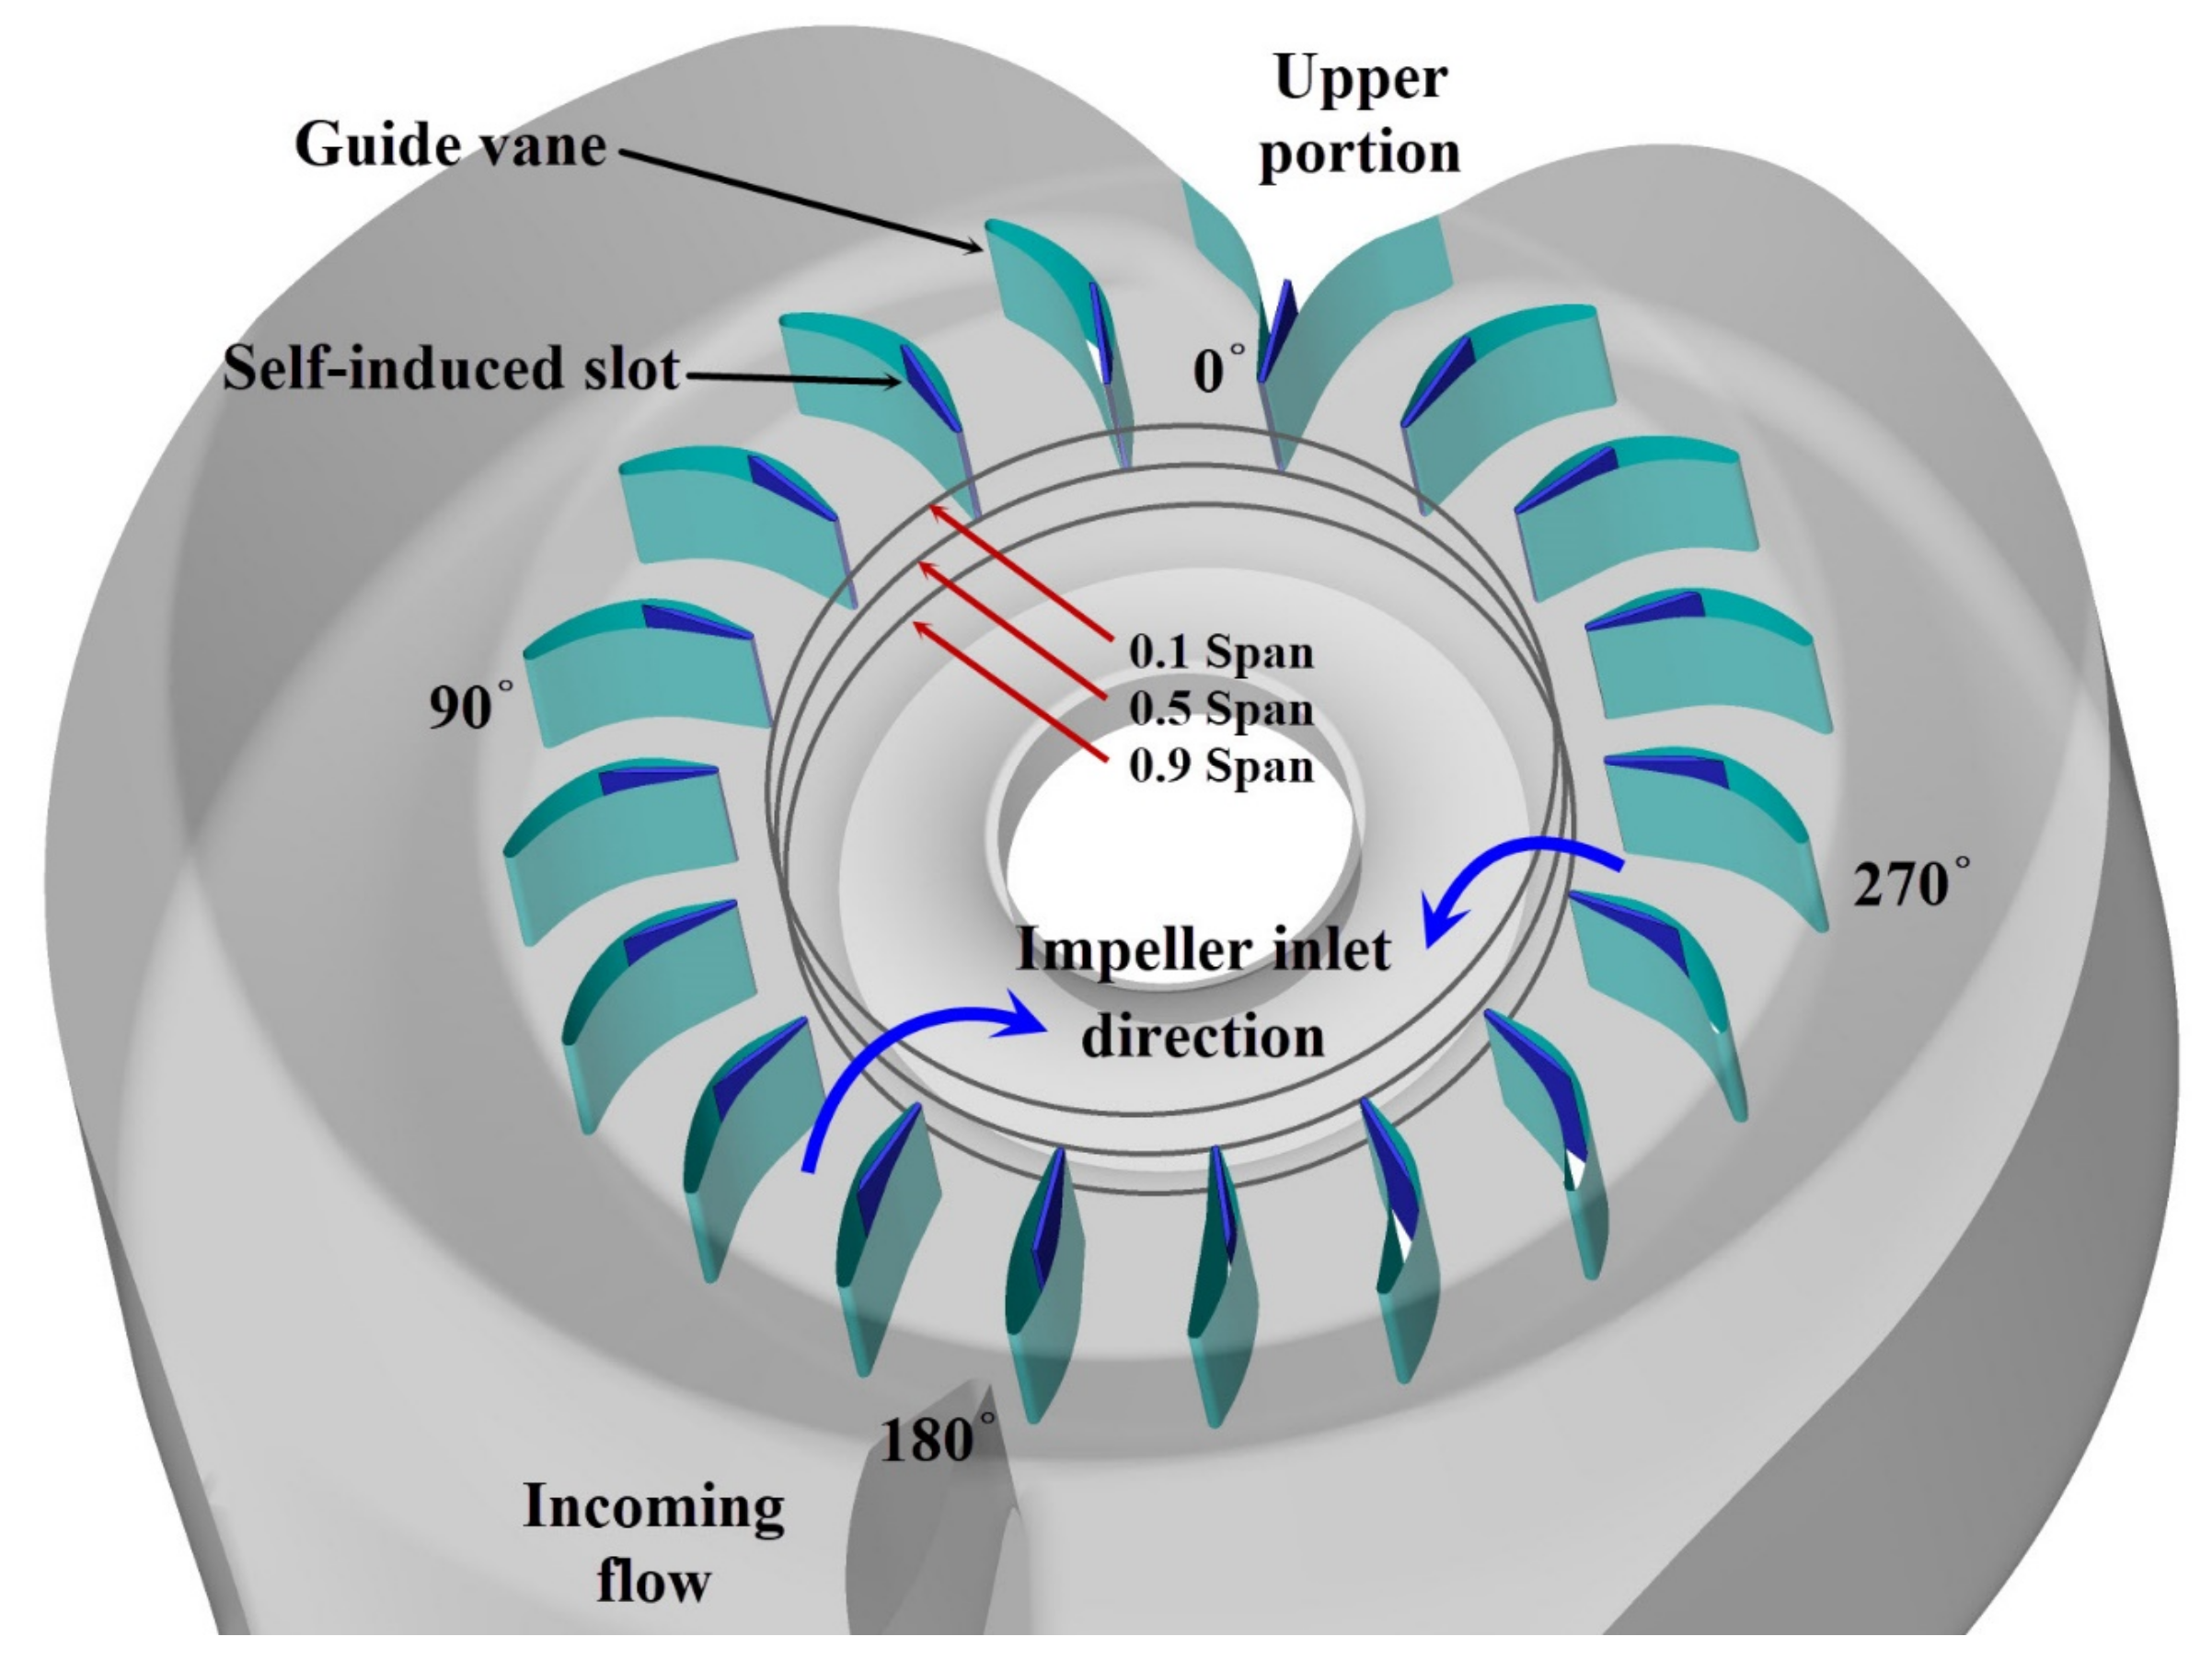
2.3. The Scheme of Self-Induced Slot and Trailing Edge Blowing on Guide Vane

According to the RSI by the guide vane, the previous work added the blowing at the guide vane trailing edge. Differently, this study focused on the self-induced slot at the guide vane trailing edge. Figure 4 depicts the trailing edge blowing and the self-induced slot distribution. In the trailing edge blowing model, due to the flow separation appearing on the suction side of the guide vanes, the exit location of blowing was set near the suction side, see Figure 4a. The self-induced slot was set inside the guide vanes, the length of which was half of the guide vane chord length, and the height was consistent with that of the guide vane. The width of the slot was half of the width of the guide vane trailing edge. The slot was parallel to the guide vane outlet angle.
The difference between the self-induced slot and the trailing edge blowing is that the self-induced slot does not encounter any injection flow from the outside. Therefore, the main fluid flows in and out of the slot at different spans of the guide vanes through the self-induced slot, and this part flow affects the wake’s style and further affects the aerodynamic load on the impeller. In addition, the primary numerical method and boundary condition were consistent for all three models. Meanwhile, the boundary condition at the outlet in the TEB model considered the additional mass flow caused by blowing flow.
To analyze the wake style under the trailing edge blowing and the self-induced slot methods, the wake judgment criterion was according to non-dimensionalized momentum thicknesses θ/d, which are based on the velocity profile [23] and calculated by
θ d = + U U 1 U U d y d
where θ represents the momentum thicknesses, and U and U represent the main flow velocity and the local velocity, respectively. d and y represent the width of the guide vane trailing edge and the guide vane passage, respectively. Once θ/d > 0, it is defined as the weak or pure wake state, which means there is insufficient blowing or no blowing. Once θ/d < 0, it is defined as the jet state, the blowing flow of which is overmuch. The state is defined as the momentumless wake once θ/d ≈ 0, and the blowing properly compensates for the wake deficit.

3. Results and Discussion

In the following section, the radial inlet with UGV, the guide vane with TEB, and the guide vane with SIS were simulated through various running conditions for comparison. The different radial inlets were named the UGV, TEB, and SIS models for the subsequent analysis. The TEB results refer to the momentumless wakes of the guide vane condition from our previous work [31]. The results and detailed analysis of the steady and unsteady simulations, respectively, are discussed. The steady simulation results provide the overall performance of the compressor and the flow details in the radial inlet, which includes the effect of the flow control method. The unsteady simulation results offer the aerodynamic load on the impeller blades, which can reflect the influence of the wake under different radial inlet conditions.

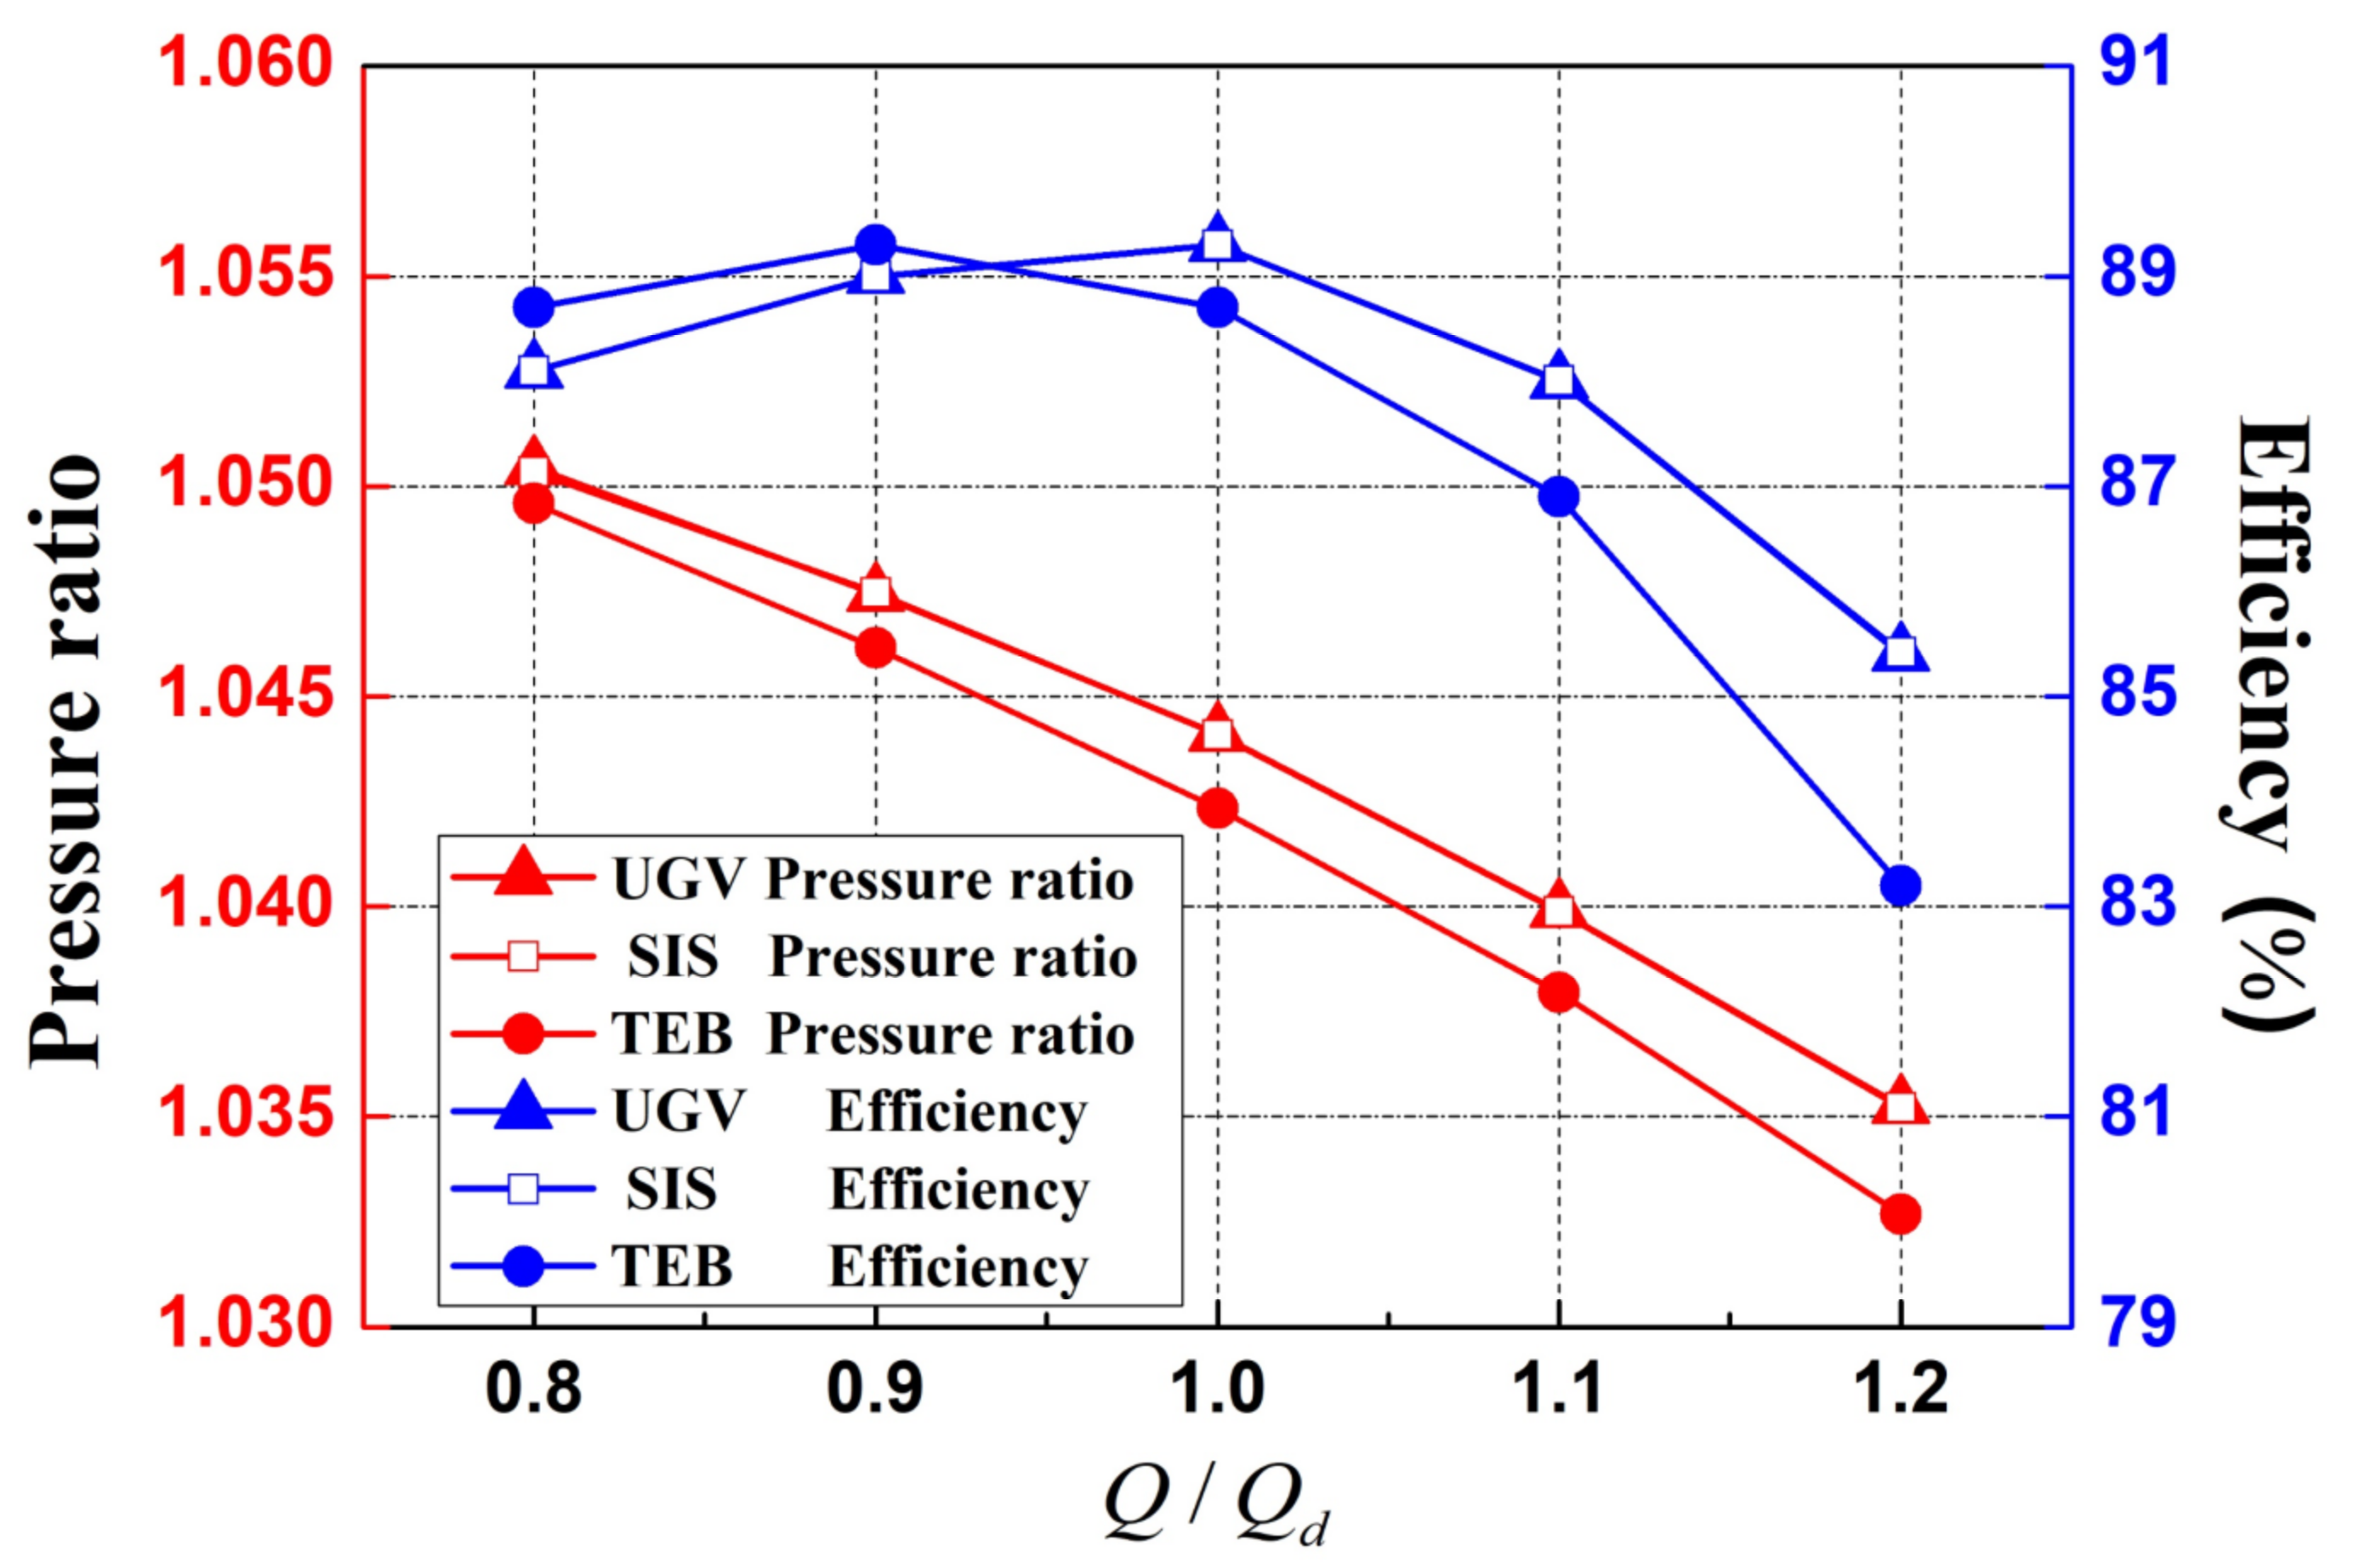
3.1. Analysis of Compressor Performance

Figure 5 gives the comparison of the compressor characteristic performance for three radial inlets through various conditions. The pressure ratio appeared to show a decreasing trend, and efficiency showed an increasing and then decreasing trend when increasing the normalized mass flow. Compared with the UGV model, the TEB model operation conditions changed due to the blowing flow. To acquire the momentumless wake, the total mass flow of the compressor increased by about 3–7%, which led to pressure ratio lines being down moved and the efficiency lines being left moved. Meanwhile, as there was no additional mass flow added by the SIS method, the curves were almost the same as those of UGV, which means that setting the self-induced slot in the guide vane did not influence the compressor performance.

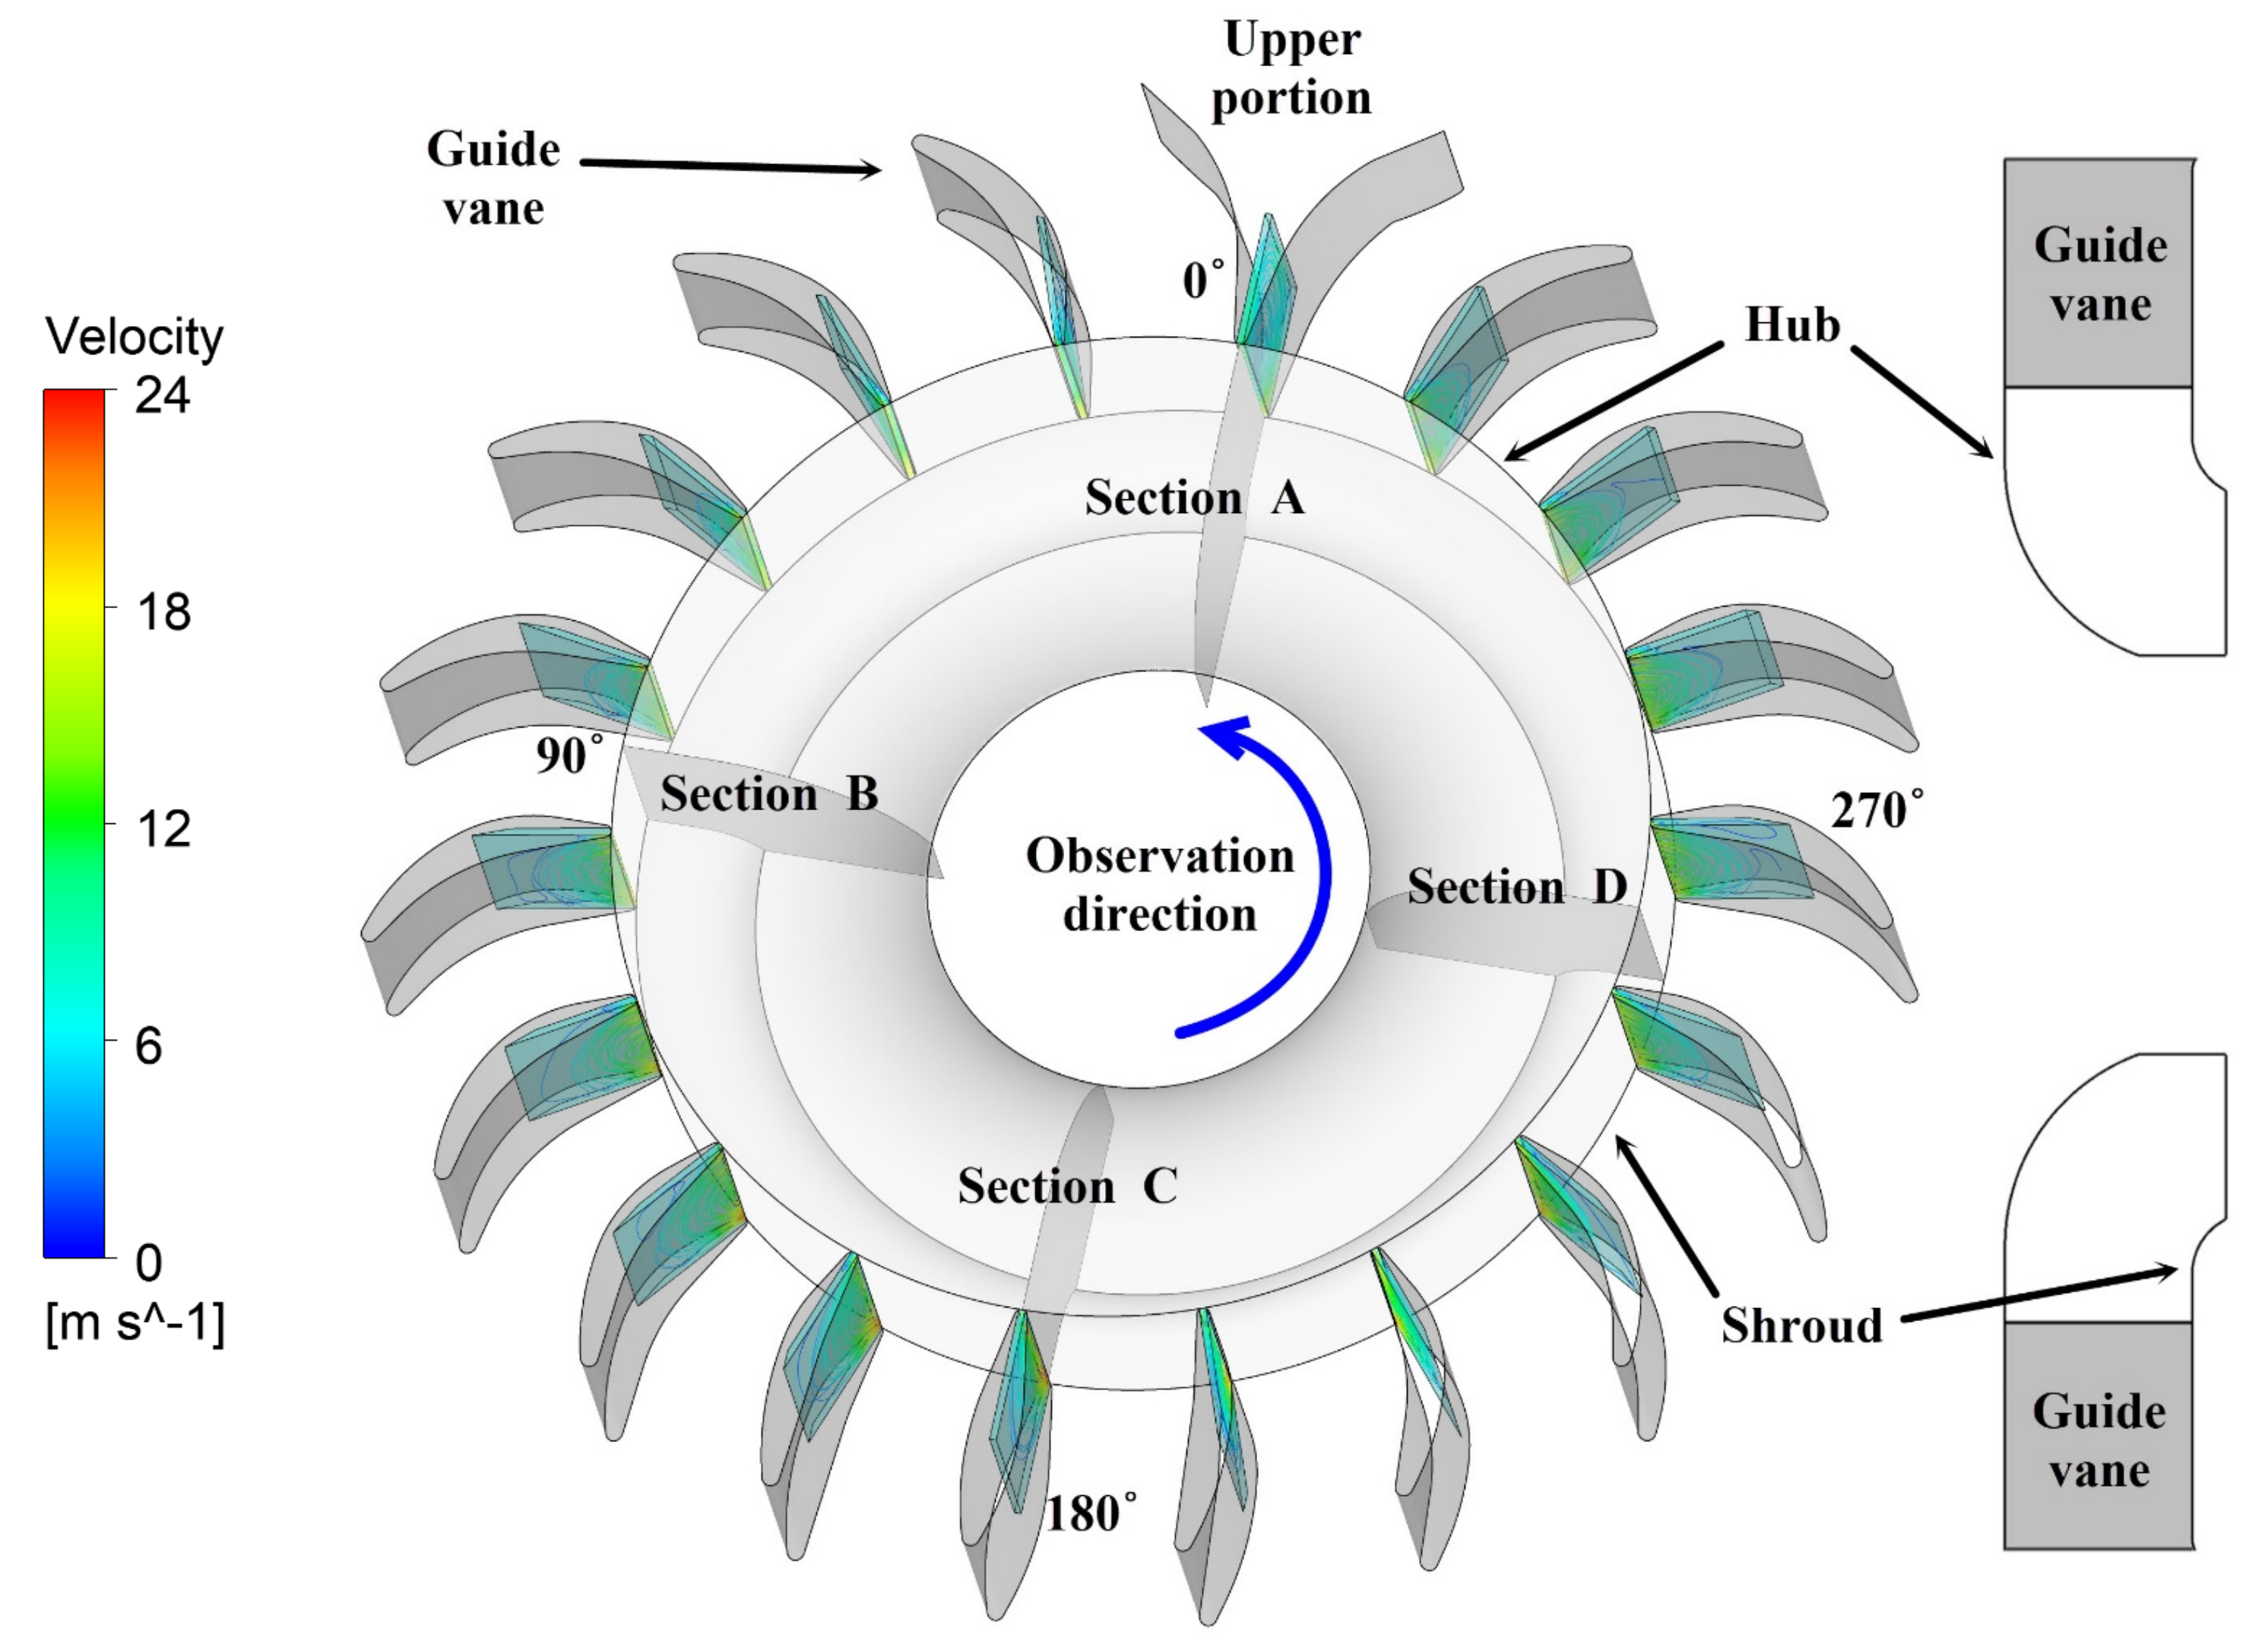
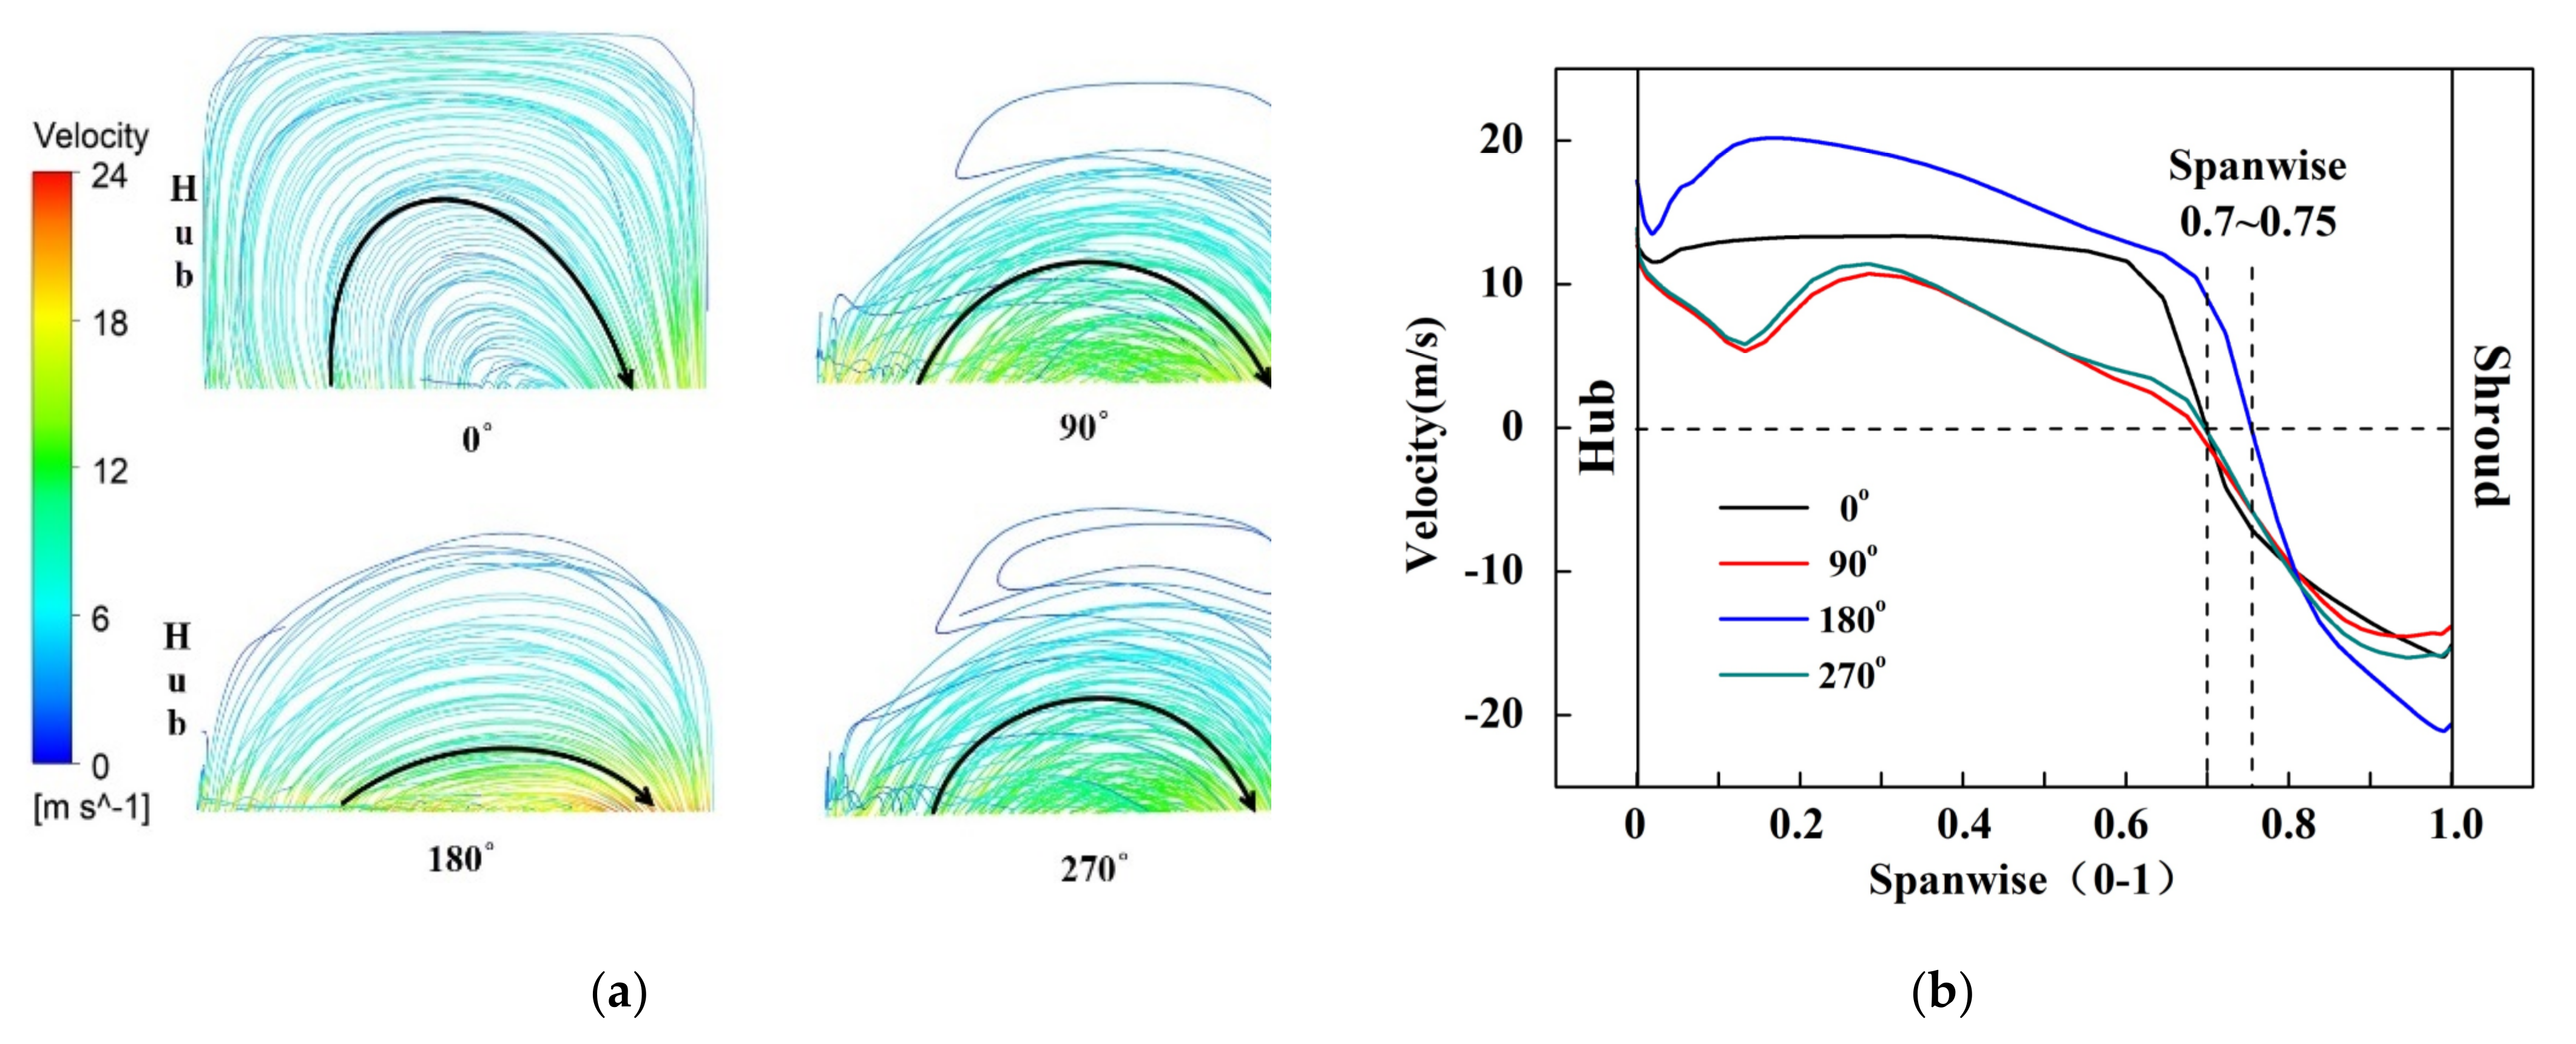
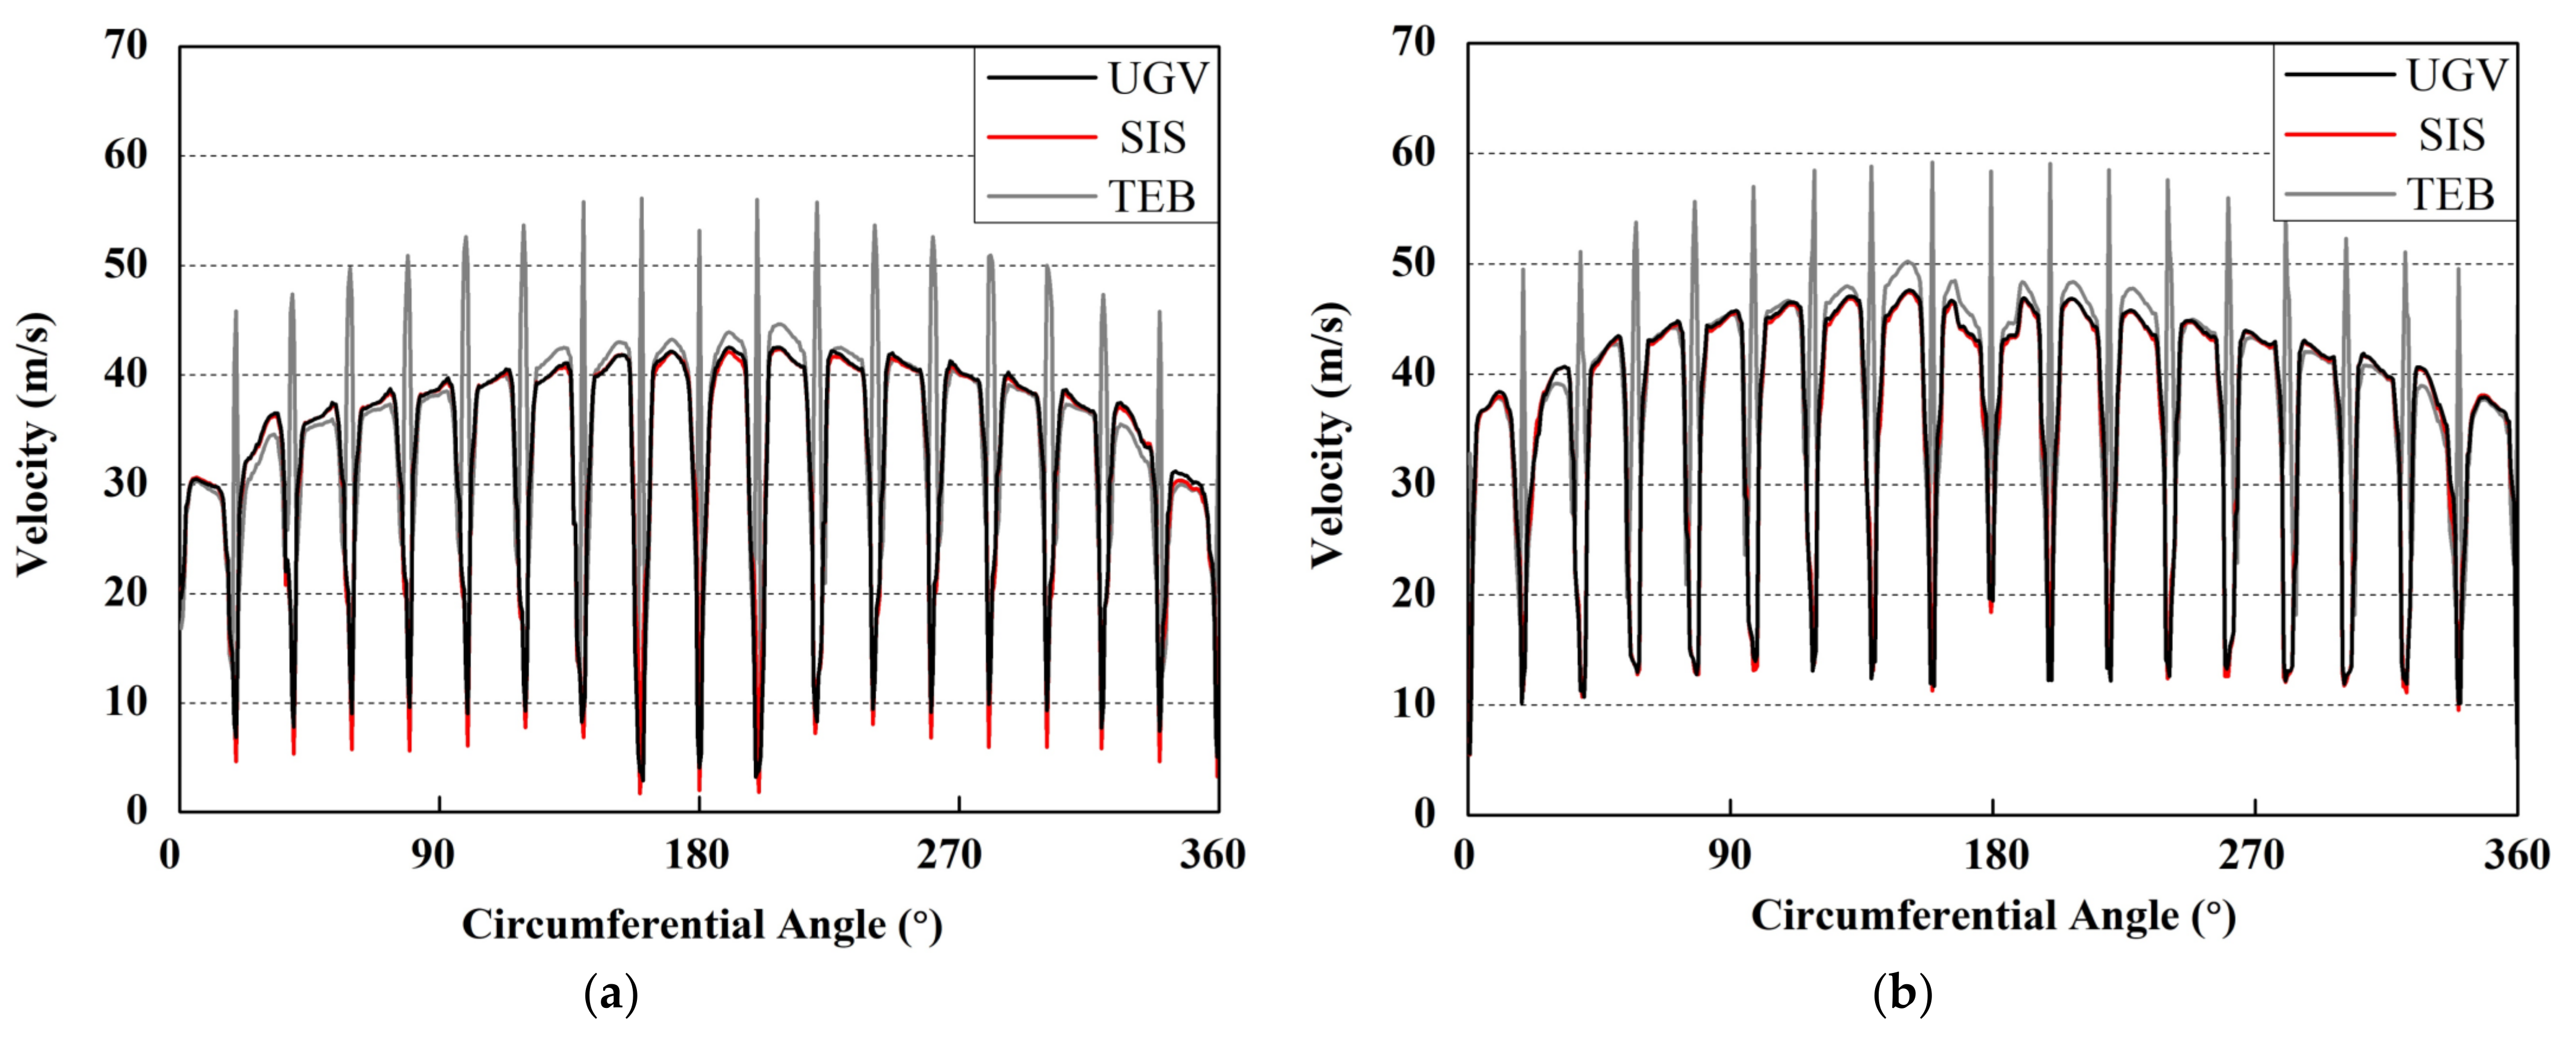
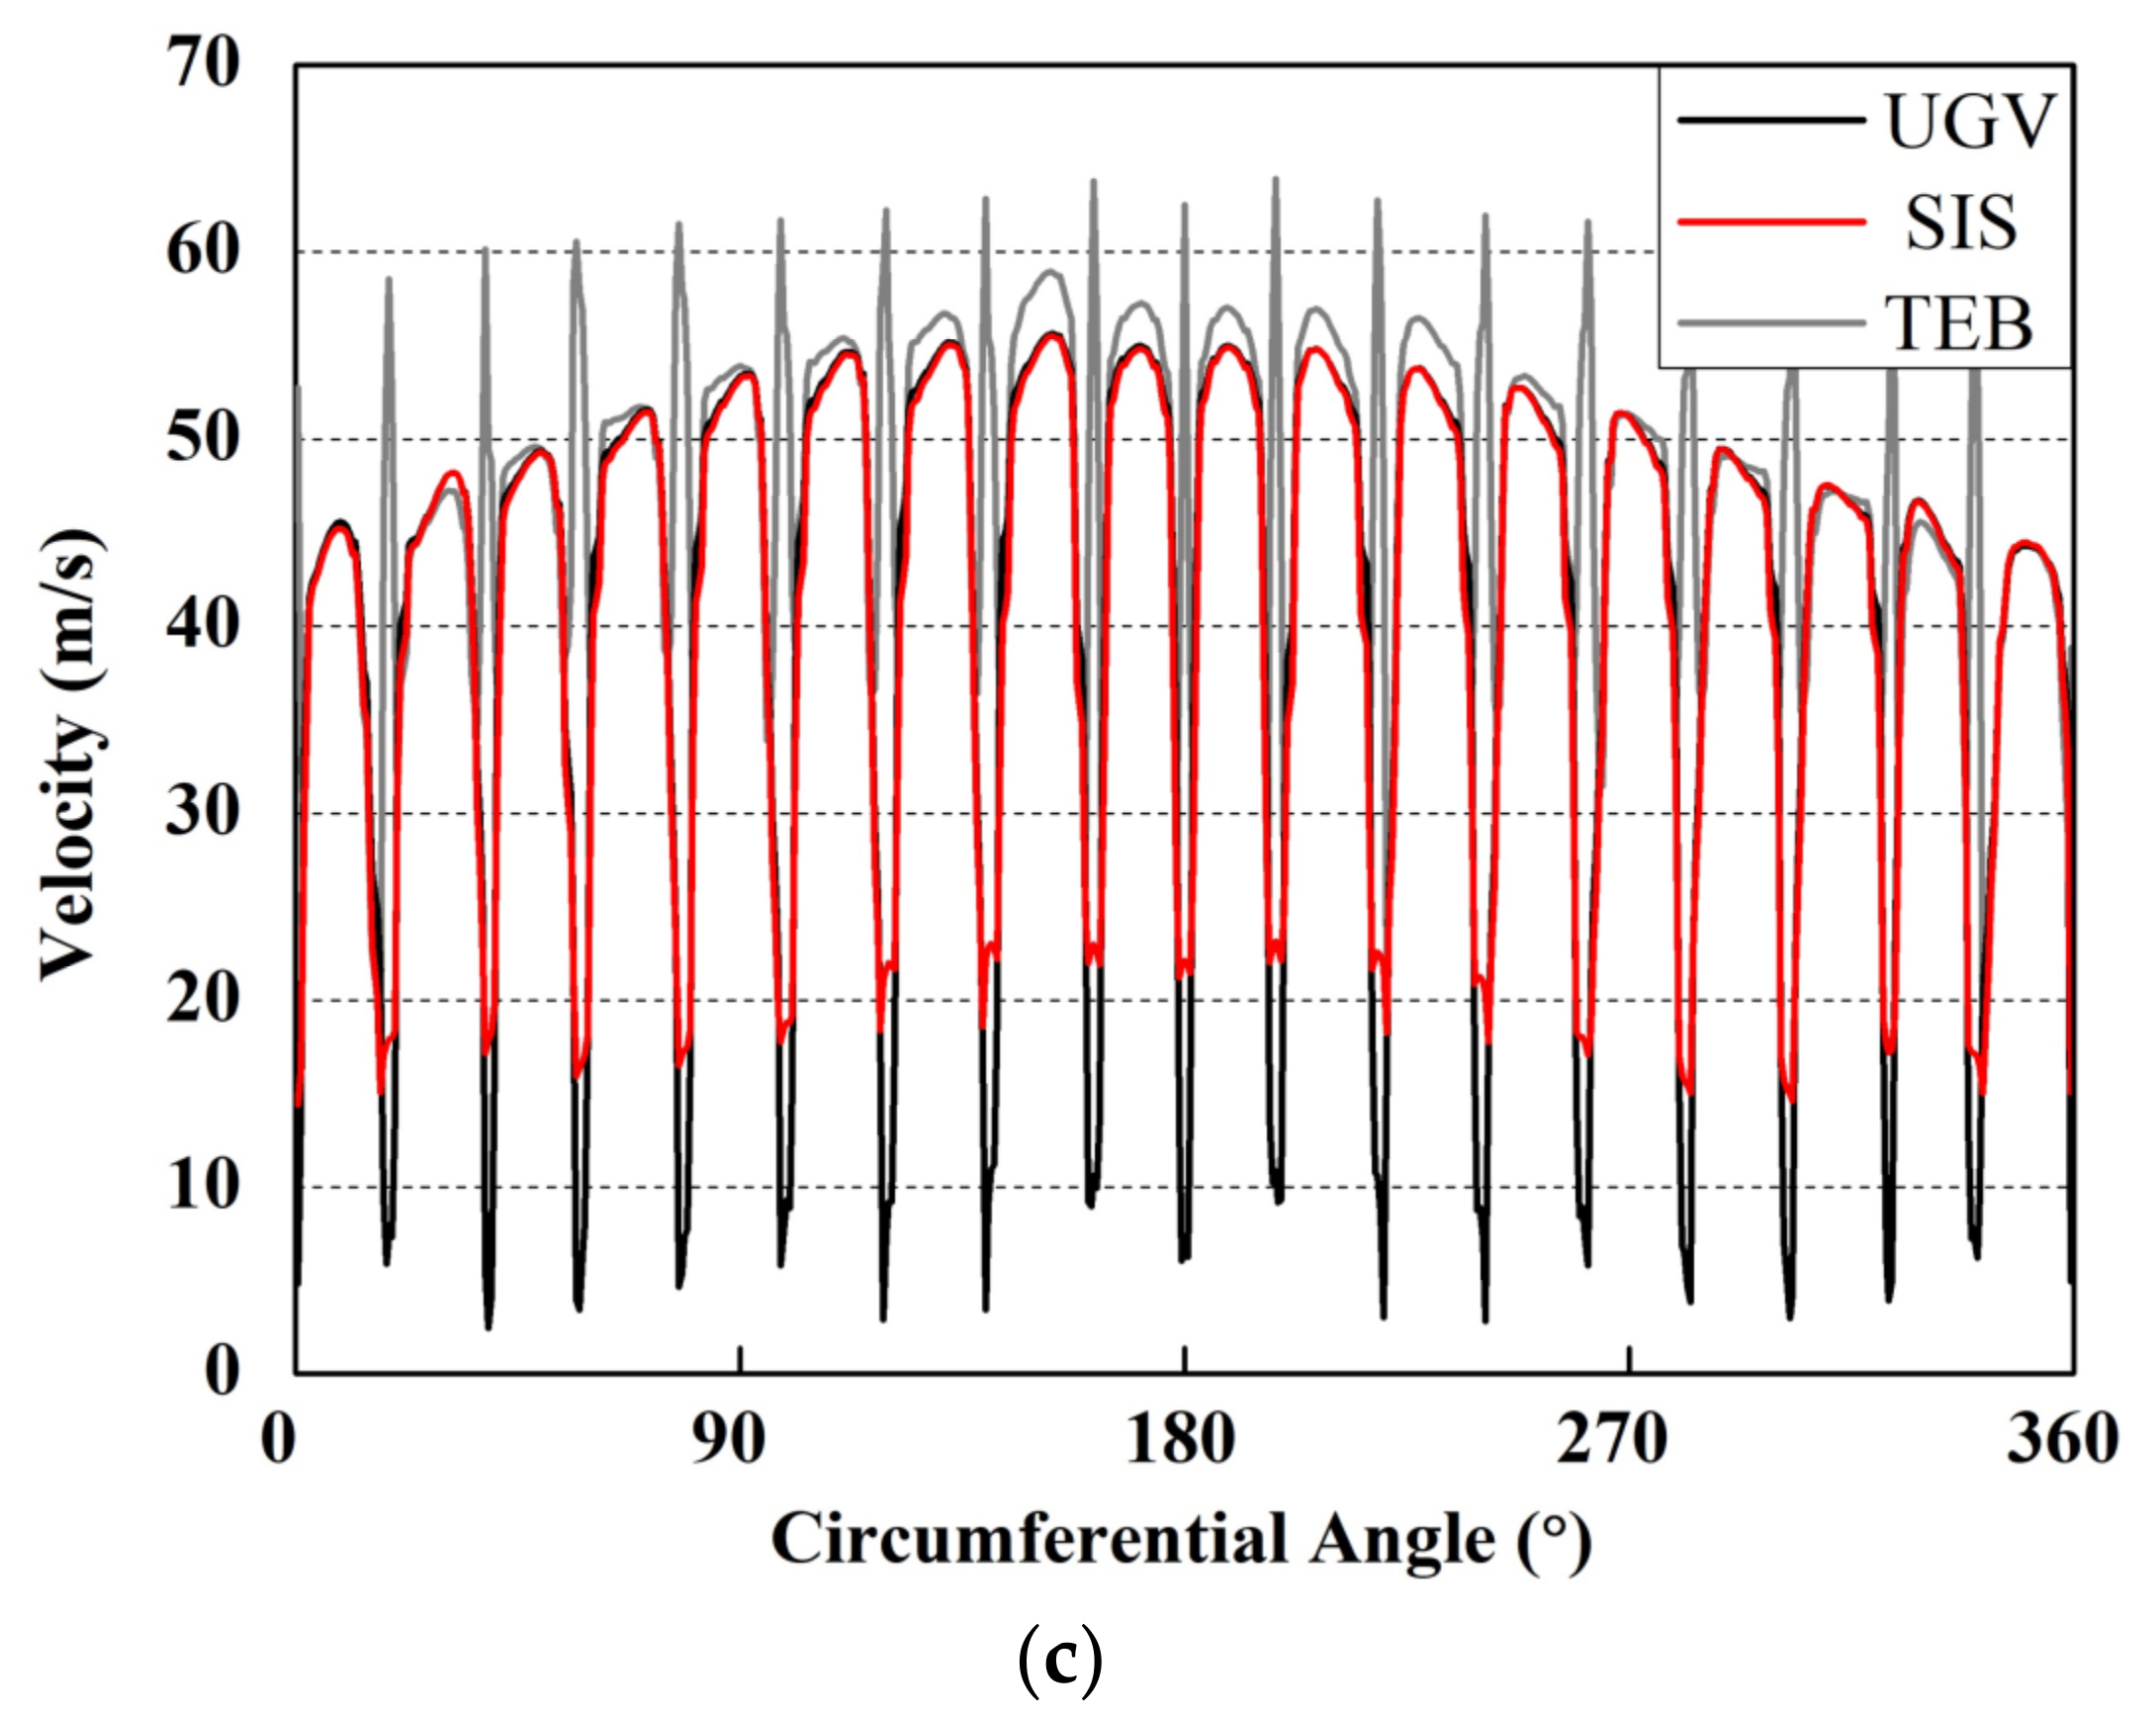
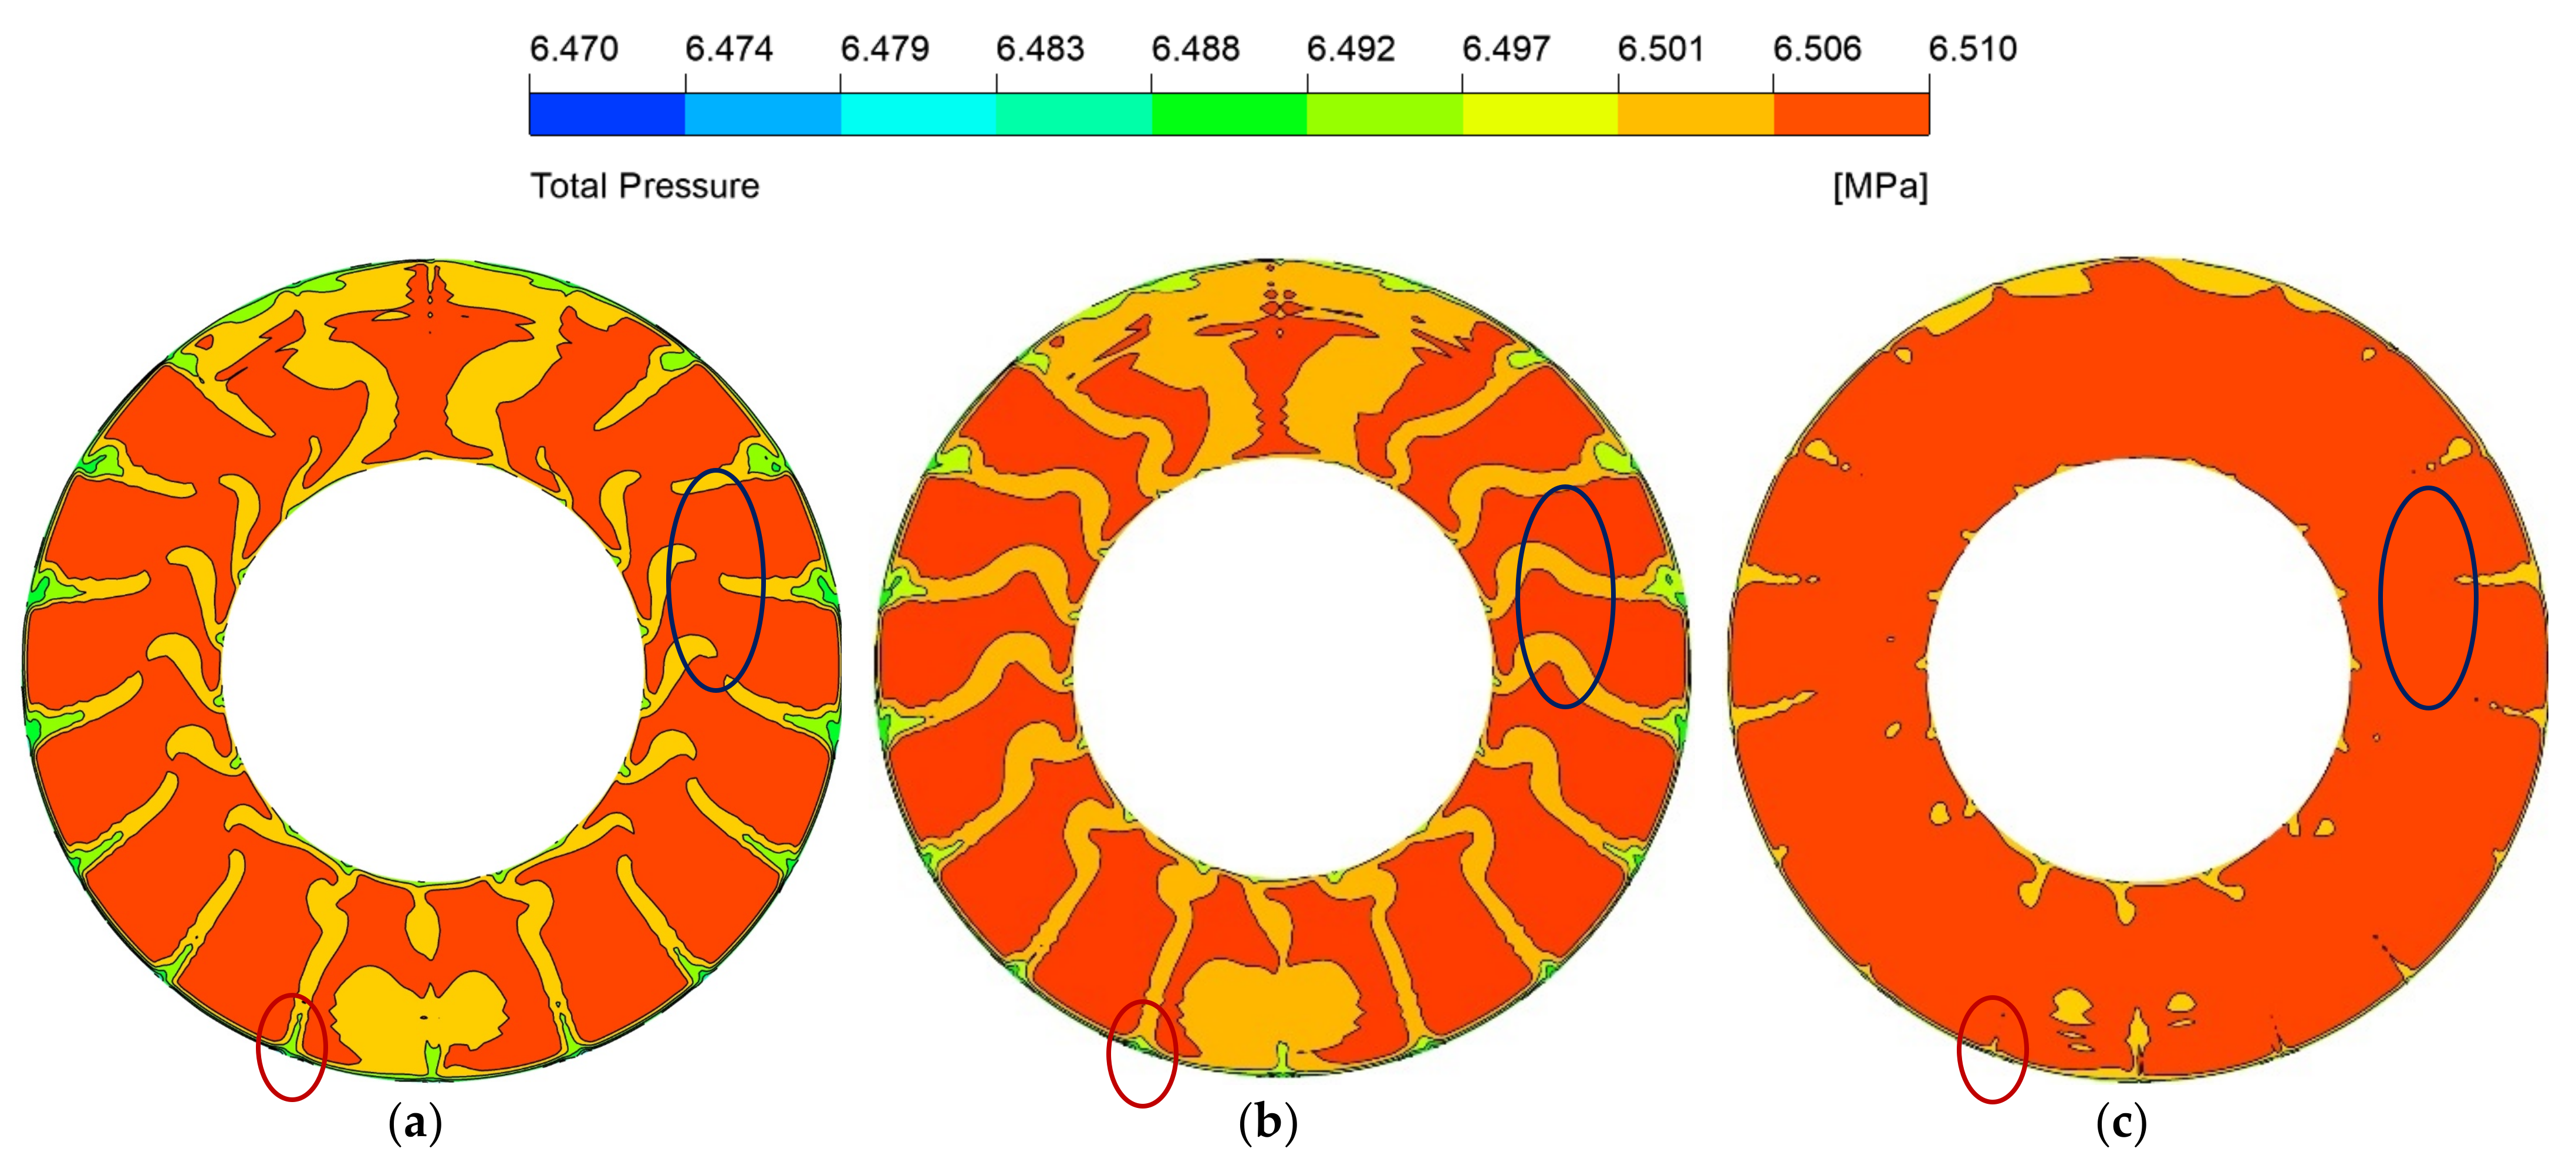
3.2. Analysis of Flow Field in the Radial Inlet

The results of three radial inlets under the design operation condition were used for the subsequent analysis. Among three radial inlets, the distinction of the flow field appeared behind the guide vanes, which was due to the TEB and SIS. To evaluate the effect of the SIS on the flow field and guide vane wake, we selected and depict sections A, B, C, and D in the radial inlet in Figure 6. Taking the impeller as a reference, we defined the left curve as the hub and the right curve as the shroud in the meridian plane. Figure 6 also illustrates the streamline in the self-induced slot. It was observed that there was a semicircle flow performance in each self-induced slot.
Figure 7 shows the streamline in the self-induced slots and the velocity distribution at the slot’s outlet under different angles in the SIS model. Particularly, Figure 7 reveals that the streamline in slots under different angles showed a similar flow phenomenon since the self-induced slots were set at the trailing edge of the guide vane, and the flow passed through the interface between the slot and main flow. Near the hub region, the flow akin to the semicircle flow moved into the slot, turned the flow direction, and finally flowed out of the slot near the shroud region. However, the detail of the streamline in each self-induced slot showed a slight difference. Figure 7b depicts the velocity distribution at the interface between the self-induced slot and the main flow. The ordinate represents the velocity, with the positive value meaning that the fluid flowed into the slot, and the negative value meaning that the fluid flowed out of the slot. As we can see, from 0 spanwise to 0.7 spanwise, the flow mainly flowed into the slot. Contrarily, from the 0.7 spanwise to 1 spanwise, the flow mainly flowed out of the slot. Moreover, the fluid flowing into the slot at 180° was nearly up to 0.75 spanwise. A higher number means there is a more significant amount of fluid flowing into and out of the slot. Therefore, it is necessary to investigate the reason for the flow phenomenon in the self-induced slot.
Figure 8 illustrates the pressure contour at different sections shown in Figure 6 and shows the pressure distribution at the inlet of different sections. It is well-known that the radial inlet is used to turn the flow direction. Therefore, the profile lines of the radial inlet contain the concave and convex arcs. The hub refers to the concave, and the shroud refers to the convex. Figure 8a illustrates that the flow pressure increases at the concave but decreases at the convex, which means that the radial inlet profile lines result in higher pressure near the hub and lower pressure near the shroud. As shown in Figure 8b, the pressure was the highest in section A, and the pressure was the lowest in section C. Moreover, there was a slight difference between sections B and D. Furthermore, section C showed the maximum difference value compared with the others. The pressure difference led to the flow phenomenon in the self-induced slot. The high pressure near the hub made the flow move into the slot, and the lower pressure near the shroud made the flow move out of the slot, as shown in Figure 8. Therefore, the higher pressure difference at section C raised the higher velocity at 180° in Figure 7b.
Employing the self-induced slot, the flow phenomenon in the radial inlet changed. Figure 9 shows the locations of monitor lines to obtain the guide vane wake distribution. At different spans of the guide vane (0.1 span, 0.5 span, and 0.9 span), the monitor lines were set behind the guide vanes, and the distance between the lines and the guide vane trailing edge was about 1/4 of the guide vane chord length.
Figure 10 shows the velocity distribution at the monitor lines for different radial inlets. It was observed that there were 18 low-velocity regions corresponding to 18 guide vanes along the circumference direction in the radial inlet, i.e., guide vane’s wake. In the SIS model, the self-induced slot made the flow move into the slot near the hub region and move out of the slot near the shroud region in the radial inlet. The hub and shroud correspond to the 0.1 and 0.9 spans, respectively. Figure 10a shows the wake velocity of the guide vanes at 0.1 span. The SIS model showed a lower velocity at the wake than the UGV model, which was about 2 m/s to 3 m/s. It means the self-induced slot enhanced the wake intensity near the hub region. As for the streamline in the slot, there was no apparent influence at the middle span. Therefore, the wake velocity of the guide vanes in SIS and UGV were almost the same, as shown in Figure 10b. Contrarily, the wake velocity in the SIS model was higher than that in the UGV model at 0.9 span, which was about 10 m/s in Figure 10c. Since the flow moved out of the slot, it compensated for the wake deficit, similar to the trailing edge blowing. It indicated that the self-induced slot weakened the wake intensity near the shroud region.
According to the judgment criterion of wake, Table 5 reports the non-dimensionalized momentum thickness θ/d distribution in different radial inlets. The velocity of the guide vane’s wake corresponds to θ/d ≈ 0 in the TEB model and θ/d > 0 in the UGV model. Compared with the UGV model, the θ/d in the SIS model was more significant at 0.1 span, and it became more minor at 0.9 span. Compared with the TEB model, wherein the blowing velocity at 0.9 span was about 60 m/s, the velocity in the SIS model was about 20 m/s. Compared with the TEB model, although the self-induced slot method could not improve the wake style to the momentumless wake style, it changed the wake style from the pure wake to the weak wake near the shroud region. However, the price of the self-induced slot method enhanced the wake intensity near the hub region. The changed wake style further affected the downstream flow field.
Figure 11 shows the total pressure comparison of radial inlets at cross-section 1-1, i.e., the outlet of the radial inlet and inlet of the impeller, see Figure 1a. When the flow passed through the guide vane, it flowed from the radial direction to the axial direction. In the UGV model, there were 18 low total pressure regions at cross section 1-1 due to the guide vane wake. See Figure 11a. The difference between the UGV and SIS models around the shroud in the guide vane wake region was that the region of the low total pressure in the SIS model was reduced, particularly in the red circle region, as shown in Figure 11b. However, the SIS model showed lower total pressure near the hub, particularly in the blue circle region in Figure 11b. The total pressure distribution was due to the flow phenomenon in the self-induced slot, which reduced the wake intensity near the shroud and increased the wake intensity near the hub. Because of the extra blowing flow, the wake region almost disappeared in the TEB model, see Figure 11c. Compared with the TEB model, the wake region in the SIS model was more significant, which means that the SIS method could not reach the momentumless wake style as per the TEB method. The TEB and SIS models changed the wake style of the guide vane in the radial inlet, and it could change the aerodynamic load distribution on the impeller, which affects the safety of the compressor.

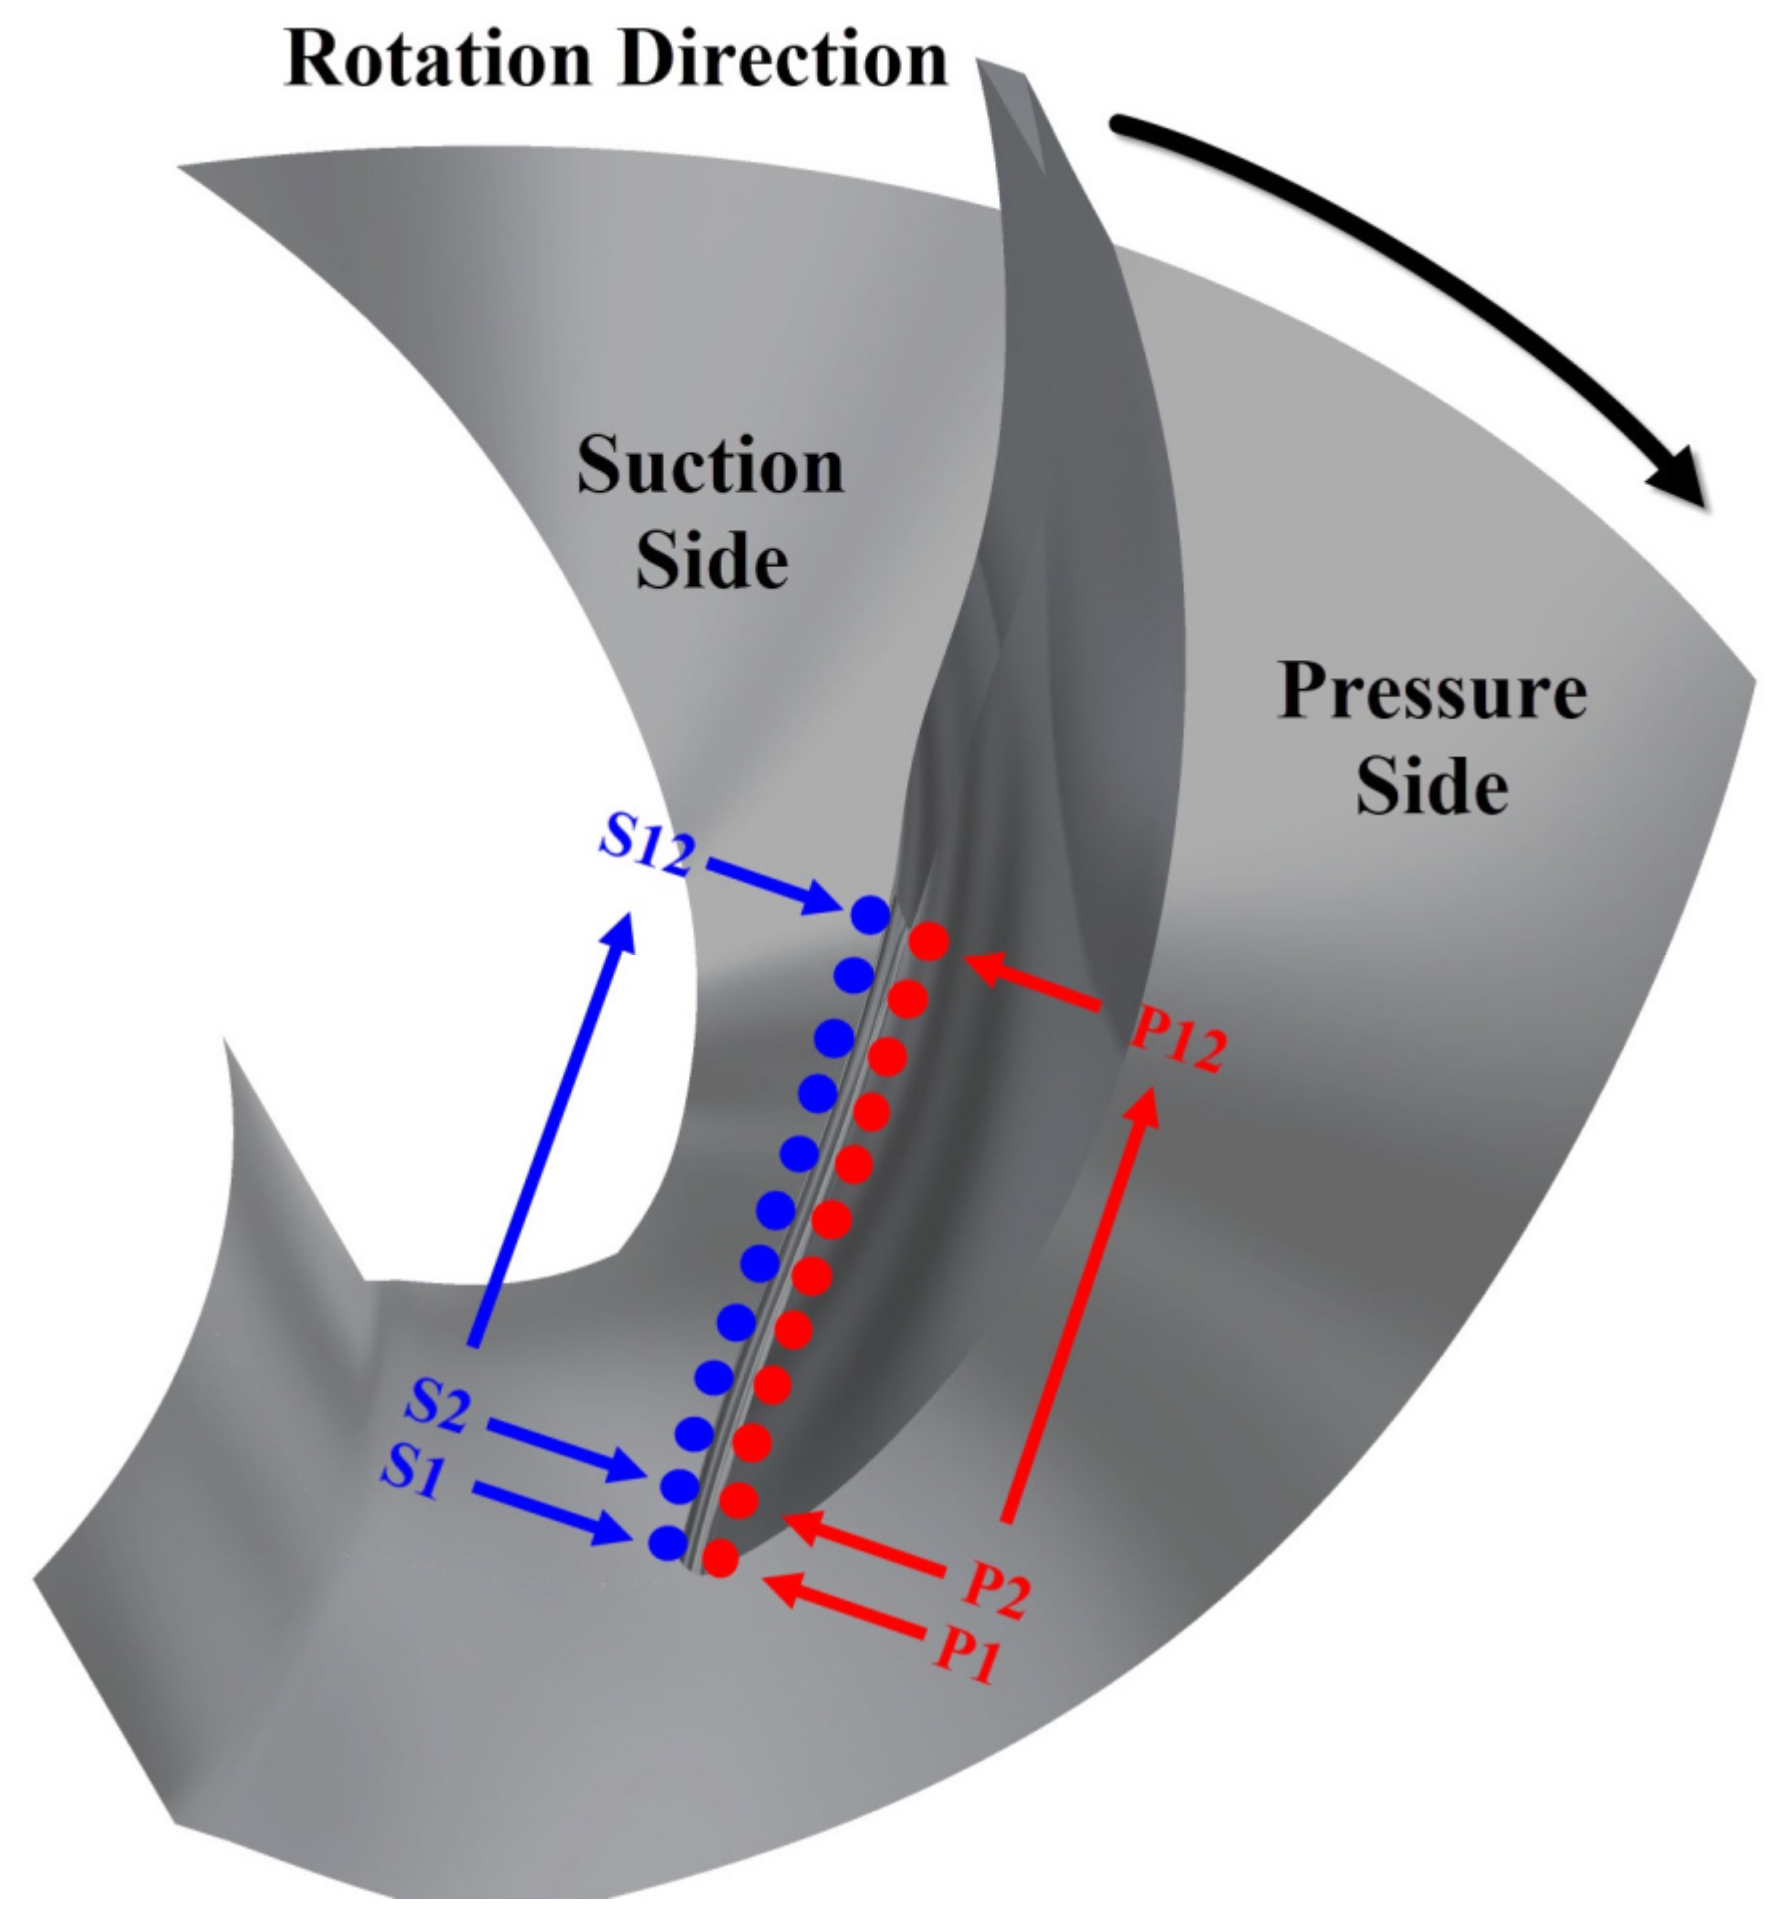
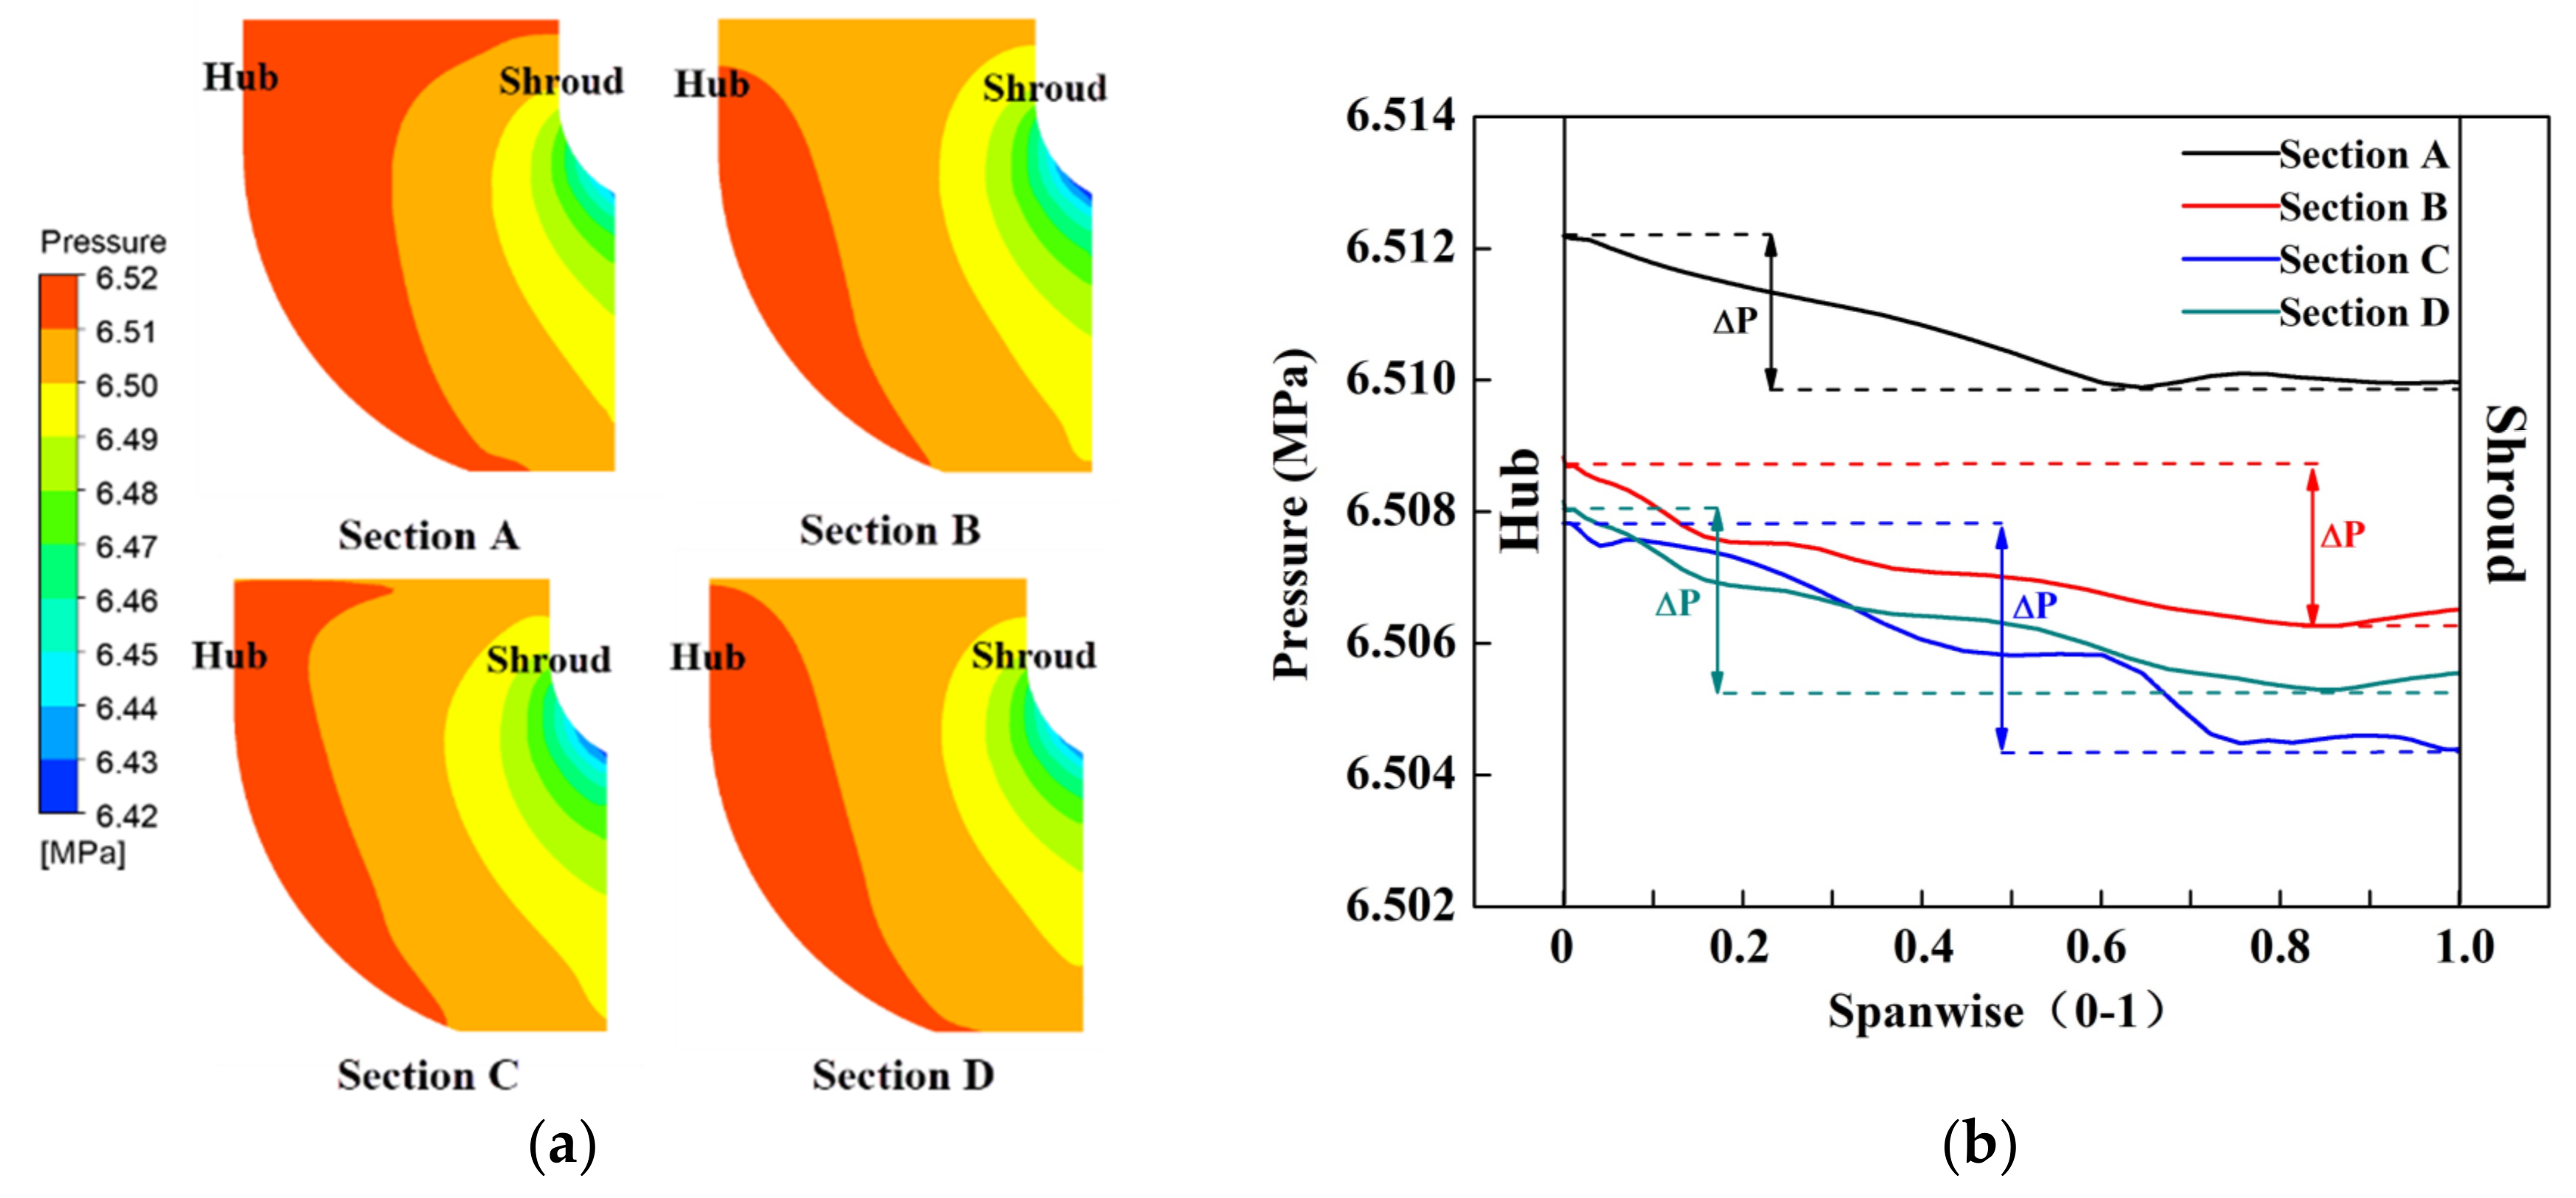
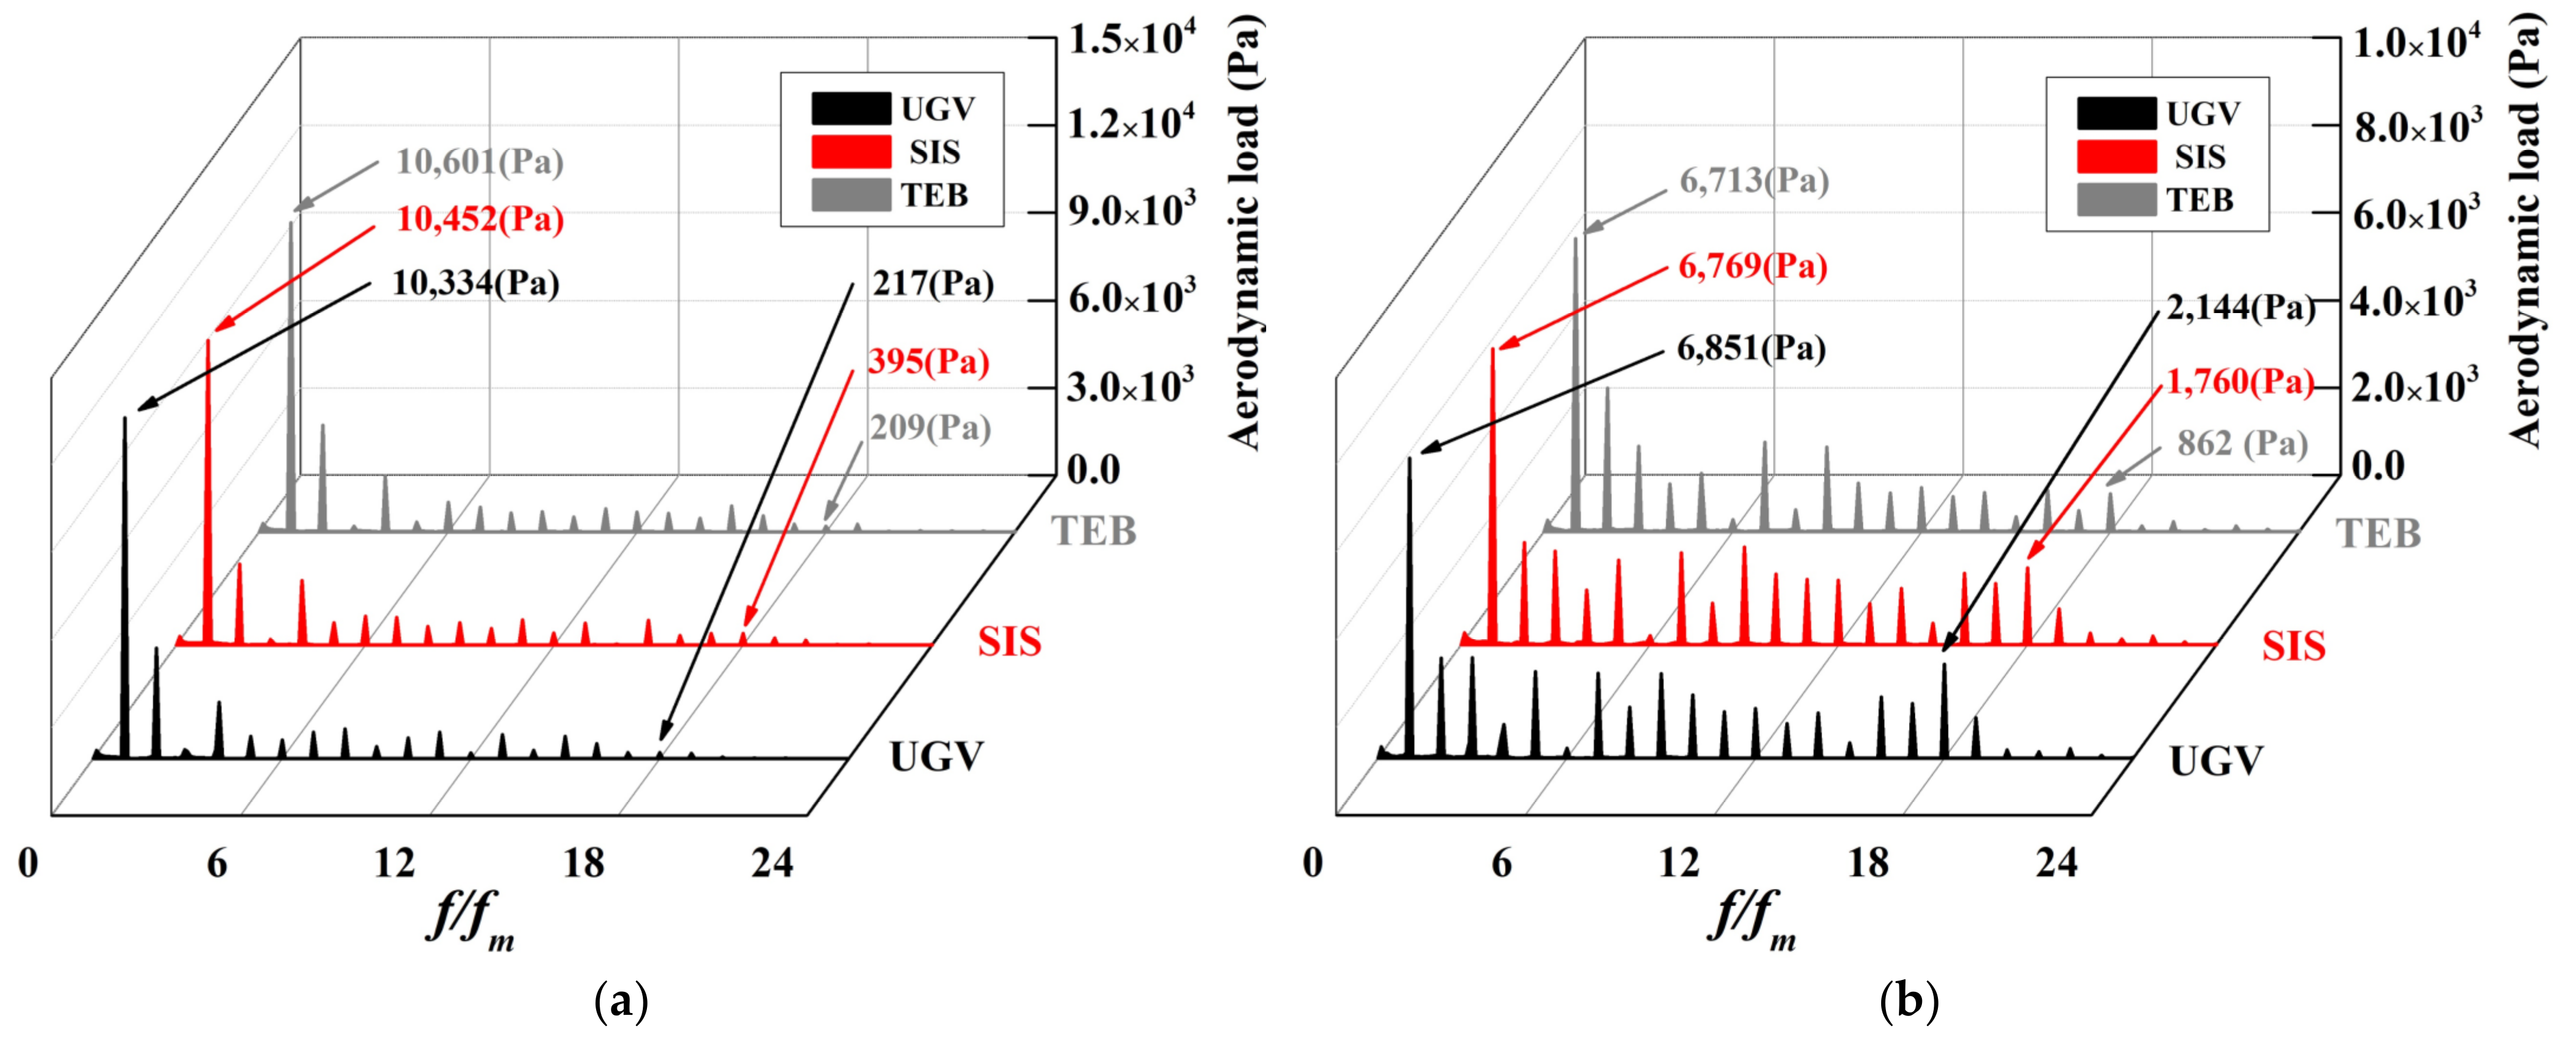
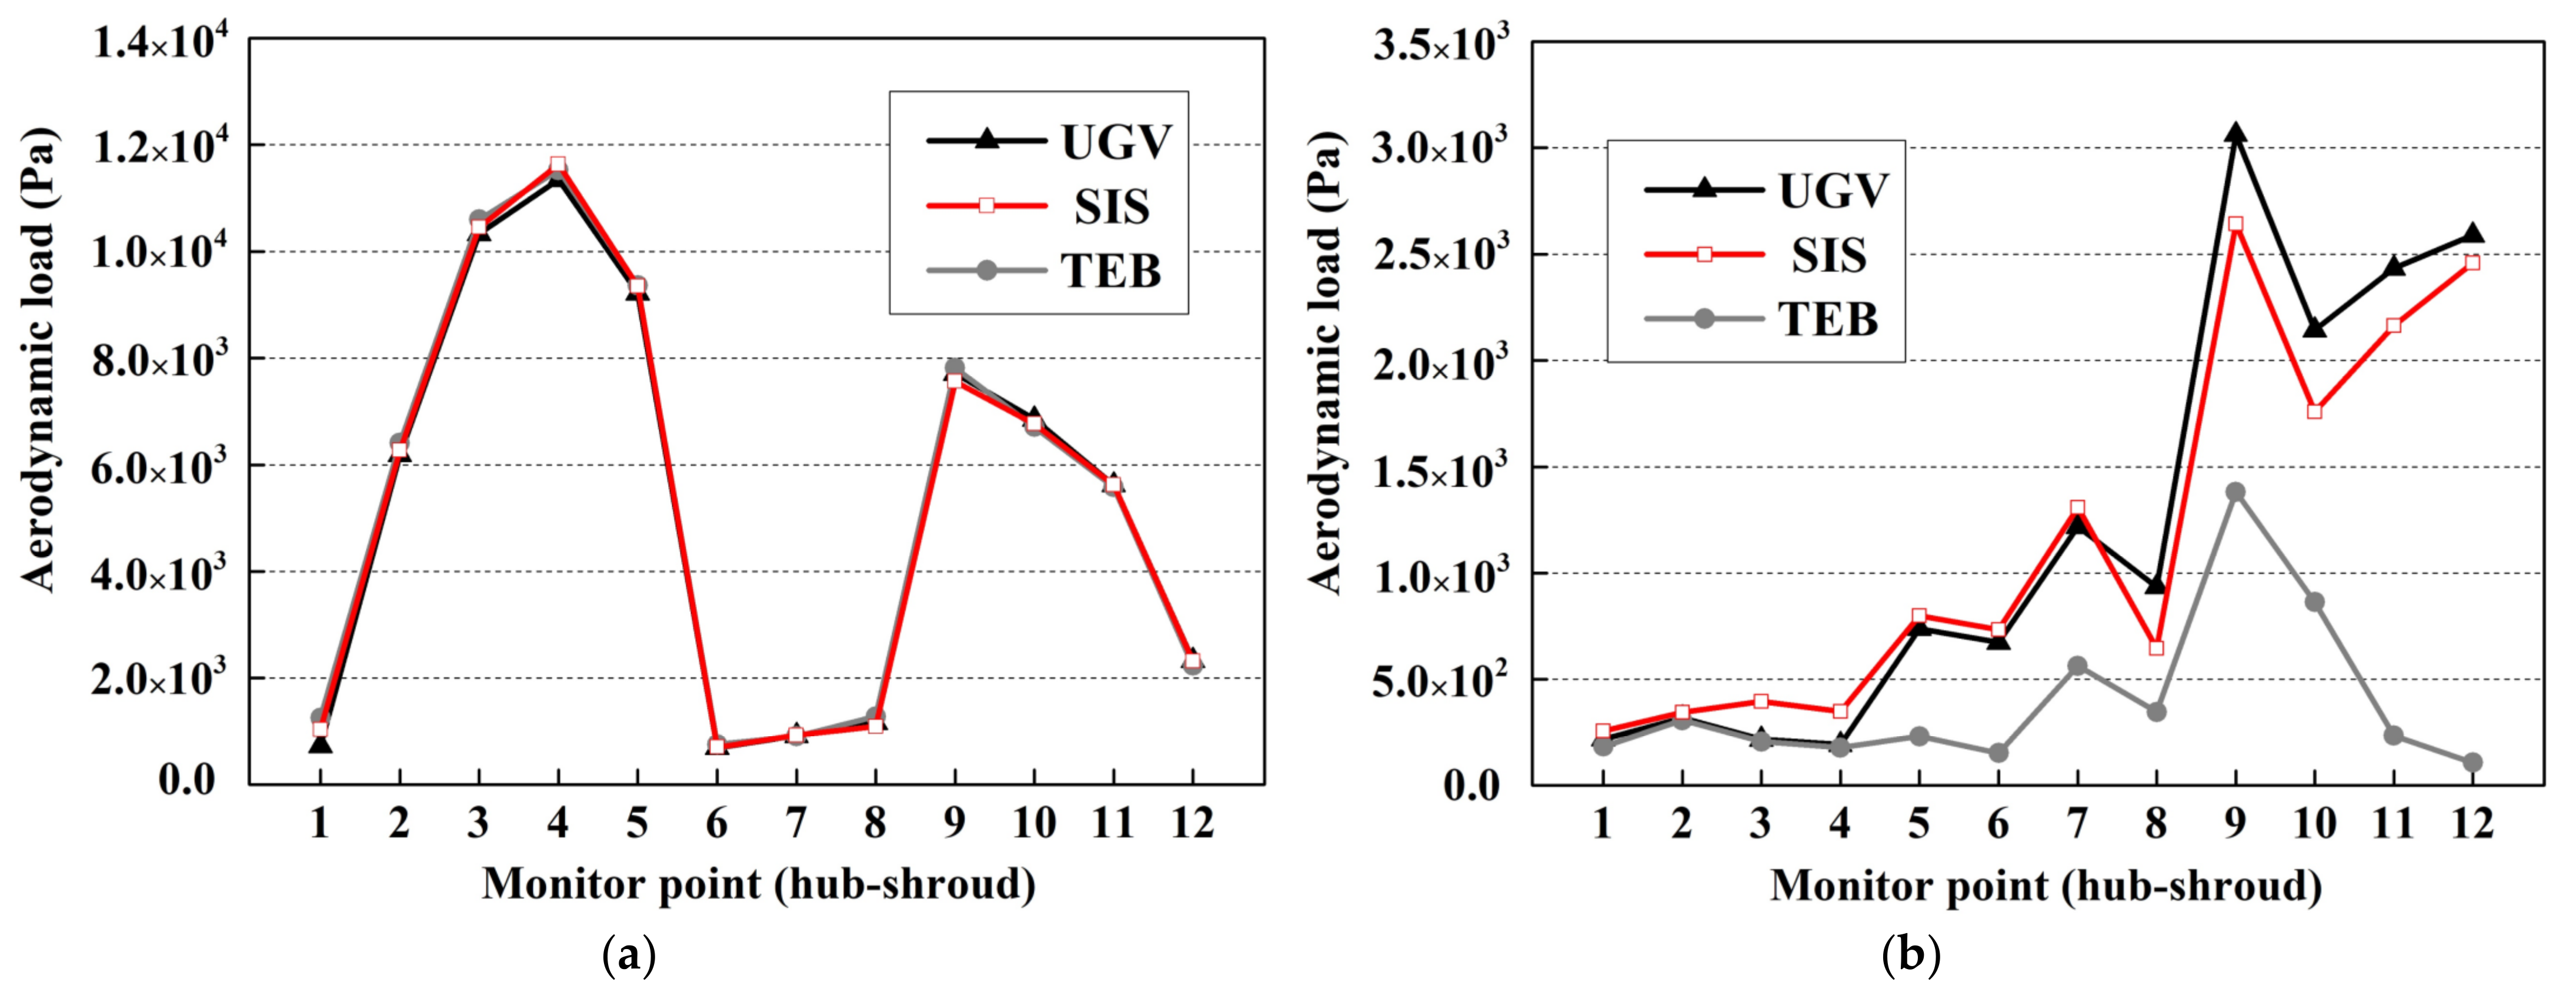
3.3. Analysis of the Aerodynamic Load on the Impeller

The aerodynamic load refers to the differential pressure with the time between the adjacent monitors between the pressure and suction sides of the impeller. The pressure fluctuation for each monitor point was obtained by the unsteady simulation, i.e., the time domains of the aerodynamic load. Then, the frequency domains of aerodynamic load were obtained through the FFT. In this hydrogen compressor, the machine rotating and the impeller passing frequencies should be the dominant frequencies of the aerodynamic load at the impeller’s leading edge. The wake of 18 guide vanes excited the impeller passing frequency due to the RSI. Table 6 shows the value of the dominant frequencies in this compressor. The parameters fi and fm represent the impeller passing and the machine rotating frequencies, respectively.
Figure 12a,b illustrate the comparison of the time history oscillations of different radial inlet models near the hub and the shroud regions of the aerodynamic load, respectively. Figure 12a refers to the differential pressure value between the P3 and S3 points, and Figure 12b refers to the differential pressure value between the P10 and S10 points.
The time history oscillations of the aerodynamic load at different spans showed periodicity and stability in all models. Due to RSI caused by the guide vane’s wake, 18 small fluctuations in each revolution were raised, which agrees with the count of guide vanes. Meanwhile, the fluctuation intensity reflects the wake intensity, and the fluctuation intensity near the shroud region was more vigorous compared with the hub region. Considering the radial inlet structure, the streamwise distance was different between the guide vane and the impeller from the hub to the shroud. Compared with the hub region, the streamwise distance between the impeller leading edge and the guide vane trailing edge in the shroud region was shorter. This means the shroud region was influenced by the wake of the guide vane more evidently. The TEB model showed weak fluctuation intensity in both the hub and shroud regions due to the blowing flow in comparison with the UGV model. Meanwhile, the SIS model showed more vigorous fluctuation intensity in the hub region and weak fluctuation intensity in the shroud region than that of the UGV model, which was due to the flow phenomenon in the self-induced slot. After that, through the FFT, the frequency harmonic comparison of the aerodynamic load in different radial inlet models was performed and is depicted in Figure 13.
As shown in Figure 13, the machine rotating frequency fm was the dominant frequency at the leading edge of the impeller. Meanwhile, there were many harmonic excitations with the values of f/fm varying from 2 to 22. The TEB and SIS models slightly impacted the amplitude at fm in contrast to the UGV model. Moreover, compared with the hub region, the amplitude at fi was higher in the shroud region, and it reflects that the guide vane’s wake had a more noticeable effect in the shroud region because of the different streamwise distances. Because of the blowing flow, the TEB model showed lower amplitude at fi in contrast to the UGV model, particularly in the shroud region, wherein the decrease in the amplitude was up to 60%. The SIS model showed lower amplitude in the shroud region in contrast to the UGV model, wherein the amplitude decrease was about 18%. The flow phenomenon in the self-induced slot improved the wake style from the pure wake to the weak wake, although it could not compensate for the wake deficit enough as with the trailing edge blowing method. Furthermore, it reduced the wake intensity with the advantage of not requiring energy from the outside. However, the SIS model showed higher amplitude in the hub region, which was the price for reducing the amplitude at fi in the shroud region.
From hub to shroud, Figure 14 shows the comparison of the aerodynamic load distribution of the amplitude at the leading edge of the impeller at fm and fi, respectively. As shown in Figure 14a, the amplitude distribution at fi had little difference in three radial inlets, reflecting that the trailing edge blowing and the self-induced slot methods had no or little effect on the uniform flow field along the circumference direction. Moreover, as shown in Figure 14b, from hub to shroud, the amplitude at fi showed an increasing trend in the UGV model. In the TEB model, because of the trailing edge blowing, the amplitude was lower compared with that of the UGV model. In the SIS model, the flow phenomenon in the self-induced slot changed the amplitude distribution. On the one hand, the self-induced slot decreased the amplitude near the shroud region, with an average reduction in the amplitude of about 15% compared with the UGV model, indicating a positive effect on impeller safety. On the other hand, the self-induced slot increased the amplitude near the hub region compared with the UGV model, which is a negative effect. As the active control method needs extra power, the passive control method needs to sacrifice the performance, and the price in the SIS model was an increase in the amplitude at fi near the hub region. Relatively, the amplitude at fi was higher near the shroud region, which is more of a threat to the impeller safety. The wake of the guide vane had little influence on the impeller hub region in this compressor. Therefore, decreasing the amplitude near the shroud region was more meaningful, and appropriately increasing the amplitude near the hub region was acceptable.

4. Conclusions

Based on the hydrogen compressor, this paper analyzed the characteristic performance, the flow field, and the aerodynamic load on the impeller of three models (UGV, TEB, and SIS). The SIS methods could provide a new idea for designers to deal with a comparable problem in the compressor. Based on the simulation results and analysis, some conclusions are summarized.
  • The wake of the guide vane excited the aerodynamic load at fi, threatening the impeller’s safety. The self-induced slot method was a way to improve the dire situation.
    The SIS method did not influence the characteristic line of the compressor and was the same as the UGV model.
  • The SIS method changed the wake style behind the guide vane in the radial inlet. Due to the differential pressure, the self-induced slot made the flow pass through the slot from the hub region to the shroud region and resulted in the wake style changing from the pure wake to the weak wake near the shroud region. However, it enhanced the wake intensity near the hub region. Due to the style changing of the wake, it decreased the amplitude at fi near the shroud region and increases the amplitude at fi near the hub region of the impeller in the SIS model.
  • As a passive control method, the SIS was not needed for extra power outside the compressor. Although the self-induced slot could not achieve the effect similar to the trailing edge blowing method, it decreasing the amplitude near the shroud region was more meaningful, and appropriately increasing the amplitude near the hub region was acceptable.

Author Contributions

Conceptualization, J.X. and X.L.; methodology, J.X.; software, L.Z.; validation, X.K. and H.L.; formal analysis, X.L.; investigation, J.X.; resources, J.X.; data curation, L.Z.; writing—original draft preparation, J.X.; writing—review and editing, A.M.; visualization, J.X.; supervision, H.L.; project administration, J.X.; All authors have read and agreed to the published version of the manuscript.

Funding

This research received no external funding.

Institutional Review Board Statement

Not applicable.

Informed Consent Statement

Not applicable.

Data Availability Statement

Not applicable.

Conflicts of Interest

The authors declare no conflict of interest.

Nomenclature

RSIRotor–stator interaction
TEBTrailing edge blowing method and model
SISSelf-induced slot method and model
CFDComputational fluid dynamics
UGVRadial inlet with unevenly distributed guide vanes model
FFTFast Fourier transforms
GERGGroupe European de Recherches de Gazieres
R1Radius of the impeller inlet
R2Radius of the impeller outlet
bChord length of the guide vane
hHeight of the guide vane
RvRadius of the guide vane outlet
QdMass flow rate (kg/s)
nRotate speed (rpm)
PinIntake total pressure (MPa)
TinIntake total temperature (°C)
ηEfficiency (%)
εPressure ratio
PoutDischarge total pressure (MPa)
ToutDischarge total temperature (°C)
γSpecific heat ratio
RMSRoot mean square
P1 to P12Monitor points on the pressure side
S1 to S12Monitor points on the suction side
SSTShear-stress transport
GGIGeneral grid interface
GCIGrid convergence index
NMesh number
ΦIndicator parameter
pThe order of convergence
Φ e x t The extrapolated values
e a Approximate relative error
e e x t Extrapolated relative error
θMomentum thickness (m)
U∞Main flow velocity (m/s)
ULocal velocity (m/s)
dGuide vane trailing edge width (m)
yWidth of the guide vane passage (m)
fmMachine rotating frequency (Hz)
fiImpeller passing frequency (Hz)

References

  1. Braembussche, R. Design and Analysis of Centrifugal Compressors; John Wiley & Sons: Hoboken, NJ, USA, 2019. [Google Scholar]
  2. Engeda, A.; Kim, Y.; Aungier, R.; Direnzi, G. The inlet flow structure of a centrifugal compressor stage and its influence on the compressor performance. J. Fluids Eng. 2003, 125, 779–785. [Google Scholar] [CrossRef]
  3. Tan, J.; Wang, X.; Qi, D.; Wang, R. The effects of radial inlet with splitters on the performance of variable inlet guide vanes in a centrifugal compressor stage. Proc. Inst. Mech. Eng. Part C J. Mech. Eng. Sci. 2011, 225, 2089–2105. [Google Scholar] [CrossRef]
  4. Long F, T.J. The Influence of Radial Inlet Volute on the Stage Performance of Centrifugal Compressor. Compress. Blower Fan Technol. 2010, 2, 7–11. (In Chinese) [Google Scholar]
  5. Tan, J.; Wang, X.; Liu, J.; Rui, W.; Qi, D.; Han, F. Review of the Study on the Radial Inlet of Centrifugal Compressor. Compress. Blower Fan Technol. 2014, 4, 63–70. (In Chinese) [Google Scholar]
  6. Galindo, J.; Tiseira, A.; Navarro, R.; Tarí, D.; Meano, C.M. Effect of the inlet geometry on performance, surge margin and noise emission of an automotive turbocharger compressor. Appl. Therm. Eng. 2017, 110, 875–882. [Google Scholar] [CrossRef]
  7. Eza, A. Flow Simulations with Relevance to a Centrifugal Compressor and the Eect of the Inlet Geometry. Ph.D. Thesis, KTH Royal Institute of Technology, Stockholm, Sweden, 2015. [Google Scholar]
  8. Flathers, M.B.; Bache, G.E.; Rainsberger, R. An Experimental and Computational Investigation of Flow in a Radial Inlet of an Industrial Pipeline Centrifugal Compressor. J. Turbomach. 1996, 118, 371–384. [Google Scholar] [CrossRef]
  9. Han, F.; Qi, D.; Tan, J.; Wang, L.; Mao, Y. Experimental and Numerical Investigation of the Flow Field in the Radial Inlet of a Centrifugal Compressor. In Proceedings of the ASME Turbo Expo: Power for Land, Sea, and Air, Copenhagen, Denmark, 11–15 June 2012; pp. 831–845. [Google Scholar]
  10. Zhang, H.; Yang, C.; Yang, C.; Zhang, H.; Wang, L.; Chen, J. Inlet bent torsional pipe effect on the performance and stability of a centrifugal compressor with volute. Aerosp. Sci. Technol. 2019, 93, 105322. [Google Scholar] [CrossRef]
  11. MacManus, D.G.; Chiereghin, N.; Prieto, D.G.; Zachos, P. Complex aeroengine intake ducts and dynamic distortion. AIAA J. 2017, 55, 2395–2409. [Google Scholar] [CrossRef] [Green Version]
  12. Yamada, K.; Furukawa, M.; Arai, H.; Ito, S. Effects of Upstream Bend on Aerodynamic Performance of a Transonic Centrifugal Compressor. In Proceedings of the ASME Turbo Expo 2019: Turbomachinery Technical Conference and Exposition, Phoenix, AZ, USA, 17–21 June 2019. [Google Scholar]
  13. Wu, D.L.; Chen, J. The Design Method of Radial Inlet Volute in Centrifugal Compressor. Compress. Blower Fan Technol. 2010, 1, 23–28. (In Chinese) [Google Scholar]
  14. Chen, Z.; Gu, C.; Shu, X. Shape optimum design for centrifugal compressor radial inlet based on CFD technique. Chin. J. Mech. Eng. 2010, 46, 124–129. [Google Scholar] [CrossRef]
  15. Yagi, M.; Shibata, T.; Nishida, H.; Kobayashi, H.; Tanaka, M.; Sugimura, K. Optimizing a Suction Channel to Improve Performance of a Centrifugal Compressor Stage. In Proceedings of the ASME Turbo Expo 2010: Power for Land, Sea, and Air, Glasgow, UK, 14–18 June 2010; pp. 2007–2017. [Google Scholar]
  16. Liu, M.; Tan, L.; Cao, S. A review of prewhirl regulation by inlet guide vanes for compressor and pump. Proc. Inst. Mech. Eng. A J. Power Energy 2019, 233, 803–817. [Google Scholar] [CrossRef]
  17. Wang, R.; Qi, D.; Wang, X. Flow loss for the Radial Suction Chamber of Centrifugal Compressor improved Design. Chinses J. Appl. Mech. 2009, 26, 437–443. [Google Scholar]
  18. Han, F.; Wang, Z.; Mao, Y.; Tan, J.; Li, W. Flow Control of Radial Inlet Chamber and Downstream Effects on a Centrifugal Compressor Stage. Appl. Sci. 2021, 11, 2168. [Google Scholar] [CrossRef]
  19. Wang, Y.F.; Yan, L.; Guo, T. Research Progress in Unsteady Flow Characteristics and Dynamic Response of Centrifugal Compressor Impellers. Compress. Blower Fan Technol. 2016, 5, 81–87. (In Chinese) [Google Scholar]
  20. Han, F.H.; Mao, Y.J.; Yan, J.J. Effects of Flow Loss and Outlet Distortions Caused by Radial Inlet. J. Eng. Thermophys. 2017, 38, 2125–2129. [Google Scholar]
  21. Xin, J.; Wang, X.; Zhou, L.; Ye, Z.; Liu, H. Numerical Investigation of the Flow Field and Aerodynamic Load on Impellers in Centrifugal Compressor with Different Radial Inlets. In Proceedings of the ASME Turbo Expo 2016: Turbomachinery Technical Conference and Exposition, Seoul, Korea, 13–17 June 2016. [Google Scholar]
  22. Dring, R.; Joslyn, H.; Hardin, L.; Wagner, J. Turbine rotor-stator interaction. J. Eng. Gas Turbines Power 1982, 4, 729–742. [Google Scholar] [CrossRef]
  23. Park, W.J.; Cimbala, J.M. The effect of jet injection geometry on two-dimensional momentumless wakes. J. Fluid Mech. 1991, 224, 29–47. [Google Scholar] [CrossRef]
  24. Wu, Y.D.; Zhu, X.C.; Du, Z.H. Experimental Investigation on Momentumless Wake and its Application in Reduction of Unsteady Stator-Rotor Interaction. In New Trends in Fluid Mechanics Research, Proceedings of the Fifth International Conference on Fluid Mechanics (ICFM-V), Shanghai, China, 15–19 August 2007; Zhuang, F.G., Li, J.C., Eds.; Springer: Berlin/Heidelberg, Germany, 2007; pp. 467–470. [Google Scholar]
  25. Lewis, B.J.; Cimbala, J.M.; Wouden, A.M. Investigation of distributor vane jets to decrease the unsteady load on hydro turbine runner blades. IOP Conf. Ser. Earth Environ. Sci. 2012, 15, 022006. [Google Scholar] [CrossRef] [Green Version]
  26. Xin, J.; Wang, X.; Chen, X.; Shi, H.; Yang, S. Numerical simulation of variable inlet guide vane with trailing-edge blowing in centrifugal compressor. J. Harbin Eng. Univ. 2018, 39, 1006–1011. [Google Scholar]
  27. Xin, J.; Liu, H.; Tian, Z.; Liu, X.; Kong, X.; Wang, X. Numerical Investigation of the Flow Field and Aerodynamic Load on Impellers Under Radial Inlet Guide Vanes with Trailing Edge Blowing in Centrifugal Compressor. IOP Conf. Ser. Mater. Sci. Eng. 2021, 1081, 12–40. [Google Scholar] [CrossRef]
  28. Eberlinc, M.; Širok, B.; Hočevar, M.; Dular, M. Numerical and experimental investigation of axial fan with trailing edge self-induced blowing. Forsch. Ingenieurwes. Eng. Res. 2009, 73, 129–138. [Google Scholar] [CrossRef]
  29. Cravero, C.; Leutcha, P.J.; Marsano, D. Simulation and Modeling of Ported Shroud Effects on Radial Compressor Stage Stability Limits. Energies 2022, 15, 2571. [Google Scholar] [CrossRef]
  30. Xin, J.; Wang, X.; Liu, H. Numerical investigation of variable inlet guide vanes with trailing-edge dual slots to decrease the aerodynamic load on centrifugal compressor impeller. Adv. Mech. Eng. 2016, 8, 1687814016640653. [Google Scholar] [CrossRef] [Green Version]
  31. Xin, J.C.; Wang, X.F.; Zhou, L.S.; Yang, S.H. Numerical Investigation of Adjustable Inlet Guide Vane with Trailing Edge’s Self-Induced Blowing in Compressors. J. Northeast. Univ. Nat. Sci. 2018, 39, 1011–1016. [Google Scholar]
  32. Dixon, S.L.; Hall, C.A. Fluid Mechanics and Thermodynamics of Turbomachinery, 6th ed.; Butterworth-Heinemann Elsevier: Oxford, UK, 2010. [Google Scholar]
  33. Menter, F.R.; Kuntz, M.; Langtry, R. Ten years of industrial experience with the SST turbulence model. In Turbulence, Heat and Mass Transfer 4, Proceedings of the Fourth International Symposium on Turbulence, Heat and Mass Transfer, Antalya, Turkey, 12–17 October, 2003; Begell House: Danbury, CT, USA, 2003; pp. 625–632. [Google Scholar]
  34. Bourgeois, J.A.; Martinuzzi, R.J.; Savory, E.; Zhang, C.; Roberts, D.A. Assessment of turbulence model predictions for an aero-engine centrifugal compressor. J. Turbomach. 2011, 133, 011025. [Google Scholar] [CrossRef]
  35. Röyttä, P.; Grönman, A.; Jaatinen, A.; Turunen-Saaresti, T.; Backman, J. Effects of different blade angle distributions on centrifugal compressor performance. Int. J. Rotating Mach. 2009, 2009, 537802. [Google Scholar] [CrossRef] [Green Version]
  36. Sundström, E.; Semlitsch, B.; Mihăescu, M. Similarities and Differences Concerning Flow Characteristics in Centrifugal Compressors of Different Size. In Proceedings of the 5th International Conference on Jets, Wakes and Separated Flows (ICJWSF2015), Stockholm, Sweden, 15–18 June 2015; pp. 457–464. [Google Scholar]
  37. Sundström, E.; Semlitsch, B.; Mihaescu, M. Assessment of the 3d flow in a centrifugal compressor using steady-state and unsteady flow solvers. In Proceedings of the SAE 2014 International Powertrain, Fuels & Lubricants Meeting, Birmingham, UK, 20 October 2014. [Google Scholar]
  38. Celik, I.B.; Ghia, U.; Roache, P.J.; Freitas, C.J. Procedure for estimation and reporting of uncertainty due to discretization in CFD applications. J. Fluids Eng. Trans. ASME 2008, 130, 078001. [Google Scholar]
  39. Xin, J.; Wang, X.; Liu, H.; Wei, W.; Zhou, L. Numerical investigation of aerodynamic load on the impellers of centrifugal compressor with leakage flow. Int. J. Fluid Mach. Syst. 2020, 13, 409–424. [Google Scholar] [CrossRef]
Figure 1. Description of (a) the compressor meridian profile, (b) the radial inlet with guide vane, and (c) first stage of the compressor.
Applsci 12 05179 g001
Figure 2. The monitoring points’ location.
Applsci 12 05179 g002
Figure 3. Meshes display of (a) the radial inlet, (b) the first stage impeller, and (c) the return channel.
Applsci 12 05179 g003aApplsci 12 05179 g003b
Figure 4. The (a) trailing edge blowing scheme and (b) self-induced slot scheme.
Applsci 12 05179 g004
Figure 5. Compressor characteristic performance comparison of the UGV, SIS, and TEB models.
Applsci 12 05179 g005
Figure 6. The sections and streamline in the self-induced slot.
Applsci 12 05179 g006
Figure 7. (a) The streamline in the self-induced slot and (b) the velocity distribution in the SIS model.
Applsci 12 05179 g007
Figure 8. The (a) pressure contour and (b) distribution in the SIS model.
Applsci 12 05179 g008
Figure 9. The locations of monitor lines.
Applsci 12 05179 g009
Figure 10. The velocity distributions of the guide vane’s wake at (a) 0.1 span, (b) 0.5 span, and (c) 0.9 span.
Applsci 12 05179 g010aApplsci 12 05179 g010b
Figure 11. The total pressure comparison of (a) UGV, (b) SIS, and (c) TEB at cross-section 1-1.
Applsci 12 05179 g011
Figure 12. The aerodynamic load comparison of the time history oscillations (a) P3 and S3, and (b) P10 and S10 in different radial inlet models.
Applsci 12 05179 g012
Figure 13. The aerodynamic load comparison of the frequency harmonic (a) P3 and S3, (b) P10 and S10 in different radial inlet models.
Applsci 12 05179 g013
Figure 14. The aerodynamic load distribution from hub to shroud at the leading edge, including the comparison of (a) the amplitude at fm and (b) the amplitude at fi in different radial inlet models.
Applsci 12 05179 g014
Table 1. Composition of the recycled gas for the studied hydrogen compressor.
NameNitrogenHydrogenCarbon MonoxideCarbon DioxideMethaneArgon
Mole fraction0.0420.8910.0390.0090.0040.015
Mass percent (%)22.634.921.48.21.111.8
Table 2. The geometrical parameters of the hydrogen compressor.
ParameterValues
Radius of the impeller inlet R10.17 m
Radius of the impeller outlet R20.275 m
Impeller outlet angle36°
Impeller inlet angle43°
Chord length of the guide vane b0.11 m
Height of the guide vane h0.09 m
Maximum thickness of the guide vane 0.02 m
Radius of the guide vane outlet Rv 0.22 m
Table 3. Compressor performance at design condition.
VariableSymbolValue
Mass flow rate (kg/s)Qd60.95
Rotate speed (rpm)n7982
Intake total pressure (MPa)Pin6.53
Intake total temperature (°C)Tin45
Pressure ratioε1.045
Efficiency (%)η89.3
Table 4. Grid convergence study using discharge total pressure as an indicator.
ItemSymbolValue
Grid refinement ratio between grids 1 and 2r211.16
Grid refinement ratio between grids 2 and 3r321.28
The order of convergencep7.8064
The extrapolated values between indicators 1 and 2 Φ e x t 21 6,823,552 (Pa)
The extrapolated values between indicators 2 and 3 Φ e x t 32 6,823,553 (Pa)
Approximate relative error between indicators 1 and 2 e a 21 0.0096%
Approximate relative error between indicators 2 and 3 e a 32 0.0861%
Extrapolated relative error between indicators 1 and 2 e e x t 21 0.00463%
Extrapolated relative error between indicators 1 and 2 e e x t 32 0.01393%
The fine-grid convergence index between grids 1 and 2GCI210.0025%
The fine-grid convergence index between grids 2 and 3GCI320.0028%
Table 5. The non-dimensionalized momentum thickness θ/d distribution in different radial inlets.
Momentum Thicknesses θ/d0.1 Span0.5 Span0.9 Span
UGV0.4040.3320.370
SIS0.4440.3260.266
TEB−0.0180.0180.015
Table 6. Summary of compressor dominant frequencies.
Type of Frequency FormulaValue (Hz)
Impeller passing frequencyfi = fm × 18 2394.6
Machine rotating frequencyfm = n/60 133.03
Publisher’s Note: MDPI stays neutral with regard to jurisdictional claims in published maps and institutional affiliations.

