
Scene Adaptive Segmentation for Crowd Counting in Population Heterogeneous Distribution


1
School of Mechanical and Electrical Engineering, Henan University of Technology, Zhengzhou 450001, China
2
Henan International Joint Laboratory of Grain Information Processing, Zhengzhou 450001, China
3
College of Information Science and Engineering, Henan University of Technology, Zhengzhou 450001, China
*
Author to whom correspondence should be addressed.
Appl. Sci. 2022, 12(10), 5183; https://doi.org/10.3390/app12105183
Submission received: 25 April 2022
/
Revised: 18 May 2022
/
Accepted: 19 May 2022
/
Published: 20 May 2022
(This article belongs to the Special Issue Selected Papers from FCPAE2022 and 4th International Conference on Artificial Intelligence and Advanced Manufacturing (AIAM2022))
Abstract
:Crowd counting is an important part of crowd analysis and has been widely applied in the field of public safety and commercial management. Although researchers have proposed many crowd counting methods, there is little research on non-uniform population distribution. In this research, a new scene adaptive segmentation network (SASNet) is proposed that can focus on crowd area to estimate accurately crowd density in population heterogeneous distribution. First, an image segmentation module is designed that can adaptive horizontal segment an image according to different density levels, and then obtains a close-up view image and a distant view image. Second, a dual branches network based on convolution neural network (CNN) is exploited that contains a distant view network (DVNet) and a close-up view network (CVNet), so as to extract different scales of image features and then generate density maps by each branch, respectively, so that the crowd counting module has robustness on different scales of target. Finally, a comparative experiment on three well-known crowd counting datasets shows that SASNet achieved stabilized performance and robustness in population heterogeneous distribution.
1. Introduction
Crowd counting estimates the count of people and their spatial distribution in a given scenario. It is still an important research field of crowd analysis. With the growth in population and rapid development of the economy, more people pursue a better life that often flows in various sports, entertainment scenarios, well-known scenic areas, etc. However, due to improper control of crowd gathering, stampede accidents emerge one after another [1], which causes great losses of life and property. Therefore, a robust crowd counting algorithm can accurately estimate the number of people in a scene, to prevent effectively the accidents.
With the high-speed improvement in computer technology, crowd counting has many applications in reality, such as public safety management, urban planning, and intelligent decision making. After a few decades of study, researchers have proposed many competitive crowd counting algorithms. Generally speaking, the method of machine learning was mainly used in early crowd counting. The characteristics of people were mapped and processed by detection [2] or regression [3], so as to obtain the sum of people in images [4,5] or videos [6]. However, these processing methods cannot obtain high-level spatial distribution information from images. The count of large-scale objects was counted by a density estimation-based approach. It can not only estimate the density map but also account for the number of objects in any zone of a map by combining spatial information.
In recent years, although researchers have devised some effective approaches, crowd counting is still a worthy task in dense scenarios. In recent years, these related researchers have their attention on CNN and have persistently studied CNN-based crowd counting in the same scene with different scales and different densities. The CNN-based approach involves two parts: (1) feature extraction: adaptive extraction of the feature is carried out by adding multiscale prediction, context awareness, empty convolution, and deformable convolution for different challenges; (2) density estimation map: a quality of density map is generated and modified by a loss function, such as structural similarity function [7], generating adversarial function and other methods.
It is widely known that these traditional machine-learning-based methods can only extract low-level feature information, and most existing deep learning-based methods just employ a network to generate the estimation density map and count the number of people in dense scenarios, especially in the case of population heterogeneous distribution. Therefore, this research proposes a crowd counting method based on scene adaptive segmentation, which is called SASNet. First, we adopted adaptive horizontal segmentation for the image and obtained two regions with different density levels of close-up view and distant view. Second, we introduced two kinds of networks with different sizes of receptor fields to grab features of different scales in two regions, and enhance the robustness of the algorithm. Finally, a dilated convolution is employed to offset the increase in parameters due to the dual-column network.
In this work, our contributions compared with previous work are summarized:
- (1)
- A novel scene adaptive segmentation network is proposed that can adaptively divide the input image into distant-view regions and close-up view regions with different densities.
- (2)
- We exploit simultaneously distant view and close-up view crowd counting modules, which can extract features of different scales from the two views according to different receptive fields of image.
- (3)
- A dilated convolution is employed to lower greatly the number of parameters.
2. Related Work
Generally, a crowd counting model includes both the traditional approach relying on manual feature extraction and the deep learning approach based on CNN. The traditional approach can be categorized into direct detection, regression, and generation of the density estimation map.
2.1. Traditional Methods
Most of these direct detection approaches employed a window sliding to count the number of people after extracting the target, which can achieve accurate results. However, once people are crowded, the counting effect will decrease sharply. Regression-based methods [8,9,10] extract foreground features by learning linear regression, Gaussian regression, ridge regression, etc. The mapping from images or image blocks to the number of targets is completed. These methods are successful in dealing with occlusion and background clutter but are unsatisfactory when the scene scale and angle of view change sharply because the spatial information is ignored. To tackle the above problems, Lemptisky et al. [11] and Chen et al. [12] developed a density estimation approach that learned the linear relation in view of spatial information. However, their methods used traditional manual features to extract junior-level information, which greatly reduced the accuracy of counting.
2.2. Deep-Learning-Based Methods
Due to the stronger ability of deep learning to capture features, these CNN-based counting methods have been applied in fields that need to be counted. More and more researchers train models to continuously refresh the performance of the CNN-based crowd counting approach. Shang et al. [13] utilized CNN that inputs an image and outputs directly the sum of a crowd. Boominathan et al. [14] attempted to use a network of two columns for estimating density maps. Marsden et al. [15] employed a single-column fully convolutional network, while Sindagi et al. [16] proposed senior-level information to boost the density prediction performance. The research results of Zhang et al. [4] exploring the MCNN were consistent with those of Oñoro-Rubio et al. [17]. In other words, the Hydra-CNN of scale and multi-column module was presented for estimating the density map. Sindagi et al. [18] explored a multi-task structure to predict the classification of density while generating a senior-quality feature map. Motivated by the MCNN, Sam et al. [5] selected the optimal regressor as input and adopted a network to acquire the same classification result of that input image in the prediction. Li et al. [19] adopted a single-column structure with deeper dilated CNN; the proposed CSRNet consisted of a 2D feature extraction network and a dilated convolution and adopted dilated convolution to replace pooling operations for obtaining larger reception fields. Zhang et al. [20] proposed a RANet that accounted for the interdependence of pixels to increase the self-attention mechanism. Cao et al. [21] developed a scale aggregation network (SANet) performing encoder and decoder. The scale aggregation models as encoders grab different scale features, and the decoder uses a large number of transposed convolutions to build high-definition density estimation maps. Zhao et al. [22] exploited a consistent polarity deep attention network (PDANet), which incorporated attention into an emotion polarity constraint CNN. Saleh et al. [23] proposed a scale-driven CNN, which premised that features of heads were visible and dominant in any density of the crowd. Wang et al. [24] designed the ScSiNet for extracting scale-invariant features, which integrated scale-invariant transformation.
From the above, it can be seen that most CNN-based crowd counting methods compute the population by estimating density with L2 regression loss, whereas because the L2 is sensitive, the generating density map is punch-drunk. To tackle this problem, a novel dilated convolutional model that combines traditional convolutional and expansion convolutional layers is proposed, which can avoid the ambiguous density map caused by L2 loss.
3. Methodology
Due to the effect of perspective in the real scenario, there are some different scales of feature between the distant view and the close-up view, such as crowd density, the scale of head and shape, etc., which decreases the accuracy of counting. Motivated by the above shortcomings, a scene adaptive segmentation network (SASNet) is proposed for crowd counting as shown in Figure 1.
3.1. Scene Adaptive Segmentation
To ensure the efficiency of image-processing algorithm, it is necessary to determine the convergence rate of parameters in the design of adaptive estimator [25,26]. Therefore, we trained a scene adaptive segmentation model which obtains a splitting ratio between distant view and close-up view images. In this work, an image segmentation network (SplitNet) is adopted shown in Figure 1. The SplitNet is a CNN-based approach to obtain an image adaptive segmentation line [27]. The image segmentation can be regarded as a regression model which inputs a scene image and outputs a segmentation ratio.
Motivated by the first ten layers of VGG-16, SplitNet automatically extracts the discriminating features of images. To make the input of different sizes become the output of the same size, it adds Spatial Pyramid pooling (SPP), the pooled windows of 1 × 1, 2 × 2, 3 × 3 with different sizes are adopted to dynamically adjust the size and step width of the pooled windows motivated by the dimension of feature image. Therefore, the SplitNet can process any size of an input image and keep the output of a fixed-size Pyramid space after the pool, receive three dimensions of feature vector into only one neuron of full connection layer, and get an output value between 0 and 1 used to describe the division point ordinate in proportion to the height of images. Finally, according to the division ratio value, the image is divided into distant view and close-up view, separately. According to the partition result in the example listed in Figure 2, the density, shape, and scale of distant and close-up scene objects are greatly different.
3.2. Crowd Counting Module
Since the head size in the close-up view image is larger than that in the distant view image, the distant-view and close-up view crowd counting network are trained during the crowd counting stage, respectively. Thus, the count of people can be computed by each density map. The step 2 describes the process of the SASNet crowd counting as shown in Figure 1.
3.2.1. Distant View Crowd Counting
In view of different head sizes in the image, the traditional convolution could cause the loss of spatial feature information. A small-sized crowd of an image often cannot be accurately identified, thus greatly reducing the accuracy of crowd density. To tackle the above problems, a deconvolution-based crowd counting network is proposed for distant-view scenarios, called DVNet. First, motivated by the feature map extracted by VGG-16, the information loss is reduced by deconvolution operation, which can estimate the small size of the head. Then, it is processed by the dilated convolution module, and the dilated convolution rate is set to 2 to enhance the information extraction of crowd characteristics in dense areas. Finally, we adopt three convolutions and one dilated convolution to filter out the complex background elements, to improve the accuracy of density analysis.
3.2.2. Close-Up View Crowd Counting
For the estimation of head in close-up view images, a dilated convolution can well compensate for the shortcomings of the above operations. It can replace the upsampling and downsampling process without changing the size, reducing the loss of information. Specifically, first, we realize the rapid localization and feature extraction of the crowd through the convolution layer when the dilated rate is 3. Then, the CVNet performs three convolutions without the dilated convolution. Finally, a dilated convolution for feature extraction employs a small convolutional kernel to reduce the count of parameters. It separates the crowd and the background to estimate the crowd density of a close-up view image.
3.3. Density Estimation Map
Due to existing perspective distortion, utilizing straightaway on the annotation with the Gaussian function for generating the density map is not excellent. In this research, we adopt the labeled image that inputs the central point of a head, and outputs the density estimation map. The normalization employs a geometry adaptive kernel. The specific calculation can be presented.
where xi represents the pixel of a head, N is representing the people counting in a given region, and represents the mean distance between a head and these heads of its nearest m neighbors. δ represents ground truth, and is the performed Gaussian blur processing on each head. In the experiment, the parameter setting of CSRNet is adopted as the standard deviation, β = 0.3, m = 3.
3.4. Loss Function
The Euclidean distance can commendably measure the distinction between the value of algorithm processing and ground truth. In the training of this research, we used Euclidean distance that minimizes the length from the value of algorithm processing to the ground truth. The formulas can be indicated as follows.
where N denotes the batch size, indicates the forecast the outcome of ith sample, and is the actual density value of ith sample.
4. Experiments
4.1. Implementation
The experiments in this paper are implemented based on Ubuntu16.04 and the version of PyTorch framework is 1.11.0. The proposed model is trained on an Intel 2.4 GHz processor and accelerated by a GPU (Tesla V100). The batch size of the training is defined as 256, the learning rate is defined as 10−5, and the variance is defined as 0.01.
4.2. Evaluation Criteria
In the field of crowd counting, the mean absolute error (MAE) can indicate the accuracy of the model, and the root mean square error (RMSE) can represent the robustness of the model. In this research, MAE and RMSE are employed as the evaluation criteria. The formulas of evaluation can be listed as follows.
Among them, N is the count of heads in a test sample, Prei indicates the predicted density map, and GTi indicates the marked head counting by manual in the given scenario. z (p, q) represents the pixel value of the point (p, q), and P and Q indicate the length and width of the estimated density map, respectively.
4.3. Datasets
In this work, we validate the proposed SASNet on the three mainstream crowd datasets. Table 1 shows the details of the above three datasets, such as the name of the dataset, resolution, and number of samples; and max, min, avg, and sum represent the maximum number, minimum number, average number, and the count of instances in the datasets, respectively.
4.3.1. ShanghaiTech
The ShanghaiTech dataset involves two different density parts. Part_A is a random picture from the internet and has a high population density, and Part_B is from a commercial street in Shanghai. This dataset successfully creates a challenging dataset across different scene types and densities. Therefore, the scale change and distorted viewing angle presented by this dataset provide new challenges and opportunities for many CNN-based designs.
4.3.2. UCF_CC_50
The UCF_CC_50 datasets is a firstly challenging dataset structured from the internet. It contains different angles of view distortion, various densities, and scenes. Motivated by the existing 50 images, the UCF_CC_50 employs a fivefold cross-authentication protocol. Just because of data deficiencies, even the SOTA CNN-based approaches cannot obtain the best excellent results.
4.3.3. UCF_QNRF
The UCF_QNRF dataset is very challenging, with the increasing difficulty of crowd counting motivated by the diversity of scenarios, such as distorted viewing angles, image resolution, crowd density, and lighting variations. It contains 1535 images with a resolution of 2013 × 2902, annotating 1,251,642 people. What is noteworthy is that containing the biggest number of people in an image is 12,865 at that time.
4.4. Results and Analysis
As we can see from Table 2, the SASNet shows a more stabilized performance than the classical single column CNN method on the three datasets because the dual-column architecture can extract effectively multi-scale features of an image. Compared with the early multi-column CNN method, the proposed method also has significant performance, which is mainly because our method extracts and retains the important details of the image, reduces the layers of a network, and accelerates the speed of network convergence. To be specific, the performance of SASNet is better than most advanced methods in terms of RMSE on UCF_CC_50. From all lists, the proposed SASNet attains a competitive result that achieves the lower MAE of 60.5 and RMSE of 101.3 on Part_A and the lower MAE of 184.3 and RMSE of 258.1 on the UCF_CC_50 datasets. Specifically, it acquires the best MAE of 91.1 and RMSE of 169.6 on the UCF_QNRF dataset. The significant improvements show that SASNet can effectively handle population heterogeneous distribution.
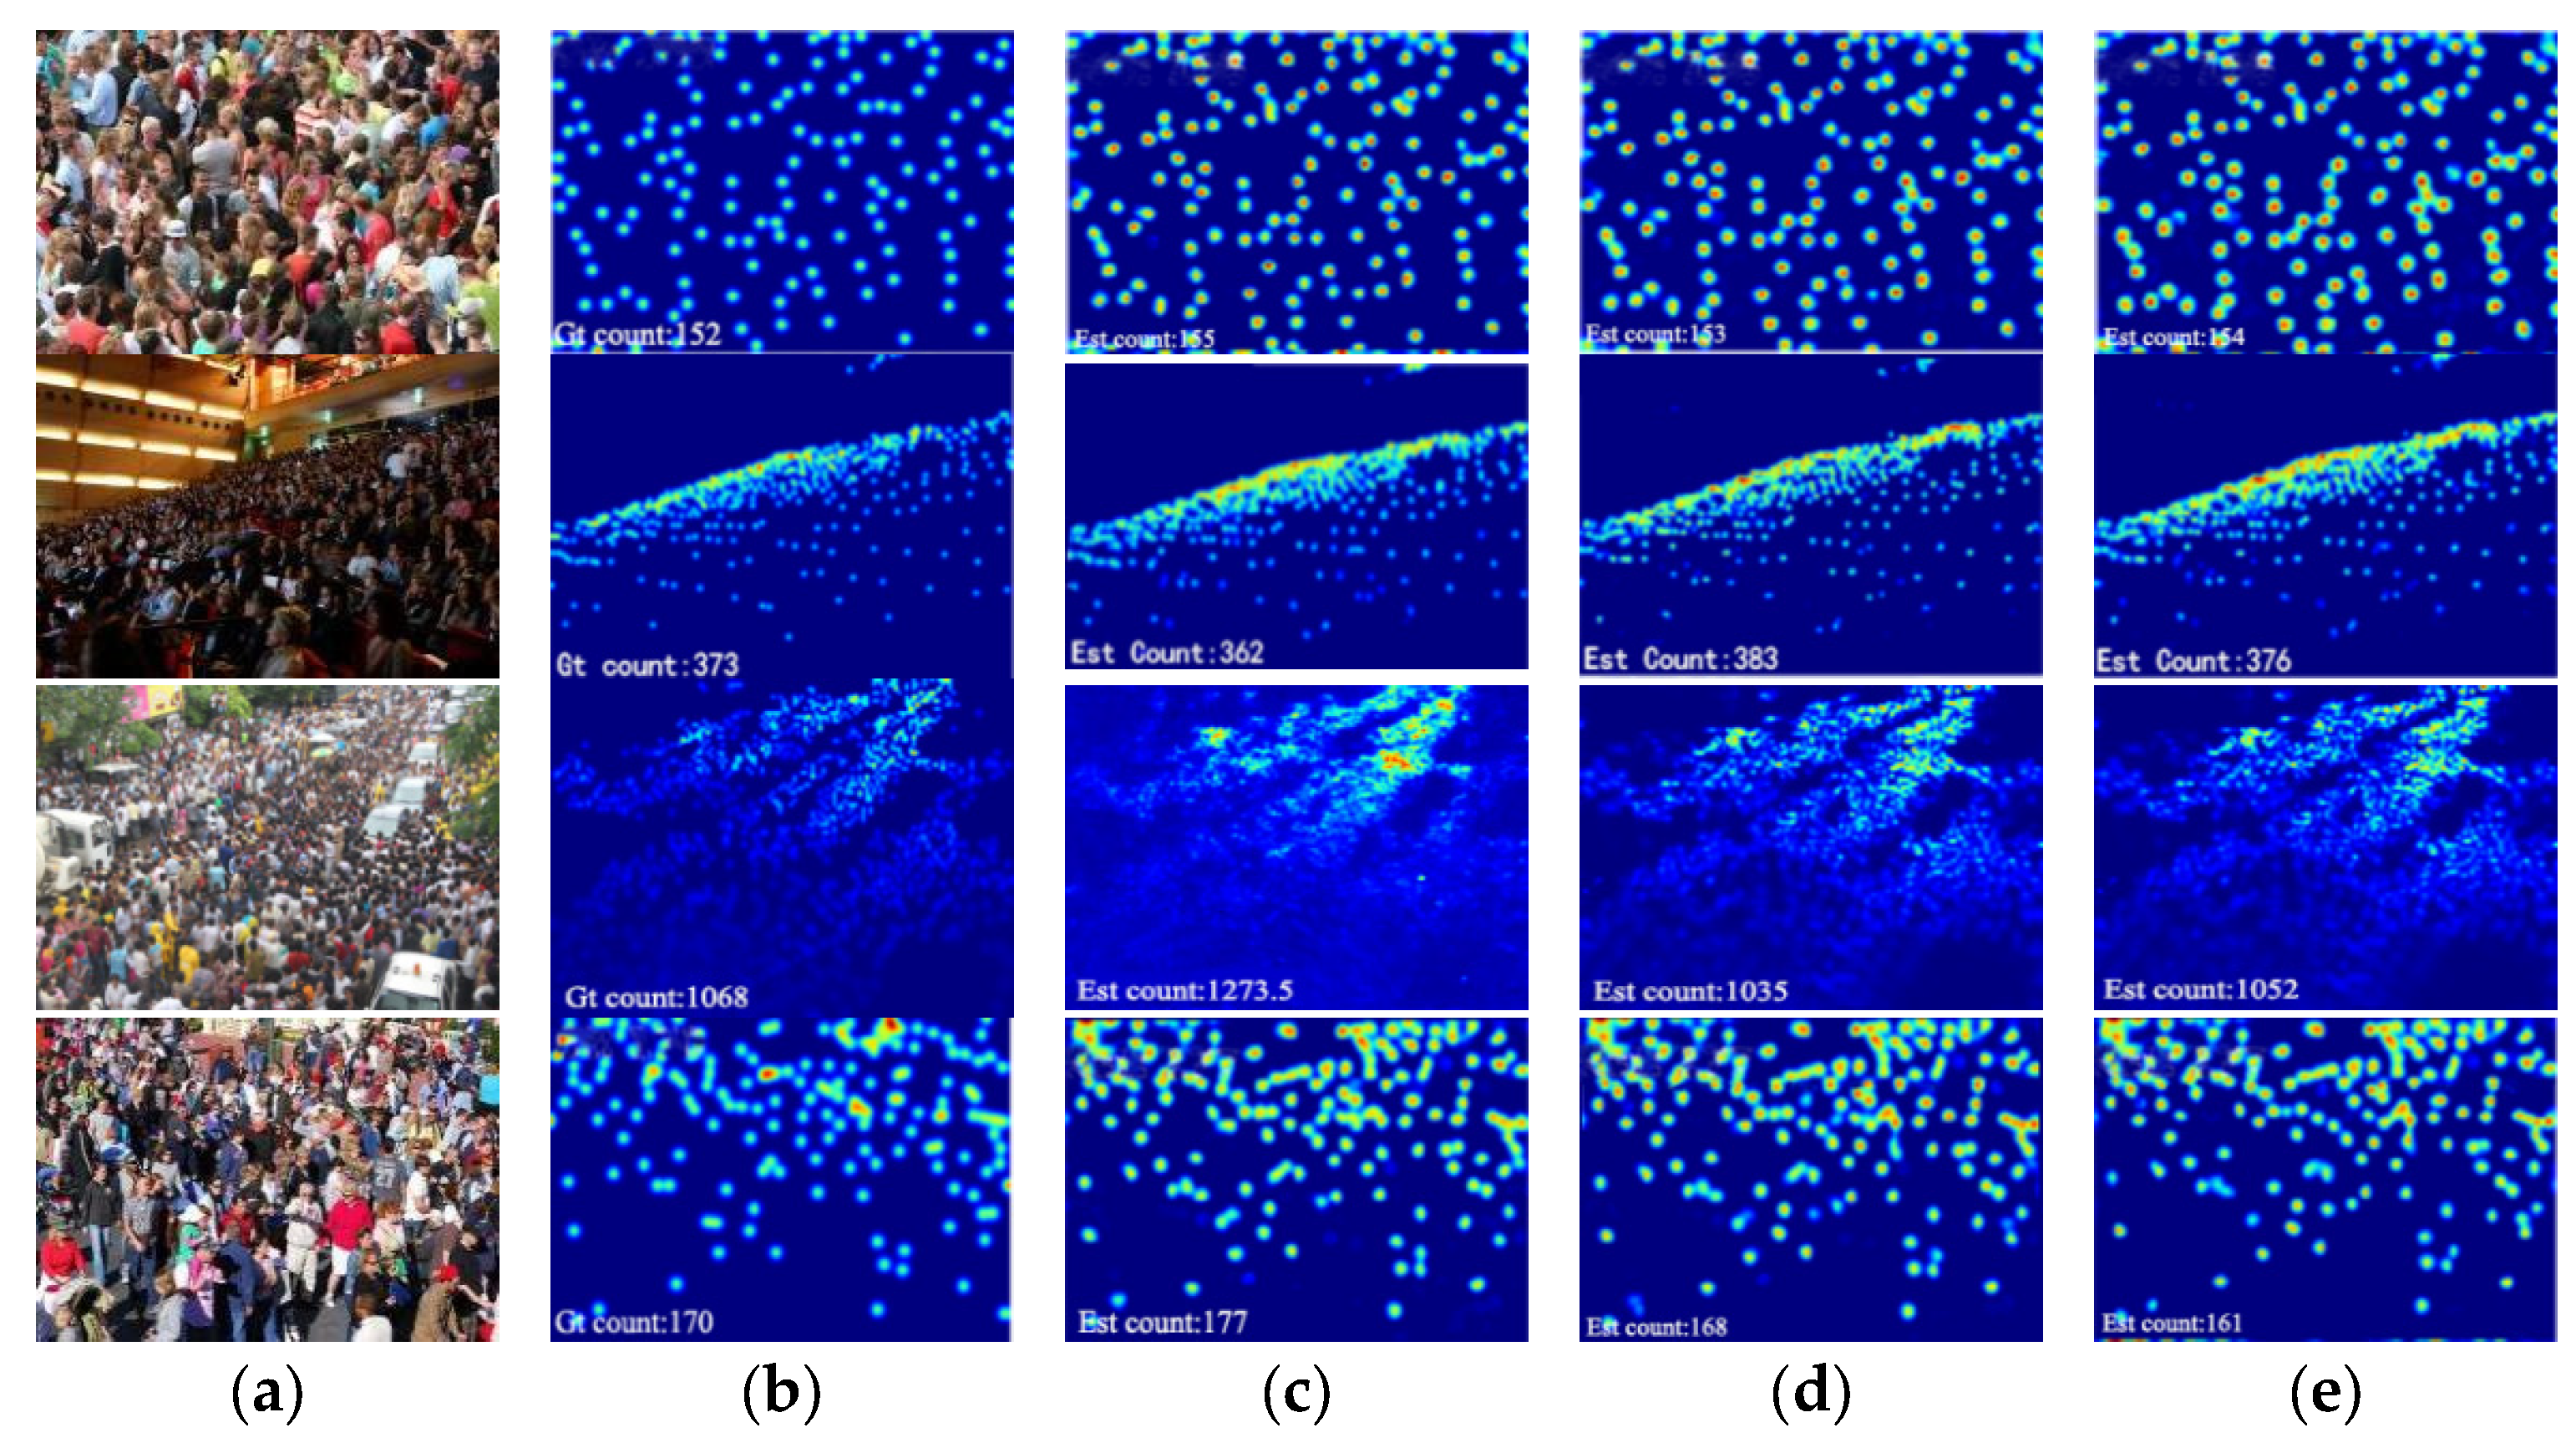
Figure 3 displays the visual comparisons of different approaches on ShanghaiTech Part_A. From left to right, the images in the first column are some samples. The second column shows the ground truth by Manual annotation, and the third to fifth columns show the estimation value generated by MCNN, CAT-CNN, and the proposed SASNet, respectively. Through comparative analysis, the density map generated by this method in population heterogeneous distribution can retain detailed information well, especially when SASNet solves the problem of different scales in the process of crowd counting, and the estimated count of people is closer to the ground truth.
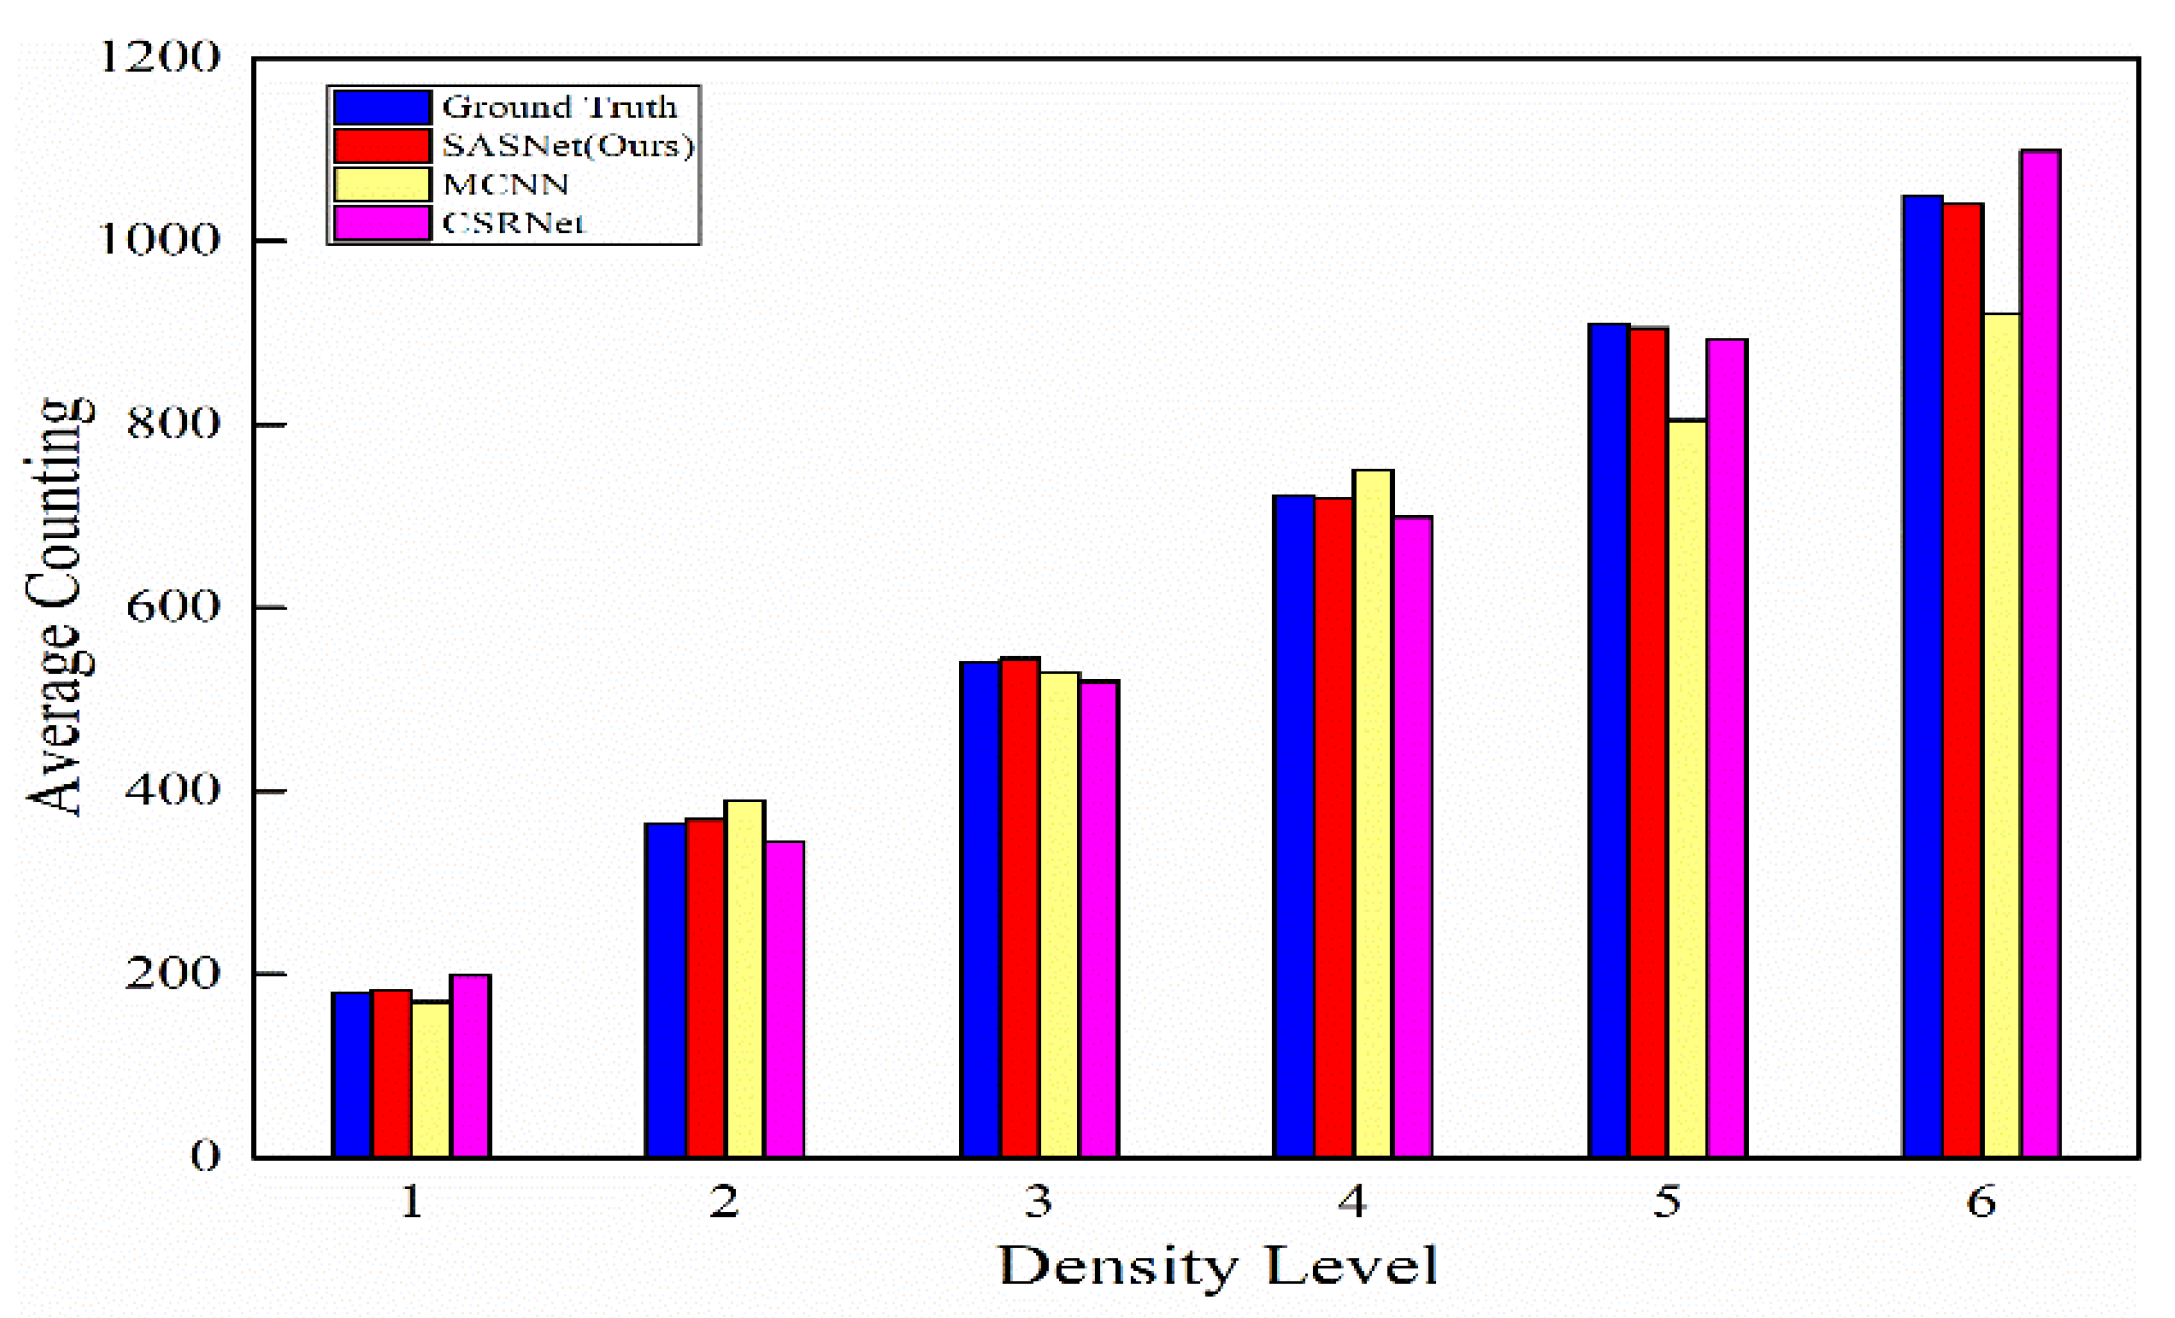
In addition, to evaluate the feature representations of the proposed SASNet from diverse scenes with various crowd density scenes, we divided the ShanghaiTech Part_A test set into six groups according to the number of people in each scenario. Each set indicates a specific density level and the corresponding average number of people. We compared our method with two existing classic representative counting networks, MCNN and CSRNet. The MCNN performs well in the relatively sparse scenes, and the CSRNet performs well in crowded scenarios. However, the proposed HSRNet outperforms the two models in all groups, which further proves that our approach can generate more precise density maps in crowd heterogeneous distribution scenes. Figure 4 shows the histogram of the results.
5. Conclusions
This research designs a novel end-to-end SASNet that can generate high-level density maps for crowd counting, which is an easily trained method. We adopt spatial pyramid pooling and full convolution to obtain a scene adaptive segmentation ratio, and receive two images of different densities. By training different views in the stage of crowd counting, the number of people is estimated from the mentioned two parts of the image, respectively. We conducted three mainstream crowd datasets compared with the SOTA performance. In the next research, we could exploit the division approach of scene density levels and extend our method to other counting tasks.
Author Contributions
Conceptualization, H.G.; methodology, H.G.; software, H.G.; validation, H.G., M.D. and W.Z.; formal analysis, W.Z.; investigation, W.Z; resources, M.D.; data curation, H.G; writing—original draft preparation, H.G; writing—review and editing, W.Z.; visualization, H.G.; supervision, D.Z.; project administration, D.Z.; funding acquisition, M.D. All authors have read and agreed to the published version of the manuscript.
Funding
This research is supported by the National Key R&D Program of China (2018******02), and the Major Public Welfare Project of Henan Province (201300311200).
Conflicts of Interest
The authors declare no conflict of interest.
References
- Li, B.; Huang, H.; Zhang, A.; Liu, P.-C. Approaches on crowd counting and density estimation: A review. Pattern Anal. Appl. 2021, 24, 853–874. [Google Scholar] [CrossRef]
- Gavrila, D.M.; Philomin, V. Real-time object detection for “smart” vehicles. In Proceedings of the Seventh IEEE International Conference on Computer Vision, Corfu, Greece, 20–27 September 1999; Volume 1, pp. 8–93. [Google Scholar]
- Chan, A.B.; Vasconcelos, N. Bayesian Poisson regression for crowd counting. In Proceedings of the IEEE 12th International Conference on Computer Vision, Kyoto, Japan, 29 September–2 October 2009; pp. 545–551. [Google Scholar]
- Zhang, C.; Li, H.; Wang, X.; Yang, X. Cross-scene crowd counting via deep convolutional neural networks. In Proceedings of the IEEE Conference on Computer Vision and Pattern Recognition (CVPR), Boston, MA, USA, 7–12 June 2015; pp. 833–841. [Google Scholar]
- Zhang, Y.; Zhou, D.; Chen, S.; Gao, S.; Ma, Y. Single-Image Crowd Counting via Multi-Column Convolutional Neural Network. In Proceedings of the IEEE Conference on Computer Vision and Pattern Recognition (CVPR), Las Vegas, NV, USA, 27–30 June 2016; pp. 589–597. [Google Scholar]
- Chen, S.; Fern, A.; Todorovic, S. Person count localization in videos from noisy foreground and detections. In Proceedings of the IEEE Conference on Computer Vision and Pattern Recognition (CVPR), Boston, MA, USA, 7–12 June 2015; pp. 1364–1372. [Google Scholar]
- Wang, Z.; Bovik, A.C.; Sheikh, H.R.; Simoncelli, E.P. Image quality assessment: From error visibility to structural similarity. IEEE Trans. Image Process. 2004, 13, 600–612. [Google Scholar] [CrossRef] [PubMed] [Green Version]
- Idrees, H.; Saleemi, I.; Seibert, C.; Shah, M. Multi-source Multi-Scale Counting in Extremely Dense Crowd Images. In Proceedings of the IEEE Conference on Computer Vision and Pattern Recognition, Portland, OR, USA, 23–28 June 2013; pp. 2547–2554. [Google Scholar]
- Dollár, P.; Wojek, C.; Schiele, B.; Perona, P. Pedestrian Detection: An Evaluation of the State of the Art. IEEE Trans. Pattern Anal. Mach. Intell. 2012, 34, 743–761. [Google Scholar] [CrossRef] [PubMed]
- Lowe, D.G. Object recognition from local scale-invariant features. In Proceedings of the Seventh IEEE International Conference on Computer Vision, Corfu, Greece, 20–27 September 1999; Volume 2, pp. 1150–1157. [Google Scholar]
- Lempitsky, V.S.; Zisserman, A. Learning to Count Objects in Images. Adv. Neural Inf. Process. Syst. 2010, 23, 1324–1332. [Google Scholar]
- Chen, K.; Gong, S.; Xiang, T.; Loy, C.C. Cumulative Attribute Space for Age and Crowd Density Estimation. In Proceedings of the IEEE Conference on Computer Vision and Pattern Recognition, Portland, OR, USA, 23–28 June 2013; pp. 2467–2474. [Google Scholar]
- Shang, C.; Ai, H.; Bai, B. End-to-end crowd counting via joint learning local and global count. In Proceedings of the IEEE International Conference on Image Processing (ICIP), Phoenix, AZ, USA, 25–28 September 2016; pp. 1215–1219. [Google Scholar]
- Boominathan, L.; Kruthiventi, S.S.S.; Babu, R.V. CrowdNet: A Deep Convolutional Network for Dense Crowd Counting. In Proceedings of the 24th ACM International Conference on Multimedia, Amsterdam, The Netherlands, 15–19 October 2016; pp. 640–644. [Google Scholar]
- Marsden, M.; McGuinness, K.; Little, S.; O’Connor, N.E. Fully Convolutional Crowd Counting on Highly Congested Scenes. arXiv 2017, arXiv:1612.00220. [Google Scholar]
- Sindagi, V.A.; Patel, V.M. Generating High-Quality Crowd Density Maps Using Contextual Pyramid CNNs. In Proceedings of the IEEE International Conference on Computer Vision (ICCV), Venice, Italy, 22–29 October 2017; pp. 1879–1888. [Google Scholar]
- Oñoro-Rubio, D.; López-Sastre, R.J. Towards Perspective-Free Object Counting with Deep Learning. In Proceedings of the European Conference on Computer Vision, Amsterdam, The Netherlands, 8–16 October 2016; pp. 615–629. [Google Scholar]
- Sindagi, V.A.; Patel, V.M. CNN-Based cascaded multi-task learning of high-level prior and density estimation for crowd counting. In Proceedings of the 14th IEEE International Conference on Advanced Video and Signal Based Surveillance (AVSS), Lecce, Italy, 29 August–1 September 2017; pp. 1–6. [Google Scholar]
- Li, Y.; Zhang, X.; Chen, D. CSRNet: Dilated Convolutional Neural Networks for Understanding the Highly Congested Scenes. In Proceedings of the IEEE/CVF Conference on Computer Vision and Pattern Recognition, Salt Lake City, UT, USA, 18–23 June 2018; pp. 1091–1100. [Google Scholar]
- Zhang, A.; Shen, J.; Xiao, Z.; Zhu, F.; Shao, L. Relational Attention Network for Crowd Counting. In Proceedings of the IEEE/CVF International Conference on Computer Vision (ICCV), Seoul, Korea, 27 October–2 November 2019; pp. 6787–6796. [Google Scholar]
- Cao, X.; Wang, Z.; Zhao, Y.; Su, F. Scale Aggregation Network for Accurate and Efficient Crowd Counting. In Proceedings of the European Conference on Computer Vision (ECCV), Munich, Germany, 8–14 September 2018; pp. 734–750. [Google Scholar]
- Zhao, S.; Jia, Z.; Chen, H.; Li, L. PDANet: Polarity-Consistent Deep Attention Network for Fine-Grained Visual Emotion Regression. In Proceedings of the 27th ACM International Conference on Multimedia, Nice, France, 21–25 October 2019; pp. 192–201. [Google Scholar]
- Basalamah, S.M.; Khan, S.D.; Ullah, H. Scale Driven Convolutional Neural Network Model for People Counting and Localization in Crowd Scenes. IEEE Access 2019, 7, 71576–71584. [Google Scholar] [CrossRef]
- Wang, M.; Cai, H.; Zhou, J.; Gong, M. Interlayer and Intralayer Scale Aggregation for Scale-Invariant Crowd Counting. Neurocomputing 2021, 441, 128–137. [Google Scholar] [CrossRef]
- Tutsoy, O.; Çolak, Ş. Adaptive estimator design for unstable output error systems: A test problem and traditional system identification based analysis. Proc. Inst. Mech. Eng. Part I J. Syst. Control Eng. 2015, 229, 902–916. [Google Scholar] [CrossRef]
- Tutsoy, O. Design and Comparison Base Analysis of Adaptive Estimator for Completely Unknown Linear Systems in the Presence of OE Noise and Constant Input Time Delay. Asian J. Control 2016, 18, 1020–1029. [Google Scholar] [CrossRef]
- Yu, Y.; Zhu, H.; Wang, L.; Pedrycz, W. Dense crowd counting based on adaptive scene division. Int. J. Mach. Learn. Cybern. 2021, 12, 931–942. [Google Scholar] [CrossRef]
- Sam, D.B.; Surya, S.; Babu, R.V. Switching Convolutional Neural Network for Crowd Counting. In Proceedings of the 2017 IEEE Conference on Computer Vision and Pattern Recognition (CVPR), Honolulu, HI, USA, 21–26 July 2017; pp. 4031–4039. [Google Scholar]
- Gao, J.; Wang, Q.; Li, X. PCC Net: Perspective Crowd Counting via Spatial Convolutional Network. IEEE Trans. Circuits Syst. Video Technol. 2020, 30, 3486–3498. [Google Scholar] [CrossRef] [Green Version]
- Jiang, X.; Xiao, Z.; Zhang, B.; Zhen, X.; Cao, X.; Doermann, D.S.; Shao, L. Crowd Counting and Density Estimation by Trellis Encoder-Decoder Networks. In Proceedings of the 2019 IEEE/CVF Conference on Computer Vision and Pattern Recognition (CVPR), Long Beach, CA, USA, 15–20 June 2019; pp. 6126–6135. [Google Scholar]
- Liu, L.; Qiu, Z.; Li, G.; Liu, S.; Ouyang, W.; Lin, L. Crowd Counting with Deep Structured Scale Integration Network. In Proceedings of the 2019 IEEE/CVF International Conference on Computer Vision (ICCV), Seoul, Korea, 27 October–2 November 2019; pp. 1774–1783. [Google Scholar]
- Dong, L.; Zhang, H.; Ji, Y.; Ding, Y. Crowd counting by using multi-level density-based spatial information: A Multi-scale CNN framework. Inf. Sci. 2020, 528, 79–91. [Google Scholar] [CrossRef]
- Luo, A.; Yang, F.; Li, X.; Nie, D.; Jiao, Z.; Zhou, S.; Cheng, H. Hybrid Graph Neural Networks for Crowd Counting. arXiv 2020, arXiv:2002.00092. [Google Scholar] [CrossRef]
- Zhang, B.; Wang, N.; Zhao, Z.; Abraham, A.; Liu, H. Crowd counting based on attention-guided multi-scale fusion networks. Neurocomputing 2021, 451, 12–24. [Google Scholar] [CrossRef]
- Zhou, F.; Zhao, H.; Zhang, Y.; Zhang, Q.; Liang, L.; Li, Y.; Duan, Z. COMAL: Compositional multi-scale feature enhanced learning for crowd counting. Multimed. Tools Appl. 2022. [Google Scholar] [CrossRef]
Figure 1.
The Architecture of SASNet. The SASNet mainly covers two stages. The first stage is the image segmentation, and the second stage is the crowd counting.
Figure 1.
The Architecture of SASNet. The SASNet mainly covers two stages. The first stage is the image segmentation, and the second stage is the crowd counting.

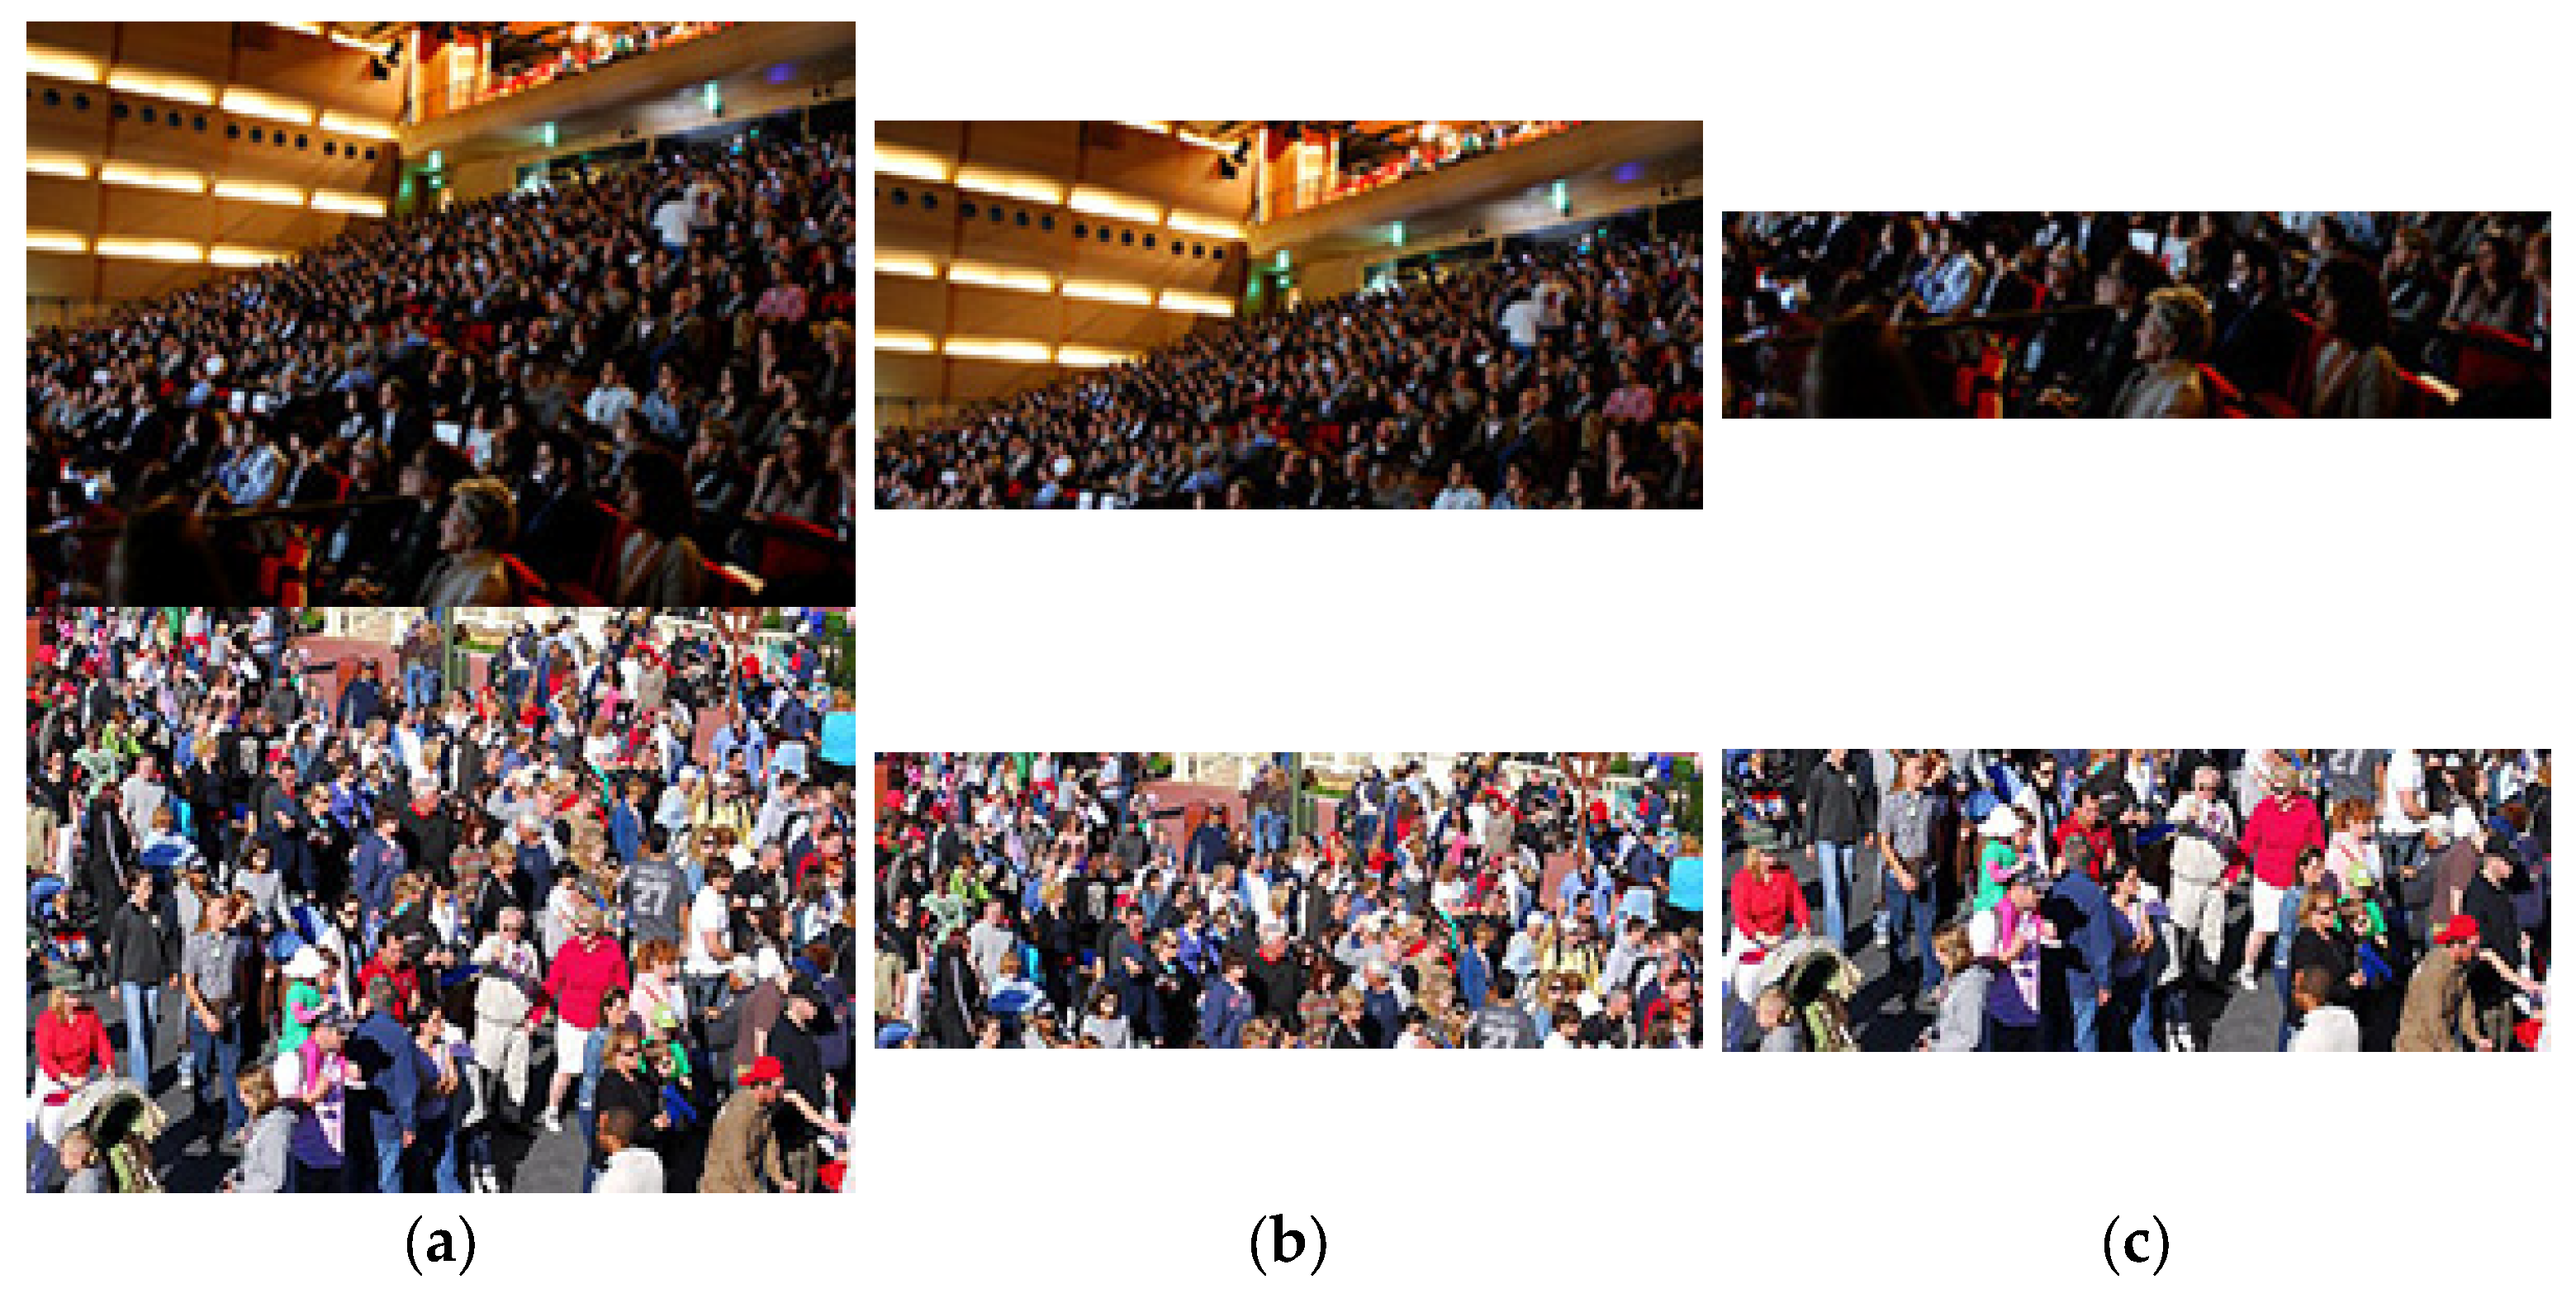
Figure 2.
Segmentation Based on Scene Adaption. (a): input image samples; (b): distant view image; (c): close-up view image. Two dense scene images are divided adaptively with the division ratio of 0.34 and 0.52, respectively.
Figure 2.
Segmentation Based on Scene Adaption. (a): input image samples; (b): distant view image; (c): close-up view image. Two dense scene images are divided adaptively with the division ratio of 0.34 and 0.52, respectively.

Figure 3.
Visual comparisons of different methods on ShanghaiTech Part_A. (a): the sample images. (b): the ground truth. (c–e) correspond to the estimated density maps from MCNN, CAT-CNN, and the proposed SASNet, respectively.
Figure 3.
Visual comparisons of different methods on ShanghaiTech Part_A. (a): the sample images. (b): the ground truth. (c–e) correspond to the estimated density maps from MCNN, CAT-CNN, and the proposed SASNet, respectively.

Figure 4.
The histogram of average counts estimated by different approaches on six density levels from ShanghaiTech Part_A dataset.
Figure 4.
The histogram of average counts estimated by different approaches on six density levels from ShanghaiTech Part_A dataset.


Table 1.
Details of ShanghaiTech, UCF_CC_50, and UCF_QNRF datasets.
| Dataset | Resolution | No. of Samples | Max | Min | Avg | Sum | |
|---|---|---|---|---|---|---|---|
| ShanghaiTech | Part_A | different | 482 | 3193 | 33 | 501.4 | 241,677 |
| Part_B | 768 × 1024 | 716 | 578 | 9 | 123.6 | 88,488 | |
| UCF_CC_50 | different | 50 | 4543 | 94 | 1279.5 | 63,974 | |
| UCF_QNRF | 2013 × 2902 | 1535 | 12,865 | 49 | 815 | 1,251,642 | |
Table 2.
Comparison Experiment on ShanghaiTech Part_A, UCF_CC_50, and UCF_QNRF datasets.
| Method | ShanghaiTech Part_A | UCF_CC_50 | UCF_QNRF | |||
|---|---|---|---|---|---|---|
| MAE | RMSE | MAE | RMSE | MAE | RMSE | |
| MCNN [5] | 110.2 | 173.2 | 377.6 | 509.1 | 243.5 | 364.7 |
| Switching CNN [28] | 90.4 | 135 | 318.1 | 439.2 | 228 | 445 |
| CMTL [18] | 101.3 | 152.4 | 322.8 | 397.9 | 252 | 514 |
| CSRNet [19] | 68.2 | 115 | 266.1 | 397.5 | 120.3 | 208.5 |
| PCCNet [29] | 73.5 | 124 | 240 | 315.5 | 149 | 247 |
| TEDnet [30] | 64.2 | 109.1 | 249.4 | 354.5 | 113 | 188 |
| DSSINet [31] | 60.6 | 96 | 216.9 | 302.4 | 99.1 | 159.2 |
| MMNet [32] | 60.8 | 99 | 209.7 | 309.7 | 104 | 178 |
| HyGnn [33] | 60.2 | 94.5 | 184.4 | 270.1 | 100.8 | 185.3 |
| AMS-Net [34] | 63.8 | 108.5 | 236.5 | 319.2 | 86.5 | 167.2 |
| COMAL [35] | 59.6 | 97.1 | 231.9 | 333.7 | 102.1 | 178.3 |
| SASNet (Ours) | 60.5 | 101.3 | 184.3 | 258.1 | 91.1 | 169.6 |
Publisher’s Note: MDPI stays neutral with regard to jurisdictional claims in published maps and institutional affiliations. |
© 2022 by the authors. Licensee MDPI, Basel, Switzerland. This article is an open access article distributed under the terms and conditions of the Creative Commons Attribution (CC BY) license (https://creativecommons.org/licenses/by/4.0/).
Share and Cite
MDPI and ACS Style
Gao, H.; Deng, M.; Zhao, W.; Zhang, D. Scene Adaptive Segmentation for Crowd Counting in Population Heterogeneous Distribution. Appl. Sci. 2022, 12, 5183. https://0-doi-org.brum.beds.ac.uk/10.3390/app12105183
AMA Style
Gao H, Deng M, Zhao W, Zhang D. Scene Adaptive Segmentation for Crowd Counting in Population Heterogeneous Distribution. Applied Sciences. 2022; 12(10):5183. https://0-doi-org.brum.beds.ac.uk/10.3390/app12105183
Chicago/Turabian StyleGao, Hui, Miaolei Deng, Wenjun Zhao, and Dexian Zhang. 2022. "Scene Adaptive Segmentation for Crowd Counting in Population Heterogeneous Distribution" Applied Sciences 12, no. 10: 5183. https://0-doi-org.brum.beds.ac.uk/10.3390/app12105183
Note that from the first issue of 2016, this journal uses article numbers instead of page numbers. See further details here.