
Pure Electric Sweeper Performance Analysis and Test Verification of Dust Extraction Port


1
School of Mechanical Engineering, Anhui Polytechnic University, Wuhu 241000, China
2
Anhui Airuite New Energy Special Vehicle Co., Ltd., Wuhu 241200, China
*
Author to whom correspondence should be addressed.
Appl. Sci. 2022, 12(10), 5188; https://0-doi-org.brum.beds.ac.uk/10.3390/app12105188
Submission received: 19 April 2022
/
Revised: 17 May 2022
/
Accepted: 19 May 2022
/
Published: 20 May 2022
(This article belongs to the Special Issue Advances on Structural Engineering, Volume III)
Abstract
:Purely electric sweepers are widely used in the urban sanitation industry due to their emission-free nature and ease of miniaturisation. The dust suction port is the key to the dust suction system of the sweeper, and improving the design level of the dust suction port of the sweeper can effectively improve the operational performance of the sweeper. Using the company’s self-developed Ruiqing S26 pure electric sweeper as the research object, a CFD (Computational Fluid Dynamics) method was used to analyse the influence of the dust suction port structure parameters (front baffle tilt angle, outlet diameter) and sweeper operation parameters (driving speed, operating pressure) on the dust suction effect of the sweeper, and was verified through real vehicle tests. The results of the study show that changing the angle and outlet diameter results in a change in the flow field characteristics and, consequently, the same change in the removal efficiency, with 65° and 160 mm being the optimum angle and outlet diameter, respectively. The tests investigated the flow field characteristics of the dust extraction opening and the removal efficiency. This study can provide theoretical reference for performance optimisation and parameter matching of the sweeper.
1. Introduction
Purely electric sweepers are widely used in urban roads, airports, and scenic areas due to their advantages such as no emissions and ease of miniaturisation [1]. In recent years, with the rise of new energy vehicles and intelligent networked vehicles, driverless sweepers are expected to take the lead in commercial applications soon, due to their operating environments of specific scenarios or closed areas [2]. Therefore, the new development of the pure electric sweeper industry has put forward higher requirements for the performance of sweepers [3]. On the one hand, the sweeper’s operating efficiency should be higher and it should be able to operate at high performance while unmanned or in a less crowded environment; on the other hand, the matching relationship between the operating parameters of the sweeper’s sweeping systems should be clearer, providing a decision basis for the sweeper’s unmanned operation.
Researchers have carried out extensive research into the operational effectiveness of sweepers. The innovative design and optimisation of the dust suction opening structure of the sweeper can effectively improve the performance of the sweeper. Qin et al. [4] proposed adding an air inlet channel behind the dust suction port to enhance the airflow’s ability to carry particles, and demonstrated the feasibility of the improved model through experiments. Hu et al. [5] used a multi-objective interval optimisation algorithm to optimise the structure of the dust suction port and obtained the optimal combination of parameters. The results showed that changing the parameters resulted in an improved outlet particle mass flow rate and reduced inlet and outlet pressure losses. With the popularity of computer technology, the application of CFD technology and the use of simulation software for parametric analysis of the research object have gradually become a trend. Yang et al. [6] used CFD to analyse the effect of parameters such as width and outlet diameter on the airflow velocity and pressure inside the suction port and to improve the original structure. Huang et al. [7] also used CFD techniques to analyse the flow field of a traditional suction nozzle with a rectangular structure by varying the horizontal inclination of the side plate, the height of the rear baffle, the inclination of the rear plate, the lead angle of the side plate, the radius of the front plate and the diameter of the suction tube. The increase in the horizontal inclination of the side plate and the diameter of the suction pipe, the decrease in the plumb inclination of the side plate and the reduction in the height of the rear baffle all contribute to the overall improvement of the suction effect in terms of speed and pressure. WU et al. [8] found that operating parameters such as driving speed and negative pressure of the sweeper had a significant impact on the efficiency of dust extraction, and that the optimum operating parameters were obtained with a balance of high dust removal rates and low energy consumption. The optimal operating parameters were obtained with a balance of high dust removal rate and low energy consumption. In recent years, back-blowing air suction ports as well as rolled suction ports have appeared in the public eye. In the study of Xi et al. [9,10,11,12,13], by analysing the structural parameters of the back-blowing suction nozzle and the back-blowing air volume, it was found that increasing the diameter and tilting angle of the nozzle could improve the removal efficiency, while the vehicle speed had a greater influence on the removal efficiency. Zhang et al. [14,15] studied the structure of blowing and suction cleaning in the area between underground tracks and found that the width ratio and height ratio between the nozzle and suction nozzle directly affect the cleaning efficiency, while a nozzle and suction nozzle tilt angle of 20° achieve the best cleaning effect. The rolled suction port uses a tornado of dust generated by a specific device. Liu et al. [16] first proposed the use of the tornado principle for dust extraction, used flow field simulation to analyse the new dust extraction device, and finally came up with a set of optimal parameters to maximise efficiency of dust removal. Wu et al. [17] carried out a comparative study of pure suction and tornado wind suction, and found that by making full use of the properties of the wind suction, a wide range of suction could be achieved. Existing studies provide a good reference for the structural design and performance analysis of dust extraction ports on sweepers, but they all focus on a single aspect, analysing the effect of changing structural parameters on airflow velocity and pressure, etc., and do not provide a more direct and in-depth picture of the effect on dust extraction efficiency, resulting in a lack of correlation between mechanistic analysis and experimental verification.
Using the self-developed Ruiqing S26 pure electric sweeper as the object of analysis, the CFD method is used to simulate the airflow in the dust suction opening using a turbulence model, and the flow field characteristics are reflected by the airflow velocity at the forward air surface and the pressure at the entrance of the exhaust pipe. In addition, the Euler–Lagrange method is used to analyse the trajectory of the dust particles in the dust extraction port and to evaluate the removal efficiency by defining an expression for the removal efficiency. A systematic correlation analysis is carried out to reveal the intrinsic influencing mechanism and to find an optimisation method to establish the best design solution; finally, the numerical simulation results are verified by means of a real vehicle test of the flow field characteristics and the removal efficiency. This study provides a theoretical reference for the performance optimisation and parameter matching of floor sweepers.
2. Numerical Simulation and Experimental Research Methods
2.1. Study Subjects
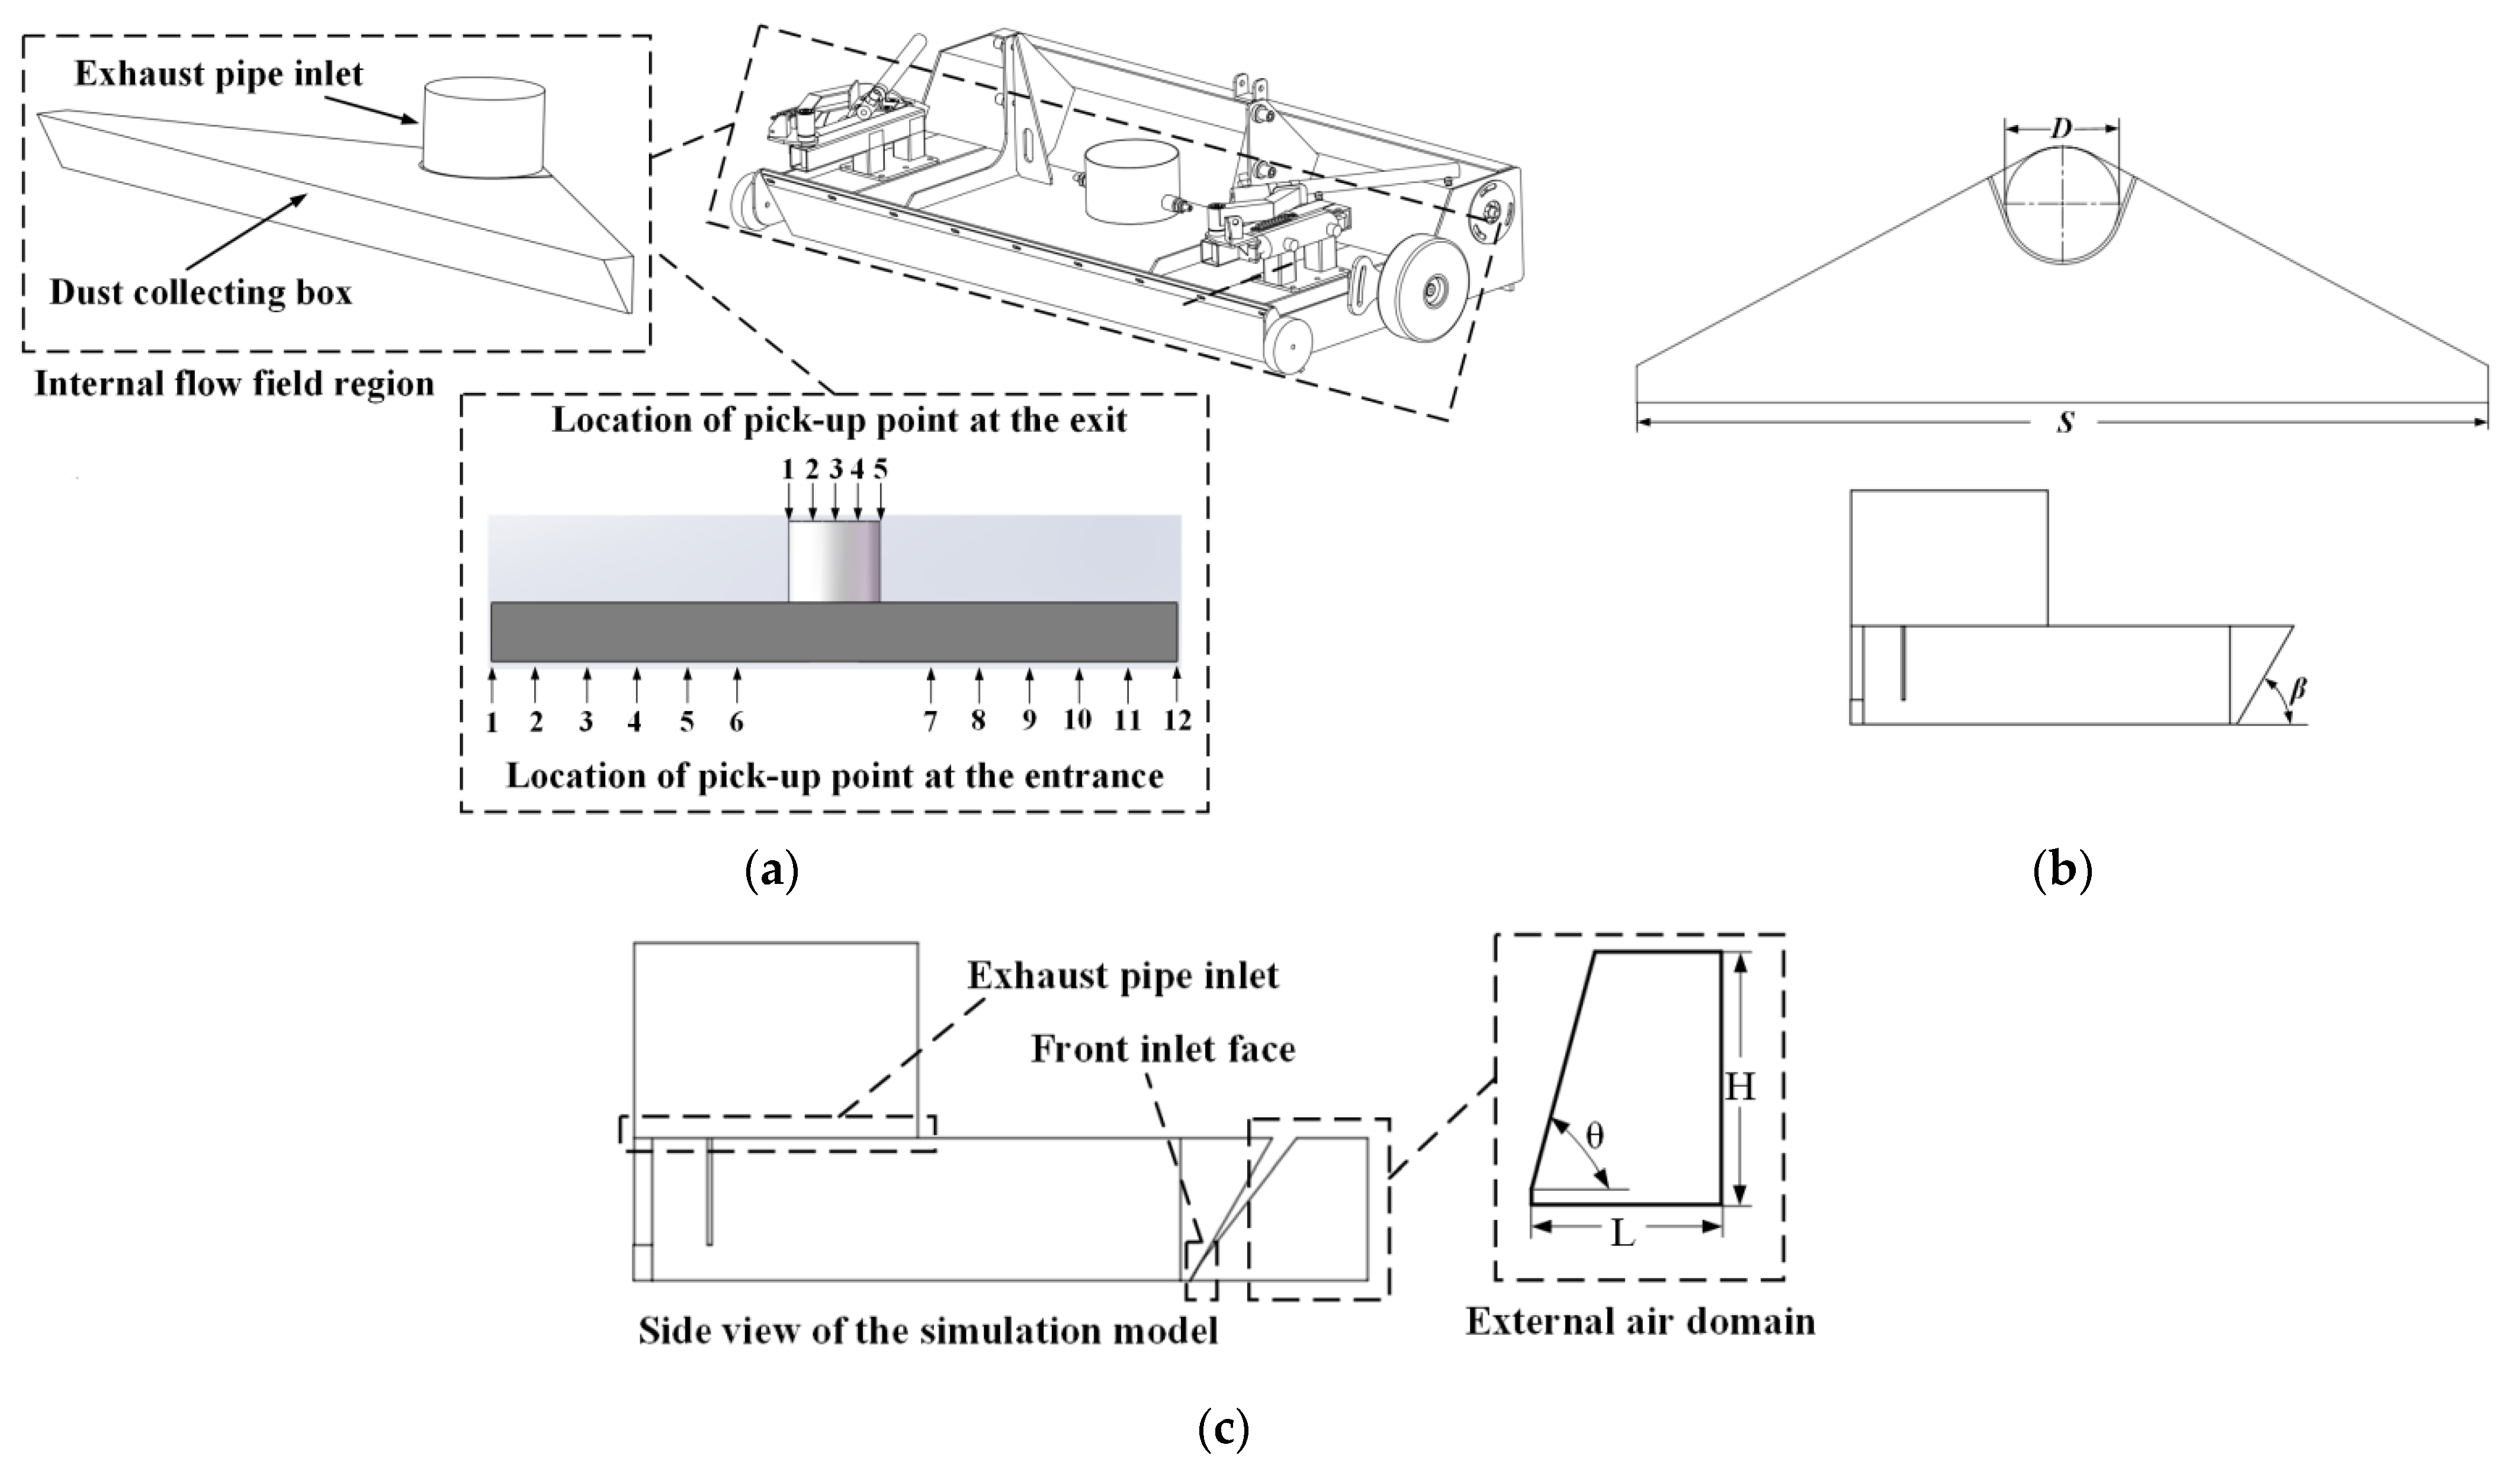
Figure 1a shows the simulation model and the location of the points. As the suction method used in this test is pure suction and the effect of dust lifting is not considered, only the front of the suction outlet is used as the simulation model. In the simulation, 12 points were taken at the entrance to measure the air speed and 5 points at the exit to measure the wind pressure; the specific locations of the points are shown in Figure 1a. In addition, the S26 sweeper studied in this paper has three modes: energy-saving, normal and high-efficiency. The three modes correspond to the three pressures of 2400 Pa, 2800 Pa and 3200 Pa, respectively, so three different pressures are used here for simulation. The structural parameters of the simulation model are given in Figure 1b, where D is the exhaust outlet diameter, S is the length of the dust suction port, and β is the inclination angle of the front inlet surface. The specific dimensions are shown in Table 1 below. Figure 1c gives the parameters of the external air domain structure, where L is the length of the external air domain, H is the height of the external air domain, and θ is the angle between the inclined plane and the horizontal plane of the external air domain.
2.2. Numerical Simulation
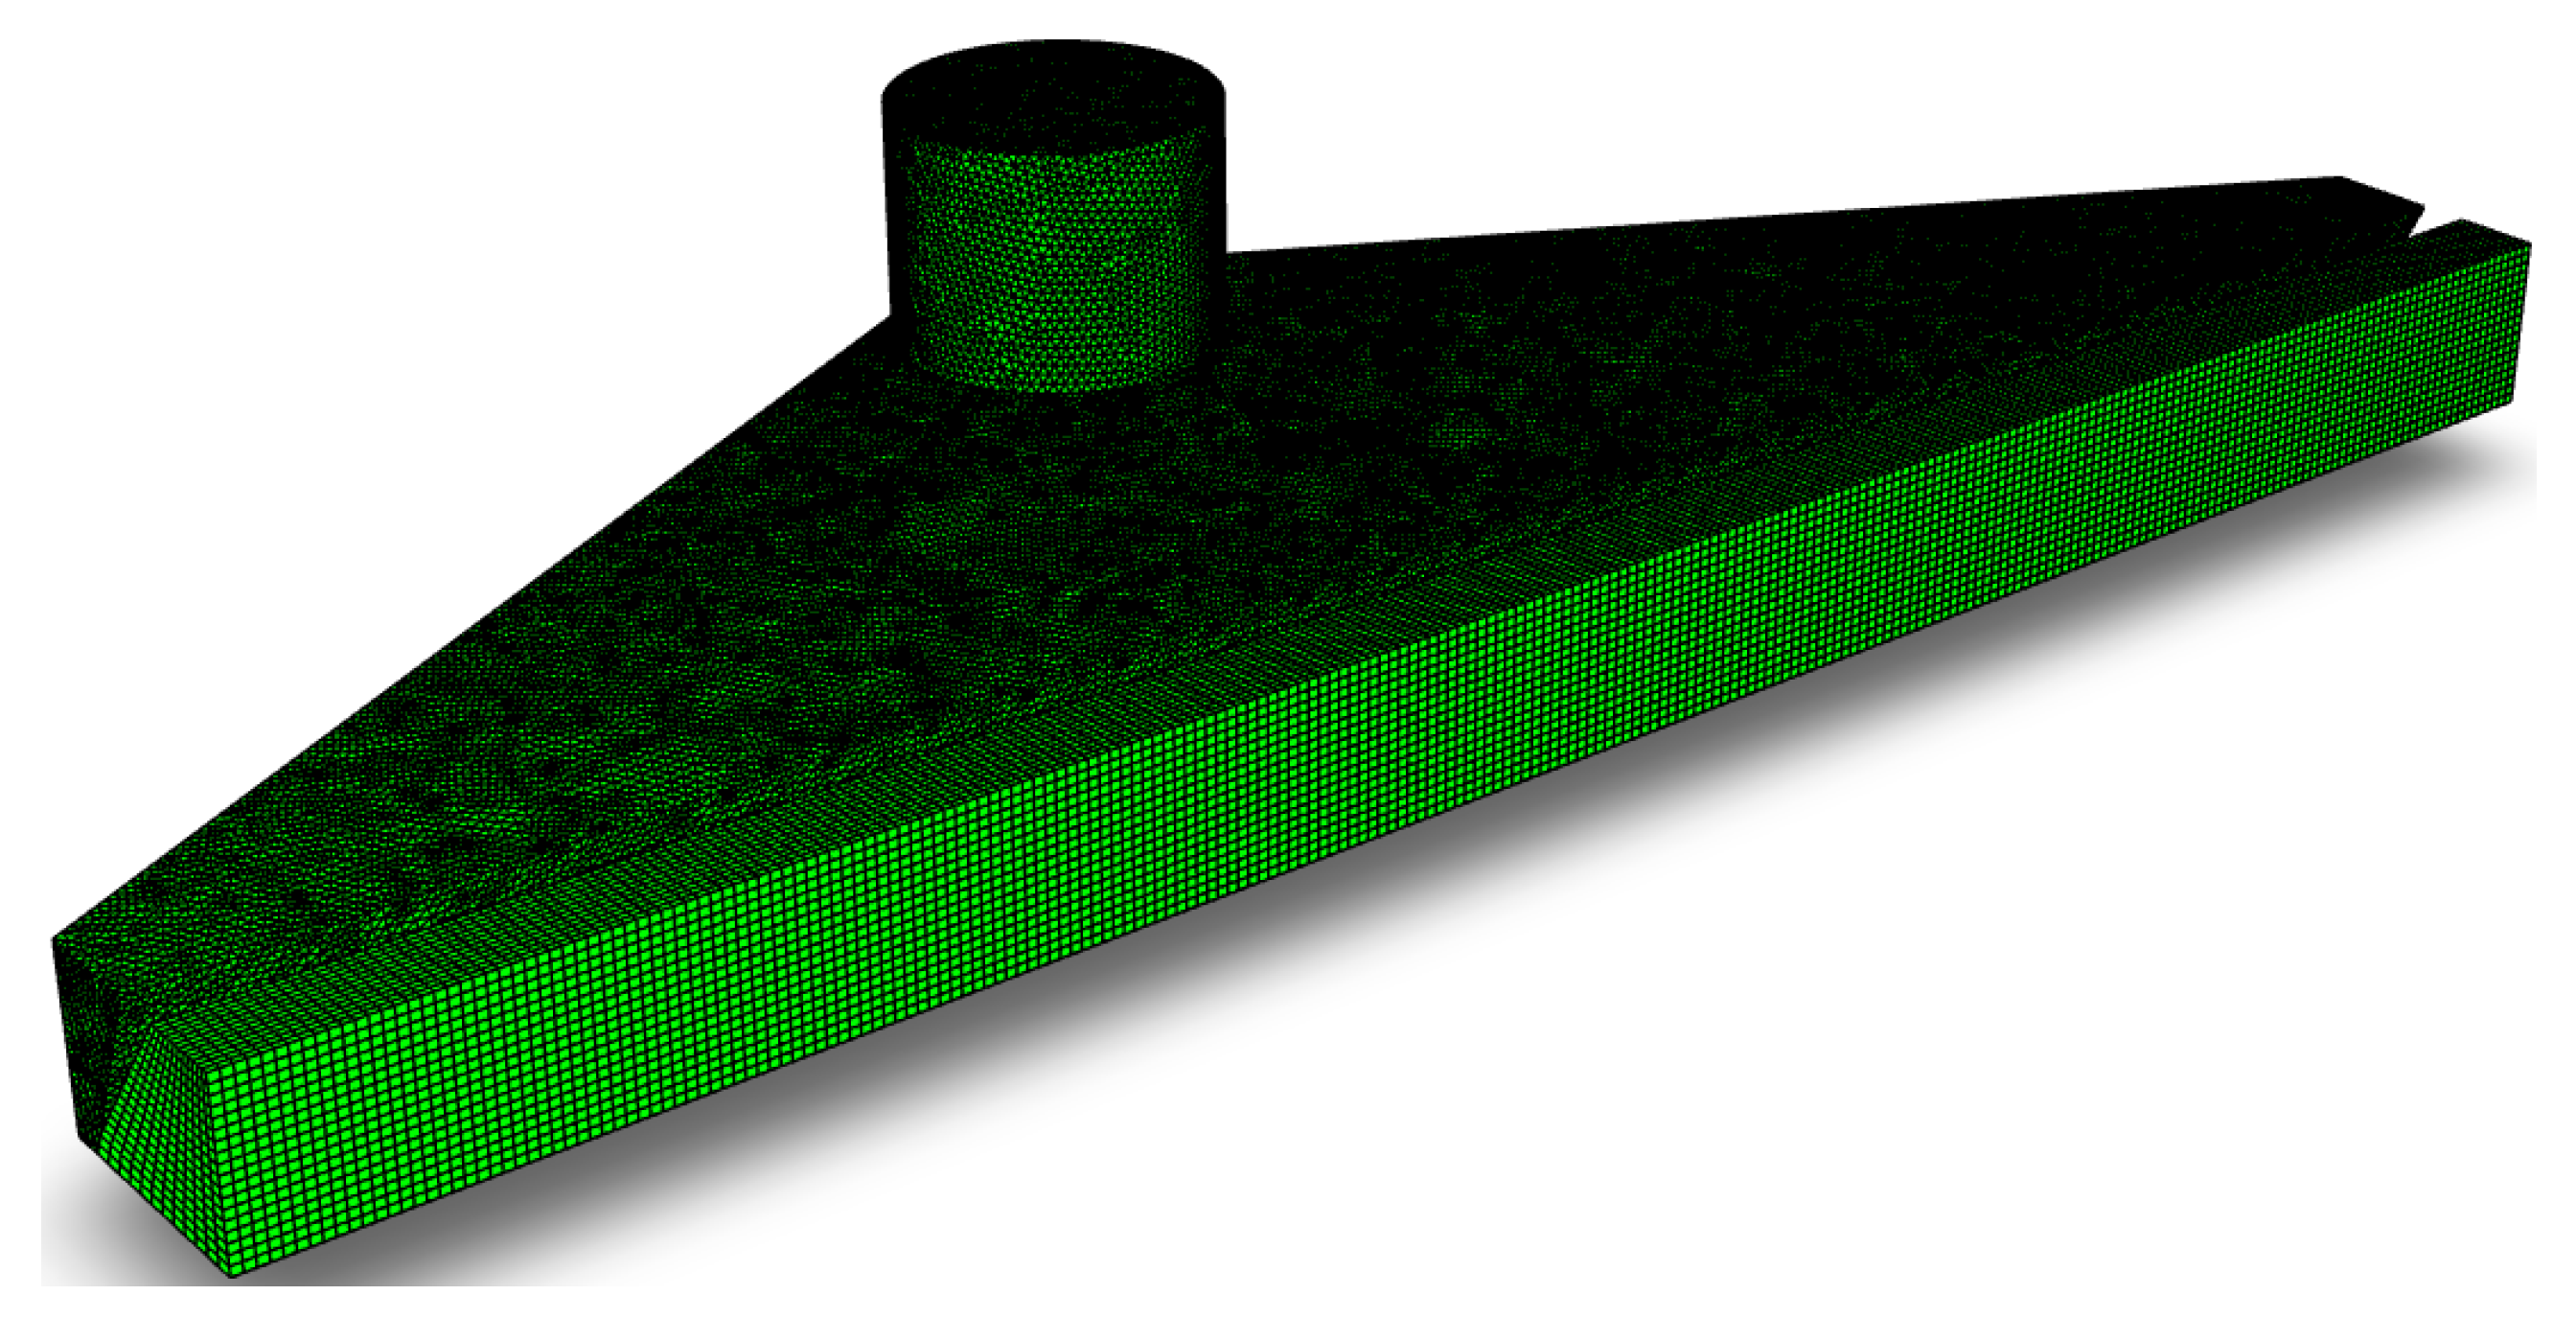
The mesh schematic of the simulation model is given in Figure 2, which in this simulation is unstructured. The overall computational domain is divided into the external air domain and the internal flow field region. A tetrahedral mesh is used for the internal flow field of the dust extraction port, while a hexahedral mesh is used for the external air domain, with a mesh number of 638,587.
The literature [18] gives the conditions for the determination of the flow field, and combined with the Reynolds number formula, it can be found that the Reynolds number in this model is greater than 4000, so the model should use the turbulence model. There are three types of turbulence models, as follows: Standard, RNG, and Realizable. In this paper, the Realizable turbulence model is chosen, which is better able to simulate moderately complex flows such as jets and cyclones than the other two models. The airflow in the suction port is the carrier of the dust particles and the airflow should be in continuous phase, so the Navier–Stokes equation should be used to solve for the gas phase flow. The gas-phase flow should be in accordance with the continuity equation, conservation of mass and conservation of momentum [19].
where m is the quality, ρ is the airflow density and Ω is the volume. ua and ga are the velocity components in different coordinate directions, p is the pressure, μ1 is the viscosity coefficient and τab is Reynolds stress.
During the grit pick-up process, the discrete phase particle volume fraction is low compared to the continuous phase airflow volume fraction, so the gas-solid two-phase flow is a dilute phase flow [20]. The particle equation of motion is used to analyse the gas-solid flow process inside the suction port using the Euler–Lagrange method [21].
Particle equations of motion:
where x is the particle parameter, m is the dust particle mass, u is the dust particle velocity, FM is the viscous force, G is the gravitational force and FN is the lifting force.
The viscous force is calculated as follow [22]:
where μ2 is the viscosity coefficient, CD is the drag coefficient, ρx and dx are the density and diameter of particles, Rex is the Reynolds number of particles and u is the air rate.
The drag coefficient calculated as follow [23]:
Reynolds number:
Gravitational force:
The lifting force is calculated by the following equation [24]:
where k generally taken as 2.594, v2 is the sport viscosity and dij, dlk, and dkl are the tensor variables.
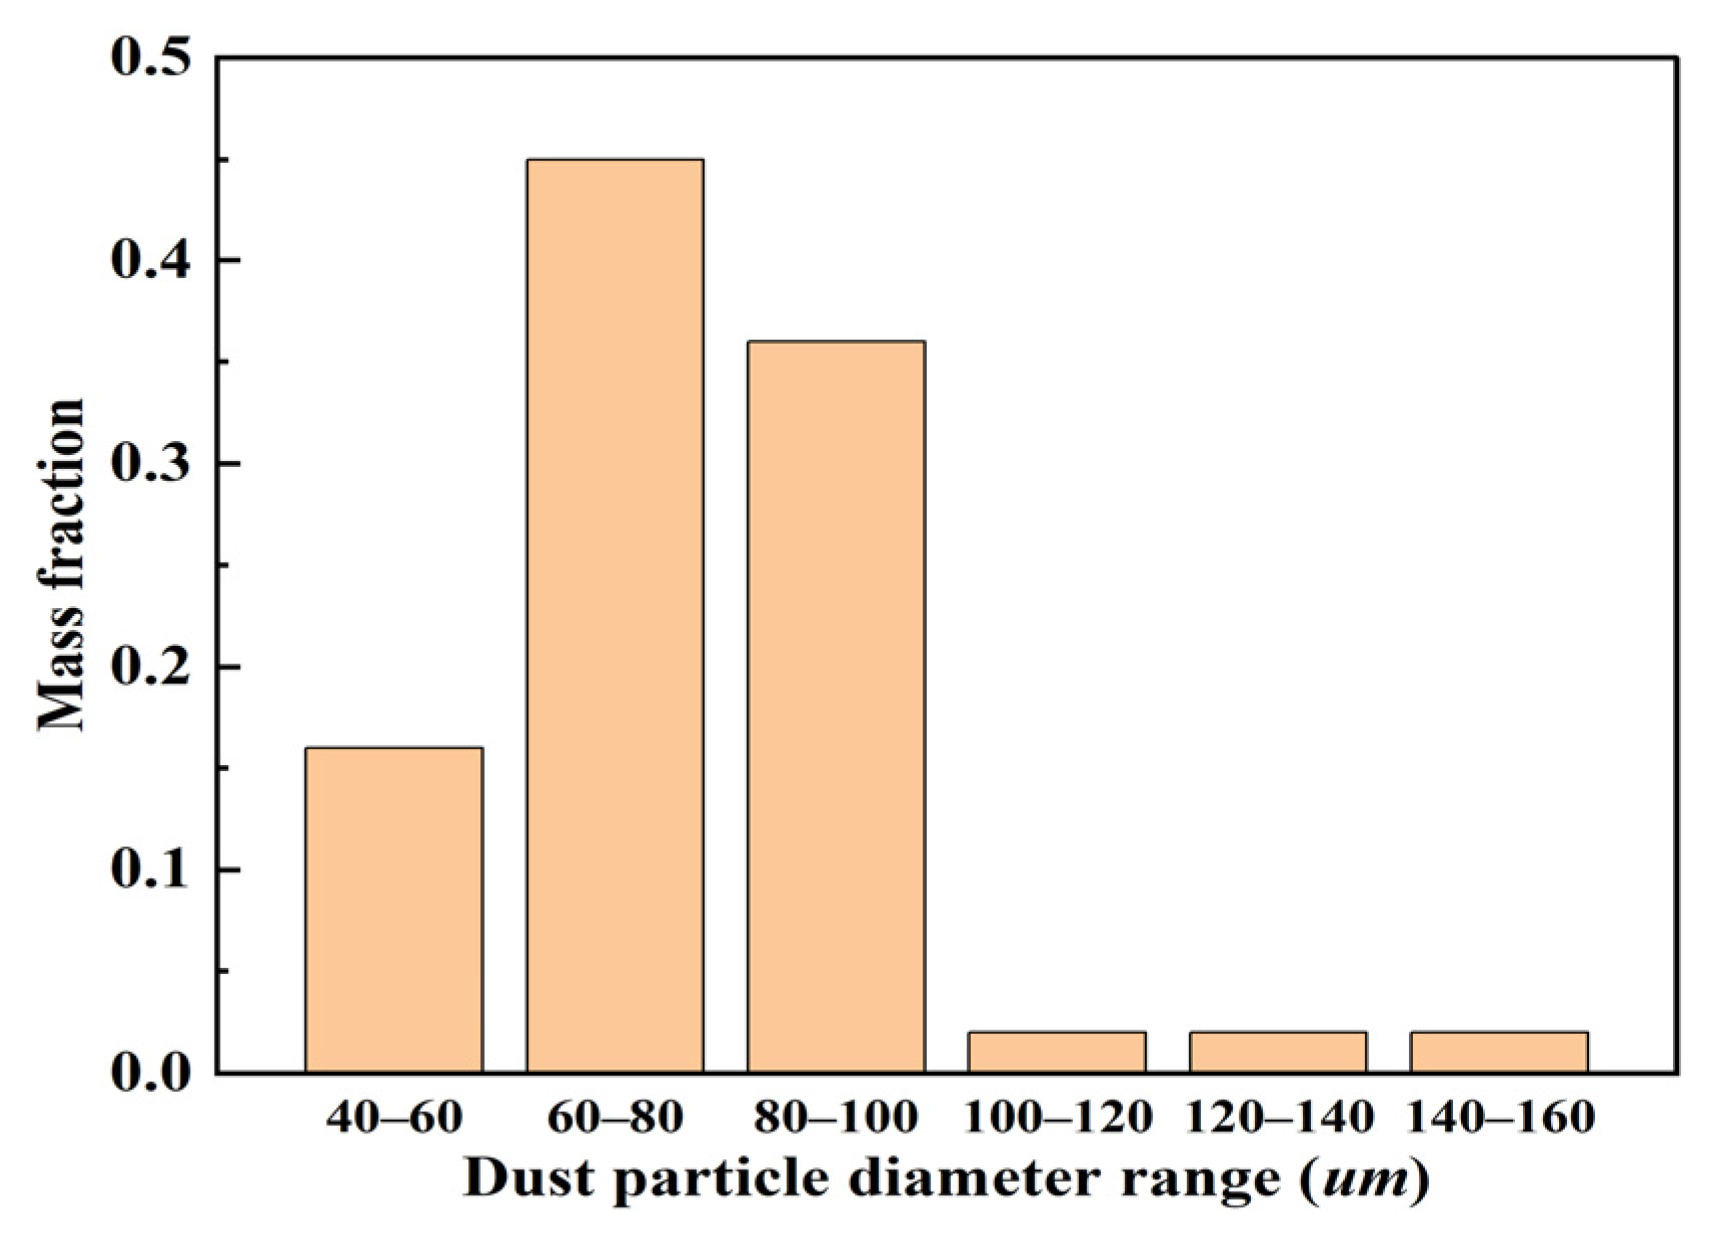
The particle distribution of the pavement particles in the simulation was adopted from the particle distribution proposed by Wu et al. [8], and the specific distribution and main parameters are shown in Figure 3 and Table 2.
The particles are in suspension when their own gravity is equal to the force of the air flow. Only when the airflow force is greater than its minimum value will the particle begin to move [25]. The particle movement velocity is the minimum air speed at which the particle starts to levitate, so the minimum velocity (u1) at which the particle moves is as follows [26]:
where ρs is the particle density, d is the particle size, g is the gravity acceleration and B is the experience coefficient.
Referring to the study by Hu et al. [27], it can be concluded that the maximum start-up velocity for dust particles with a diameter of less than 3 mm is 20 m/s. A jet source is used at the inlet of the dust suction port to release the particles and the boundary condition is set to escape, where the particles enter the interior of the dust suction port uniformly from the dust suction inlet. The boundary condition is reflect at the inside of the suction port and the exit boundary is trap. The particles are trapped at the exit of the exhaust pipe during the simulation, while the tracking of the particles stops. The removal efficiency is expressed by the ratio of the number of particles collected at the outlet (trap) to the total number of particles incident (tracked) [28].
η1 = trap/tracked
In a realistic working environment, the pressure, velocity and flow rate of the airflow entering the forward surface of the suction port are unknown, so in order to realistically simulate the working environment of the suction port, an external air domain needs to be added outside the port [29]. In conjunction with the study by Zhang et al. [30], it is clear that the geometric parameters of the external expansion domain directly affect the accuracy of the simulation. When the geometrical parameters are larger than a threshold value, the effect can be neglected. For different structures of dust extraction ports, the threshold value of the geometric parameter of the external expansion domain should be found and selected as the value of the geometric parameter in the calculation when the computational accuracy and computational efficiency of the simulation results are required to be high.
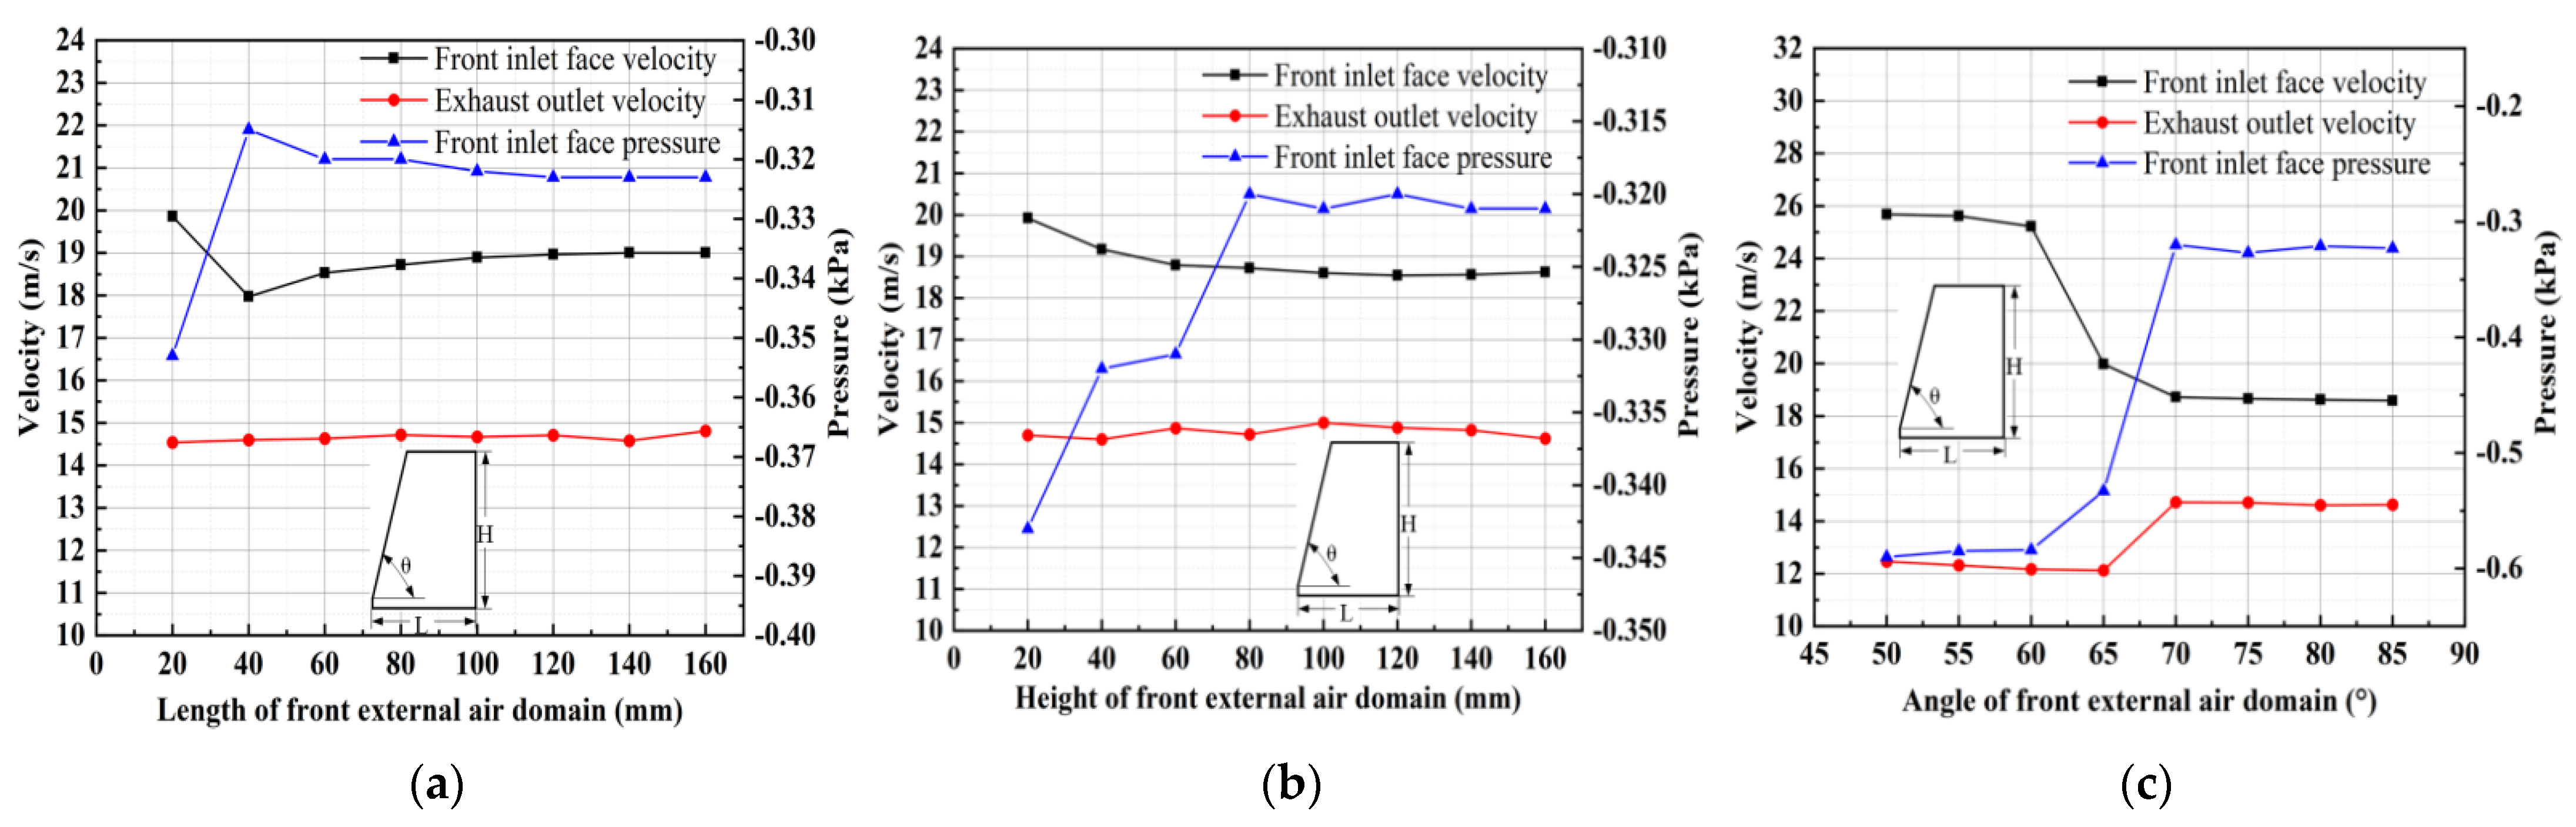
Figure 4 shows the influence of the geometric parameters of the external expansion domain on the accuracy of the calculation. Here the influence of the length L, height H and angle θ of the external expansion domain on the air velocity and pressure at the forward air surface and the air velocity at the exit of the exhaust pipe is investigated by varying the length L, height H and angle θ to obtain the optimum geometric threshold. The optimum thresholds are 60 mm for the length, 80 mm for the height and 70° for the angle.
2.3. Experimental Study
The Ruiqing S26 pure electric road sweeper is mainly used for general sweeping work on main roads and tutorial roads, integrating sweeping, high-pressure flushing, sewage recycling, etc. It can quickly sweep leaves, stones, sand and dust, white rubbish, etc. It has the functions of simultaneous collection of rubbish and sewage, and high-level self-dumping. Its specific technical parameters are shown in Table 3 below.
Figure 5 shows the physical diagram and test site diagram of the S26 sweeper. This paper has been designed to investigate the flow field characteristics at different negative pressures and to investigate the vacuum efficiency at different driving speeds and negative pressures. These tests were carried out without the use of an auxiliary brush or lance; i.e., only the flow field characteristics and efficiency of the pure suction nozzle itself were investigated. As the flow field characteristics cannot be measured in the driving condition because the suction nozzle needs to be connected to the corresponding test equipment, only the flow field characteristics at different negative pressures are investigated here. When investigating the flow field characteristics under different negative pressures, the test uses the DP1000-IIIB digital pressure anemometer with L-type pitot tube; the charge amplifier uses the WS-2401 charge, voltage, filter, and integral four-function amplifier; the data acquisition instrument uses the WS-5931N/N240204 data acquisition instrument. Before the test to investigate the removal efficiency at different driving speeds and negative pressure, 14 kg of dust on the road was weighed and the distribution density of dust particles was about 0.15 kg/m2, thus simulating a more serious dust load on the road [9]. After the test, the dust collected in the bin was weighed to determine the removal efficiency. To ensure the reliability of the tests, each set of tests was repeated three times in both parts of the test and the average value was taken as the final result.
When measuring the flow field characteristics at different negative pressures, three sets of data were measured at the same position to ensure reliable and stable results, and the data were processed by taking the average value [31]. The error was calculated as follows.
When measuring the removal efficiency at different travel speeds and negative pressures, the removal efficiency was calculated using the following formula.
where: η2 is the removal efficiency, m2 is the total mass of dust in the bin, m1 is the total mass of dust on the road before sweeping.
The error is calculated as follows [9].
where: Δp is the error, pCalculated is the simulated calculated value, pTest is the test measured value.
3. Numerical Simulation Results and Analysis
3.1. Simulation Results of Flow Field Characteristics at Different Negative Pressures
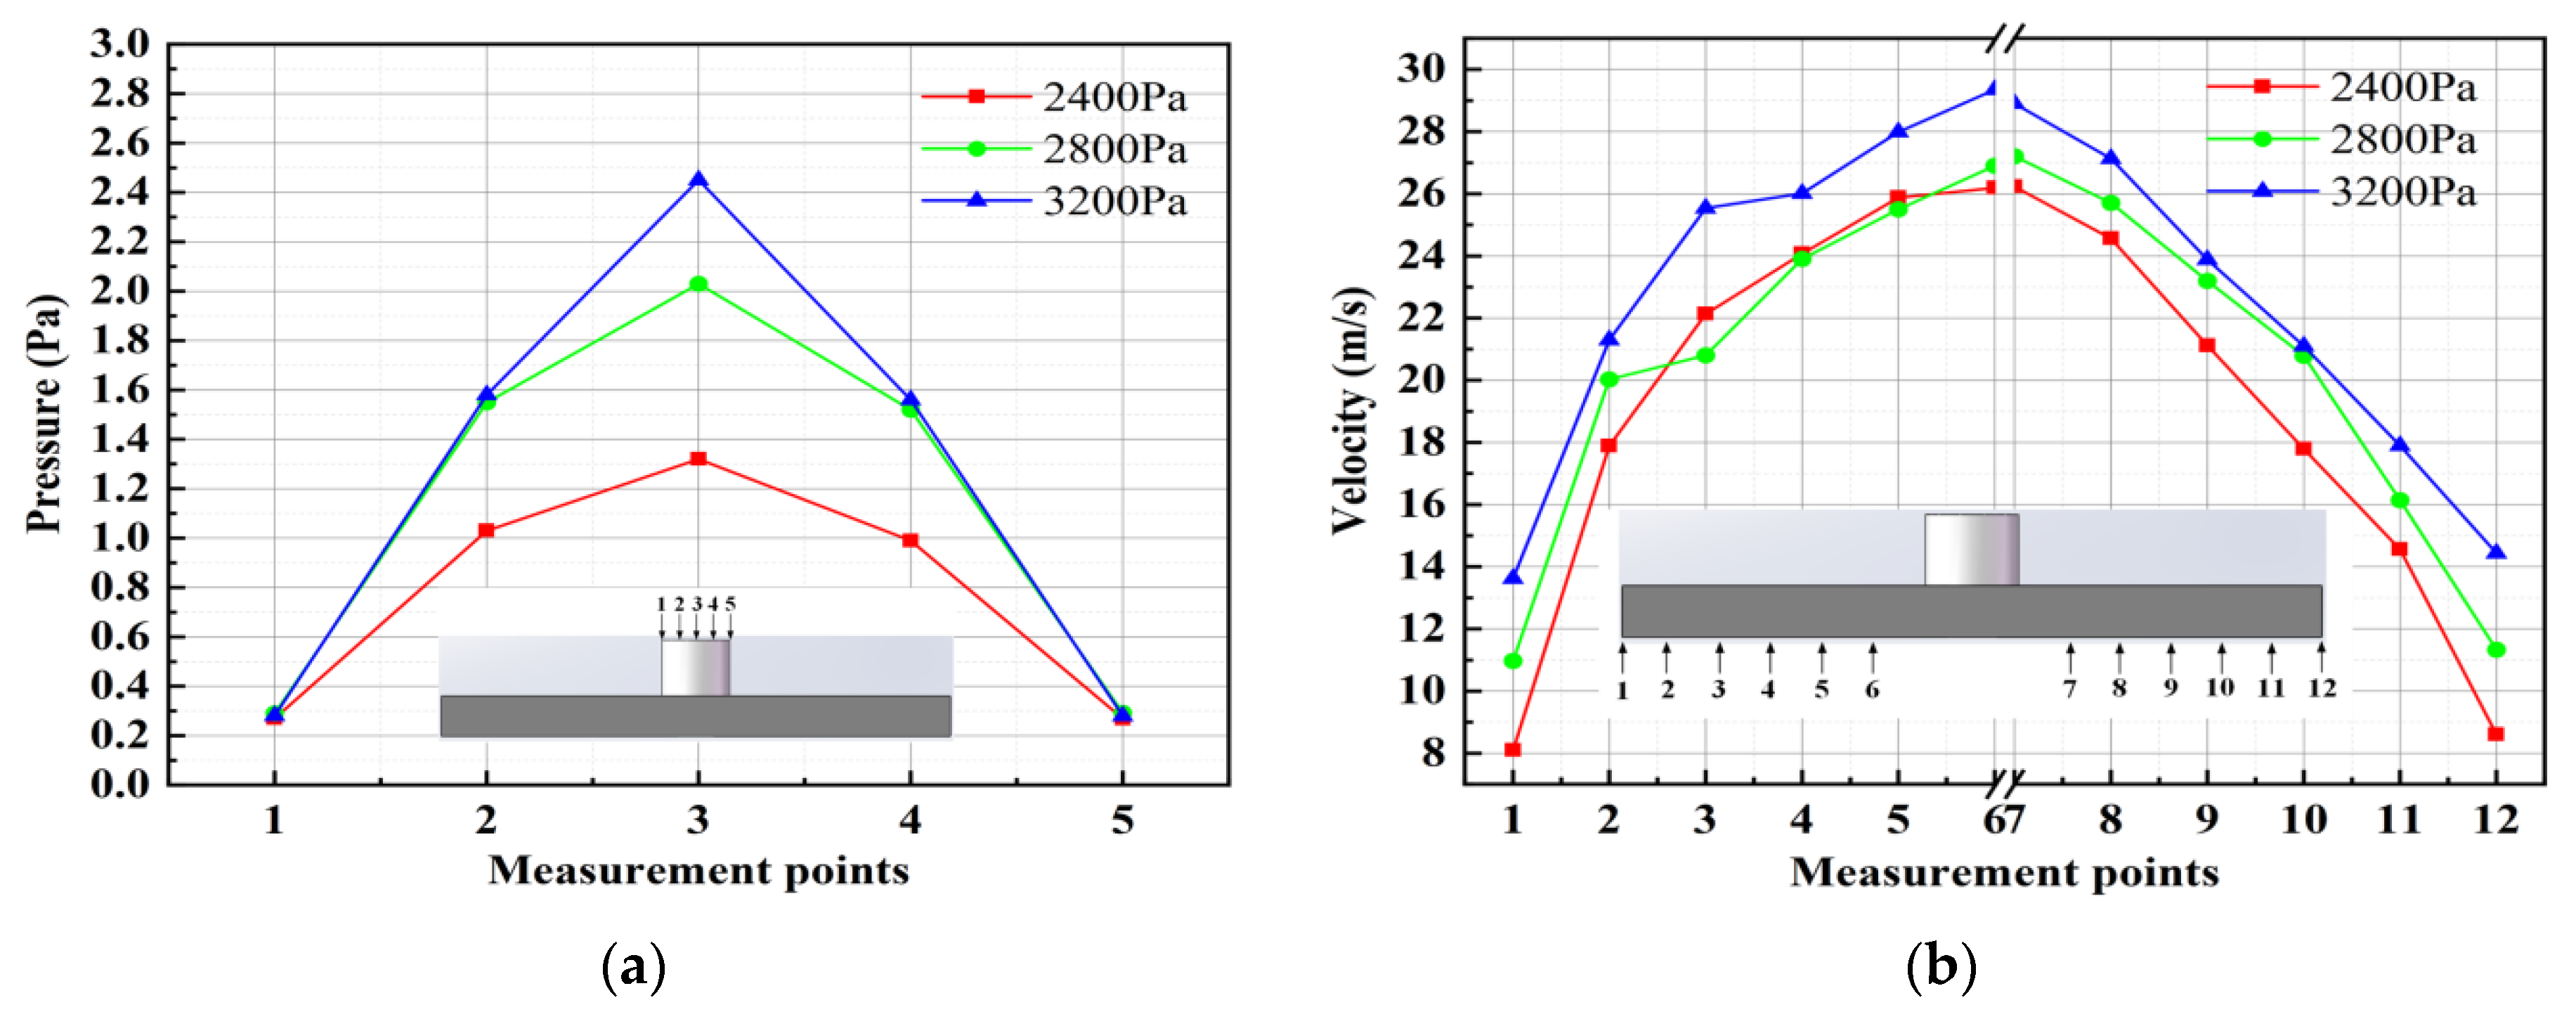
The simulation results of the flow field characteristics at different negative pressures are given in Figure 6, where Figure 6a gives the simulated values of the wind pressure at different negative pressures at different measurement points at the outlet. Figure 6b shows that the higher the negative pressure, the higher the air speed at the inlet; in addition, the air speed near the centre of the inlet is significantly higher than that at the edge.
3.2. Simulation Results of Dust Extraction Efficiency at Different Driving Speeds and Negative Pressures
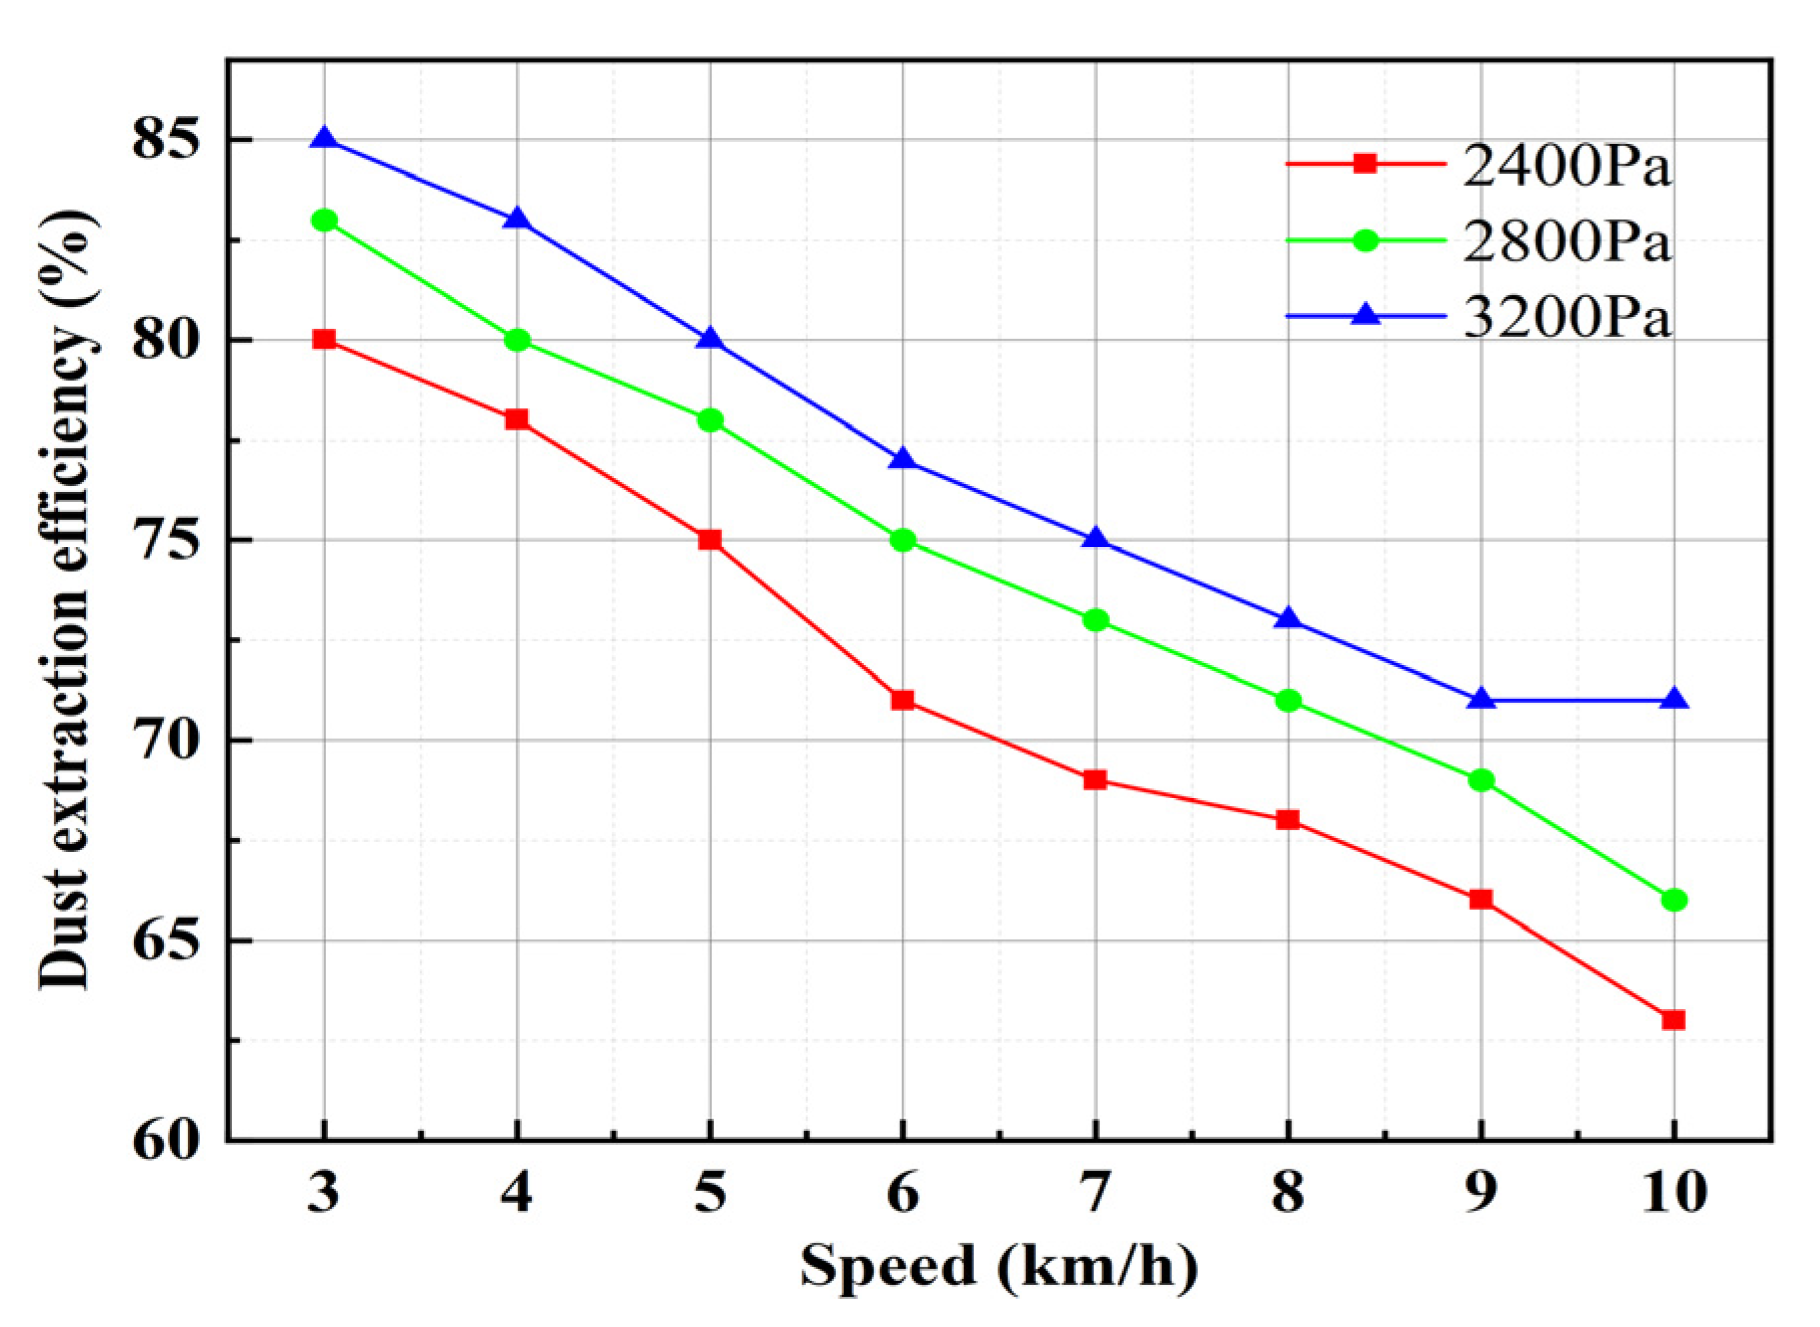
Figure 7 gives the simulation results of removal efficiency under different driving speeds and negative pressure; from the figure it can be seen that, with the same driving speed, the greater the negative pressure, the greater the removal efficiency. With the increase of the driving speed, the efficiency of dust absorption tends to decrease. The increase in vehicle speed leads to an increase in the relative velocity between the intake surface and the particles, with a large number of particles moving towards the intake surface at a faster rate. At this point the larger particles, due to inertia, collide with the inner wall as they are drawn in, while escaping through the ground clearance. Therefore, it is clear that increasing the vehicle speed leads to a decrease in the vacuuming efficiency. Combined with Figure 5, it can be seen that an increase in pressure increases all flow field parameters. Given that particles start to move because of the negative pressure provided with the kinetic energy, increasing the pressure allows many particles to be picked up and increases the efficiency of dust extraction.
3.3. Parameter Impact Analysis
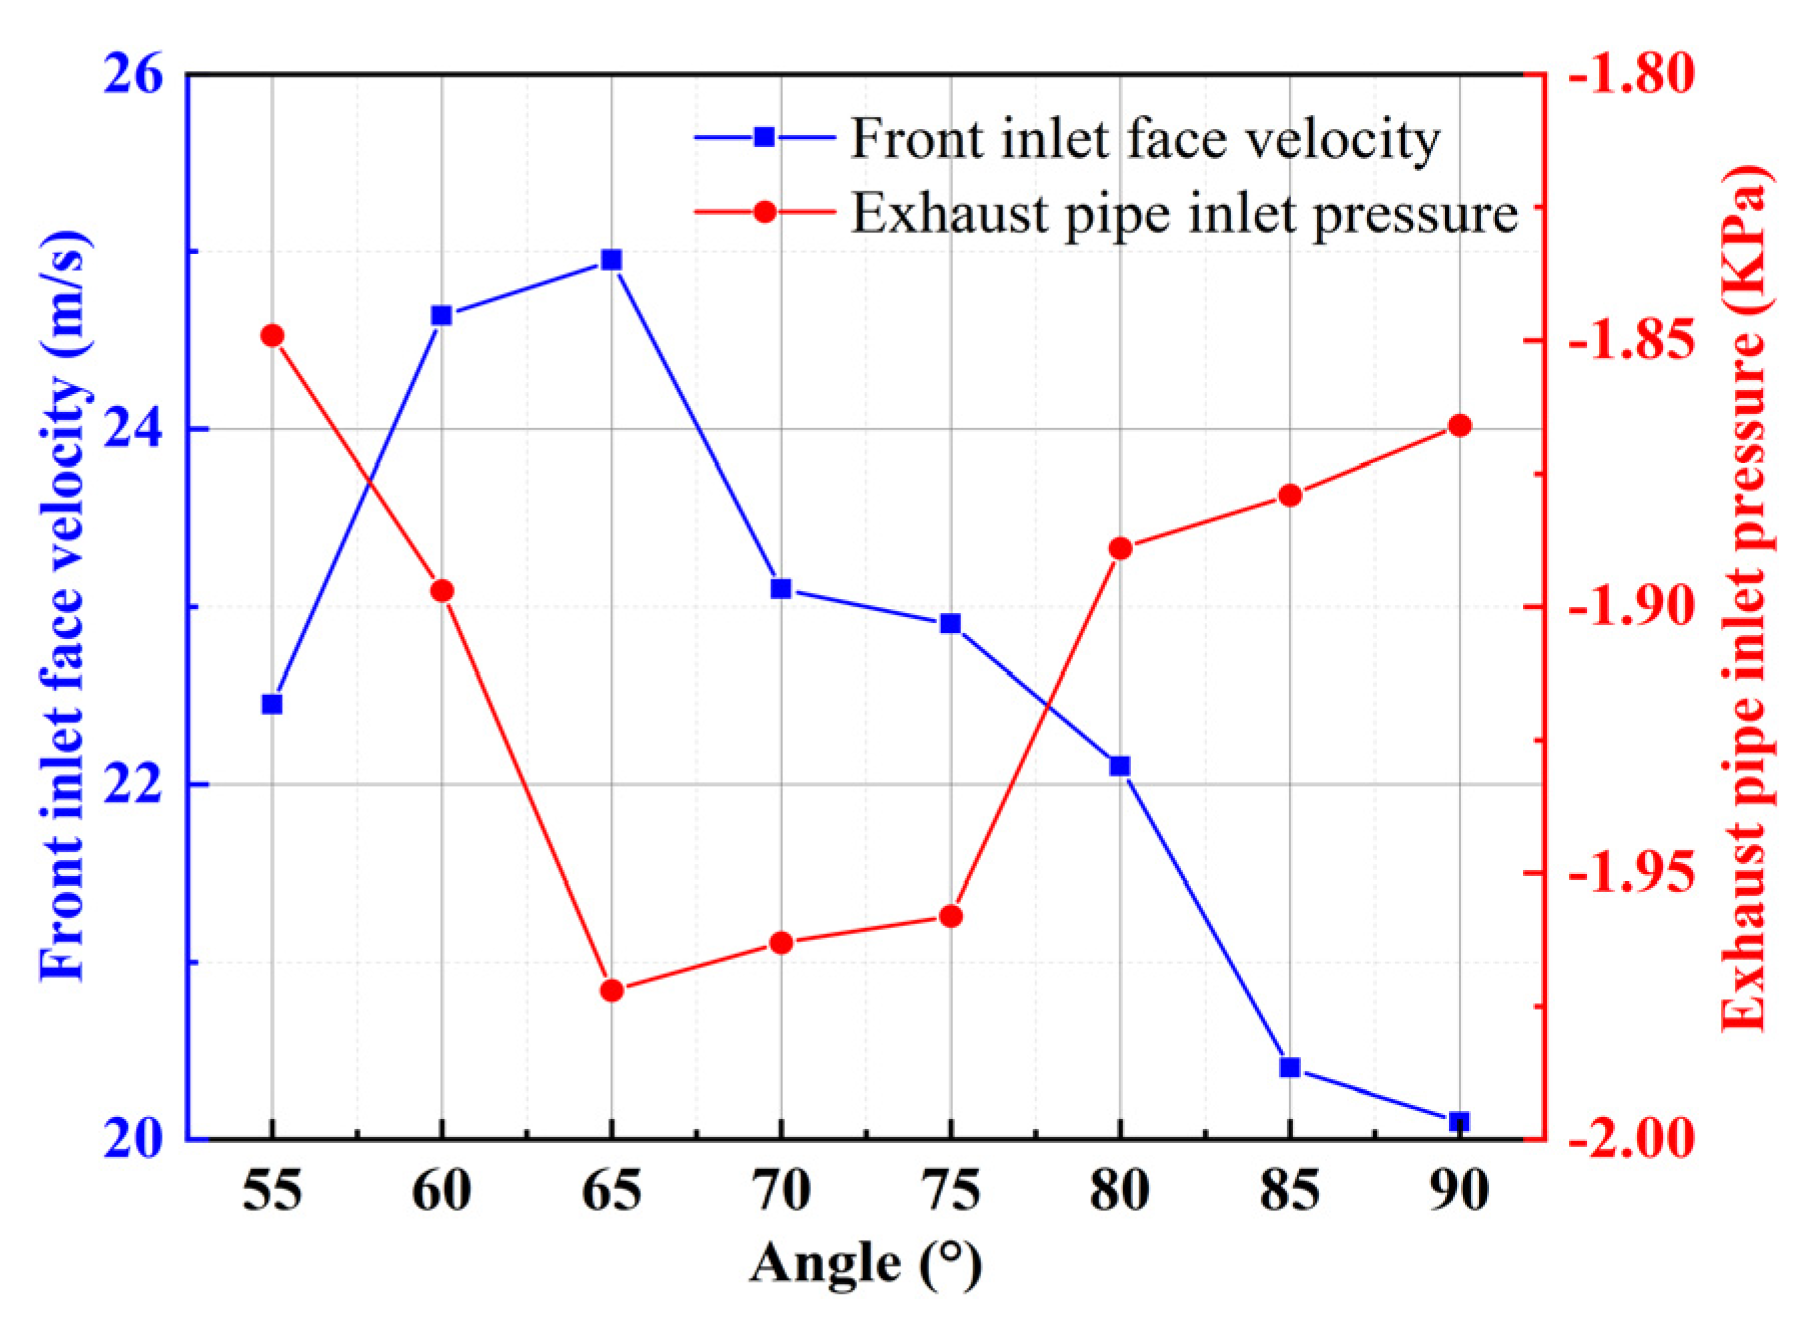
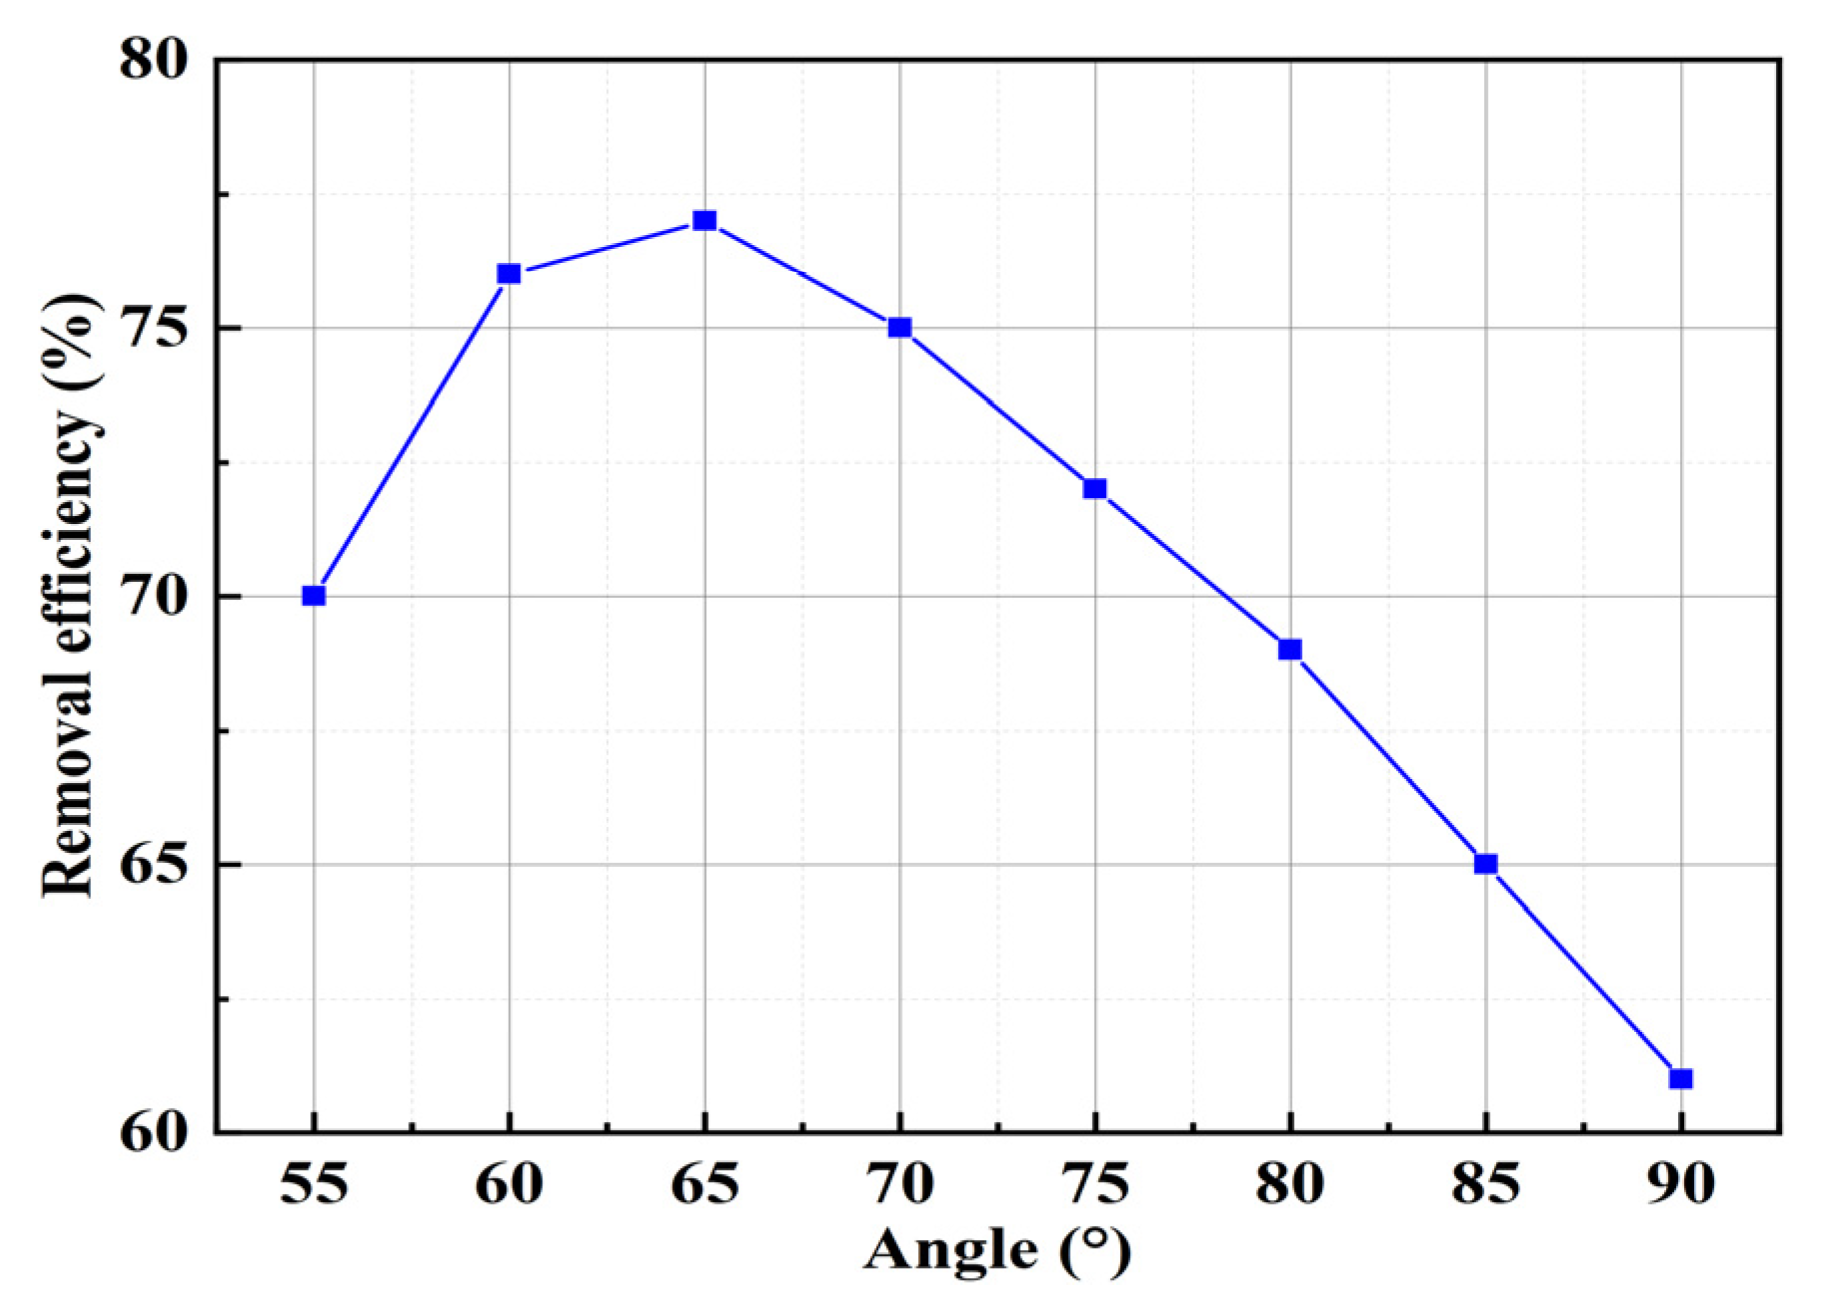
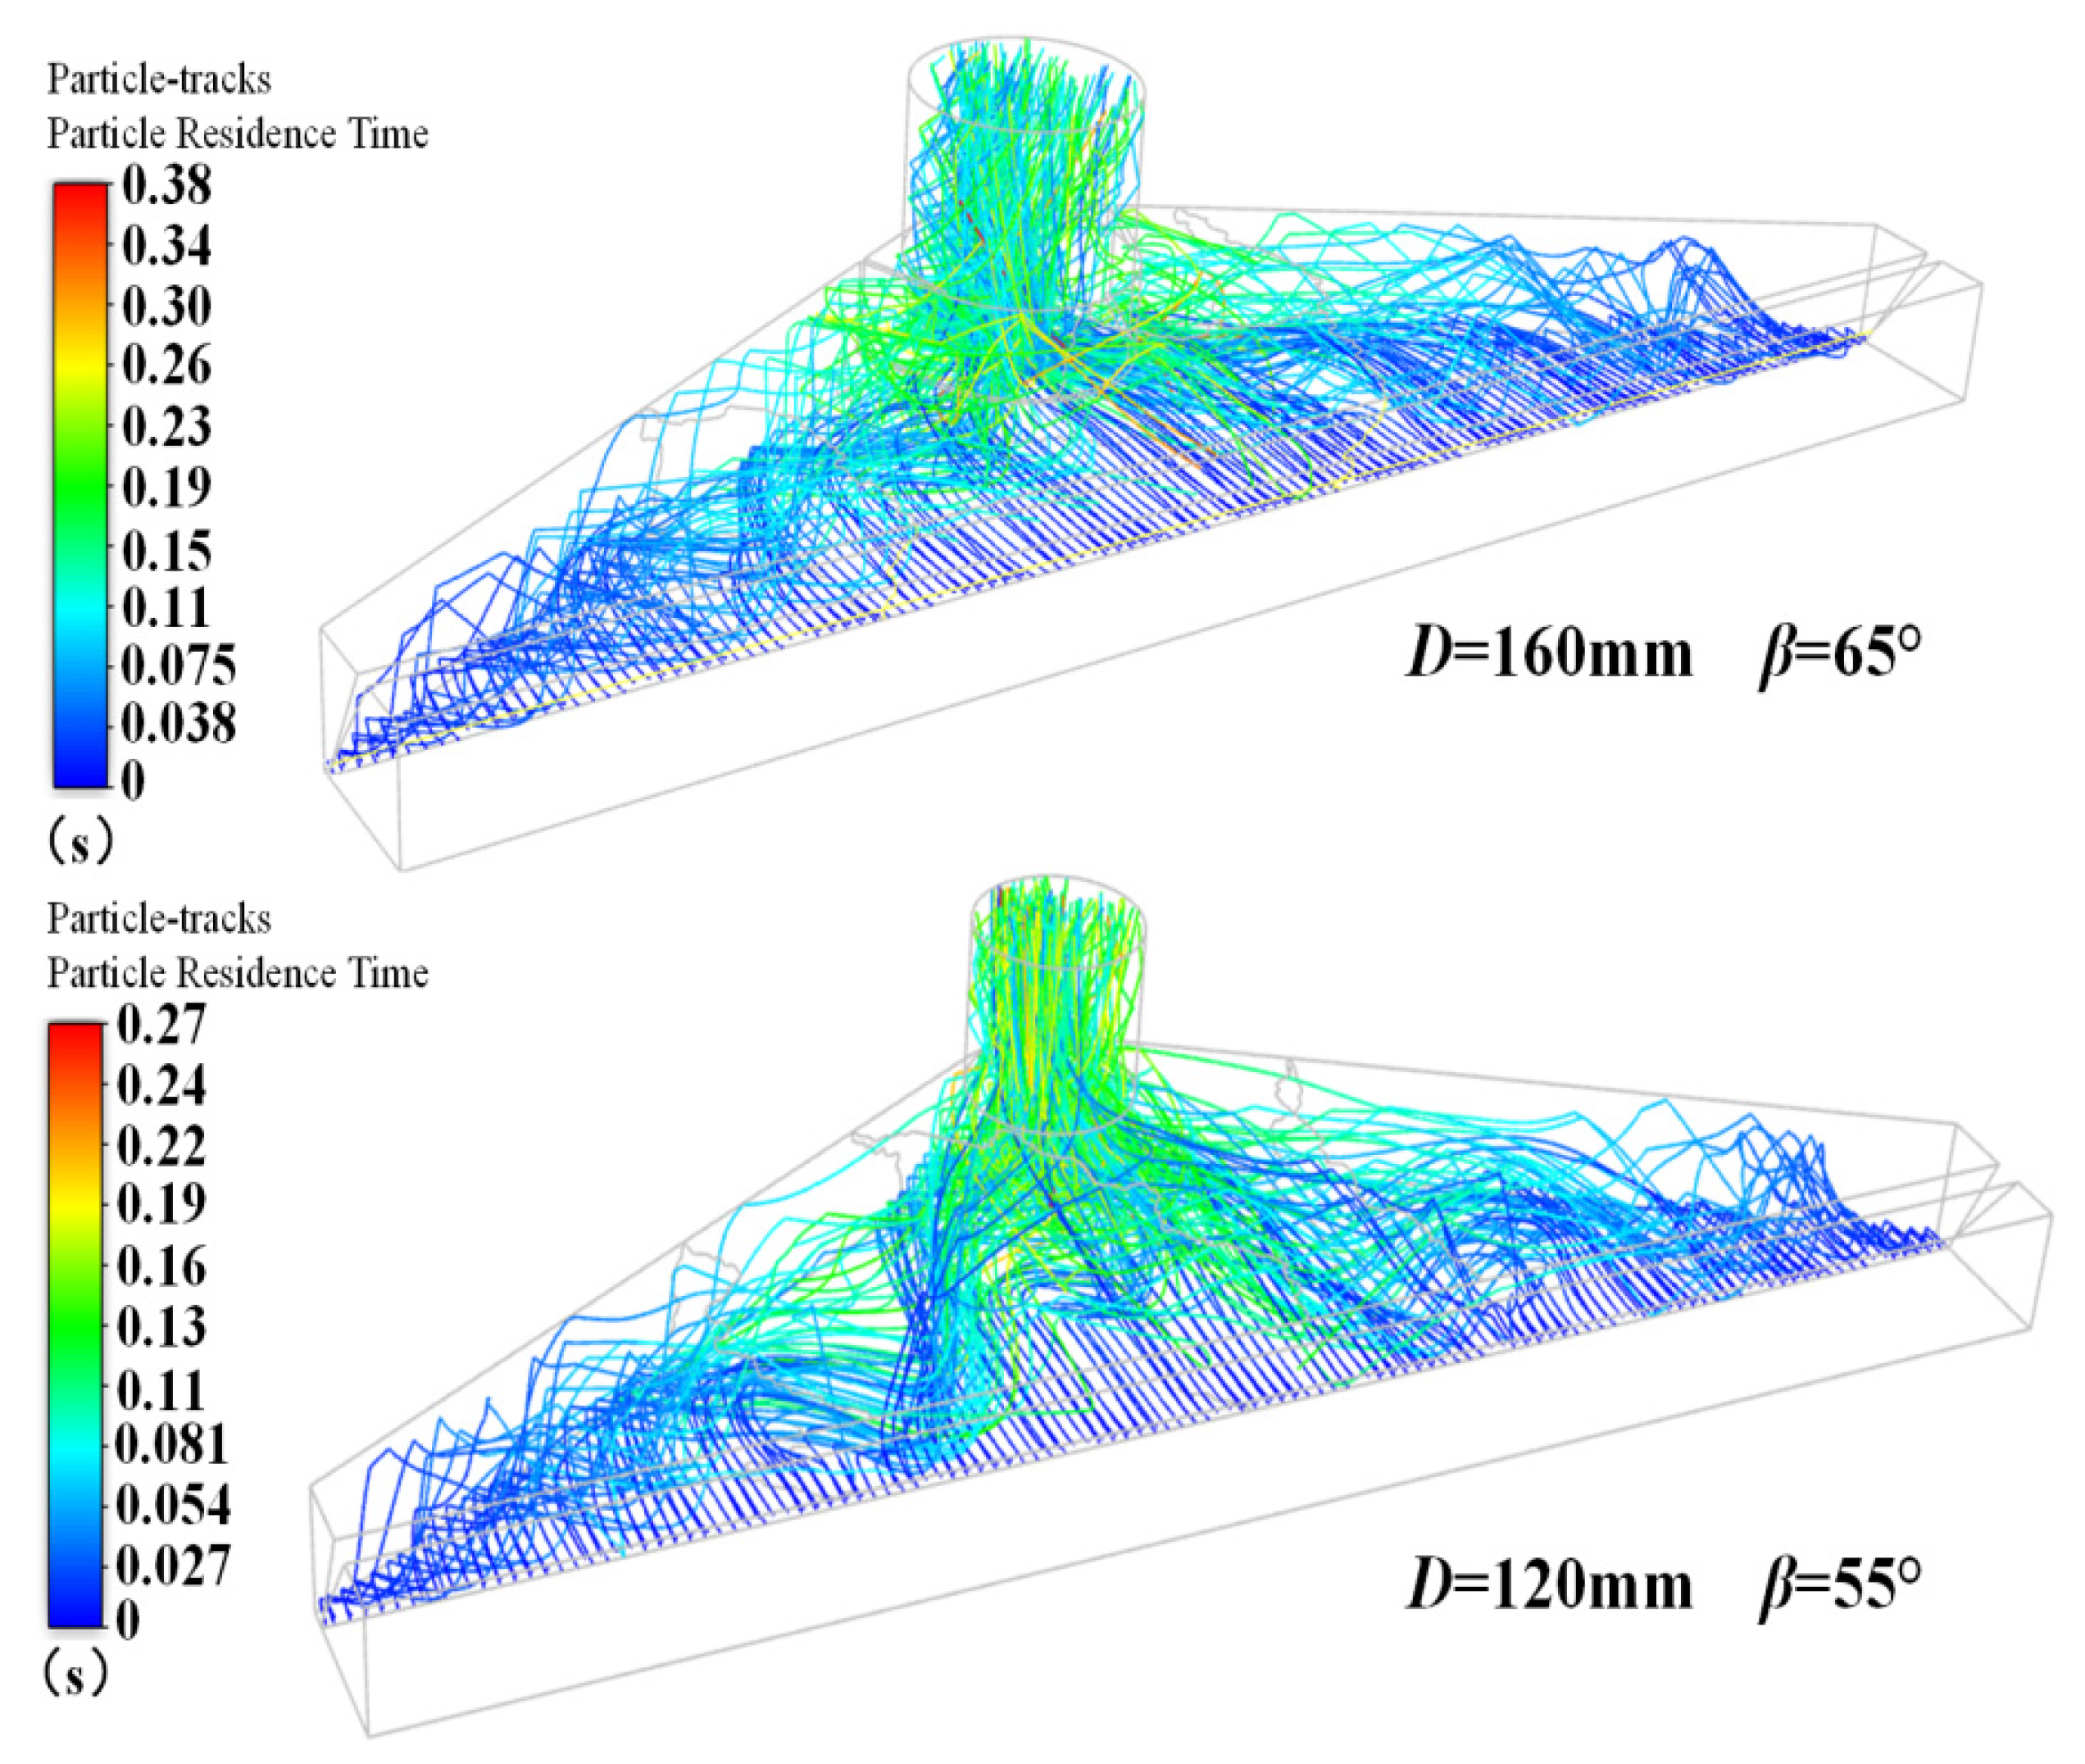
Figure 8 shows effect of the tilt angle of the forward air surface on the characteristics of the flow field. From the figure it can be seen that with the increase of the angle, the forward air surface airflow velocity and exhaust inlet pressure is first increased and then decreased; 65° is the threshold value. When the angle of inclination is less than 65°, the air flow inside the nozzle is smoother and the energy loss is smaller, increasing the speed of the forward air surface of the nozzle, while the increasing angle of inclination of the nozzle inevitably brings about a sudden increase in the cross-sectional area of the nozzle, reducing the negative pressure at the exit of the nozzle to the entrance of the exhaust pipe, resulting in an increase in the pressure at the entrance of the exhaust pipe. When the inclination angle is greater than 65°, the internal airflow loss increases and the working power of the suction nozzle near the ground decreases, which directly leads to a reduction in the speed of the forward air surface. Referring to the study by Xi Yuan et al. [10], the size of the tilt angle directly affects the energy loss inside the suction port; at less than the threshold value, the energy loss is low, which is equivalent to increasing the power; at greater than the threshold value, the opposite is true. This is similar to the pattern found in this paper. Figure 9 shows the effect of the angle of inclination of the forward air surface on the removal efficiency, illustrating that the inhalation efficiency increases and then decreases as the inhalation angle increases, with 65° also being the threshold value. Combined with the particle trajectories of the different sizes of the suction port in Figure 10, it can be seen that the removal efficiency is directly related to the flow field characteristics. At an inclination angle of less than 65°, the increase in air velocity at the forward air surface and the pressure at the exhaust inlet increases the suction power of the suction port. The opposite is true for inclination angles greater than 65°. Therefore, the optimum construction parameter for the angle of inclination of the forward air surface is 65°.
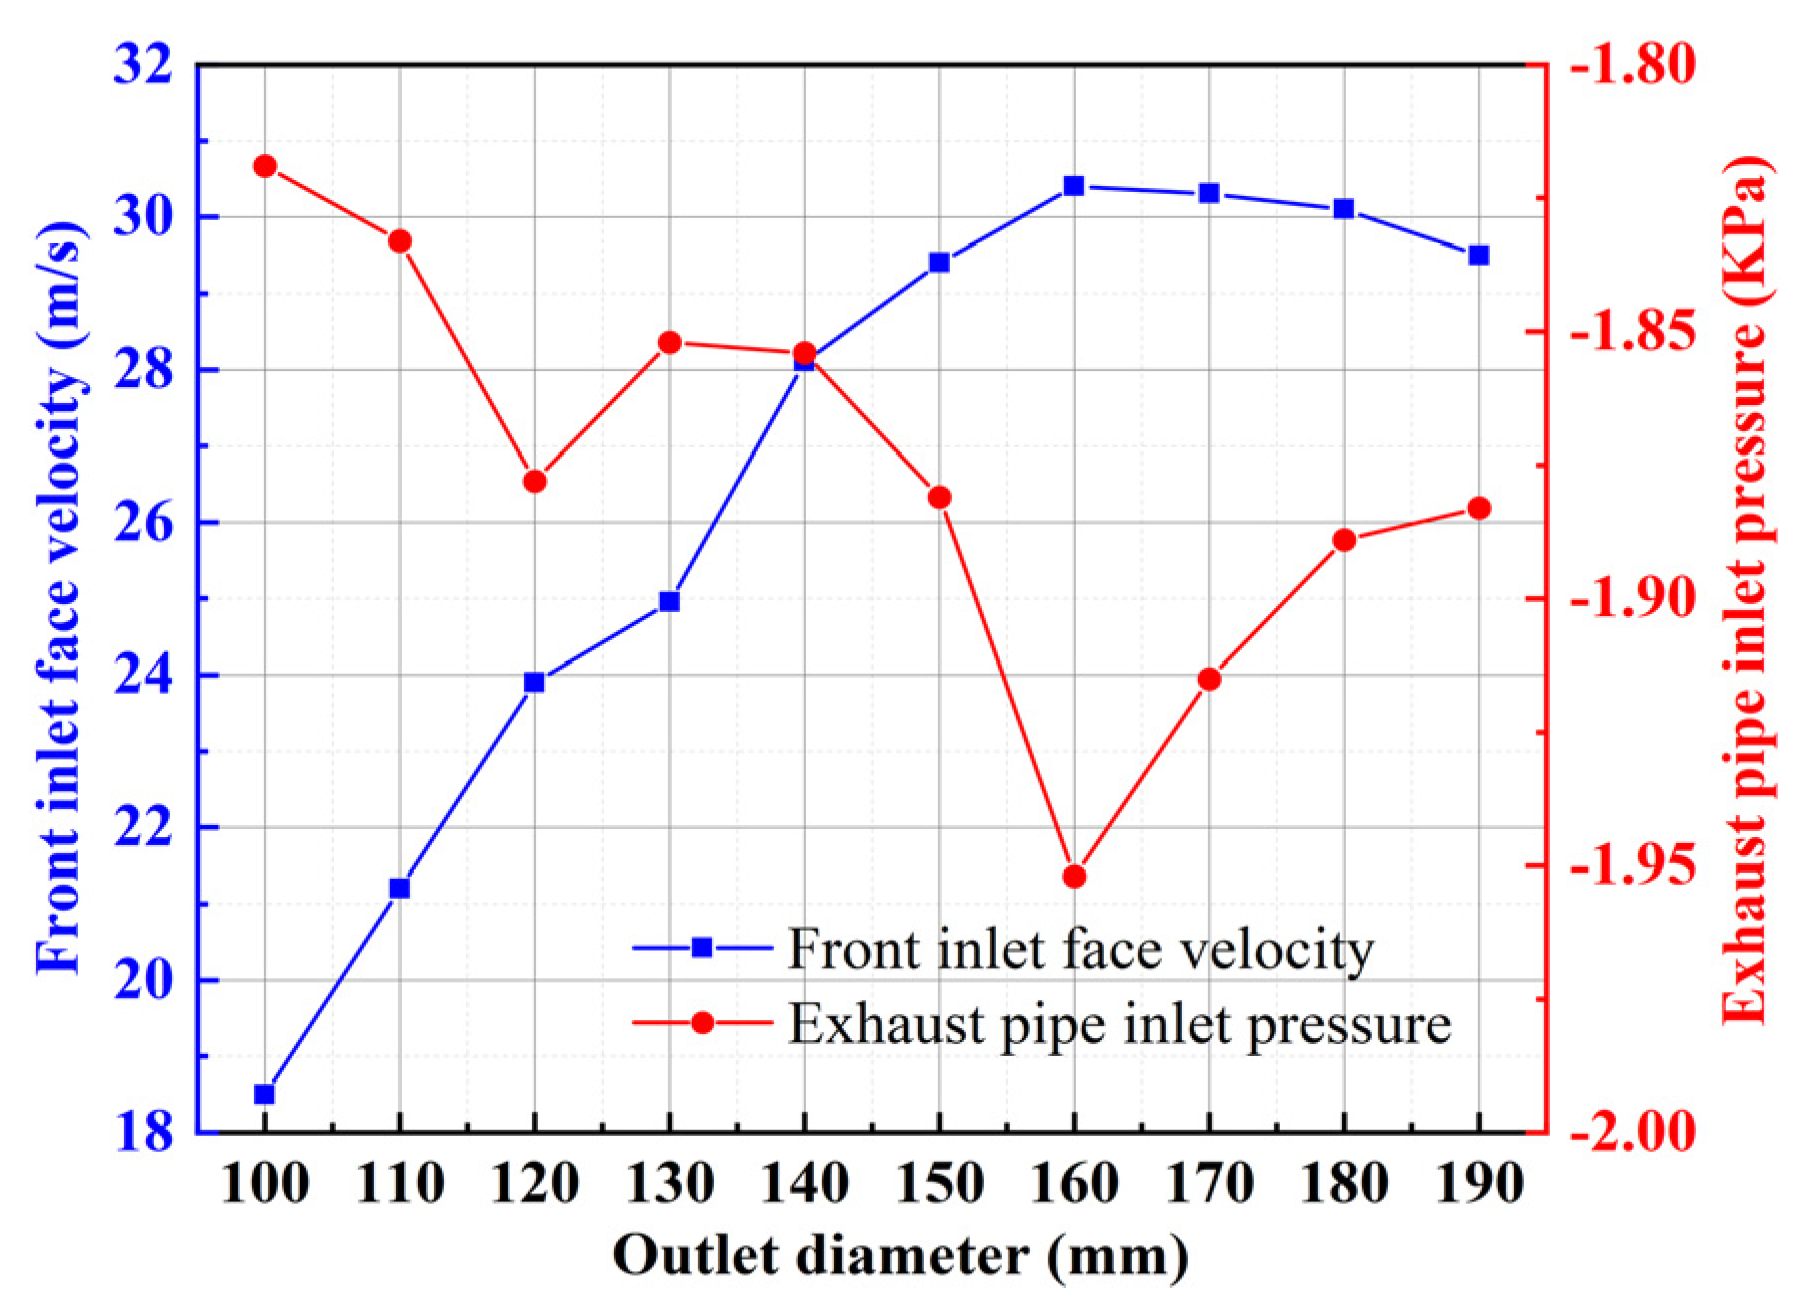
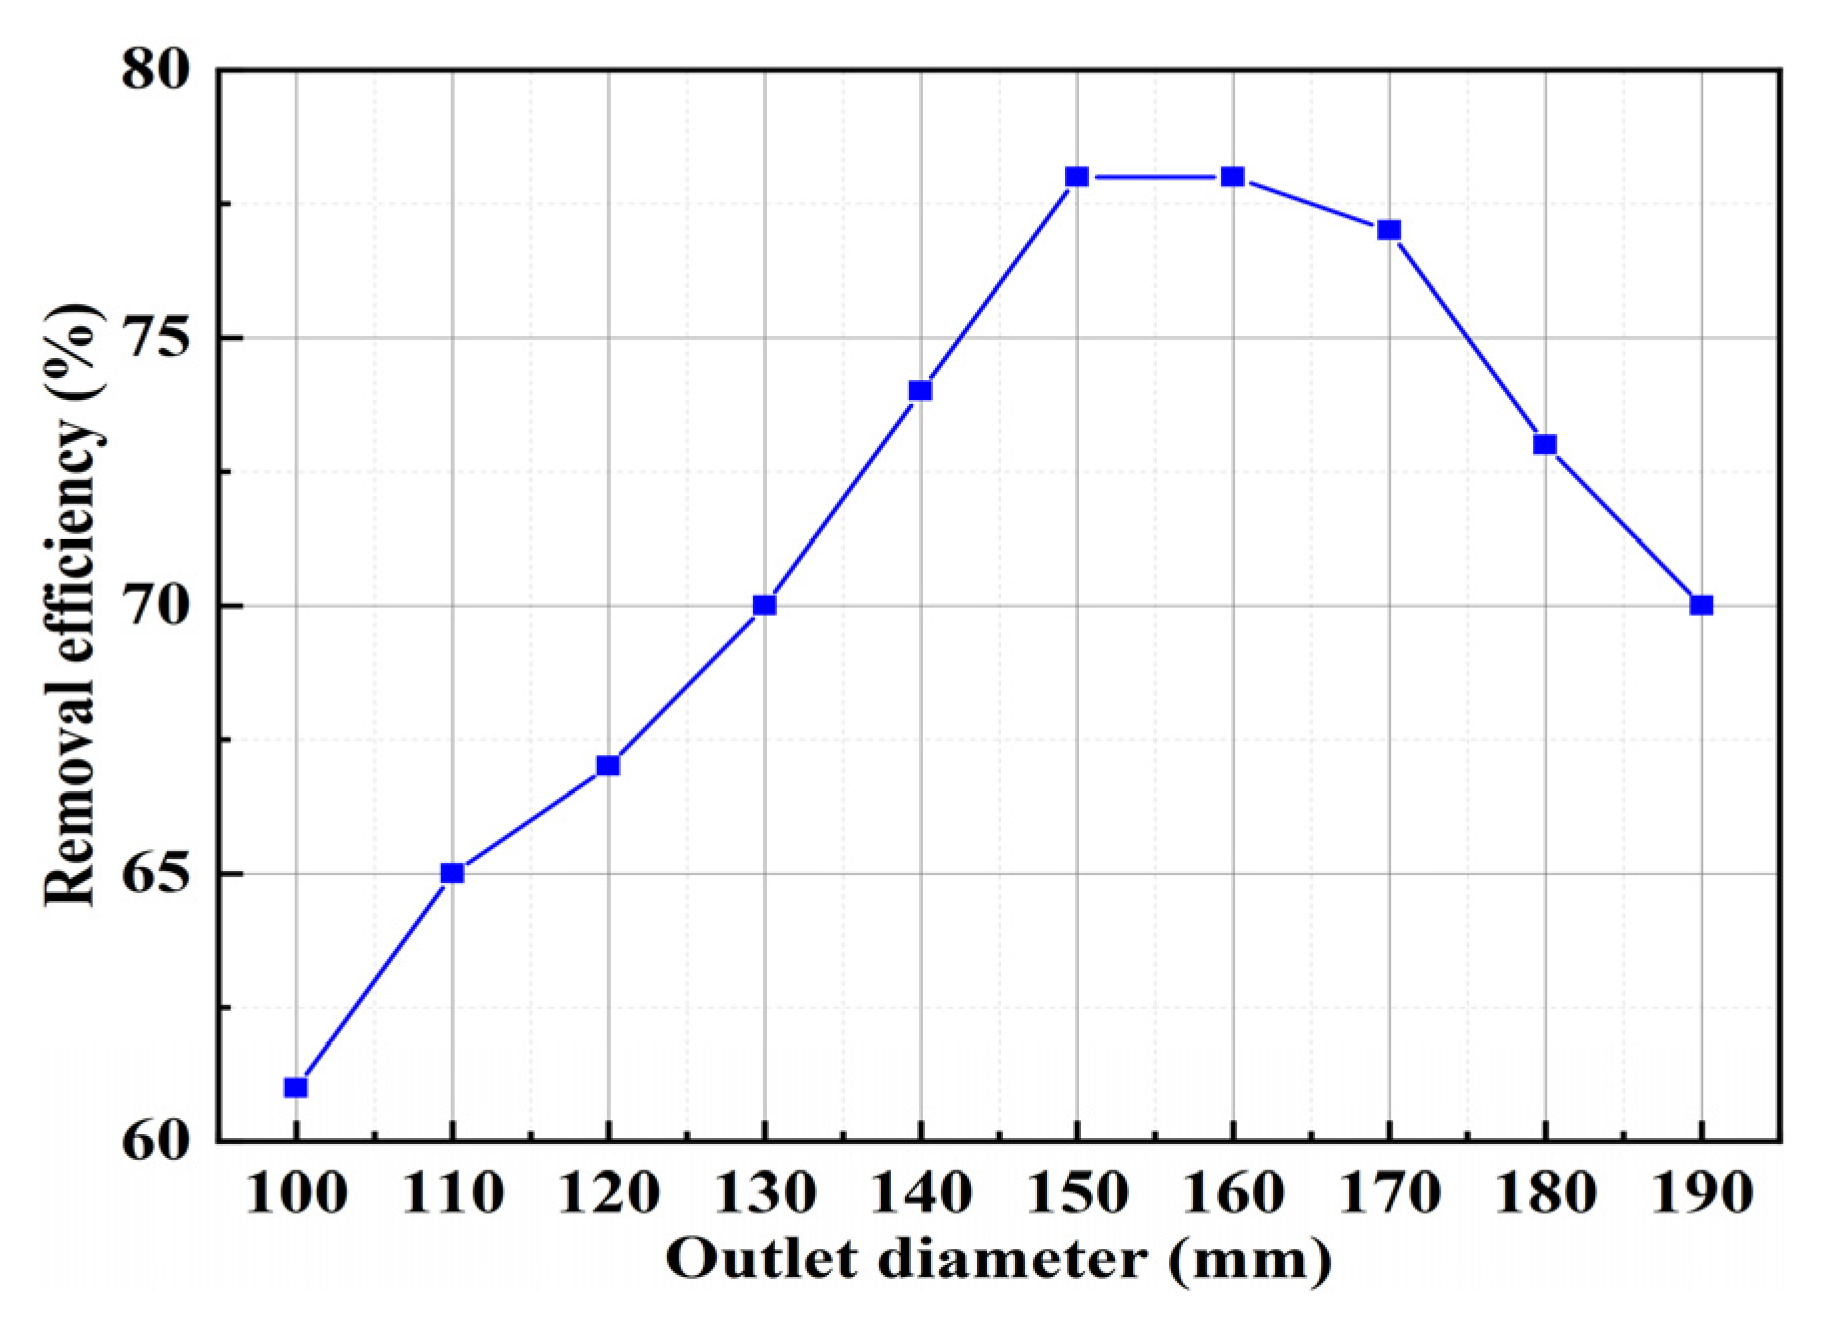
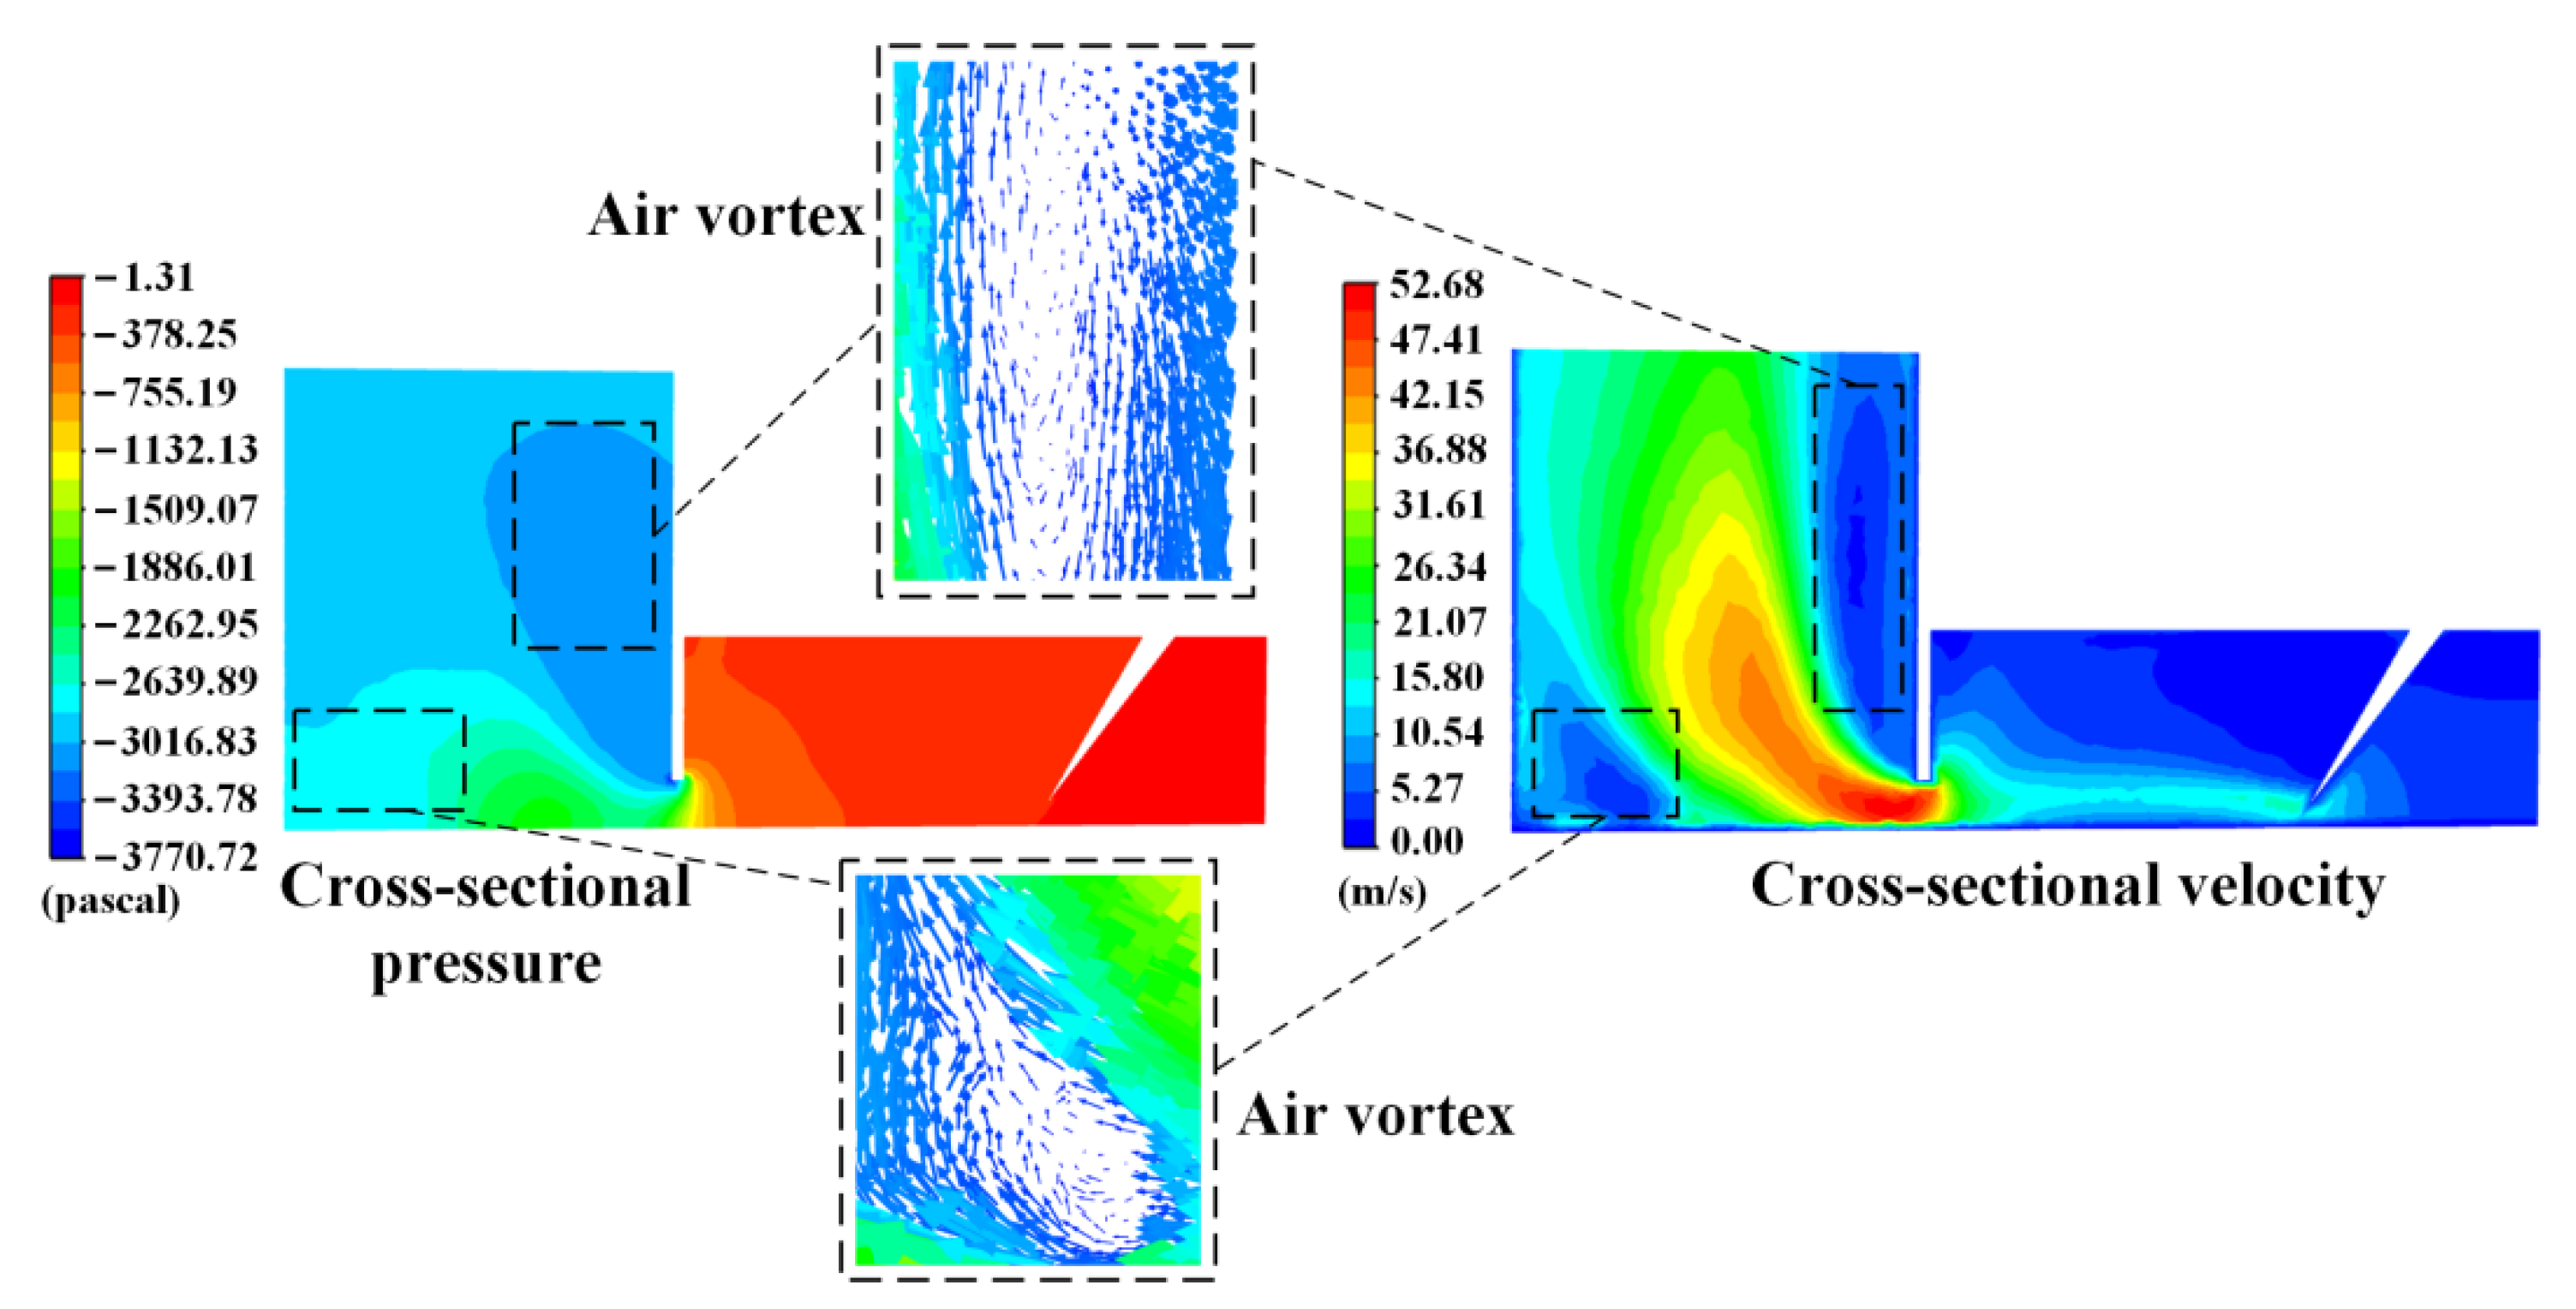
Figure 11 shows the effect of outlet diameter on the characteristics of the flow field. As can be seen from the figure, as the outlet diameter increases, the forward gas surface velocity increases and then decreases slightly, and the pressure at the exhaust inlet increases, then decreases, then starts to increase again and finally decreases. When the outlet diameter is 160 mm, the forward air surface velocity and the pressure at the exhaust inlet reach the maximum value. The effect of outlet diameter on the removal efficiency is given in Figure 12, which shows that as the outlet diameter increases, the removal efficiency increases and then decreases, reaching a maximum at 160 mm. From the study of Yang et al. [6], it can be seen that increasing the pipe diameter will reduce the loss along the inlet and outlet, but too large a pipe diameter will cause the increased power to offset the loss. This conclusion can explain the findings of this paper. Combined with the simulated cross-sectional cloud of the dust suction port given in Figure 13, it can be seen that in the process of increasing the pipe diameter, the air intake at the exhaust inlet becomes smoother due to the reduction in along-travel losses. Therefore, the optimum construction parameter for the outlet diameter is 160 mm.
4. Test Results and Discussion
4.1. Characteristics of the Flow Field at the Dust Suction Outlet at Different Negative Pressures
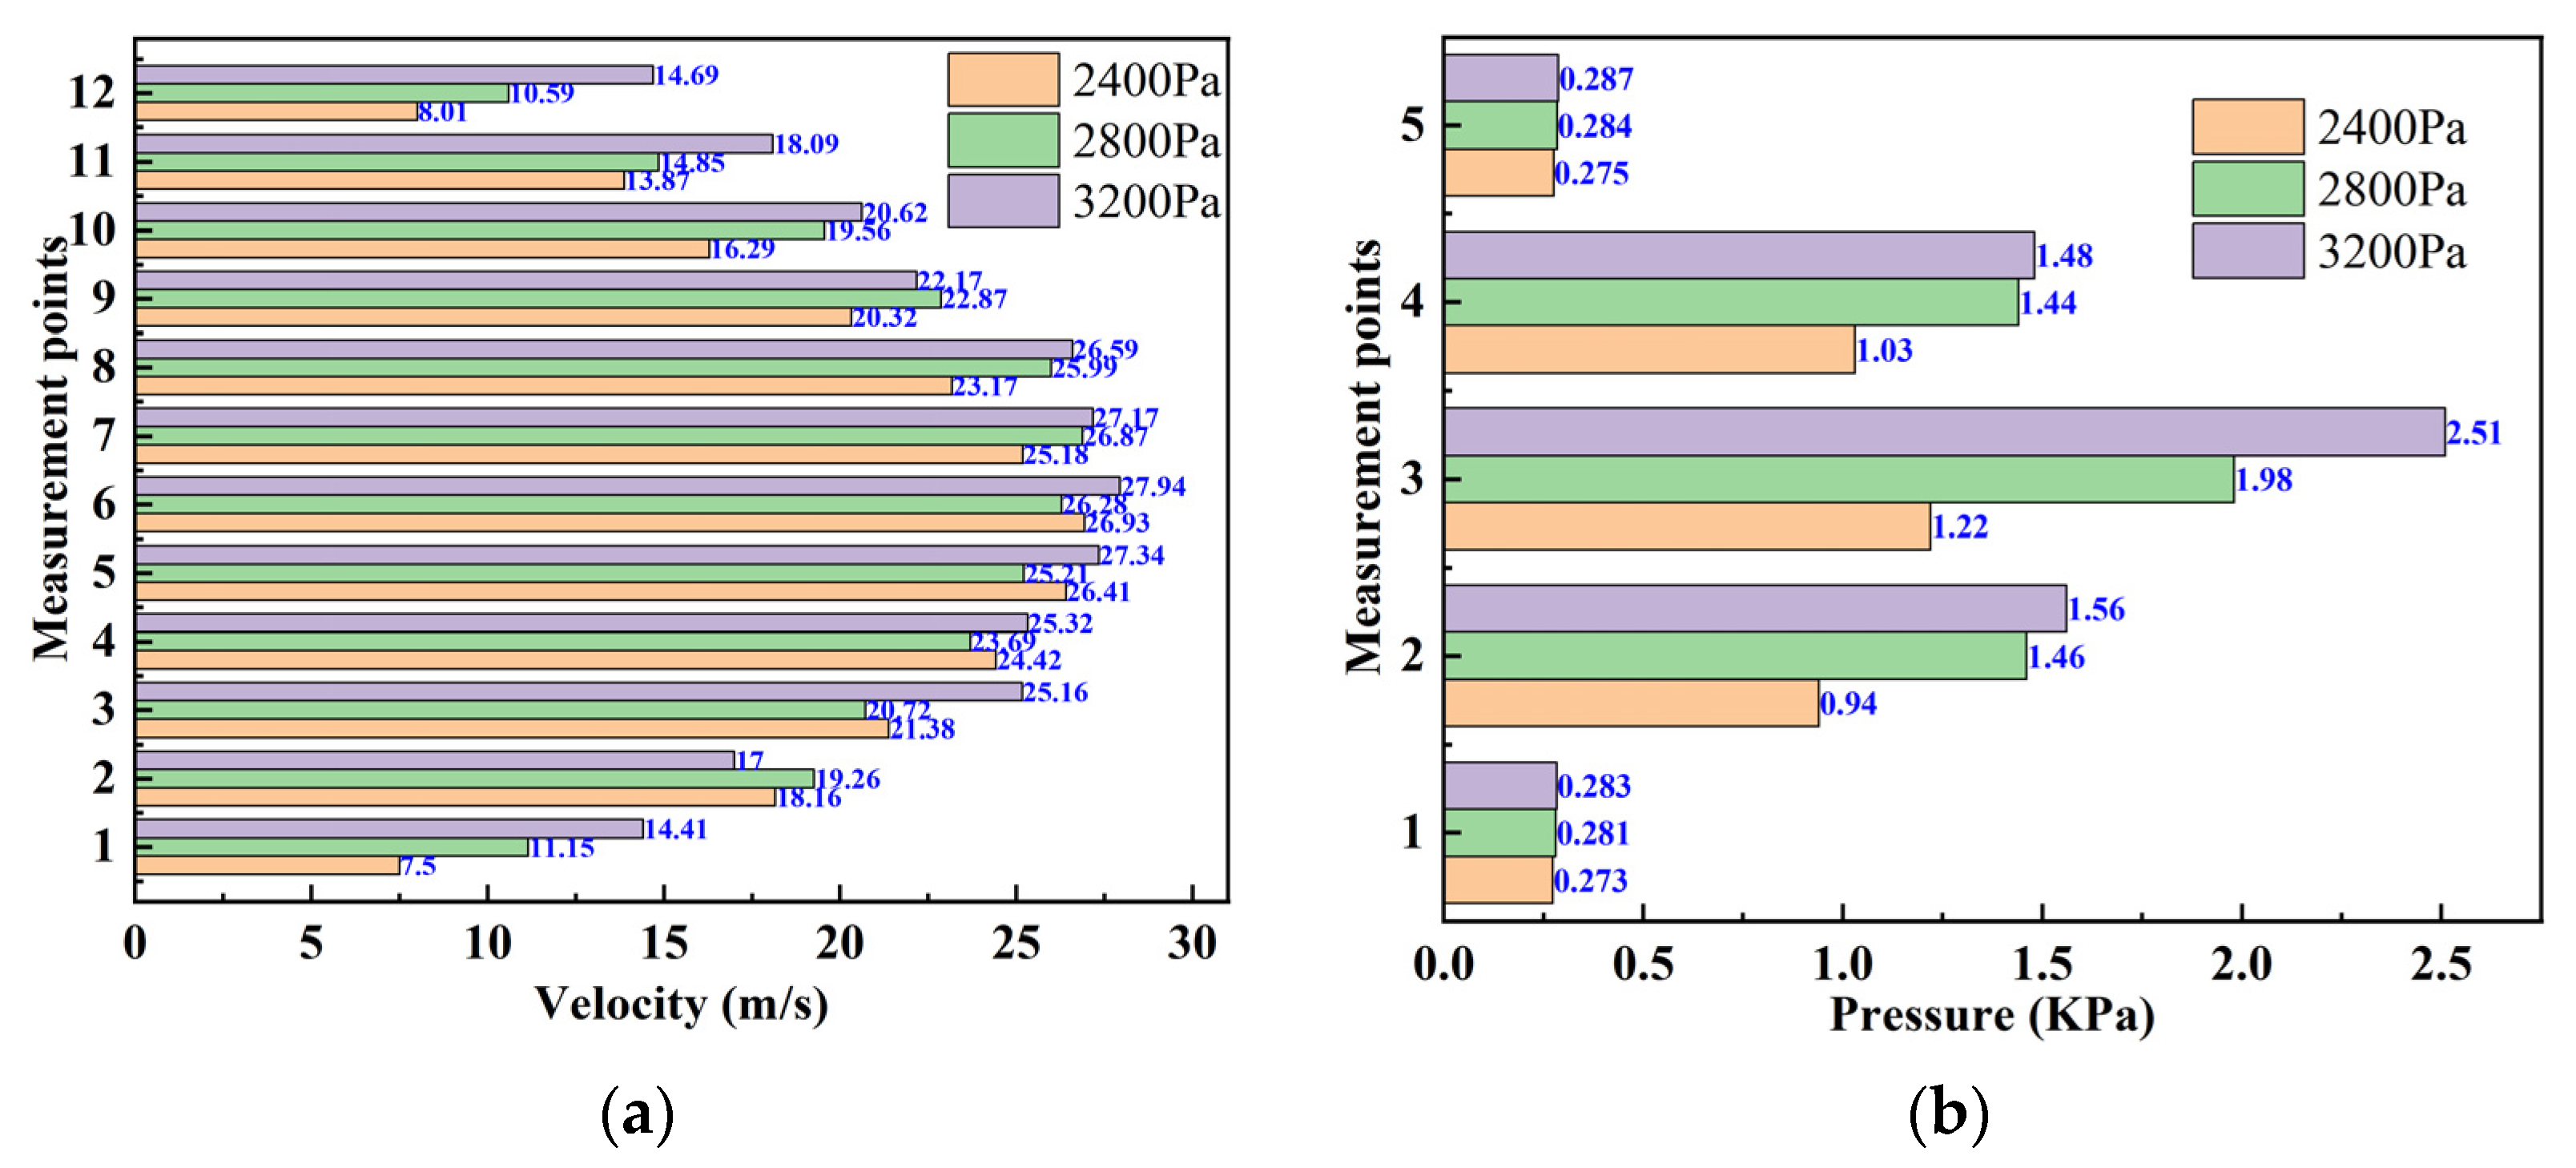
Figure 14a shows the mean values of the air speed at the inlet at different measurement points. It can be seen from the graph that the greater the negative pressure provided by the centrifugal fan, the greater the air speed at the inlet; in addition, the air speed near the centre of the inlet is significantly greater than at the edges. There are some discrepancies in the data at individual measurement points; for example, the air speed at 2400 Pa at measurement point 2 is significantly higher than at 2800 Pa. The reason for this may be that the L-shaped Pitot tube was not placed in the right direction for the flow of air during the test. Figure 14b shows the mean air pressure at the outlet at different negative pressures at different measurement points. As can be seen from the graph, the pressure at the centre of the outlet is greater than at the edges; the greater the negative pressure provided by the centrifugal fan, the greater the pressure at the centre of the outlet, while the pressure near the edges does not change much.
4.2. Vacuum Efficiency at Different Driving Speeds and Negative Pressures
Figure 15 shows the efficiency of dust extraction at different driving speeds and negative pressures, and it is clear from the figure that the efficiency of dust extraction decreases as the driving speed increases. The lower driving speed reduces the relative velocity between the suction port and the dust particles, while the airflow increases the carrying capacity of the dust particles so that the suction port can fully play the suction capacity. At the same driving speed, the greater the negative pressure provided by the fan, the greater will be the efficiency of dust extraction.
4.3. Simulation and Experimental Comparison Analysis of Flow Field Characteristics
Figure 16 gives a comparison between the simulated and experimental outlet wind pressure results under different negative pressures. As can be seen from the figure, the trend of the simulated results is basically the same as that of the experimental results, with the wind pressure in the central area of the outlet being greater than that in the peripheral area. There is an error between the data obtained from the simulation and the data obtained from the test, and the magnitude of the error can be calculated according to Equation (12); the maximum error is 9.5%, which is within the allowable error range of 10% mentioned in the literature [9].
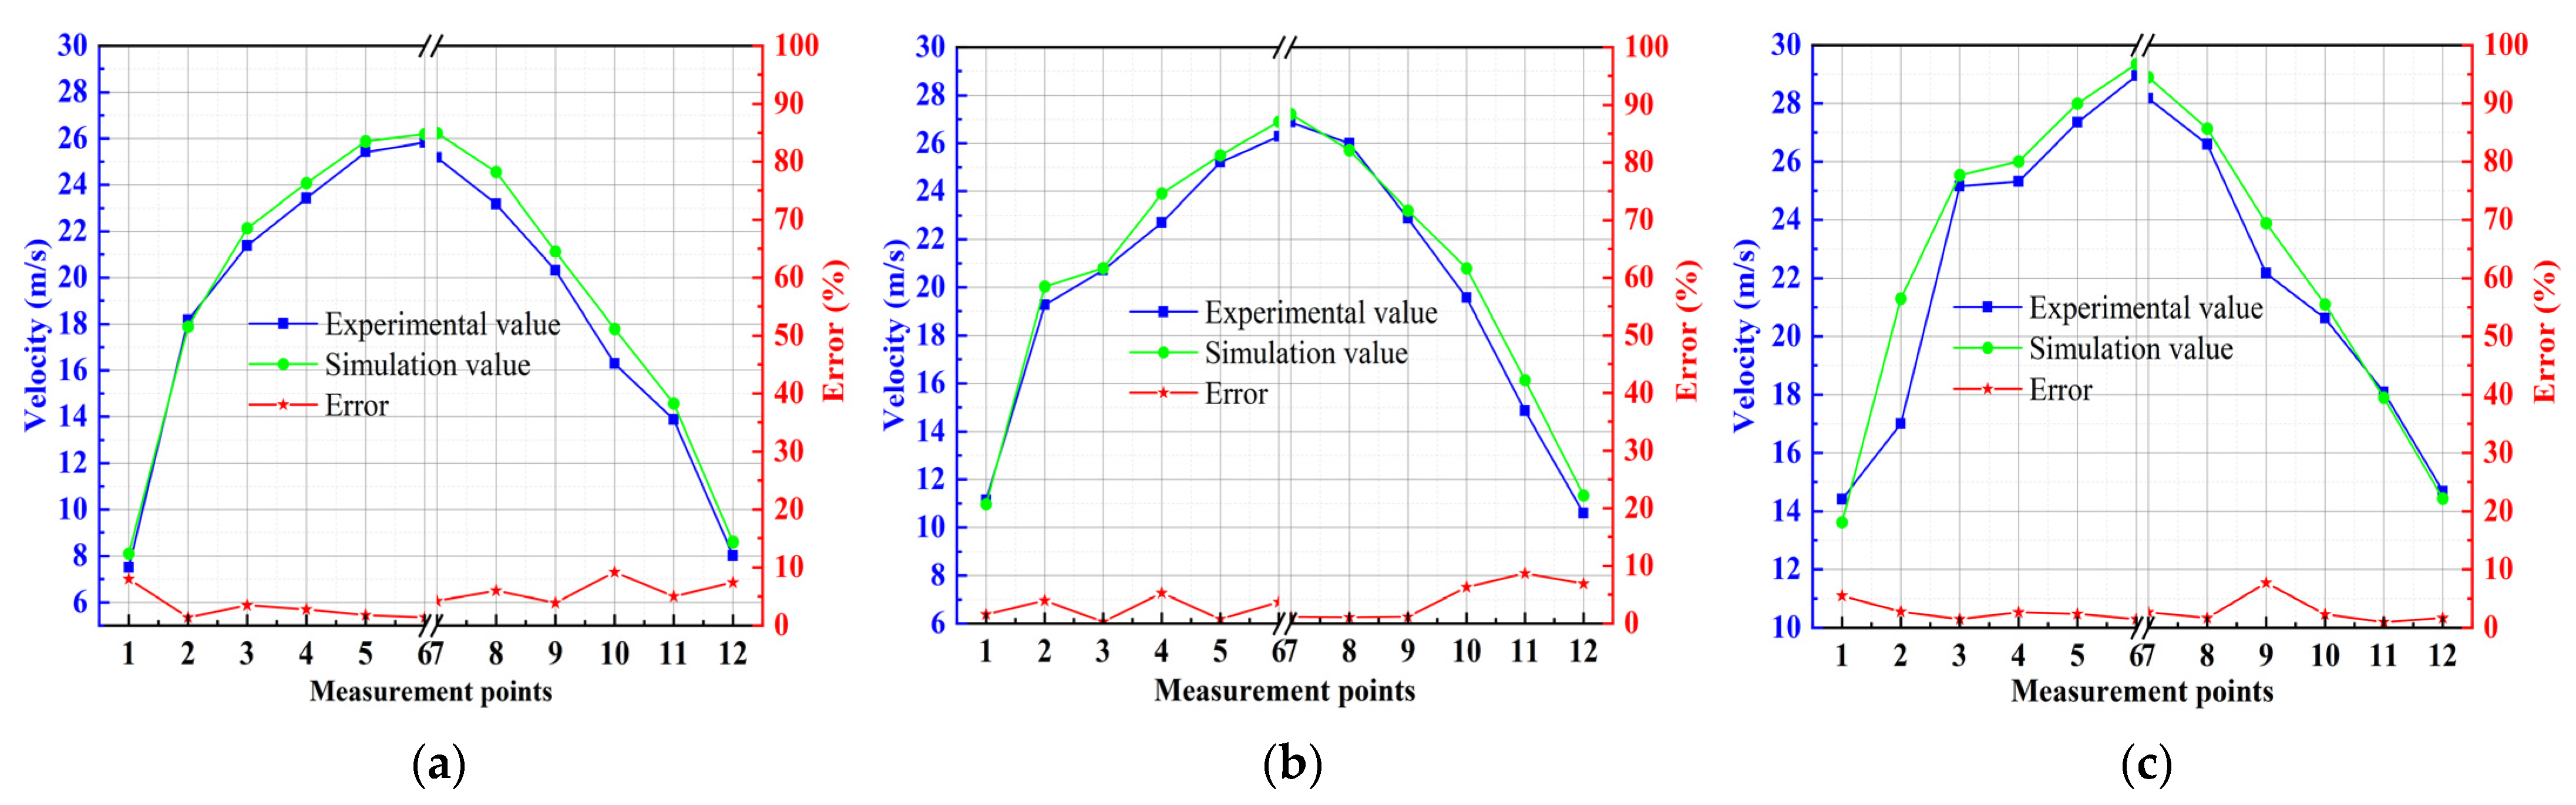
Figure 17 gives the simulation results of the inlet air speed at different negative pressures compared with the test. As can be seen from the figure, the air speed at the centre of the inlet is significantly greater than that at the edge of the area, and the trend of the simulation results is basically the same as the test results. Here the maximum error calculated by Equation (12) is 9.2%, which is also within the 10% error tolerance. Combined with Figure 13, it can be seen that the space inside the dust suction port is nearly closed, and some areas even form airflow vortices, which indicates that the airflow changes very rapidly. The main reason for this error is that the locations of the measurement points in the simulation do not exactly coincide with the locations of the measurement points in the test, thus causing deviations. The reason why the air velocity and pressure at the centre of the inlet and outlet are higher than at the edges is that the presence of the inner baffle causes a swirl of airflow at the edge of the exhaust pipe, with less pressure at the centre of the swirl. At the same time, due to the structure of the suction inlet, the incoming airflow converges to the centre of the inlet, so the airflow velocity at the centre is higher than at the edges. In addition, the presence of swirls in the airflow has a different effect on the airflow at the left and right ends of the suction port, resulting in an asymmetrical velocity distribution.
4.4. Simulated and Experimental Comparative Analysis of Dust Extraction Efficiency
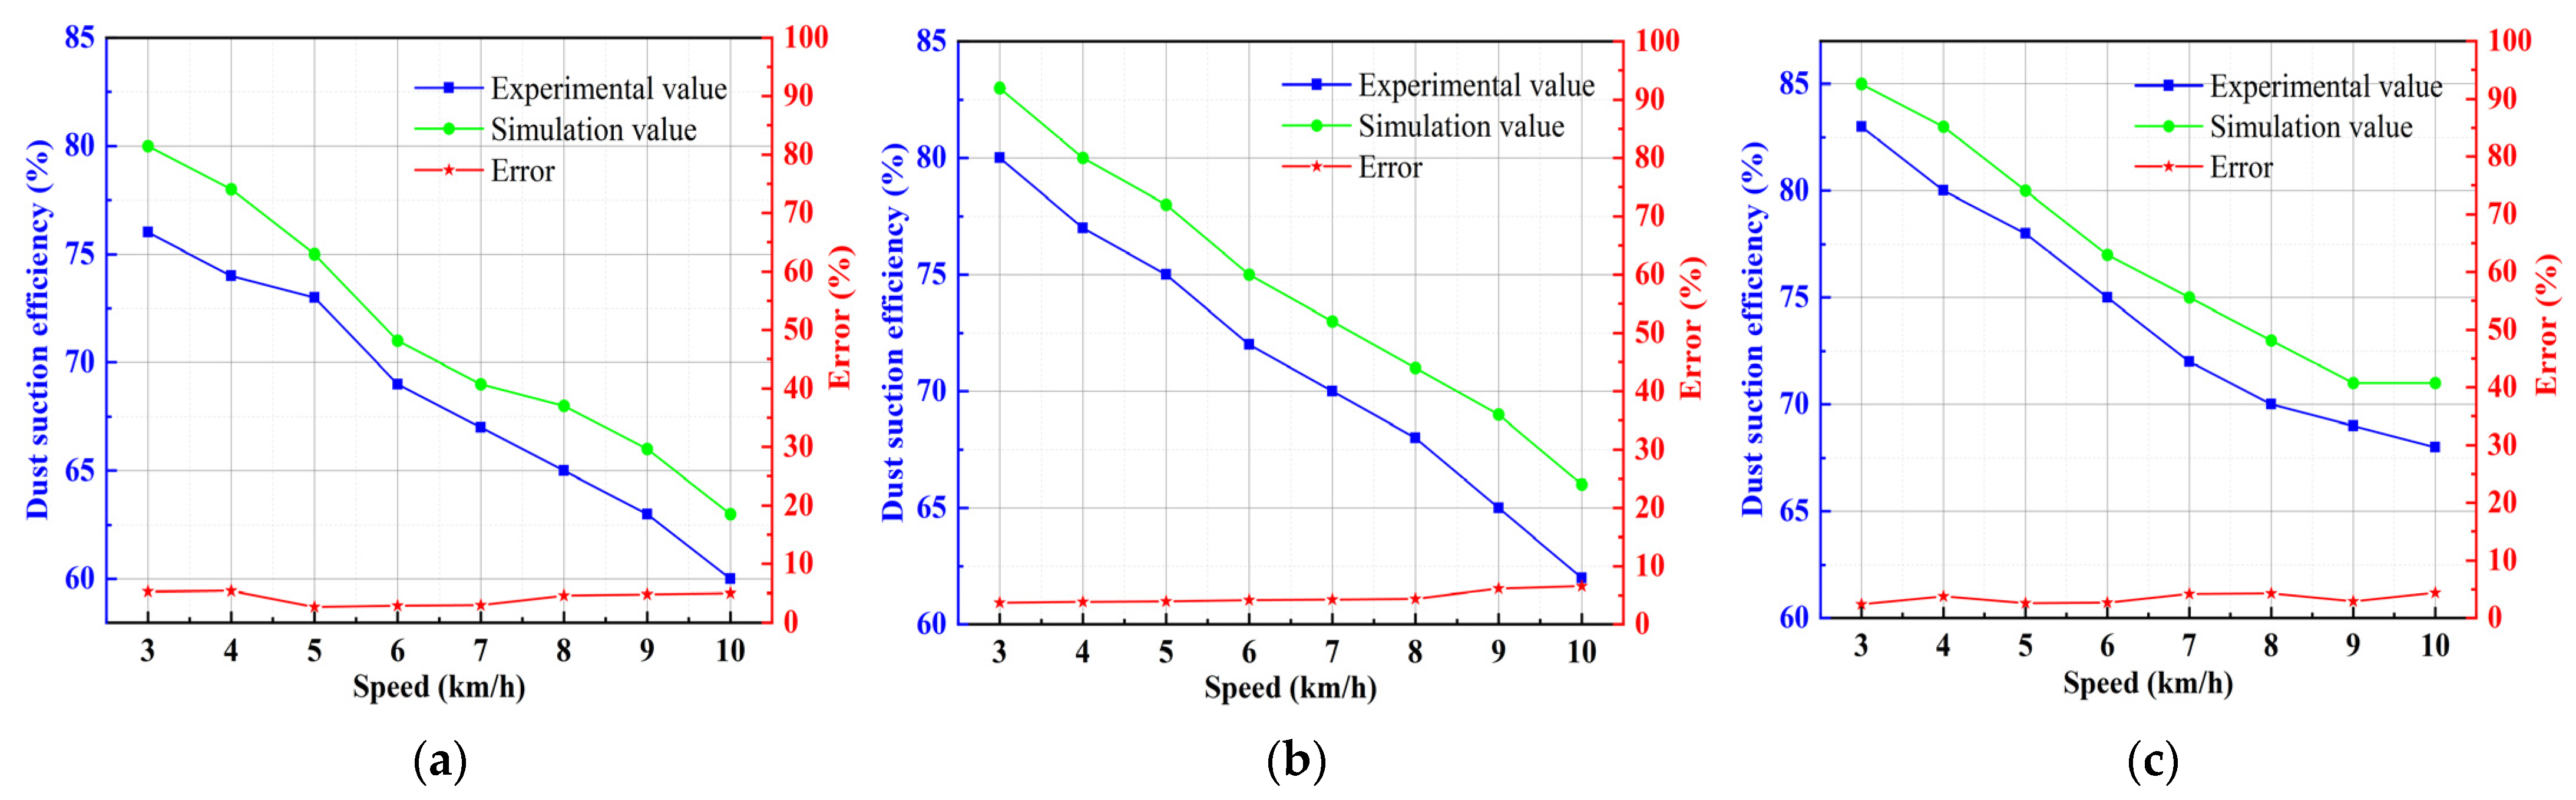
Figure 18 gives the simulation results and test comparison of the vacuum efficiency under different driving speeds and negative pressures. I can be seen from the figure that under the same negative pressure, with increasing driving speed, the vacuum efficiency decreases. Under the same driving speed, the greater the negative pressure, the greater the dust absorption efficiency. From Equation (14), the maximum error can be calculated to be 6.6%, again within the allowed error range of 10%. In conjunction with the simulated particle trajectories given in Figure 10, it can be seen that the main sources of error are, firstly, the initial settings of the particle phases in the CFD simulation: particle density, dispersion coefficient, incident mode, velocity, etc., which are all ideal, but these conditions are always changing in the test. Secondly, the road surface and the inner wall of the dust suction port are set to be smooth and free of slippage, but in reality, the road surface and the inner wall of the dust suction port are rough and the collision between the particles and the inner wall cannot be realistically simulated. There are also gaps in the test surface, which have a hiding effect on the dust and affect the vacuum efficiency.
5. Conclusions
Taking the company’s self-developed Ruiqing S26 pure electric sweeper as the research object, the CFD method was used to analyse the influence of the structural parameters of the dust suction port and the operating parameters of the sweeper on the dust suction effect of the sweeper, and was verified through real vehicle tests. The specific conclusions are as follows.
- (1)
- The turbulence model is used to simulate the air flow in the dust extraction port, and physical values such as air velocity and pressure are analysed. Here, we use the air velocity at the forward air surface and the pressure at the entrance of the exhaust pipe to reflect the characteristics of the flow field; then the Euler–Lagrange method is used to analyse the trajectory of the dust particles in the dust extraction port, and then the removal efficiency is evaluated by defining an expression for the removal efficiency. The simulation results show that, for the S26 pure electric road sweeper, the air speed at the entrance increases as the negative pressure increases; in addition, the air speed near the centre of the entrance is significantly stronger than that at the edges. Similarly, the pressure at the centre of the exit increases significantly as the negative pressure increases, and the pressure at the centre of the exit is also greater than that at the edges. In the simulation of the influence of driving speed and negative pressure on the removal efficiency, the removal efficiency tends to decrease with an increase of driving speed; at the same driving speed, the greater the negative pressure provided by the fan, the greater the removal efficiency will be. The maximum removal efficiency is 85%.
- (2)
- The structural parameters of the dust suction outlet will affect its flow field characteristics, which in turn affects the operational performance of the sweeper. The size of the inclination angle directly affects the internal energy loss of the dust suction port, the best structural parameter for the inclination angle of the forward air surface is 65°. Increasing the diameter of the pipe will reduce the along-range loss between the import and export, but too large a pipe diameter will make the increased power and losses offset each other. The best structural parameter for the outlet diameter is 160 mm.
- (3)
- By comparing the test and simulation data, it was found that the simulation variation law was basically the same as the test results. The maximum error in the simulation results was 9.5% for the outlet air pressure at different negative pressures and 9.2% for the inlet air speed at different negative pressures. The main source of the error was that the location of the measurement points in the simulation did not exactly coincide with the location of the measurement points in the test, thus causing deviations. The maximum error in the simulation results for the removal efficiency at different driving speeds and negative pressures was 6.6%. The main source of error is that the initial settings of the particle phases in the simulations do not truly reproduce the physical properties of the particles at the time of the tests. However, the maximum error in these simulations was within 10%, which is the permissible error range.
Author Contributions
Methodology, J.Y.; software, J.Y.; validation, J.P.; formal analysis, J.Y.; investigation, J.Y.; resources, H.A. and J.W.; data curation, J.Y.; writing—original draft preparation, J.Y.; writing—review and editing, J.P.; funding acquisition and visualisation, J.P. All authors have read and agreed to the published version of the manuscript.
Funding
This research was funded by National Natural Foundation of China (52005004) and The Major Science and Technology Special Projects in Anhui Province under grant (201903a05020061).
Institutional Review Board Statement
Not applicable.
Informed Consent Statement
Not applicable.
Data Availability Statement
Not applicable.
Acknowledgments
The authors gratefully acknowledge the financial support by National Natural Foundation of China (52005004) and The Major Science and Technology Special Projects in Anhui Province under Grant (201903a05020061).
Conflicts of Interest
The authors declare no conflict of interest.
References
- Jia, Y.W.; Gao, Y.; Xu, Z.; Wong, K.P.; Lai, L.L.; Xue, Y.S.; Dong, Z.Y.; Hill, D.J. Powering China’s Sustainable Development with Renewable Energies: Current Status and Future Trend. Electr. Power Compon. Syst. 2015, 43, 1193–1204. [Google Scholar] [CrossRef]
- Ma, Y.; Shi, T.Y.; Zhang, W.; Hao, Y.; Huang, J.B.; Lin, Y.A. Comprehensive policy evaluation of NEV development in China, Japan, the United States, and Germany based on the AHP-EW model. J. Clean. Prod. 2019, 214, 389–402. [Google Scholar] [CrossRef]
- Jeong, Y.; Kim, W.; Yim, S. Model Predictive Control Based Path Tracking and Velocity Control with Rollover Prevention Function for Autonomous Electric Road Sweeper. Energies 2022, 15, 984. [Google Scholar] [CrossRef]
- Qin, X.Y.; Xiao, Q.L.; Zhou, F.L. Simulation analysis of gas-particle flow through the pickup head of a street sweeper and its design improvement. Chin. J. Appl. Mech. 2016, 33, 73–79, 181–182. [Google Scholar]
- Hu, X.J.; Zhang, Z.Q.; Li, J.C.; Liu, Y.C.; Sang, T.; Cao, Q.W.; Li, T.H. Structure optimization of vaccum nozzle based on intervalmulti-objective optimization algorithm. J. Jilin Univ. (Eng. Technol. Ed.) 2020, 50, 1991–1997. [Google Scholar]
- Yang, C.Z.; Zhang, Y.C.; Ouyang, Z.J. Parametric design of dust collection port of vacuum sweeper based on flow simulation. J. Cent. South Univ. Sci. Technol. 2012, 43, 385–390. [Google Scholar]
- Huang, D.H.; Chen, C.X.; Zhang, Y.C. Parametric analysis of dust sucking mouth for vacuum sweeper based on flow field simulation. J. Mach. Des. 2013, 30, 73–76. [Google Scholar]
- Bofu, W.; Jinlai, M.; Jie, C. Numerical study on particle removal performance of pickup head for a street vacuum sweeper. Powder Technol. 2010, 200, 934–943. [Google Scholar]
- Xi, Y. Research on the Flow Characteristics and Overall Removal Efficiency Optimization of Reverse Blowing Pickup Mouth for a Lightsweeper; Jilin University: Changchun, China, 2016. [Google Scholar]
- Xi, Y.; Cheng, K.; Lou, X.T. Research on Numerical Analysis and Dust Collection Efficiency of Reverse Blowing Pickup Mouth. J. Southwest Jiaotong Univ. 2016, 51, 105–112. [Google Scholar]
- Xi, Y.; Cheng, K.; Li, G.X. CFD analysis of the operating parameters of reverse blowing pickup mouth for a street sweeper. J. Cent. South Univ. Sci. Technol. 2016, 47, 1144–1150. [Google Scholar]
- Yuan, X.; Yan, D.; Xilong, Z. Prediction of particle-collection efficiency for vacuum-blowing cleaning system based on operational conditions. Processes 2020, 8, 809. [Google Scholar]
- Xi, Y.; Yongliang, Z.; Xilong, Z. Enhancement of particle collection efficiency considering the structural interplay: Particle motion characteristics analysis. Mech. Ind. 2020, 21, 618. [Google Scholar] [CrossRef]
- Zhang, M.F.; Zhang, Y.C.; Zhang, F.Y. Numerical analysis on blowing-suction cleaning flow field between subway rails. J. Harbin Inst. Technol. 2020, 52, 137–143. [Google Scholar]
- Zhang, M.F.; Zhang, Y.C.; Zhang, T.X. Design Optimization of Subway-Track Sweeper: A Simulation Study. Chin. J. Vac. Sci. Technol. 2019, 39, 273–278. [Google Scholar]
- Liu, X.J.; Zhang, Y.C.; Liu, F. Structure design and flow field simulation analysis of a dust collectorbased on tornado principle. J. Harbin Inst. Technol. 2020, 52, 106–114. [Google Scholar]
- Wu, Q.Y.; Zhang, Y.C.; Xu, B. Similarity and Difference of Direct/Tornado Suction Modes of Road Sweeper: A Simulation Study. Chin. J. Vac. Sci. Technol. 2020, 40, 302–307. [Google Scholar]
- Zhang, X.H.; Wang, T.Y.; Liu, D.M.; Li, W.; Zhao, P. Experiment of Cycle-to-Cycle Variation of In-Cylinder Flow with Variable Tumble. Chin. Intern. Combust. Engine Eng. 2016, 37, 119–125. [Google Scholar]
- Zhang, H.; Li, G.; An, X.Z. Numerical Study on The Erosion Process of the Low Temperature Economizer Using Computational Fluid Dynamics-Discrete Particle Method. Wear 2020, 450, 203–269. [Google Scholar] [CrossRef]
- Jiang, K.J.; Chen, W.; Zhang, Q.; Xu, C.; Du, X.Z. Experimental Study on Cluster Characteristics of Gas-solid Countercurrent Fluidized Bed. J. Eng. Thermophys. 2021, 42, 3213–3221. [Google Scholar]
- Zhang, G.G.; Zhao, Y.G.; Gao, Y.W. Wear analysis of gas-solid two-phase flow atomizing nozzle. Surf. Technol. 2017, 46, 121–126. [Google Scholar]
- Zhou, J.W.; Liu, Y.; Du, C.L. Numerical study of coarse coal particle breakage in pneumatic conveying. Particuology 2018, 38, 204–214. [Google Scholar] [CrossRef]
- Zhu, L.Y.; Wang, S.; Wang, G.T. Numerical simulation of influence factors on erosion characteristics of four-way pipe in heavy oil thermal recovery. Surf. Technol. 2022, 1–12. Available online: http://kns.cnki.net/kcms/detail/50.1083.tg.20220322.1322.004.html (accessed on 18 May 2022).
- Miao, Z.; Kuang, S.B.; Zughbi, H. CFD simulation of dilute-phase pneumatic conveying of powders. Powder Technol. 2019, 349, 70–83. [Google Scholar] [CrossRef]
- Fu, P.; Liu, L.H.; Yang, W.P. Study on Structure Optimization of Feed Conveying Pipeline in Gas-Solid Two-phase Flow. Surf. Technol. 2021, 50, 303–310, 319. [Google Scholar]
- Cheng, F.; Sun, S.; Xie, M.X.; Zhang, Y.; Tan, H.J. Method of improving sand separation performance of particle separator based on local jet. J. Aerosp. Power 2022, 1–9. [Google Scholar] [CrossRef]
- Hu, J.P.; Zhang, L.; Shi, T.L. Flow field numerical simulation and experiment for a new type ofdust suction apparatus based on dust start-up characteristics. J. Cent. South Univ. Sci. Technol. 2020, 51, 2442–2450. [Google Scholar]
- Jin, Y.; Jiabao, P.; Hejin, A. Relationship between flow field characteristics and dust collection efficiency of sweeper suction port. J. Eng. 2022, 389–400. [Google Scholar] [CrossRef]
- Han, C.; Bai, L.; Zhou, C.; Sun, W.L.; Zhou, L. CFD–DEM simulation and experimental study of flow pattern transition in a rectangular spouted bed. Powder Technol. 2022, 399, 117179. [Google Scholar] [CrossRef]
- Zhang, Y.C.; Yang, C.Z.; Baker, C. Effects of expanding zone parameters of vacuum dust suction mouth on flow simulation results. J. Cent. South Univ. 2014, 21, 25–47. [Google Scholar] [CrossRef]
- Sim, J.B.; Yeo, U.H.; Jung, G.H. Enhancement of louver dust collector efficiency using modified dust container. Powder Technol. 2018, 325, 69–77. [Google Scholar] [CrossRef]
Figure 1.
Internal flow field region and its structural parameters: (a) internal flow field region and the location of the measurement points; (b) internal flow field region structural parameters; (c) simulation model and external air domain structural parameters.
Figure 1.
Internal flow field region and its structural parameters: (a) internal flow field region and the location of the measurement points; (b) internal flow field region structural parameters; (c) simulation model and external air domain structural parameters.

Figure 2.
Simulation model grid structure.

Figure 3.
Interval distribution of sand particles.

Figure 4.
Influence of geometric parameters of the external expansion domain on the accuracy of the calculation: (a) the effect of length on accuracy of calculation; (b) the effect of height on the accuracy of the calculation; (c) the effect of angle on the accuracy of the calculation.
Figure 4.
Influence of geometric parameters of the external expansion domain on the accuracy of the calculation: (a) the effect of length on accuracy of calculation; (b) the effect of height on the accuracy of the calculation; (c) the effect of angle on the accuracy of the calculation.

Figure 5.
Physical drawing and test site view of S26.

Figure 6.
Simulation results of flow field characteristics at different negative pressures: (a) simulated pressure values; (b) simulation velocity values.
Figure 6.
Simulation results of flow field characteristics at different negative pressures: (a) simulated pressure values; (b) simulation velocity values.

Figure 7.
Simulation results of dust extraction efficiency at different driving speeds and negative pressures.
Figure 7.
Simulation results of dust extraction efficiency at different driving speeds and negative pressures.

Figure 8.
Influence of the angle of inclination of the front inlet surface on the flow field characteristics.
Figure 8.
Influence of the angle of inclination of the front inlet surface on the flow field characteristics.

Figure 9.
Effect of the angle of inclination of the front intake surface on the efficiency of dust extraction.
Figure 9.
Effect of the angle of inclination of the front intake surface on the efficiency of dust extraction.

Figure 10.
Comparison of particle trajectories for different sizes of dust extraction ports.

Figure 11.
Influence of outlet diameter on flow field characteristics.

Figure 12.
Effect of outlet diameter on the efficiency of dust extraction.

Figure 13.
Simulated cross-sectional cloud of the dust extraction port.

Figure 14.
Flow field characteristics of the dust suction port at different negative pressures: (a) average velocity at the vacuum inlet; (b) average pressure at the dust suction port outlet.
Figure 14.
Flow field characteristics of the dust suction port at different negative pressures: (a) average velocity at the vacuum inlet; (b) average pressure at the dust suction port outlet.

Figure 15.
Vacuum efficiency at different driving speeds and negative pressures.

Figure 16.
Comparison between simulation and test of outlet air pressure at different negative pressures: (a) comparison of outlet air pressure at 2400 Pa; (b) comparison of outlet air pressure at 2800 Pa; (c) comparison of outlet air pressure at 3200 Pa.
Figure 16.
Comparison between simulation and test of outlet air pressure at different negative pressures: (a) comparison of outlet air pressure at 2400 Pa; (b) comparison of outlet air pressure at 2800 Pa; (c) comparison of outlet air pressure at 3200 Pa.

Figure 17.
Comparison between simulation and test of inlet air velocity at different negative pressures: (a) comparison of inlet air velocity at 2400 Pa; (b) comparison of inlet air speed at 2800 Pa; (c) comparison of inlet air speed at 3200 Pa.
Figure 17.
Comparison between simulation and test of inlet air velocity at different negative pressures: (a) comparison of inlet air velocity at 2400 Pa; (b) comparison of inlet air speed at 2800 Pa; (c) comparison of inlet air speed at 3200 Pa.

Figure 18.
Comparison of simulated and experimental dust extraction efficiency at different driving speeds and negative pressures: (a) vacuum efficiency at different vehicle speeds at 2400 Pa; (b) vacuum efficiency at different vehicle speeds at 2800 Pa; (c) comparison of simulated and experimental dust extraction efficiency at different driving speeds and negative pressures.


Table 1.
The specific dimensions of the dust suction port.
| S | D | β | Height of Ground Clearance |
|---|---|---|---|
| 1200 mm | 160 mm | 60° | 10 mm |
Table 2.
Discrete phase main parameters.
| Parameters | Value |
|---|---|
| Particle mass flow rate (kg/s) | 0.5 |
| Min diameter (um) | 40 |
| Median diameter (um) | 81 |
| Max diameter (um) | 160 |
| Distribution coefficient | 5.95 |
Table 3.
S26 technical parameters.
| Parameters | Ruiqing S26 |
|---|---|
| Work efficiency | ≥20,000 m2/h |
| Voltage/drive rating | 72 V/7.5 KW |
| Continuous working time | ≥5 h |
| Mileage | ≥100 km |
| Maximum travel speed | 35 km/h |
| Maximum inhalation particles | 50 mm |
Publisher’s Note: MDPI stays neutral with regard to jurisdictional claims in published maps and institutional affiliations. |
© 2022 by the authors. Licensee MDPI, Basel, Switzerland. This article is an open access article distributed under the terms and conditions of the Creative Commons Attribution (CC BY) license (https://creativecommons.org/licenses/by/4.0/).
Share and Cite
MDPI and ACS Style
Ye, J.; Pan, J.; Ai, H.; Wang, J. Pure Electric Sweeper Performance Analysis and Test Verification of Dust Extraction Port. Appl. Sci. 2022, 12, 5188. https://0-doi-org.brum.beds.ac.uk/10.3390/app12105188
AMA Style
Ye J, Pan J, Ai H, Wang J. Pure Electric Sweeper Performance Analysis and Test Verification of Dust Extraction Port. Applied Sciences. 2022; 12(10):5188. https://0-doi-org.brum.beds.ac.uk/10.3390/app12105188
Chicago/Turabian StyleYe, Jin, Jiabao Pan, Hejin Ai, and Jiamei Wang. 2022. "Pure Electric Sweeper Performance Analysis and Test Verification of Dust Extraction Port" Applied Sciences 12, no. 10: 5188. https://0-doi-org.brum.beds.ac.uk/10.3390/app12105188
Note that from the first issue of 2016, this journal uses article numbers instead of page numbers. See further details here.