
Overview of Identified Genomic Regions Associated with Various Agronomic and Physiological Traits in Barley under Abiotic Stresses

 ,
,  , and
, and 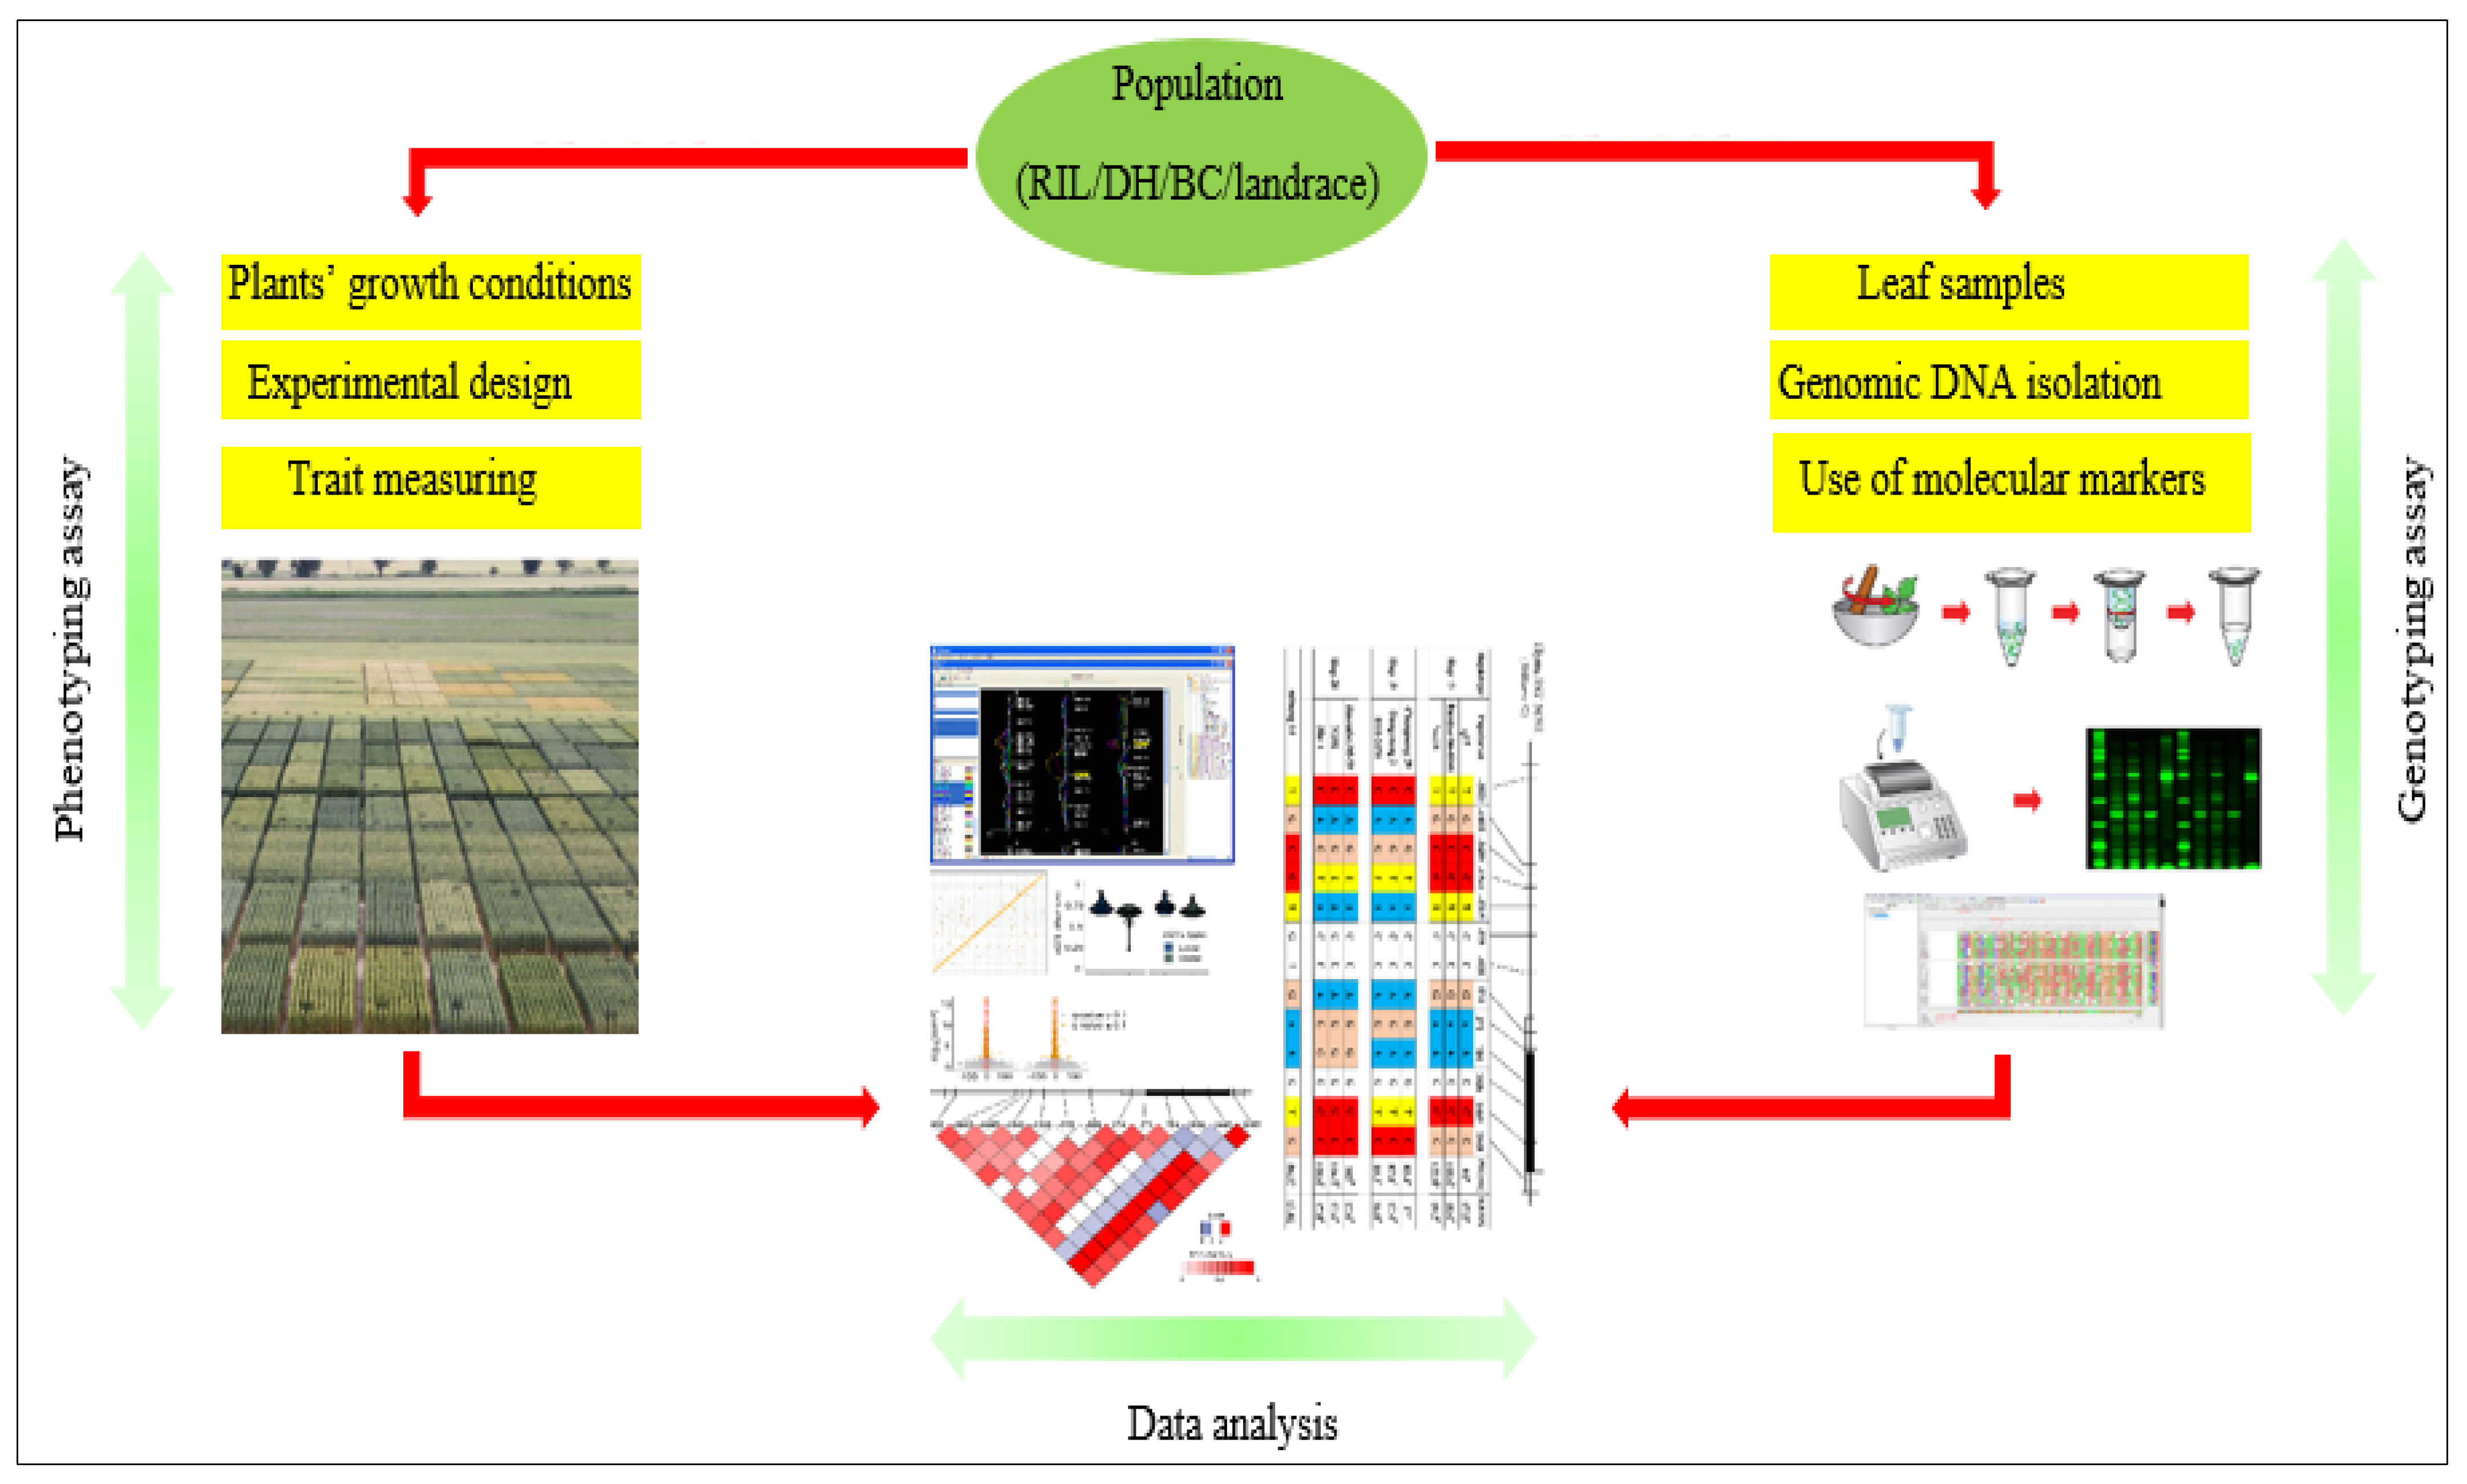
Abstract
:1. Introduction
2. Quantitative Trait Loci (QTL) and Its Role in Breeding Programs
3. Aims of the Review
4. Response of Barley to Abiotic Stresses
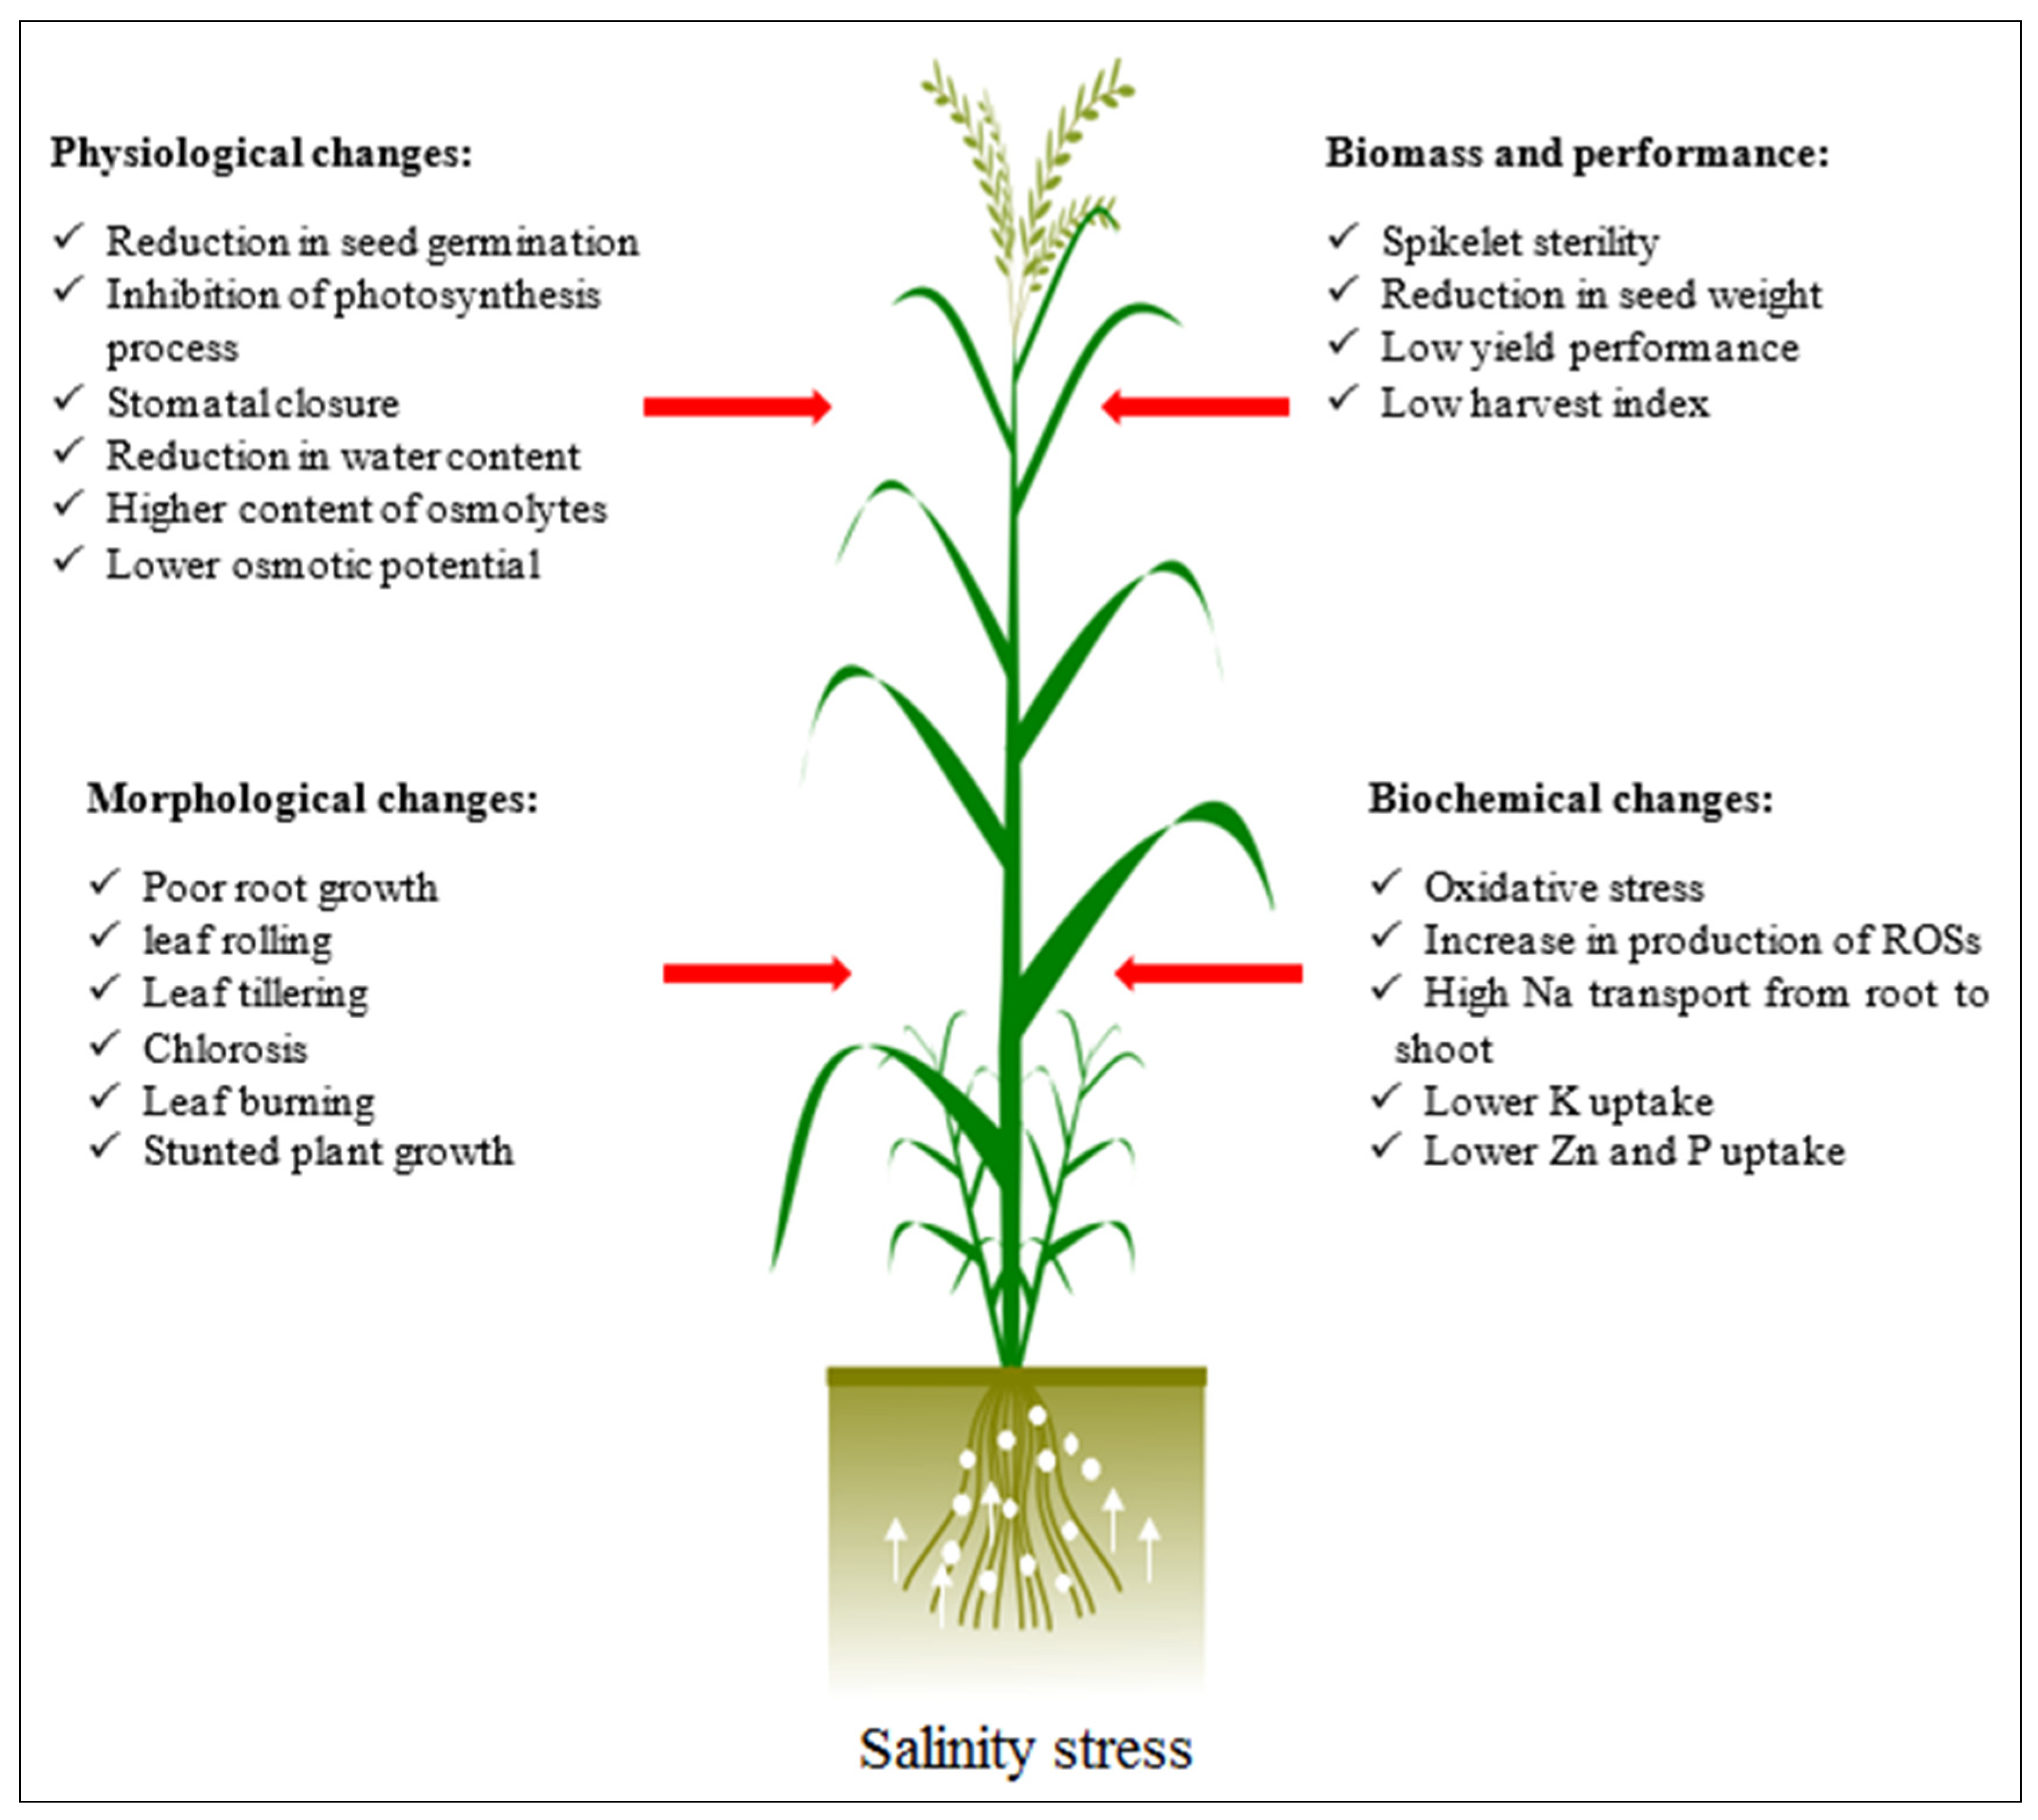
4.1. Salinity
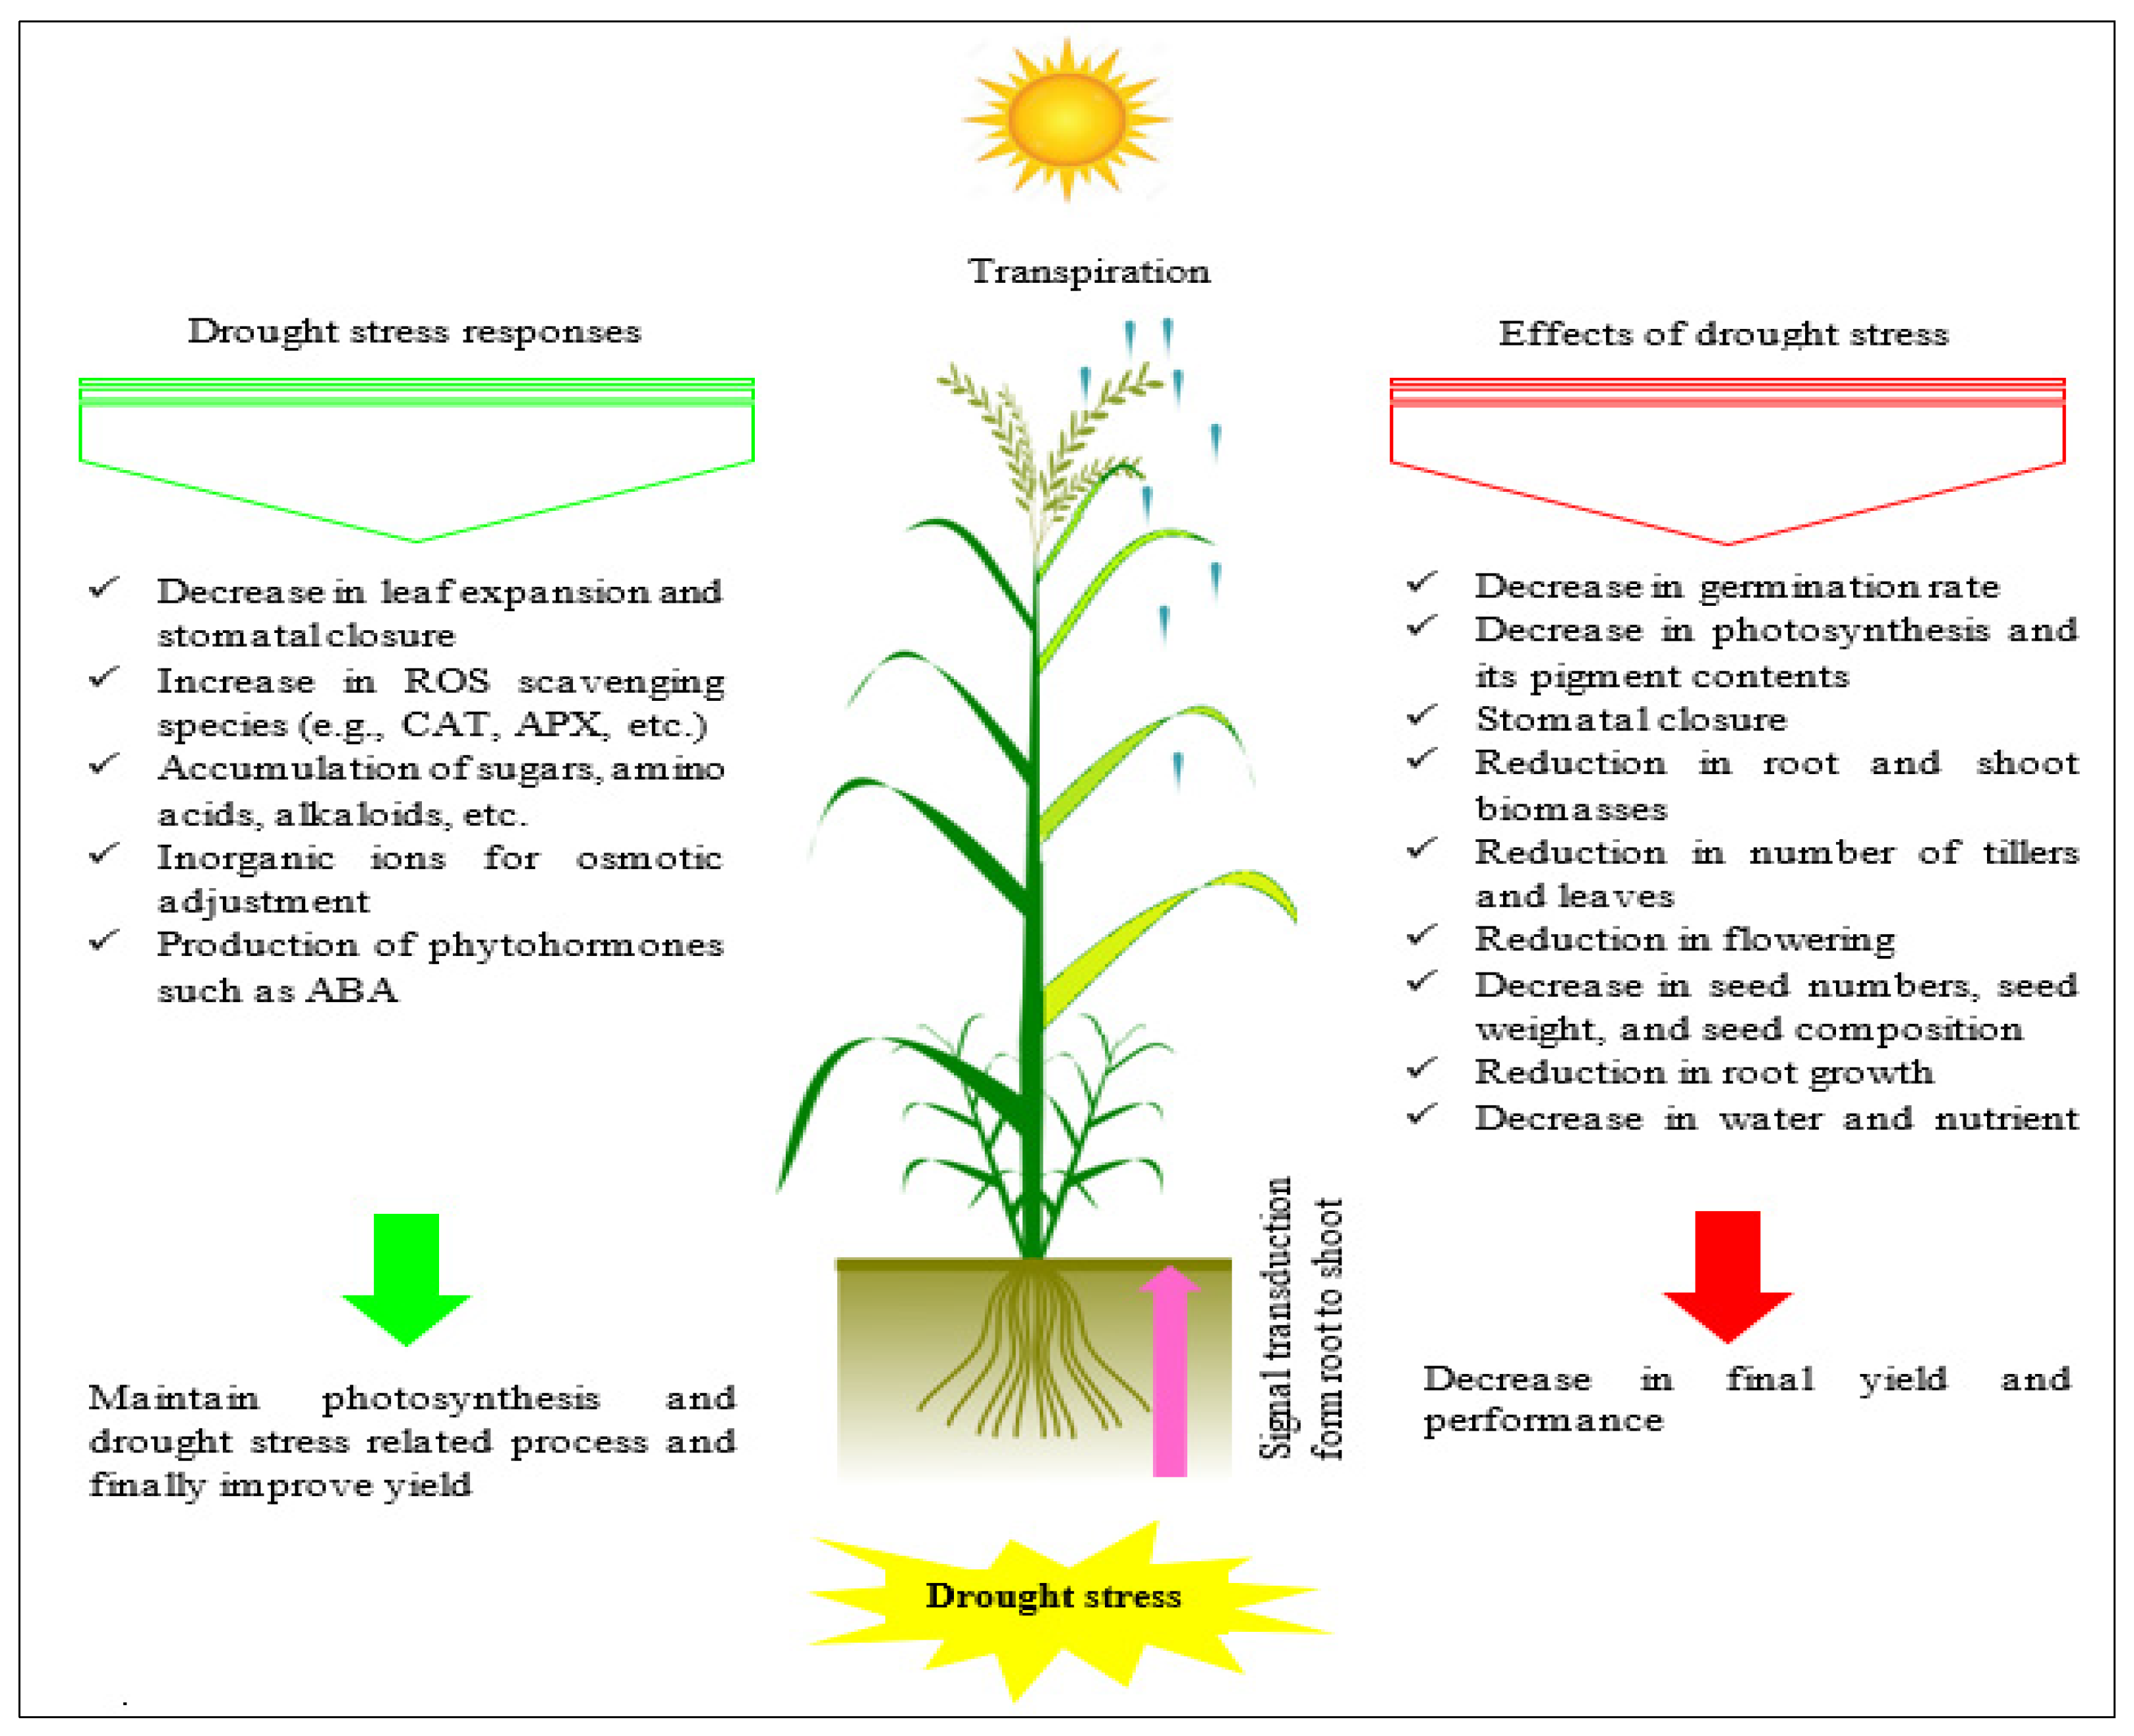
4.2. Drought
4.3. Temperature
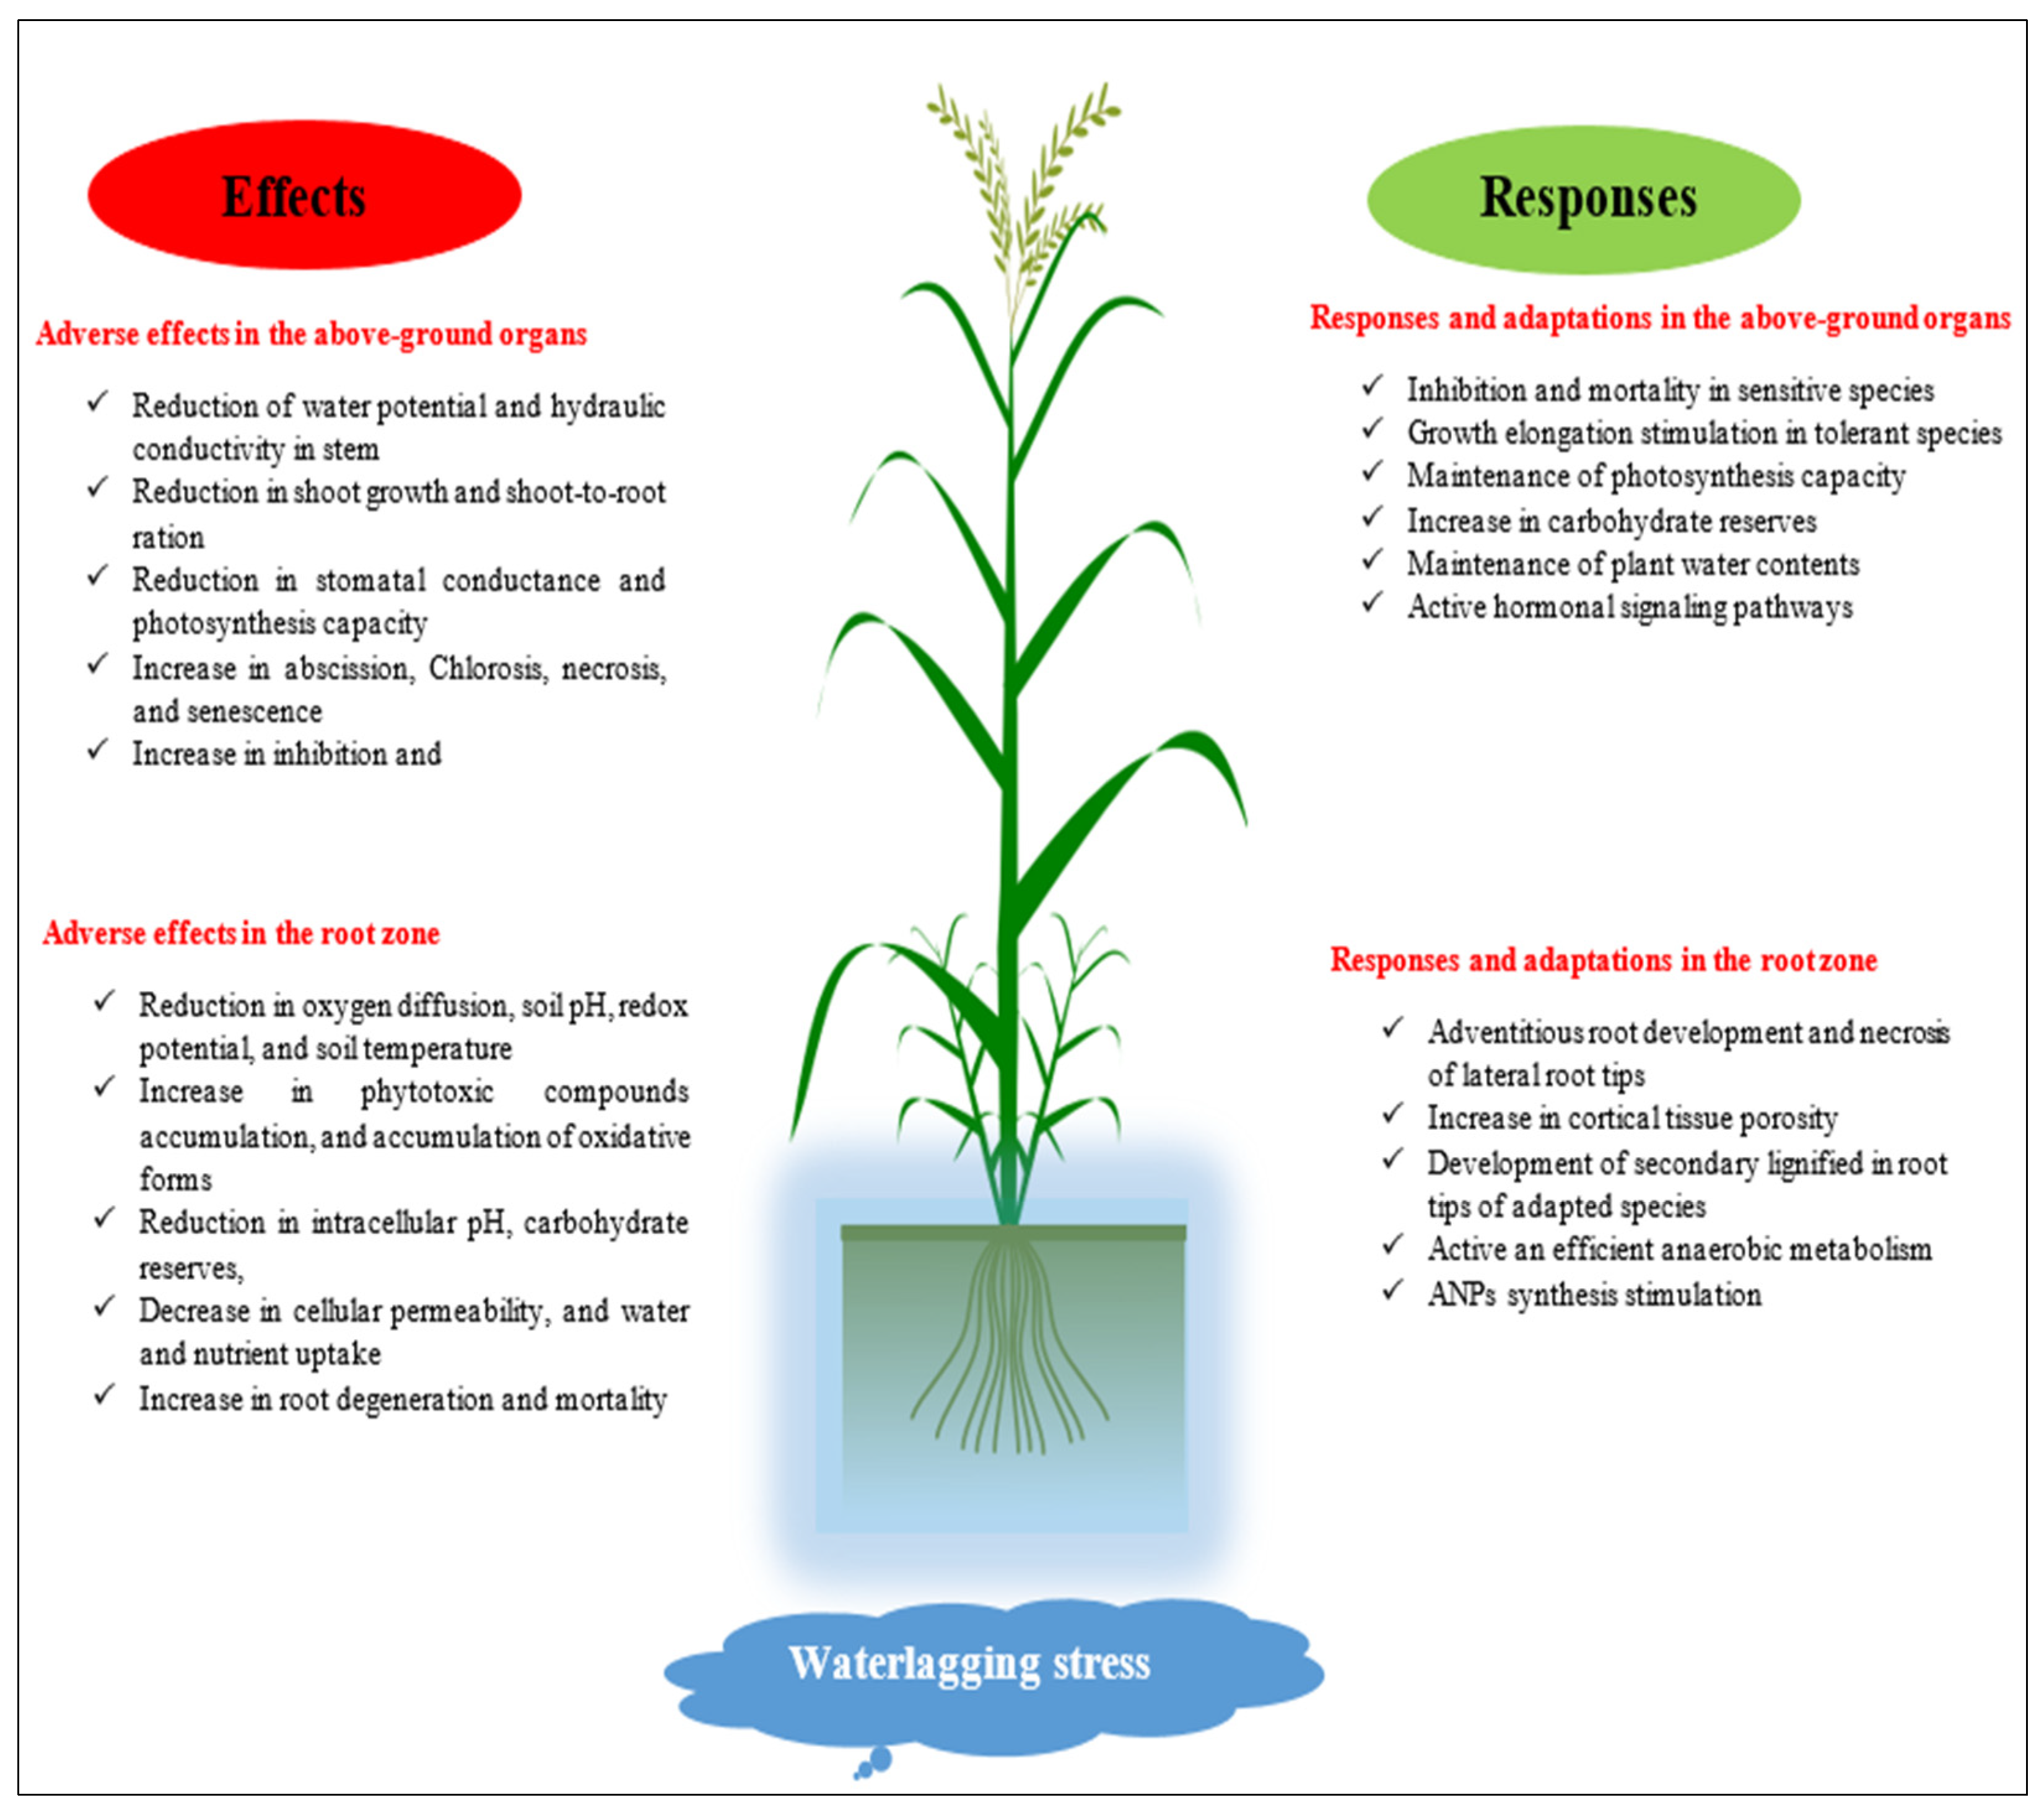
4.4. Waterlogging
4.5. Toxicity
5. Conclusions
Supplementary Materials
Author Contributions
Funding
Institutional Review Board Statement
Data Availability Statement
Conflicts of Interest
References
- Wang, X.K.; Gong, X.; Cao, F.B.; Wang, Y.Z.; Zhang, G.P.; Wu, F.B. HvPAA1 encodes a P-Type ATPase, a novel gene for cadmium accumulation and tolerance in barley (Hordeum vulgare L.). Int. J. Mol. Sci. 2019, 20, 1732. [Google Scholar] [CrossRef] [Green Version]
- Yan, S.; Sun, D.; Sun, G. Genetic divergence in domesticated and non-domesticated gene regions of barley chromosomes. PLoS ONE 2015, 10, e0121106. [Google Scholar] [CrossRef] [Green Version]
- Zohary, D.; Hopf, M. Domestication of Plants in the Old World. In The Origin and Spread of Cultivated Plants in West Asia, Europe, and the Nile Valley; Oxford University Press: New York, NY, USA, 2000. [Google Scholar]
- Harlan, J.R.; Zohary, D. Distribution of wild wheats and barley. Science 1996, 153, 1074–1080. [Google Scholar] [CrossRef]
- Nevo, E. Origin, evolution, population genetics and resources for breeding of wild barley, Hordeum spontaneum, in the Fertile Crescent. In Barley: Genetics, Biochemistry, Molecular Biology and Biotechnology; Shewry, P.R., Ed.; International, The Alden Press: Oxford, UK, 1992; pp. 19–43. [Google Scholar]
- Bothmer, R.V.; Jacobsen, N.; Baden, C.; Jorgensen, R.B.; Linde-Laursen, I. An Ecogeographical Study of the Genus Hordeum; IPGRI: Rome, Italy, 1995; p. 129. [Google Scholar]
- Singh, L.; Park, R.F.; Dracatos, P.; Ziems, L.; Singh, D. Understanding the expression and interaction of Rph genes conferring seedling and adult plant resistance to Puccinia hordei in barley. Can. J. Plant Pathol. 2021, 43, 218–226. [Google Scholar] [CrossRef]
- Vaezi, B.; Pour-Aboughadareh, A.; Mohammadi, R.; Armion, M.; Mehraban, A.; Hossein-Pour, T.; Dorri, M. GGE biplot and AMMI analysis of barley yield performance in Iran. Cereal Res. Commun. 2017, 45, 500–511. [Google Scholar] [CrossRef] [Green Version]
- OECD. Consensus Document on Compositional Considerations for New Varieties of Barley (Hordeum vulgare L.): Key Food and Feed Nutrients and Anti-Nutrients; Report No: 12, Environment Directorate; OECD: Paris, France, 2004. [Google Scholar]
- Heuzé, V.; Tran, G.; Nozière, P.; Bastianelli, D.; Lebas, F. Cowpea (Vigna unguiculata) Forage. Feedipedia, a Programme by INRA, CIRAD, AFZ and FAO. Last Updated on October 20. 2015. Available online: https://www.feedipedia.org/node/233 (accessed on 14 February 2018).
- FAO. Special Report: 2021 FAO Crop and Food Supply Assessment Mission to the Syrian Arab Republic—December 2021; FAO: Rome, Italy, 2021. [Google Scholar]
- Sax, K. The association of size differences with seed-coat pattern and pigmentation in Phaseolus vulgaris. Genetics 1923, 8, 552–560. [Google Scholar] [CrossRef]
- Thoday, J.M. Location of polygenes. Nature 1961, 191, 368–370. [Google Scholar] [CrossRef]
- Kearsey, M.J.; Farquhar, A.G.L. QTL analysis; where are we now? Heredity 1998, 80, 137–142. [Google Scholar] [CrossRef] [Green Version]
- Stuber, C.W.; Lincoln, S.E.; Wolff, D.W.; Helentjaris, T.; Lander, E.S. Identification of genetic factors contributing to heterosis in a hybrid from two elite maize inbred lines using molecular markers. Genetics 1992, 132, 823–839. [Google Scholar] [CrossRef]
- Moose, S.P.; Mumm, R.H. Molecular plant breeding as the foundation for 21st Century crop improvement. Plant Physiol. 2008, 147, 969–977. [Google Scholar] [CrossRef] [Green Version]
- Sham, P.; Bader, J.S.; Craig, I.; Odonovan, M.; Owen, M. DNA pooling: A tool for large-scale association studies. Nat. Rev. Genet. 2002, 3, 862–871. [Google Scholar] [CrossRef]
- Nillson-Ehle, H. Kreuzunguntersuchungen an Hafer und Weizen. Acta Univ. Lund. 1909, 5, 1–122. [Google Scholar]
- East, E.M. Studies on size inheritance in nicotiana. Genetics 1916, 1, 164–176. [Google Scholar] [CrossRef]
- Xu, Y. Quantitative trait loci: Separating, pyramiding, and cloning. Plant Breed. Rev. 1997, 15, 85–139. [Google Scholar]
- Xu, Y. Molecular Plant Breeding; CABI: Wallingford, UK, 2010; p. 736. [Google Scholar]
- Bernardo, R. Molecular markers and selection for complex traits in plants: Learning from the last 20 years. Crop Sci. 2008, 48, 1649–1664. [Google Scholar] [CrossRef] [Green Version]
- Xu, S. Mapping quantitative trait loci using multiple families of line crosses. Genetics 1998, 148, 517–524. [Google Scholar] [CrossRef]
- Collard, B.; Mace, E.; Mcphail, M.; Wenzl, P.; Cakir, M.; Fox, G.; Poulsen, D.; Jordan, D. How accurate are the marker orders in crop linkage maps generated from large marker datasets? Crop Pasture Sci. 2009, 60, 362–372. [Google Scholar] [CrossRef]
- Bradshaw, H.D. Molecular genetics of populus. In Biology of Populus and Its Implications for Management and Conservation; Part 1; Stettler, R.F., Bradshaw, H.D., Heilman, P.E., Hinckley, T.M., Eds.; NRC Research Press: Ottawa, ON, Canada, 1996; pp. 183–199. [Google Scholar]
- Pour-Aboughadareh, A.; Yousefian, M.; Moradkhani, H.; Poczai, P.; Siddique, K.H.M. STABILITYSOFT: A new online program to calculate parametric and non-parametric stability statistics for crop traits. Appl. Plant Sci. 2019, 7, e1211. [Google Scholar] [CrossRef]
- Szareski, V.J.; Carvalho, I.R.; Rosa, T.C.; Dellagostin, S.M.; de Pelegrin, A.J.; Barbosa, M.H.; Pegoraro, C. Wild Species: An Alternative for Rice Breeding under Abiotic Stress Conditions. Am. J. Plant Sci. 2018, 9, 1093–1104. [Google Scholar] [CrossRef] [Green Version]
- Larcher, W. Ecofisiologia Vegetal; Rima Artes: São Carlos, Brazil, 2004. [Google Scholar]
- Shanker, A.; Venkateswarlu, B. Abiotic Stress Response in Plants: Physiological, Biochemical and Genetic Perspectives; InTech Open: Rijeka, Croatia, 2011; p. 360. [Google Scholar]
- Brozynska, M.; Furtado, A.; Henry, R.J. Genomics of crop wild relatives: Expanding the gene pool for crop improvement. Plant Biotechnol. J. 2016, 14, 1070–1085. [Google Scholar] [CrossRef]
- Paterson, A.H.; Lin, Y.R.; Li, Z.; Schertz, K.F.; Doebley, J.F.; Pinson, S.R.; Liu, S.C.; Stansel, J.W.; Irvine, J.E. Convergent domestication of cereal crops by independent mutations at corresponding genetic loci. Science 1995, 269, 1714–1718. [Google Scholar] [CrossRef] [PubMed]
- Arzani, A.; Ashraf, A. Smart engineering of genetic resources for enhanced salinity tolerance in crop plants. Crit. Rev. Plant Sci. 2016, 35, 146–189. [Google Scholar] [CrossRef]
- Honsdorf, N.; March, T.J.; Berger, B.; Tester, M.; Pillen, K. High-throughput phenotyping to detect drought tolerance QTL in wild barley lines introgression. PLoS ONE 2014, 9, e97047. [Google Scholar] [CrossRef] [PubMed] [Green Version]
- Jedmowski, C.; Ashoub, A.; Momtaz, O.; Brüggemann, W. Impact of drought, heat, and their combination on chlorophyll fluorescence and yield of wild barley (Hordeum spontaneum). J. Bot. 2015, 2015, 120868. [Google Scholar] [CrossRef] [Green Version]
- Kilian, B.; Ozkan, H.; von Kohl, J.; Haeseler, A.; Barale, F.; Deusch, O.; Salamini, F. Haplotype structure at seven barley genes: Relevance to gene pool bottlenecks, phylogeny of ear type and site of barley domestication. Mol. Genet. Genom. 2006, 276, 230–241. [Google Scholar] [CrossRef] [Green Version]
- Zhang, H.; Irving, L.J.; McGill, C.; Matthew, C.; Zhou, D.; Kemp, P. The effects of salinity and osmotic stress on barley germination rate: Sodium as an osmotic regulator. Ann. Bot. 2010, 106, 1027–1035. [Google Scholar] [CrossRef]
- FAO. Food and Agriculture Organization of the United Nations. In Global Network on Integrated Soil Management for Sustainable Use of Salt-Affected Soils; FAO: Rome, Italy, 2000. [Google Scholar]
- Toppa, E.V.B.; Brambilla, W.P. O melhoramento de plantas e a salinidade dos solos. Rev. Verde Agroecol. Desenvolv. Sustent. 2011, 6, 21–25. [Google Scholar]
- Fatemi, F.; Hashemi-Petroudi, S.H.; Nematzadeh, G.; Askari, H.; Abdollahi, M.R. Exploiting differential gene expression to discover ionic and osmotic-associated transcripts in the halophyte grass Aeluropus littoralis. Biol. Proced. Online 2019, 21, 14. [Google Scholar] [CrossRef] [Green Version]
- Gheyi, H.R. Problemas de salinidade na agricultura irrigada. In Agricultura, Sustentabilidade e o Semiárido; Oliveira, J.R.C., Assis-Junior, T.S., Romero, R.N., Silva, R.E., Eds.; Sociedade Brasileira de Ciências do Solo: Fortaleza, Brazil, 2000; pp. 329–346. [Google Scholar]
- Willadino, L.; Camara, T.R. Tolerância das plantas à salinidade: Aspectos fisiológicos e bioquímicos. Encicl. Biosfera. 2010, 6, 11. [Google Scholar]
- James, R.; Munns, R.; Caemmerer, S.; Trejo, C.; Miller, C.; Condon, T.A. Photosynthetic capacity is related to the cellular and sub-cellular partitioning of Na+, K+ and Cl− in salt-affected barley and durum wheat. Plant Cell Environ. 2006, 29, 2185–2197. [Google Scholar] [CrossRef]
- Loomis, R.S.; Coonor, D.J. Crop Ecology: Productivity and Management in Agricultural Systems; Cambridge University Press: Cambridge, UK, 1992. [Google Scholar]
- Richardson, S.G.; McCree, K.J. Carbon balance and water relations of sorghum exposed to salt and water stress. Plant Physiol. 1985, 79, 1015–1020. [Google Scholar] [CrossRef] [PubMed] [Green Version]
- Long, N.; Dolstra, V.O.; Malosetti, M.; Kilian, B.; Graner, A.; Visser, R.G.F.; Linden, D. Association mapping of salt tolerance in barley (Hordeum vulgare L.). Theor. Appl. Genet. 2013, 126, 2335–2351. [Google Scholar] [CrossRef] [PubMed]
- Nguyen, V.L.; Ribot, S.A.; Dolstra, O.; Niks, R.E.; Visser, R.E.; Linden, C. Identification of quantitative trait loci for ion homeostasis and salt tolerance in barley (Hordeum vulgare L.). Mol. Breed. 2013, 31, 137–152. [Google Scholar] [CrossRef]
- El Sabagh, A.; Hossain, A.; Islam, M.S.; Barutcular, C.; Hussain, S.; Hasanuzzaman, M.; Akram, T.; Mubben, M.; Nasim, W.; Fahad, S.; et al. Drought and salinity stresses in barley: Consequences and mitigation strategies. Austral. J. Crop Sci. 2019, 13, 810. [Google Scholar] [CrossRef]
- Ahmadi, J.; Pour-Aboughadareh, A.; Fabriki-Ourang, S.; Mehrabi, A.A.; Siddique, K.H.M. Screening wild progenitors of wheat for salinity stress at early stages of plant growth: Insight into potential sources of variability for salinity adaptation in wheat. Crop Pasture Sci. 2018, 69, 649–658. [Google Scholar] [CrossRef]
- Ahmed, S. Effect of Soil Salinity on the Yield and Yield Components of Mungbean. Pak. J. Bot. 2009, 41, 263–268. [Google Scholar]
- Abd El-Monem, A.A.; El-Habbasha, S.F.; Hozayn, M. Mitigation salinity stress effects on barley (Hordeum vulgare L.) growth, yield and some physiological aspects by Hemin. J. Appl. Sci. Res. 2013, 9, 2411–2421. [Google Scholar]
- Pour-Aboughadareh, A.; Mehrvar, M.R.; Sanjani, S.; Amini, A.; Nikkhah-Chamanabad, H.; Asadi, A. Effects of salinity stress on seedling biomass, physiochemical properties, and grain yield in different breeding wheat genotypes. Acta Physiol. Plant. 2021, 43, 98–122. [Google Scholar] [CrossRef]
- Pour-Aboughadareh, A.; Sanjani, S.; Nikkhah-Chamanabad, H.; Mehrvar, M.R.; Asadi, A.; Amini, A. Identification of salt tolerant barley genotypes using multiple-traits index and yield performance at the early growth and maturity stages. Bull. Natl. Res. Cent. 2021, 45, 117. [Google Scholar] [CrossRef]
- Ma, X.; Li, C.; Wang, A.; Duan, R.; Jiao, G.; Nevo, E.; Chen, G. Genetic diversity of wild barley (Hordeum vulgare ssp. spontaneum) and its utilization for barley improvement. Sci. Cold Arid Reg. 2012, 4, 0453–0461. [Google Scholar]
- Nevo, E.; Chen, G. Drought and salt tolerances in wild relatives for wheat and barley improvement. Plant Cell Environ. 2010, 33, 670–685. [Google Scholar] [CrossRef] [PubMed]
- Ebrahim, F.; Arzani, A.; Rahimmalek, M.; Sun, D.; Peng, J. Salinity tolerance of wild barley Hordeum vulgare ssp. spontaneum. Plant Breed. 2020, 139, 304–316. [Google Scholar] [CrossRef]
- Tester, M.; Davenport, R. Na+ tolerance and Na+ transport in higher plants. Ann. Bot. 2003, 91, 503–527. [Google Scholar] [CrossRef] [PubMed]
- Ashraf, M. Some important physiological selection criteria for salt tolerance in plants. Flora Morphol. Distrib. Funct. Ecol. Plants 2004, 199, 361–376. [Google Scholar] [CrossRef]
- Ahmadi, J.; Pour-Aboughadareh, A.; Fabriki Ourang, S.; Poczai, K.P.P. Unraveling salinity stress responses in ancestral and neglected wheat species at early growth stage: A baseline for utilization in future wheat improvement programs. Physiol. Mol. Biol. Plants 2020, 26, 537–549. [Google Scholar] [CrossRef]
- Ahmadi, A.; Emam, Y.; Pessarakli, M. Response of various cultivars of wheat and maize to salinity stress. J. Food Agric. Environ. 2009, 7, 123–128. [Google Scholar]
- Fricke, W.; Peters, W.S. The biophysics of leaf growth in salt stressed barley: A study at the cell level. Plant Physiol. 2002, 129, 374–388. [Google Scholar] [CrossRef] [Green Version]
- Pirasteh-Anosheh, H.; Ranjbar, G.; Pakniyat, H.; Emam, Y. Physiological mechanisms of salt stress tolerance in plants: An overview. In Plant Environment Interaction: Responses and Approaches to Mitigate Stress; Mahgoub-Azooz, M., Ahmad, P., Eds.; John Wiley & Sons, Ltd.: Jammu and Kashmir, India, 2016; Chapter 8; pp. 141–160. [Google Scholar]
- Gill, S.S.; Tuteja, N. Reactive oxygen species and antioxidant machinery in abiotic stress tolerance in crop plants. Plant Physiol. Biochem. 2010, 48, 909–930. [Google Scholar] [CrossRef]
- Zeeshan, M.; Lu, M.; Sehar, S.; Holford, P.; Wu, F. Comparison of Biochemical, Anatomical, Morphological, and Physiological Responses to Salinity Stress in Wheat and Barley Genotypes Deferring in Salinity Tolerance. Agronomy 2020, 10, 127. [Google Scholar] [CrossRef] [Green Version]
- Thabet, S.G.; Moursi, Y.S.; Sallam, A.; Karam, M.A.; Alqudah, A.M. Genetic associations uncover candidate SNP markers and genes associated with salt tolerance during seedling developmental phase in barley. Environ. Exp. Bot. 2021, 188, 104499. [Google Scholar] [CrossRef]
- Mwando, E.; Angessa, T.T.; Han, Y.; Zhou, G.; Li, C. Quantitative trait loci mapping for vigour and survival traits of barley seedlings after germinating under salinity stress. Agronomy 2021, 11, 103. [Google Scholar] [CrossRef]
- Mwando, E.; Han, Y.; Angessa, T.T.; Zhou, G.; Hill, C.B.; Zhang, X.Q.; Li, C. Genome-Wide Association Study of Salinity Tolerance During Germination in Barley (Hordeum vulgare L.). Front. Plant Sci. 2020, 11, 118. [Google Scholar] [CrossRef] [PubMed] [Green Version]
- Maddur, A.M. The inheritance of salt tolerance in barley (Hordeum vulgare L.). Dissert. Abstr. Int. B 1977, 37, 5911 B. [Google Scholar]
- Mano, Y.; Nakazumi, H.; Takeda, K. Varietal variation in and effects of some major genes on salt tolerance at the germination stage in barley. Jpn. J. Breed. 1996, 46, 227–233. [Google Scholar] [CrossRef] [Green Version]
- Mano, Y.; Takeda, K. Genetical studies on salt tolerance at germination in recombinant inbred, isogenic, and doubled haploid lines of barley (Hordeum vulgare L.). Bull Res. Inst. Bioresour. Okayama Univ. 1996, 4, 79–88. [Google Scholar]
- Ullrich, S.E.; Hayes, P.M.; Dyer, W.E.; Blake, T.K.; Clancy, J.A. Quantitative trait locus analysis of seed dormancy in Steptoe barley. In Pre-Harvest in Cereals Walker-Simmons; Ried, J.L., Ed.; USDA-ARS Washington State University Pullman: Washington, DC, USA, 1992; pp. 136–145. [Google Scholar]
- Karahara, I.; Horie, T. Functions and structure of roots and their contributions to salinity tolerance in plants. Breed. Sci. 2021, 71, 89–108. [Google Scholar] [CrossRef] [PubMed]
- Barati, A.; Moghaddam, M.; Mohammadi, S.A.; Ghazvini, H.A.; Sadeghzadeh, B. Identification of QTLs associated with agronomic and physiological traits under salinity stress in barley. J. Agric. Sci. Technol. 2017, 19, 185–200. [Google Scholar]
- Fan, Y.; Zhou, G.; Shabala, S.; Chen, Z.; Cai, S.; Li, C.; Zhou, M. Genome-wide association study reveals a new QTL for salinity tolerance in barley (Hordeum vulgare L.). Front. Plant Sci. 2016, 7, 946. [Google Scholar] [CrossRef] [Green Version]
- Angessa, T.T.; Zhang, X.Q.; Zhou, G.; Broughton, S.; Zhang, W.; Li, C. Early growth stages salinity stress tolerance in CM72 x Gairdner doubled haploid barley population. PLoS ONE 2017, 12, e0179715. [Google Scholar] [CrossRef] [Green Version]
- Sayed, M.A.; Nassar, S.M.; Moustafa, E.S.; Said, M.T.; Börner, A.; Hamada, A. Genetic Mapping Reveals Novel Exotic and Elite QTL Alleles for Salinity Tolerance in Barley. Agronomy 2021, 11, 1774. [Google Scholar] [CrossRef]
- Zhou, G.; Zhang, Q.; Tan, C.; Zhang, X.Q.; Li, C. Development of genome-wide InDel markers and their integration with SSR, DArT and SNP markers in single barley map. BMC Genom. 2015, 16, 804. [Google Scholar] [CrossRef] [PubMed] [Green Version]
- Xue, W.T.; Yan, J.; Jiang, Y.; Zhan, Z.J.; Zhao, G.; Tondelli, A.; Cattivelli, L.; Cheng, J.P. Genetic dissection of winter barley seedling response to salt and osmotic stress. Mol. Breed. 2019, 39, 139. [Google Scholar] [CrossRef] [Green Version]
- Gill, M.B.; Zeng, F.; Shabala, L.; Zhang, G.P.; Yu, M.; Demidchik, V.; Shabala, S.; Zhou, M.X. Identification of QTL related to ROS formation under hypoxia and their association with waterlogging and salt tolerance in barley. Int. J. Mol. Sci. 2019, 20, 699. [Google Scholar] [CrossRef] [PubMed] [Green Version]
- Capo-chichi, L.J.A.; Eldridge, S.; Elakhdar, A.; Kubo, T.; Brueggeman, R.; Anyia, A.O. QTL Mapping and Phenotypic Variation for Seedling Vigour Traits in Barley (Hordeum vulgare L.). Plants 2021, 10, 1149. [Google Scholar] [CrossRef]
- Sayed, M.A.; Tarawneh, R.; Youssef, H.M.; Pillen, K.; Börner, A. Detection and Verification of QTL for Salinity Tolerance at Germination and Seedling Stages Using Wild Barley Introgression Lines. Plants 2021, 10, 2246. [Google Scholar] [CrossRef] [PubMed]
- Liu, X.; Fan, Y.; Mak, M.; Babla, M.; Holford, P.; Wang, F.; Chen, G.; Scott, G.; Wang, G.; Shabala, S.; et al. QTLs for stomatal and photosynthetic traits related to salinity tolerance in barley. BMC Genom. 2017, 18, 9. [Google Scholar] [CrossRef] [Green Version]
- Saade, S.; Brien, C.; Pailles, Y.; Berger, B.; Shahid, M.; Russell, J.; Waugh, R.; Negrão, S.; Tester, M. Dissecting new genetic components of salinity tolerance in two-row spring barley at the vegetative and reproductive stages. PLoS ONE 2020, 15, e0236037. [Google Scholar] [CrossRef]
- Wang, J.B.; Sun, G.L.; Ren, X.F.; Li, C.D.; Liu, L.P.; Wang, Q.F.; Du, B.B.; Sun, D.F. QTL underlying some agronomic traits in barley detected by SNP markers. BMC Genet. 2016, 17, 103. [Google Scholar] [CrossRef] [Green Version]
- Xue, D.; Huang, Y.; Zhang, X.; Wei, K.; Westcott, S.; Li, C.; Chen, M.; Zhang, G.; Lance, R. Identification of QTLs associated with salinity tolerance at late growth stage in barley. Euphytica 2009, 169, 187–196. [Google Scholar] [CrossRef]
- Sbei, H.; Sato, K.; Shehzad, T.; Harrabi, M.; Okuno, K. Detection of QTLs for salt tolerance in Asian barley (Hordeum vulgare L.) by association analysis with SNP markers. Breed Sci. 2014, 64, 378–388. [Google Scholar] [CrossRef] [Green Version]
- Xue, R.; Wang, J.; Li, C.; Johnson, P.; Lu, C.; Zhou, M. A single locus is responsible for salinity tolerance in a Chinese landrace barley (Hordeum vulgare L.). PLoS ONE 2012, 7, e43079. [Google Scholar] [CrossRef] [PubMed]
- Ma, Y.; Shabala, S.; Li, C.; Liu, C.; Zhang, W.; Zhou, M. Quantitative Trait Loci for Salinity Tolerance Identified under Drained and Waterlogged Conditions and Their Association with Flowering Time in Barley (Hordeum vulgare. L). PLoS ONE 2015, 10, e0134822. [Google Scholar] [CrossRef] [PubMed] [Green Version]
- Magalhães, J.A. A influência de características fenológicas na avaliação da tolerância à seca em sorgo. In Circular Técnica 165; Embrapa Milho e Sorgo: Sete Lagoas, Brazil, 2011. [Google Scholar]
- Khalili, M.; Naghavi, M.R.; Pour-Aboughadareh, A.R.; Talebzadeh, S.J. Evaluating of drought stress tolerance based on selection indices in spring canola cultivars (Brassica napus L.). J. Agric. Sci. 2012, 4, 78–85. [Google Scholar] [CrossRef]
- Cambraia, J. Aspectos bioquímicos, celulares e fisiológicos dos estresses nutricionais em plantas. In Estresses Ambientais: Danos e Benefícios em Plantas; Nogueira, U.M.T., Araújo, R.J.M.C., Willadino, E.L., Cavalcante, L.G., Eds.; Imprensa Universitária UFRPE: Recife, Brazil, 2005; pp. 95–105. [Google Scholar]
- Troyjack, C.; Carvalho, I.R.; Pimentel, J.R.; Junior, G.T.; Szareski, V.J.; Dubal, Í.T.P.; Conte, G.G. Envronmental stresses and its implications on breeding of brewing barley. Agron. Sci. Biotechnol. 2021, 7, 1–18. [Google Scholar] [CrossRef]
- Lopes, N.F.; Lima, M.G.S. Fisiologia da Produção; Viçosa, M.G., Ed.; Editora UFV: Vicosa, Brazil, 2015. [Google Scholar]
- Oukarroum, A.; Madidi, S.; El Schansker, G.; Strasser, R.J. Probing the responses of barley cultivars (Hordeum vulgare L.) by chlorophyll a fluorescence OLKJIP under drought stress and re-watering. Environ. Exp. Bot. 2007, 60, 438–446. [Google Scholar] [CrossRef]
- Cantero, C.; Villar, J.M.; Fereres, E. Relaciones hídricas de genótipos de cereal de invierno en condiciones de secano semiárido em la Segarra. Riegos Dren. 1989, 29, 32–39. [Google Scholar]
- Mahmood, Y.; Hassan, H.N.; Mohammed, M.S. Yield Performance of Barley Hybrids (Hordeum vulgare L.) under Drought stress and non-stressed Conditions. Passer J. 2021, 3, 107–113. [Google Scholar] [CrossRef]
- Cai, K.; Chen, X.; Han, Z.; Wu, X.; Zhang, S.; Li, Q.; Nazir, M.M.; Zhang, G.; Zeng, F. Screening of worldwide barley collection for drought tolerance: The assessment of various physiological measures as the selection criteria. Front. Plant Sci. 2020, 11, 1159. [Google Scholar] [CrossRef]
- Naz, A.A.; Ehl, A.; Pillen, K.; Leon, J. Validation for root-related quantitative trait locus effects of wild origin in the cultivated background of barley (Hordeum vulgare L.). Plant Breed. 2012, 131, 392–398. [Google Scholar]
- Gahoonia, T.S.; Nielsen, N.E. Barley genotypes with long root hairs sustain high grain yields in low-P field. Plant Soil. 2004, 262, 55–62. [Google Scholar] [CrossRef]
- Mehrabi, A.A.; Pour-Aboughadareh, A.; Mansouri, S.; Hosseini, A. Genome-wide association analysis of root system architecture features and agronomic traits in durum wheat. Mol. Breed. 2020, 40, 55. [Google Scholar] [CrossRef]
- Siddiqui, N.; Léon, J.; Naz, A.A.; Ballvora, A. Genetics and genomics of root system variation in adaptation to drought stress in cereal crops. J. Exp. Bot. 2021, 72, 1007–1019. [Google Scholar] [CrossRef] [PubMed]
- Marok, M.A.; Marok-Alim, D.; Rey, P. Contribution of functional genomics to identify the genetic basis of water-deficit tolerance in barley and the related molecular mechanisms. J. Agron. Crop Sci. 2021, 207, 913–935. [Google Scholar] [CrossRef]
- Fan, Y.; Shabala, S.; Ma, Y.; Xu, R.; Zhou, M. Using QTL mapping to investigate the relationships between abiotic stress tolerance (drought and salinity) and agronomic and physiological traits. BMC Genom. 2015, 16, 43. [Google Scholar] [CrossRef] [Green Version]
- Mora, F.; Quitral, Y.A.; Matus, I.; Russell, J.; Waugh, R.; Del Pozo, A. SNP-based QTL mapping of 15 complex traits in barley under rain-fed and well-watered conditions by a mixed modeling approach. Front. Plant Sci. 2016, 7, 909. [Google Scholar] [CrossRef]
- Wójcik-Jagła, M.; Fiust, A.; Ko’scielniak, J.; Rapacz, M. Association mapping of drought tolerance-related traits in barley to complement a traditional biparental QTL mapping study. Theor. Appl. Genet. 2018, 131, 167–181. [Google Scholar] [CrossRef] [Green Version]
- Abed, A.; Belzile, F. Comparing single-SNP, multi-SNP, and haplotype-based approaches in association studies for major traits in barley. Plant Genome 2019, 12, 190036. [Google Scholar] [CrossRef] [Green Version]
- Tarawneh, R.A.; Alqudah, A.M.; Nagel, M.; Börner, A. Genome-wide association mapping reveals putative candidate genes for drought tolerance in barley. Environ. Exp. Bot. 2020, 180, 104237. [Google Scholar] [CrossRef]
- Dhanagond, S.; Liu, G.; Zhao, Y.; Chen, D.; Grieco, M.; Reif, J.; Kilian, B.; Graner, A.; Neumann, K. Non-invasive phenotyping reveals genomic regions involved in pre-anthesis drought tolerance and recovery in spring barley. Front. Plant Sci. 2019, 10, 1307. [Google Scholar] [CrossRef] [Green Version]
- Abdel-Ghani, A.H.; Sharma, R.; Wabila, C.; Dhanagond, S.; Owais, S.J.; Duwayri, M.A.; Al-Dalain, S.A.; Klukas, C.; Chen, D.; Lübberstedt, T. Genome-wide association mapping in a diverse spring barley collection reveals the presence of QTL hotspots and candidate genes for root and shoot architecture traits at seedling stage. BMC Plant Biol. 2019, 19, 216. [Google Scholar] [CrossRef]
- Pham, A.; Maurer, A.; Pillen, K.; Brien, C.; Dowling, K.; Berger, B.; Eglinton, J.K.; March, T.J. Genome-wide association of barley plant growth under drought stress using a nested association mapping population. BMC Plant Biol. 2019, 19, 134. [Google Scholar] [CrossRef] [PubMed] [Green Version]
- Moualeu-Ngangue, D.; Dolch, C.; Schneider, M.; Leon, J.; Uptmoor, R.; Stutzel, H. Physiological and morphological responses of different spring barley genotypes to water deficit and associated QTLs. PLoS ONE 2020, 15, e0237834. [Google Scholar] [CrossRef] [PubMed]
- Kumar, P.; Malik, R.; Tikle, A.N.; Neeraj Budhlakoti, R.P.S. Microsatellite markers based association mapping for yield contributing traits in exotic barley (Hordeum vulgare L.) accessions from ICARDA. Indian J. Genet. Plant Breed. 2021, 81, 1–5. [Google Scholar]
- Zhang, M.; Fu, M.M.; Qiu, C.W.; Cao, F.; Chen, Z.H.; Zhang, G.; Wu, F. Response of Tibetan wild barley genotypes to drought stress and identification of quantitative trait loci by genome-wide association analysis. Int. J. Mol. Sci. 2019, 20, 791. [Google Scholar] [CrossRef] [PubMed] [Green Version]
- Moursi, Y.S.; Thabet, S.G.; Amro, A.; Dawood, M.F.A.; Baenziger, P.S.; Sallam, A. Detailed genetic analysis for identifying QTLs associated with drought tolerance at seed germination and seedling stages in barley. Plants 2020, 9, 1425. [Google Scholar] [CrossRef]
- Gudys, K.; Guzy-Wrobelska, J.; Janiak, A.; Dziurka, M.A.; Ostrowska, A.; Hura, K.; Jurczyk, B.; Żmuda, K.; Grzybkowska, D.; Śróbka, J.; et al. Prioritization of candidate genes in QTL regions for physiological and biochemical traits underlying drought response in barley (Hordeum vulgare L.). Front. Plant Sci. 2018, 9, 769. [Google Scholar] [CrossRef] [Green Version]
- Arifuzzaman, M.; Sayed, M.A.; Muzammil, S.; Pillen, K.; Schumann, H.; Naz, A.A.; Leon, J. Detection and validation of novel QTL for shoot and root traits in barley (Hordeum vulgare L.). Mol. Breed. 2014, 34, 1373–1387. [Google Scholar] [CrossRef]
- Szücs, P.; Blake, V.C.; Bhat, P.R.; Chao, S.; Close, T.J.; Cuesta-Marcos, A.; Muehlbauer, G.J.; Ramsay, L.; Waugh, R.; Hayes, P.M. An integrated resource for barley linkage map and malting quality QTL alignment. Plant Genome 2009, 2, 134–140. [Google Scholar] [CrossRef] [Green Version]
- Berger, G.L.; Liu, S.; Hall, M.D.; Brooks, W.S.; Chao, S.; Muehlbauer, G.J.; Baik, B.K.; Steffenson, B.; Griffey, C.A. Marker-trait associations in Virginia Tech winter barley identified using genome-wide mapping. Theor. Appl. Genet. 2012, 126, 693–710. [Google Scholar] [CrossRef]
- Gawenda, I.; Thorwarth, P.; Günther, T.; Ordon, F.; Schmid, K.J. Genome-wide association studies in elite varieties of German winter barley using single-marker and haplotype-based methods. Plant Breed. 2015, 134, 28–39. [Google Scholar] [CrossRef]
- Honsdorf, N.; March, T.J.; Pillen, K. QTL controlling grain filling under terminal drought stress in a set of wild barley introgression lines. PLoS ONE 2017, 12, e0185983. [Google Scholar] [CrossRef] [PubMed] [Green Version]
- Inostroza, L.; Del Pozo, A.; Matus, I.; Castillo, D.; Hayes, P.; Machado, S.; Corey, A. Association mapping of plant height, yield, and yield stability in recombinant chromosome substitution lines (RCSLs) using Hordeum vulgare subsp. Spontaneum as a source of donor alleles in a Hordeum vulgare subsp. vulgare background. Mol. Breed. 2009, 23, 365–376. [Google Scholar]
- Elakhdar, A.; Kumamaru, T.; Qualset, C.O.; Brueggeman, R.S.; Amer, K.; Capo-chichi, L. Assessment of genetic diversity in Egyptian barley (Hordeum vulgare L.) genotypes using SSR and SNP markers. Genet. Resour. Crop. Evol. 2018, 65, 1937–1951. [Google Scholar] [CrossRef]
- Diab, A.A.; Teulat-Merah, B.; This, D.; Ozturk, N.Z.; Benscher, D.; Sorrells, M.E. Identification of drought-inducible genes and differentially expressed sequence tags in barley. Theor. Appl. Genet. 2004, 109, 1417–1425. [Google Scholar] [CrossRef] [PubMed]
- Peighambari, S.A.; Samadi, B.Y.; Nabipour, A.W.C.I.T.; Charmet, G.; Sarrafi, A. QTL analysis for agronomic traits in a barley doubled haploids population grown in Iran. Plant Sci. 2005, 169, 1008–1013. [Google Scholar] [CrossRef]
- Cattivelli, L.; Ceccarelli, S.; Romagosa, I.; Stanca, M. Abiotic stresses in Barley: Problems and solutions. In Barley: Production, Improvement, and Uses; Steven, E., Ed.; Blackwell Publishing Ltd.: Oxford, UK, 2010; pp. 282–306. [Google Scholar]
- Andleeb, T.; Shah, T.; Nawaz, R.; Munir, I.; Munsif, F.; Jalal, A. QTL mapping for drought stress tolerance in plants. In Salt and Drought Stress Tolerance in Plants; Springer: Cham, Switzerland, 2020; pp. 383–403. [Google Scholar]
- Gous, P.W.; Hickey, L.; Christopher, J.T.; Franckowiak, J.; Fox, G.P. Discovery of QTL for stay-green and heat-stress in barley (Hordeum vulgare) grown under simulated abiotic stress conditions. Euphytica 2016, 207, 305–317. [Google Scholar] [CrossRef]
- Zhou, H.; Luo, W.; Gao, S.; Ma, J.; Zhou, M.; Wei, Y.; Zheng, Y.; Liu, Y.; Liu, C. Identification of loci and candidate genes controlling kernel weight in barley based on a population for which whole genome assemblies are available for both parents. Crop J. 2020, 9, 854–861. [Google Scholar] [CrossRef]
- Oyiga, B.C.; Palczak, J.; Wojciechowski, T.; Lynch, J.P.; Naz, A.A.; Léon, J.; Ballvora, A. Genetic components of root architecture and anatomy adjustments to water-deficit stress in spring barley. Plant Cell Environ. 2020, 43, 692–711. [Google Scholar] [CrossRef]
- Wehner, G.; Balko, C.; Humbeck, K.; Zyprian, E.; Ordon, F. Expression profiling of genes involved in drought stress and leaf senescence in juvenile barley. BMC Plant Biol. 2016, 16, 3. [Google Scholar] [CrossRef] [Green Version]
- Craufurd, P.Q.; Flower, D.J.; Peacock, J.M. Effect of heat and drought stress on sorghum (Sorghum bicolor). I. Panicle development and leaf appearance. Exp. Agric. 1993, 29, 61–76. [Google Scholar] [CrossRef]
- Prasad, P.V.V.; Pisipati, S.R.; Momčilović, I.; Ristic, Z. Independent and Combined Effects of High Temperature and Drought Stress During Grain Filling on Plant Yield and Chloroplast EF-Tu Expression in Spring Wheat. J. Agron. Crop Sci. 2011, 197, 430–441. [Google Scholar] [CrossRef]
- Savin, R.; Nicolas, M.E. Effects of short periods of drought and high temperature on grain growth and starch accumulation of two malting barley cultivars. Funct. Plant Biol. 1996, 23, 201. [Google Scholar] [CrossRef]
- Dellagostin, S.M.; Martinazzo, E.G.; Pimentel-Junior, R.; Troyjack, C.; Pedó, T. Temperaturas extremas e qualidade fisiológica de sementes de plantas de lavoura. In Estresses Ambientais e a Produção de Sementes: Ciência e Aplicação; Aumonde, F.A., Pedó, T.Z., Martinazzo, T., Villela, E.G., Pelotas, R.S., Eds.; Cópias Santa Cruz: Pelotas, Brazil, 2017; pp. 171–198. [Google Scholar]
- Essemine, J.; Ammar, S.; Bouzid, S. Impact of heat stress on germination and growth in higher plants: Physiological, biochemical and molecular repercussions and mechanisms of defence. J. Biol. Sci. 2010, 10, 565–572. [Google Scholar] [CrossRef] [Green Version]
- Brestic, M.; Zivcak, M. PSII fluorescence techniques for measurement of drought and high temperature stress signal in crop plants: Protocols and applications. In Molecular Stress Physiology of Plants; Springer: Berlin, Germany, 2013; pp. 87–131. [Google Scholar]
- Wang, X.; Dinler, B.S.; Vignjevic, M.; Jacobsen, S.; Wollenweber, B. Physiological and proteome studies of responses to heat stress during grain filling in contrasting wheat cultivars. Plant Sci. 2015, 230, 33–50. [Google Scholar] [CrossRef] [PubMed]
- Ashraf, M.; Harris, P.J. Photosynthesis under stressful environments: An overview. Photosynthetica 2013, 51, 163–190. [Google Scholar] [CrossRef]
- Oukarroum, A.; El Madidi, S.; Strasser, R.J. Differential heat sensitivity index in barley cultivars (Hordeum vulgare L.) monitored by chlorophyll a fluorescence OKJIP. Plant Physiol. Biochem. 2016, 105, 102–108. [Google Scholar] [CrossRef] [Green Version]
- Gupta, N.K.; Khan, A.; Maheshwari, A.; Narayan, S.; Chhapola, O.P.; Arora, A.; Singh, G. Effect of post anthesis high temperature stress on growth, physiology and antioxidative defense mechanisms in contrasting wheat genotypes. Indian J. Plant Physiol. 2015, 20, 103–110. [Google Scholar] [CrossRef]
- Bita, C.E.; Gerats, T. Plant tolerance to high temperature in a changing environment: Scientific fundamentals and production of heat stress-tolerant crops. Front. Plant Sci. 2013, 4, 273. [Google Scholar] [CrossRef] [Green Version]
- Bahrami, F.; Arzani, A.; Rahimmalek, M. Photosynthetic and yield performance of wild barley (Hordeum vulgare ssp. spontaneum) under terminal heat stress. Photosynthetica 2019, 57, 9–17. [Google Scholar] [CrossRef]
- Guerra, D.; Morcia, C.; Badeck, F.; Rizza, F.; Delbono, S.; Francia, E.; Milc, J.A.; Monostori, I.; Galiba, G.; Cattivelli, L.; et al. Extensive allele mining discovers novel genetic diversity in the loci controlling frost tolerance in barley. Theor. Appl. Genet. 2022, 135, 553–569. [Google Scholar] [CrossRef]
- Muñoz-Amatriaín, M.; Hernandez, J.; Herb, D.; Baenziger, P.S.; Bochard, A.M.; Capettini, F.; Casas, A.; Cuesta-Marcos, A.; Einfeldt, C.; Fisk, S.; et al. Perspectives on low temperature tolerance and vernalization sensitivity in barley: Prospects for facultative growth habit. Front. Plant Sci. 2020, 11, 585927. [Google Scholar] [CrossRef] [PubMed]
- Dawood, M.F.A.; Moursi, Y.S.; Amro, A.; Baenziger, S.; Sallam, A. Investigation of Heat-Induced Changes in the Grain Yield and Grains Metabolites, with Molecular Insights on the Candidate Genes in Barley. Agronomy 2020, 10, 1730. [Google Scholar] [CrossRef]
- Tondelli, A.; Pagani, D.; Ghafoori, I.N.; Rahimi, M.; Ataei, R.; Rizza, F.; Flavell, A.J.; Cattivelli, L. Allelic variation at Fr-H1/Vrn-H1 and Fr-H2 loci is the main determinant of frost tolerance in spring barley. Environ. Exp. Bot. 2014, 106, 148–155. [Google Scholar] [CrossRef]
- Tóth, B.; Francia, E.; Rizza, F.; Stanca, A.M.; Galiba, G.; Pecchioni, N. Development of PCR-based markers on chromosome 5H for assisted selection of frost-tolerant genotypes in barley. Mol. Breed. 2004, 14, 265–273. [Google Scholar] [CrossRef]
- Akar, T.; Francia, E.; Tondelli, A.; Rizza, F.; Stanca, A.M.; Pecchioni, N. Marker-assisted characterization of frost tolerance in barley (Hordeum vulgare L.). Plant Breed. 2009, 128, 381–386. [Google Scholar] [CrossRef]
- Ahres, M.; Gierczik, K.; Boldizsár, Á.; Vítámvás, P.; Galiba, G. Temperature and light-quality-dependent regulation of freezing tolerance in barley. Plants 2020, 9, 83. [Google Scholar] [CrossRef] [PubMed] [Green Version]
- Templer, S.E.; Ammon, A.; Pscheidt, D.; Ciobotea, O.; Schuy, C.; McCollum, C.; Sonnewald, U.; Hanemann, A.; Förster, J.; Ordon, F.; et al. Metabolite profiling of barley flag leaves under drought and combined heat and drought stress reveals metabolic QTLs for metabolites associated with antioxidant defense. J. Exp. Bot. 2017, 68, 1697–1713. [Google Scholar] [CrossRef] [Green Version]
- Fisk, S.P.; Cuesta-Marcos, A.; Cistue, L.; Russell, J.; Smith, K.P.; Baenziger, S.; Bedo, Z.; Corey, A.; Filichkin, T.; Karsai, I.; et al. FR-H3: A new QTL to assist in the development of fall-sown barley with superior low temperature tolerance. Theor. Appl. Genet. 2013, 126, 335–347. [Google Scholar] [CrossRef] [Green Version]
- Hayes, P.M.; Chen, F.Q.; Corey, A.; Pan, A.; Chen, T.H.H.; Baird, E.; Powell, W.; Thomas, W.; Waugh, R.; Bedo, Z.; et al. The Dicktoo × Morex population: A model for dissecting components of winter hardiness in barley. In Plant Cold Hardiness; Li, P.H., Chen, T.H.H., Eds.; Springer: Boston, MA, USA, 1997; pp. 77–87. [Google Scholar]
- Francia, E.; Rizza, F.; Cattivelli, L.; Stanca, A.M.; Galiba, G.; Toth, B.; Pecchioni, N. Two loci on chromosome 5H determine low-temperature tolerance in a ‘Nure’ (winter) × ‘Tremois’ (spring) barley map. Theor. Appl. Genet. 2004, 108, 670–680. [Google Scholar] [CrossRef]
- Saade, S.; Negrão, S.; Plett, D.; Garnett, T.; Tester, M. Genomic and Genetic Studies of Abiotic Stress Tolerance in Barley. In The Barley Genome, Compendium of Plant Genomes; Springer International Publishing, Part of Springer Nature; Stein, A.G., Muehlbauer, G.J., Eds.; Springer: Cham, Switzerland, 2018; p. 259. [Google Scholar]
- Troyjack, C.; Szarescki, V.J.; Martinazzo, E.G.; Aumonde, T.Z.; Pedó, T. Ecofisiologia, produção e qualidade de sementes de plantas de lavoura em resposta ao alagamento do solo e a restrição hídrica. In Estresses Ambientais e a Produção de Sementes: Cência e Aplicação; Aumonde, F.A., Pedó, T.Z., Martinazzo., T., Villela, E.G., Pelotas, R.S., Eds.; Cópias Santa Cruz: Pelotas, Brazil, 2017; pp. 139–169. [Google Scholar]
- Wang, M.; Jiang, N.; Jia, T.; Leach, L.; Cockram, J.; Waugh, R.; Ramsay, L.; Thomas, B.; Luo, Z. Genome-wide association mapping of agronomic and morphologic traits in highly structured populations of barley cultivars. Theor. Appl. Genet. 2012, 124, 233–246. [Google Scholar] [CrossRef]
- Sachs, M.; Vartapetian, B. Plant anaerobic stress I. Metabolic adaptation to oxygen deficiency. Plant Stress 2007, 1, 123–135. [Google Scholar]
- Amarante, L.; do Badinelli Colares, D.; Oliveira, M.L.A.; Zenzen, I.; Badinelli, P.G.; Bernardi, E. Teores de Clorofilas em Soja Associada Simbioticamente com Diferentes Estirpes de. Rev. Bras. Biociênc. 2007, 5 (Suppl. 2), 906–908. [Google Scholar]
- Yordanova, R.Y.; Popova, L.P. Photosynthetic response of barley plants to soil flooding. Photosynthetica 2001, 39, 515–520. [Google Scholar] [CrossRef]
- Bailey-Serres, J.; Chang, R. Sensing and signalling in response to oxygen deprivation in plants and other organisms. Ann. Bot. 2005, 96, 507–518. [Google Scholar] [CrossRef] [Green Version]
- Ahmadi, J.; Pour-Aboughadareh, A.; Fabriki Ourang, S.; Mehrabi, A.A.; Siddique, K.H.M. Wild relatives of wheat: Aegilops-Triticum accessions disclose different antioxidative and physiological response to water stress. Acta Physiol Plant. 2018, 40, 90. [Google Scholar] [CrossRef]
- Steffens, B. The role of ethylene and ROS in salinity, heavy metal, and flooding responses in rice. Front. Plant Sci. 2014, 5, 685. [Google Scholar] [CrossRef]
- Halliwell, B.; Gutteridge, J.M.C. Free Radicals in Biology and Medicine, 5th ed.; Oxford University Press: New York, NY, USA, 2015; pp. 1–29. [Google Scholar]
- Foyer, C.H.; Noctor, G. Redox regulation in photosynthetic organisms: Signaling, acclimation, and practical implications. Antioxid Redox Sign. 2009, 11, 861–905. [Google Scholar] [CrossRef]
- Hossain, M.A.; da Silva, J.A.T.; Fujita, M. Glyoxalase system and reactive oxygen species detoxification system in plant abiotic stress response and tolerance. In Abiotic Stress in Plants-Mechanisms and Adaptations; Shankar, A.K., Venkateswarlu, B., Eds.; INTECH-Open Access Publisher: Rijeka, Croatia, 2011; pp. 235–266. [Google Scholar]
- Tong, C.; Hill, C.B.; Zhou, G.; Zhang, X.-Q.; Jia, Y.; Li, C. Opportunities for Improving Waterlogging Tolerance in Cereal Crops-Physiological Traits and Genetic Mechanisms. Plants 2021, 10, 1560. [Google Scholar] [CrossRef]
- Jia, W.; Ma, M.; Chen, J.; Wu, S. Plant morphological, physiological and anatomical adaption to flooding stress and the underlying molecular mechanisms. Int. J. Mol. Sci. 2021, 22, 1088. [Google Scholar] [CrossRef]
- Romina, P.; Abeledo, L.G.; Miralles, D.J. Identifying the critical period for waterlogging on yield and its components in wheat and barley. Plant Soil. 2014, 378, 265–277. [Google Scholar]
- Wei, W.L.; Li, D.H.; Wang, L.H.; Wang, L.H.; Ding, X.; Zhang, Y.X.; Gao, Y.; Zhang, X.R. Morpho-anatomical and physiological responses to waterlogging of sesame (Sesamum indicum L.). Plant Sci. 2013, 208, 102–111. [Google Scholar] [CrossRef] [PubMed]
- Zhang, X.C.; Shabala, S.; Koutoulis, A.; Shabala, L.; Johnson, P.; Hayes, D.; Nichols, D.S.; Zhou, M.X. Waterlogging tolerance in barley is associated with faster aerenchyma formation in adventitious roots. Plant Soil. 2015, 394, 355–372. [Google Scholar] [CrossRef]
- Luan, H.; Guo, B.; Pan, Y.; Lv, C.; Shen, H.; Xu, R. Morpho-anatomical and physiological responses to waterlogging stress in different barley (Hordeum vulgare L.) genotypes. Plant Growth Regul. 2018, 85, 399–409. [Google Scholar] [CrossRef]
- Liu, M.; Li, Y.; Ma, Y.; Zhao, Q.; Stiller, J.; Feng, Q.; Tian, Q.; Liu, D.; Han, B.; Liu, C. The draft genome of a wild barley genotype reveals its enrichment in genes related to biotic and abiotic stresses compared to cultivated barley. Plant Biotechnol. J. 2020, 18, 443–456. [Google Scholar] [CrossRef] [Green Version]
- Li, H.; Vaillancourt, R.; Mendham, N.; Zhou, M. Comparative mapping of quantitative trait loci associated with waterlogging tolerance in barley (Hordeum vulgare L.). BMC Genom. 2008, 9, 401. [Google Scholar] [CrossRef] [Green Version]
- Zhang, X.; Zhou, G.; Shabala, S.; Koutoulis, A.; Shabala, L.; Johnson, P.; Li, C.H.; Zhou, M. Identification of aerenchyma formation related QTL in barley that can be effective in breeding for waterlogging tolerance. Theor. Appl. Genet. 2016, 129, 1167–1177. [Google Scholar] [CrossRef]
- Broughton, S.; Zhou, G.; Teakle, N.; Matsuda, R.; Zhou, M.; O’Leary, R.; Colmer, T.; Li, C. Waterlogging tolerance is associated with root porosity in barley (Hordeum vulgare L.). Mol. Breed. 2015, 35, 27. [Google Scholar] [CrossRef]
- Huang, X.; Shabala, S.; Shabala, L.; Rengel, Z.; Wu, X.; Zhang, G.; Zhou, M. Linking waterlogging tolerance with Mn2+ toxicity: A case study for barley. Plant Biol. 2015, 17, 26–33. [Google Scholar] [CrossRef]
- Borrego-Benjumea, A.; Carter, A.; Zhu, M.; Tucker, J.R.; Zhou, M.; Badea, A. Genome-Wide Association Study of Waterlogging Tolerance in Barley (Hordeum vulgare L.) Under Controlled Field Conditions. Front. Plant Sci. 2021, 12, 711654. [Google Scholar] [CrossRef]
- Zhang, X.; Fan, Y.; Shabala, S.; Koutoulis, A.; Shabala, L.; Johnson, P.; Hu, H.; Zhou, M. A new major-effect QTL for waterlogging tolerance in wild barley (H. spontaneum). Theor. Appl. Genet. 2017, 130, 1559–1568. [Google Scholar] [CrossRef]
- Zhou, M. Accurate phenotyping reveals better QTL for waterlogging tolerance in barley. Plant Breed. 2011, 130, 203–208. [Google Scholar] [CrossRef]
- Xue, D.W.; Zhou, M.X.; Zhang, X.Q.; Chen, S.; Wei, K.; Zeng, F.R.; Mao, Y.; Wu, F.B.; Zhang, G.P. Identification of QTLs for yield and yield components of barley under different growth conditions. J. Zhejiang Univ. Sci. B. 2010, 11, 169–176. [Google Scholar] [CrossRef] [PubMed] [Green Version]
- Zaidi, P.H.; Rashid, Z.; Vinayan, M.T.; Almeida, G.D.; Phagna, R.K.; Babu, R. QTL mapping of agronomic waterlogging tolerance using recombinant inbred lines derived from tropical maize (Zea mays L) germplasm. PLoS ONE 2015, 10, e0124350. [Google Scholar] [CrossRef] [PubMed]
- Zhou, M.; Johnson, P.; Zhou, G.; Li, C.; Lance, R. Quantitative trait loci for waterlogging tolerance in a barley cross of Franklin × YuYaoXiangTian Erleng and the relationship between waterlogging and salinity tolerance. Crop Sci. 2012, 52, 2082–2088. [Google Scholar] [CrossRef]
- Zhang, X.; Tang, B.; Yu, F.; Li, L.; Wang, M.; Xue, Y.; Zhang, Z.; Yan, J.; Yue, B.; Zheng, Y. Identification of major QTL for waterlogging tolerance using genome-wide association and linkage mapping of maize seedlings. Plant Mol. Biol. Rep. 2013, 31, 594. [Google Scholar] [CrossRef]
- Van Kleunen, M.; Fischer, M. Constraints on the evolution of adaptive phenotypic plasticity in plants. New Phytol. 2005, 166, 49–60. [Google Scholar] [CrossRef]
- Mano, Y.; Omori, F.; Muraki, M.; Takamizo, T. QTL mapping of adventitious root formation under flooding conditions in tropical maize (Zea mays L.) seedlings. Breed. Sci. 2005, 55, 343–347. [Google Scholar] [CrossRef] [Green Version]
- Gill, M.B.; Zeng, F.; Shabala, L.; Zhang, G.; Fan, Y.; Shabala, S.; Zhou, M. Cell-Based Phenotyping Reveals QTL for Membrane Potential Maintenance Associated with Hypoxia and Salinity Stress Tolerance in Barley. Front. Plant Sci. 2017, 8, 1941. [Google Scholar] [CrossRef] [Green Version]
- Smith, S.R. A critical review of the bioavailability and impacts of heavy metals in municipal solid waste composts compared to sewage sludge. Environ Int. 2009, 35, 142–156. [Google Scholar] [CrossRef]
- Kabata-Pendias, A. Trace Elements in Soils and Plants, 4th ed.; Taylor & Francis Group: London, UK, 2010; p. 548. [Google Scholar]
- Rahmani, A.; Asghari, A.; Jafari, H.; Sofalian, O. QTL mapping for physiological traits affecting lead tolerance in the Hordeum vulgare L. Environ. Stresses Crop Sci. 2021, 14, 849–860. [Google Scholar]
- Lwalaba, J.L.W.; Louis, L.T.; Zvobgo, G.; Richmond, M.E.A.; Fu, L.; Naz, S.; Mwamba, M.; Mundende, R.P.M.; Zhang, G. Physiological and molecular mechanisms of cobalt and copper interaction in causing phyto-toxicity to two barley genotypes differing in Co tolerance. Ecotoxicol. Environ. Saf. 2020, 187, 109866. [Google Scholar] [CrossRef] [PubMed]
- Reid, D.A. Genetic potential for solving problems of soil mineral stress: Aluminum and manganese toxicities in cereal grains. In Plant Adaptation to Mineral Stress in Problem Soils; Wright, M.J., Ed.; Cornell University Press: Ithaca, NY, USA, 1976; pp. 5–64. [Google Scholar]
- Siedlecka, A.; BaszyńAski, T. Inhibition of electron flow around photosystem I in chloroplasts of Cd treated maize plants is due to Cd-induced iron deficiency. Physiol. Plant. 1993, 87, 199–202. [Google Scholar] [CrossRef]
- Vassilev, A.; Yordanov, I. Reductive analysis of factors limiting growth of cadmium-treated plants: A review. Bulg. J. Plant Physiol. 1997, 23, 114–133. [Google Scholar]
- Hall, J.L. Cellular mechanisms for heavy metal detoxification and tolerance. J. Exp. Bot. 2002, 53, 1–11. [Google Scholar] [CrossRef]
- Kim, D.Y.; Bovet, L.; Maeshima, M.; Martinoia, E.; Lee, Y. The ABC transporter AtPDR8 is a cadmium extrusion pump conferring heavy metal tolerance. Plant J. 2007, 50, 207–218. [Google Scholar] [CrossRef]
- Ueno, D.; Koyama, E.; Yamaji, N.; Ma, J.F. Physiological, genetic, and molecular characterization of a high Cd-accumulating rice cultivar, Jarjan. J. Exp Bot. 2011, 62, 2265–2272. [Google Scholar] [CrossRef]
- Yuan, L.; Yang, S.; Liu, B.; Zhang, M.; Wu, K. Molecular characterization of a rice metal tolerance protein, OsMTP1. Plant Cell Rep. 2012, 31, 67–79. [Google Scholar] [CrossRef]
- Derakhshani, B.; Jafary, H.; Zanjani, B.M.; Hasanpur, K.; Mishina, K.; Tanaka, T.; Kawahara, Y.; Oono, Y. Combined QTL mapping and RNA-Seq profiling reveals candidate genes associated with cadmium tolerance in barley. PLoS ONE 2020, 15, e0230820. [Google Scholar] [CrossRef] [Green Version]
- Wu, D.Z.; Sato, K.; Ma, J.F. Genome-wide association mapping of cadmium accumulation in different organs of barley. New Phytol. 2015, 208, 817–829. [Google Scholar] [CrossRef]
- Huang, X.; Fan, Y.; Shabala, L.; Rengel, Z.; Shabala, S.; Zhou, M. A major QTL controlling the tolerance to manganese toxicity in barley (Hordeum vulgare L.). Mol. Breed. 2018, 38, 16. [Google Scholar] [CrossRef]
- Koochakpour, Z.; Solouki, M.; Fakheri, B.A.; Aghnoum, R.; Mahdi Nezhad, N. Genome wide association analysis of plant height, spike and awn length in Barley (Hordeum vulgare L.) Exposed to Mn Stress. J. Animal Plant Sci. 2020, 30, 384–390. [Google Scholar]
- Navakode, S.; Weidner, A.; Varshney, R.K.; Lohwasser, U.; Scholz, U.; Borner, A. A QTL analysis of aluminium tolerance in barley, using gene-based markers. Cereal Res. Commun. 2009, 37, 531–540. [Google Scholar] [CrossRef]
- Reuscher, S.; Kolter, A.; Hoffmann, A.; Pillen, K.; Krämer, U. Quantitative Trait Loci and Inter-Organ Partitioning for Essential Metal and Toxic Analogue Accumulation in Barley. PLoS ONE 2016, 11, e0153392. [Google Scholar] [CrossRef] [PubMed]
- Bian, M.; Jin, X.; Broughton, S.; Zhang, X.-Q.; Zhou, G.; Zhou, M.; Zhang, G.; Sun, D.; Li, C. A new allele of acid soil tolerance gene from a malting barley variety. BMC Genet. 2015, 16, 92. [Google Scholar] [CrossRef] [PubMed] [Green Version]


Publisher’s Note: MDPI stays neutral with regard to jurisdictional claims in published maps and institutional affiliations. |
© 2022 by the authors. Licensee MDPI, Basel, Switzerland. This article is an open access article distributed under the terms and conditions of the Creative Commons Attribution (CC BY) license (https://creativecommons.org/licenses/by/4.0/).
Share and Cite
Fatemi, F.; Kianersi, F.; Pour-Aboughadareh, A.; Poczai, P.; Jadidi, O. Overview of Identified Genomic Regions Associated with Various Agronomic and Physiological Traits in Barley under Abiotic Stresses. Appl. Sci. 2022, 12, 5189. https://0-doi-org.brum.beds.ac.uk/10.3390/app12105189
Fatemi F, Kianersi F, Pour-Aboughadareh A, Poczai P, Jadidi O. Overview of Identified Genomic Regions Associated with Various Agronomic and Physiological Traits in Barley under Abiotic Stresses. Applied Sciences. 2022; 12(10):5189. https://0-doi-org.brum.beds.ac.uk/10.3390/app12105189
Chicago/Turabian StyleFatemi, Farzaneh, Farzad Kianersi, Alireza Pour-Aboughadareh, Peter Poczai, and Omid Jadidi. 2022. "Overview of Identified Genomic Regions Associated with Various Agronomic and Physiological Traits in Barley under Abiotic Stresses" Applied Sciences 12, no. 10: 5189. https://0-doi-org.brum.beds.ac.uk/10.3390/app12105189