
Investigation of Performance and Configuration of a Selected IoT System—Middleware Deployment Benchmarking and Recommendations


Faculty of Electronics, Telecommunications and Informatics, Gdańsk University of Technology, Narutowicza 11/12, 80-392 Gdańsk, Poland
*
Authors to whom correspondence should be addressed.
Appl. Sci. 2022, 12(10), 5212; https://0-doi-org.brum.beds.ac.uk/10.3390/app12105212
Submission received: 24 March 2022
/
Revised: 18 May 2022
/
Accepted: 19 May 2022
/
Published: 21 May 2022
(This article belongs to the Special Issue Advances in High-Performance Computing Research and Applications)
Abstract
:Nowadays Internet of Things is gaining more and more focus all over the world. As a concept it gives many opportunities for applications for society and it is expected that the number of software services deployed in this area will still grow fast. Especially important in this context are properties connected with deployment such as portability, scalability and balance between software requirements and hardware capabilities. In this article, we present results of practical tests with multiple clients representing sensors sending notifications to an IoT middleware—DeviceHive. Firstly, we investigate performance using two deployment configurations—containerized and bare-metal showing small overhead of the former under different loads by various numbers of IoT clients. We present scaling of the middleware on the server side using various numbers of cores as well as HyperThreading for all aforementioned configurations. Furthermore, we also investigated how containarization affects performance when the system is scaled with various numbers of nodes each using a predefined number of cores, considering memory usage of various configurations. The latter could be found useful when assigning cores to Docker nodes in cloud environments.
1. Introduction
Deployment of a computer system is an important step of whole project execution. Thorough description and overview of this phase can be found in [1]. Its goal is to properly launch software in a production environment. Successful deployment is characterized by:
- proper design of infrastructure (server, network, storage) so that performance and scalability as well as availability requirements can be met—we can call it a good balance between hardware capacity and software requirements [2],
- portability—in terms of possibility to move the deployment to another environment easily (also considering time) [3],
- scalability—in terms of possibility to scale the system to allow successful and efficient handling of more requests. This can be considered both in terms of server scaling as well as scaling versus the number of clients (threads) [4].
Taking into account the aforementioned characteristics, the first point can be realized in many ways one of which is assignment of as much resources as is needed. This approach can be fulfilled with CPU affinity. The other two can be assured in production environments using virtual machines or containerization. In this paper, we decided to use containerization as this technology has much lower footprint compared to the virtual machine [5,6]. It is also better suited for HPC servers than virtualization. In [7] authors showed that containerization offers much better results compared to KVM. In [8] authors compared two different containerization tools—LXC and Docker and demonstrated similar results. Once prepared, a container can be used many times with no additional time spent on configuration from scratch. There are various tools allowing containerization one of which is Docker. As could be found in [9] Docker has gained much popularity in this context. In article [10] authors list current Docker usage in various IoT scenarios, including edge/fog computing, MQTT broker running in the Docker container within the Raspberry Pis, IoT analytics, Vehicle-to-Everything (V2X) applications, Industrial IoT (IIoT), precision agriculture, smart cities etc. Docker, typically offering flexibility and ease of management at a small performance cost compared to native solutions, is used for containerization at various levels [11]: sensor/edge [12], gateway/fog [13] and server/cloud [14]. In paper [15] authors propose an edge cloud architecture for devices which is based on containers that allow for a packaging and distribution mechanism. There can be several edge clouds communicating with a data center cloud. From the hardware point of view, several Raspberry Pis are formed into an edge cluster.
This paper is divided into two parts. In the first one we decided to investigate how the above solutions affect a real system and what the impact of containerization and CPU affinity on its scalability are. In the second part we compared how different configurations with containers affect performance and stability. The main goal was to find benefits and drawbacks of deployment setups with different numbers of nodes (represented as Docker containers within same physical machine) running the IoT middleware using, in total, the same number of cores responding to clients’ requests through a load balancer. This way we can gain a perspective on containerization and recommendations for middleware configuration also considering memory usage of these deployments. Consideration of performance vs resource usage can be of interest in optimizing deployment of applications using high performance multi-core servers.
2. Related Work
As the number of IoT devices is still rapidly growing and is expected to reach the size of human population by 2030 [16], IoT middlewares are key components of a distributed system. In this context, in the literature performance investigation of IoT middlewares has been conducted such as considering scalability and stability of ThingsBoard and SiteWhere platforms [17]—ThingsBoard offering better performance for REST, SiteWhere record better performance for MQTT but with a high error rate compared to lower and stable ThingsBoard results. Another comparison of platforms [18] includes InatelPlat, Konker, Linksmart, Orion+STH as well as SiteWhere (assessed as the best one overall) studying up to 10,000 concurrent users, various numbers of parameters passed (1, 15, 100) and evaluating packet sizes, error percentages, response times. Sensitivity analysis has been performed for particular use cases, such as IoT based flood alerting system [19] as well as in the context of more general strategies for mitigation of vulnerabilities in hybrid networks, including IoT devices [20].
To help with the ease and flexibility of deployment in a real environment, virtualization technologies can be considered provided that the performance overhead is acceptable. In paper [6] authors provided comparison of performance of Docker containers vs virtual machines (KVM) using tools including Sysbench, Phoronix and Apache. Specific tests run included computing maximum prime number, zip compression, RAM speed test, disk I/O, the number of requests per second handled by a server, eight queen test, t-test analysis showing superior performance of Docker containers in all tests. There are also comparisons of container technologies such as [21]. In the latter, Docker, LXC, and LXD are compared in terms of: IOZone read (74–85%), write (77–83%), RAM speed (97–99%), CPU intensive code (73–95%) with average Docker performance of 81.7%, LXC 86.5% and LXD 90.5%, following with performance of Web and FTP servers confirming the above findings. Another interesting comparison between KVM and Docker is presented in [22]. Authors conclude that Docker has significantly less overhead than KVM and as such it is much better suited for latency-sensitive or workloads with high I/O rates.
Virtualization has been widely used in various contexts in IoT systems and within various layers of a typical IoT system, as described next.
In paper [23] authors propose a container-based virtual client architecture for interactive digital signage. This is done such that several digital signage clients and IoT devices are virtualized and managed by a container-based middleware. This solution allows to manage a cluster of IoT devices and clients and reduce load in a server and correspondingly improve performance as well as ease deployment in the system.
In work [24] authors propose design, implementation and tests of IoTDoc that forms a mobile cloud that is composed of containers running on distributed IoT devices. System architecture, image distribution, installation as well as scenarios for device migration in a distributed system are described. Finally, the authors present results of selected performance tests of Swarm Managers (SM) and Node Managers (NM) running in IoTDoc (using Raspberry Pis with microSD cards) compared to EC2-t2-micro instance—including for a computational CPU, Data Definition (DD) read/write and memory test. While the Amazon EC2 solution is generally better, the authors argue that IoTDoc in some cases offers comparable values in a much cheaper environment.
In paper [25] authors presented design of a solution and feasibility study for deploying virtualized (Docker) nanoservices locally within a three tier IoT network (local+edge+core network–data center). The authors showed how the solution can be optimized in terms of required space with container size down to few tens of MBs and deployment and initiation times per nanoservice to less than a minute and service initiation times to a few seconds.
In paper [26] container technology is proposed to improve load balancing at the gateway layer and flexibility of deployment in an IoT system. As a typical IoT system consists of three layers: sensor, gateway and cloud, of interest in the paper is the traffic between the sensors which are traditionally linked to one gateway in a cluster (of gateways). The authors proposed an architecture in which in each gateway there are three services (reading, processing and gateway-cloud transfer service) running as containers and load balancing allowing load balancing of sensor requests among gateways, demonstrating actual distribution of load. In work [27] authors investigated two operational scenarios/ways of communication between devices in an IoT system: CPIS for direct interactions between devices, and CEMC with management functions at the edge of the network. In the latter Container-oriented Edge Manager (CEM) controls a cluster of Container-based IoT Workers (CIWs) and selects nodes for deployment of containerized services. A CIW then processes tasks following CoAP requests from clients. The authors demonstrate small overhead of the solution allowing easier and more flexible management. Specifically, times for native vs Docker are presented for averaging, merge and bubble sort, CPU utilization are presented for these configurations as well as activation times and power consumption of nodes, also for activation of several sensors (laser, buzzer, flame sensor etc.).
In paper [28] the author benchmarked Docker vs native configuration on Raspberry Pi 2 for several synthetic as well as actual server workloads. In general, we can observe a measurable but reasonably small difference of Docker vs native with overheads of the former as follows: sysbench: 2.7% for CPU, up to 6% in memory tests, disk I/O up to 13% for reads. For MySQL db query tests for 1–100 clients performance results were very similar, for Apache2 server tests with 100–300 clients the native configuration outperformed Docker (by up to approx. 15%) at the cost of larger power consumption. A similar example and tests were shown in paper [29] where the author demonstrated performance benchmarking of Docker versus native configuration on Raspberry Pi 3 with Docker introducing overhead for CPU, memory (mbw, up to 1.4%) and disk I/O (sysbench, 24.4% worse transfer).
As there is lack of research works focused on investigation of containerization overheads for IoT middlewares, we decided to analyze relevant research papers based on server applications deployed in containerized environment which focus on performance evaluation of virtualization technologies per se. In paper [14], a comparison of Docker, KVM, Podman, VMWare Workstation, VirtualBox, and Xen was performed considering Dhrystone, Whetstone, Kcbench, RAMspeed, and Iperf3, Bonnie, DBENCH as well as a real life application was presented serving content of a digital dictionary, under various loads. For the latter, best in terms of successful HTTP 200 messages were OpenStack and Docker. For actual demanding computations, overheads of container technologies have been studied in the context of high performance computing applications [30,31,32]. For instance, in paper [31] authors concluded that for KMI Hash (queries/second) and MiniFE (MFLOPS) benchmarks run on 72 and 96 MPI ranks the overhead of Docker over bare metal was only 8.5% and 0.4% respectively.
In the context of the existing works, our research focuses on assessment of potential overheads of using Docker on the middleware side as well as on investigation of performance of configurations with a cluster with containers also considering resource such as memory usage. Such perspective in the context of the IoT area has not been previously investigated and thus it contributes to the knowledge and practical experiences in this field.
3. Investigation of Scalability and Impact of Virtualization on Performance of the System
In this section we describe our test setup, proposed metrics and obtained results. We also measure how core affinity affects scalability of the system. This provides us with foundation for further analysis how we can divide cores among Docker nodes within a cluster defined within one physical machine.
3.1. Testbed Description
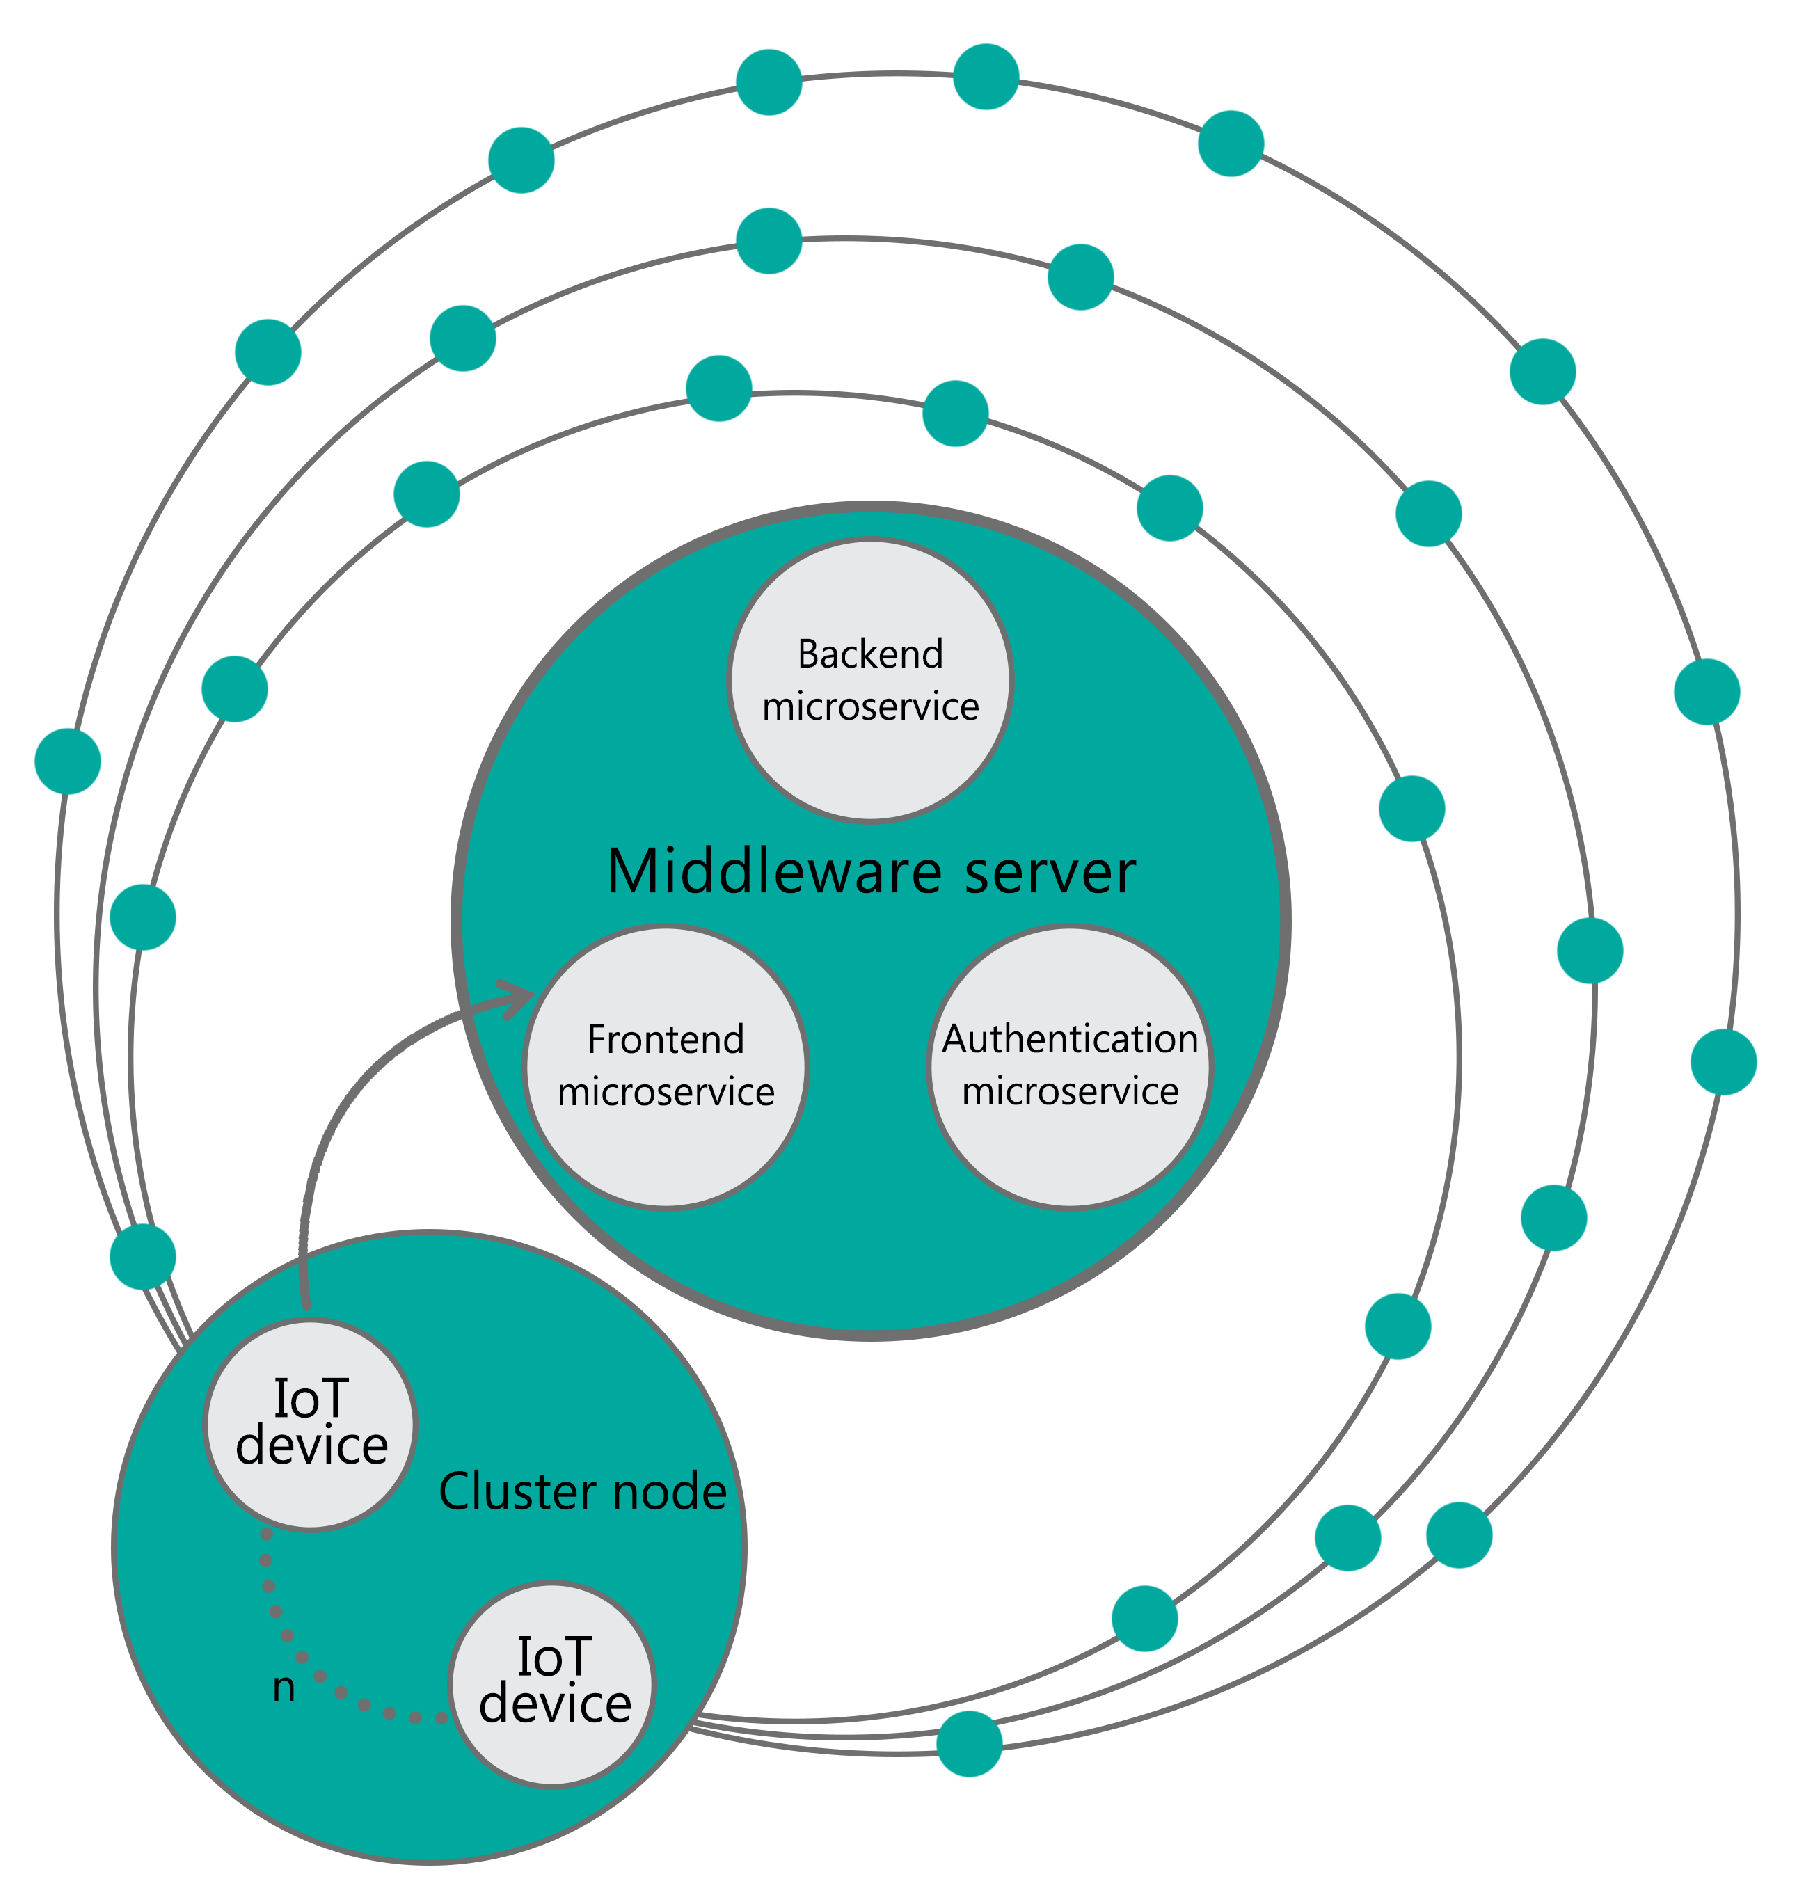
We investigate an application model similar to the one described in [33], in which sensors send notifications (small data packets) continuously and periodically to a middleware server. Such a solution may be applicable to many use cases where each device collects data which is gathered and processed by a centralized server. This scenario may be found in a grid of sensors for data collection e.g., weather stations or water quality measurement. The same middleware as proposed in our scenario was successfully used in a smart metering electrical power system as shown in [34] as well as in its further continuation presented in [35]. In Figure 1 we can see an overview of the proposed model.
3.1.1. Server Software and Hardware
For our experiments we aimed at finding a middleware which is open source and thus can be widely used, with many forks available, designed using the principle of microservice architecture. Such an approach is most popular for the state of the art design backend solutions [36]. In-depth analysis of available solutions led us to a selection out of three of the following:
- SiteWhere,
- ThingsBoard,
- DeviceHive.
SiteWhere addresses all of our requirements. Out of the box it allows to communicate over HTTP with the REST API. Its architecture contains 4 global microservices and 15 multitenant microservices [37]. ThingsBoard meets all of our requirements as well. It differs from SiteWhere that it also supports other protocols such as MQTT, CoAP and LwM2M. It is built out of 5 microservices—Core, Transport, WebUI, RuleEnging and JavaScript Executor [38]. DeviceHive also fulfills the aforementioned requirements. Out of the box it supports communication over Websocket, HTTP and MQTT and contains 3 main microservices—Backend, Frontend and Authorization [39]. As all of the aforementioned solutions present a similar approach in terms of design, use similar third party software e.g., runtime cache or queue like Redis or Kafka and finally each has been implemented with Java and runs on an JVM, we decided to conduct in-depth analysis of one. Consequently, within future work, research using the other solutions can be performed. We chose DeviceHive for conducting tests—while all of the considered solutions present a similar architecture, for the selected one start time, measured from the start of all microservices until being ready for receiving requests, can be on the shorter side since it is built using the smallest number of services. As microservices are built of applications embedded with an application server the total start time is not insignificant since between tests we need to shutdown the whole system, archive results and perform a start-up of the components again.
As stated before DeviceHive is built out of 3 microservices: Frontend, Backend and Authorization. The Frontend microservice is responsible for communication. It exposes REST API and Websocket to the world and grabs all incoming requests to other microservices. Communication over MQTT mentioned before is realized with an additional plugin running with JS—it receives data with MQTT and proxies it to the REST API of the Frontend service. The Authorization service is responsible for authentication and authorization. It provides users with JWT tokens assigned to a user defined in the system. These tokens are subsequently used in all requests to the system. The last one—Backend service is responsible for realizing whole application logic. The platform also relies on a database. Database contains platform configuration and user (device) repositories. All load generated by users i.e., the messages running through the system are served with a queue using Kafka. In order to provide low latency in getting information sent between users the system collects all messages in runtime databases—Redis.
The selected IoT middleware platform was deployed on a high performance server with 2 Intel Xeon CPUs E5-2680 v2 @2.8 GHz with a total of 40 logical processors (with HT), with 128 GB of RAM, running Ubuntu. Same hardware was used for containerized test suite. Containerization was performed with Docker. A basic image of Ubuntu with same environment software as physical machine—JVM, DeviceHive and all supporting software (like Kafka, Hazelcast and other [39]) were used within the container.
3.1.2. Device Simulator Software and Hardware
In the proposed model devices send notifications to the middleware server. These devices were represented as actual software clients running in a cluster composed of 29 physical machines. Each has an Intel Xeon CPU E5345 @2.33 GHz and 8 GB RAM, running CentOS 6. Stations were connected with Gigabit Ethernet. Client software was written in Java as a multithreaded application. In total we simulated as many devices as 29 (number of machines in cluster) multiplied by the requested number of threads per machine. We began with 870 devices with a step of 290 devices to simulate load. Detailed overview of the client application model can be found in [33]. The main application loop performs:
- access check—authorization,
- send notification periodically—randomly generated 36 bytes of data,
- random decision to disconnect (connection problem simulator).
3.1.3. Benchmarking Process
The test suite process begins with starting a middleware server, then 3 requests are sent to “warm-up” the middleware (to allow JVM load all classes used in the process)—register client request, notification insert request and client deletion request. These messages are not taken into account in result analysis. Afterwards the devices send requests in a predefined time frame periodically. All devices work in parallel and are started at the same time. After the time frame has elapsed device simulators end its application execution, the middleware is stopped and results are collected.
One test suite provides us with one set of results which is composed of entries containing the following details:
- request send and related response received timestamps—client (device) side,
- request processing begin timestamp—server side,
- request processing end timestamp—server side,
- request processed with or without errors—server side.
Each test suite was repeated 7 times and took 10 min per suite. These provided us with 7 result data sets—including processing time (calculated as a difference between timestamps of request and response events on the client side). In order to minimize any external factors (eq. OS cron or update services) we rejected the highest and the lowest values over these 7 sets of data. The remaining results were merged together to calculate a median, first quartile and third quartile values of processing times. Such data was used for calculating all metrics. Restricting cores used by the server was achieved using taskset command. The following configurations were tested:
- taskset -c 0-1—two physical cores of CPU 0,
- taskset -c 0-3—four physical cores of CPU 0,
- taskset -c 0-19—10 physical cores of CPU 0 and 10 physical cores of CPU 1,
- taskset -c 0-39—all logical cores in the system (including HyperThreading technology).
3.1.4. Evaluation Metrics
Our goal at this point was to investigate how various numbers of cores used by the middleware affect the performance and scalability [40] of an IoT system. Subsequently, we also aimed to check if containerization influences the performance of the platform and if so, to what degree.
Consequently, we decided to test various conditions reflected by various numbers of:
- cores used by the middleware,
- IoT devices.
Taking into account the obtained results, for a given number of cores used, we identified the load giving the largest number of successfully processed messages served within the test time frame. This is considered as the optimum load point. Such points will be different for various configurations because of the various numbers of cores involved in processing. Larger numbers of CPU cores used by a middleware will allow increasing the optimum load point in terms of the number of devices served. We took into account measures beginning with small load and ending at the aforementioned optimum load point. For such analysis we investigated the influence of:
- number of cores on scalability,
- containerization on scalability,
- containerization on performance.
3.2. Results Analysis
The following subsections include analysis of results in terms of the aforementioned scalability and performance related impacts.
3.2.1. Influence of Server Core Number on Scalability
In our tests load was simulated by increasing the number of clients–IoT devices. Selected load defined as the number of clients in a given test stems from the fact that we would like to assess characteristics from small load until system overload. Particular values start with the number of client nodes multiplied by 30, followed by multiplication by 40, 50 etc. Total number of clients correspond to the values considered in research works analyzed in Section 2. Experiments were repeated for various number of cores available on the server. It is expected that both numbers of requests handled by the server will increase and request-response times will decrease in the function of core count.
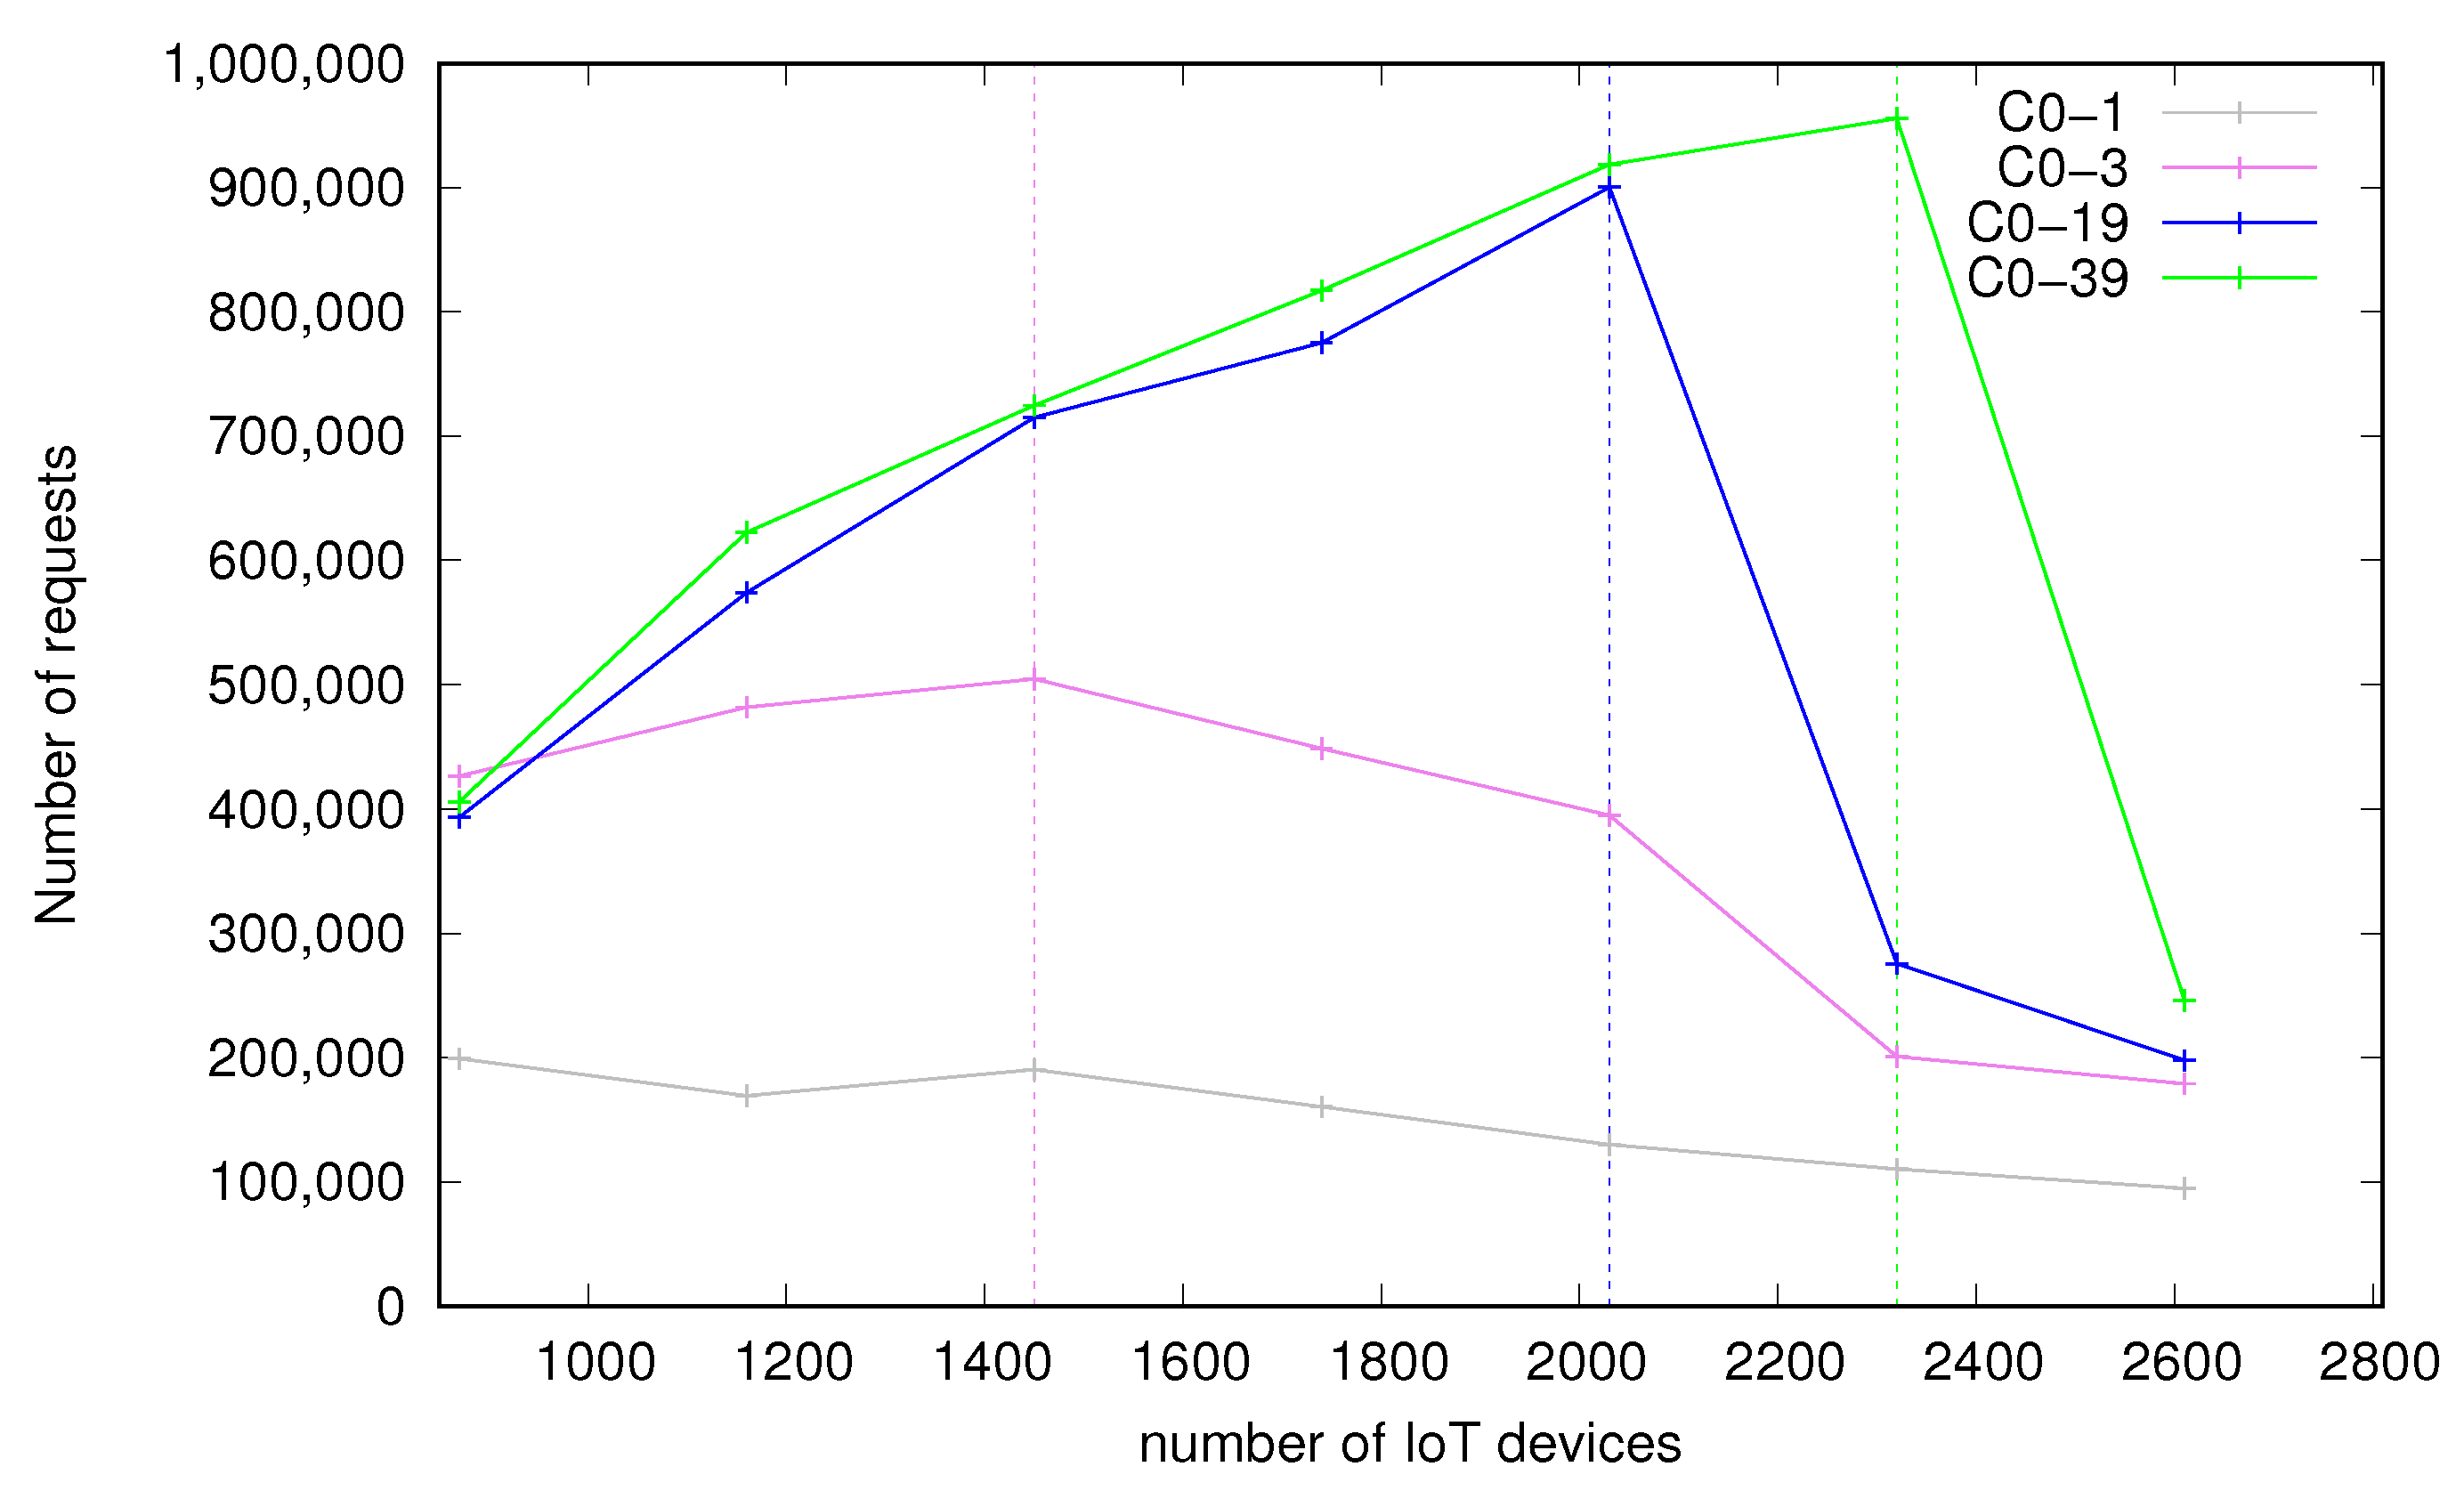
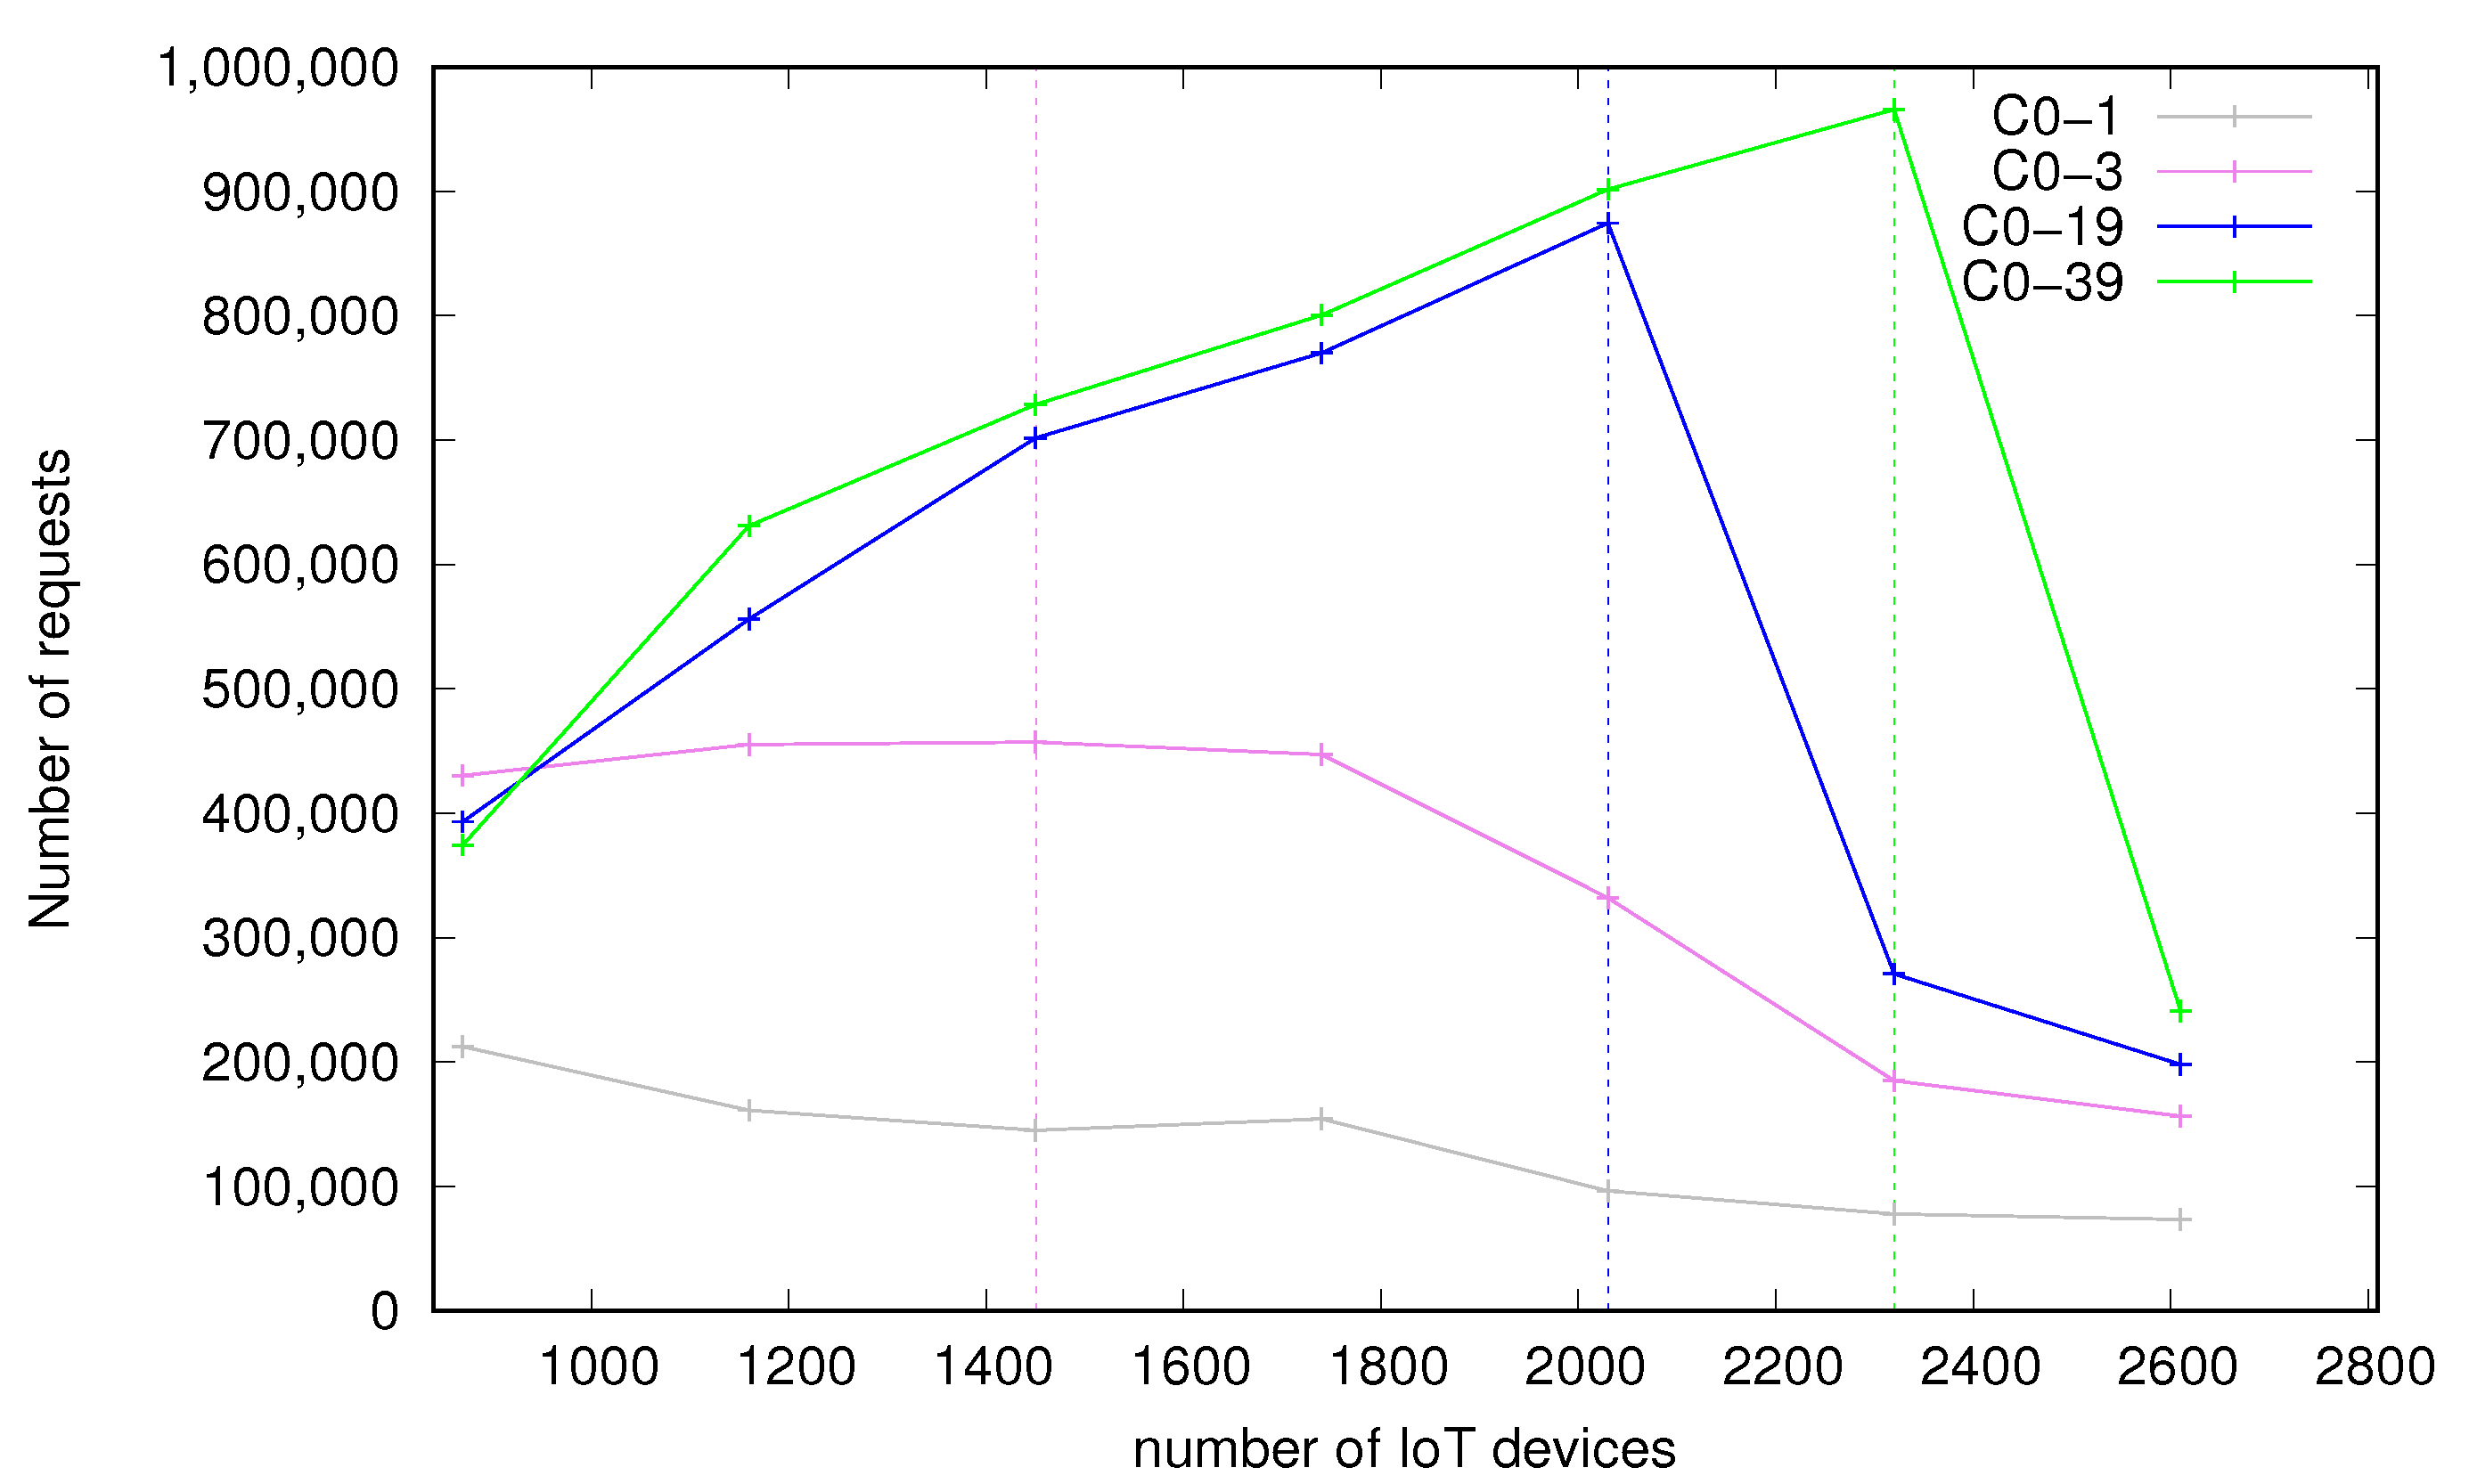
Figure 2 and Figure 3 present numbers of successfully processed requests by bare-metal and containerized environments respectively. Four continuous lines represent four different configurations used on the middleware side, as follows:
- C0–1—2 CPU cores,
- C0–3—4 CPU cores,
- C0–19—20 CPU cores,
- C0–39—40 CPU cores (including HyperThreading).
The dashed, vertical lines correspond to the points of optimal load introduced in Section 3.1.4. For a given optimal load point, the color of a vertical line is the same as the color of a plot which the given optimal point refers to. As we can see, for the configuration with 4 cores (C0–3) the optimal load is at 1450 devices, the 20 cores setup (C0–19) has the optimal load at 2030 devices and the most powerful configuration of 40 cores (C0–39) achieves the optimal load of 2320 devices. For configuration with 2 cores (C0–1) the system is overloaded and increasing the number of IoT devices results even in a slight drop of the number of successfully processed messages. It has no optimal load point in the measurements and as such is not analyzed further in terms of times. It is apparent that the system is scalable—a higher core count results in moving the optimum load point to the right side of the X axis and being able to serve more requests successfully during the test. This means that more cores involved in processing result in better availability of the service—more devices can be served in the same time frame. This also shows that the middleware platform benefits from a multicore environment.
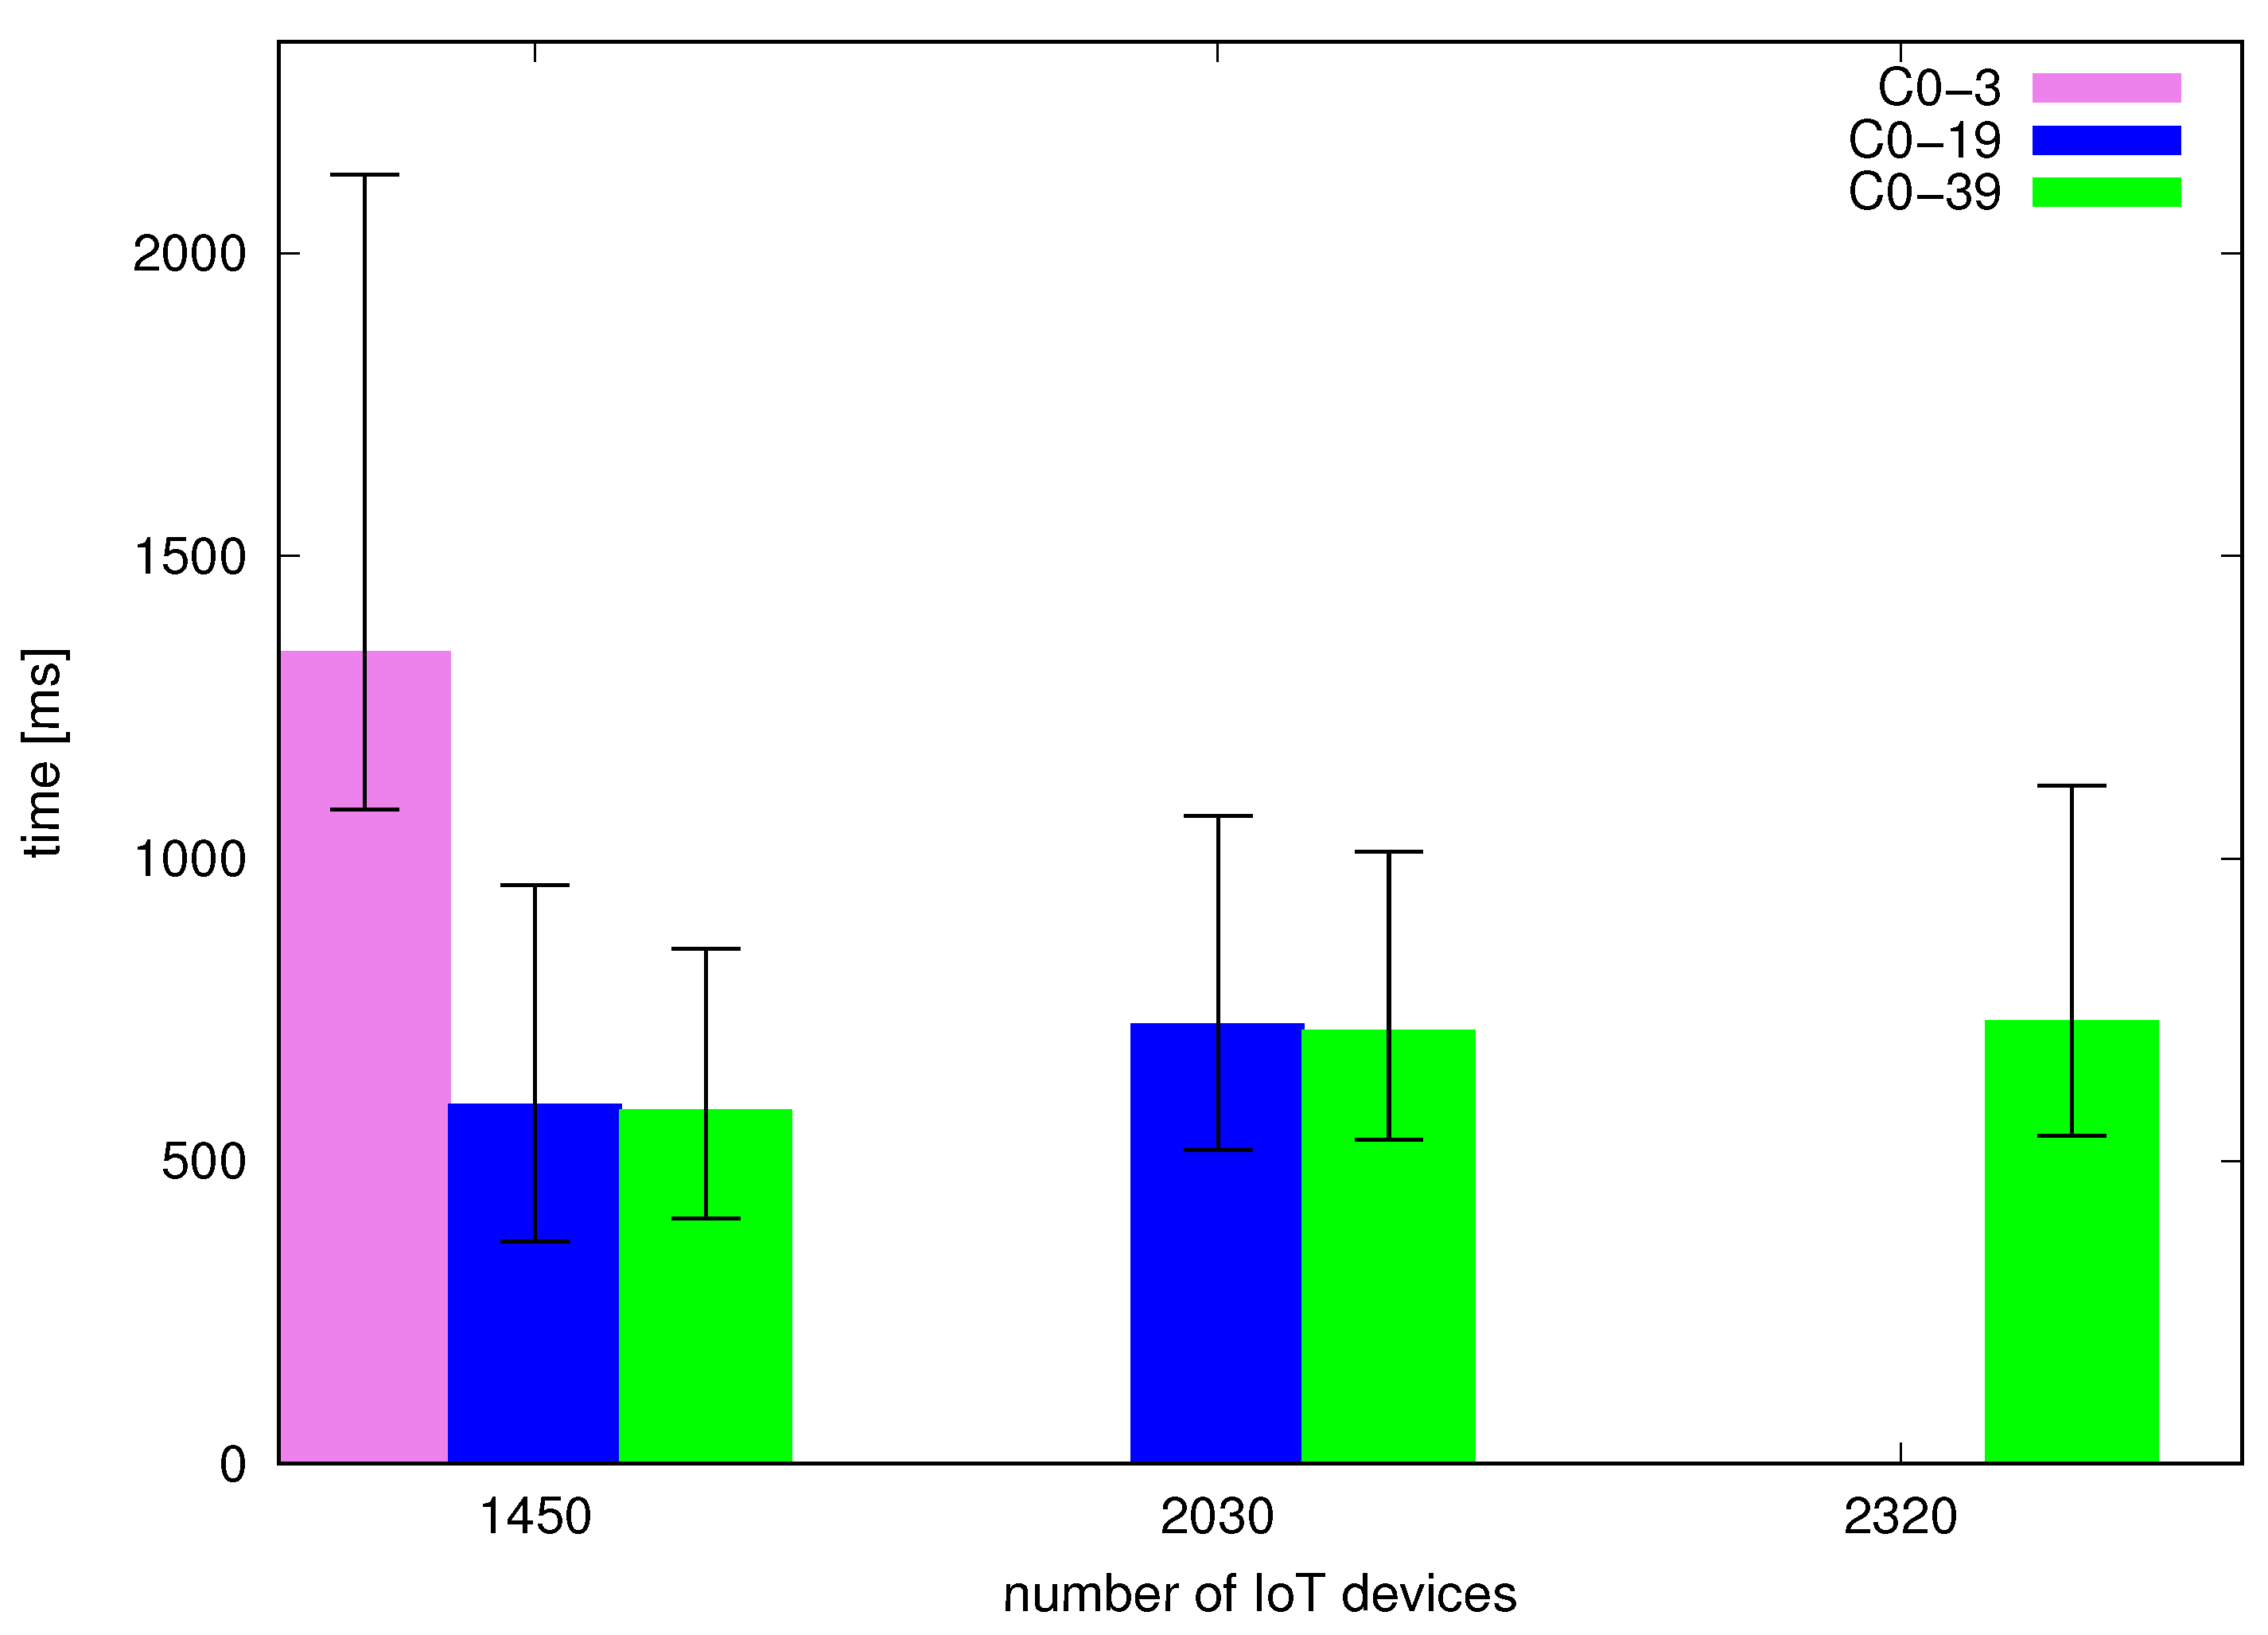
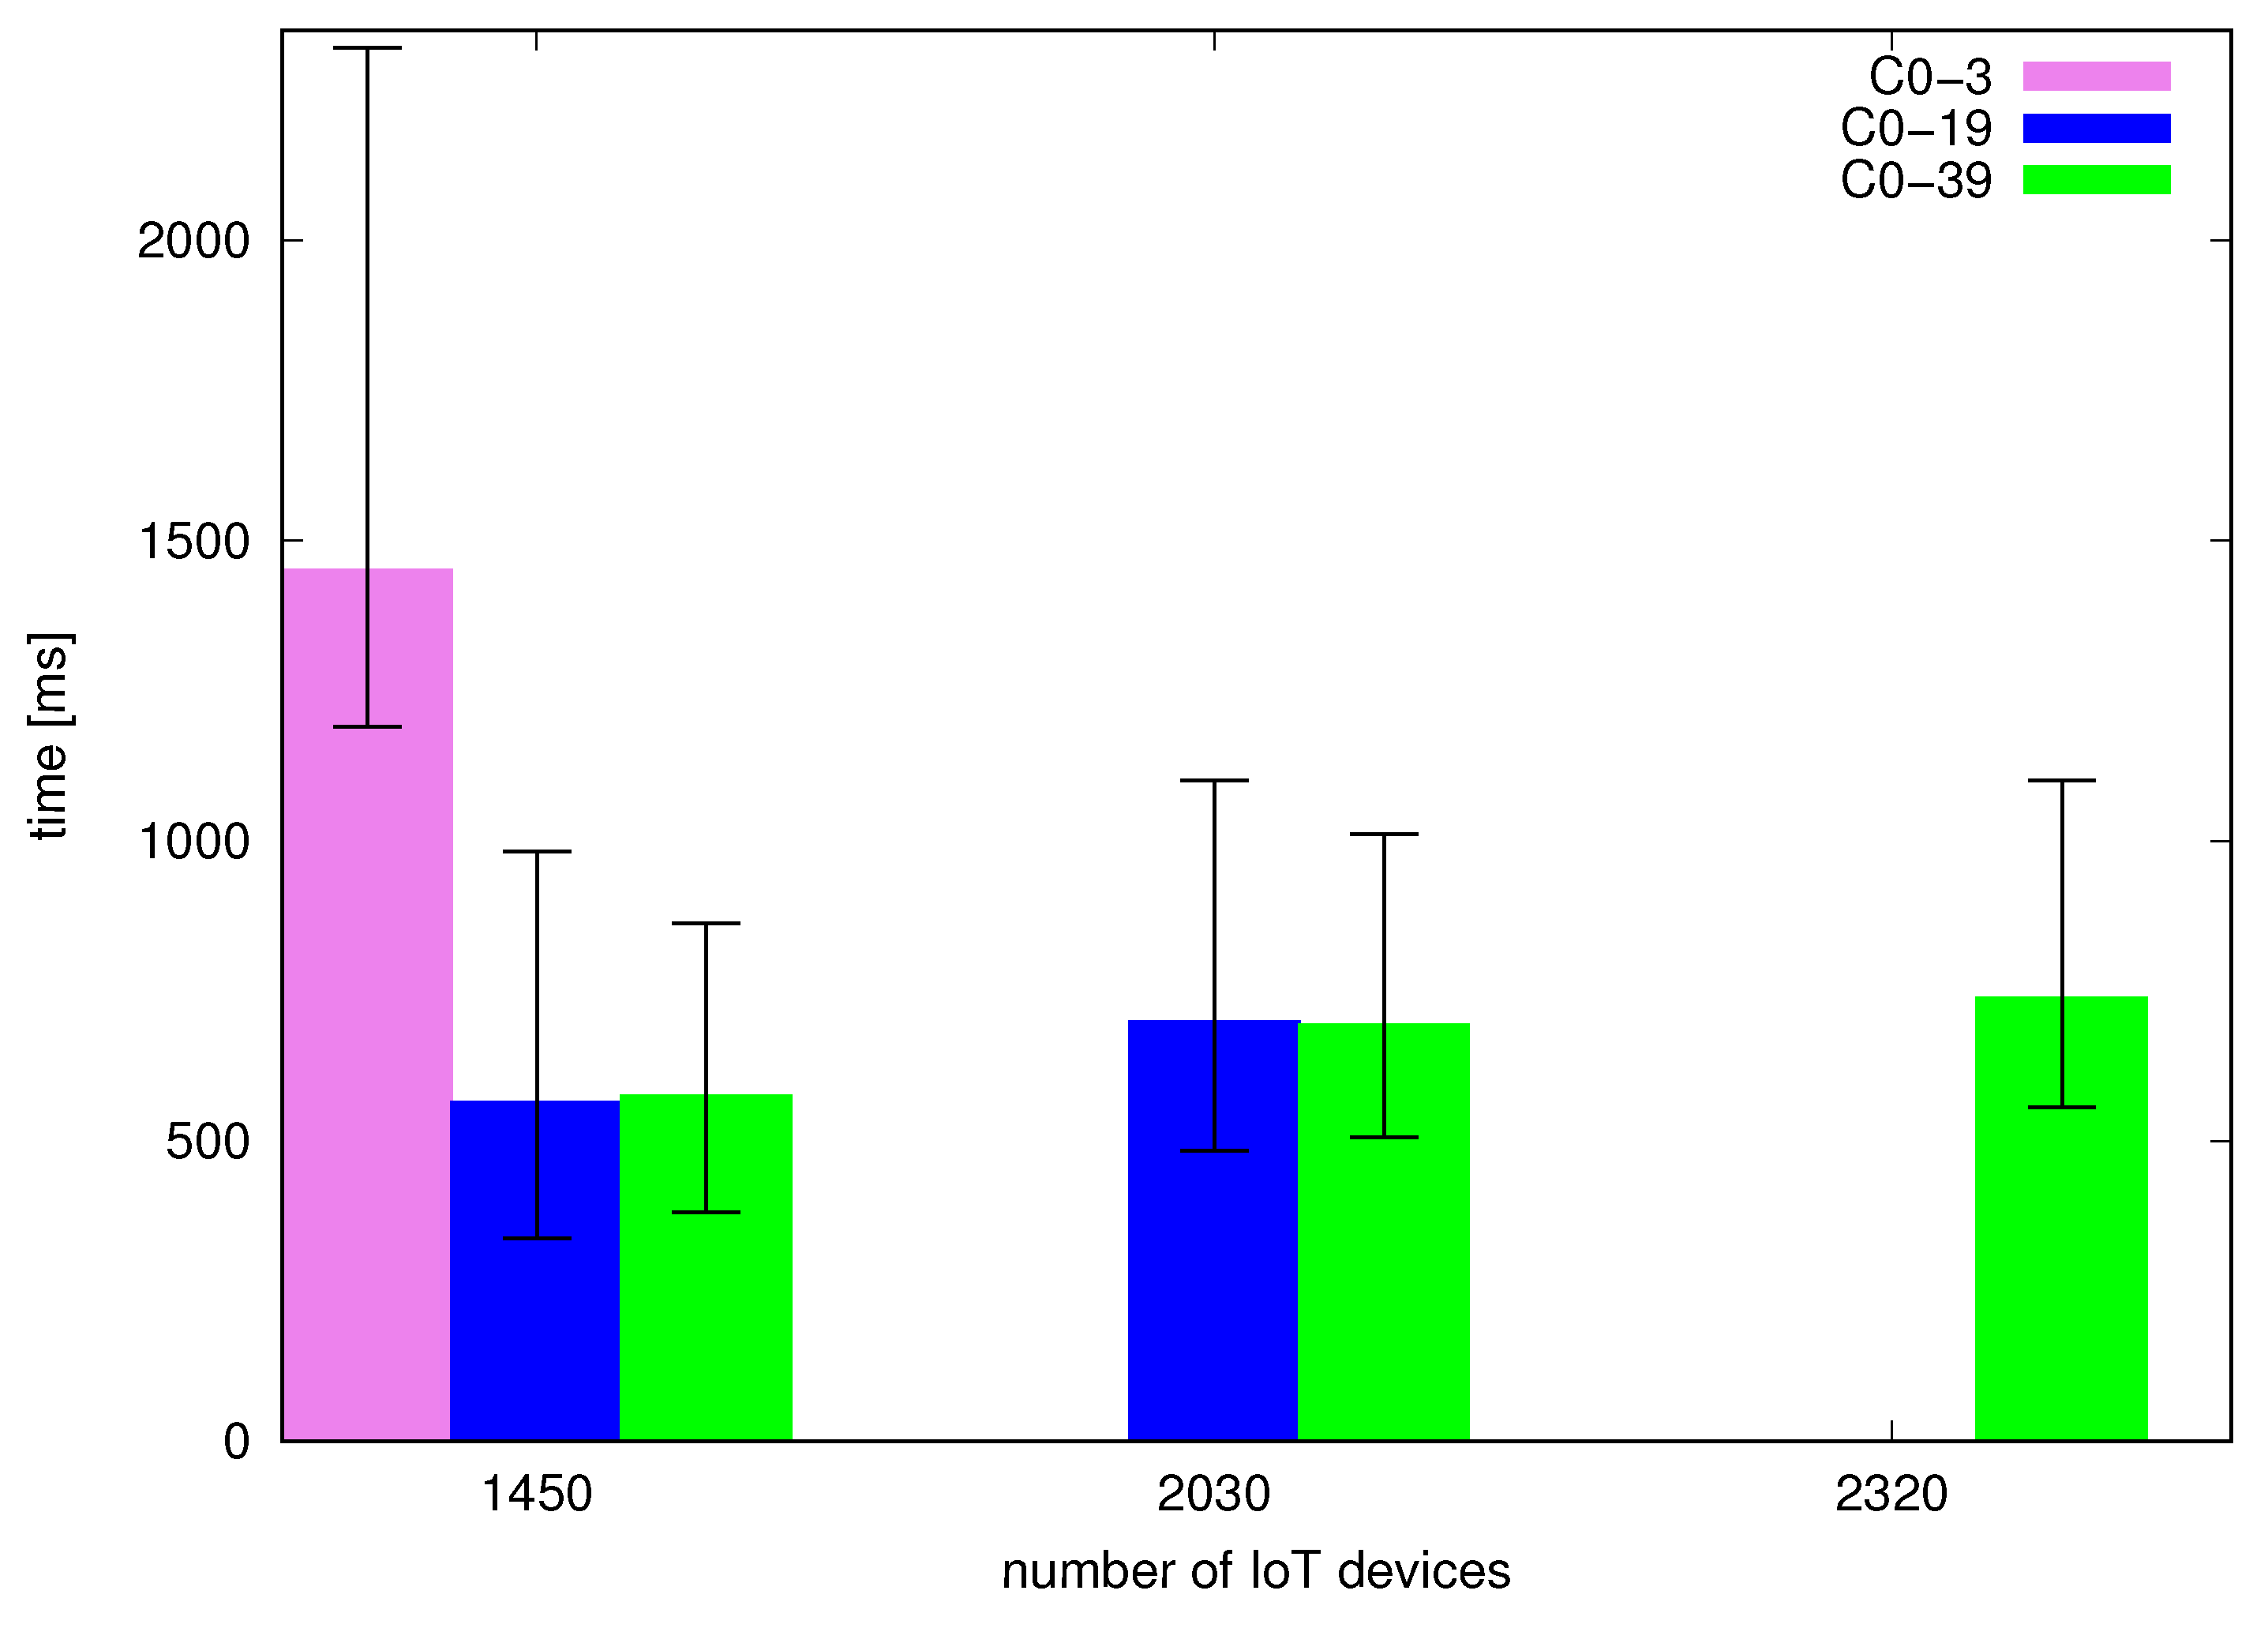
Figure 4 and Figure 5 present request-response times measured on the client side for bare-metal and containerized cases. Based on the numbers of successfully processed requests we focused our attention on the configurations with respective optimal points for C0–3, C0–19 and C0–39 because loads above the optimal points correspond to the scenarios of significant drops in the number of successfully processed messages. The optimal load for a certain configuration (e.g., C0–3) is also handled by a larger configuration (such as C0–19 and C0–39). Bars represent median times while whiskers visualize first and third quartiles. We can see that processing times grow with a growing load for a given configuration. Moreover, we can see that processing time is significantly lower for configurations C0–19 and C0–39 versus C0–3. Comparing the configurations with 20 cores and 40 cores we can see that while median processing times are very close, C0–39 (obtained with the HT technology) has visibly narrower quartiles for the same number of devices and can serve efficiently one larger tested load i.e., that of 2320 devices instead of 2030 with the 20 core configuration.
3.2.2. Influence of Containerization on Scalability
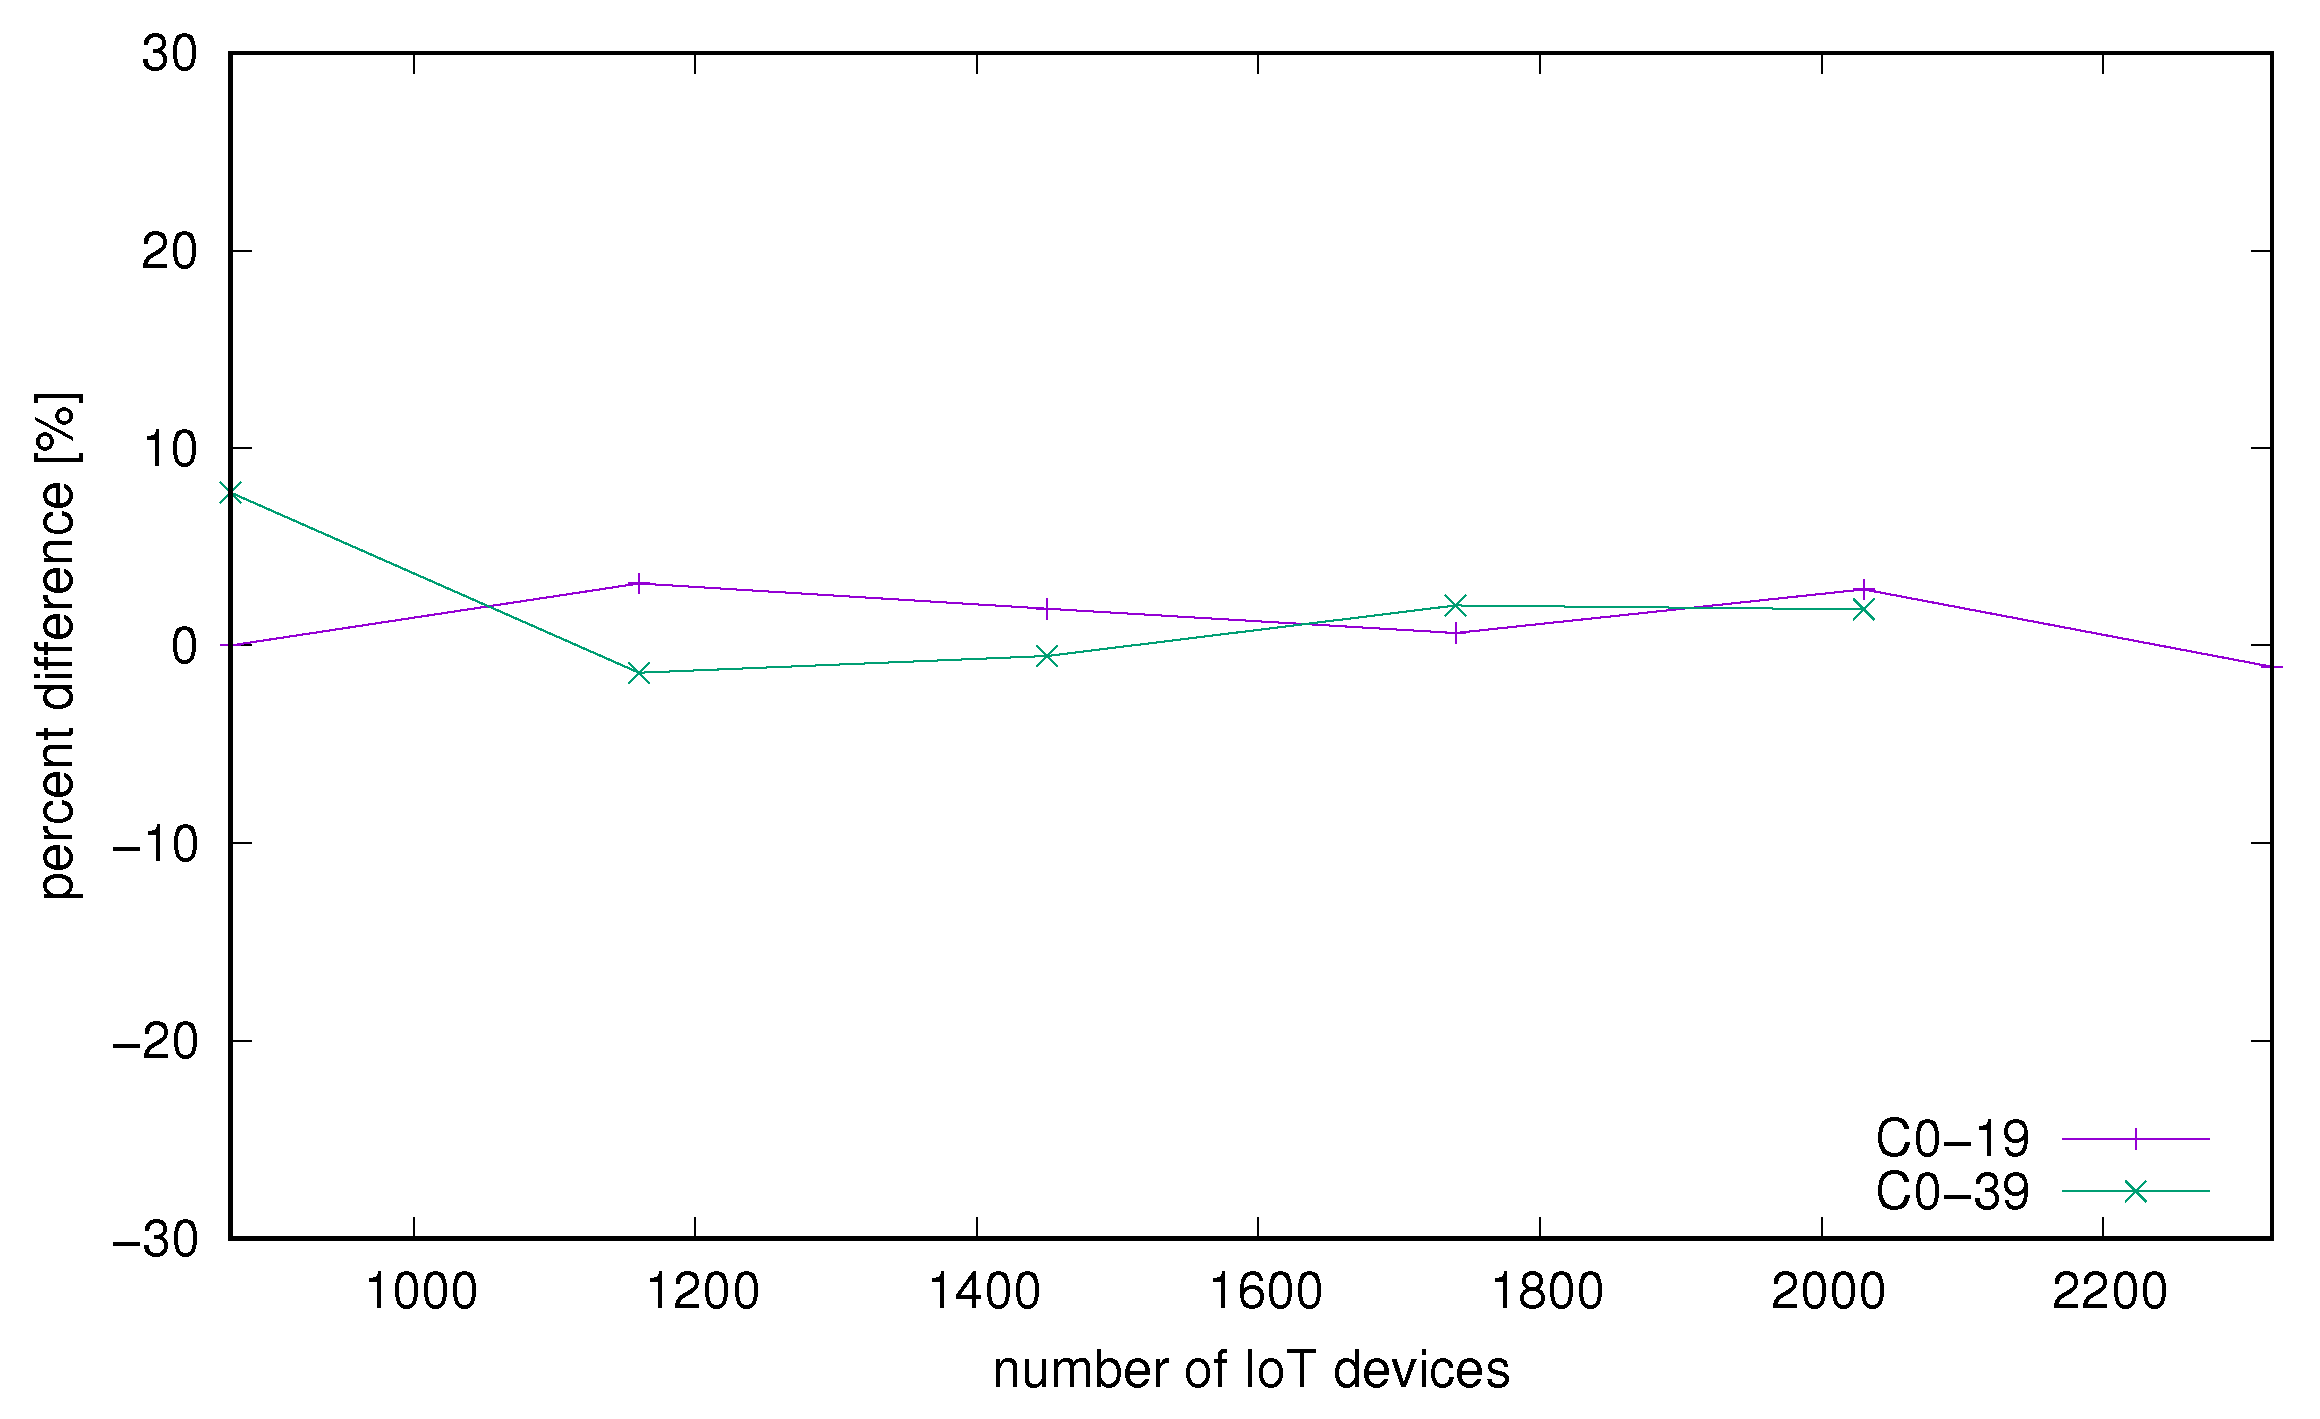
It is expected that launching a container with same core affinity as same configuration on bare-metal results in quite similar results, based on performance overheads identified in the literature described in Section 2. In Figure 6 we presented normalized difference of successfully processed requests N on bare-metal and same metric on the container. The value is calculated as . These results and also the observation from previous charts in Figure 4 and Figure 5 also Figure 2 and Figure 3 may indicate that system has very similar characteristics with and without containerization. That clearly shows that containerization has no visible impact on scalability achieved with different server core counts.
3.2.3. Influence of Containerization on Performance
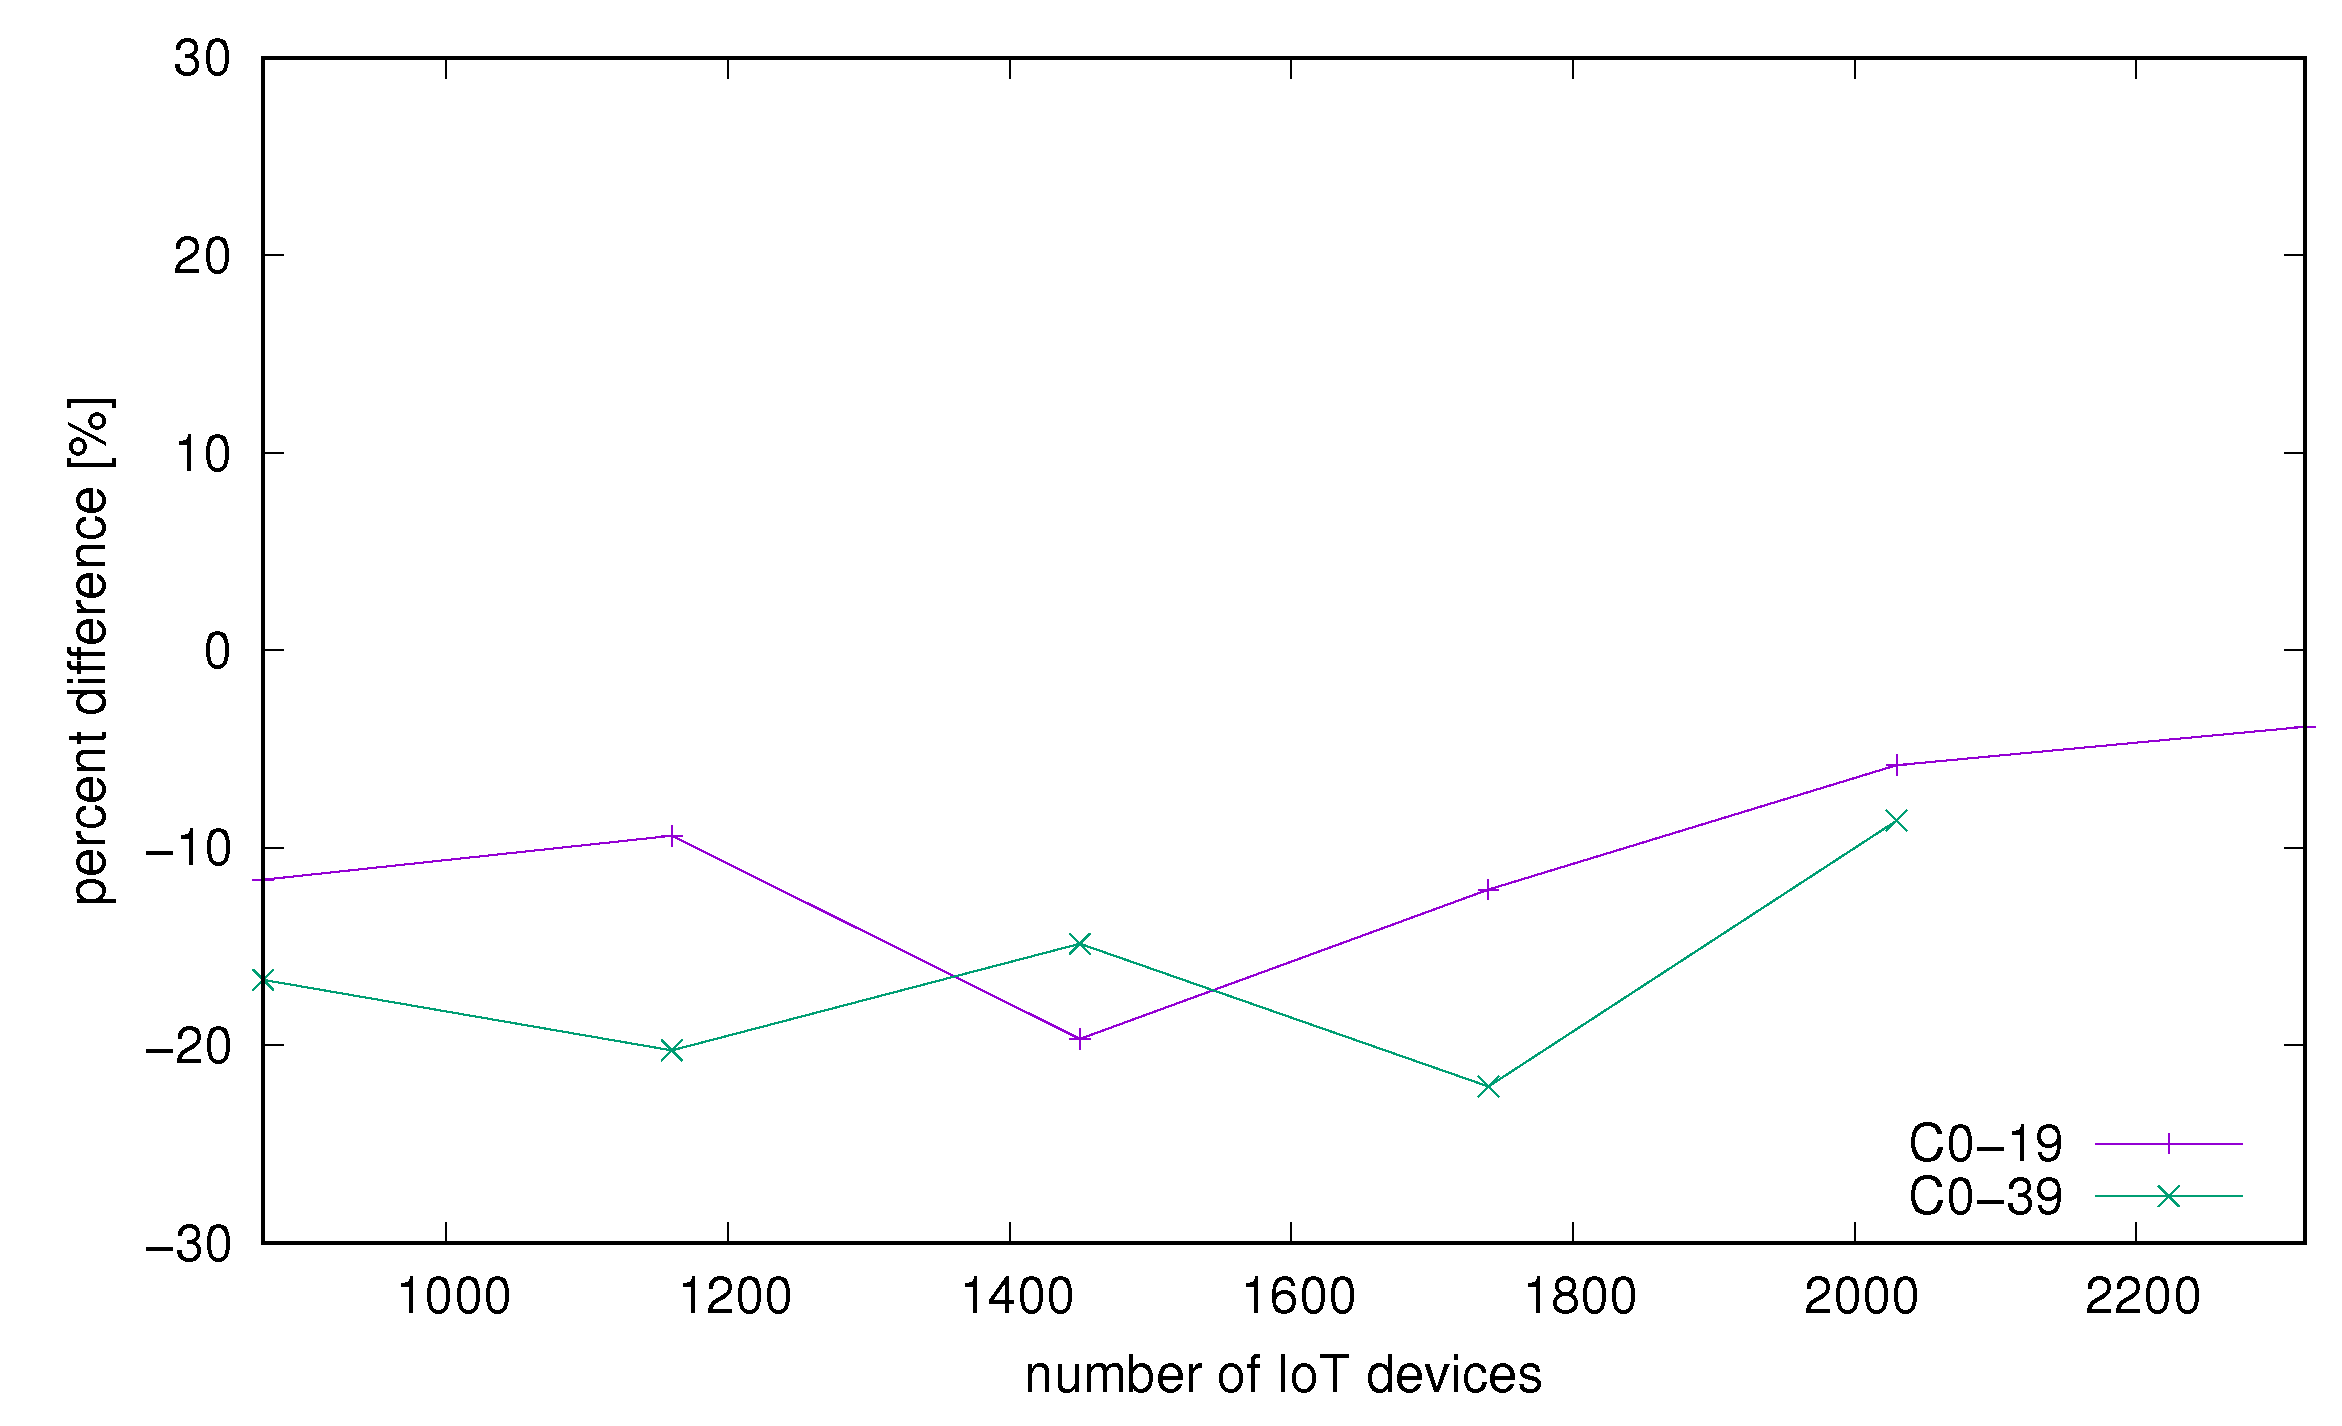
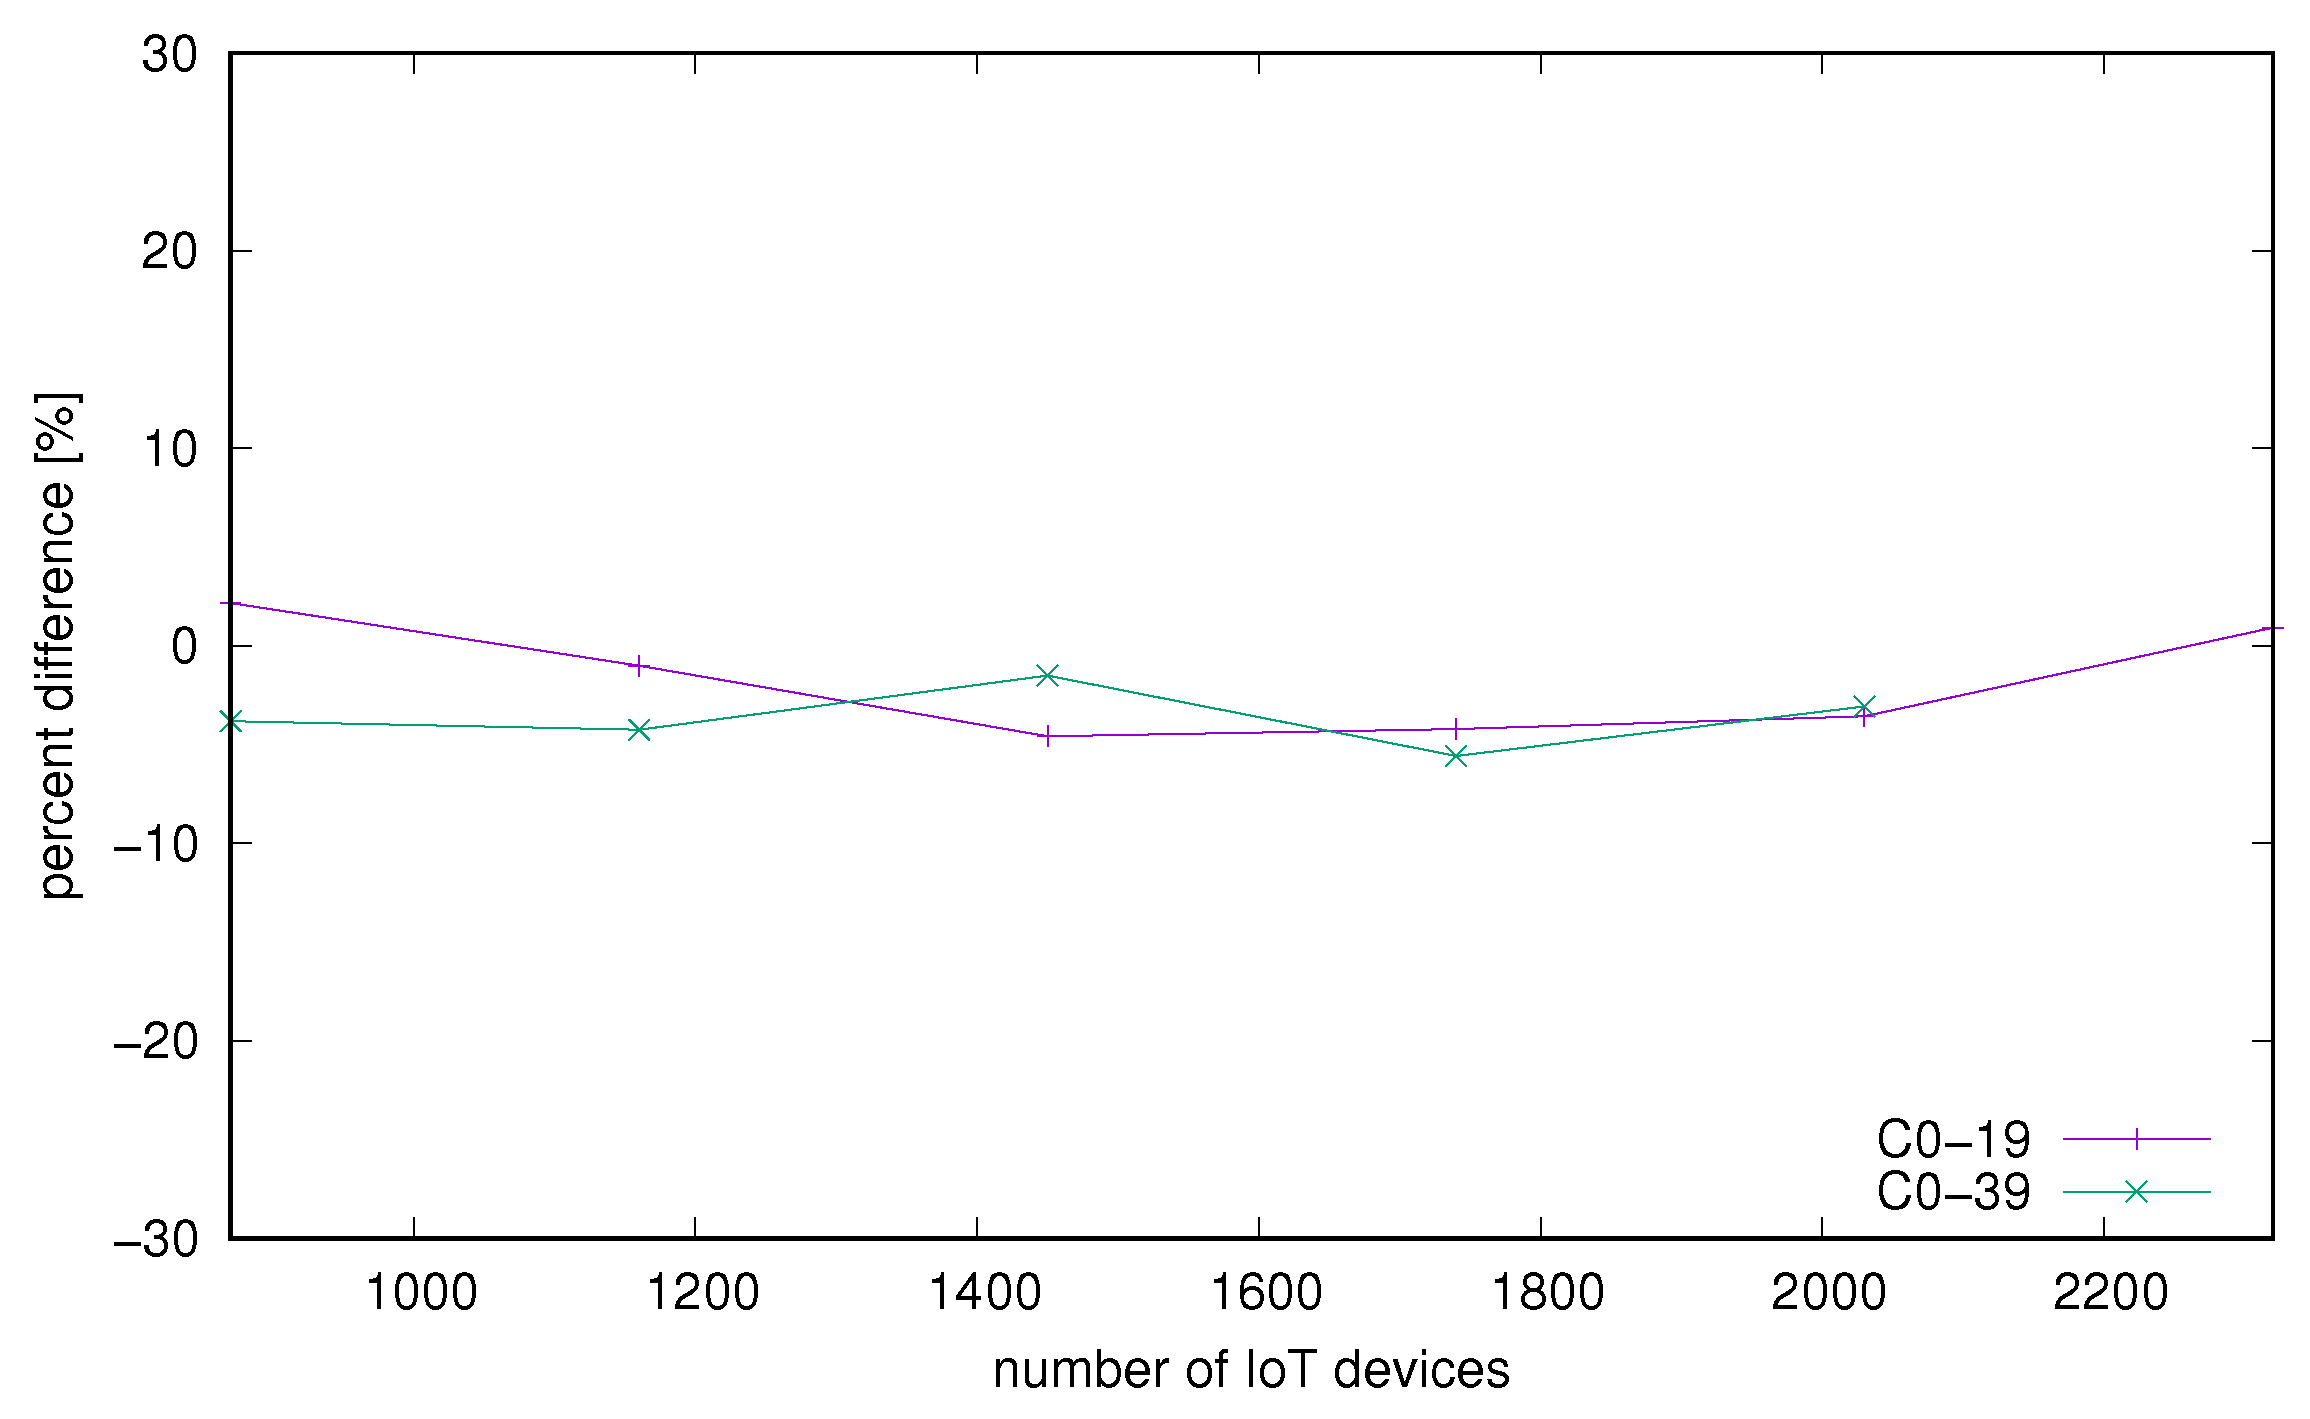
Subsequently we investigated the influence of containerization on performance. For this comparison we used only two strongest configurations. One was using cores 0–19 and the second one was running on all available cores 0–39. In Figure 7 and Figure 8 we can see differences in processing times measured on the server side and same measured on the client side. We notice that there is no significant difference between the containerized and bare-metal environments. We can conclude that under small load there is quite better performance on bare-metal but with growing load this difference diminishes (Figure 7). Times measured on the client side (Figure 8) indicate that even though small differences were found on the server side, the whole request processing time including communication, network load made the difference much less significant.
3.3. Observations and Conclusions
We can conclude with two observations. Firstly, using more physical cores as well as HyperThreading gives a noticeable increase in server processing performance. Typical gains from HyperThreading [40] are observed in the range of 0+ up to 40%, with examples from the high performance computing field such as 20–25% for numerical integration, 10–11% for image recognition applications [41]. In our case we observe an increase of about 11% for results shown in Figure 3 which is in line with expectations. Secondly, even though we see small differences in favor of bare-metal, considering times from the client perspective with network delays, Docker appears as a viable alternative.
4. Investigation of Scalable Configurations Using Containerization
In this section we investigated two architectures in several configurations. We tested architectures either with or without a load balancer. Proposed configurations differ in the number of available nodes and core affinity but overall all of them run on the same physical machine. It is important to emphasize the difference between the architecture and the configuration. A system which uses different components and/or links among those than another can be described as one having a different architecture e.g., contains a load balancer versus one that does not. On the other hand, a system with a different number of nodes than another (e.g., scaled up) is just another configuration of the same architecture. We believe that such setup may be of interest on an HPC hardware e.g., in a cloud system where a part of available resources like CPU cores may be assigned to one application while another part made available to other applications. More Docker nodes are considered in the context of performance versus memory utilization. Different CPU affinity and also impact of load balancer stated at the beginning of processing pipeline can also be considered in this respect.
4.1. Testbed Description
Our test case was set up using the same hardware as described in Section 3.1.1 along with the application model and software. However, the proposed architecture is different. In Section 3, clients were directly sending notifications to one instance of the middleware server. In the new scenarios we are changing the number of nodes running the middleware server, all of them connected through a load balancer which is built upon an nginx Docker image. Load balancing uses the round-robin algorithm and the nginx configuration is organized as follows:
- two server elements—one for a front-end service and one for an authorization service,
- SSL enabled on the server side,
- worker connections and backlog equal to 9000,
- n application nodes defined,
- connection between the load balancer and application nodes is plain HTTP (without SSL).
The load balancer is running on another machine with 24 cores (including HT) of 2 Intel Xeon E5-2640 CPUs and 64 GB of RAM. It is important to notice that setting SSL connections also between the load balancer and application nodes will significantly decrease the performance [42] but in a typical environment load balancer and nodes can be assumed to be located in a safe network so there is no need to set up SSL there.
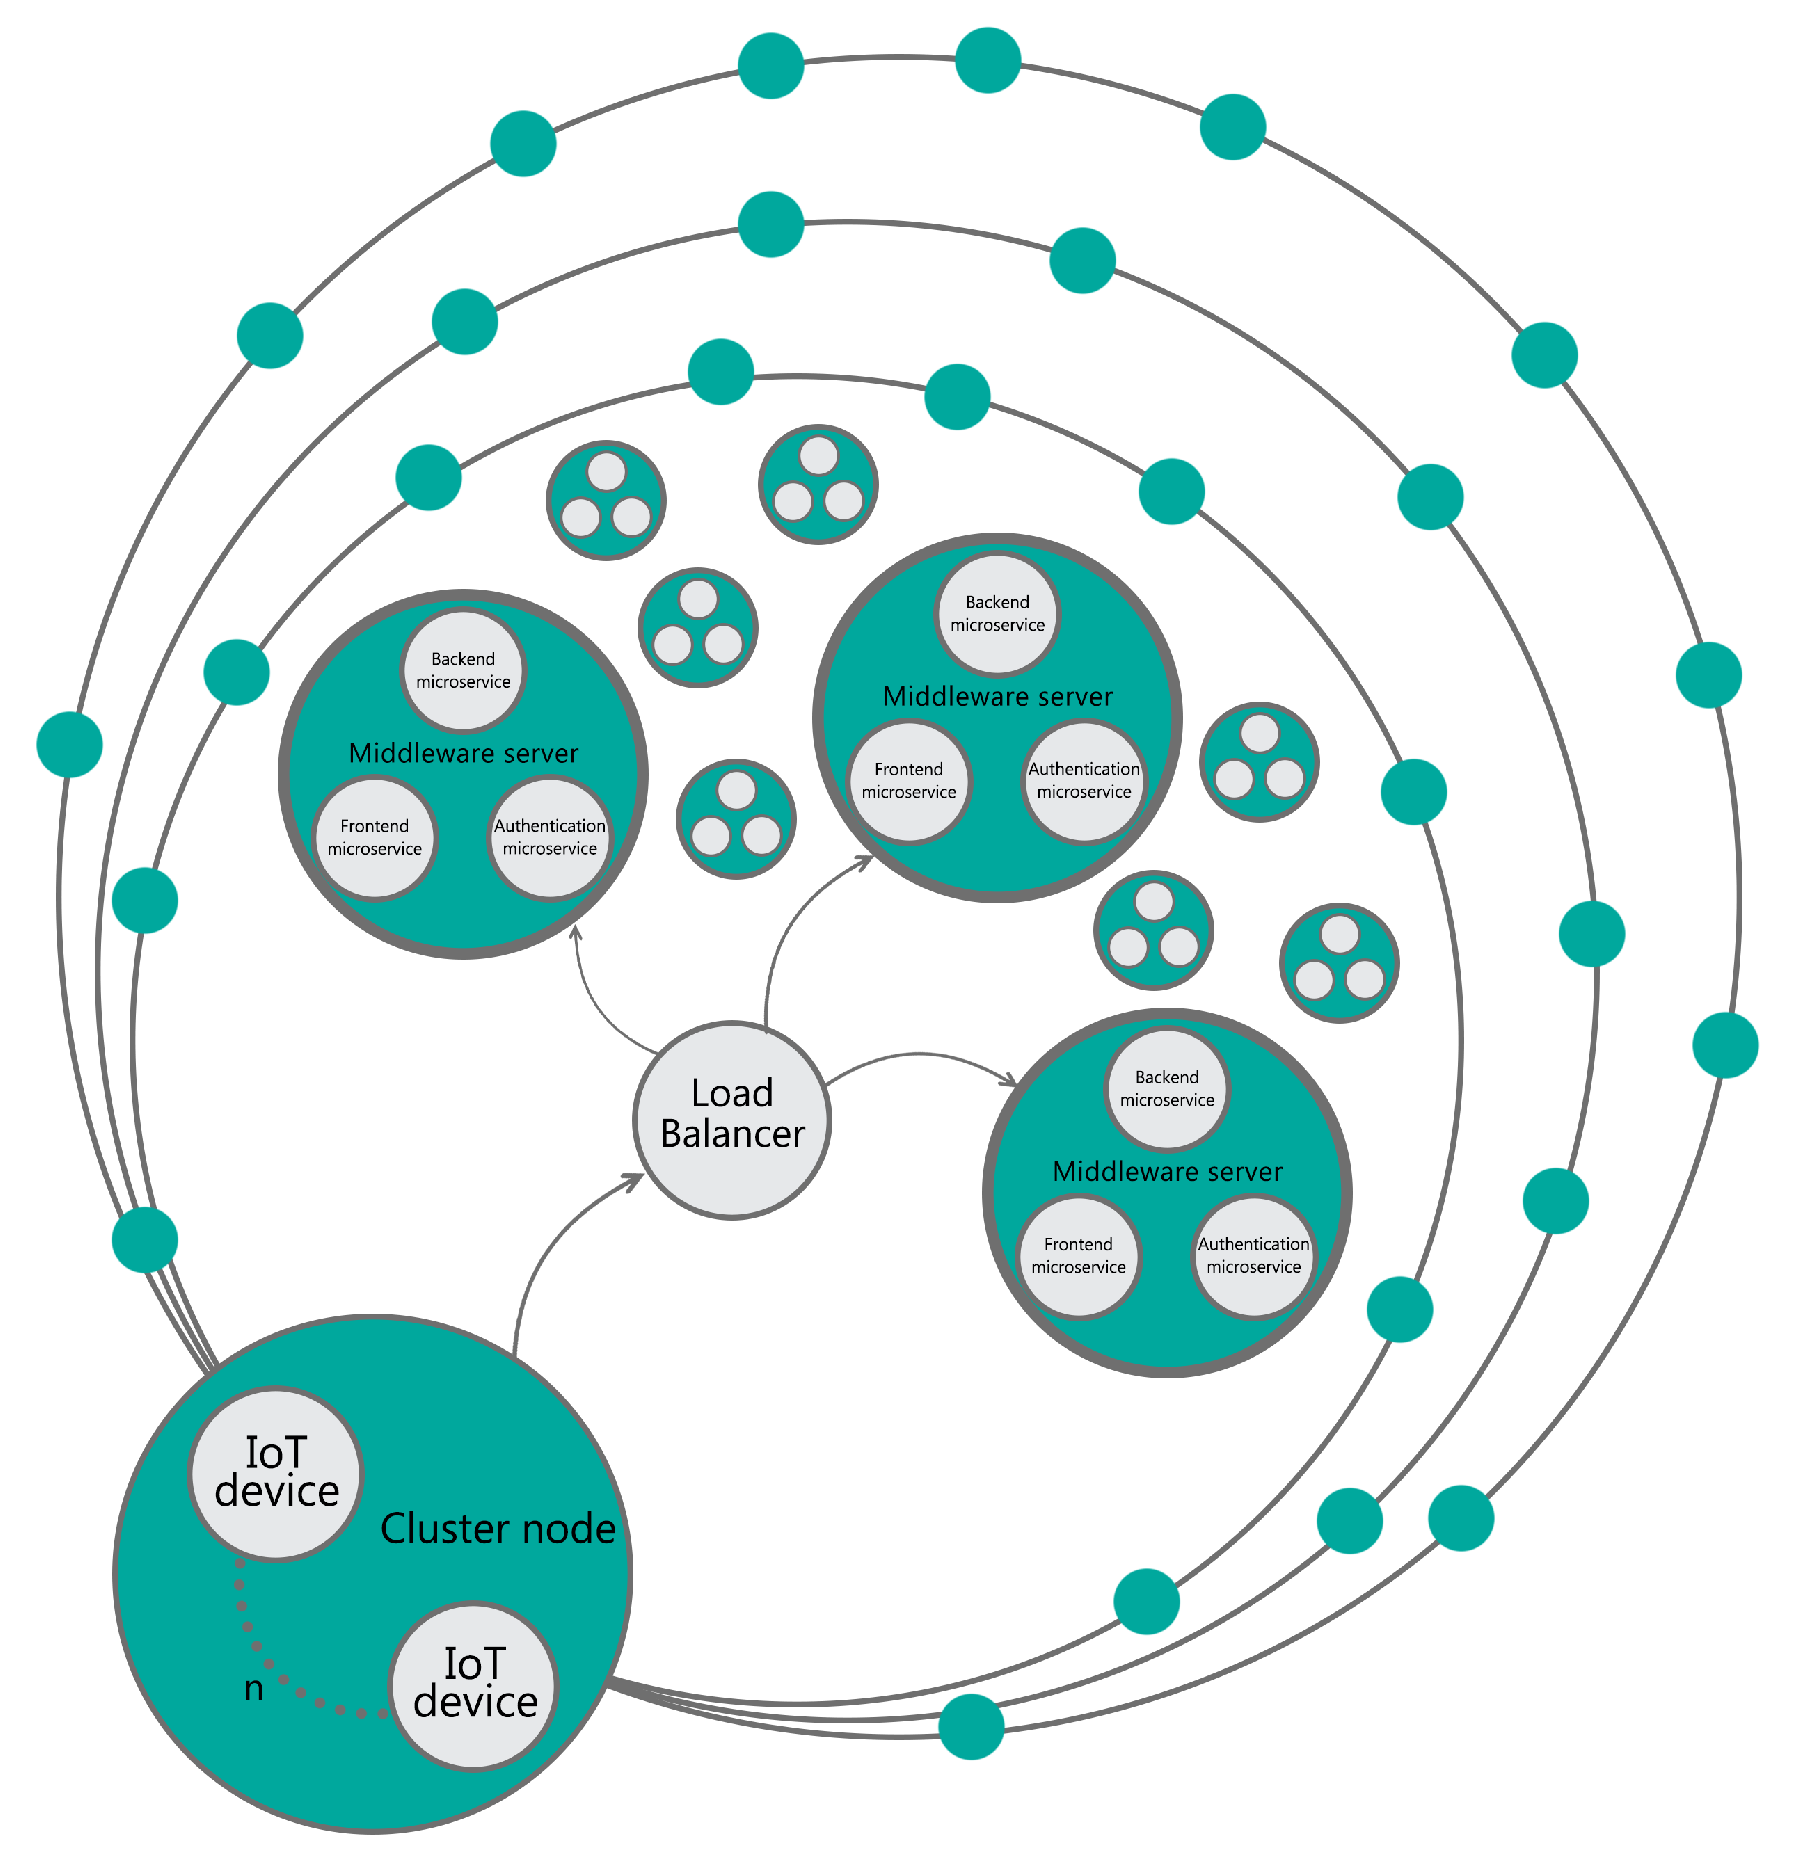
The middleware server side is built upon n Docker nodes running within one physical machine. Each node is running a Docker container with the DeviceHive middleware—backend, front-end and authorization services. Containers share resources within a physical machine. There were no limits concerning RAM usage. No CPU limits are set per container but core affinity is controlled using taskset inside a Docker container. Common data services as Kafka, Hazelcast and Postgres database are located outside of the tested environment. It is also important to notice that configuration of databases differs between the two test cases (Section 3 and Section 4) so the results should not be compared directly between them. In Figure 9 we provide an overview of the proposed architecture.
4.2. Benchmarking Process
The benchmarking process is the same on each node as described in Section 3.1.3. Docker containers running nodes are started at the beginning of each test, after a test case has ended all logs are copied from containers and containers are stopped. Gathered results contain data structures analogous to the previous experiment. Time frames and test counts are also the same.
This experiment provides us with information how different configurations of deployment on same hardware might affect scalability and stability of the assumed scenario. We investigate the following scenarios:
- 1 node with 20 cores assigned without load balancer,
- 1 node with 20 cores assigned with load balancer,
- 2 nodes with 10 cores each with load balancer,
- 5 nodes with 4 cores each with load balancer,
- 10 nodes with 2 cores each with load balancer,
- 7 nodes with 3 cores each with load balancer.
All the above configurations except the last one use 20 cores in total. It differs from the first configuration analyzed in Section 3 where we also compared engagement of all cores (40 logical processors in total) because in this scenario we need to dedicate some CPU resources for common parts of architecture as data bus as could be found in Section 4.1. It is important to note that there are out-of-the-box solutions dedicated to automatic scalability of the system like Docker Swarm and its possibility to add new nodes on runtime. Since resource requirements of particular configurations are not known in advance, our approach might help to narrow down the set of viable configurations which can be used for further automation of the process of selecting an optimal configuration.
4.3. Evaluation Metrics
In this part we focused on CPU affinity between many nodes while keeping total CPU allocation the same. Nodes are built with Docker containers and running within one physical machine. We would like to investigate various configurations that can potentially impact throughput of request handling at a potential cost of resource usage, such as memory used by several Docker containers. Additionally, we aimed at checking if a load balancer has significant influence on total processing performance.
For these tests we measured the number of successfully processed messages within the test time frame. Additionally, we consider stability of the system. This will be investigated with two measures:
- percent of invalid messages processed within the test time frame,
- comparison of median and mean values of processing time on the client side.
4.4. Results Analysis
4.4.1. Performance of Different Set-Ups
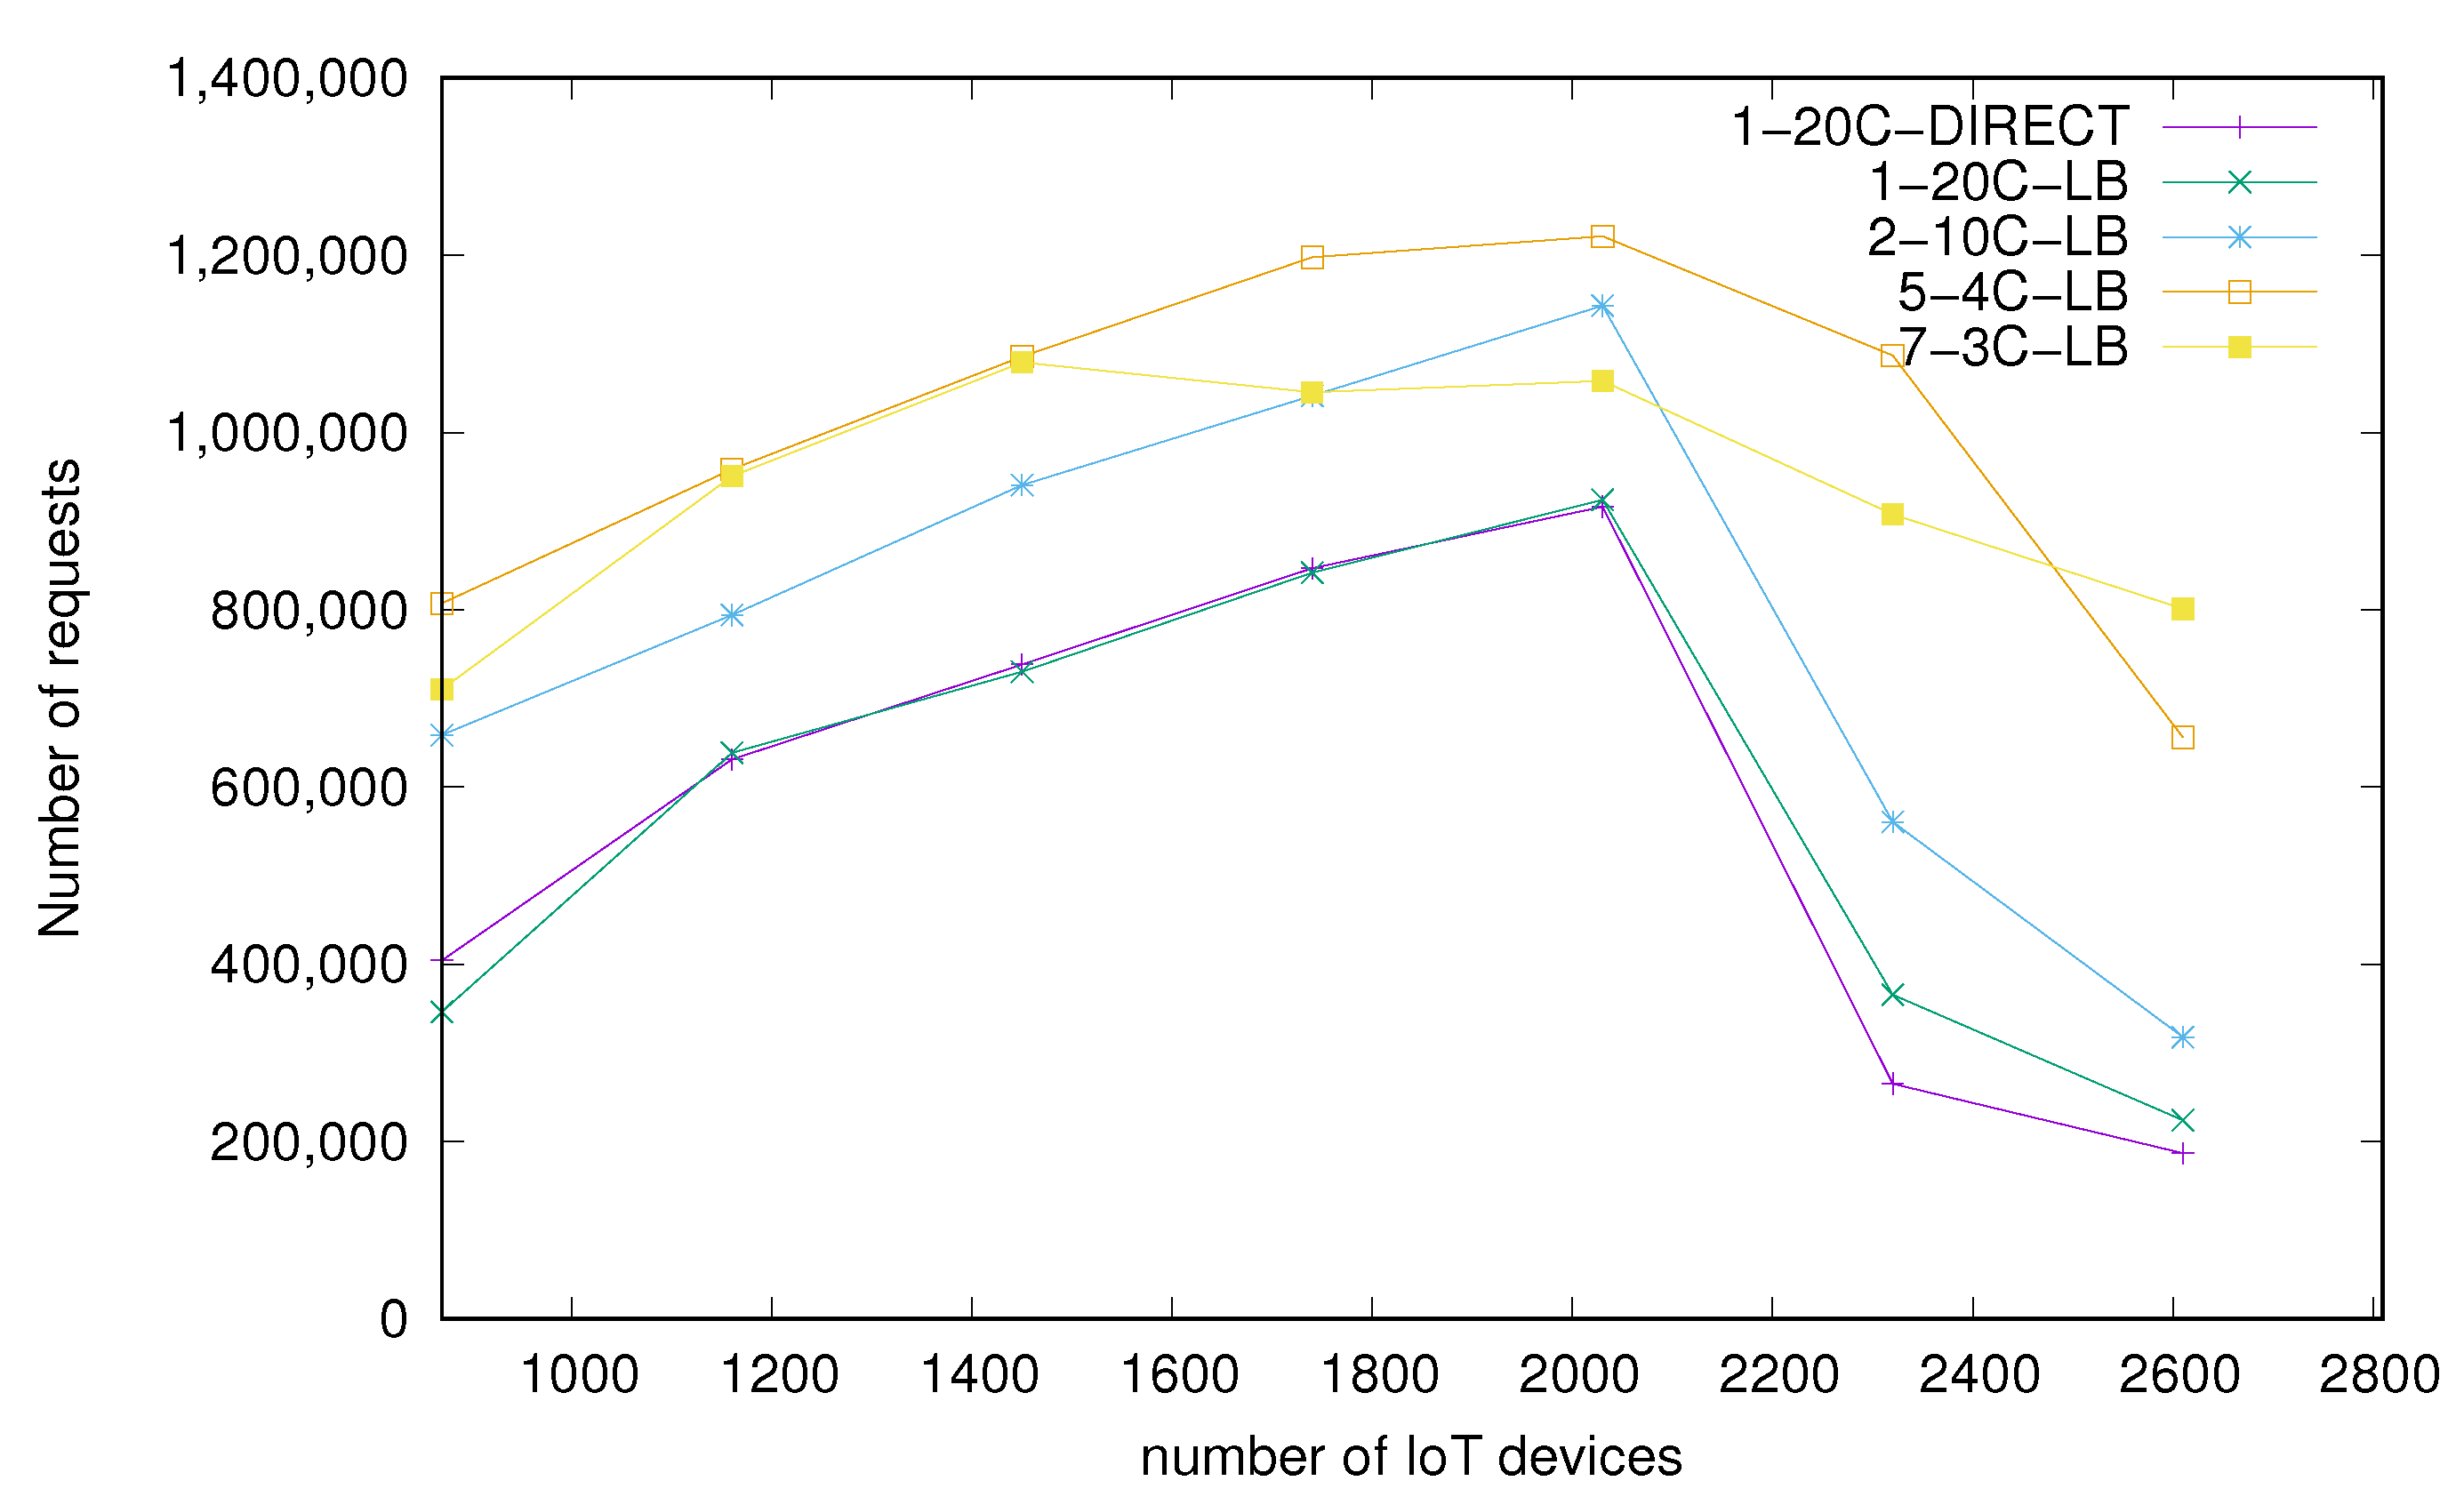
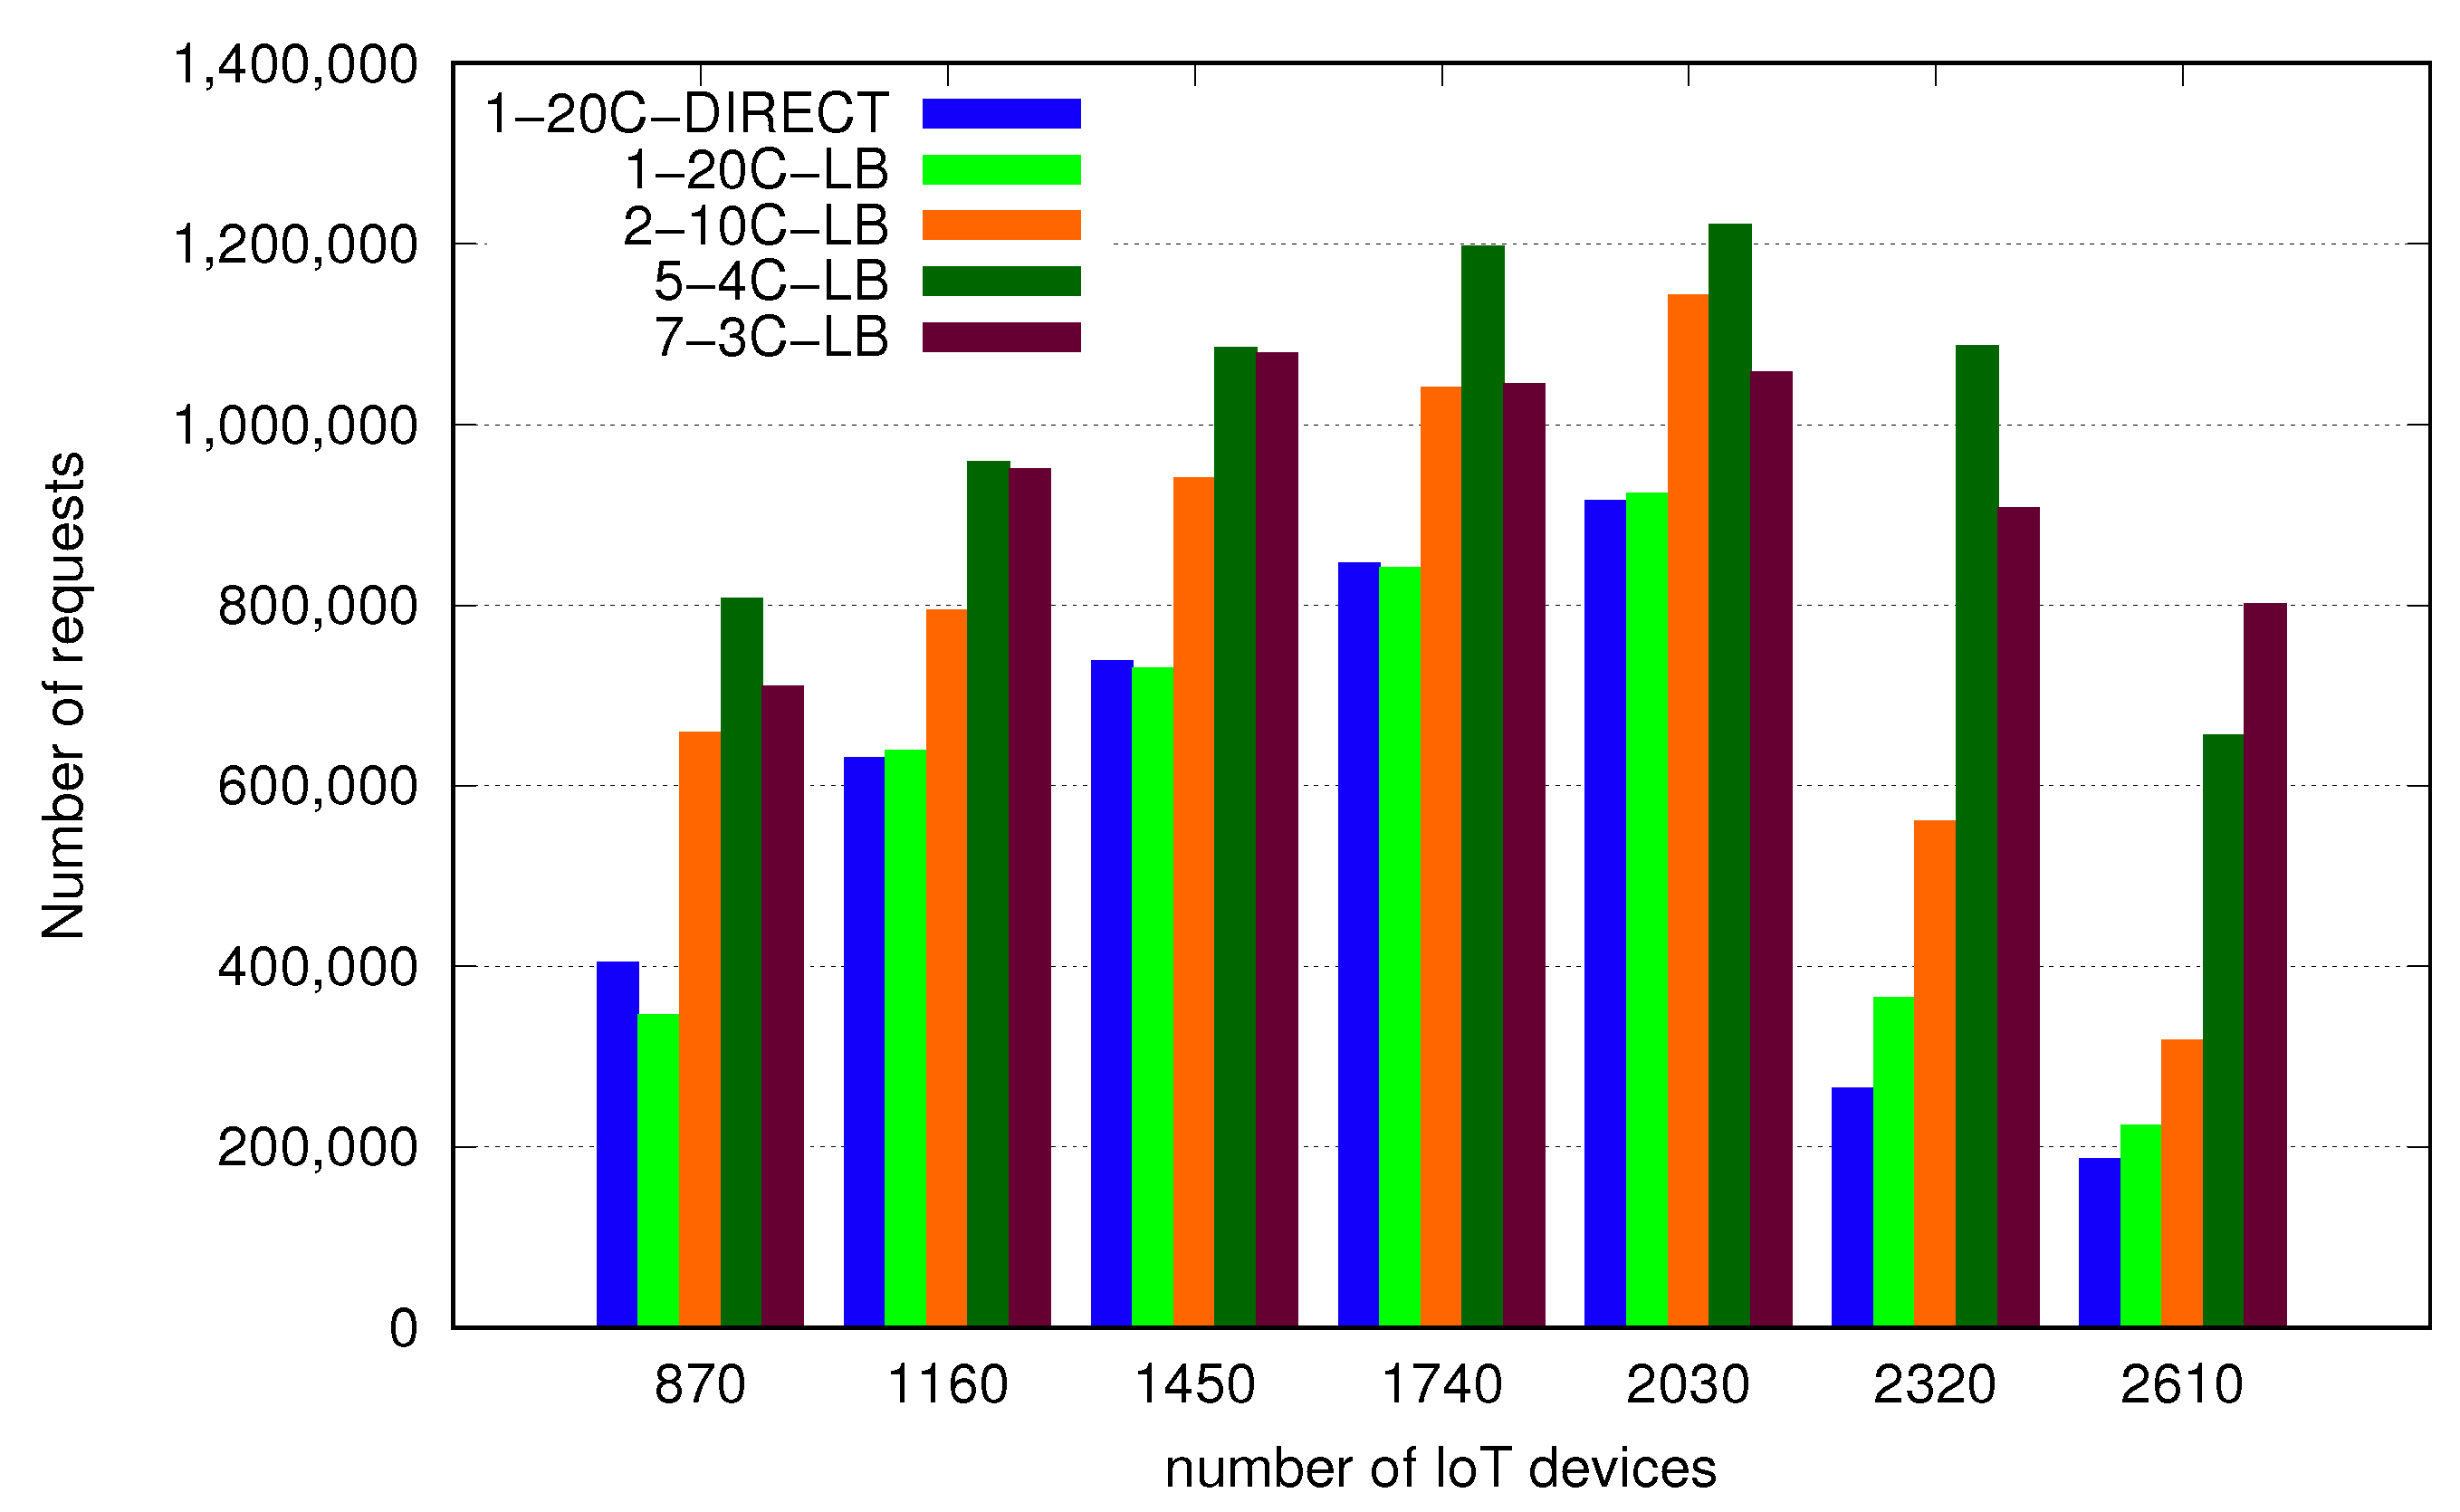
Performance measured as the number of successfully processed messages within the test time frame is shown in Figure 10. X axis values represent growing load defined as the number of IoT devices and values on the Y axis represent the number of successfully processed messages. Firstly, we observe that the versions with only one node, with and without a load balancer, have similar results. This indicates that, in such a scenario, the impact of the load balancer is really low and has practically no effect on total results. The results for the configuration with 2 nodes and 10 cores each are visibly better and configuration of 5 nodes with 4 cores each obtained the best results. It shows that it is beneficial to use more nodes with fewer cores assigned. Figure 11 provides more detailed view on differences between the configurations. It should be noted that increasing the number of Docker nodes might potentially benefit from more resources allocated this way (numbers of threads or preallocated memory buffers, depending on actual middleware code) but is limited by the system resources. For instance, we failed to end a test with the configuration of 10 nodes 2 cores each because of lack of RAM. It was possible to begin the test but a growing size of data exceeded available memory before the test ended. We also measured 7 nodes with 3 cores each and this configuration provided us with worse results than 5 nodes with 4 cores. In Table 1 we present exact results of each configuration at optimal load point (2030 clients) and also RAM usage of each configuration at the beginning of the test—when the middleware was ready to receive data from IoT clients. It should be noted that memory consumption is growing over the time of test. Table 2 contains the percentage difference compared to the architecture with the best performance.
4.4.2. Stability of Different Configurations
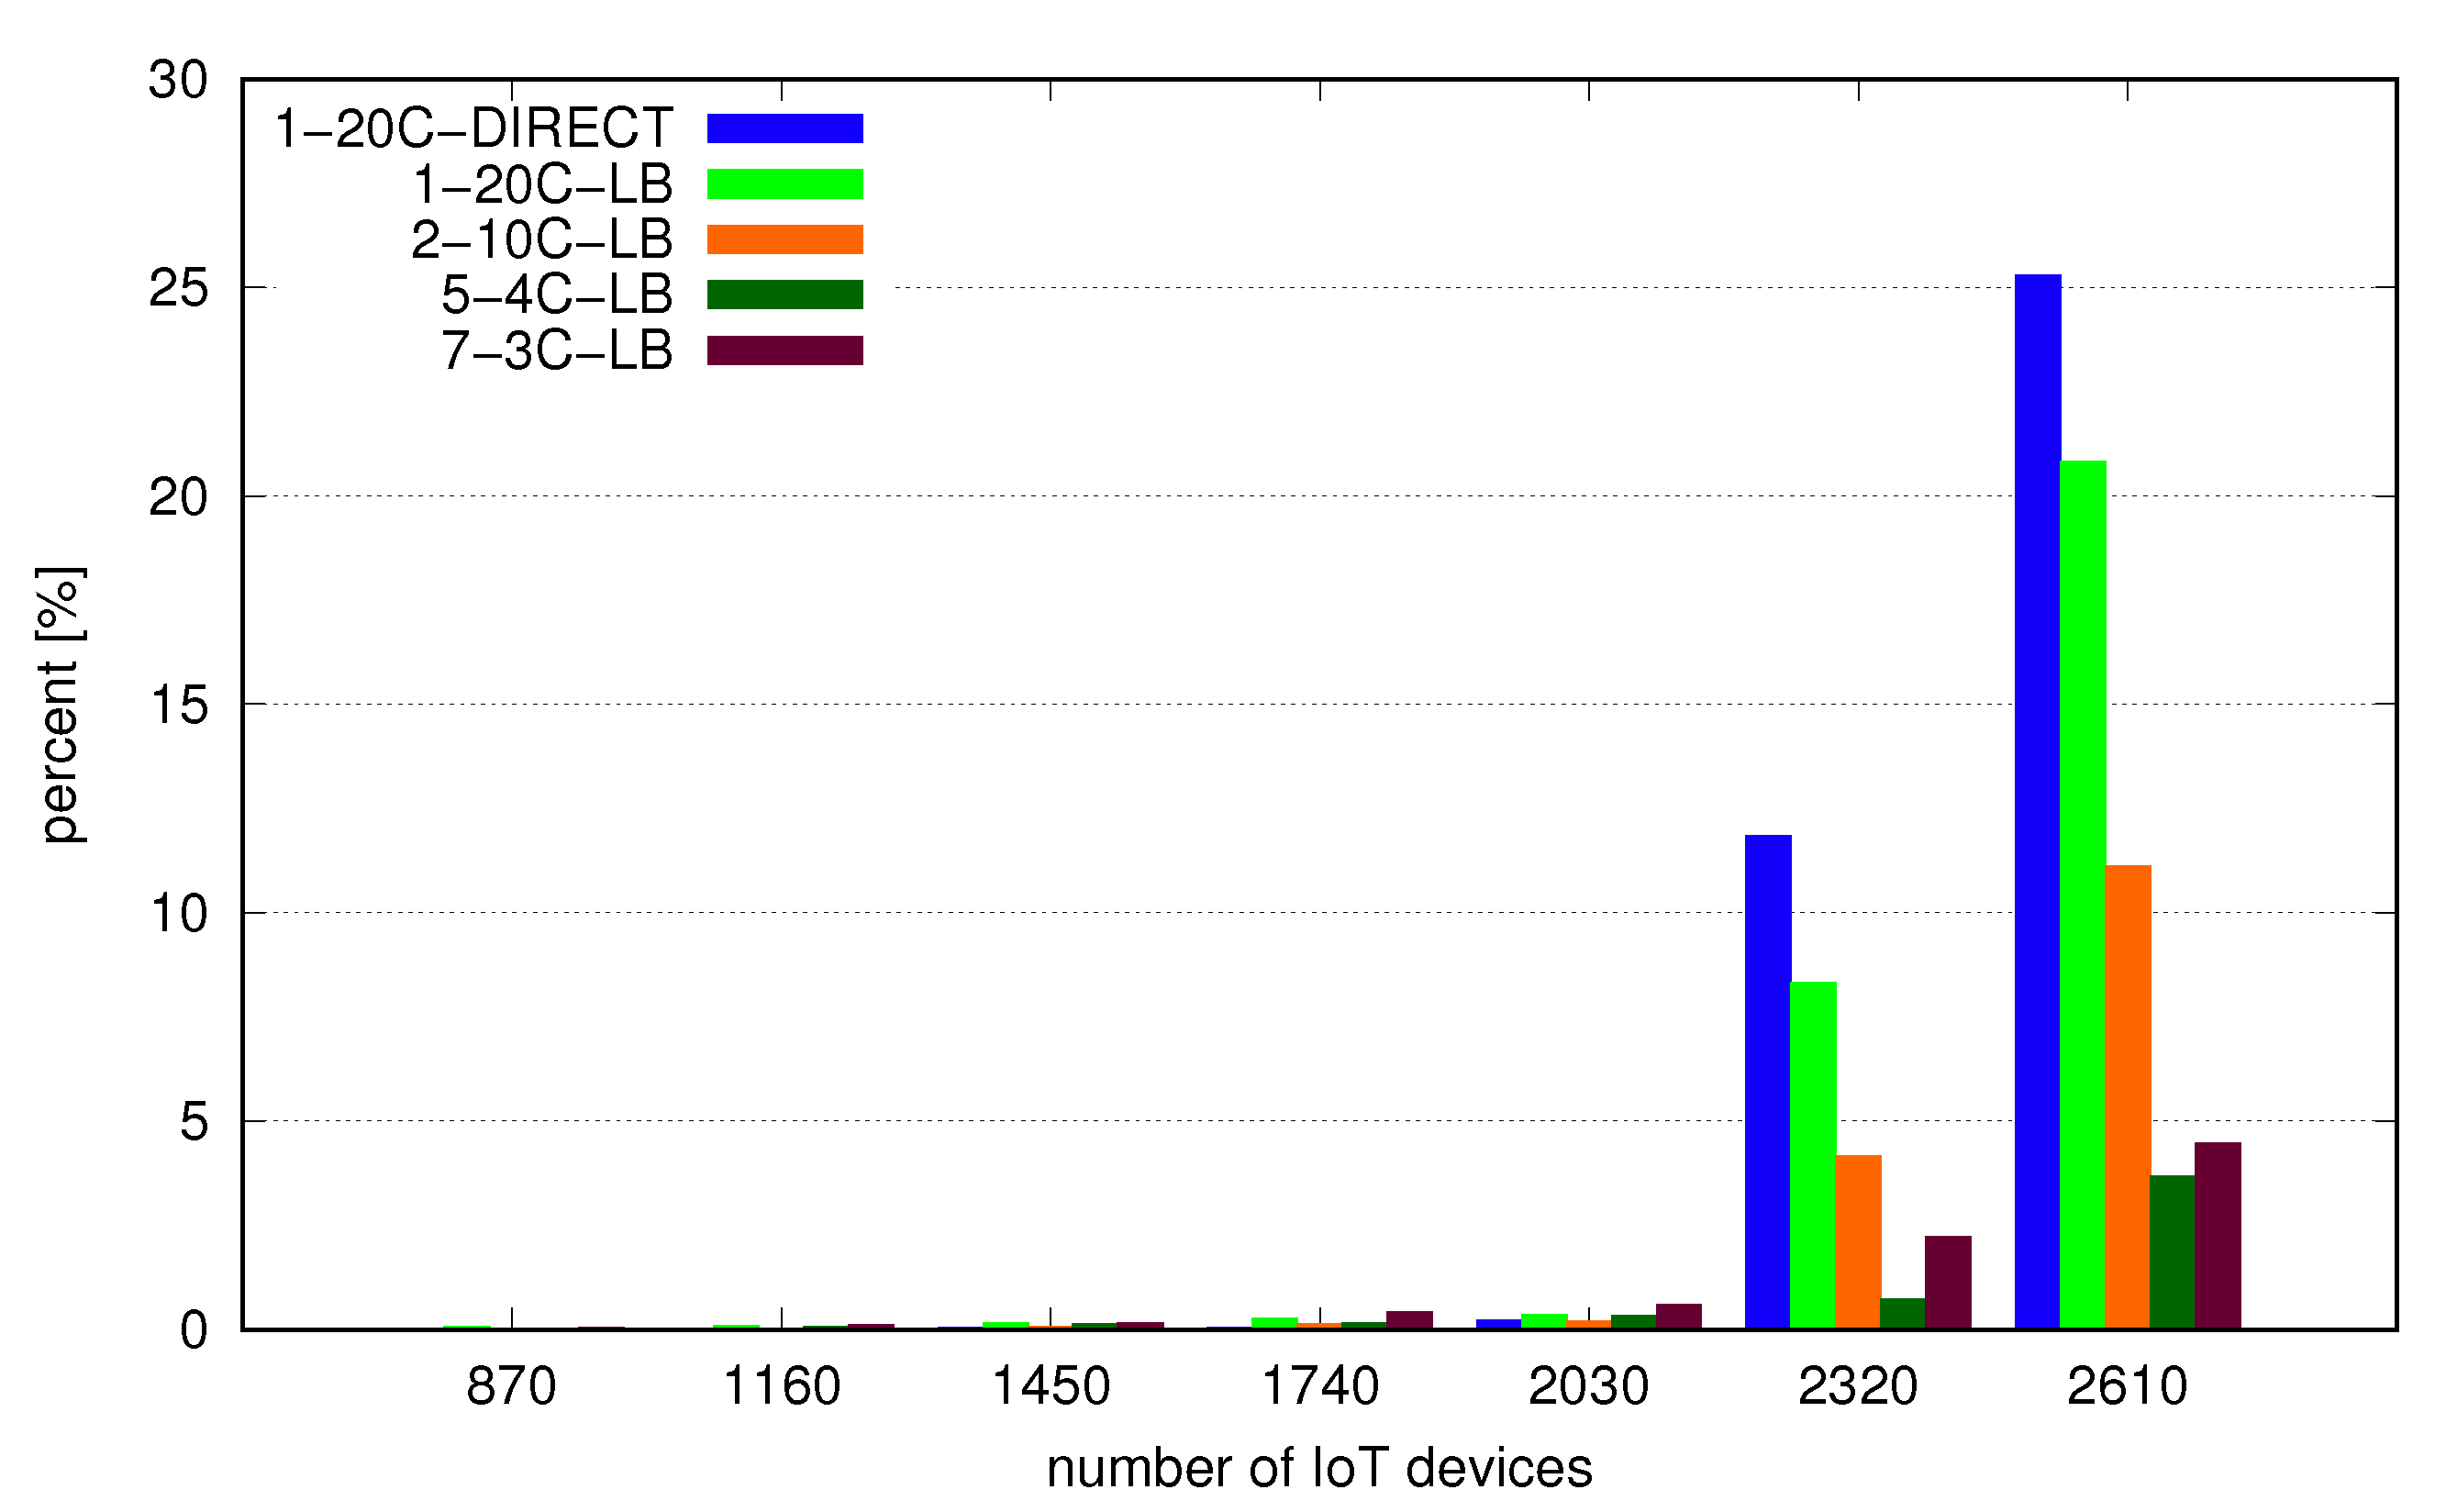
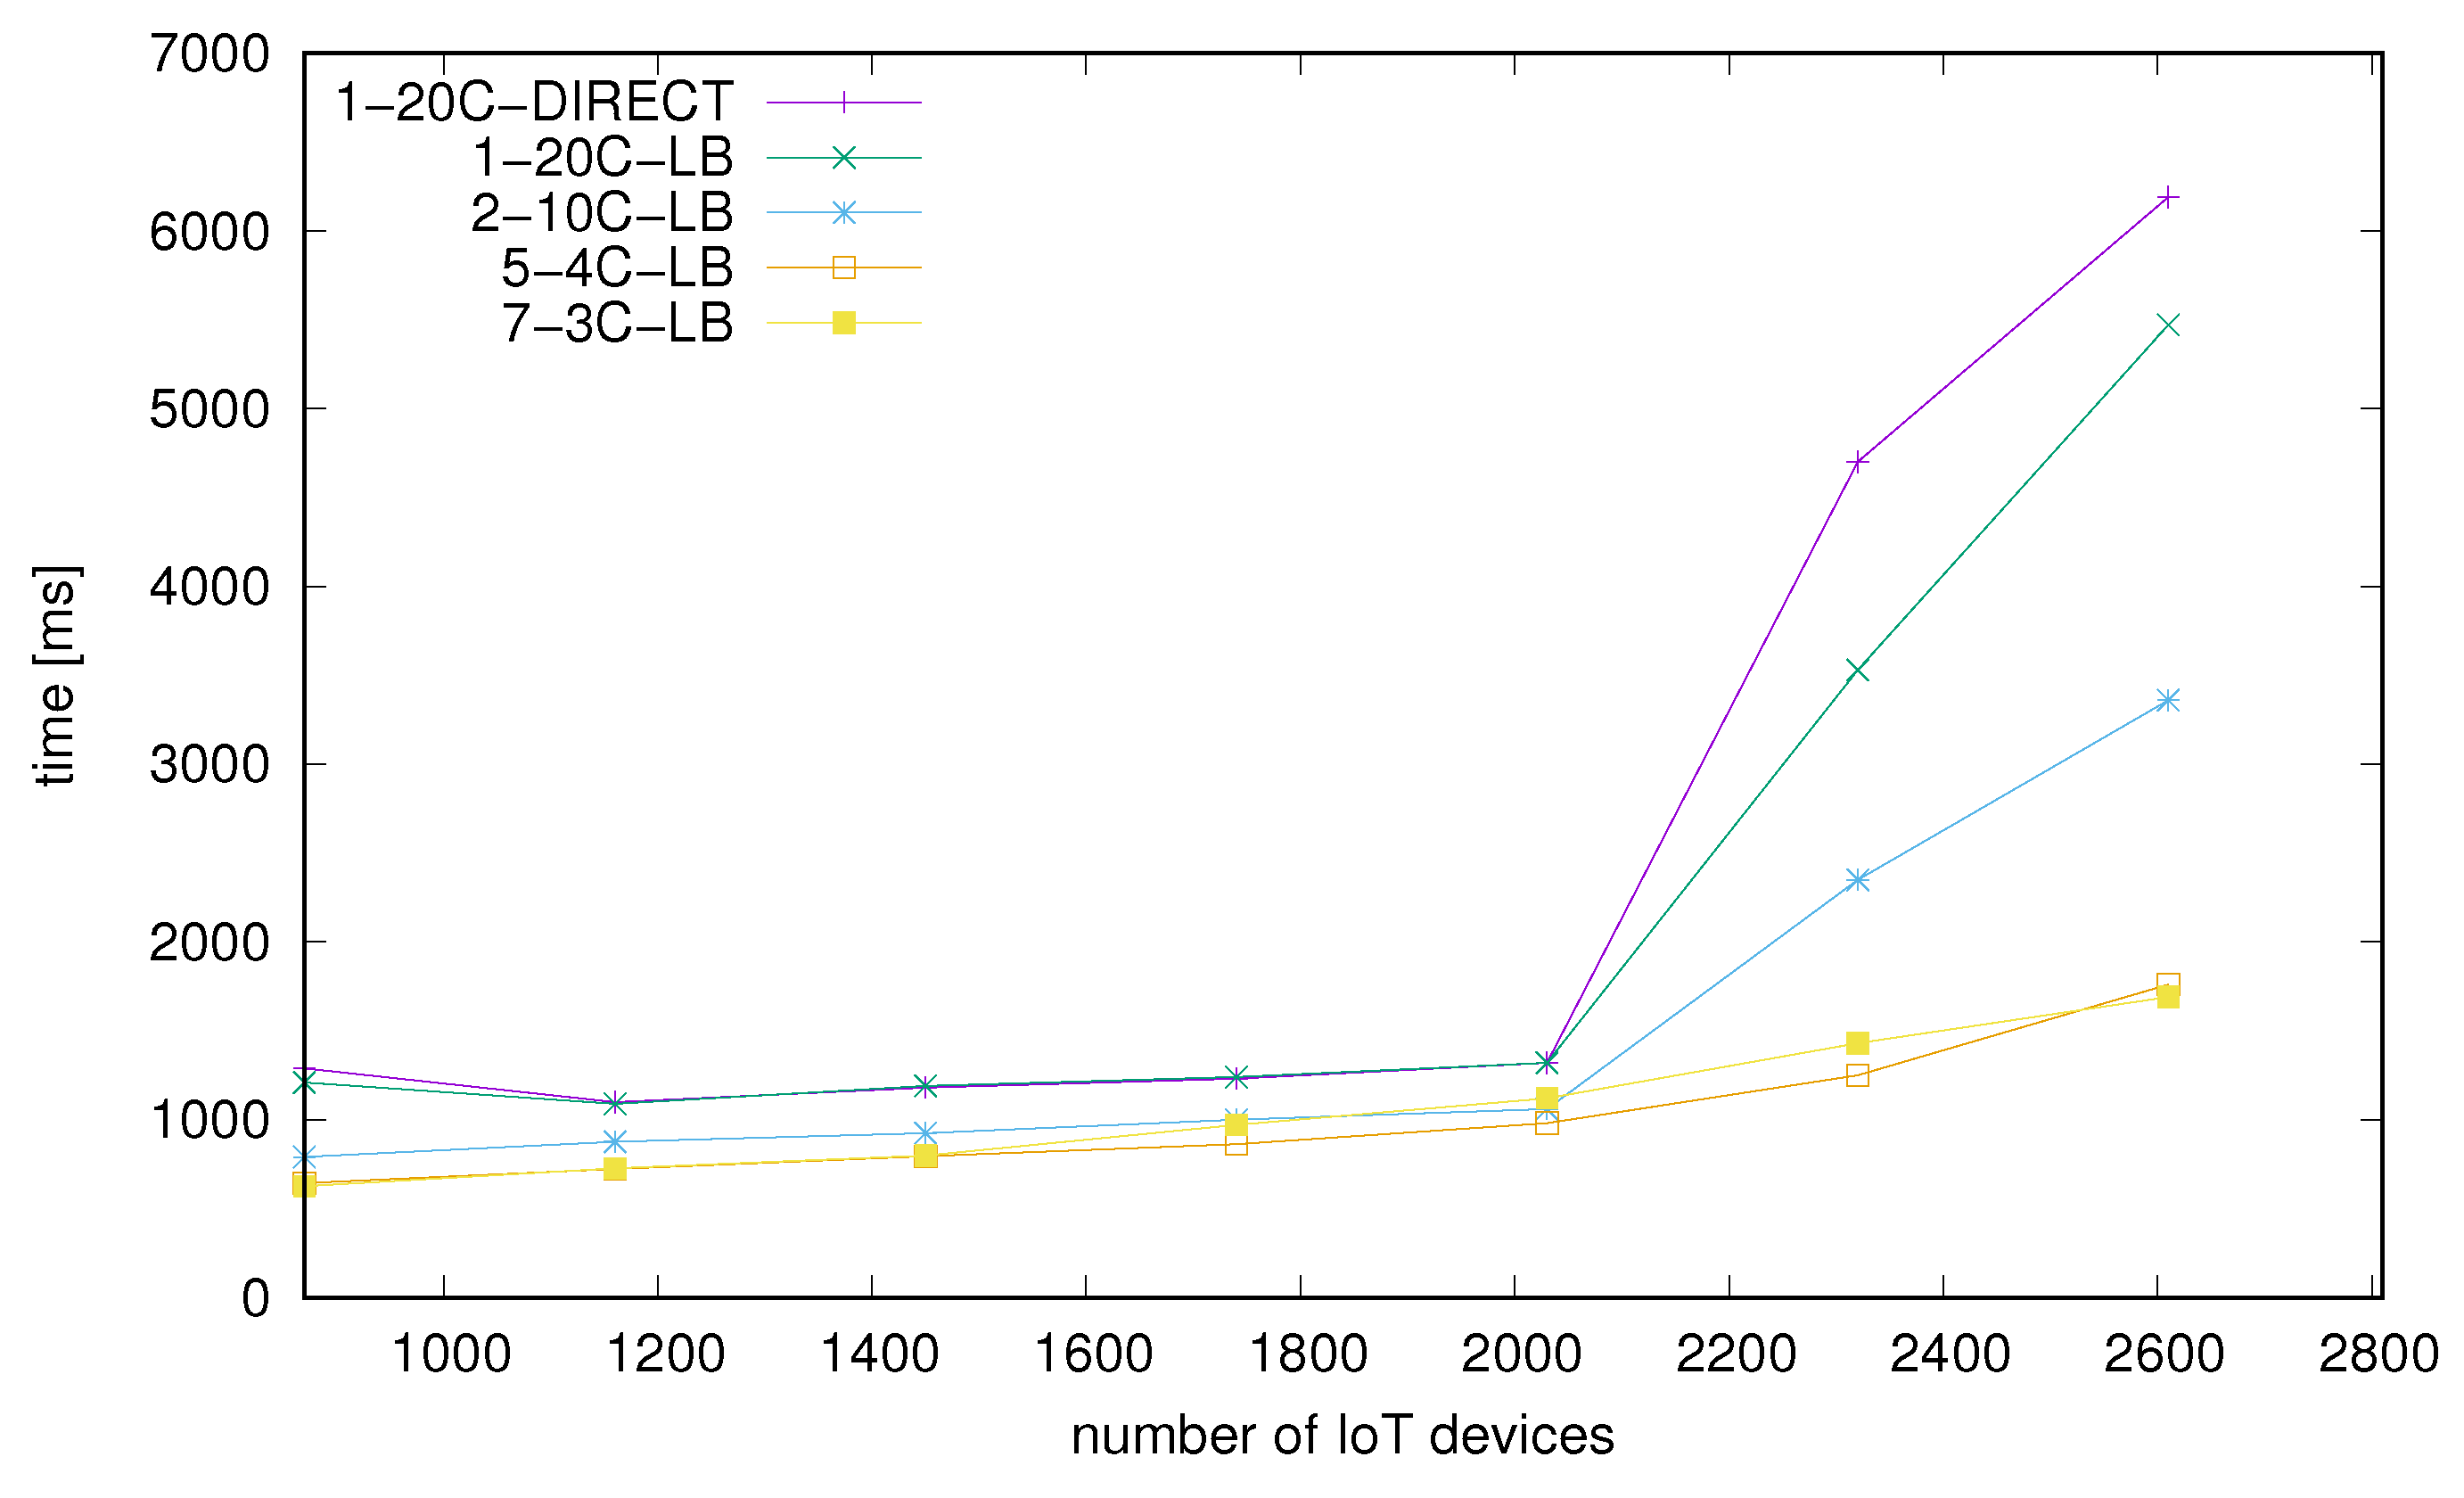
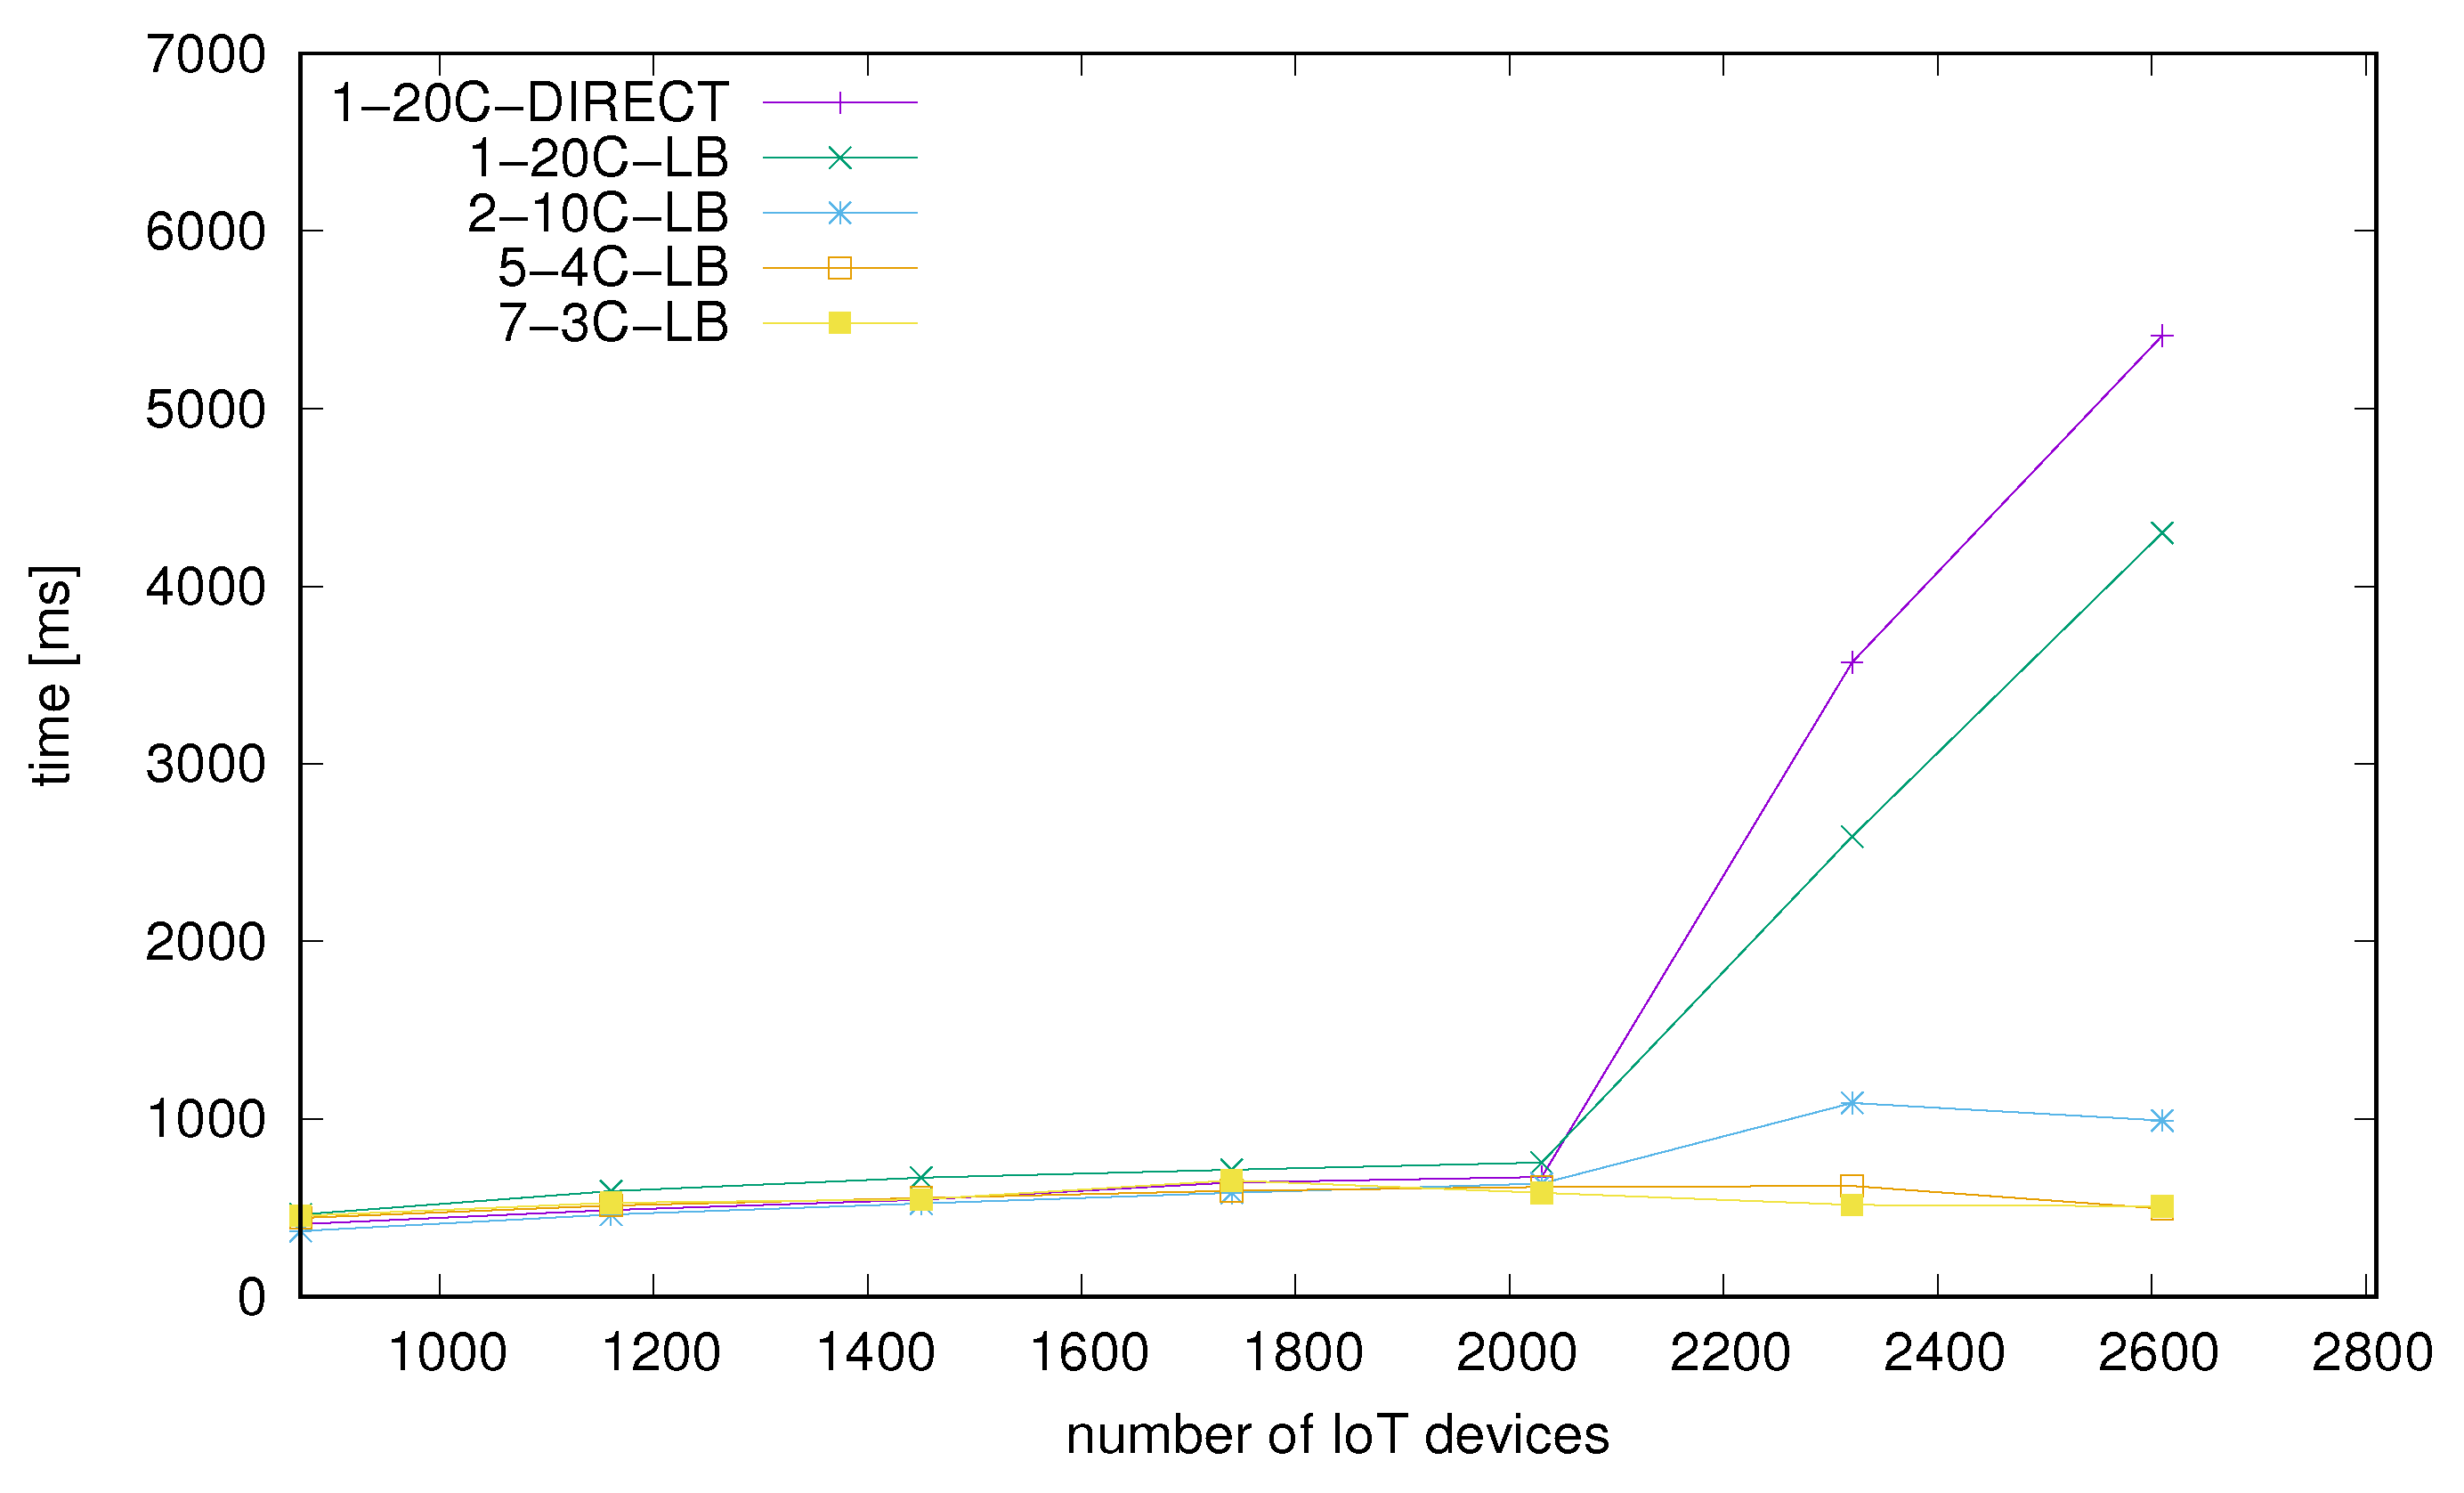
In our test stability of the solution is measured on the server side through the percentage of improperly processed messages in the test time frame. Improperly processed means any result to a request other than successful according to DeviceHive documentation [43]. If the value is really low (2% or less) we can say that stability is sufficient for such an application model and scenario. A growing number of errors will be leading to invalidation of the processed results. Based on the results presented in Figure 12 we can see that each configuration is really stable until the optimal load point and also there are no visible differences between these. Under high load the number of errors is smaller for larger numbers of nodes with best values for the configuration with 5 nodes with 4 cores each. Secondly, we observed mean values (Figure 13) and median values (Figure 14) of request-response processing time on the client side. Cases for which the mean value is visibly higher than median indicate a scenario for which some requests have taken much longer than others to complete and this is generally what we observe in the tested cases.
4.4.3. Impact of Load Balancer on Processing Time
For our purposes we used nginx software as a load balancer which is often used in many multi-node architectures. As we stated before in the performance results overview—there were insignificant differences between the solutions with and without the load balancer. Using a load balancer improves results for multi-node middleware cases. We can see that the architecture with the load balancer has a visibly smaller percentage error at high load.
5. Conclusions and Future Work
Deployment is really an important phase before running new services. When properly configured it can bring many profits in the context of costs as well as performance. In this paper we investigated the impact of containerization using Docker containers for the selected IoT middleware application—DeviceHive—with a model based on a network of many devices sending notifications continuously. We found out that that from the perspective of an end-device containerization has no important drawbacks in terms of performance. Further research provided us with interesting insights. Increasing the number of nodes in the cluster (while keeping the total number of CPU cores used within each configuration) allows to identify a configuration which presents best performance albeit this comes at the cost of increased memory usage consumed by each new node.
Moreover, taking into account our observations, and also results found in [29], we can assume that using containerization in connection with a load balancer is recommended in the proposed application model. Even if there is a minimal overhead stemming from containerization obtained benefits are much more valuable. These benefits are:
- ease of scalability—using an additional container allows to scale up the system,
- ease of portability—once configured image of a platform environment may be simply transferred and run on another machine i.e., a backup environment,
- good balance between hardware capacity and software requirements—having high-end hardware may allow to run many containers possibly with different applications,
- isolation at application level—when running different containers on same bare-metal using containerization each of these are fail-safe in terms of any software bugs i.e., an application error in one container still allows other containers to run and respond to user requests.
Future work will include investigation of other IoT middlewares, especially SiteWhere and ThingsBoard mentioned in Section 3.1.1, in the context of performance against various configurations. Additionally, we plan to perform tests with consideration of performance-energy optimization under CPU power capping [44]. Additionally, it would also be valuable to perform measurements of the system performance under client load generated either randomly or using certain call frequencies corresponding to periodic reporting of data and measurement of system’s reactions to it, possibly for a larger number of clients. Another area of interest would be in-depth statistical analysis of results gathered based on the proposed experiments which may provide us with additional observations concerning system characteristics in a given testbed.
Author Contributions
Conceptualization, R.K. and P.C.; methodology, P.C.; software, R.K.; formal analysis, P.C.; investigation, R.K.; writing—original draft preparation, R.K.; writing—review and editing, P.C.; visualization, R.K.; All authors have read and agreed to the published version of the manuscript.
Funding
This research received no external funding.
Institutional Review Board Statement
Not applicable.
Informed Consent Statement
Not applicable.
Data Availability Statement
Data is contained within the article.
Acknowledgments
In this work, we used facilities located at the Faculty of Electronics, Telecom- munications and Informatics in the lab of the Department of Computer Architecture of the aforementioned faculty.
Conflicts of Interest
The authors declare no conflict of interest.
References
- Dearle, A. Software Deployment, Past, Present and Future. In Proceedings of the Future of Software Engineering (FOSE ’07), Minneapolis, MN, USA, 23–25 May 2007; pp. 269–284. [Google Scholar] [CrossRef] [Green Version]
- Shivakumar, S.K. Architecting High Performing, Scalable and Available Enterprise Web Applications; Morgan Kaufmann: San Francisco, CA, USA, 2015. [Google Scholar]
- Odun-Ayo, I.; Okereke, C.; Orovwode, H. Cloud Application Portability: Issues and Developments. In Cloud Computing; Harkut, D.G., Kasat, K.N., Shah, S.A., Eds.; IntechOpen: Rijeka, Croatia, 2019; Chapter 4. [Google Scholar] [CrossRef] [Green Version]
- Czarnul, P.; Gołaszewski, G.; Jereczek, G.; Maciejewski, M. Development and benchmarking a parallel Data AcQuisition framework using MPI with hash and hash+tree structures in a cluster environment. In Proceedings of the 2020 19th International Symposium on Parallel and Distributed Computing (ISPDC), Warsaw, Poland, 5–8 July 2020; pp. 164–171. [Google Scholar] [CrossRef]
- Anderson, C. Docker [Software engineering]. IEEE Softw. 2015, 32, 102-c3. [Google Scholar] [CrossRef]
- Potdar, A.M.; Narayan, D.G.; Kengond, S.; Mulla, M.M. Performance Evaluation of Docker Container and Virtual Machine. Procedia Comput. Sci. 2020, 171, 1419–1428. [Google Scholar] [CrossRef]
- Beserra, D.; Moreno, E.D.; Endo, P.T.; Barreto, J.; Sadok, D.; Fernandes, S. Performance Analysis of LXC for HPC Environments. In Proceedings of the 2015 Ninth International Conference on Complex, Intelligent, and Software Intensive Systems, Santa Catarina, Brazil, 8–10 July 2015; pp. 358–363. [Google Scholar] [CrossRef]
- Beserra, D.; Pinheiro, M.K.; Souveyet, C.; Steffenel, L.A.; Moreno, E.D. Performance Evaluation of OS-Level Virtualization Solutions for HPC Purposes on SoC-Based Systems. In Proceedings of the 2017 IEEE 31st International Conference on Advanced Information Networking and Applications (AINA), Taipei, Taiwan, 27–29 March 2017; pp. 363–370. [Google Scholar] [CrossRef]
- da Silva, V.G.; Kirikova, M.; Alksnis, G. Containers for Virtualization: An Overview. Appl. Comput. Syst. 2018, 23, 21–27. [Google Scholar] [CrossRef] [Green Version]
- Abdul, M.S.; Sam, S.M.; Norliza; Mohamed; Kamardin, K.; Akmam, R.; Dziyauddin. Docker Containers Usage in the Internet of Things: A Survey. Open Int. J. Inform. 2019, 7, 208–220. [Google Scholar]
- Alam, M.; Rufino, J.; Ferreira, J.; Ahmed, S.H.; Shah, N.; Chen, Y. Orchestration of Microservices for IoT Using Docker and Edge Computing. IEEE Commun. Mag. 2018, 56, 118–123. [Google Scholar] [CrossRef]
- Ismail, B.I.; Mostajeran Goortani, E.; Ab Karim, M.B.; Ming Tat, W.; Setapa, S.; Luke, J.Y.; Hong Hoe, O. Evaluation of Docker as Edge computing platform. In Proceedings of the 2015 IEEE Conference on Open Systems (ICOS), Melaka, Malaysia, 24–26 August 2015; pp. 130–135. [Google Scholar] [CrossRef]
- Aruna, K.; Pradeep, G. Measure The IoT Framework Using Docker With Fog Computing. Int. J. Sci. Technol. Res. 2020, 9, 5677–5682. [Google Scholar]
- Giallorenzo, S.; Mauro, J.; Poulsen, M.; Siroky, F. Virtualization Costs: Benchmarking Containers and Virtual Machines Against Bare-Metal. SN Comput. Sci. 2021, 2, 404. [Google Scholar] [CrossRef]
- von Leon, D.; Miori, L.; Sanin, J.; El Ioini, N.; Helmer, S.; Pahl, C. A Lightweight Container Middleware for Edge Cloud Architectures. In Fog and Edge Computing; John Wiley & Sons, Ltd.: Hoboken, NJ, USA, 2019; Chapter 7; pp. 145–170. [Google Scholar] [CrossRef]
- Agarwal, P.; Alam, M. Investigating IoT Middleware Platforms for Smart Application Development. arXiv 2019, arXiv:1810.12292. [Google Scholar]
- Ismail, A.A.; Hamza, H.S.; Kotb, A.M. Performance Evaluation of Open Source IoT Platforms. In Proceedings of the 2018 IEEE Global Conference on Internet of Things (GCIoT), Alexandria, Egypt, 5–7 December 2018; pp. 1–5. [Google Scholar] [CrossRef]
- da Cruz, M.A.; Rodrigues, J.J.; Sangaiah, A.K.; Al-Muhtadi, J.; Korotaev, V. Performance evaluation of IoT middleware. J. Netw. Comput. Appl. 2018, 109, 53–65. [Google Scholar] [CrossRef]
- Tyagi, V.; Rawat, N.; Ram, M. Reliability modelling and sensitivity analysis of IoT based flood alerting system. J. Qual. Maint. Eng. 2021, 27, 292–307. [Google Scholar] [CrossRef]
- Ur-Rehman, A.; Gondal, I.; Kamruzzaman, J.; Jolfaei, A. Sensitivity Analysis for Vulnerability Mitigation in Hybrid Networks. Electronics 2022, 11, 238. [Google Scholar] [CrossRef]
- Putri, A.R.; Munadi, R.; Negara, R.M. Performance analysis of multi services on container Docker, LXC, and LXD. Bull. Electr. Eng. Inform. 2020, 9, 2008–2016. [Google Scholar] [CrossRef]
- Felter, W.; Ferreira, A.; Rajamony, R.; Rubio, J. An updated performance comparison of virtual machines and Linux containers. In Proceedings of the 2015 IEEE International Symposium on Performance Analysis of Systems and Software (ISPASS), Philadelphia, PA, USA, 29–31 March 2015; pp. 171–172. [Google Scholar] [CrossRef] [Green Version]
- Park, Y.; Yang, H.; Dinh, T.; Kim, Y. Design and implementation of a container-based virtual client architecture for interactive digital signage systems. Int. J. Distrib. Sens. Netw. 2017, 13, 1550147717717864. [Google Scholar] [CrossRef] [Green Version]
- Noor, S.; Koehler, B.; Steenson, A.; Caballero, J.; Ellenberger, D.; Heilman, L. IoTDoc: A Docker-Container Based Architecture of IoT-Enabled Cloud System. In Big Data, Cloud Computing, and Data Science Engineering; Springer International Publishing: Cham, Switzerland, 2020; pp. 51–68. [Google Scholar] [CrossRef]
- Islam, J.; Harjula, E.; Kumar, T.; Karhula, P.; Ylianttila, M. Docker Enabled Virtualized Nanoservices for Local IoT Edge Networks. In Proceedings of the 2019 IEEE Conference on Standards for Communications and Networking (CSCN), Granada, Spain, 28–30 October 2019; pp. 1–7. [Google Scholar] [CrossRef] [Green Version]
- Ahmed, B.; Seghir, B.; Al-Osta, M.; Abdelouahed, G. Container Based Resource Management for Data Processing on IoT Gateways. Procedia Comput. Sci. 2019, 155, 234–241. [Google Scholar] [CrossRef]
- Morabito, R.; Farris, I.; Iera, A.; Taleb, T. Evaluating Performance of Containerized IoT Services for Clustered Devices at the Network Edge. IEEE Internet Things J. 2017, 4, 1019–1030. [Google Scholar] [CrossRef] [Green Version]
- Morabito, R. A performance evaluation of container technologies on Internet of Things devices. In Proceedings of the 2016 IEEE Conference on Computer Communications Workshops (INFOCOM WKSHPS), San Francisco, CA, USA, 10–14 April 2016; pp. 999–1000. [Google Scholar] [CrossRef] [Green Version]
- Ruchika. Evaluation of Docker for IoT Application. Int. J. Recent Innov. Trends Comput. Commun. 2016, 4, 624–628. [Google Scholar] [CrossRef]
- Chung, M.T.; Quang-Hung, N.; Nguyen, M.T.; Thoai, N. Using Docker in high performance computing applications. In Proceedings of the 2016 IEEE Sixth International Conference on Communications and Electronics (ICCE), Ha-Long, Vietnam, 27–29 July 2016; pp. 52–57. [Google Scholar] [CrossRef]
- Saha, P.; Beltre, A.; Uminski, P.; Govindaraju, M. Evaluation of Docker Containers for Scientific Workloads in the Cloud. arXiv 2019, arXiv:1905.08415. [Google Scholar]
- Rezende Alles, G.; Carissimi, A.; Mello Schnorr, L. Assessing the Computation and Communication Overhead of Linux Containers for HPC Applications. In Proceedings of the 2018 Symposium on High Performance Computing Systems (WSCAD), Sao Paulo, Brazil, 1–3 October 2018; pp. 116–123. [Google Scholar] [CrossRef]
- Kałaska, R.; Czarnul, P. Benchmarking Scalability and Security Configuration Impact for A Distributed Sensors-Server IOT Use Case. In Proceedings of the 37th IBIMA Conference, Cordoba, Spain, 1–2 April 2021. [Google Scholar]
- Shopov, M.P. An M2M solution for smart metering in electrical power systems. In Proceedings of the 2016 39th International Convention on Information and Communication Technology, Electronics and Microelectronics (MIPRO), Opatija, Croatia, 30 May–3 June 2016; pp. 1141–1144. [Google Scholar] [CrossRef]
- Lyaskov, M.; Spasov, G.; Petrova, G. A practical implementation of smart home energy data storage and control application based on cloud services. In Proceedings of the 2017 XXVI International Scientific Conference Electronics (ET), Sozopol, Bulgaria, 13–15 September 2017; pp. 1–4. [Google Scholar] [CrossRef]
- Microservices Adoption in 2020. Available online: https://www.oreilly.com/radar/microservices-adoption-in-2020/ (accessed on 26 April 2022).
- SiteWhere Documentation. Available online: https://sitewhere.io/docs/2.1.0/platform/ (accessed on 26 April 2022).
- ThingsBoard Documentation. Available online: https://thingsboard.io/docs/getting-started-guides/helloworld/ (accessed on 26 April 2022).
- DeviceHive Documentation. Available online: https://github.com/devicehive/devicehive-java-server/wiki/Getting-started (accessed on 26 April 2022).
- Czarnul, P. Parallel Programming for Modern High Performance Computing Systems; Chapman and Hall/CRC Press/Taylor & Francis: Boca Raton, FL, USA, 2018. [Google Scholar]
- Czarnul, P. Assessment of OpenMP Master–Slave Implementations for Selected Irregular Parallel Applications. Electronics 2021, 10, 1188. [Google Scholar] [CrossRef]
- Amir Radwat. Testing the Performance of NGINX and NGINX PlusWeb Servers. Available online: https://www.nginx.com/blog/testing-the-performance-of-nginx-and-nginx-plus-web-servers/ (accessed on 10 February 2022).
- DeviceHive Homepage. Available online: https://devicehive.com (accessed on 26 April 2022).
- Krzywaniak, A.; Czarnul, P.; Proficz, J. Extended investigation of performance-energy trade-offs under power capping in HPC environments. In Proceedings of the 17th International Conference on High Performance Computing & Simulation, HPCS 2019, Dublin, Ireland, 15–19 July 2019; pp. 440–447. [Google Scholar] [CrossRef]
Figure 1.
Testbed application model.

Figure 2.
Number of successfully processed requests—bare-metal.

Figure 3.
Number of successfully processed requests—container.

Figure 4.
Processing time of request-response process from client side—bare-metal, bars denote medians and whiskers Q1 and Q3 quartiles.
Figure 4.
Processing time of request-response process from client side—bare-metal, bars denote medians and whiskers Q1 and Q3 quartiles.

Figure 5.
Processing time of request-response process from client side—container, bars denote medians and whiskers Q1 and Q3 quartiles.
Figure 5.
Processing time of request-response process from client side—container, bars denote medians and whiskers Q1 and Q3 quartiles.

Figure 6.
Difference of successfully processed requests—bare-metal and container.

Figure 7.
Difference in processing times on server side .

Figure 8.
Difference in processing time on client side .

Figure 9.
Testbed architecture.

Figure 10.
Number of successfully processed requests.

Figure 11.
Number of successfully processed requests.

Figure 12.
Percentage of error responses from middleware server.

Figure 13.
Mean value of processing time request-response (client side).

Figure 14.
Median value of processing time request-response (client side).


Table 1.
Comparison of performance at optimal load point and memory usage.
| Configuration | Number of Successfully Processed Messages | RAM Usage at Start of Test |
|---|---|---|
| 1 node 20 cores without load balancer | 916,281 | 6.49% |
| 1 node 20 cores with load balancer | 923,957 | 6.49% |
| 2 nodes 10 cores with load balancer | 1,143,067 | 12.83% |
| 5 nodes 4 cores with load balancer | 1,221,302 | 27.01% |
| 7 nodes 3 cores with load balancer | 1,086,165 | 36.55% |
Table 2.
Percentage difference at optimal load point.
| Configuration | Percentage Difference of Successfully Processed Messages to Best Setup |
|---|---|
| 1 node 20 cores without load balancer | −24.98% |
| 1 node 20 cores with load balancer | −24.35% |
| 2 nodes 10 cores with load balancer | −6.41% |
| 7 nodes 3 cores with load balancer | −11.06% |
Publisher’s Note: MDPI stays neutral with regard to jurisdictional claims in published maps and institutional affiliations. |
© 2022 by the authors. Licensee MDPI, Basel, Switzerland. This article is an open access article distributed under the terms and conditions of the Creative Commons Attribution (CC BY) license (https://creativecommons.org/licenses/by/4.0/).
Share and Cite
MDPI and ACS Style
Kałaska, R.; Czarnul, P. Investigation of Performance and Configuration of a Selected IoT System—Middleware Deployment Benchmarking and Recommendations. Appl. Sci. 2022, 12, 5212. https://0-doi-org.brum.beds.ac.uk/10.3390/app12105212
AMA Style
Kałaska R, Czarnul P. Investigation of Performance and Configuration of a Selected IoT System—Middleware Deployment Benchmarking and Recommendations. Applied Sciences. 2022; 12(10):5212. https://0-doi-org.brum.beds.ac.uk/10.3390/app12105212
Chicago/Turabian StyleKałaska, Robert, and Paweł Czarnul. 2022. "Investigation of Performance and Configuration of a Selected IoT System—Middleware Deployment Benchmarking and Recommendations" Applied Sciences 12, no. 10: 5212. https://0-doi-org.brum.beds.ac.uk/10.3390/app12105212
Note that from the first issue of 2016, this journal uses article numbers instead of page numbers. See further details here.