Article

Interaction Effect of Room Size and Opening on Trombe Wall Performance in Sichuan–Tibet Alpine Valley Areas

College of Architecture and Urban-Rural Planning, Dujiangyan Campus, Sichuan Agricultural University, Dujiangyan 611830, China
*
Author to whom correspondence should be addressed.
Submission received: 17 April 2022 / Revised: 19 May 2022 / Accepted: 20 May 2022 / Published: 23 May 2022
(This article belongs to the Topic Sustainable Building Structures)

Abstract

:
The Trombe wall (T-wall) system is one of the most effective systems for passive solar energy utilization technology, which is of great significance for the alleviation of the energy crisis and the protection of the environment. Taking as an example Tibetan dwellings in the Sichuan–Tibet alpine valley which have installed T-walls for heating, the effects of the length of the room (Factor A), the width of the room (Factor B), the width of the opening on the north wall of the room (Factor C), and the distance from the lower edge of the opening to the floor (Factor D) on the indoor air temperature and room energy consumption are studied by orthogonal experiment and numerical simulation. Results show that the four factors all have a significant effect on the two analysis indicators. The rankings of the factors are consistent for their impact on the two analysis indicators, as, in both cases, Factor A > Factor B > Factor C > Factor D. Therefore, the influence of room configuration cannot be ignored in the optimization of T-wall design. Additionally, the optimal parameter combination for the highest indoor temperature and low energy consumption in winter is also proposed. This research can further improve the study of T-walls, and provide a reference for the thermal environment design of buildings.

1. Introduction

Building energy consumption accounts for almost 1/3 of the total energy consumption for heating in winter and cooling in summer, leading to excessive use of fossil fuels and severe environmental pollution [1]. As a clean and renewable energy source, solar energy has been utilized in building air conditioning and refrigeration systems to alleviate energy and environmental problems. The Trombe wall (T-wall) system is one of the most effective passive solar energy utilization technology systems. It relies solely on passive solar energy collection to provide energy for buildings’ heating, cooling, and ventilation. This system can reduce the energy consumption of traditional buildings while improving indoor thermal comfort. The first T-wall, installed by architect Jacques Michel in Odeillo, France, in 1967, was named after engineer Felix Trombe. In the last half-century, many scholars have conducted theoretical and practical research on it.
The T-wall system is popular due to its unique characteristics, which include environmental protection and energy-saving capacities, low maintenance requirements, a simple geometric layout, easy installation, and zero operating costs [
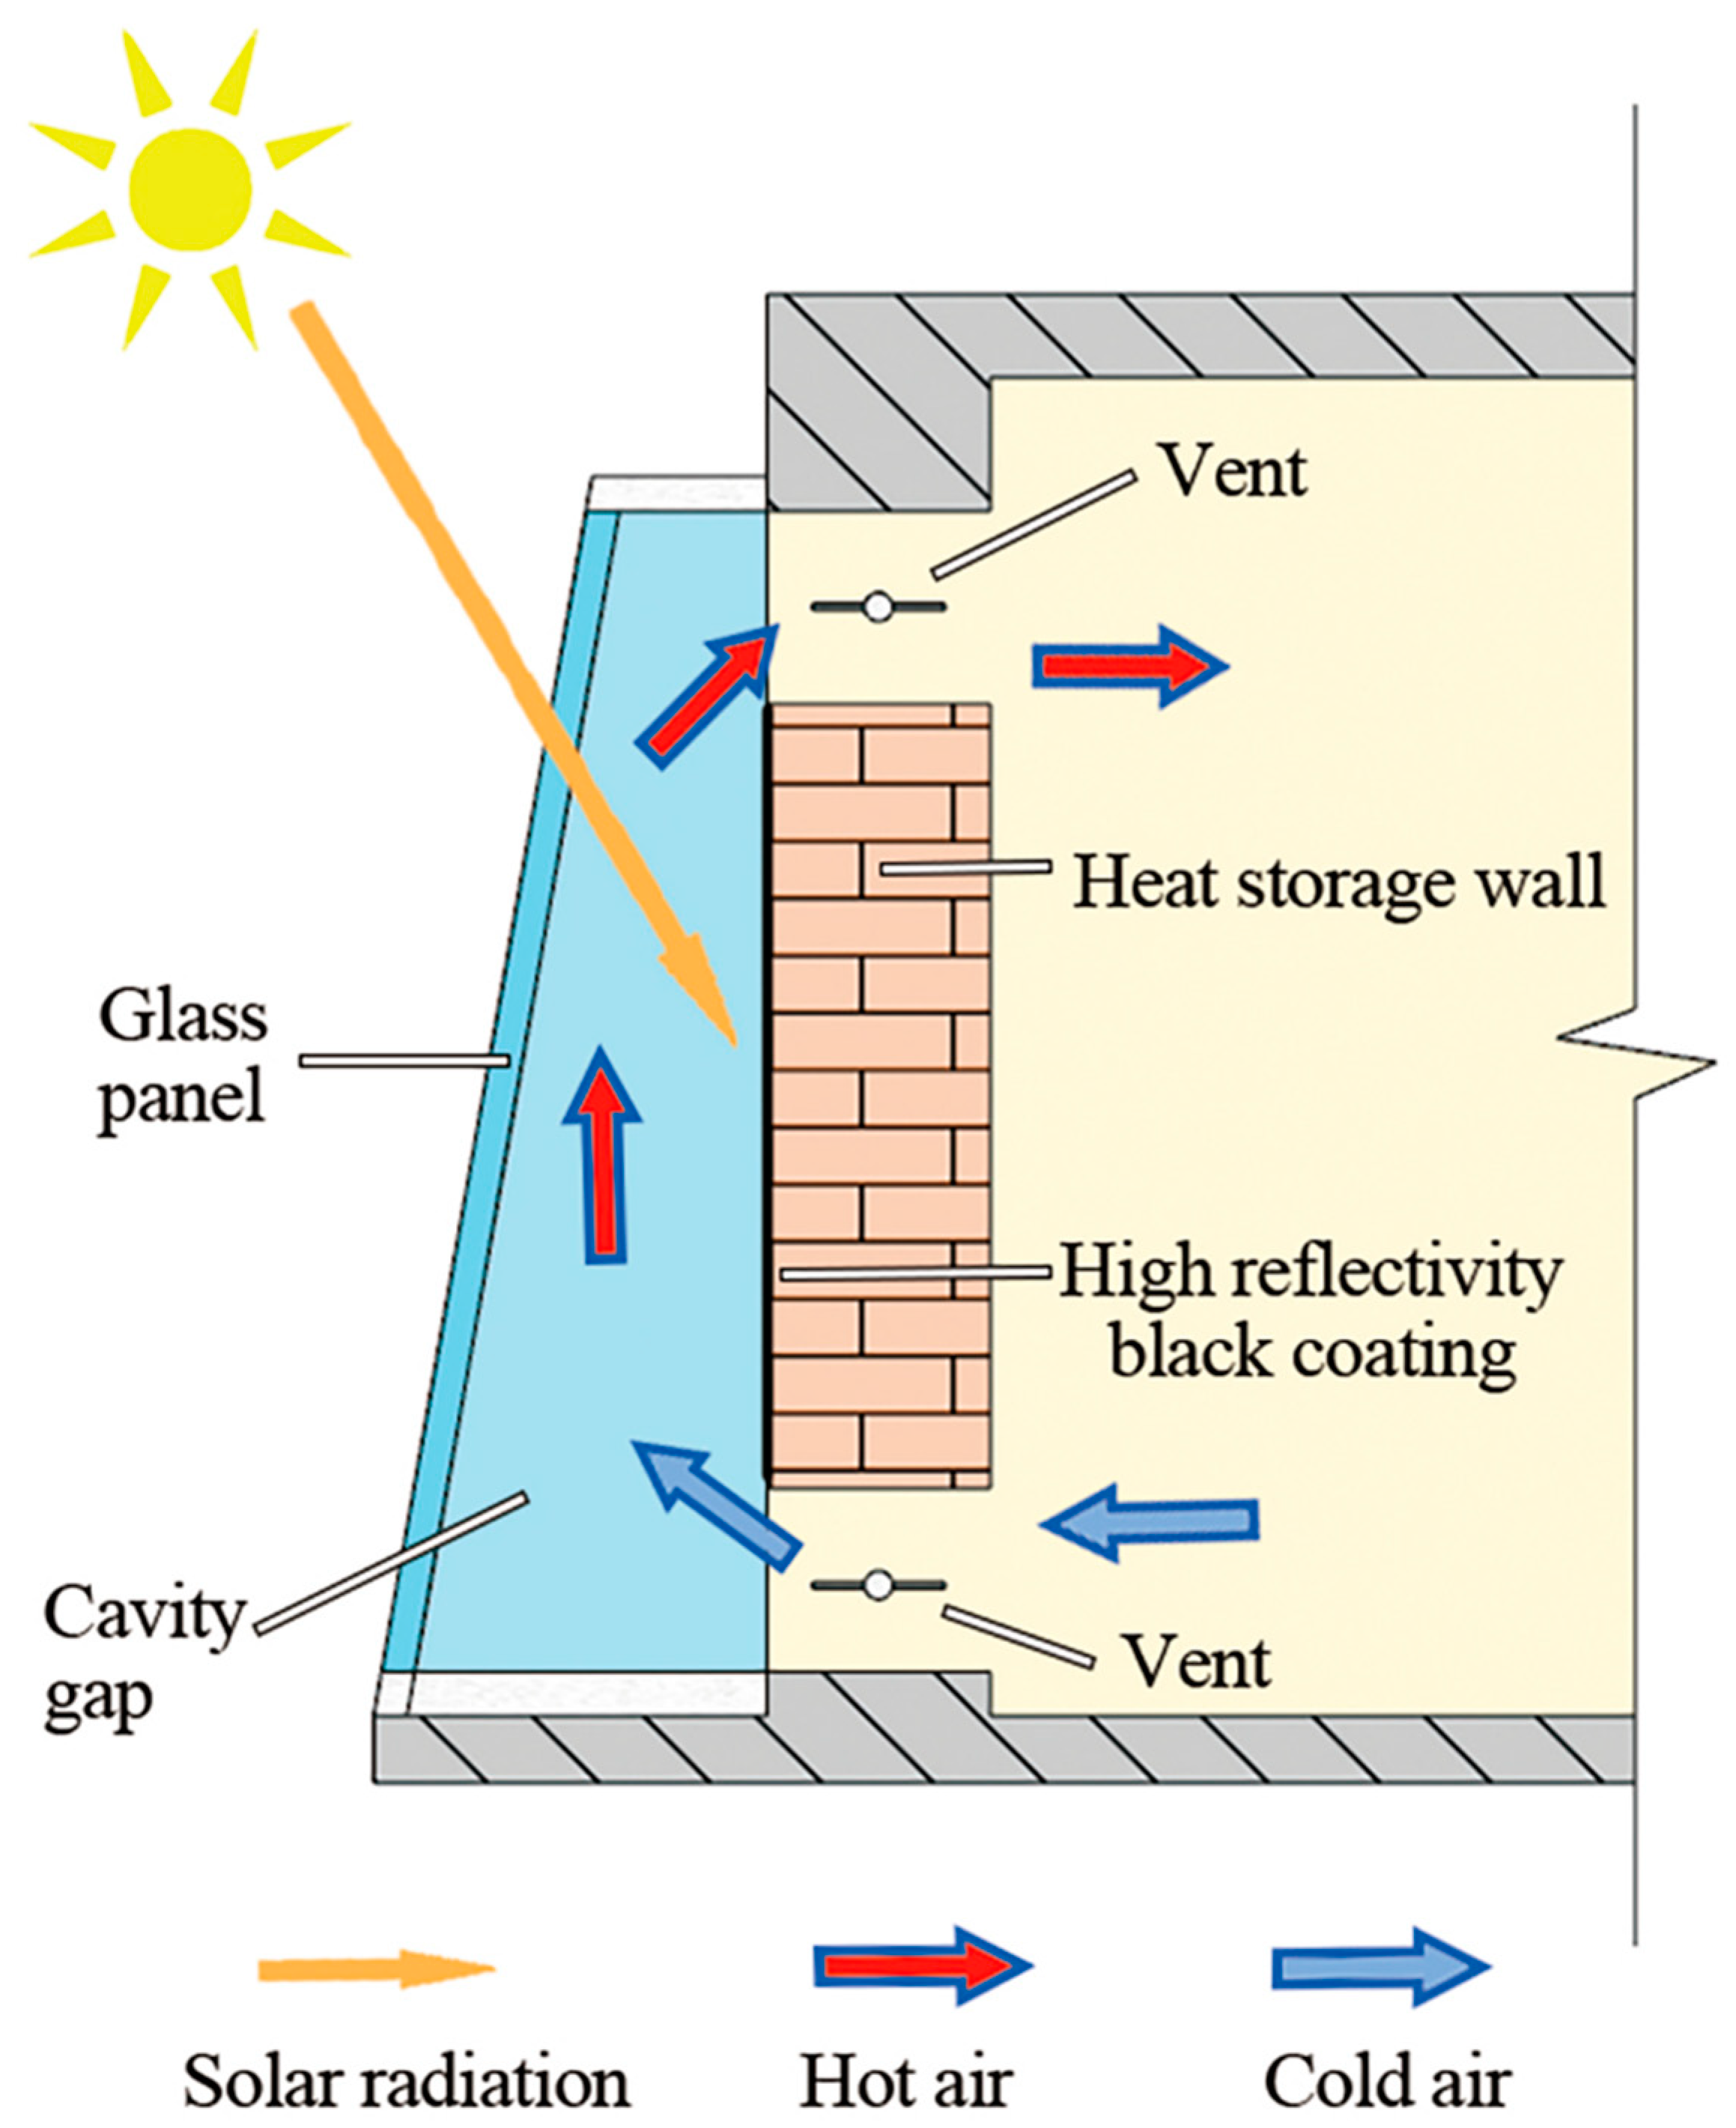
2]. The classic T-wall consists of a glass panel, a cavity gap, and a thick heat storage wall with a black coating on the outer surface [3]. Vents are placed at the top and bottom of the thick wall, connecting the indoor environment to the T-wall cavity gap [3]. As shown in Figure 1, solar radiant heat heats the air in the cavity gap between the glass panel and the heat storage wall, and the uneven rise of air temperature leads to a density change in the upper and lower parts, which makes natural convection movement under the action of buoyancy [4]. During the day in winter, cold air enters the cavity gap from the bottom vent and returns from the top vent after being heated, which gradually increases the indoor temperature, and the thermal convection cycle finally reaches a stable state at a specific moment. At night, the heat storage wall slowly releases the heat stored during the day through natural convection and heat conduction [5].
The improvement effect of the T-wall on the indoor environment has been confirmed in many previous studies. Letan et al. [6] found that even when solar radiation was low, the T-wall structure could still achieve ventilation in summer and heating in winter. The studies of Rabani et al. [7] and Hernandez-Lopez et al. [8] showed that a T-wall could raise the room’s temperature and keep the room comfortable in a cold climate. Zhou et al. [9] found that T-walls can effectively enhance the natural ventilation of two-story buildings to reduce the indoor temperature and thus improve thermal comfort. In addition to the functions of heating, cooling, and ventilation, other emerging functions of T-walls are also gradually being explored. Yu et al. [10,11,12,13,14,15] conducted a large number of studies on T-walls based on the geographical and climatic conditions in Hefei in recent years; three new types of hybrid T-wall, based on classic T-walls, were proposed, including photocatalytic (PV) Trombe walls, thermal catalytic (TC) Trombe walls, and photocatalytic and thermal catalytic (PV-TC) Trombe walls. These composite walls can be used for space heating, air purification and sterilization, and energy saving.
Since a T-wall is a passive technology, its contribution to reducing energy consumption is also a research focus. Yilmaz et al. [16] found that applying this indirect passive solar energy gain system has a significant energy-saving effect, and will bring tremendous energy and economic benefits to Turkey. Using a TRNSYS simulation, Chel et al. [17] found that a T-wall could save 3312 kW·h of energy and reduce emissions by about 33 tons of CO2 every year. Abbassi et al. [18] studied the performance of several T-wall structures in Lyon, France, and found that buildings using T-walls ultimately saved about 20% of the energy used in the heating process each year.
The study of T-walls has been accompanied by the optimization of T-wall design. Most scholars mainly focus on the optimization of the structural parameters of T-walls. A T-wall is primarily driven by thermal buoyancy in the cavity, so the cavity gap of T-walls plays a crucial role. Duan et al. [19], Hong et al. [20], Zhang et al. [21], and Dragićević et al. [22] have all studied the cavity depth of T-walls. T-wall inlets have also been investigated in many studies. The research of Hong et al. [20] and Zhang et al. [21] concerns T-wall inlet and outlet areas. Liu et al. [23] analyzed the opening and closing of T-wall vents and determined the optimal opening and closing times of vents. The experimental study of Ryan et al. [4] showed that, for T-wall or thermosyphon air heating collectors, the height of the chimney should be maximized to maximize thermal efficiency. In addition, the material and thickness of the heat storage wall [21,24], the absorptivity and emissivity of the coating [25], and the Trombe wall-to-wall ratio [21,26,27] have been considered by some scholars as factors that influence the performance of T-walls.
A T-wall is a subsidiary structure of a building. If it is only its structural parameters that are optimized, the T-wall may not be able to achieve the optimal application effect. Studies into how the external environment affects a T-wall’s performance have been carried out by some scholars in the existing research, but these factors only involved solar radiation intensity [19,22,28] and external ambient temperature [29,30]. The influences of room configuration (e.g., room width and length) on the performance of T-walls have rarely been studied. The working principle of the T-wall is similar to that of the solar chimney. Studies on solar chimneys have confirmed that ignoring room structure may lead performance to be over-predicted, and a room coefficient was proposed to address these effects [31,32]. In the subsequent study of Shi et al., the interaction effect of room openings and air inlets on solar chimney performance was analyzed, and the best combination of air inlet and window heights for the typical solar chimney was provided [33].
With the rapid development of computer technology, its function is also very powerful. All kinds of industries are using artificial intelligence, algorithms, and so on, to solve problems that needed to be solved by tedious methods in the past, and there are also many scholars [34,35,36,37] using algorithms and neural networks to predict the heating and cooling loads of residential buildings.
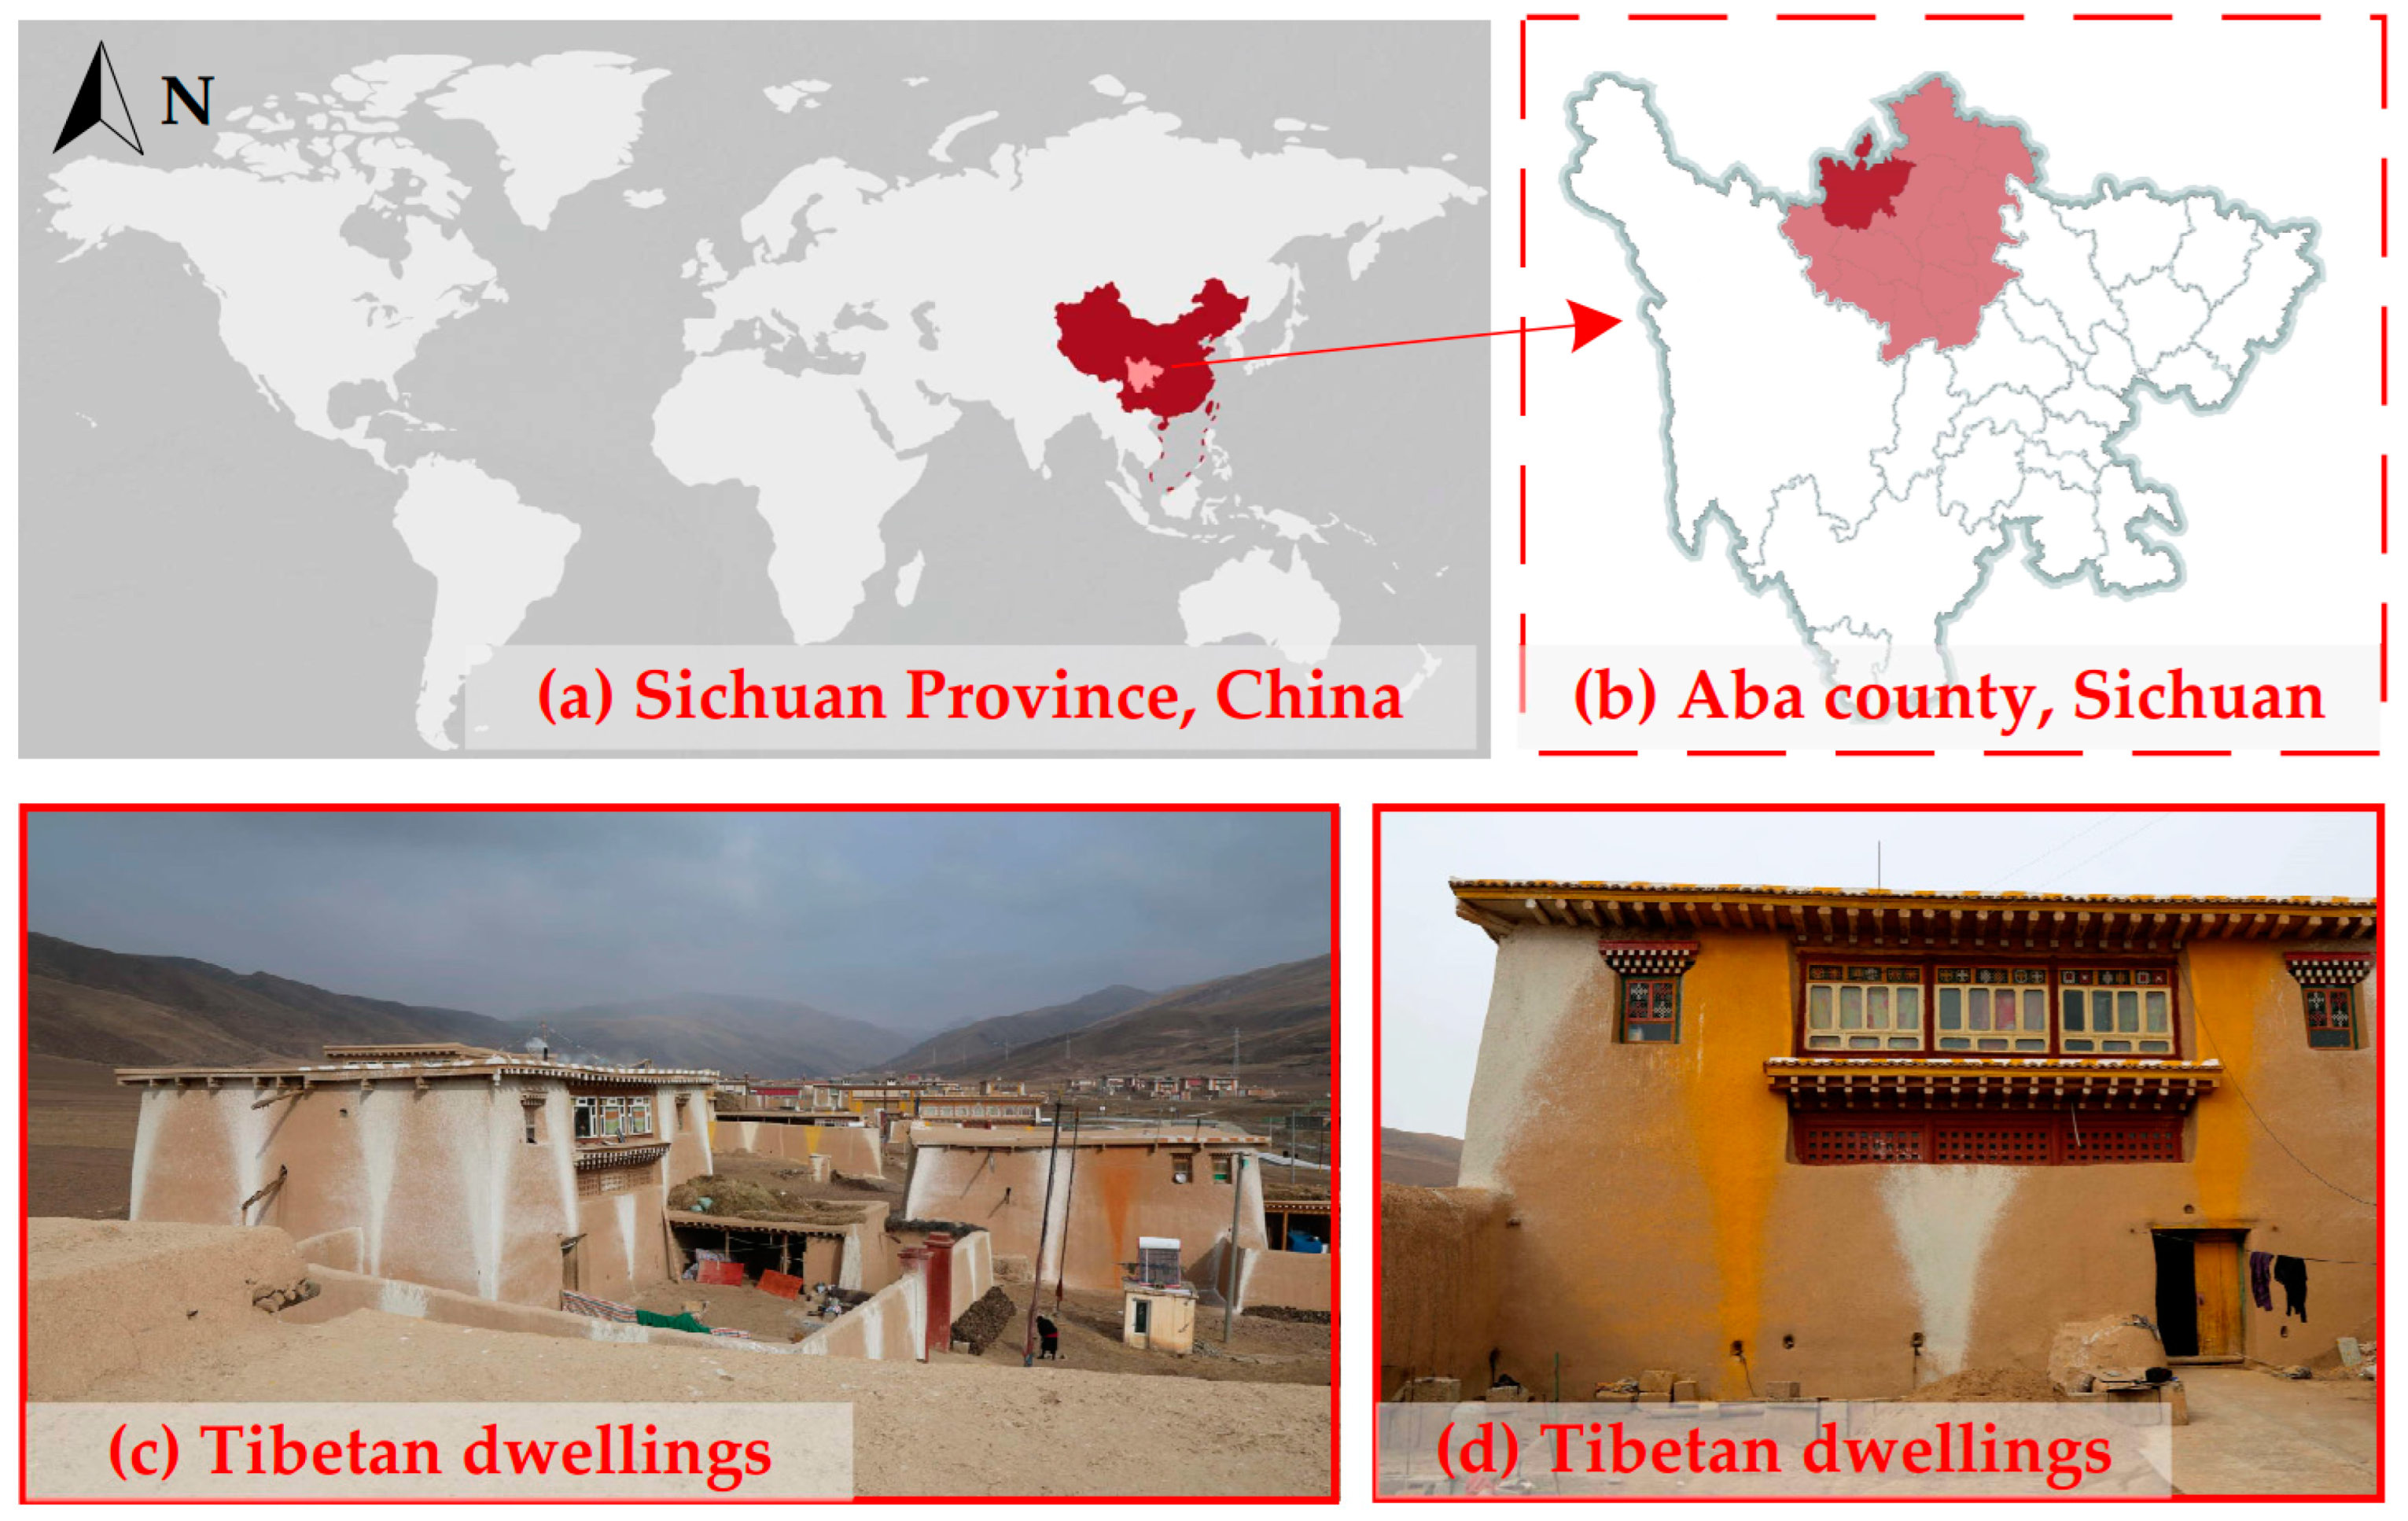
The application of T-walls on Tibetan dwellings in Sichuan–Tibet alpine valley areas was researched by our team [
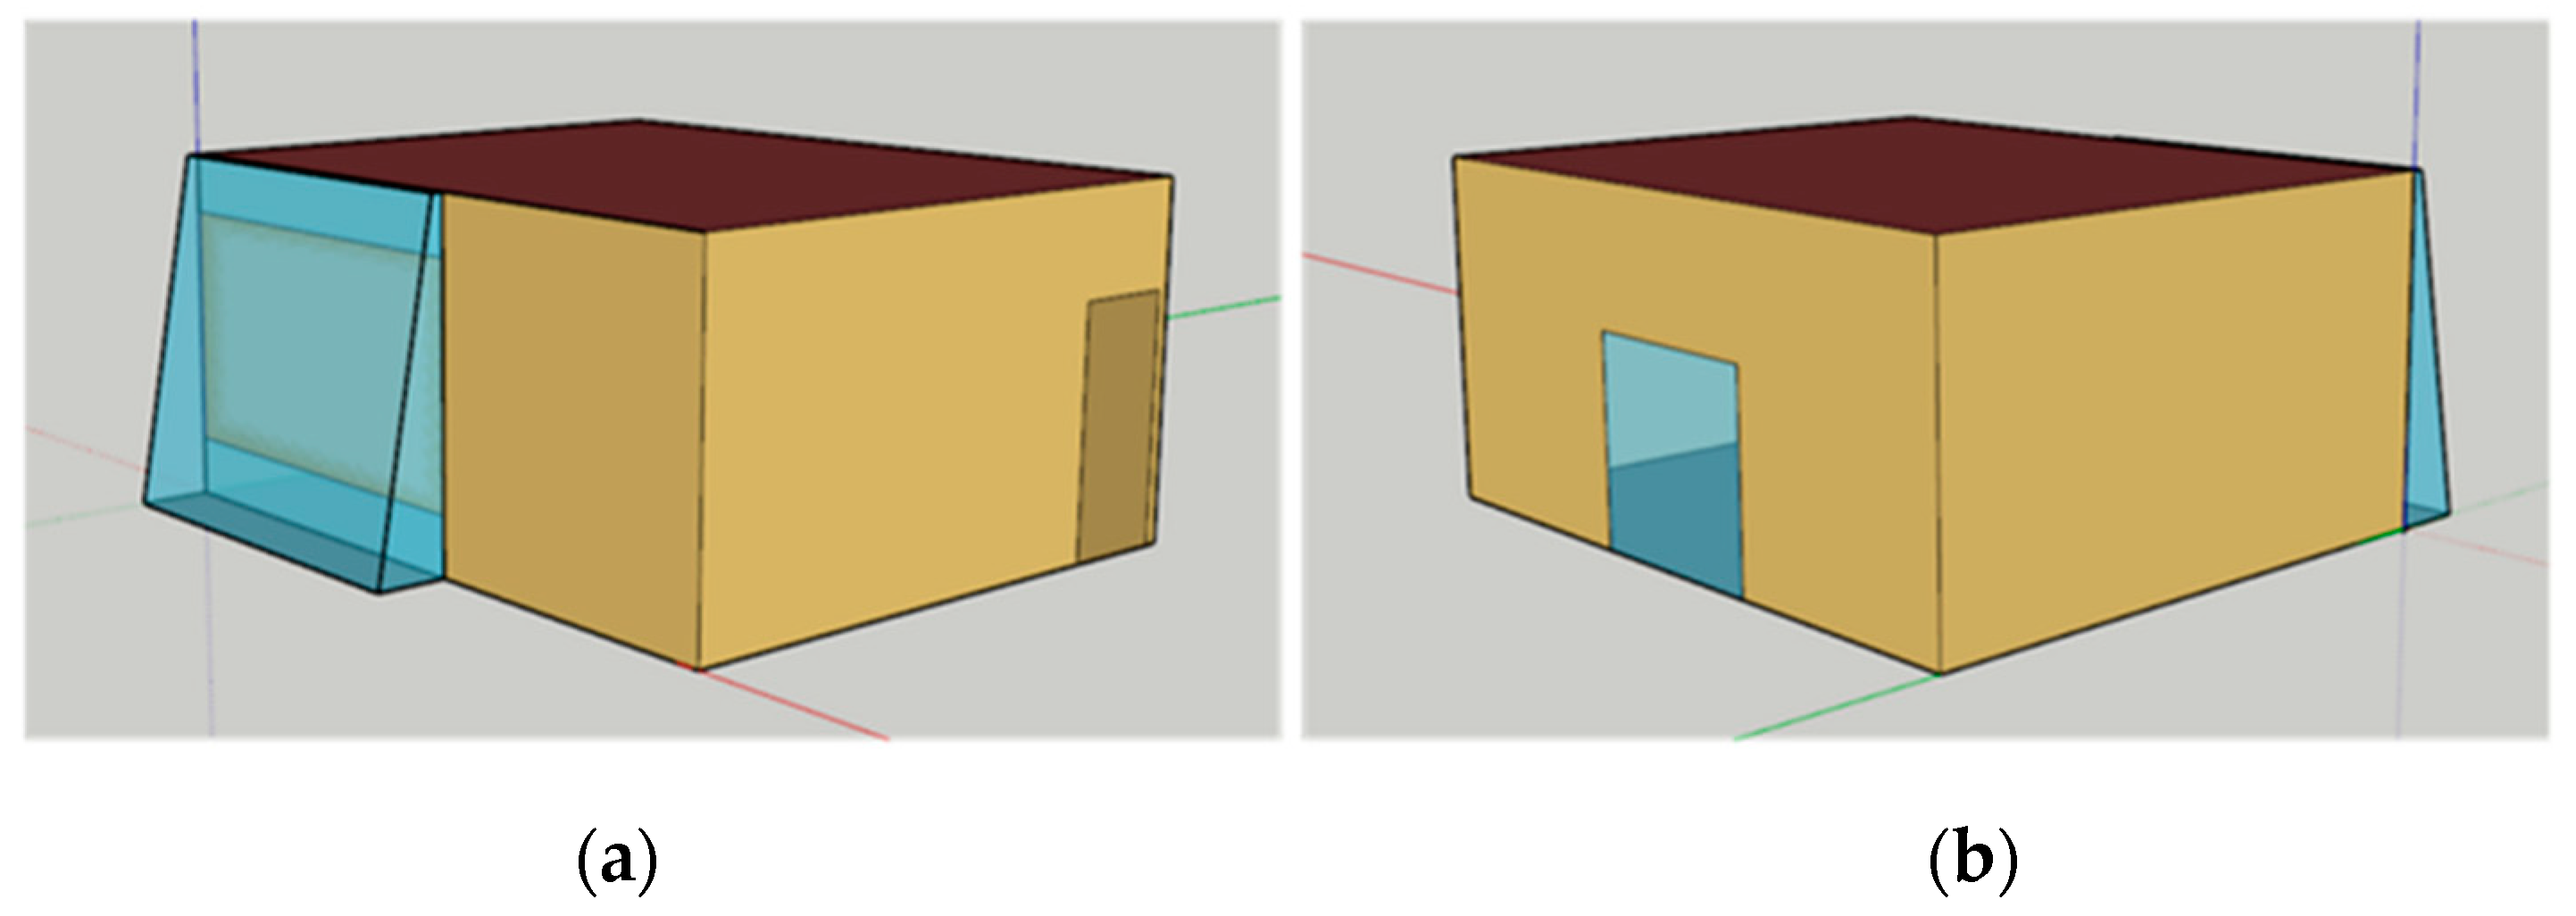
21]. In our previous study, six key influencing factors of T-walls were analyzed, including the south T-wall-to-wall ratio, inlet/outlet height, the glazing inclination angle, storage wall thickness, storage wall material, and the cavity gap. The optimal combination of T-wall structural parameters in this area was determined. However, the factors in the study were all structural parameters of the T-wall itself. Based on previous studies, the influencing factors chosen in this study are no longer the T-wall’s own structural parameters, but the parameters of the room and its openings.
This study aims to:
  • Further study the application of T-walls to traditional Tibetan dwellings in Sichuan–Tibet alpine valley areas to find out the impact of room configuration on the performance of T-walls, and rank the degree of influence of these factors.
  • Find out the optimal room configuration for the best T-wall performance in this area to improve the optimal design of T-walls.

2. Methods

2.1. Physical Model

Most areas of the Sichuan–Tibet alpine valley have harsh climate conditions, with no extreme heat in summer and extreme cold in winter. The research site is located in Aba County, Sichuan Province, China. Figure 2 shows the geographical location and architectural style of the buildings studied in this research. The annual dry-bulb temperature of Aba is shown in Figure 3. The hottest month is July, which has an average temperature, while the coldest is January, and all the monthly average dry-bulb temperatures are less than 15 °C. The main function of T-walls applied in Traditional Tibetan dwellings is to heat the indoor air and create a comfortable indoor thermal environment by passive means. To simplify the research, and taking into consideration the frequency of room use, a single room in traditional Tibetan dwellings—the living room—is chosen as the research object. The research site is rich in solar energy resources (seen in Figure 4). Because Aba is located in the northern hemisphere, the living room frequently used during the day faces a southern direction. The T-wall is installed on the south wall of the living room, and its height is the same as the floor height, which is 3 m. The construction, materials, and dimensions of the T-wall in this research are based on the previous research conclusions concerning T-walls; see Table 1 [21].
An OpenStudio plug-in based on SketchUp modeling software is used to build the numerical model. The 3D geometric model drawn in SketchUp is shown in Figure 5. At this time, the room and T-wall are divided into two thermal zones. The floor height of the room is fixed at 3 m, and there is a 0.9 m wide × 2.1 m high wooden door on the east wall of the room [21]. Other aspects of room configuration (e.g., the length and width of the room, the size of the opening on the north wall of the room depending on the design) are all factors of this research. The physical parameters of the room structure are shown in Table 2.

2.2. Orthogonal Experimental Design

This research involves a combination of multiple factors and multiple levels. Four influencing factors are selected, and each factor contains five levels. If comprehensive work were carried out, 625 (54 = 625) simulations with 625 models would be generated, which would be a massive amount of work. Therefore, to find an efficient and convenient research method, the orthogonal experimental design method is chosen. The basic tool for orthogonal experimental design is the orthogonal table. The experimenter can identify the relevant orthogonal table according to the requirements of the number of factors, the level of factors, and whether there is an interaction between factors, and then carry out the experiment relying on the experimental scheme designed by the orthogonal table [40]. Finally, range analysis and analysis of variance (ANOVA) are conducted to find out the influence of each factor on the indicator and the optimal level of each factor, and the optimal scheme to achieve the aims of the research. Analysis of variance (abbreviated as ANOVA), also known as an “F-test”, was invented by R. A. Fisher, and is used to test the significance of the difference in the means of two or more samples. Significance level is a concept in hypothesis testing, which refers to the probability or risk that people reject the original hypothesis when it is correct. It is recognized as the probability value of small probability events, which must be determined before each statistical test, usually α = 0.05 or α = 0.01. Range analysis adopts simple and intuitive calculation, and the complex ANOVA calculation steps are as follows:
S S T = j = 1 n S S j + S S e
S S j = 1 r i = 1 m K i j 2 C
C = T 2 n
d f j = r 1
M S j = S S j d f j
F = M S j M S e
R 2 = 1 S S e S S T
where SST is the sum of squares of the total deviation; SSj is the sum of deviation squares of factors in the column j; SSe is the sum of deviation squares of errors; Kij is the sum of the test indexes corresponding to the factor i level in the column j; r is the number of levels corresponding to the factors in the column j; m is the number of columns of the orthogonal table; C is the number of corrections. T is the sum of the test indicators of all combinations; n is the number of tests; dfj is the degree of freedom; F is the variance ratio; MSj is the mean square error; MSe is the mean square error of error. R2 is the goodness of fit.
As shown in Figure 6, four influencing factors are selected as independent variables, which are the length of the room (Factor A), the width of the room (Factor B), the width of the opening on the north wall of the room (Factor C), and the distance from the lower edge of the opening to the floor (Factor D). After determining the influencing factors, according to the field investigations, five levels are selected for each factor. This research is a study of 4 factors and 5 levels. The values corresponding to each level of each factor are shown in Table 3. According to the requirements of orthogonal experimental design, the orthogonal Table L 25 ( 5 6 ) is selected in this research. There are 25 schemes, and each row of the orthogonal Table represents one combination of room and opening parameters.

2.3. Numerical Simulation Based on EnergyPlus

EnergyPlus can conduct comprehensive energy consumption simulation analysis and economic analysis of buildings’ heating, cooling, lighting, ventilation, and other energy consumption [41]. The potential of using EnergyPlus software to simulate a T-wall’s performance has been confirmed in previous studies both by our team and by many other scholars [21,41]. In the present study, EnergyPlus software is used to simulate a single room’s indoor temperature and energy consumption in Tibetan dwellings with a T-wall installed, under 25 different room and opening parameters. When simulating indoor air temperature, the building is in a state of natural ventilation. In the simulation of building energy consumption, the EnergyPlus “IdealLoadSystem” is considered. Other settings in the numerical simulation are shown in Table 4. The weather data for simulation operations can be downloaded from the official website of EnergyPlus [41]. The authentic and authoritative data is derived from the China Standard Weather Document (CSWD). The simulated period is the coldest month, from 1 January to 31 January in Aba.

3. Results and Discussions

3.1. Analysis of Indoor Air Temperature

To study the influence of room and opening parameters on indoor air temperature, the inspection indicator of the orthogonal experiment is the indoor air temperature of each scheme. The 25 indoor air temperature average values are analyzed using ANOVA and range analysis to obtain both the degree of influence of each factor on indoor air temperature, and the optimal combination of the factors.

3.1.1. ANOVA of Indoor Air Temperature

ANOVA is used to study the relationships between the four factors and the average indoor air temperature. The ANOVA Table 5 is calculated using the numerical simulation results of Table 3 and the Formulas (1)~(7) in Section 2.2. As shown in Table 5, the R2 is 0.998, which means that these four factors can explain 99.8% of the variation of the average indoor air temperature. ANOVA is also known as the “F-test”; in statistics, the significance level used for ANOVA is usually 0.05 or 0.01. The degree of freedom of the factors is 4, and that of the error is 8. Looking up the F distribution table, when the significance level is 0.05, the F value is 3.84; when the significance level is 0.01, the F value is 7.01. If the variance ratio of a factor is greater than F0.01 (7.01), the probability of that factor affecting the test index is 99%, and the significance level of this factor is considered to be highly significant. If the variance ratio of a factor is between F0.05 (3.84) and F0.01 (7.01), the probability of this factor affecting the test index will decrease to 95%, and then the significance level of this factor is considered to be significant. If the variance ratio is less than F0.05 (3.84), the effect of this factor is not significant. As shown in Table 5, the F values of the four influencing factors are all much greater than 7.01. Therefore, the four influencing factors have a highly significant influence on indoor air temperature.

3.1.2. Range Analysis of Indoor Air Temperature

Range analysis is further used to find the relationship between the four influencing factors and indoor air temperature. Range analysis (see Table 6) is carried out using the numerical simulation results in Table 3. From the comparison of the R-values (range values) of the four factors, it can be seen that, among the four factors, factor A is the most important factor, and factor D has the least influence on indoor air temperature. The influence degree of the four factors on indoor air temperature is as follows: factor A > factor B > factor C > factor D. In this orthogonal experiment, the best level of each factor is the level that corresponds to the highest average indoor air temperature. As shown in Table 6, the level corresponding to the maximum K ¯ value of each factor is the optimal level of each factor. When factor A is at the fifth level, factors B, C, and D are all at the first level; that is, when the length of the room, the width of the room, the width of the opening on the north wall of the room, and the distance from the lower edge of the opening to the floor are 12,300 mm, 5100 mm, 1500 mm and 0 mm, respectively, the average indoor air temperature reaches its highest. The optimal combination for the room’s indoor air temperature, determined by range analysis, is A5B1C1D1. The scheme number of the combination A5B1C1D1 is set to S26.
The reasons why this is the optimal combination can be explained as follows. For the length of the room (Factor A), the longer the room length, the larger the area of the T-wall in the south wall, so the more air heated by the T-wall and the higher the room temperature. For the width of the room (Factor B), the longer the width, the longer the cold air path which enters the room through the opening on the north wall. Due to the mixing of cold air, the room temperature is lower. For the width of the opening on the north wall of the room (Factor C), the larger the width of the opening, the more cold air enters the room through the opening, and the lower the room temperature. For the distance from the lower edge of the opening to the floor (Factor D), according to the principle of different densities of cold and hot air, the hot air heated by T-wall will gather on the ceiling after entering the room. Over time, the hot air will slowly fill the room. If the opening on the north wall is closer to the ceiling, the hot air will quickly flow out of the room, so the room will not be heated.

3.2. Analysis of Room Energy Consumption

This research aims to find out the influence of room and opening parameters on room energy consumption. However, in the 25 schemes, the sizes of the rooms are different. So, room energy consumption per square meter was finally chosen as the analysis indicator. The room energy consumption for each scheme is simulated by EnergyPlus. The room energy consumption per square meter of each experimental combination is calculated according to the area of the room. After that, the 25 results are analyzed using ANOVA and range analysis, and each factor’s influence degree on the energy consumption of the room and the optimal combination of factors are obtained.

3.2.1. ANOVA of Room Energy Consumption

As in Section 3.1.1, ANOVA is used to study the relationships between the four factors and room energy consumption. As shown in Table 7, the R2 is 0.996, which means that these four factors can explain 99.6% of the variation of the room energy consumption. The variance ratios of the four factors are all higher than F0.01 (7.01), indicating that the influence of all four factors on room energy consumption is highly significant.

3.2.2. Range Analysis of Room Energy Consumption

Through the range analysis of the energy consumption per square meter, shown in Table 8, and from the comparison of the R-value (range value) of the four factors, it can be seen that factor A is the most important factor, and factor D has the least influence on room energy consumption. The influence degree of the 4 factors on room energy consumption is as follows: factor A > factor B > factor C > factor D. The relative significance of the factors affecting room energy consumption is consistent with that of indoor air temperature. In this orthogonal experiment, the optimal level of each factor is the level of each factor that corresponds to the lowest energy consumption per square meter. As shown in Table 8, the level corresponding to the minimum K value of each factor is the optimal level of each factor. When factors A and B are at the fifth level, factors C and D are at the first level; that is, when the length of the room, the width of the room, the width of the opening on the north wall of the room, and the distance from the lower edge of the opening to the floor are 12,300 mm, 8700 mm, 1500 mm and 0 mm, respectively, the energy consumption per square meter reaches its lowest. The optimal combination for room energy consumption, determined by range analysis, is A5B5C1D1. The test number of the scheme A5B5C1D1 is set to S27.

3.3. Analysis of the Optimal Combination of Room Parameters

According to the results of the range analysis of indoor air temperature and room energy consumption in the above Section 3.1.2 and Section 3.2.2, the relationship curve (effect curve) between the four influencing factors and the analysis indicators is shown in Figure 7. The abscissa in the figure is the different levels of each factor, and the ordinate is the average indoor air temperature and the energy consumption per square meter of the room.
In this study, when the average indoor air temperature is the highest and the energy consumption per square meter of the room is the lowest, the level corresponding to each factor is the optimal level of the factor. As shown in Figure 7a, factor A is at the same level, which is the 5th level, simultaneously meeting the highest average temperature of the room and the lowest energy consumption per square meter of the room. From Figure 7c,d it can be seen that factors C and D are in the same situation as factor A. However, as the width of the room increases in Figure 7b, both analysis indicators decrease. The decrease in the average indoor air temperature is greater than the decrease in the room’s energy consumption per square meter. The level at which factor B satisfies the highest indoor air temperature is not the same as that at which it satisfies the lowest room energy consumption. Therefore, according to the analysis in Section 3.1 and Section 3.2, two new combinations of the two indicators are obtained when they are, respectively, optimal. The optimal combination of indoor air temperature is A5B1C1D1 (S26), and the optimal combination of room energy consumption is A5B5C1D1 (S27). Next, the two new combinations are modeled and simulated to analyze further the optimal combination of the room and opening parameters.
The boxplot of indoor air temperature in January of 27 schemes is shown in Figure 8. It can be seen from the figure that, of the Tibetan residential rooms with T-walls installed, the indoor air temperature in January ranges from 2.2 °C to 24.5 °C, and the average temperature is between 9.1 °C and 12.2 °C. No matter which scheme, the average indoor temperature is much higher than the average indoor temperature of the existing Tibetan dwelling test room (−0.94 °C) [21]. It can also be seen from the boxplot that the minimum, average, and maximum values of scheme S26, which is the optimal combination of indoor air temperature analyzed in Section 3.1, are higher than those of the other 26 schemes. This also verifies the conclusion obtained by ANOVA and range analysis, which is that the optimal scheme for indoor air temperature is scheme S26.
The histogram of room energy consumption per square meter in January of the 27 schemes is shown in Figure 9. In January, the rooms’ energy consumption per square meter ranged from 4.8 to 8.0 kW·h/m2, and scheme S2 has the highest energy consumption per square meter, which is 8.0 kW·h/m2. Scheme S27, which is the optimal combination of room energy consumption analyzed in Section 3.2, has the lowest energy consumption, at 4.8 kW·h/m2. It is worth noting that the room energy consumption per square meter in January of the optimal indoor air temperature combination S26 is 5.2 kW·h/m2, which is only 0.4 kW·h/m2 higher than S27, and 2.8 kW·h/m2 lower than the highest energy consumption combination S2 which is 8.0 kW·h/m2. However, the maximum indoor air temperature of S27 is much lower than that of S26, with a difference of 3.2 °C. Based on the above analysis, this study determines that the scheme S26 is the optimal combination. That is, the length of the room, the width of the room, the width of the opening on the north wall of the room, and the distance from the lower edge of the opening to the floor are, respectively, 12,300 mm, 5100 mm, 1500 mm and 0 mm (Figure 10). Under the corresponding room and opening parameters of this scheme, the room with a T-wall installed can have the highest indoor air temperature, while the room’s energy consumption per square meter is at a low level.

4. Conclusions

Through orthogonal experiments combined with numerical simulation, the effects of room and opening parameters on T-wall performance in Tibetan dwellings in Sichuan–Tibet alpine valley areas are studied. The research conclusions are as follows:
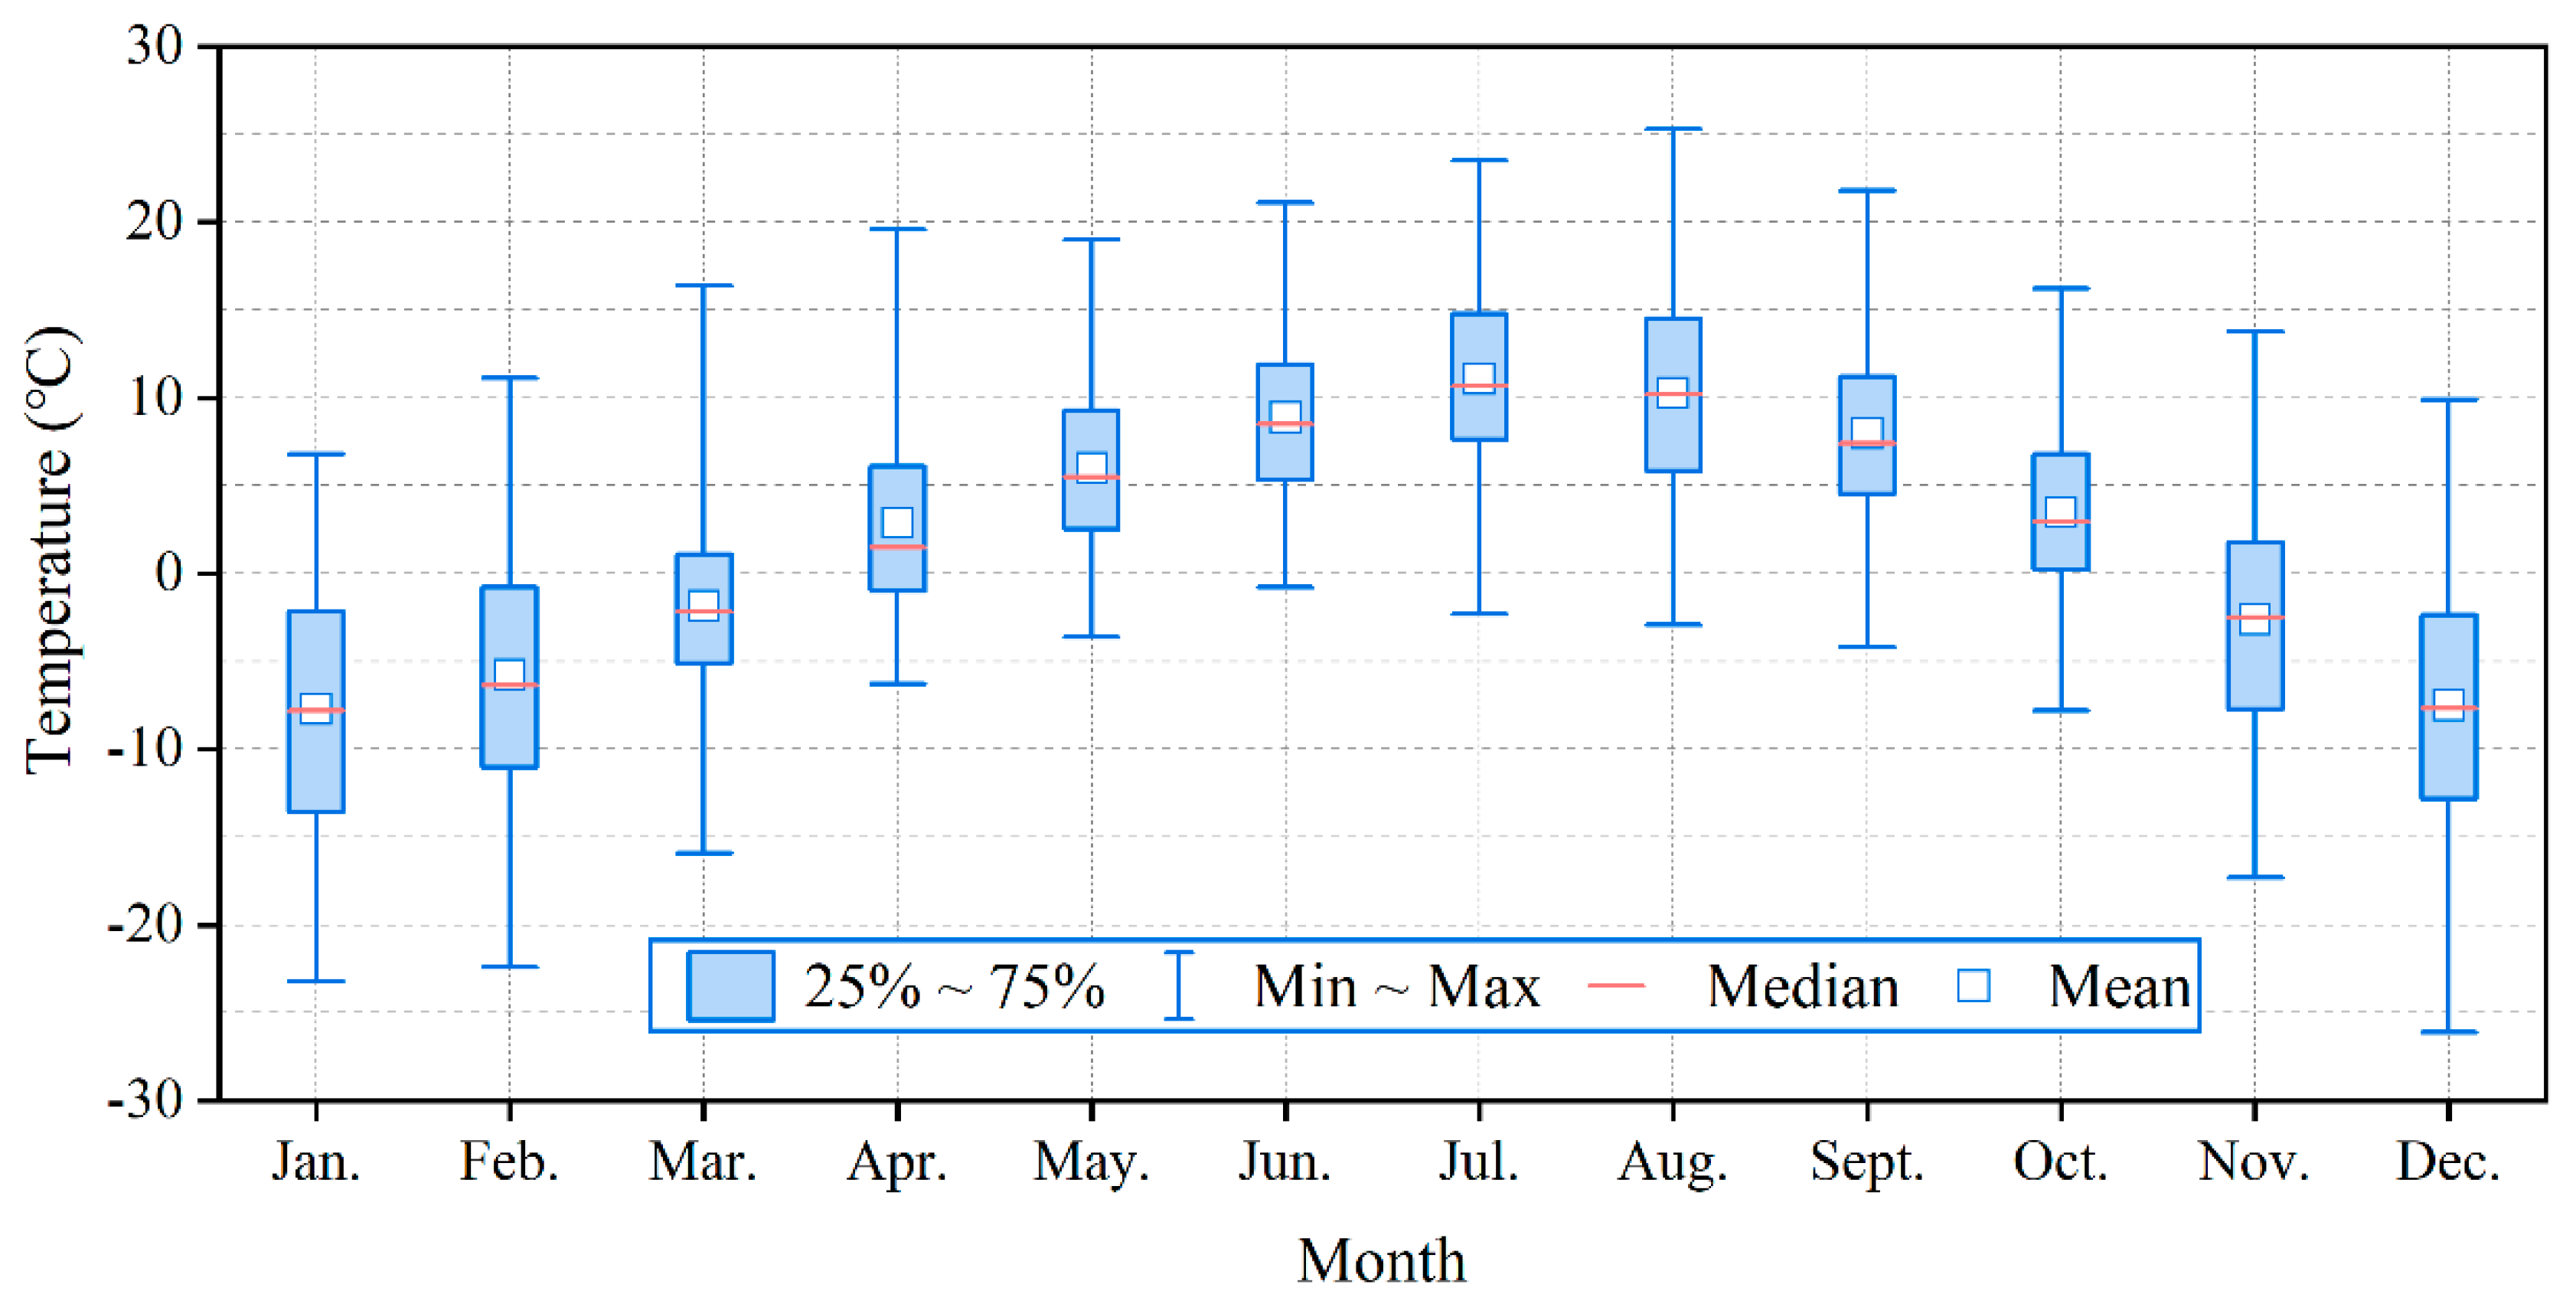
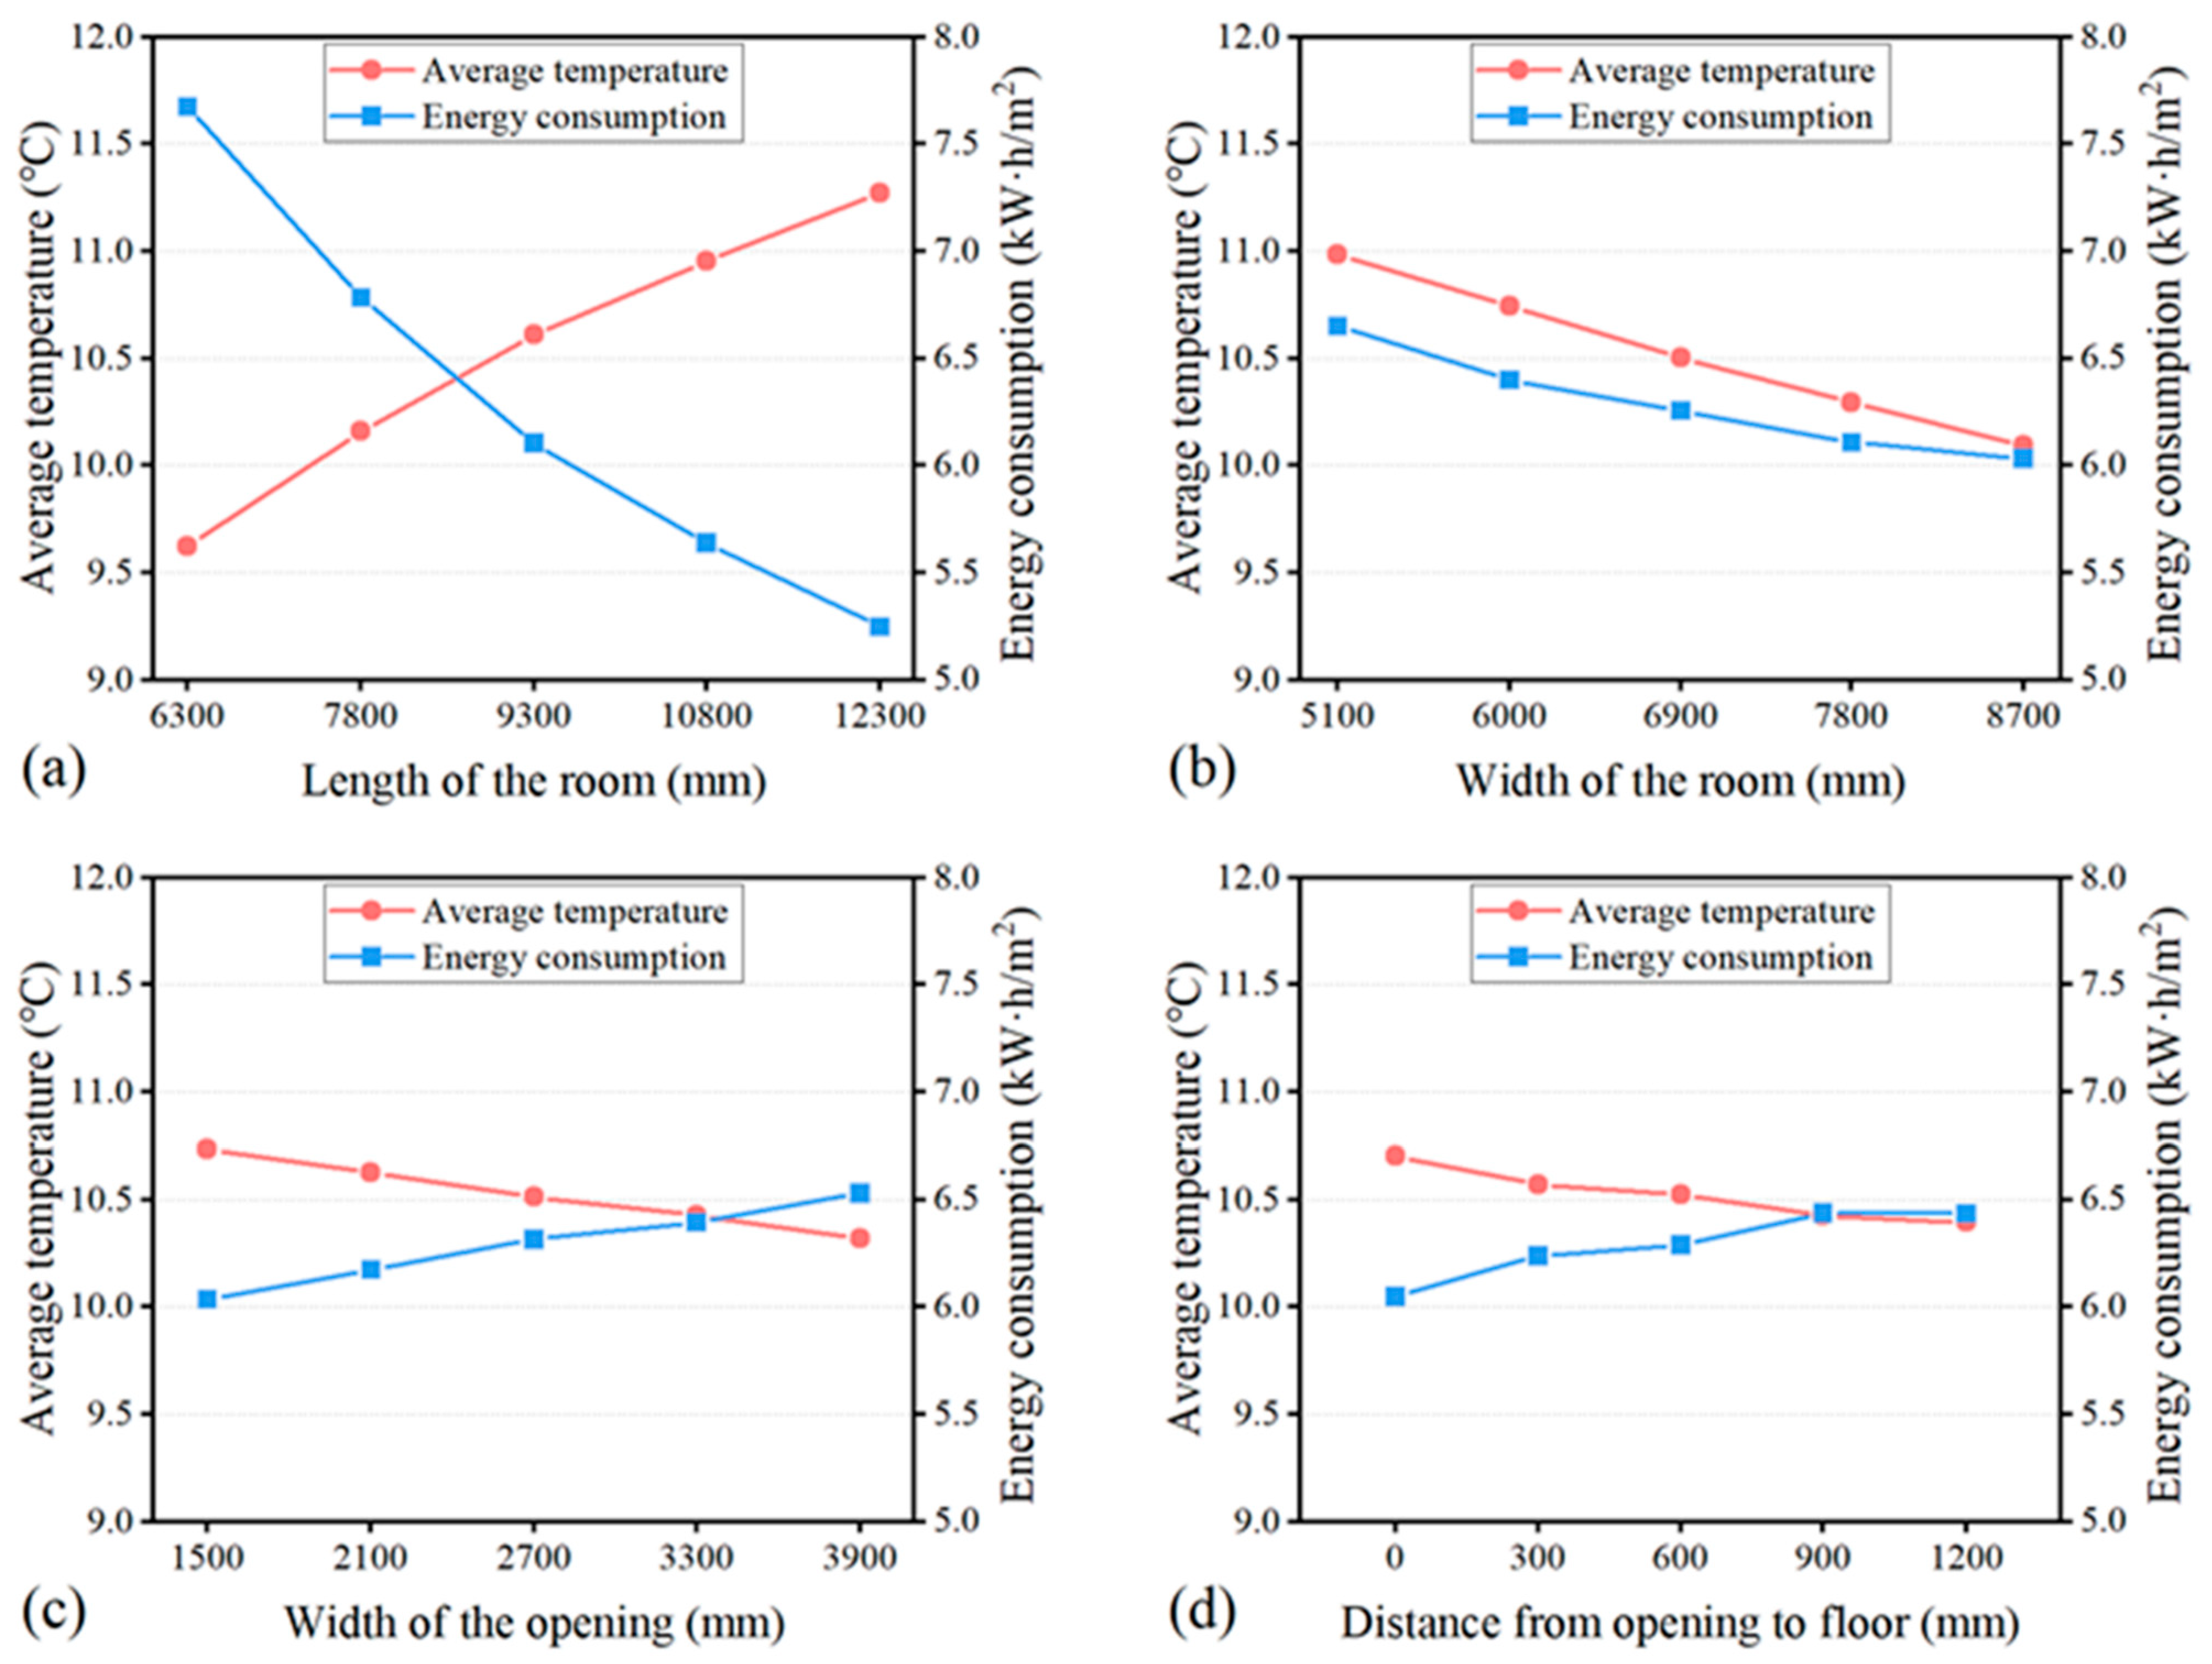
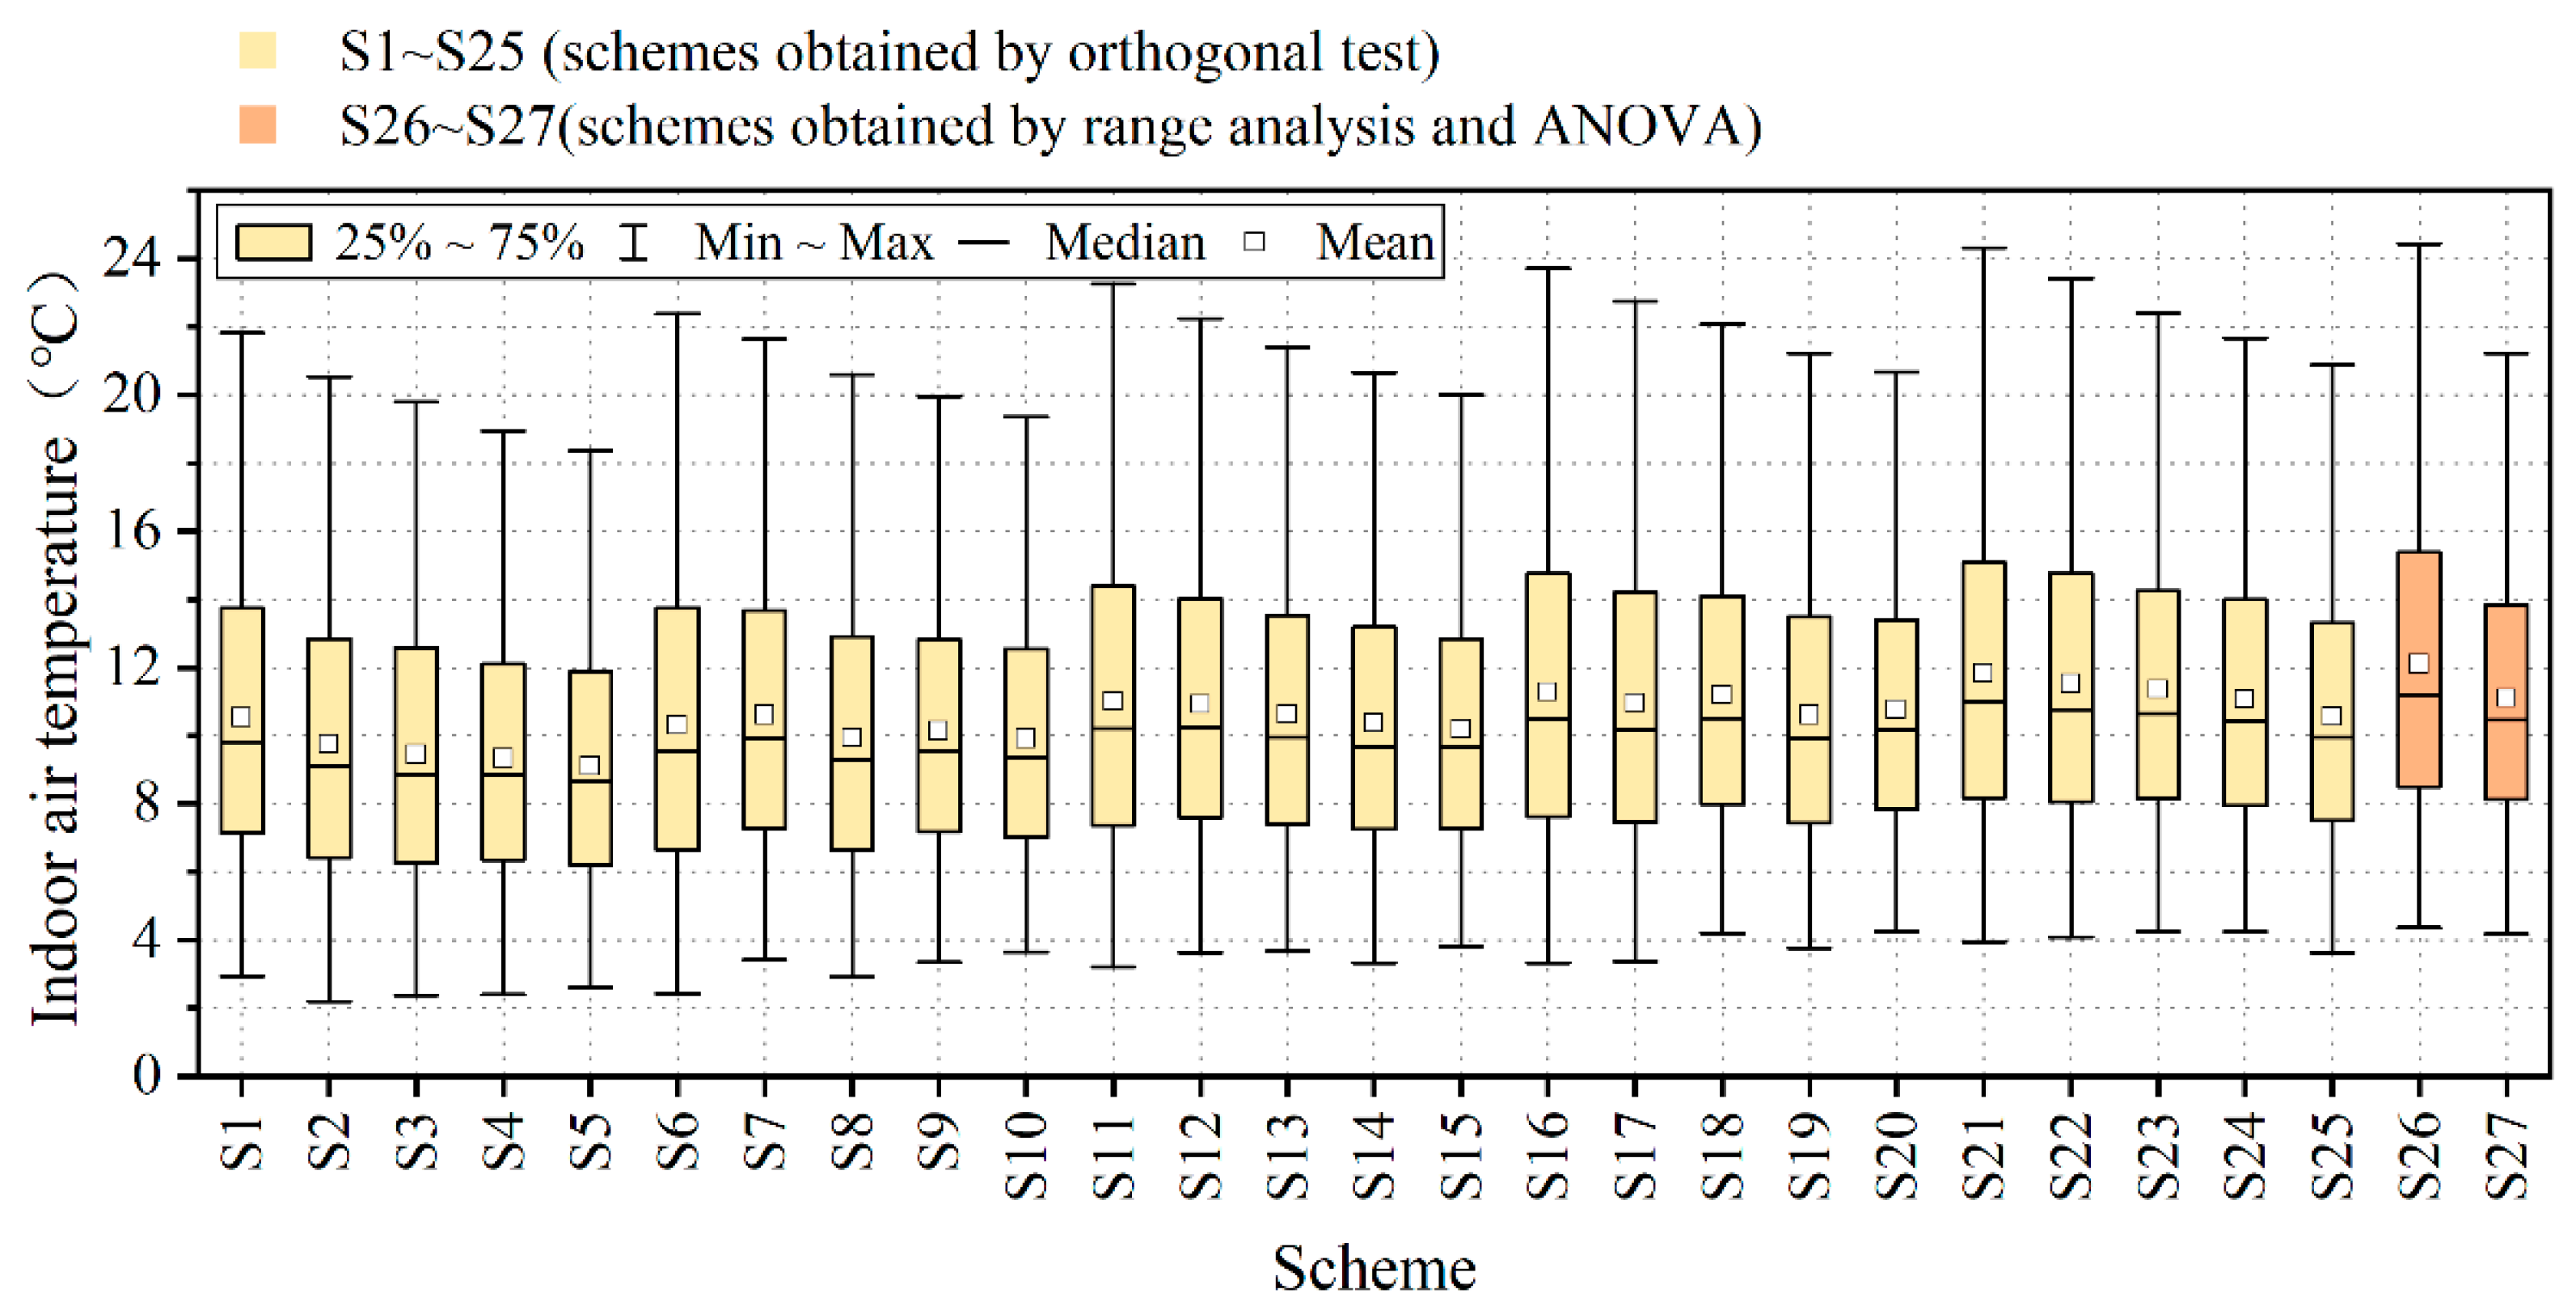
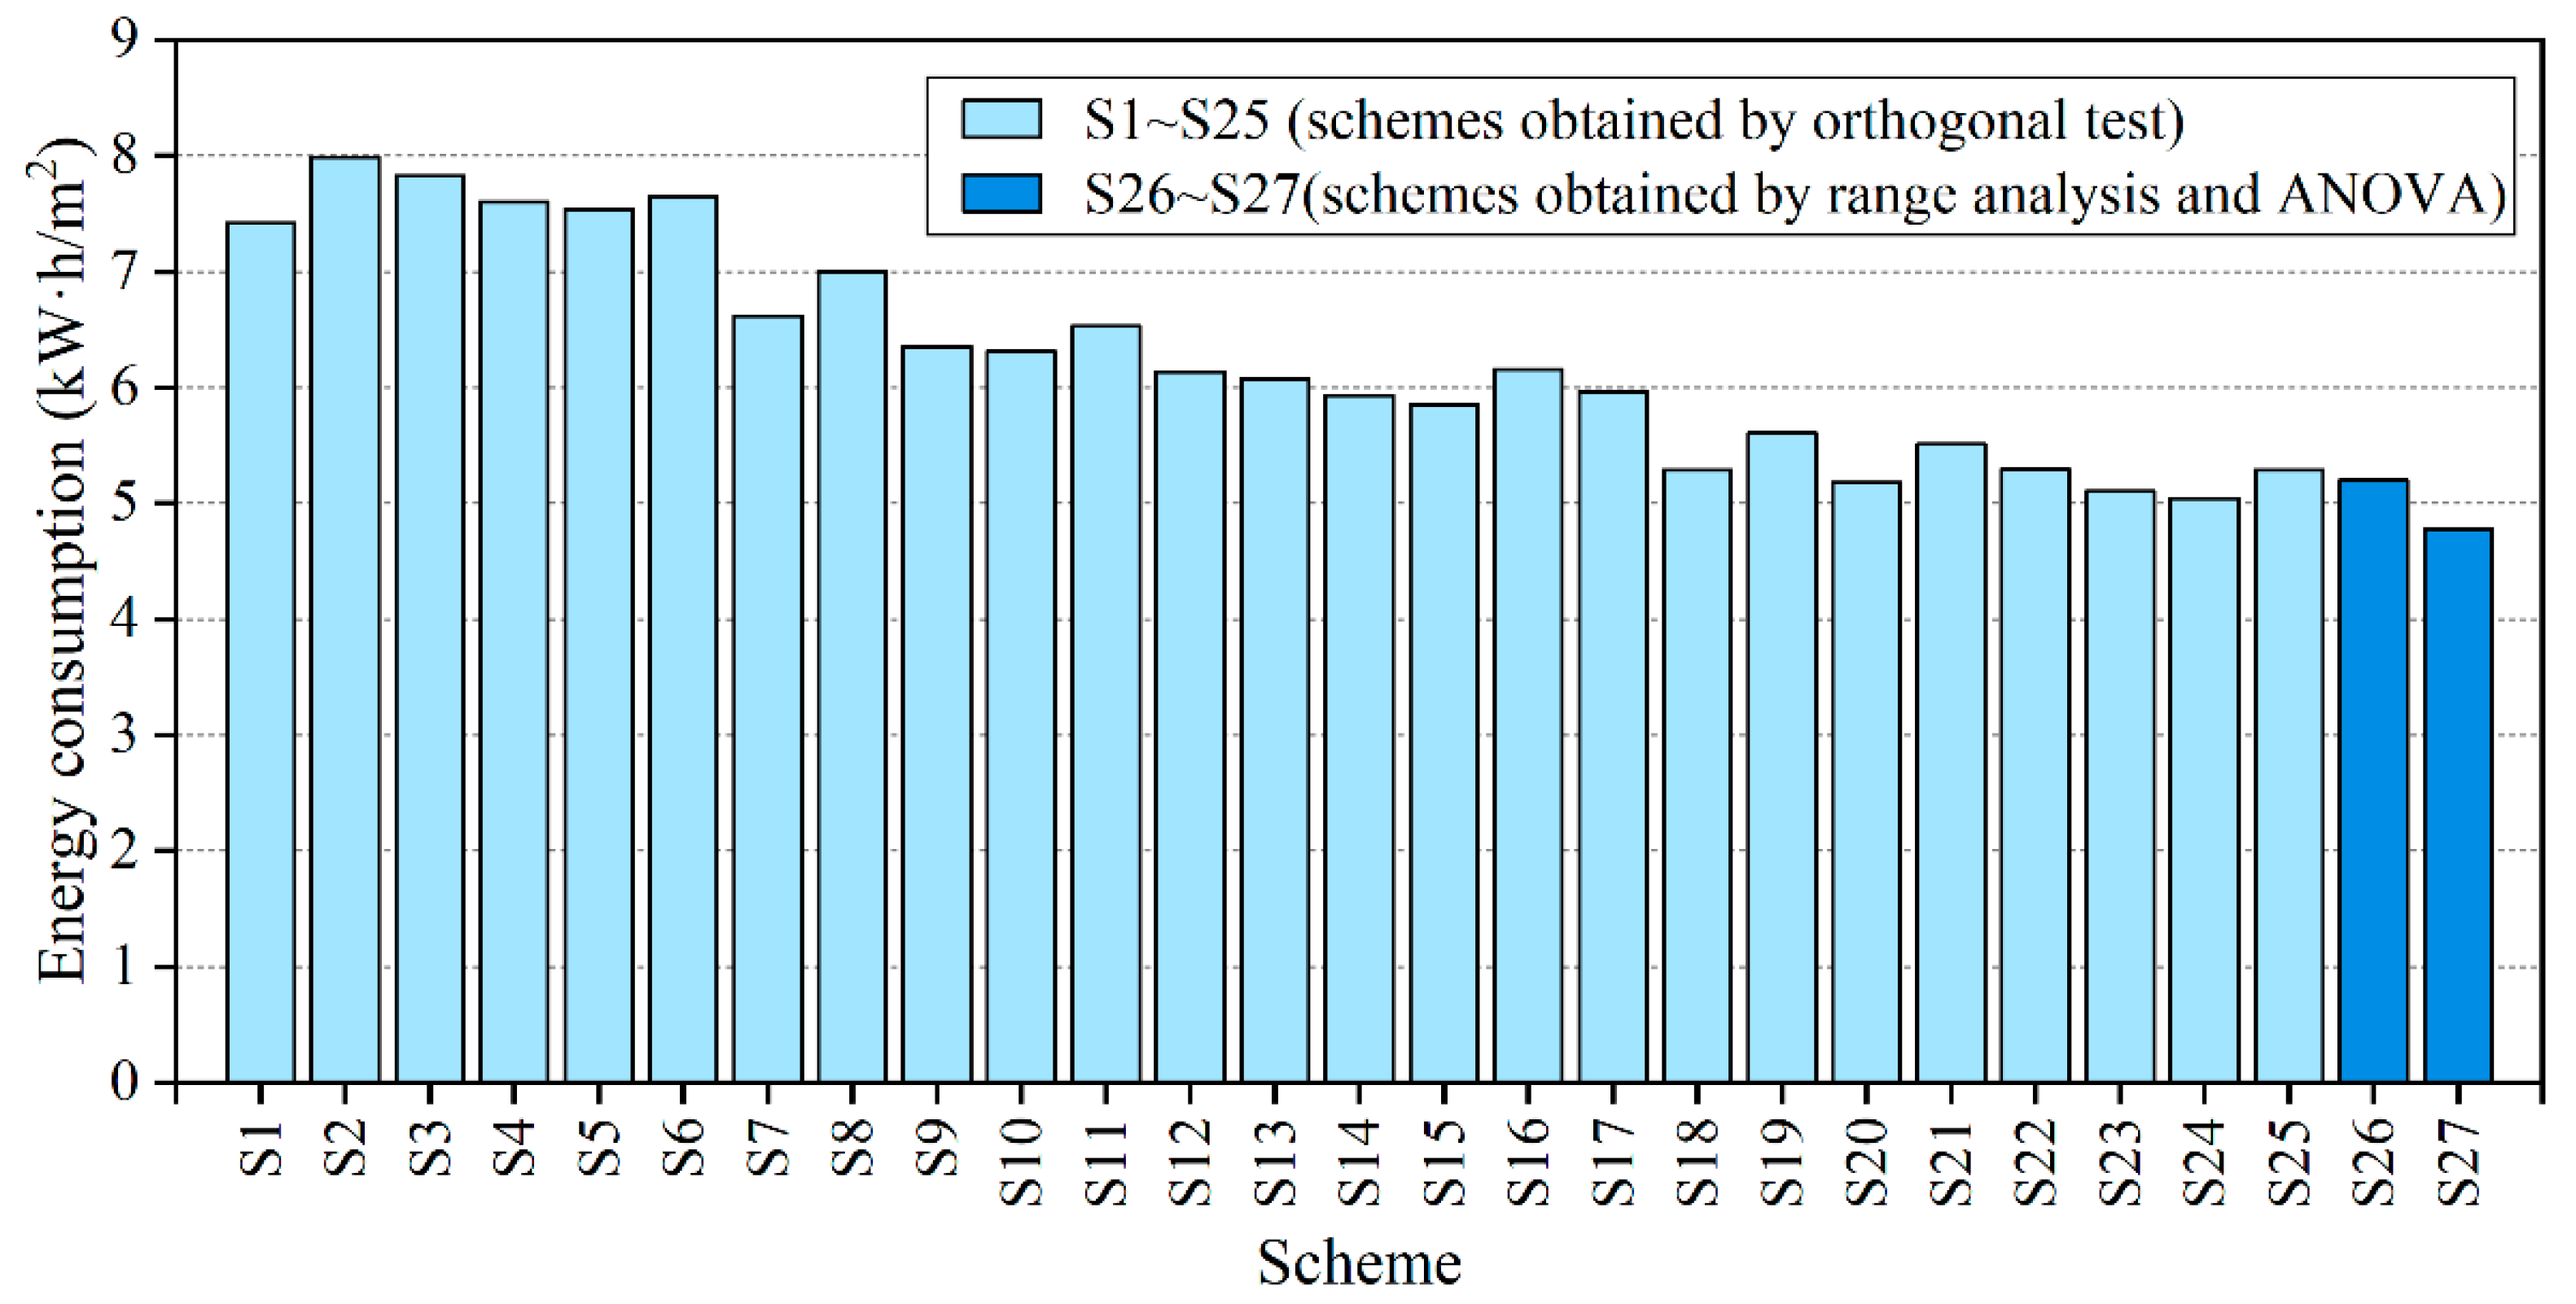
(1) For the study of a single room in a Tibetan dwelling, after applying a T-wall, the indoor air temperature range of the room in January, which is the coldest month, is 2.2 °C~24.5 °C, and the range of the average indoor air temperature range was from 9.1 °C to 12.2 °C. The average indoor temperature is much higher than the average indoor temperature of the existing Tibetan dwelling test room (−0.94 °C). The room’s energy consumption per square meter in January is between 4.0 and 8.0 kW·h/m2.
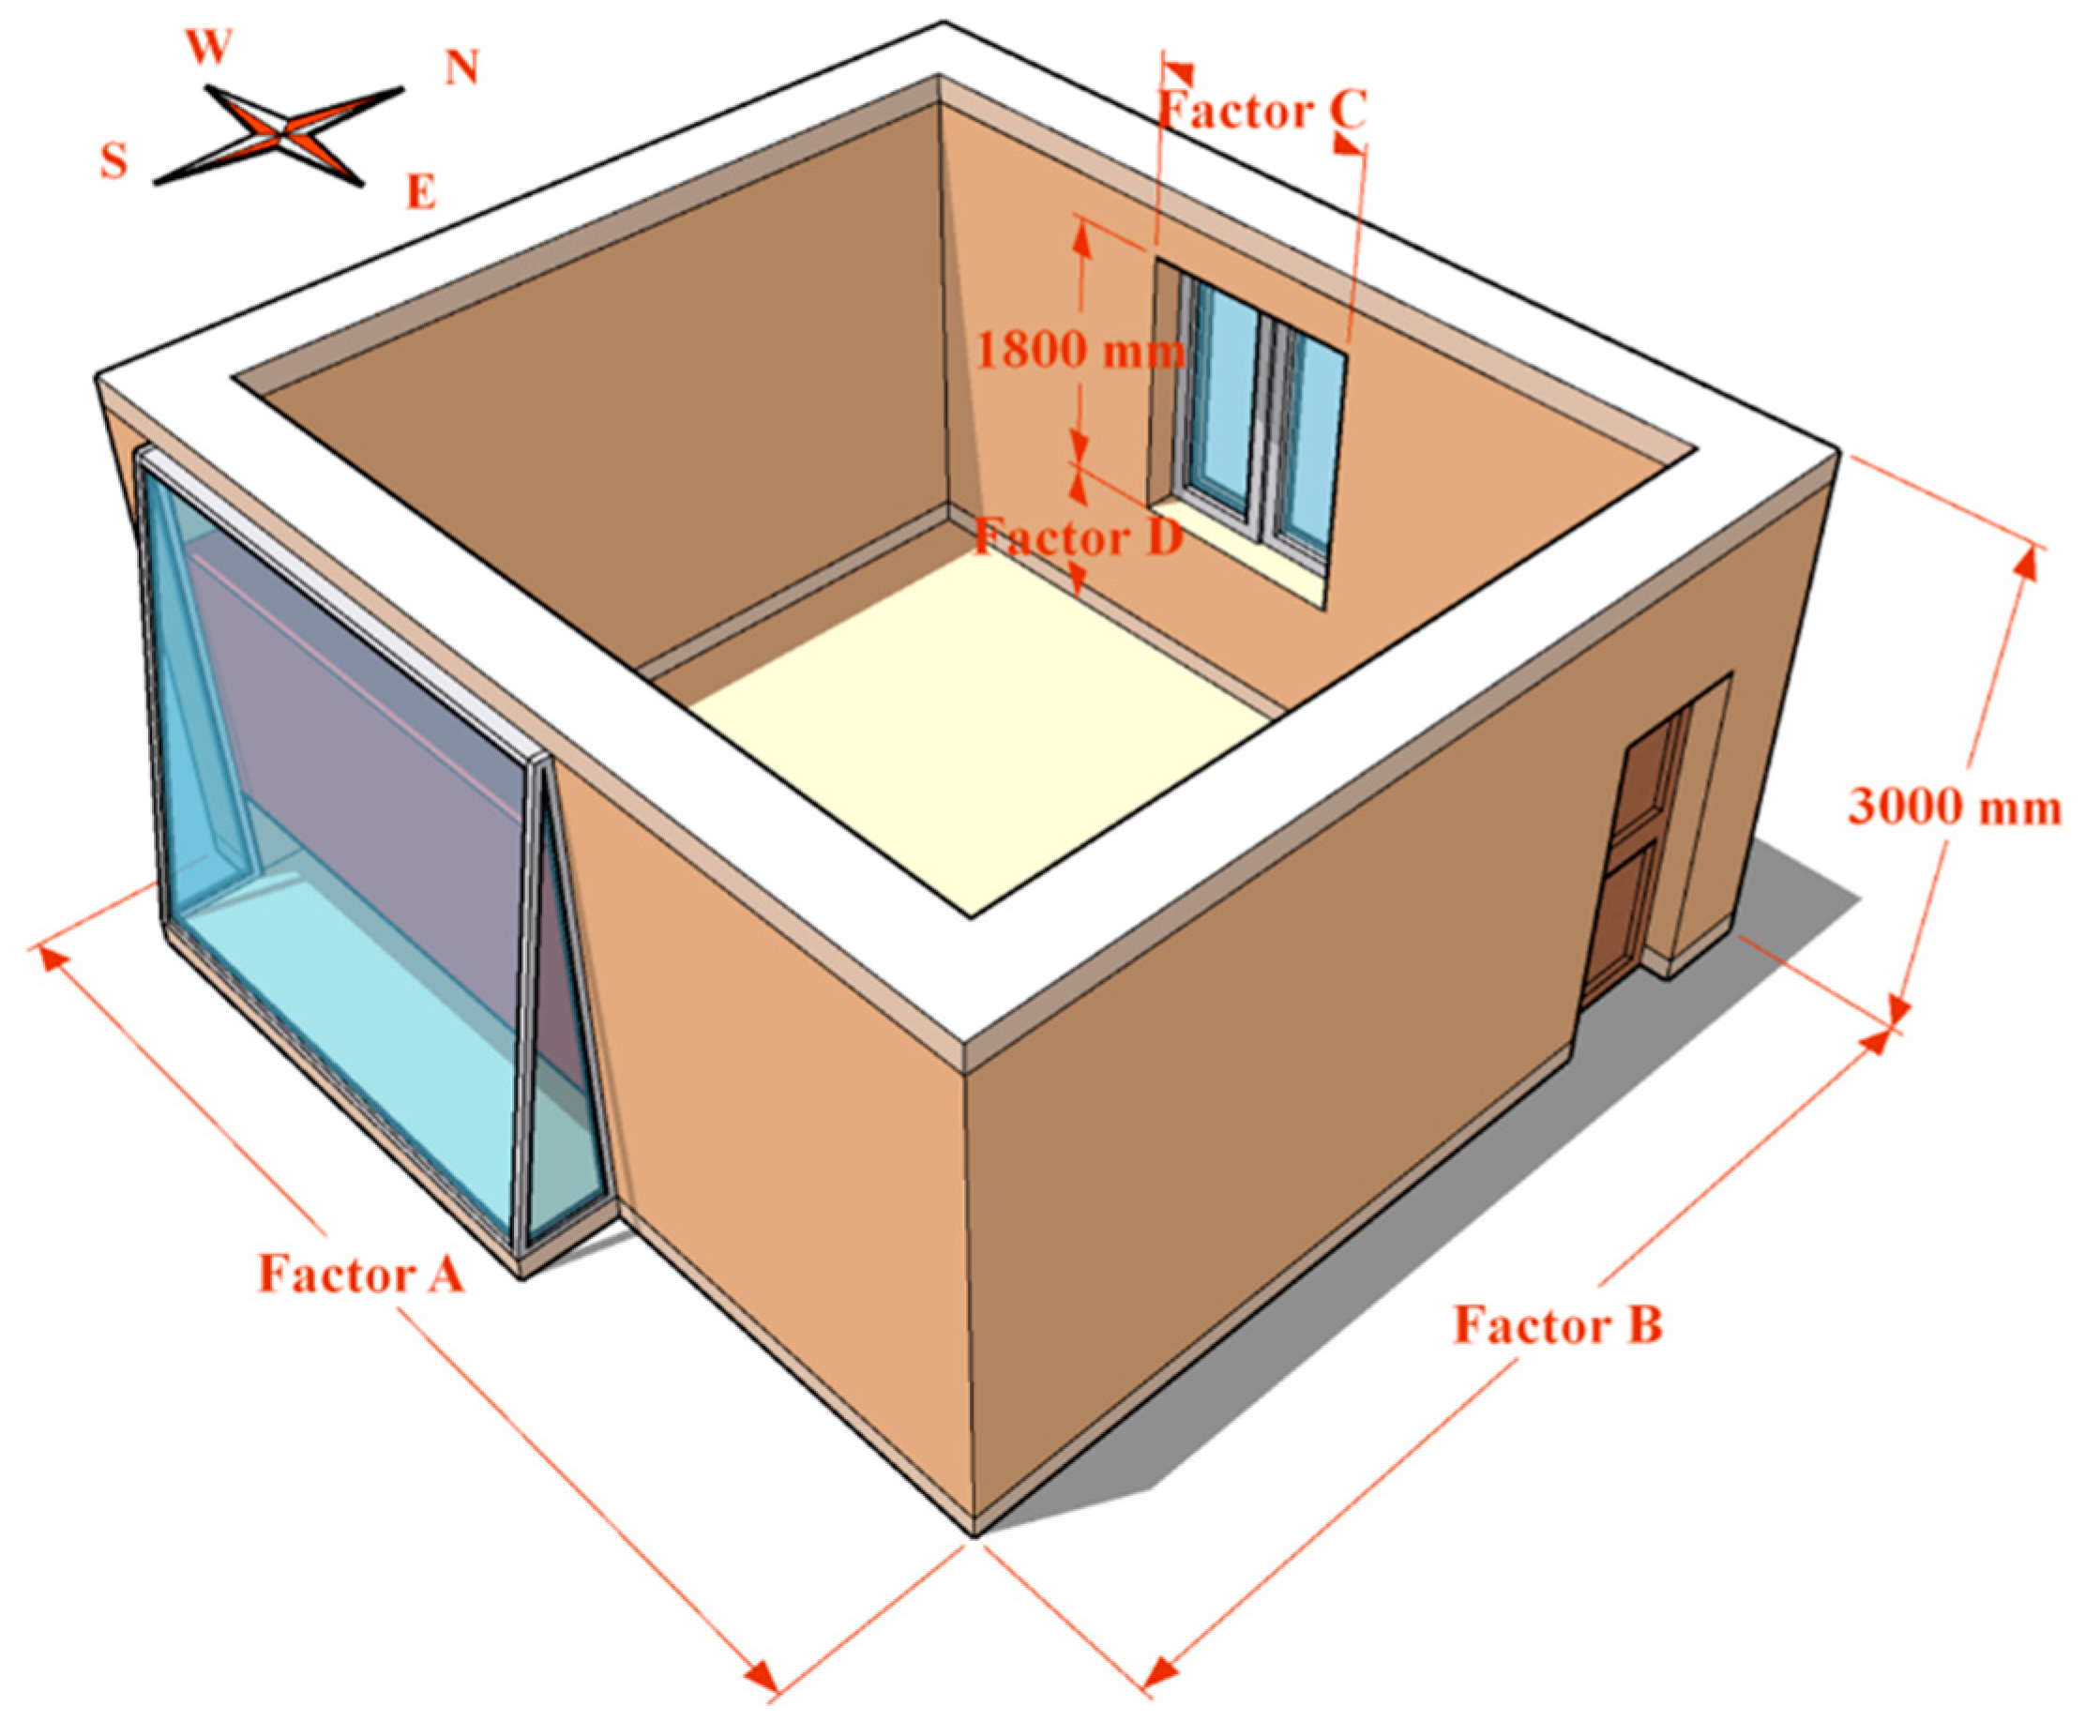
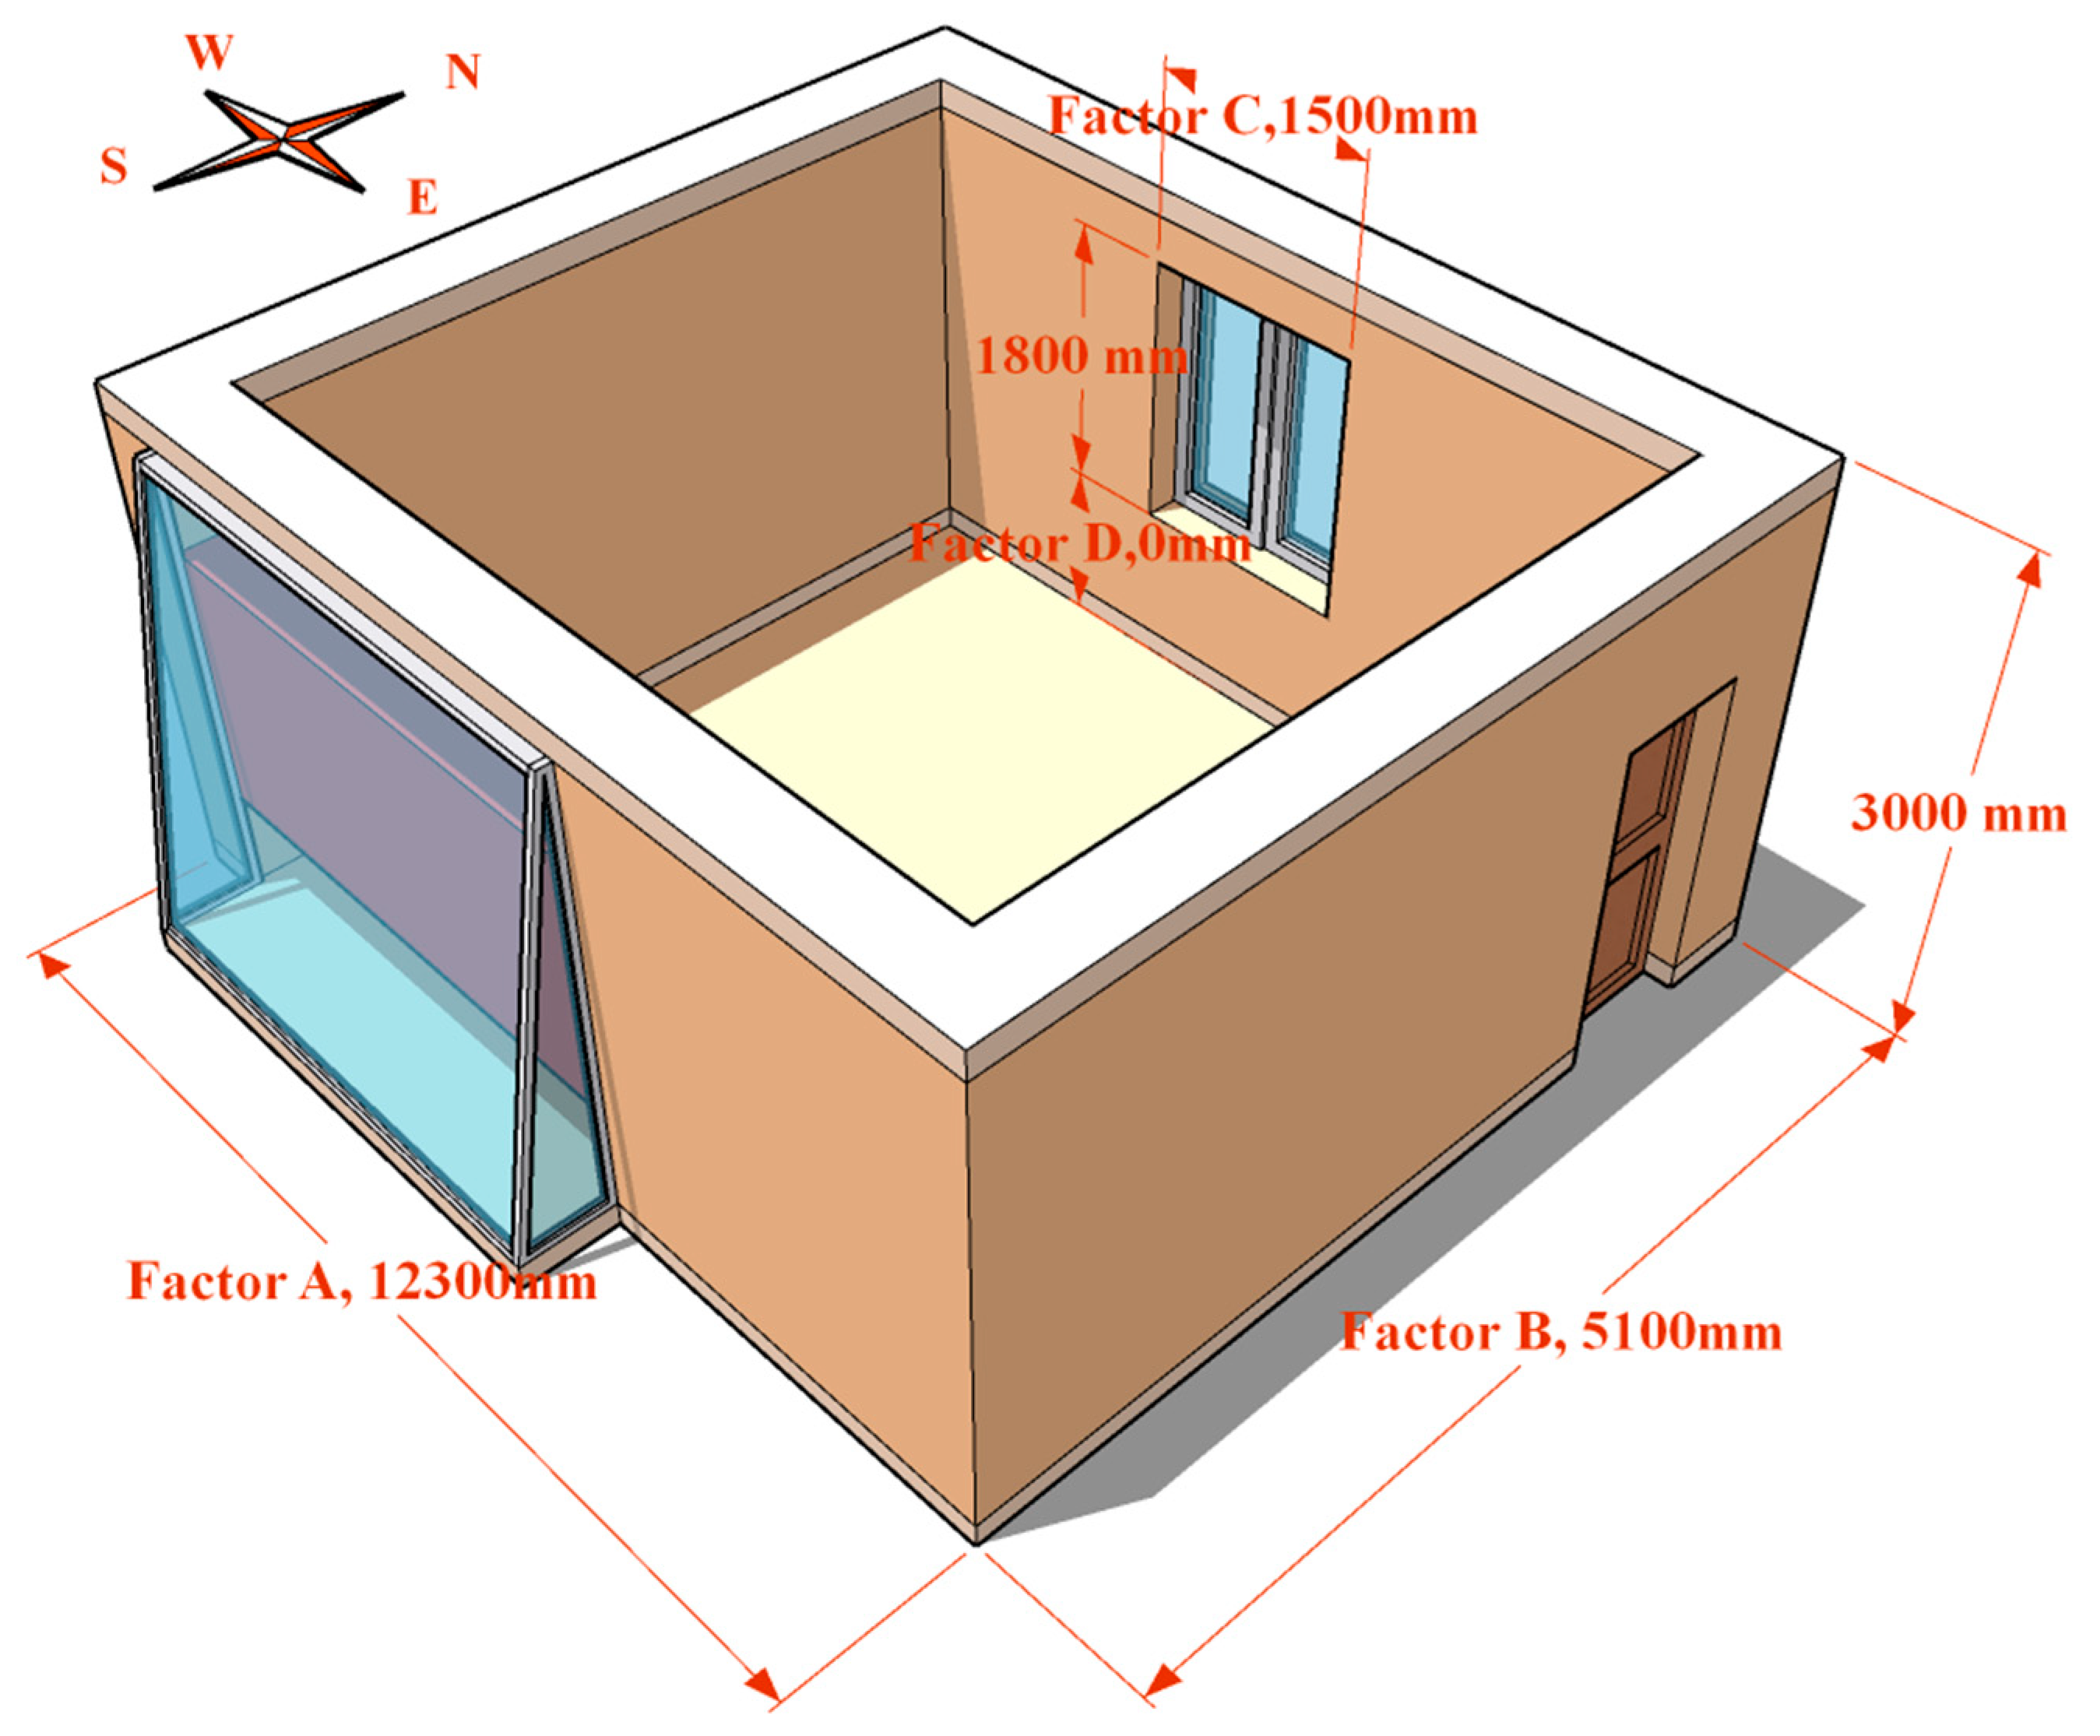
(2) The room configuration has a significant impact on the performance of a T-wall. The four influencing factors identified in the study have a highly significant effect on room temperature and energy consumption. The rankings were consistent for their effects on both room temperature and energy consumption, as Factor A (the length of the room) > Factor B (the width of the room) > Factor C (the width of the opening on the north wall of the room) > Factor D (the distance from the lower edge of the opening to the floor).
(3) The optimal combination for room temperature, determined by range analysis, is S26, and that for energy consumption is S27. Through further simulation analysis between S26 and S27, S26 was determined to be the best combination with the highest indoor air temperature and low energy consumption. Factors (A, B, C, D) in S26 are, respectively (12,300, 5100, 1500, 0) mm.

5. Implementations and Future Work

The conclusions of this study further confirm that the influence of room configuration on the performance of T-walls cannot be ignored. Future research should not only focus on the structural parameters of T-walls. In this study, the structural parameters of T-walls were set as the optimal structural parameters obtained from the fixed-room configuration in the previous study. At present, it is not clear how T-walls will perform when both T-wall structural parameters and room configuration are changed. In future research, simultaneous optimization of T-wall structure and room configuration should be further considered to determine the interaction between the T-wall and the room.

Author Contributions

Conceptualization, L.Z.; methodology, L.Z., J.C., F.L. and L.T.; software, J.C., H.L. (Haolin Li), Z.D. and L.T.; validation, F.L., Z.D. and H.L. (Haoru Liu); formal analysis, J.C. and L.T.; investigation, Z.D., X.Z., K.W. and H.L. (Haoru Liu); data curation, J.C., H.L. (Haolin Li) and K.W.; writing—original draft, J.C.; writing—review & editing, L.Z., F.L. and J.W. visualization, J.C., H.L. (Haolin Li) and X.Z.; supervision, L.Z. and F.L.; project administration, L.Z., J.W. and C.T.; funding acquisition, C.T. All authors have read and agreed to the published version of the manuscript.

Funding

This research was funded by the National Natural Science Foundation of China (Grant No. 42001244).

Institutional Review Board Statement

Not applicable.

Informed Consent Statement

Not applicable.

Data Availability Statement

The data used are available within the manuscript.

Acknowledgments

The authors want to thank all participants involved in the study.

Conflicts of Interest

The authors declare no conflict of interest.

References

  1. Duan, S.; Wang, L.; Zhao, Z.; Zhang, C. Experimental study on thermal performance of an integrated PCM Trombe wall. Renew. Energ. 2021, 163, 1932–1941. [Google Scholar] [CrossRef]
  2. Islam, N.; Irshad, K.; Zahir, M.; Islam, S. Numerical and experimental study on the performance of a Photovoltaic Trombe wall system with Venetian blinds. Energy 2021, 218, 119542. [Google Scholar] [CrossRef]
  3. Zhang, L.; Dong, J.; Sun, S.; Chen, Z. Numerical simulation and sensitivity analysis on an improved Trombe wall. Sustain. Energy Technol. Assess. 2021, 43, 100941. [Google Scholar] [CrossRef]
  4. Ryan, D.; Burek, S. Experimental study of the influence of collector height on the steady state performance of a passive solar air heater. Sol. Energy 2010, 84, 1676–1684. [Google Scholar] [CrossRef]
  5. Stazi, F.; Mastrucci, A.; Perna, C. The behaviour of solar walls in residential buildings with different insulation levels: An experimental and numerical study. Energy Build. 2012, 47, 217–229. [Google Scholar] [CrossRef]
  6. Letan, R.; Dubovsky, V.; Ziskind, G. Passive ventilation and heating by natural convection in a multi-storey building. Build. Environ. 2003, 38, 197–208. [Google Scholar] [CrossRef]
  7. Rabani, M.; Kalantar, V.; Dehghan, A.; Faghih, A. Experimental study of the heating performance of a Trombe wall with a new design. Sol. Energy 2015, 118, 359–374. [Google Scholar] [CrossRef]
  8. Hernández-López, I.; Xamán, J.; Chávez, Y.; Hernández-Pérez, I.; Alvarado-Juárez, R. Thermal energy storage and losses in a room-Trombe wall system located in Mexico. Energy 2016, 109, 512–524. [Google Scholar] [CrossRef]
  9. Zhou, Y.; Wang, Z.; Yang, C.; Xu, L.; Chen, W. Influence of Trombe wall on indoor thermal environment of a two-story building in rural Northern China during summer. Sci. Technol. Built Environ. 2019, 25, 438–449. [Google Scholar] [CrossRef]
  10. Yu, B.; Hou, J.; He, W.; Liu, S.; Hu, Z.; Ji, J.; Chen, H.; Xu, G. Study on a high-performance photocatalytic-Trombe wall system for space heating and air purification. Appl. Energy 2018, 226, 365–380. [Google Scholar] [CrossRef]
  11. Yu, B.; Jiang, Q.; He, W.; Hu, Z.; Chen, H.; Ji, J.; Xu, G. The performance analysis of a novel TC-Trombe wall system in heating seasons. Energy Convers. Manag. 2018, 164, 242–261. [Google Scholar] [CrossRef]
  12. Yu, B.; Yang, J.; He, W.; Qin, M.; Zhao, X.; Chen, H. The performance analysis of a novel hybrid solar gradient utilization photocatalytic-thermal-catalytic-Trombe wall system. Energy 2019, 174, 420–435. [Google Scholar] [CrossRef]
  13. Yu, B.; Li, N.; Ji, J. Performance analysis of a purified Trombe wall with ventilation blinds based on photo-thermal driven purification. Appl. Energy 2019, 255, 113846. [Google Scholar] [CrossRef]
  14. Yu, B.; Liu, X.; Li, N.; Liu, S.; Ji, J. The performance analysis of a purified PV/T-Trombe wall based on thermal catalytic oxidation process in winter. Energy Convers. Manag. 2020, 203, 112262. [Google Scholar] [CrossRef]
  15. Yu, B.; Li, N.; Xie, H.; Ji, J. The performance analysis on a novel purification-cleaning trombe wall based on solar thermal sterilization and thermal catalytic principles. Energy 2021, 225, 120275. [Google Scholar] [CrossRef]
  16. Yilmaz, Z.; Kundakci, A. An approach for energy conscious renovation of residential buildings in Istanbul by Trombe wall system. Build. Environ. 2008, 43, 508–517. [Google Scholar] [CrossRef]
  17. Chel, A.; Nayak, J.; Kaushik, G. Energy conservation in honey storage building using Trombe wall. Energy Build. 2008, 40, 1643–1650. [Google Scholar] [CrossRef]
  18. Bojić, M.; Johannes, K.; Kuznik, F. Optimizing energy and environmental performance of passive Trombe wall. Energy Build. 2014, 70, 279–286. [Google Scholar] [CrossRef]
  19. Duan, S.; Jing, C.; Zhao, Z. Energy and exergy analysis of different Trombe walls. Energy Build. 2016, 126, 517–523. [Google Scholar] [CrossRef]
  20. Hong, X.; He, W.; Hu, Z.; Wang, C.; Ji, J. Three-dimensional simulation on the thermal performance of a novel Trombe wall with venetian blind structure. Energy Build. 2015, 89, 32–38. [Google Scholar] [CrossRef]
  21. Zhang, L.; Hou, Y.; Liu, Z.; Du, J.; Xu, L.; Zhang, G.; Shi, L. Trombe wall for a residential building in Sichuan-Tibet alpine valley—A case study. Renew. Energy 2020, 156, 31–46. [Google Scholar] [CrossRef]
  22. Dragićević, S.; Lambic, M. Influence of constructive and operating parameters on a modified Trombe wall efficiency. Arch. Civ. Mech. Eng. 2011, 11, 825–838. [Google Scholar] [CrossRef]
  23. Liu, Y.; Wang, D.; Ma, C.; Liu, J. A numerical and experimental analysis of the air vent management and heat storage characteristics of a trombe wall. Sol. Energy 2013, 91, 1–10. [Google Scholar] [CrossRef]
  24. Özbalta, T.; Kartal, S. Heat gain through Trombe wall using solar energy in a cold region of Turkey. Sci. Res. Essays 2010, 5, 2768–2778. [Google Scholar]
  25. Jie, J.; Luo, C.; Sun, W.; He, W.; Pei, G.; Han, C. A numerical and experimental study of a dual-function solar collector integrated with building in passive space heating mode. Chin. Sci. Bull. 2010, 55, 1568–1573. [Google Scholar] [CrossRef]
  26. Jaber, S.; Ajib, S. Optimum design of Trombe wall system in mediterranean region. Sol. Energy 2011, 85, 1891–1898. [Google Scholar] [CrossRef]
  27. Fares, A. The Effect of Changing Trombe Wall Component on the Thermal Load. Energy Procedia 2012, 19, 47–54. [Google Scholar] [CrossRef] [Green Version]
  28. Dragićević, S.; Lambić, M. Numerical study of a modified Trombe wall solar collector system. Therm. Sci. 2009, 13, 195–204. [Google Scholar] [CrossRef]
  29. Suárez, M.; Gutiérrez, A.; Pistono, J.; Blanco, E. CFD analysis of heat collection in a glazed gallery. Energy Build. 2011, 43, 108–116. [Google Scholar] [CrossRef]
  30. Dimassi, N.; Dehmani, L. Thermal performance of a passive test room with a Trombe wall in Tunisia. J. Renew. Sustain. Energy 2012, 4, 246–626. [Google Scholar] [CrossRef]
  31. Shi, L. Theoretical models for wall solar chimney under cooling and heating modes considering room configuration. Energy 2018, 165, 925–938. [Google Scholar] [CrossRef]
  32. Shi, L.; Zhang, G. An empirical model to predict the performance of typical solar chimneys considering both room and cavity configurations. Build. Environ. 2016, 103, 250–261. [Google Scholar] [CrossRef] [Green Version]
  33. Shi, L.; Cheng, X.; Zhang, L.; Li, Z.; Zhang, G.; Huang, D.; Tu, J. Interaction effect of room opening and air inlet on solar chimney performance. Appl. Therm. Eng. 2019, 159, 113877. [Google Scholar] [CrossRef]
  34. Zhou, G.; Moayedi, H.; Foong, L. Teaching–learning-based metaheuristic scheme for modifying neural computing in appraising energy performance of building. Eng. Comput. 2021, 37, 3037–3048. [Google Scholar] [CrossRef]
  35. Moayedi, H.; Mosavi, A. Double-Target Based Neural Networks in Predicting Energy Consumption in Residential Buildings. Energies 2021, 14, 1331. [Google Scholar] [CrossRef]
  36. Moayedi, H.; Mosavi, A. Suggesting a Stochastic Fractal Search Paradigm in Combination with Artificial Neural Network for Early Prediction of Cooling Load in Residential Buildings. Energies 2021, 14, 1649. [Google Scholar] [CrossRef]
  37. Zhou, G.; Moayedi, H.; Bahiraei, M.; Lyu, Z. Employing artificial bee colony and particle swarm techniques for optimizing a neural network in prediction of heating and cooling loads of residential buildings. J. Clean. Prod. 2020, 254, 120082. [Google Scholar] [CrossRef]
  38. Dabaieh, M.; Elbably, A. Ventilated Trombe wall as a passive solar heating and cooling retrofitting approach; a low-tech design for off-grid settlements in semi-arid climates. Sol. Energy 2015, 122, 820–833. [Google Scholar] [CrossRef] [Green Version]
  39. China Academy of Building Research. Code for Thermal Design of Civil Building (GB 50176-2016); China Academy of Building Research, Ed.; China Architecture & Building Press: Beijing, China, 2016. [Google Scholar]
  40. Xu, Z.; Wang, T.; Li, C.; Bao, L.; Ma, Q.; Miao, Y. Brief Introduction to the Orthogonal Test Design. Technol. Inf. Dev. Econ. 2002, 12, 148–150. [Google Scholar]
  41. U.S. Department of Energy. EnergyPlus Version 8.9.0. 2017. Available online: https://energyplus.net/ (accessed on 20 January 2021).
  42. China Academy of Building. Design Standard for Energy Efficiency of Rural Residential Buildings (GB/T 50824-2013); China Architecture & Building Press: Beijing, China, 2013. [Google Scholar]
Figure 1. Diagram of the working principle of a T-wall.
Applsci 12 05260 g001
Figure 2. The research location and the architectural style.
Applsci 12 05260 g002
Figure 3. The annual dry-bulb temperature of Aba County.
Applsci 12 05260 g003
Figure 4. The annual total solar radiation of Aba County.
Applsci 12 05260 g004
Figure 5. SketchUp map of the building model. (a) South side of the room; (b) North side of the room.
Applsci 12 05260 g005
Figure 6. Diagram of influencing factors.
Applsci 12 05260 g006
Figure 7. The effect curve of each test factor and the average indoor air temperature/room energy consumption per square meter. (a) The length of the room; (b) The width of the room; (c) The width of the opening on the north wall of the room; (d) The distance from the lower edge of the opening to the floor.
Applsci 12 05260 g007
Figure 8. The indoor air temperature in January of 27 schemes.
Applsci 12 05260 g008
Figure 9. Room energy consumption per square meter, in January, of the 27 schemes.
Applsci 12 05260 g009
Figure 10. The configuration parameters of the room corresponding to the optimal combination.
Applsci 12 05260 g010
Table 1. Optimal size of the T-wall structure [21].
ItemThe Optimal Value
T-wall-to-south-wall ratio (%)55
Inlet and outlet height (mm)500
Glazing inclination (°)10
The thickness of the storage wall (mm)400
Material of the storage wallClay wall
Cavity gap (mm)100
Table 2. Physical parameters of room structure [38,39].
Building EnvelopeConstruction MaterialThickness (mm)Density (kg/m3)Specific Heat [J/(kg·K)]Thermal Conductivity [W/(m·K)]
South/West Wall (Exterior Wall)Clay1000180010100.93
North/East Wall (Internal Wall)Wooden board20050025100.14
Floor/ CeilingWooden board20050025100.14
Wooden doorWooden board5050025100.14
T-wall heat storage wallClay400180010100.93
High reflectivity black coating106001000.16
U-value * [W/(m2·K)] = 0.16
T-wall glassDouble glass6U-value [W/(m2·K)] = 1.77
Sc * = 1.07
SHGC * = 0.739
* U-value: heat transfer coefficient; * Sc: shading coefficient; * SHGC: solar heat gain coefficient.
Table 3. Orthogonal experimental design schemes and results.
SchemeFactor A * (mm)Factor B * (mm)Factor C * (mm)Factor D * (mm)Analysis Indicator
Average Indoor Air Temperature (°C)Energy Consumption (kW·h/m2)
S16300 (A1)5100 (B1)1500 (C1)0 (D1)10.537.42
S26300 (A1)6000 (B2)2700 (C3)900 (D4)9.737.99
S36300 (A1)6900 (B3)3900 (C5)300 (D2)9.457.83
S46300 (A1)7800 (B4)2100 (C2)1200 (D5)9.337.60
S56300 (A1)8700 (B5)3300 (C4)600 (D3)9.107.54
S67800 (A2)5100 (B1)3900 (C5)900 (D4)10.287.64
S77800 (A2)6000 (B2)2100 (C2)300 (D2)10.596.62
S87800 (A2)6900 (B3)3300 (C4)1200 (D5)9.917.00
S97800 (A2)7800 (B4)1500 (C1)600 (D3)10.136.35
S107800 (A2)8700 (B5)2700 (C3)0 (D1)9.896.31
S119300 (A3)5100 (B1)3300 (C4)300 (D2)11.006.53
S129300 (A3)6000 (B2)1500 (C1)1200 (D5)10.916.14
S139300 (A3)6900 (B3)2700 (C3)600 (D3)10.606.07
S149300 (A3)7800 (B4)3900 (C5)0 (D1)10.355.93
S159300 (A3)8700 (B5)2100 (C2)900 (D4)10.185.85
S1610800 (A4)5100 (B1)2700 (C3)1200 (D5)11.276.16
S1710800 (A4)6000 (B2)3900 (C5)600 (D3)10.975.97
S1810800 (A4)6900 (B3)2100 (C2)0 (D1)11.205.29
S1910800 (A4)7800 (B4)3300 (C4)900 (D4)10.595.61
S2010800 (A4)8700 (B5)1500 (C1)300 (D2)10.745.18
S2112300 (A5)5100 (B1)2100 (C2)600 (D3)11.835.51
S2212300 (A5)6000 (B2)3300 (C4)0 (D1)11.545.29
S2312300 (A5)6900 (B3)1500 (C1)900 (D4)11.365.10
S2412300 (A5)7800 (B4)2700 (C3)300 (D2)11.085.04
S2512300 (A5)8700 (B5)3900 (C5)1200 (D5)10.555.29
* Factor A: The length of the room, * Factor B: The width of the room, * Factor C: The width of the opening on the north wall of the room, * Factor D: The distance from the lower edge of the opening to the floor (with the opening height fixed at 1800 mm).
Table 4. Settings in the numerical simulation [39,42].
ItemValue
Ideal Load SystemConstant heating set point18 °C
Constant cooling set point26 °C
Operating time8:00–9:00 a.m. and 5:00–9:00 p.m.
Other heat dissipation in the roomEquipmentA TV (15 W/m2)
A light (7 W/m2)
People4
Table 5. ANOVA of indoor air temperature.
Sum of Deviation Squares ( S S ) Degree of Freedom ( d f ) Mean Square ( M S ) Variance Ratio ( F ) Significance
Factor A8.46042.115895.397Highly Significant
Factor B2.50140.625264.667Highly Significant
Factor C0.52740.13255.766Highly Significant
Factor D0.29840.07531.575Highly Significant
Error0.01980.002--
R 2 = 0.998
F 0.05 ( 4 , 8 ) = 3.84 ; F 0.01 ( 4 , 8 ) = 7.01
Table 6. Range analysis of indoor air temperature.
ItemLevelFactor AFactor BFactor CFactor D
K * 148.1254.9253.6753.51
250.8053.7353.1252.86
353.0552.5252.5752.63
454.7751.4752.1452.13
556.3650.4651.6051.98
K ¯ * 19.6210.9810.7310.70
210.1610.7510.6210.57
310.6110.5010.5110.53
410.9510.2910.4310.43
511.2710.0910.3210.40
R -value *1.650.890.410.31
RankA > B > C > D
Optimal Level *5111
Optimal combinationA5B1C1D1
* K : The sum of the test results corresponding to a certain factor and a certain level, * K ¯ : The average value of K , * R -value: The extreme value of the factor. The calculation method of this value is the maximum value of K minus the minimum value of K , which can be combined with the extreme value of the factors to sort the factors, * Optimal Level: The level number corresponding to the optimal K ¯ value of a factor.
Table 7. ANOVA of room energy consumption.
Sum of Deviation Squares ( S S ) Degree of Freedom ( d f ) Mean Square ( M S ) Variance Ratio ( F ) Significance
Factor A18.51944.630429.495Highly Significant
Factor B1.21540.30428.167Highly Significant
Factor C0.73340.18317.003Highly Significant
Factor D0.51840.12912.006Highly Significant
Error0.08680.011--
R 2 = 0.996
F 0.05 ( 4 , 8 ) = 3.84 ; F 0.01 ( 4 , 8 ) = 7.01
Table 8. Range analysis of room energy consumption.
ItemLevelFactor AFactor BFactor CFactor D
K 138.37 33.26 30.19 30.25
233.92 32.00 30.87 31.19
330.52 31.29 31.58 31.45
428.20 30.54 31.97 32.19
526.24 30.17 32.65 32.18
K ¯ 17.67 6.65 6.04 6.05
26.78 6.40 6.17 6.24
36.10 6.26 6.32 6.29
45.64 6.11 6.39 6.44
55.25 6.03 6.53 6.44
R -value1.652.43 0.62 0.49
RankA > B > C > D
Optimal Level5511
Optimal combinationA5B5C1D1
Publisher’s Note: MDPI stays neutral with regard to jurisdictional claims in published maps and institutional affiliations.

