
Estimation of Cosmic-Ray-Induced Atmospheric Ionization and Radiation at Commercial Aviation Flight Altitudes

 , ,
, ,  , ,
, ,
Abstract
:1. Introduction
2. Technical Analysis and Data Selection
3. Results
4. Discussion and Conclusions
Supplementary Materials
Author Contributions
Funding
Institutional Review Board Statement
Informed Consent Statement
Data Availability Statement
Acknowledgments
Conflicts of Interest
References
- Vainio, R.; Desorgher, L.; Heynderickx, D.; Storini, M.; Flückiger, E.; Horne, R.B.; Kovaltsov, G.A.; Kudela, K.; Laurenza, M.; McKenna-Lawlor, S.; et al. Dynamics of the Earth’s Particle Radiation Environment. Space Sci. Rev. 2009, 147, 187–231. [Google Scholar] [CrossRef]
- Dorman, L. Cosmic Rays in the Earth’s Atmosphere and Underground; Kluwer Academic Publishers: Dordrecht, The Netherlands, 2004. [Google Scholar]
- Harrison, R.G.; Tammet, H. Ions in the terrestrial atmosphere and other solar system atmospheres. Space Sci. Rev. 2008, 137, 107–118. [Google Scholar] [CrossRef]
- Mironova, I.A.; Aplin, K.L.; Arnold, F.; Bazilevskaya, G.A.; Harrison, R.G.; Krivolutsky, A.A.; Nicoll, K.A.; Rozanov, E.V.; Turunen, E.; Usoskin, I.G. Energetic Particle Influence on the Earth’s Atmosphere. Space Sci. Rev. 2015, 194, 1–96. [Google Scholar] [CrossRef] [Green Version]
- Adriani, O.; Ambriola, M.; Barbarino, G.; Barbier, L.M.; Bartalucci, S.; Bazilevskaja, G.; Bellotti, R.; Bertazzoni, S.; Bidoli, V.; Boezio, M.; et al. The PAMELA experiment on satellite and its capability in cosmic rays measurements. Nucl. Instrum. Methods Phys. Res. Sect. A 2002, 478, 114–118. [Google Scholar] [CrossRef] [Green Version]
- Bruno, A.; Bazilevskaya, G.A.; Boezio, M.; Christian, E.R.; de Nolfo, G.A.; Martucci, M.; Merge, M.; Mikhailov, V.V.; Munini, R.; Richardson, I.G.; et al. Solar Energetic Particle Events Observed by the PAMELA Mission. Astrophys. J. Lett. 2018, 862, 97. [Google Scholar] [CrossRef]
- Semeniuk, K.; Fomichev, V.I.; McConnell, J.C.; Fu, C.; Melo, S.M.L.; Usoskin, I.G. Middle atmosphere response to the solar cycle in irradiance and ionizing particle precipitation. Atmos. Chem. Phys. 2011, 11, 5045–5077. [Google Scholar] [CrossRef] [Green Version]
- Velinov, P.I.Y.; Mateev, L. Analytical approach for cosmic ray proton ionization in the lower ionosphere and middle atmosphere. C. R. Acad. Bulg. Sci. 2005, 58, 511–516. [Google Scholar]
- Velinov, P.I.Y.; Mateev, L. Improved cosmic ray ionization model for the system ionosphere-atmosphere. Calculation of electron production rate profiles. J. Atmos. Solar-Terr. Phys. 2007, 70, 574–582. [Google Scholar] [CrossRef]
- Desorgher, L.; Flückiger, E.O.; Gurtner, M.; Moser, M.R.; Bütikofer, R. ATMOCOSMICS: A GEANT4 code for computing the interaction of cosmic rays with the Earth’s atmosphere. Int. J. Mod. Phys. A 2005, 20, 6802–6804. [Google Scholar] [CrossRef]
- Scherer, K.; Fichtner, H.; Borrmann, T.; Beer, J.; Desorgher, L.; Flükiger, E.O.; Fahr, H.J. Interstellar-terrestrial relations: Variable cosmic environments, the dynamic heliosphere, and their imprints on terrestrial archives and climate. Space Sci. Rev. 2007, 127, 327–465. [Google Scholar] [CrossRef] [Green Version]
- Usoskin, I.G.; Kovaltsov, G.A. Cosmic ray induced ionization in the atmosphere: Full modeling and practical applications. J. Geophys. Res. 2006, 111, D21206. [Google Scholar] [CrossRef] [Green Version]
- Usoskin, I.G.; Kovaltsov, G.A.; Mironova, I.A. Cosmic ray induced ionization model CRAC: CRII: An extension to the upper atmosphere. J. Geophys. Res. 2010, 115, D10302. [Google Scholar] [CrossRef] [Green Version]
- Usoskin, I.G.; Desorgher, L.; Velinov, P.; Storini, M.; Flueckiger, E.O.; Buetikofer, R.; Kovaltsov, G.A. Ionization of the Earth’s atmosphere by solar and galactic cosmic rays. Acta Geophys. 2009, 57, 88. [Google Scholar] [CrossRef]
- Singh, A.K.; Singh, D.; Singh, R.P. Impact of galactic cosmic rays on earth’s atmosphere and human health. Atmos. Environ. 2011, 45, 3806–3818. [Google Scholar] [CrossRef]
- Miroshnichenko, L.I. Radiation Hazard in Space; Springer: Dordrecht, The Netherlands, 2003; ISBN 978-94-017-0301-7. [Google Scholar]
- European Commission. Directive 96/29/EURATOM of 13 May 1996 Laying Down Basic Safety Standards for the Protection of the Health of Workers and the General Public Against the Dangers Arising from Ionizing Radiation; Publications Office: Luxembourg, 1996. [Google Scholar]
- International Commission on Radiation Units and Measurements. Reference data for the validation of doses from cosmic-radiation exposure of aircraft crew. ICRU Report 84. J. Int. Commun. Radiat. Units Meas. 2010, 10, 5–6. [Google Scholar]
- International Commission on Radiological Protection. Radiological protection from cosmic radiation in aviation. Ann. ICRP 2016, 45, 132. [Google Scholar]
- Beck, P.; Latocha, M.; Dorman, L.; Pelliccioni, M.; Rollet, S. Measurements and simulations of the radiation exposure to aircraft crew workplaces due to cosmic radiation in the atmosphere. Radiat. Prot. Dosim. 2007, 126, 564–567. [Google Scholar] [CrossRef]
- Meier, M.M.; Matthiä, D. A space weather index for the radiation field at aviation altitudes. J. Space Weather Space Clim. 2014, 4, A13. [Google Scholar] [CrossRef] [Green Version]
- Meier, M.M.; Copeland, K.; Kloble, K.E.J.; Matthia, D.; Plettenberg, M.C.; Schennetten, K.; Wirtz, M.; Hellweg, C.E. Radiation in the atmosphere. A hazard to aviation safety? Atmosphere 2020, 11, 1358. [Google Scholar] [CrossRef]
- Mishev, A.; Usoskin, I. Numerical model for computation of effective and ambient dose equivalent at flight altitudes. Application for dose assessment during GLEs. J. Space Weather Space Clim. 2015, 5, A10. [Google Scholar] [CrossRef] [Green Version]
- Mishev, A.; Usoskin, I.; Tuohino, S.; Ibragimov, A. The upgraded GLE database includes assessment of radiation exposure at flight altitudes. J. Phys. Conf. Ser. 2019, 1181, 012061. [Google Scholar] [CrossRef]
- Mishev, A.; Usoskin, I. Current status and possible extension of the global neutron monitor network. J. Space Weather Space Clim. 2020, 10, 17. [Google Scholar] [CrossRef]
- Flückiger, E.; Bütikofer, R. Radiation doses along selected flight profiles during two extreme solar cosmic ray events. ASTRA 2011, 7, 105–109. [Google Scholar] [CrossRef]
- Bütikofer, R.R.; Flückiger, E.O.; Desorgher, L.; Moser, M.; Pirard, B. The solar cosmic ray ground-level enhancements on 20 January 2005 and 13 December 2006. Adv. Space Res. 2009, 43, 499–503. [Google Scholar] [CrossRef]
- SIEVERT. Available online: https://www.sievert-system.org/ (accessed on 11 April 2022).
- Latocha, M.; Beck, P.; Rollet, S. AVIDOS—A software package for European accredited aviation dosimetry. Radiat. Prot. Dosim. 2009, 136, 286–290. [Google Scholar] [CrossRef]
- Mertens, C.J.; Meier, M.M.; Brown, S.; Norman, R.B.; Xu, X. NAIRAS aircraft radiation model development, dose climatology, and initial validation. Space Weather 2013, 11, 603–635. [Google Scholar] [CrossRef] [Green Version]
- Copeland, K. CARI-7A: Development and validation. Radiat. Prot. Dos. 2017, 175, 419–431. [Google Scholar] [CrossRef] [Green Version]
- Berger, T.; Meier, M.; Reitz, G.; Schridde, M. Longterm dose measurements applying a human anthropomorphic phantom onboard an aircraft. Radiat. Meas. 2008, 43, 580–584. [Google Scholar] [CrossRef]
- SPENVIS. Available online: https://www.spenvis.oma.be/ (accessed on 11 April 2022).
- Edwards, R.; Dyer, C.; Normand, E. Technical standard for atmospheric radiation single event effects, (SEE) on avionics electronics. In Proceedings of the IEEE Radiation Effects Data Workshop 2004 (IEEE Cat. No.04TH8774), Atlanta, GA, USA, 22–22 July 2004; pp. 1–5. [Google Scholar] [CrossRef]
- Leray, J.L. Effects of atmospheric neutrons on devices, at sea level and in avionics embedded systems. Microelectron. Reliab. 2007, 47, 1827–1835. [Google Scholar] [CrossRef]
- Brunetti, G.; McKenzie, I.; Dell’Olio, F.; Armenise, M.N.; Ciminelli, C. Measured radiation effects on InGaAsP/InP ring resonators for space applications. Opt. Express 2019, 27, 24434–24444. [Google Scholar] [CrossRef]
- Boscherini, M.; Adriani, O.; Bongi, M.; Bonechi, L.; Castellini, G.; D’Alessandro, R.; Gabbanini, A.; Grandi, M.; Menn, W.; Papini, P.; et al. Radiation damage of electronic components in space environment. Nucl. Instrum. Methods Phys. Res. Sect. A 2003, 514, 112–116. [Google Scholar] [CrossRef]
- Gill, K.; Cervelli, G.; Grabit, R.; Jensen, F.; Vasey, F. Radiation damage and annealing in 1310 nm InGaAsP/InP lasers for the CMS tracker. Proc. SPIE 2000, 4134, 176–184. [Google Scholar] [CrossRef] [Green Version]
- Paschalis, P.; Mavromichalaki, H.; Dorman, L.I.; Plainaki, C.; Tsirigkas, D. Geant4 software application for the simulation of cosmic ray showers in the Earth’s atmosphere. New Astron. 2014, 33, 26–37. [Google Scholar] [CrossRef]
- Tezari, A.; Paschalis, P.; Mavromichalaki, H.; Karaiskos, P.; Crosby, N.; Dierckxsens, M. Assessing Radiation Exposure Inside The Earth’s Atmosphere. Radiat. Prot. Dos. 2020, 190, 427–436. [Google Scholar] [CrossRef]
- Heck, D.; Knapp, J.; Capdevielle, J.N.; Schatz, G.; Thouw, T. CORSIKA: A Monte Carlo Code to Simulate Extensive Air Showers; FZKA 6019; Forsch: Karlsruhe, Germany, 1998. [Google Scholar]
- Fassò, A.; Ferrari, A.; Sala, P.R. Electron-Photon Transport in FLUKA: Status, Advanced Monte Carlo for Radiation Physics. In Particle Transport Simulation and Applications, Proceedings of the Monte Carlo 2000 Conference, Lisbon, Portugal, 23–26 October 2000; Springer: Berlin/Heidelberg, Germany, 2000; pp. 159–164. [Google Scholar] [CrossRef]
- Usoskin, I.G.; Alanko-Huotari, K.; Kovaltsov, G.A.; Mursula, K. Heliospheric modulation of cosmic rays: Monthly reconstruction for 1951–2004. J. Geophys. Res. 2005, 110, A12108. [Google Scholar] [CrossRef] [Green Version]
- Usoskin, I.G.; Bazilevskaya, G.A.; Kovaltsov, G.A. Solar modulation parameter for cosmic rays since 1936 reconstructed from ground-based neutron monitors and ionization chambers. J. Geophys. Res. 2011, 116, A02104. [Google Scholar] [CrossRef] [Green Version]
- Burger, R.A.; Potgieter, M.S.; Heber, B. Rigidity dependence of cosmic ray proton latitudinal gradients measured by the Ulysses spacecraft: Implication for the diffusion tensor. J. Geophys. Res. 2000, 105, 447–455. [Google Scholar] [CrossRef]
- Agostinelli, S.; Allison, J.; Amako, K.A.; Apostolakis, J.; Araujo, H.; Arce, P.; Asai, M.; Axen, D.; Banerjee, S.; Barrand, G.; et al. Geant4—A simulation toolkit. Nucl. Instrum. Methods A 2003, 506, 250–303. [Google Scholar] [CrossRef] [Green Version]
- Allison, J.; Amako, K.; Apostolakis, J.; Araujo, H.; Dubois, P.A.; Asai, M.; Barrand, G.; Capra, R.; Chauvie, S.; Chytracek, R.; et al. Geant4 developments and applications. IEEE Trans. Nucl. Sci. 2006, 53, 270–278. [Google Scholar] [CrossRef] [Green Version]
- Allison, J.; Amako, K.; Apostolakis, J.; Arce, P.; Asai, M.; Aso, T.; Bagli, E.; Bagulya, A.; Banerjee, S.; Barrand, G.; et al. Recent developments in Geant4. Nucl. Instrum. Methods A 2016, 835, 186–225. [Google Scholar] [CrossRef]
- International Commission on Radiological Protection. The Recommendations of the International Commission on Radiological Protection. Ann. ICRP 2007, 37, 103. [Google Scholar]
- ESA. ESA SSA P3 SWE-III Acceptance Test Report, R.137 Dynamic Atmospheric Tracking Interactive Model Application (DYASTIMA); ESA: Paris, France, 2019. [Google Scholar]
- ISO 2533:1975ISO; Standard Atmosphere. International Organization for Standardization: Geneva, Switzerland, 2007.
- ISO 15390:2004ISO; Space Environment (Natural and Artificial)—Galactic Cosmic Ray Model. International Organization for Standardization: Geneva, Switzerland, 2004.
- Smart, D.F.; Shea, M.A. World grid of calculated cosmic ray vertical cutoff rigidities for epoch 1995.0. In Proceedings of the 30th International Cosmic Ray Conference, Yucatán, Mexico, 3–11 July 2007. [Google Scholar]
- Smart, D.F.; Shea, M.A. World grid of calculated cosmic ray vertical cutoff rigidities for epoch 2000.0. In Proceedings of the 30th International Cosmic Ray Conference, Yucatán, Mexico, 3–11 July 2007. [Google Scholar]
- Smart, D.F.; Shea, M.A. Vertical Geomagnetic Cutoff Rigidities for Epoch 2015. In Proceedings of the 36th International Cosmic Ray Conference, Madison, WI, USA, 24 July–1 August 2019. [Google Scholar]
- Gerontidou, M.; Katzourakis, N.; Mavromichalaki, H.; Yanke, V.; Eroshenko, E. World grid of cosmic ray vertical cut-off rigidity for the last decade. Adv. Space Res. 2021, 67, 2231–2240. [Google Scholar] [CrossRef]
- Forbush, S.E. World-wide cosmic ray variations, 1937–1952. J. Geophys. Res. 1954, 54, 525. [Google Scholar] [CrossRef]
- Makrantoni, P.; Mavromichalaki, H.; Usoskin, I.G.; Papaioannou, A. Calculation of the cosmic ray induced ionization for the region of Athens. J. Phys. Conf. Ser. 2013, 409, 2232. [Google Scholar] [CrossRef] [Green Version]
- Makrantoni, P.; Mavromichalaki, H.; Paschalis, P. Solar cycle variation of the ionization by cosmic rays in the atmosphere at the mid-latitude region of Athens. Astrophys. Space Sci. 2021, 366, 70. [Google Scholar] [CrossRef]
- Tezari, A.; Paschalis, P.; Stassinakis, A.; Mavromichalaki, H.; Karaiskos, P.; Gerontidou, M.; Alexandridis, D.; Kanellakopoulos, A.; Crosby, N.; Dierckxsens, M. Radiation Exposure in the Lower Atmosphere during Different Periods of Solar Activity. Atmosphere 2022, 13, 166. [Google Scholar] [CrossRef]
- Mavromichalaki, H.; Marmatsouri, L.; Vassilaki, A. On Reproduction of Long term Cosmic-ray modulation as seen by Neutron Monitor Stations. Astrophys. Space Sci. 1995, 232, 315–326. [Google Scholar] [CrossRef]
- Dorman, L.I. Space Weather and Cosmic Ray Effects, Chapter 30. In Climate Change; Elsevier: Amsterdam, The Netherlands, 2016; pp. 513–544. [Google Scholar] [CrossRef]
- Todd, M.C.; Kniveton, D.R. Changes in cloud cover associated with Forbush decreases of galactic cosmic rays. J. Geophys. Res. 2001, 106, 32031–32042. [Google Scholar] [CrossRef]
- Usoskin, I.G.; Kovaltsov, G.A.; Mironova, I.A.; Tylka, A.J.; Dietrich, W.F. Ionization effect of solar particle GLE events in low and middle atmosphere. Atmos. Chem. Phys. 2011, 11, 1979. [Google Scholar] [CrossRef] [Green Version]
- Tobiska, W.K.; Bouwer, D.; Smart, D.; Shea, M.; Bailey, J.; Didkovsky, L.; Judge, K.; Garret, H.; Atwell, W.; Gersey, B.; et al. Global real-time dose measurements using the Automated Radiation Measurements for Aerospace Safety (ARMAS) system. Space Weather 2016, 14, 1053–1080. [Google Scholar] [CrossRef] [Green Version]


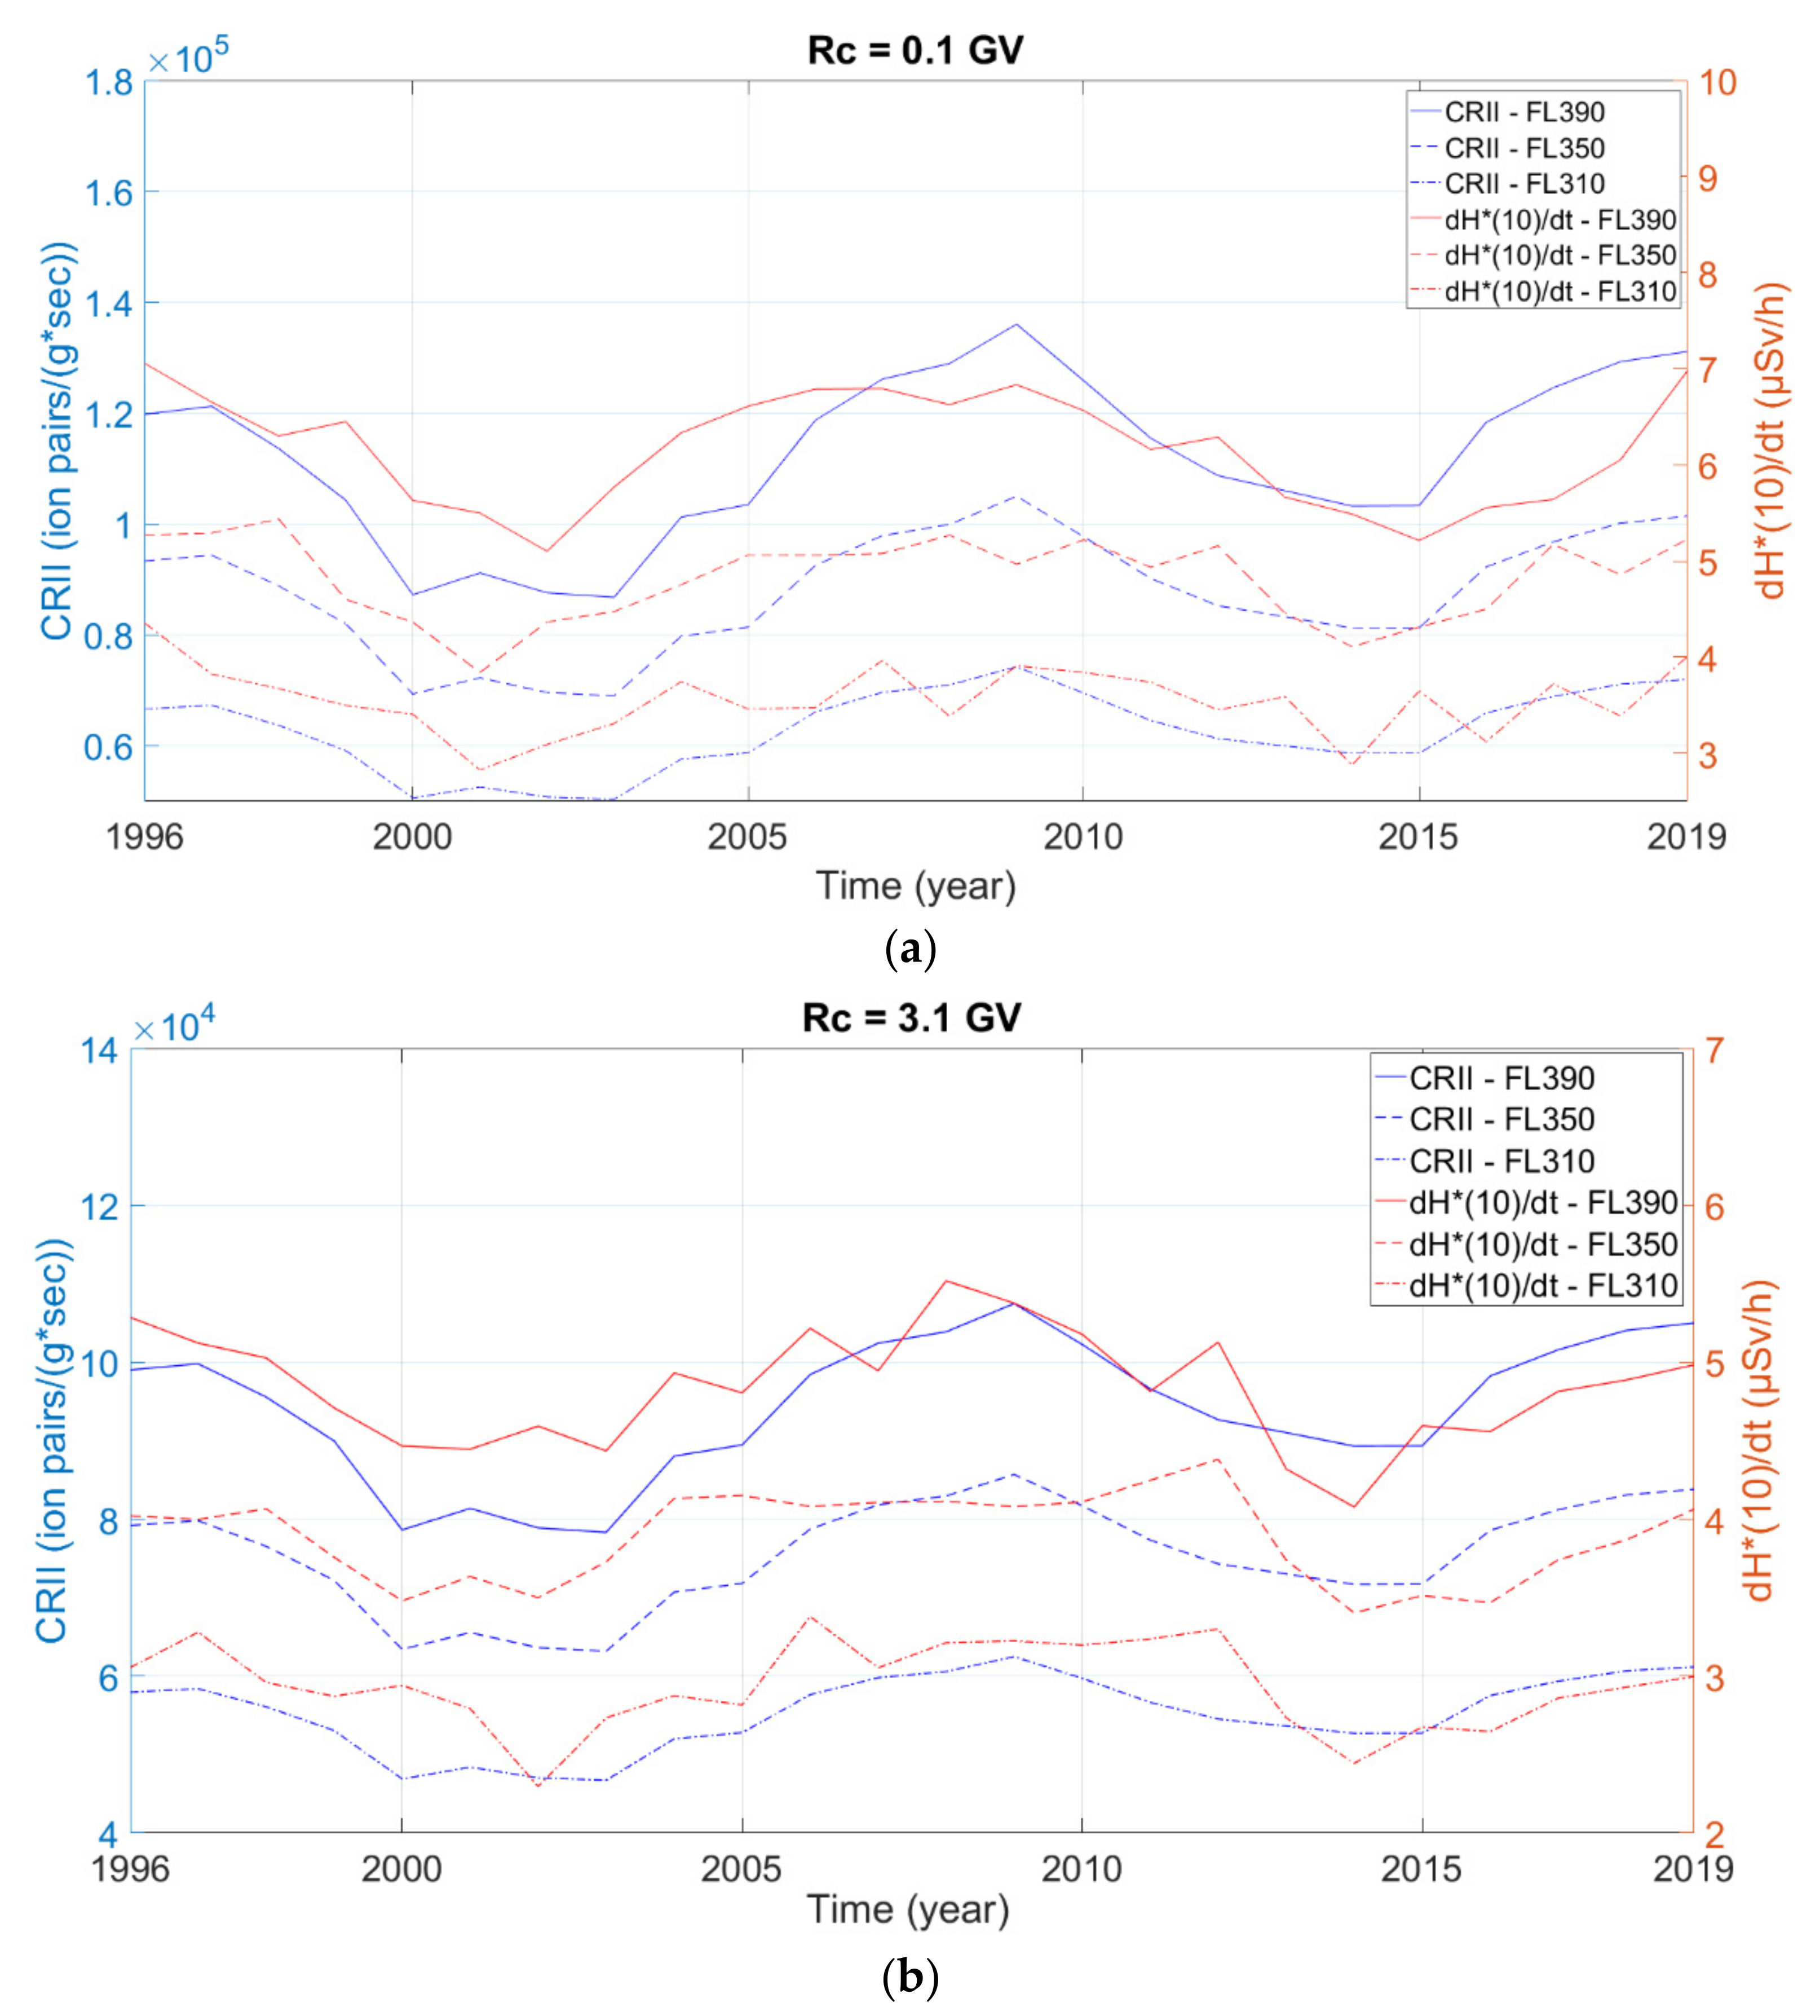
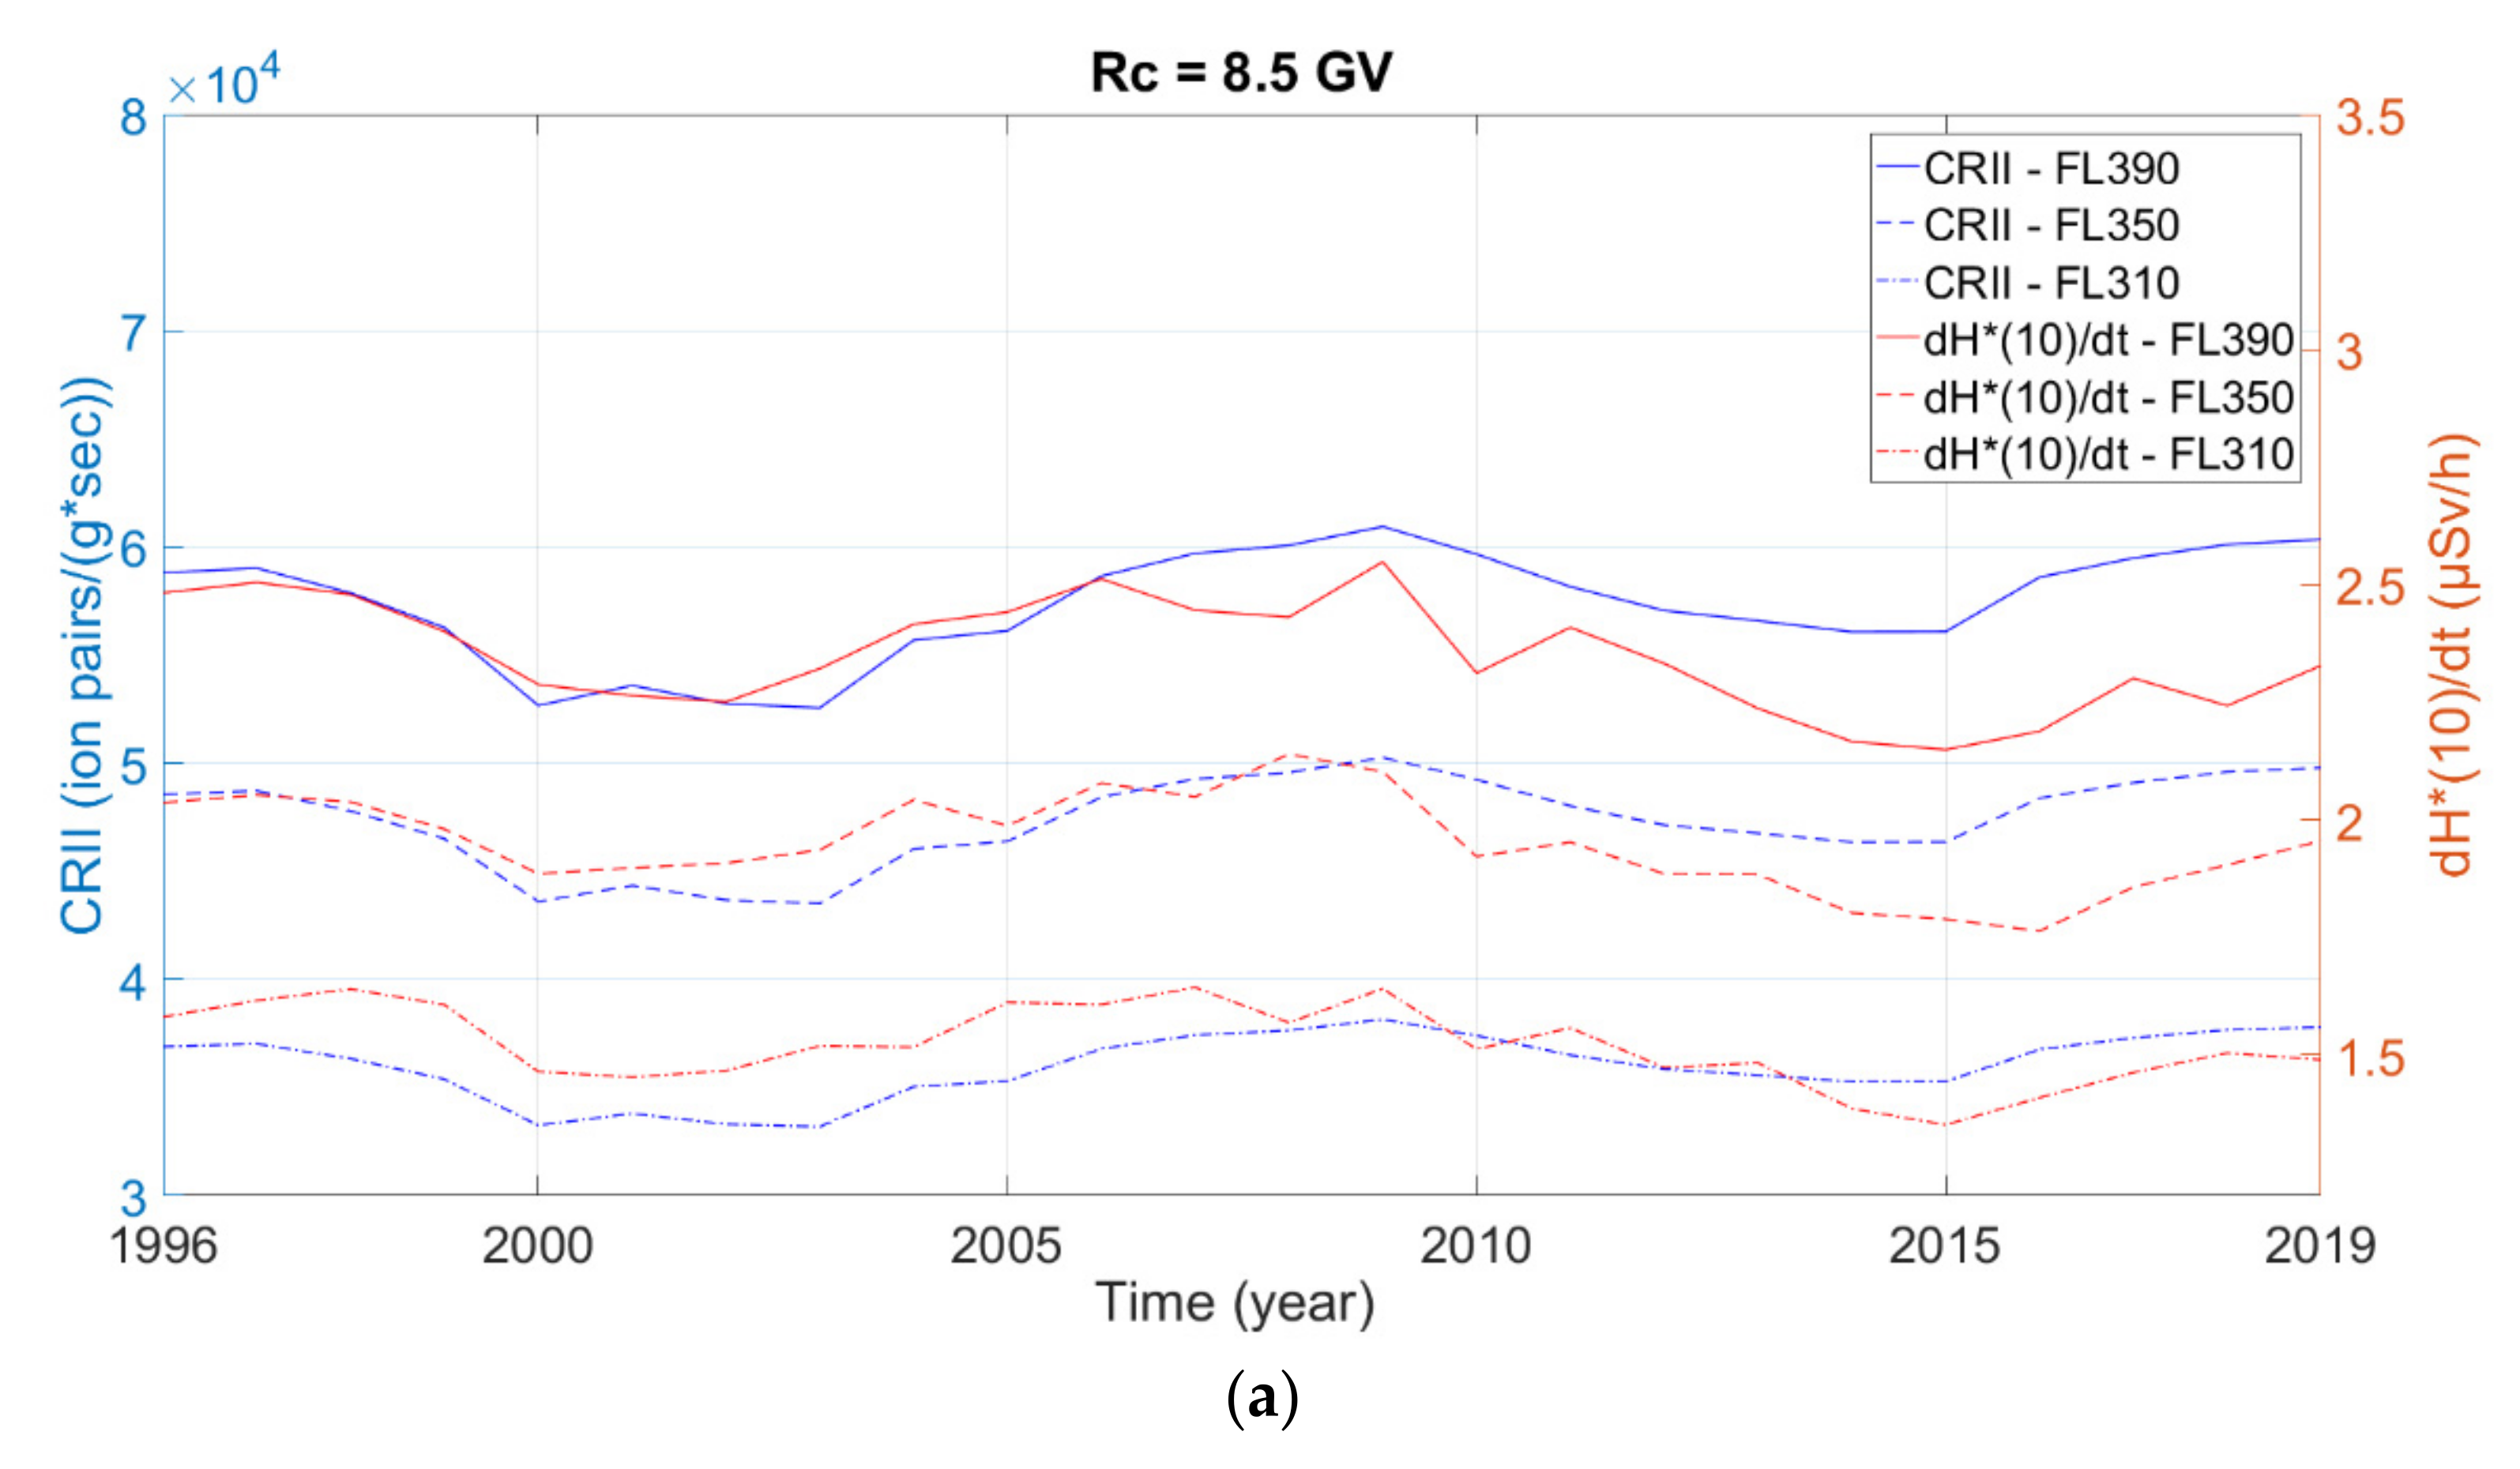
| YEARS | CRII (Ion Pairs/(g*s)) | dH*(10)/dt (μSv/h) | ||
|---|---|---|---|---|
| Minimum Values ×104 | Maximum Values ×104 | Minimum Values | Maximum Values | |
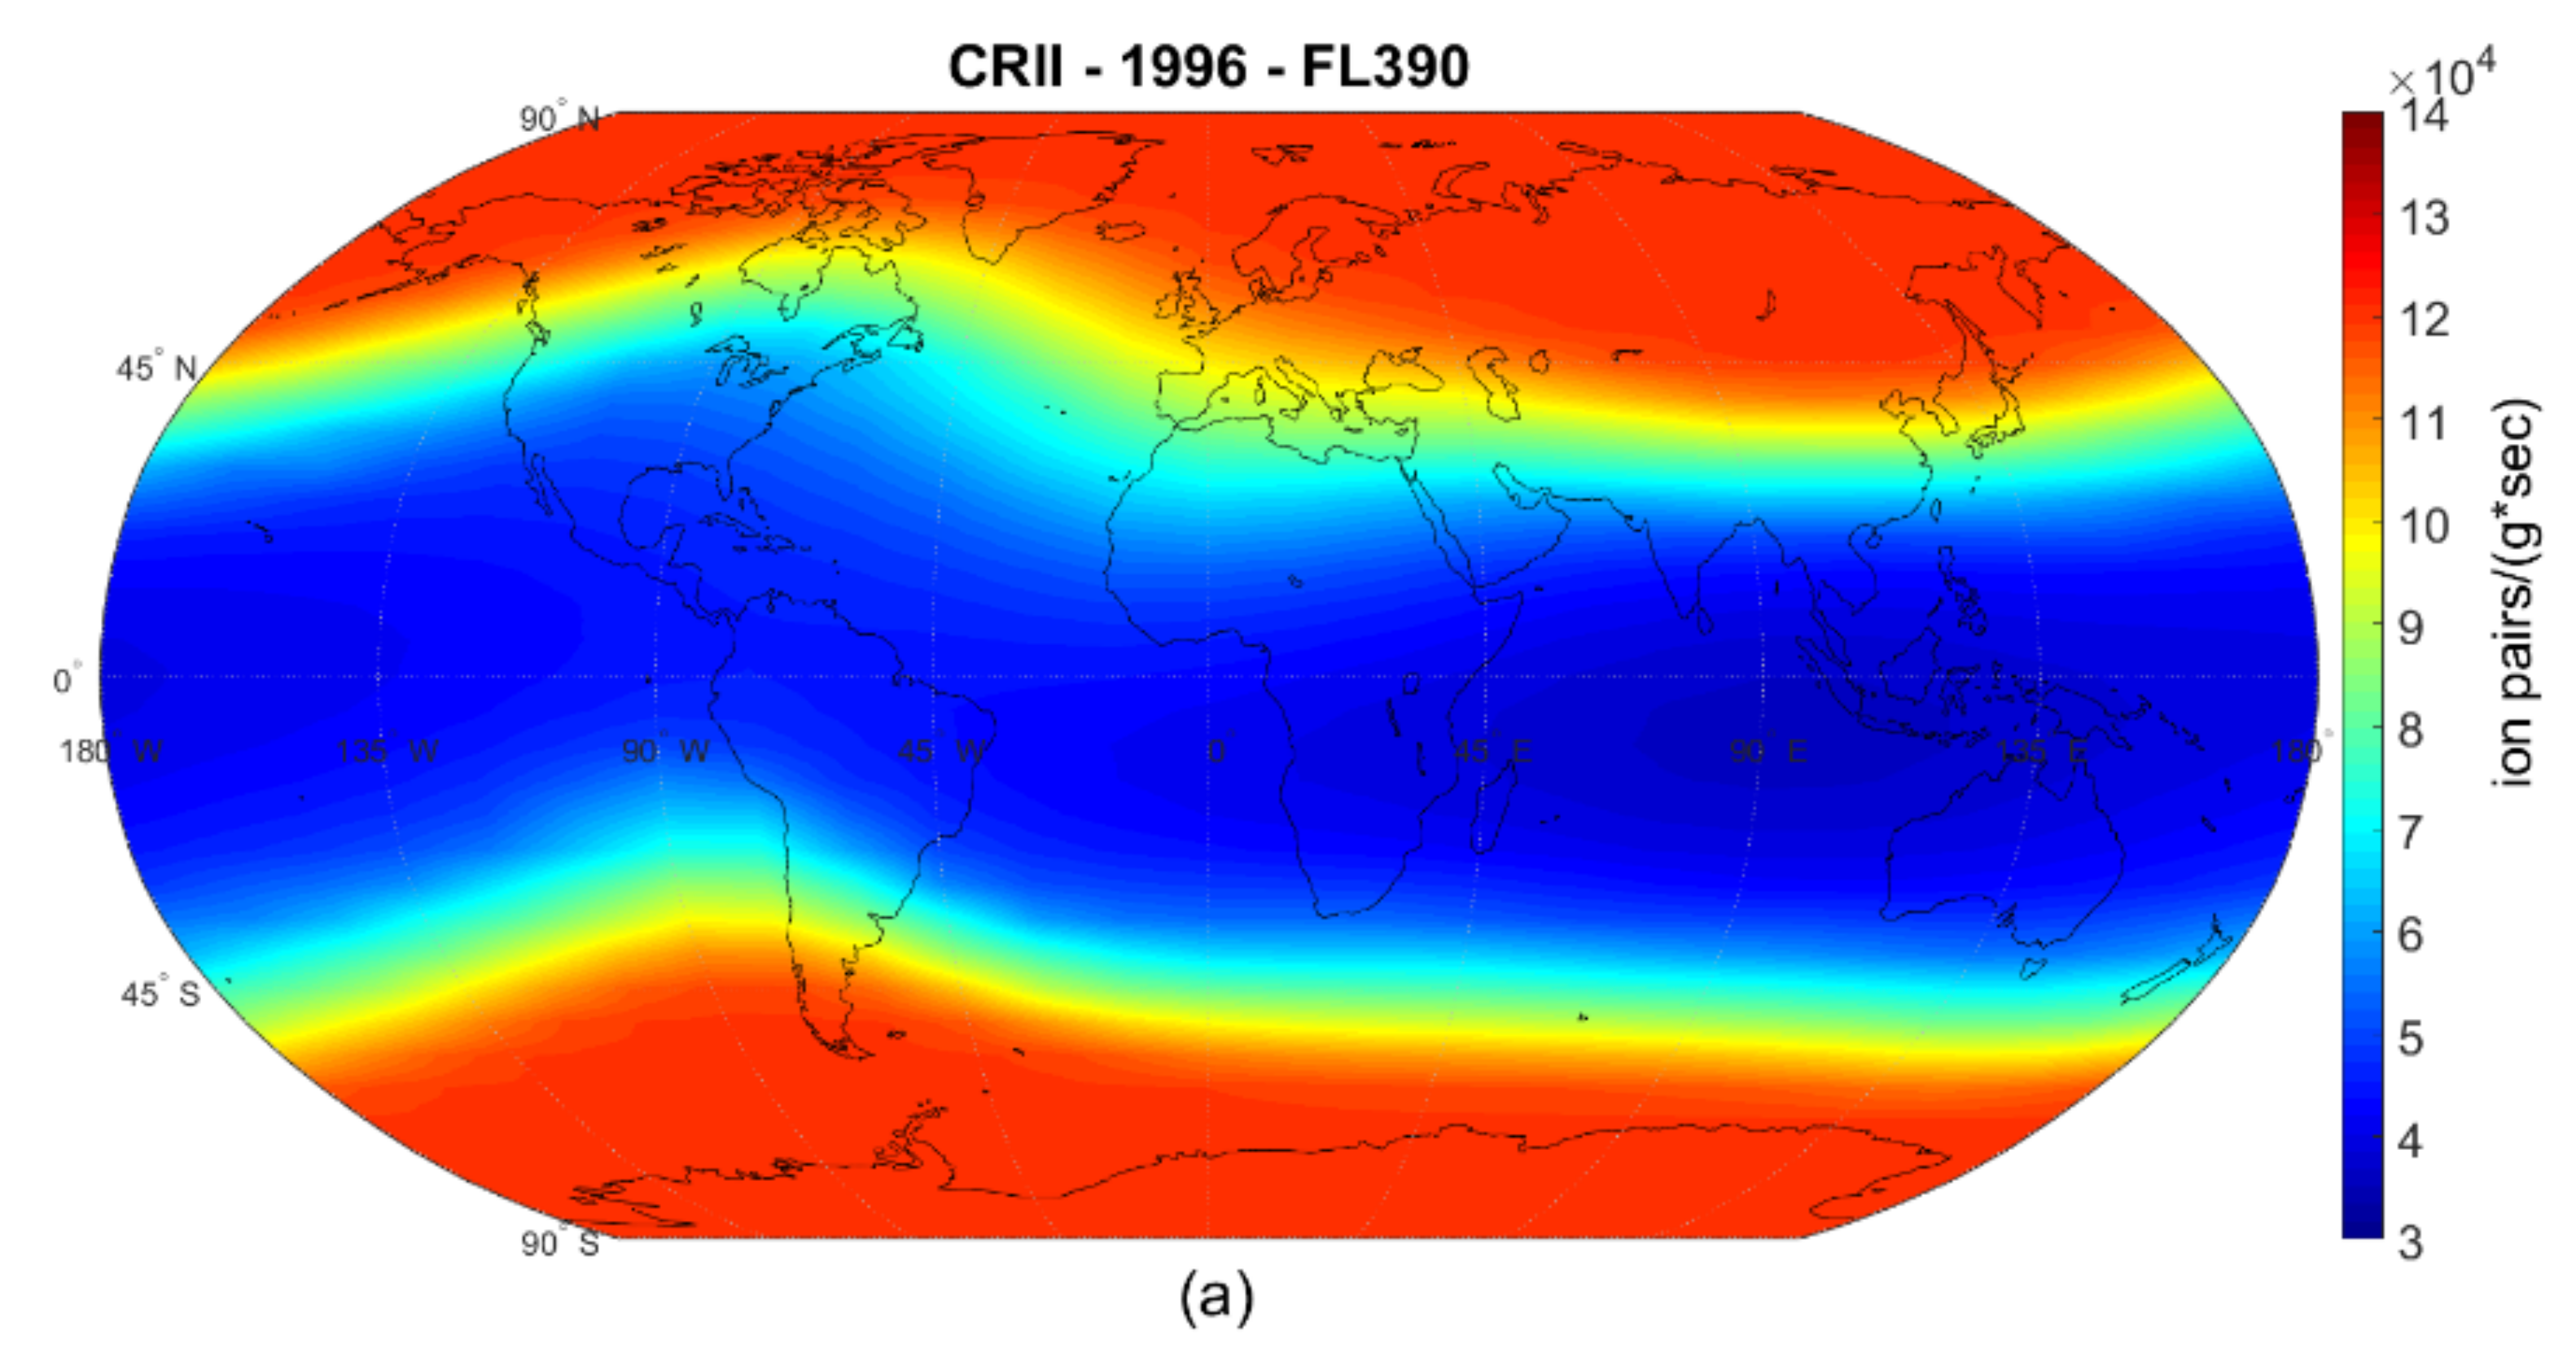
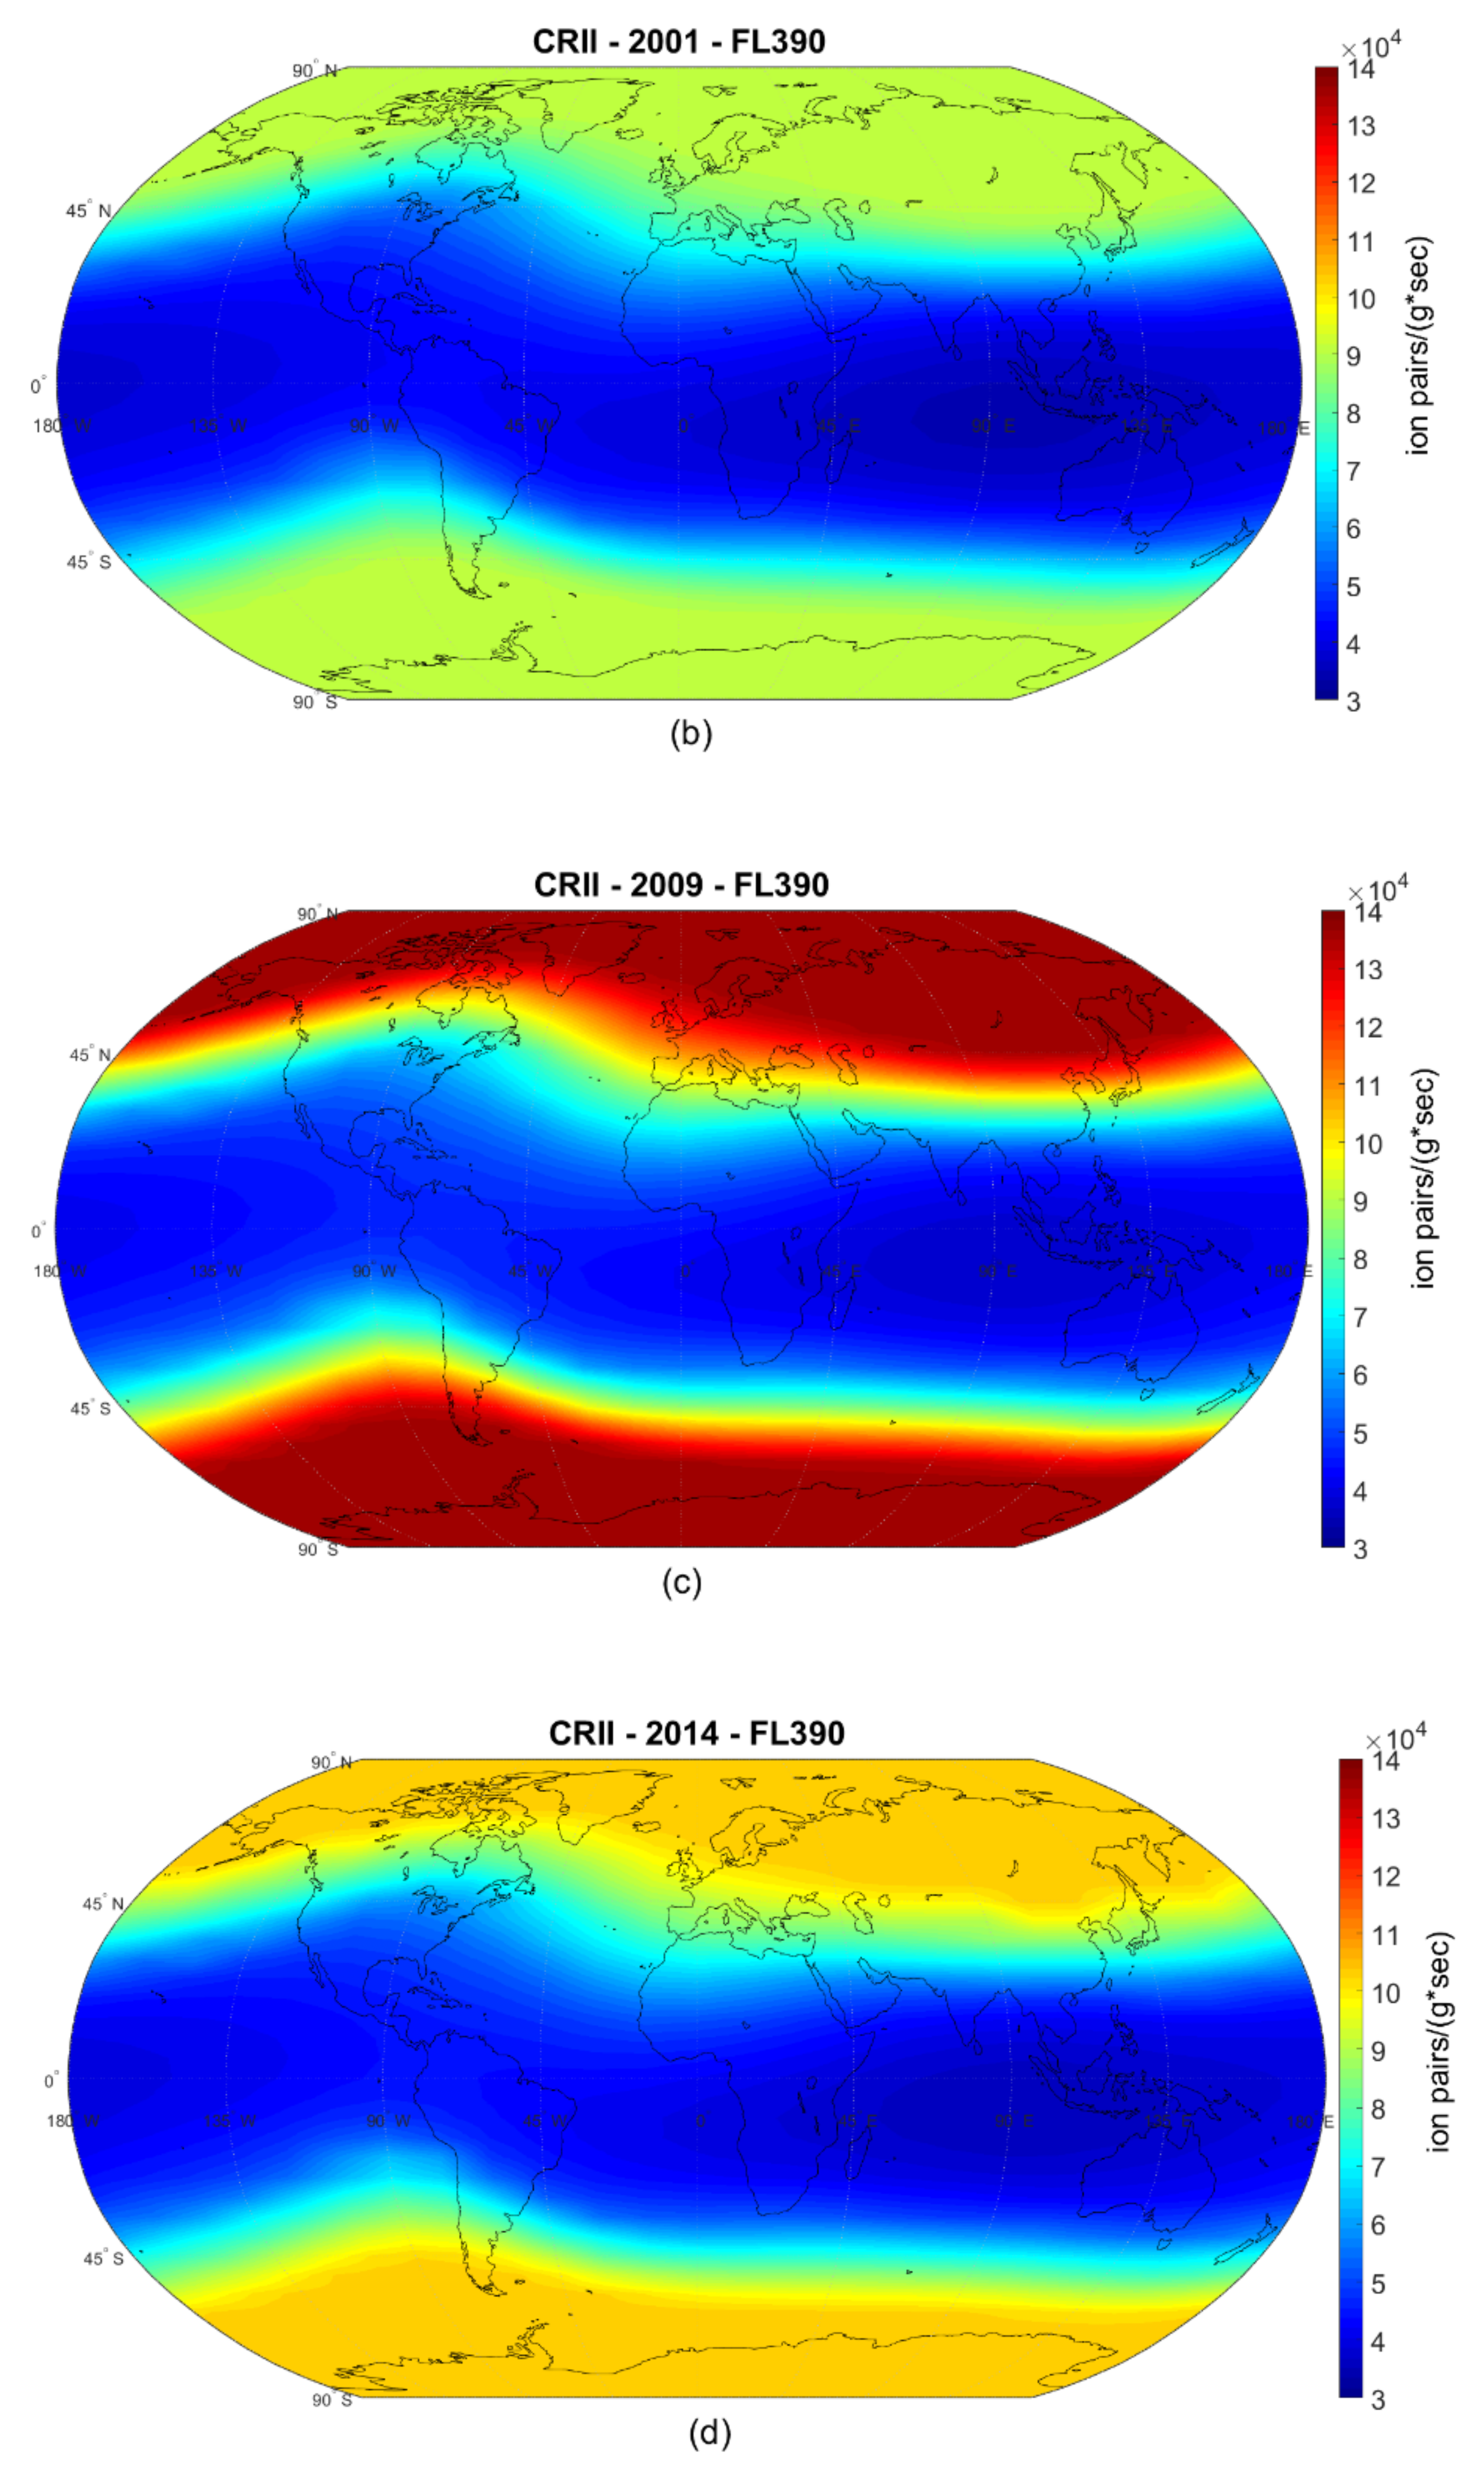
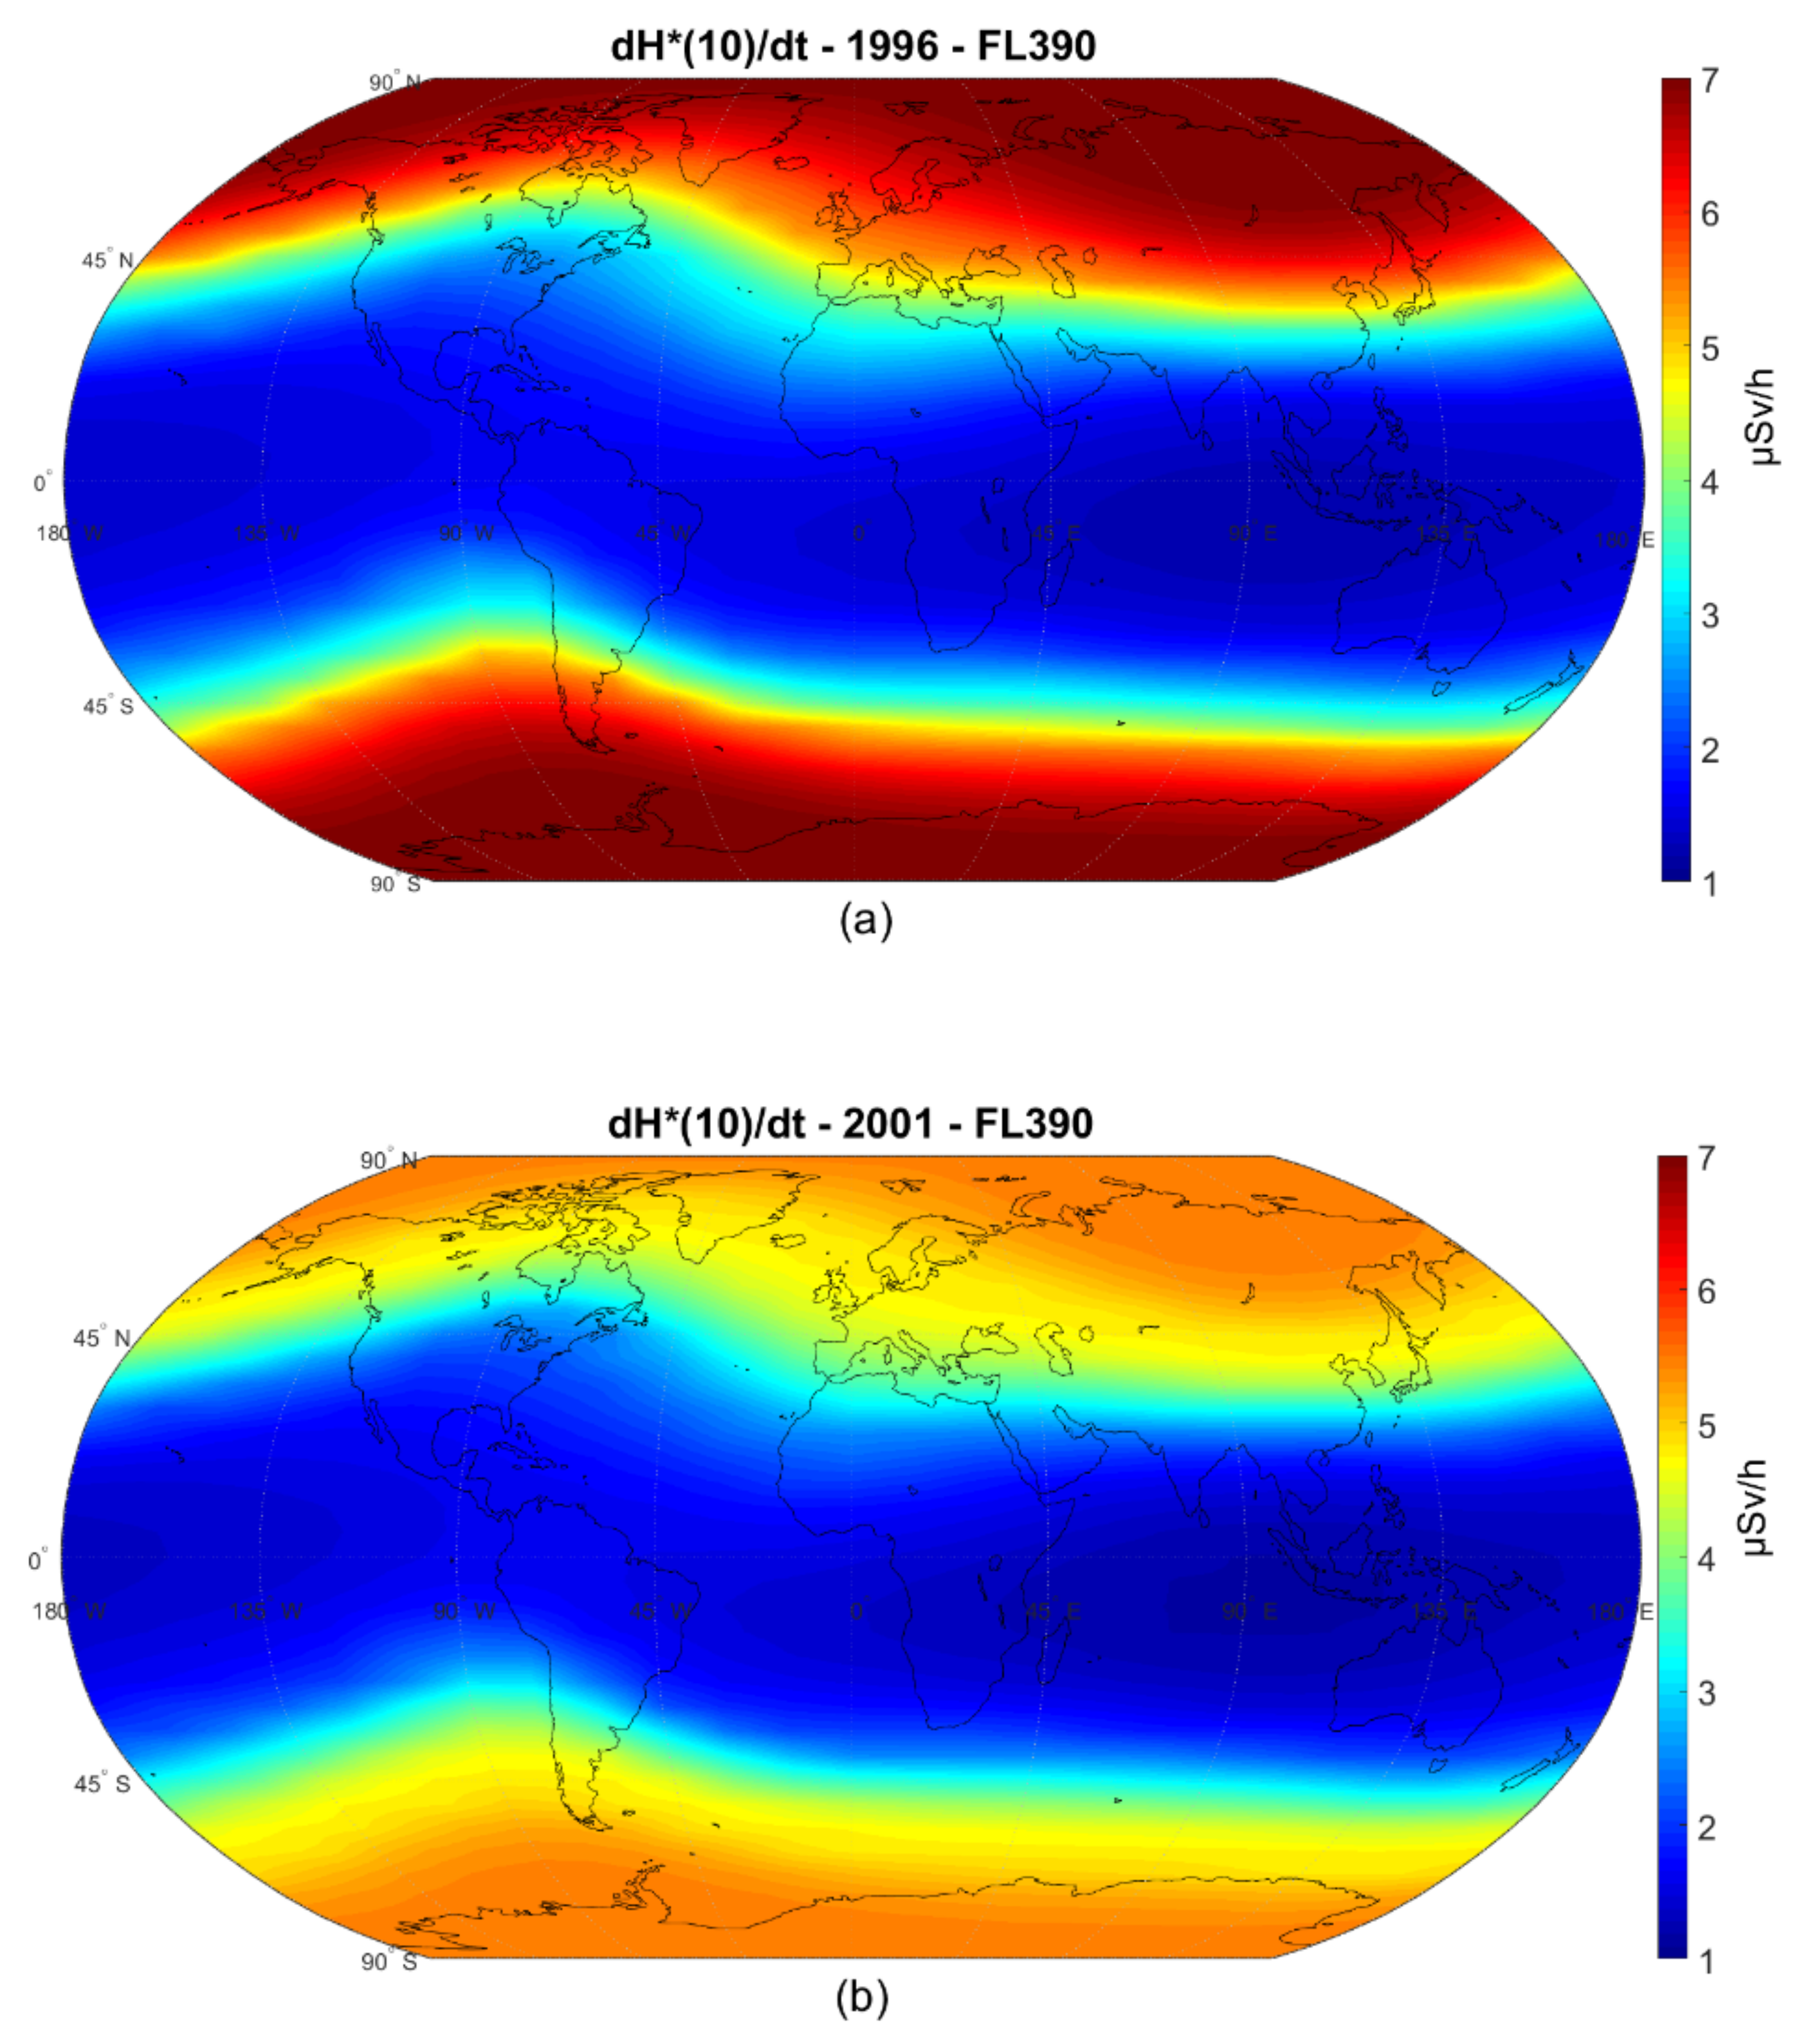
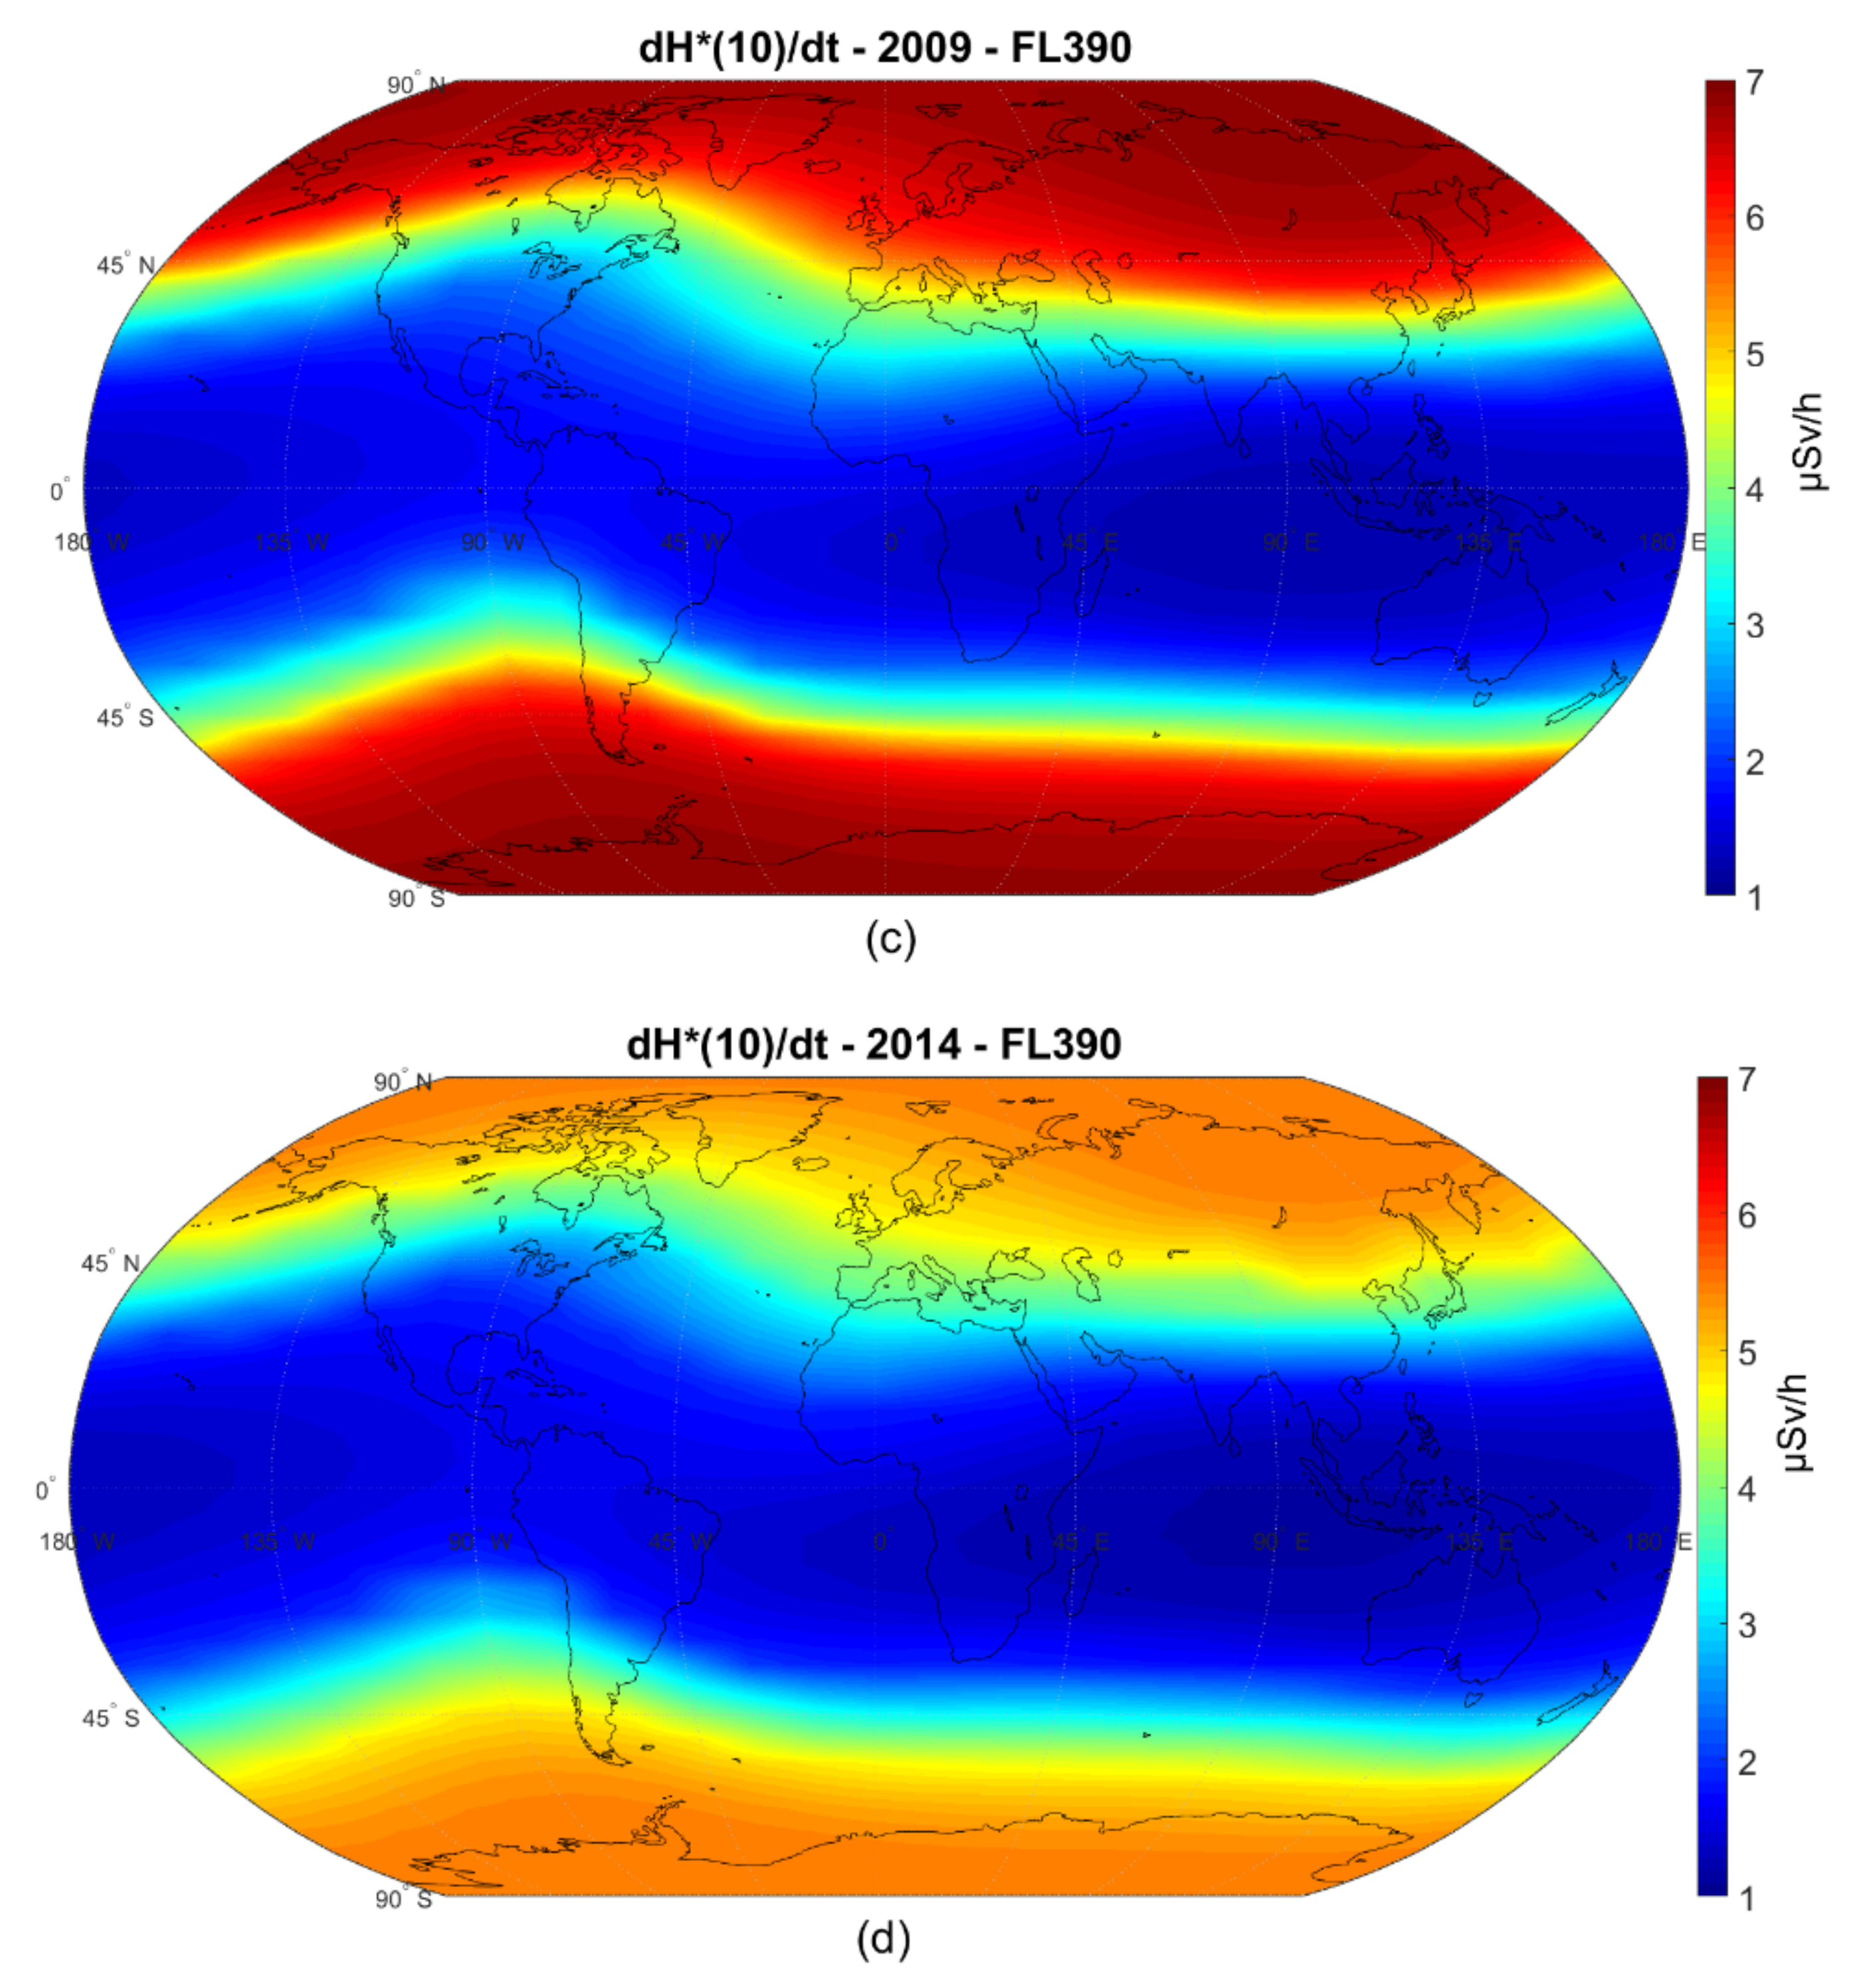
| 1996 (SC23 min) | 3.6 | 12.0 | 1.22 | 6.83 |
| 2009 (SC24 min) | 3.7 | 13.6 | 1.24 | 7.05 |
| 2001 (SC23 max) | 3.4 | 9.1 | 1.18 | 5.49 |
| 2014 (SC24 max) | 3.5 | 11.0 | 1.19 | 5.50 |
Publisher’s Note: MDPI stays neutral with regard to jurisdictional claims in published maps and institutional affiliations. |
© 2022 by the authors. Licensee MDPI, Basel, Switzerland. This article is an open access article distributed under the terms and conditions of the Creative Commons Attribution (CC BY) license (https://creativecommons.org/licenses/by/4.0/).
Share and Cite
Makrantoni, P.; Tezari, A.; Stassinakis, A.N.; Paschalis, P.; Gerontidou, M.; Karaiskos, P.; Georgakilas, A.G.; Mavromichalaki, H.; Usoskin, I.G.; Crosby, N.; et al. Estimation of Cosmic-Ray-Induced Atmospheric Ionization and Radiation at Commercial Aviation Flight Altitudes. Appl. Sci. 2022, 12, 5297. https://0-doi-org.brum.beds.ac.uk/10.3390/app12115297
Makrantoni P, Tezari A, Stassinakis AN, Paschalis P, Gerontidou M, Karaiskos P, Georgakilas AG, Mavromichalaki H, Usoskin IG, Crosby N, et al. Estimation of Cosmic-Ray-Induced Atmospheric Ionization and Radiation at Commercial Aviation Flight Altitudes. Applied Sciences. 2022; 12(11):5297. https://0-doi-org.brum.beds.ac.uk/10.3390/app12115297
Chicago/Turabian StyleMakrantoni, Panagiota, Anastasia Tezari, Argyris N. Stassinakis, Pavlos Paschalis, Maria Gerontidou, Pantelis Karaiskos, Alexandros G. Georgakilas, Helen Mavromichalaki, Ilya G. Usoskin, Norma Crosby, and et al. 2022. "Estimation of Cosmic-Ray-Induced Atmospheric Ionization and Radiation at Commercial Aviation Flight Altitudes" Applied Sciences 12, no. 11: 5297. https://0-doi-org.brum.beds.ac.uk/10.3390/app12115297