
A Novel Brain Tumor Detection and Coloring Technique from 2D MRI Images


1
School of Information Engineering, Zhengzhou University, Zhengzhou 450001, China
2
Faculty of Pharmacy and Health Sciences, University of Baluchistan, Quetta 87300, Pakistan
3
Department of Computer Science, Virtual University, Islamabad 04403, Pakistan
4
Department of Computer Science and Software Engineering, Islamic International University, Islamabad 04403, Pakistan
5
School of Pharmaceutical Sciences, Zhengzhou University, Zhengzhou 450001, China
*
Author to whom correspondence should be addressed.
Appl. Sci. 2022, 12(11), 5744; https://0-doi-org.brum.beds.ac.uk/10.3390/app12115744
Submission received: 10 May 2022
/
Revised: 26 May 2022
/
Accepted: 3 June 2022
/
Published: 6 June 2022
(This article belongs to the Section Computing and Artificial Intelligence)
Abstract
:The early automated identification of brain tumors is a difficult task in MRI images. For a long time, continuous research efforts have floated a new idea of replacing different grayscale anatomic regions of diagnostic images with appropriate colors that could overcome the problems being faced by radiologists. The colorization of grayscale images is challenging for enhancing various regions’ contrasts by transforming grayscale images into high-contrast color images. This study investigates standard solutions in discriminating between normal and abnormal regions by assigning colors to grayscale human brain MR images to differentiate different kinds of tissues. The proposed approach is influenced by connected component and index-based colorization methods for applying colors to different regions and abnormal areas. It is an automated approach that varies its inputs using luminance and pixel matrix values and provides the possible outcome. After segmentation, a specific algorithm is devised to colorize the region-of-interest (ROI) areas, which distinguishes and applies colors to differentiate the regions. Results show that implementing the watershed-based area segmentation method and ROI selection method based on the morphological operation helps identify tissues during processing. Moreover, the colorization approach based on luminance and pixel matrix after segmentation and ROI selection is beneficial due to better PSNR and SSIM values and visible contrast improvement. Our proposed algorithm works with less processing overhead and uses less time than those of the industry’s previously used color transfer method.
1. Introduction
A brain tumor is a malignant disease with a high mortality ratio, occurring when one or more tissues in the brain become malignant and start growing unusually. Moreover, it disturbs the brain’s normal function and other neighboring tissues. The detection of tumors depends on the size and position of the malignant tissue.
Our problem statement is that the automated identification of brain tumors at an early stage is a difficult task in MRI images. Continuous research efforts floated the new idea of replacing the different grayscale anatomic regions of diagnostic images with appropriate colors, which might overcome radiologists’ problems. The coloring technique facilitates further radiologist accuracy and validity in brain tumor detection.
Many researchers have worked to detect and segment brain tumor cells from normal cells using different techniques. The gap in the work of previous authors is whether they applied machine-learning algorithms or only watershed algorithms for segmentation. In this research, we develop a fully automated method to perform skull removal from brain images, the binarization of grayscale images, normalization, and image enhancement before segmenting normal and abnormal cells and achieving better colorization of tumor cells. That is the difference between our work and the work of previous researchers. Moreover, our proposed algorithm works with less processing overhead and uses less time than those of the industry’s previously used color transfer methods. Our proposed approach is influenced by connected component and index-based colorization methods for applying colors to different regions and abnormal areas. This automated approach varies its inputs using luminance and pixel matrix values and provides the possible outcome. After segmentation, a specific algorithm was devised to colorize the region-of-interest (ROI) areas, which distinguishes and applies colors to differentiate the regions. Results show that implementing the watershed-based area segmentation method and ROI selection method based on the morphological operation helps identify tissues during processing. Moreover, the colorization approach based on luminance and the pixel matrix after segmentation and ROI selection are beneficial due to better PSNR and SSIM values and visible contrast improvement.
Our objective is to investigate standard solutions in discriminating between normal and abnormal regions by assigning colors to grayscale human brain MR images to differentiate different kinds of tissues. Our proposed solution to the problem of the detection and segmentation of brain tumors in MRI images through the colorization approach is immensely important because it provides the accurate and certain diagnosis and detection of cancer tumors.
The diagnosis of brain tumors is established with a neurological examination of brain tissues [1]. The examination is based on the careful observation of muscle movement and strength, a reflexive and radiological examination of the brain tissues. These examinations are performed with the use of medical imaging methods. These techniques include the computed tomography scan (CT), magnetic resonance imaging technique (MRI), and positron emission tomography (PET) [2]. The growth and pressure of growing tissue also damage vital tissues of the brain that also need to be detected by medical imaging. One of the main issue types is water accumulation in the brain that is caused due to the tumor and results in the circulation of cerebrospinal fluid. The growth of tumors also increases symptoms. The primary symptoms are headaches, hearing problems, loss of smell, skull swelling, and sensational loss of vision problems. Moreover, it can also cause insomnia, memory disorders, and speaking power reduction in the patient.
Colorization is a computerized process that helps medical images convert grayscale images, pictures, and videos into color versions [3,4]. In clinical settings and medical environments, colorization plays a vital role in identifying pathological areas in medical images. Colors are used to teach medical anatomy [5]. It is an increasingly popular area of interest due to its formal academic context in medical images in different fields such as plastic surgery, nuclear medicine, dermatology, and pathology. It marks a tumor to distinguish between benign and malevolent tissue, which is analyzed based on colors [6]. Colorization aims to present knowledge concerning the significance of color quality assurance [7]. Color standardization and consistency in medical imaging play a decisive role in diagnostics [8]. Color and texture provide considerable information for diagnosis. While treating tumors in patients, especially cancerous ones, identifying the exact size and shape of the tumor at the initial stage is very difficult and critical. MR image slices can range from ten to a hundred; thus, it is a difficult task for radiologists to manually extract or segment these tumor regions. An adjacent anatomical structure in MR images improves color contrast by colorization. An effective and quick segmentation solution is the main target that is used in the clinical environment and surgery [9]. Grayscale images are taken as input and then scaled to colorization to differentiate between malignant and normal tissues. Introducing colors in medical images greatly helps in discriminating between normal and pathological tissues. Colored medical images can identify pathological regions [7,10].
It is challenging to differentiate tissues in grayscale brain images. Therefore, the automatic coloring and differentiation of malignant tissues benefit medical service providers. This study focuses on the colorization of brain images to help in identifying brain tissues. Moreover, this helps in differentiating between normal and malignant tissue. The advantage of this proposed method is identifying and differentiating tissues at an early stage of the pathological disease, which is difficult in the grayscale medical imaging of brain tissues.
1.1. Approaches to Tumor Detection
1.1.1. Magnetic Resonance Imaging
Magnetic resonance imaging (MRI) is a noninvasive examination to diagnose the different types of brain tumors. These scans use attractive fields and radio frequencies rather than X-rays and computers to create complete pictures of the brain’s soft tissue. A 3-dimensional visual slice of the brain is taken from the coronal axial and sagittal directions in the MRI test. A contrast dye is used to improve the scanned image [11].
1.1.2. Positron Emission Tomography
Positron emission tomography (PET) is valid for diagnosing primary brain tumors. A PET scan detects changes in cells as they grow. Radioactive glucose is injected in a minimal amount compared with standard brain parts. Tumor cells absorb a specified amount of radioactive glucose depending on the tumor’s grade. A PET scan can help determine the grade and severity of a tumor [12].
1.1.3. Functional Magnetic Resonance Imaging
Functional magnetic resonance imaging (fMRI) is a method for determining which portion of the brain is responsible for a specific function [13,14]. FMRI can focus on brain activity changes in regions as small as one cubic millimeter using the most powerful magnets. Because it is noninvasive, a significant advantage of MRI is that it can be readily used on human subjects. FMRI allows patients to perform routine tasks during the scan. Unlike X-rays, computed tomography (CT), and positron emission tomography (PET) scans, fMRI does not involve radiation exposure. If appropriately performed, fMRI presents no dangers. It is safe, noninvasive, and effective in assessing brain function [15].
1.1.4. Magnetic Resonance Spectroscopy (MRS) Scans
Magnetic resonance spectroscopy (MRS) is another noninvasive technology that can detect chemical abnormalities in body tissues. It can assess disorders such as brain issues, multiple sclerosis, Alzheimer’s disease, tumors, and scarring after radiation. It shows some points of the brain tumors that are not clear on MRI scans. MRS is like MRI, and the only difference is that it shows function instead of structure [16].
1.1.5. Biopsy
In some cases, diagnosis cannot happen through scans. A biopsy is performed to conclude the type of tumor [17]. A biopsy is a surgical process to eradicate a small tumor for examination. A tiny tissue sample is taken and examined under the microscope by a doctor. A biopsy can be performed as a separate spinal biopsy process with a small hole drilled in the skull [18].
1.1.6. Diffusion Tensor Imaging
Diffusion tensor imaging (DTI) is an MRI method that employs anisotropic diffusion to determine the brain’s axonal (white-matter) architecture. Brain pathways may be analyzed with fiber tractography (FT), a 3D reconstruction approach that uses data from DTI. Diffusion tensor imaging (DTI) is used to estimate the location and anisotropy of the brain’s white-matter tracts. This approach gives a detailed image of the brain’s structure and is used to assess changes over time. This scan allows for surgical treatment by visualizing the brain’s circuitry for surgery [19].
1.2. Related Works
Anat. Levin et al. reported a colorization approach using an optimization technique to color available grayscale images. This approach is automated and does not need operator involvement. In this YUV color space used for applying colors, they colorized images and movie clips. They considered pixels to be a neighborhood that was timewise adjacent to space. This approach did not require precise segmentation and user interaction [20]. Jacob and Gupta proposed a semiautomated color-transfer approach to convert grayscale images and videos into colored versions. The proposed method was applied to still images and videos and compared with the automated segmentation method. This method requires human interaction, where a user indicates the desired “color marker” to each region. However, the automated segmentation method did not detect exact boundaries and tedious tasks [21]. Dhaniya et al. used pivoting, editing, zooming, and CLACHE evening out to maximize the available data. The use of k implies bunching, brain tumors were separated, and component foci were gathered. Support vector machine classifier (SVM) image order computation aids in accurately recognizing a tumor in its early stages. Their work demonstrated how to combine essential k implies grouping with dropout arrangement and SVM information contention to create a new viewpoint in the field of picture order, which was extensively studied [22].
Blasi and Reforgiato proposed a technique used for colorization by transferring color from a source image to an image [23]. The proposed method was inspired by the algorithm of Welsh et al. and worked based on the similarity image enhancing technique. The critical feature of this new technique was the adaption of efficient data and large data structures to retrieve “color words” from a vast vocabulary. This approach does not work on nonhomogeneous images [24]. T. Tan et al. discussed the colorization of CT brain images. They introduced a technique based on a histogram to enhance the visualization of brain tumors to minimize human error. The pseudo-coloring method was used to color the abnormal regions of a brain, such as a tumor or an injury. The technique improved accuracy and time by 13.3% and 21.6%, respectively [25]. A. A. shah et al. proposed a colorization approach to grayscale medical images using user interaction to convert grayscale medical images into colored images and then convert the colored images again into grayscale images. Their presented method was applied to 40 X-ray, dental, and MRI images. This methodology does not work on CT images [26]. Attique et al. discussed the two methods to increase the discrimination between normal and abnormal tissues using CIELAB color and space. The second method automatically segmented the three regions of a T2 brain MR image by using the approach of auto centroid selection. The auto centroid segmentation method efficiently separates gray and white matter, and cerebrospinal fluid (CSF). The proposed method achieved better segment results when compared with watershed and Gaussian classifier segmentation methods [27]. Lagodzinski and Smolka used morphological distance transformation to assign colors using scribbling techniques on different medical images.
Colors were automatically propagated in the different regions of brain MR images by following standard distance transform, hybrid distance transform, and color blending steps. The key feature was the preservation of the intensity of the original image. However, this method was unsuitable for coloring the available images [28]. Zhao Yuanmeng et al. first selected an appropriate chromatic image for reference to colorize images. The grayscale and colored (reference) image was converted into a lαβ color space. Then, the best matching chromatic pixel for each pixel of the grayscale image was selected after this chromatic value had been transformed from the best matching reference pixel to the corresponding grayscale pixel. This is a complicated technique and not valuable in coloring available tumor images [29]. Popowicz and Smolka used the isoline concept of a geographical map and a distance map between grayscale pixels and the colored regions scribbled by the user. The method is efficient because accuracy is maintained without losing any information. The accuracy of the proposed algorithm is 100%, but the drawback of this approach is that a reference image is required [30].
Martinez-Escobar et al. suggested three steps: colorization, segmentation, and postprocessing, with a region growing technique to segment the tumor region. This method for coloring medical images is beneficial and supportive [31]. Yogesh Rathore et al. proposed a fully automated approach. The steps in this approach are creating an image database, converting the reference images into a lab color space, creating a histogram and signature, and saving the images with a signature in the database. This approach achieves better results, and the quality may be improved in the future by using more color transfer techniques [32]. Z. Cheng et al. discussed a fully computerized approach with a perfect patch match technique to color grayscale images without user interaction. The proposed method uses a neural network to train on a large number of images to remove the burden from the user. It requires a vast database, which is possible for authentic images, but impossible for synthetic images. This method is better than traditional methods [33]. Michal Kawulok et al. reported a colorization approach for scribble images using textural features instead of luminance and gradient values. Textural features were accessed using linear discriminative analysis (LDA). This technique works well but achieves poor results for region boundaries due to the large kernel size [34]. Li B. et al. presented a technique based on deep learning to extract engraved areas from a stela’s 3D scanned mesh. First, the mesh’s unequal distribution of vertices was modified using a mesh subdivision method, resulting in a mesh with evenly distributed vertices. The subdivided mesh was then used to extract surface characteristics (depth, concave features, and local surface features). In experiments, the authors demonstrated that the suggested approach efficiently removes engraved portions of inscriptions from a stela’s rough surface. It is resilient to noisy and severely abraded characters. The suggested technique of the authors surpassed the other best method by 2.95%, 3.65%, and 7.53% in terms of F1 score, IoU, and SIRI, respectively [35].
Kawulok et al. suggested a colorization approach based on an extreme example picture and used a new locality consistent sparse representation. Their system automatically colorizes the target grayscale image by sparse pursuit after providing a single reference color image. The approach acts at the superpixel level for efficiency and durability. Each superpixel’s descriptor is composed of minor intensity characteristics, midlevel texture features, and significant semantic features, which are then concatenated. Their experimental results showed that aesthetically and numerically, their colorization approach surpassed the latest methods [36]. R.jayadevan et al. presented several pseudo-coloring techniques to convert grayscale images into colored versions. User interactive (ICT), semiautomated (CTGI, PHI), and fully automated (CTTS, CGFA, FDPC) pseudo-coloring techniques were discussed, and comparisons were drawn among them. Results showed that PHI was better than the CTGI method (semiautomated). PDPC achieved excellent and superior results to CTTS and CGFA (fully automated) [37]. Liu and Zhang proposed an automated colorization approach. However, a source image is required to provide color information on the luminance histogram of grayscale and color images. Then, the zero point is found to calculate the average color from the source image. The mapping between luminance color and target image generates the colorization results. The purposed method works well on both normal and noisy images, but a large number of texture parameters are required to perform colorization [38]. A. Bugeau and V.T. Ta reported a patch base colorization approach using reference images and a distance selection framework for color prediction. This method converts from the RGB to the YUV color space because lαβ gives visually inconsistent results. Color is transferred to grayscale images using luminance features. Then, the distance selection framework and color prediction are performed, and total variation on the output images is applied to smoothen the colorization results [39].
2. Materials and Methods
2.1. Brain Image Dataset
Two different datasets were used during this study for experimental purposes and result comparison:
- BVH (Bahawal Victoria Hospital) brain MR images dataset;
- RIDER Neuro MRI imaging dataset.
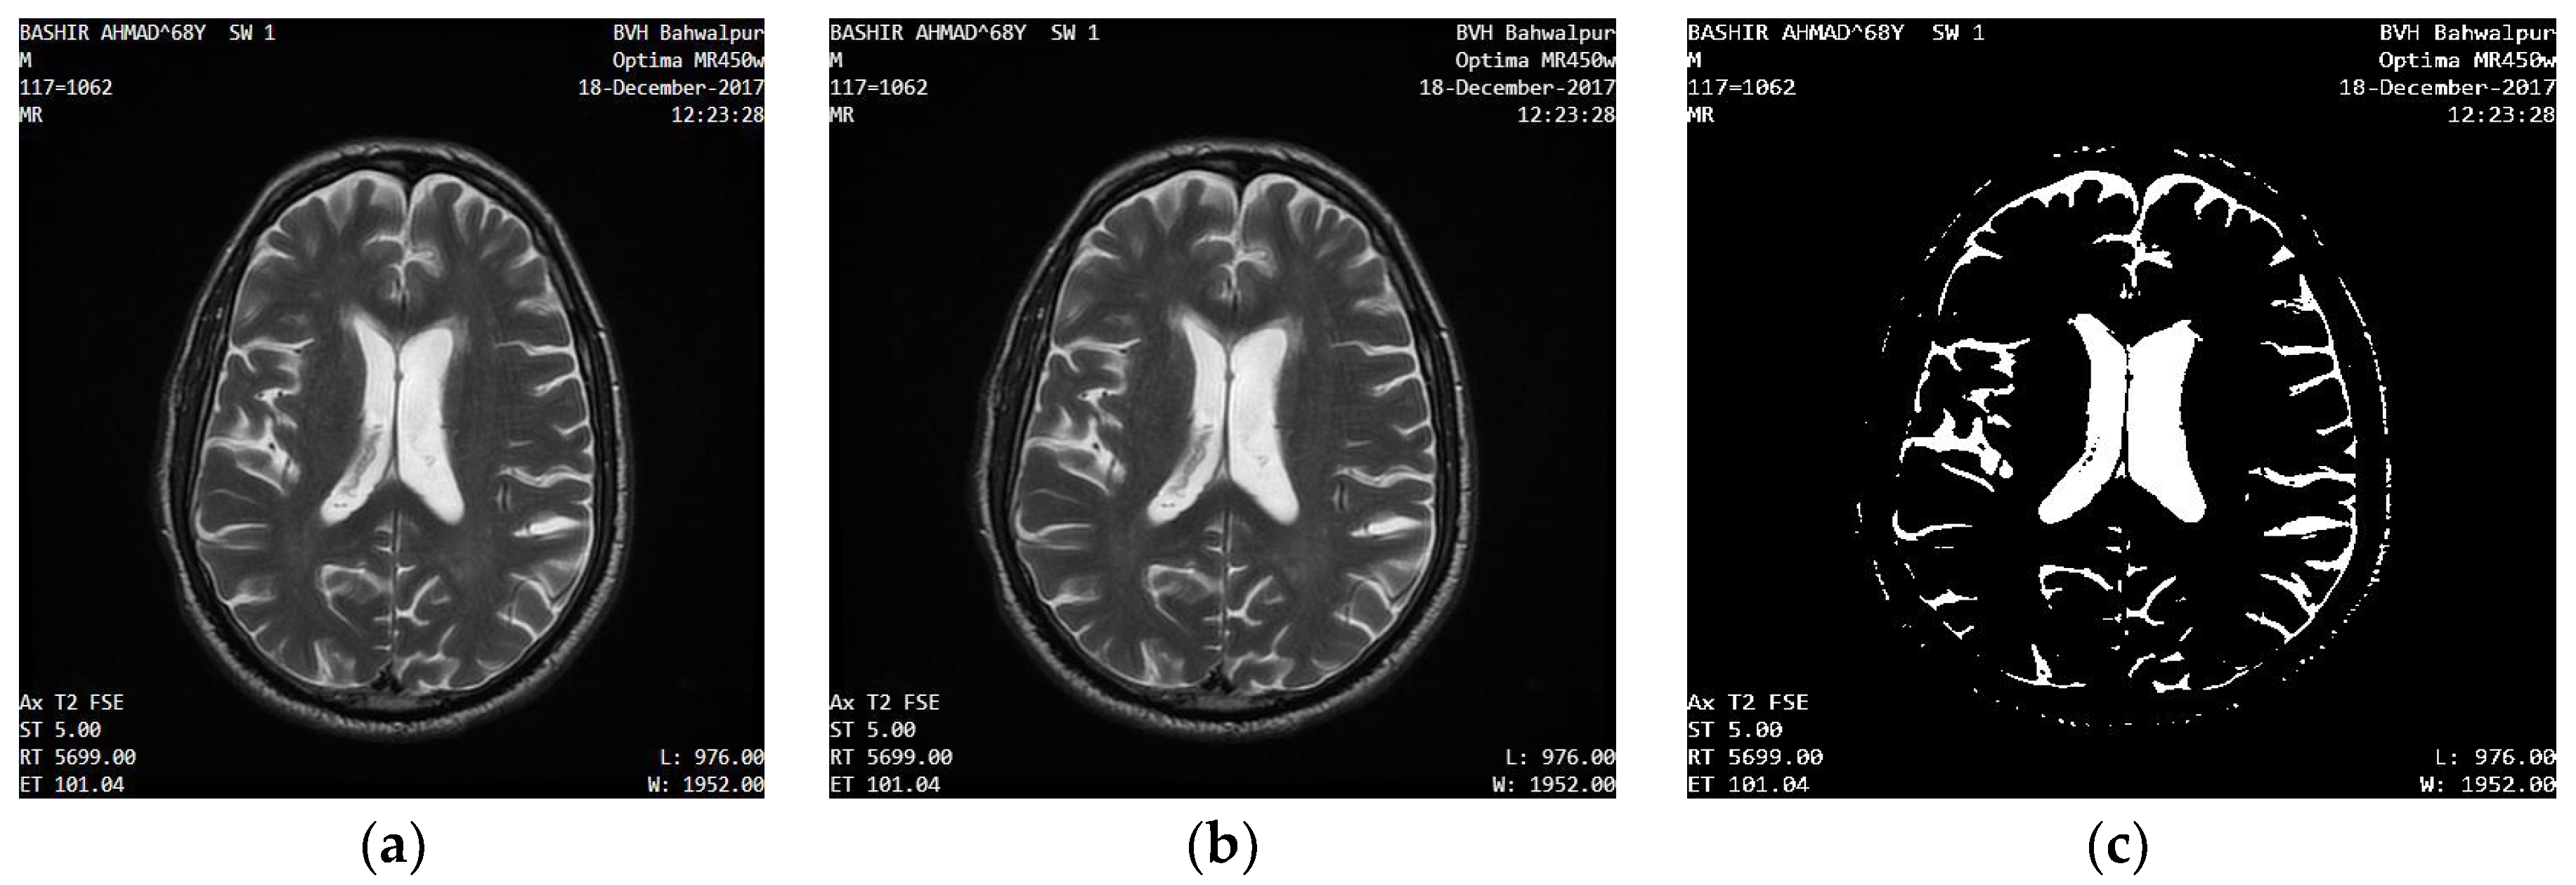
The BVH dataset was physically collected from the (MRI) Radiology department of Bahawal Victoria Hospital in Bahawalpur, Pakistan. This study used 35 images (16 from the BVH dataset and 19 from the RIDER dataset). Further division of these 35 images comprised 24 tumors and 11 nontumor images of male and female patients with normal and abnormal brain images. The BVH dataset was also used and supported by [40]. BVH dataset MRI images are presented in Figure 1.
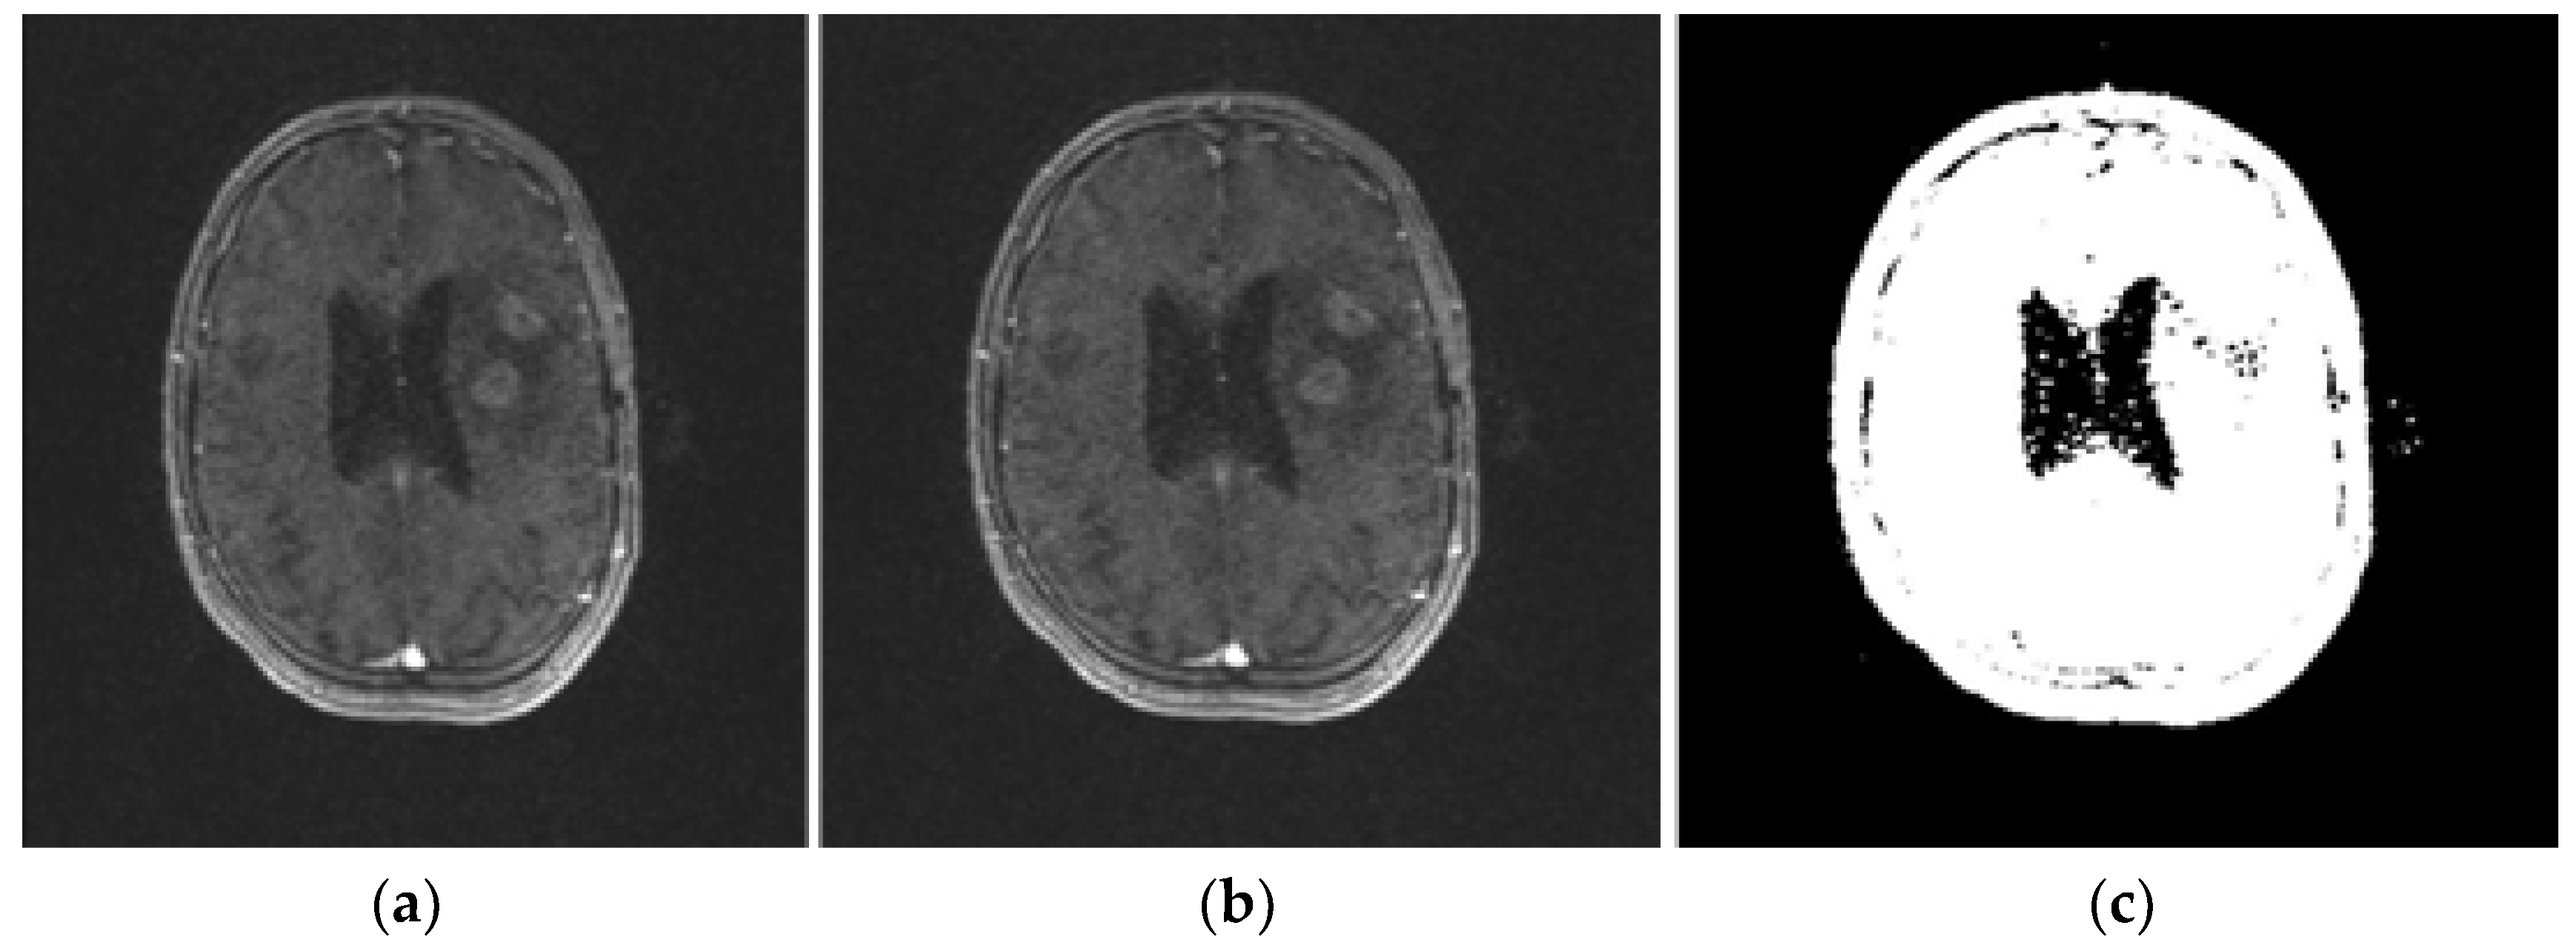
RIDER neuro MRI imaging data were utilized in this publicly available study on the Cancer Imaging Archive (TCIA) [41]. The RIDER Neuro imaging dataset consisted of 19 patients (1.5T Siemens MRI scanner, TE/TR = 1.8/3.8 mSec, Voxel size: 1 × 1 × 5 mm) with recurrent glioblastoma, which is also supported by [42]. An example image of the RIDER dataset is presented in Figure 2.
2.2. Proposed Masked Area Colorization Approach
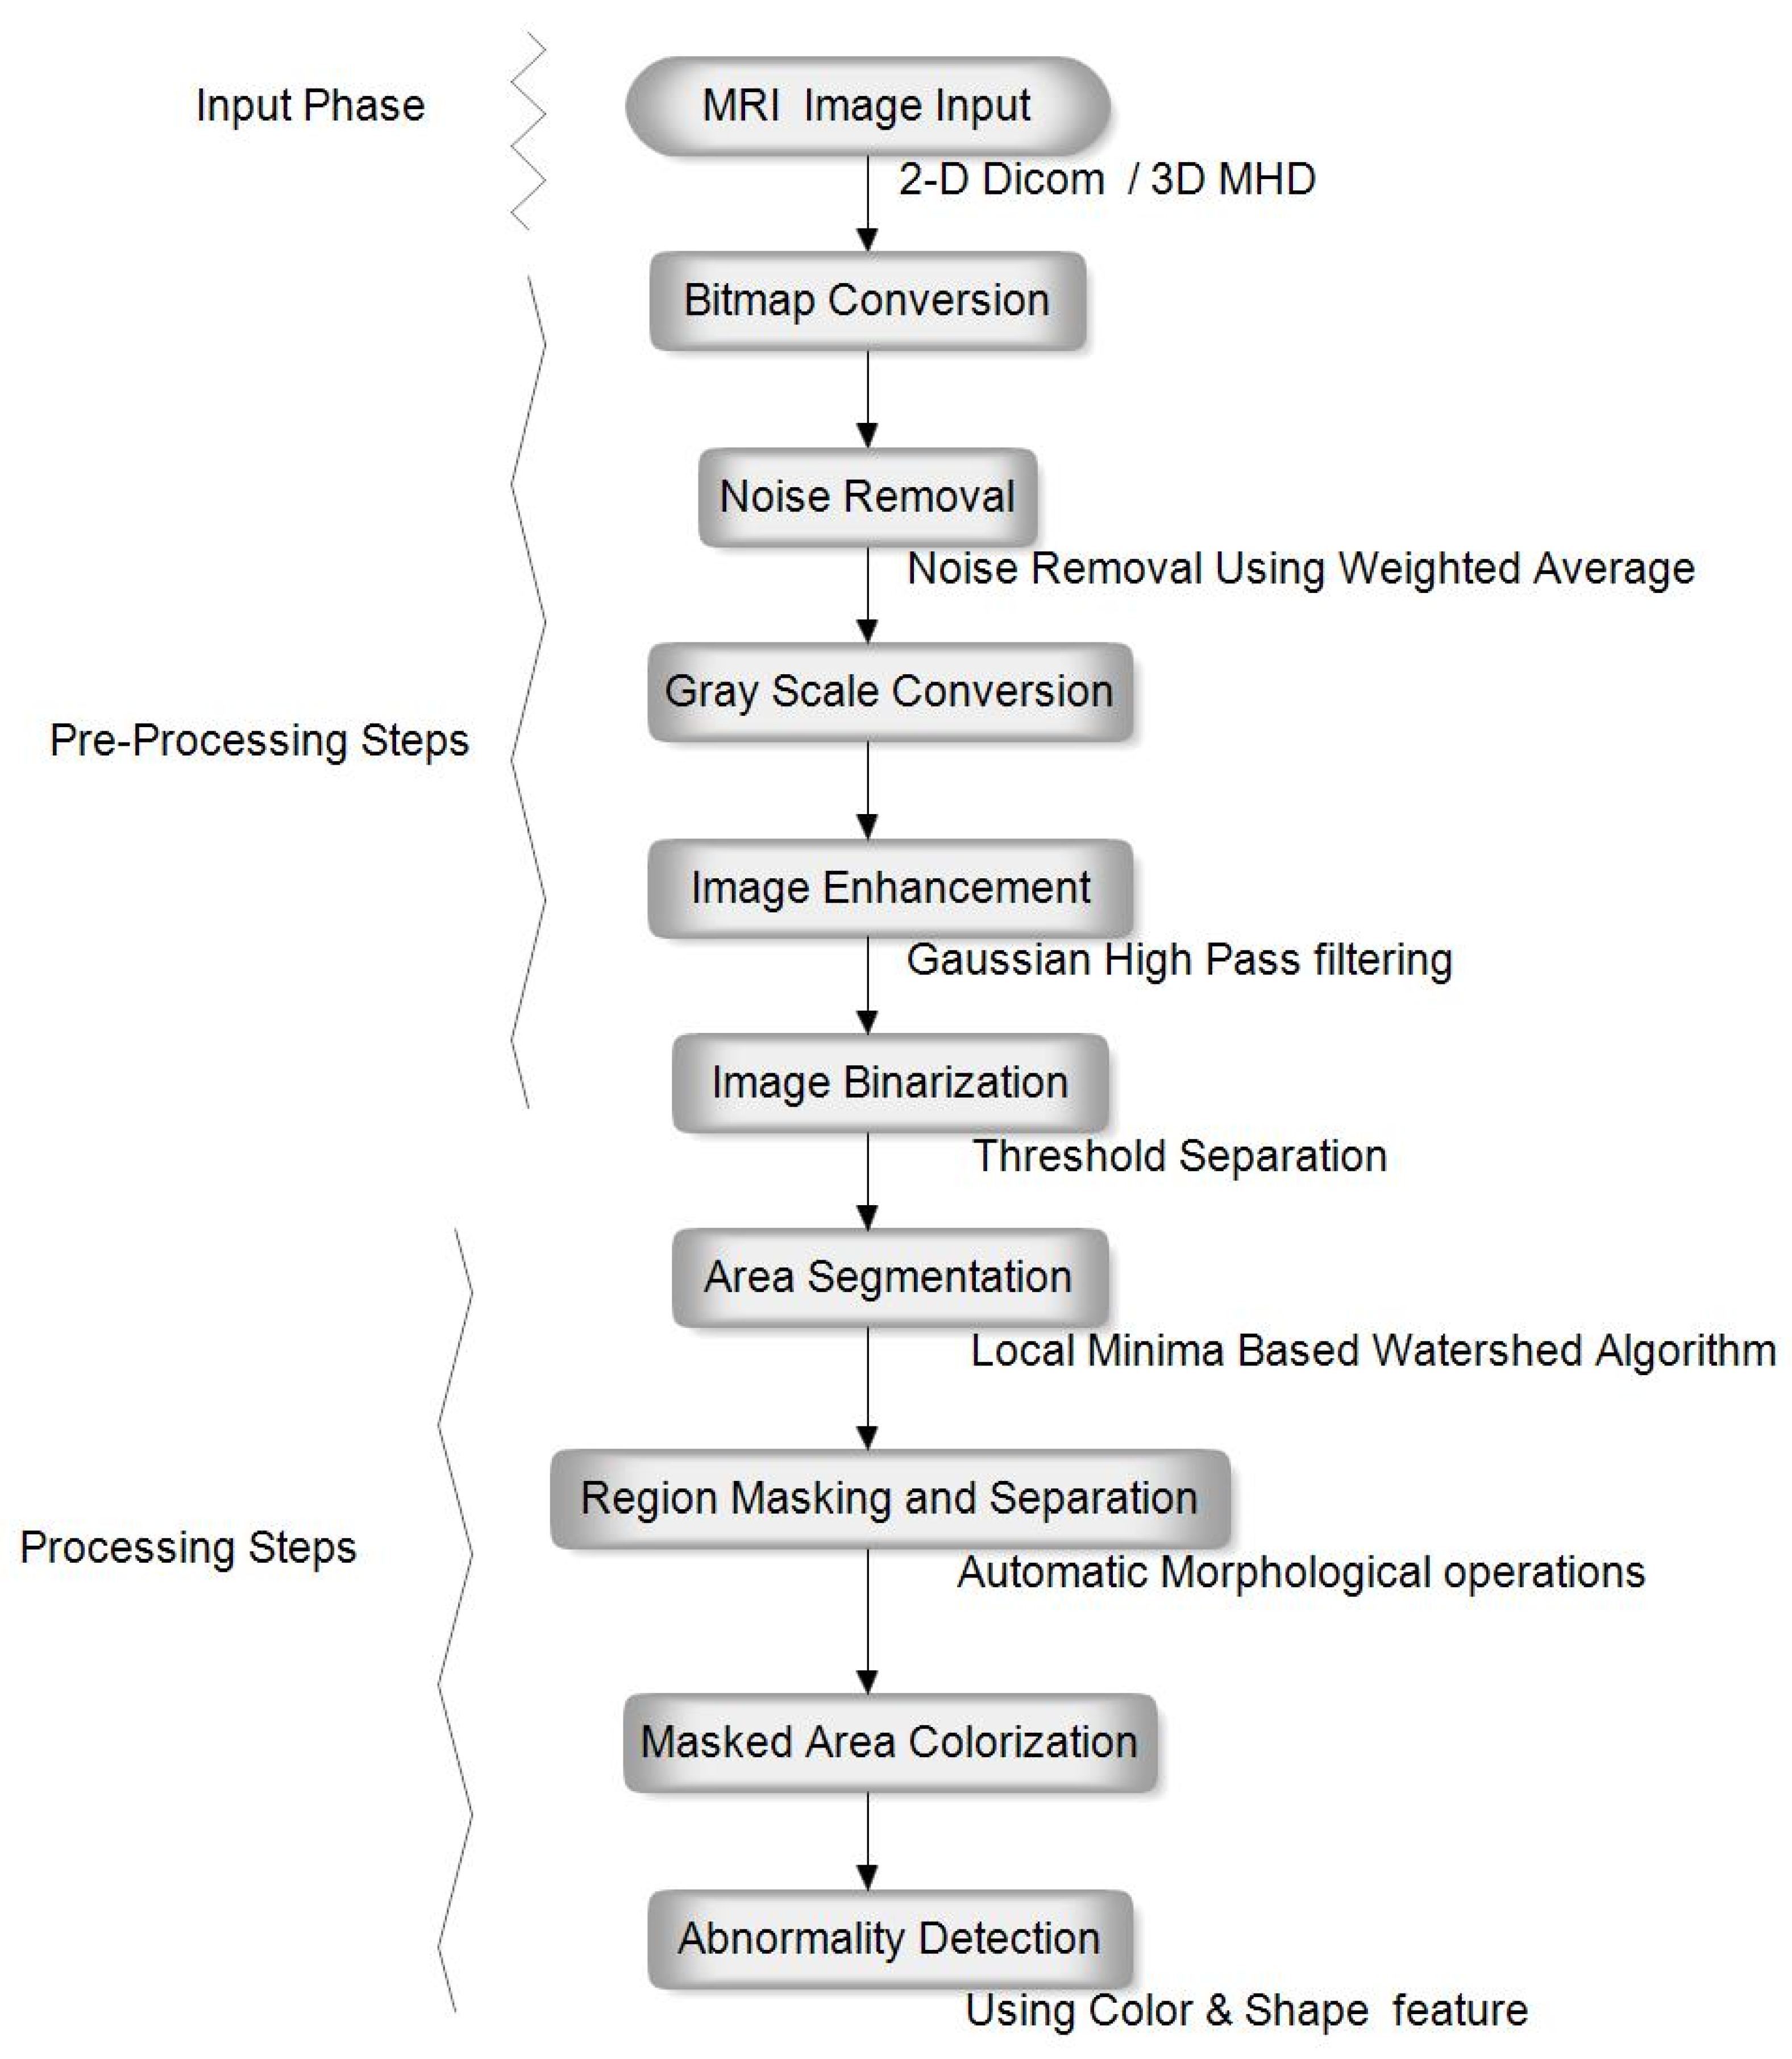
The proposed method for brain image colorization consisted of many steps. Step-by-step method of brain image colorization is given in Figure 3. The output is shown in the last step in the form of morphological and shape features based on abnormality detection.
2.2.1. Input Human Brain MR Images
The first step is to input brain images obtained from the MR imaging center. Two different datasets were used to evaluate the method. Brain images used in the research were taken from the radiology department of Bahawal Victoria Hospital of Bahawalpur and an online standard archive, RIDER Neuro MRI (https://wiki.nci.nih.gov/display/cip/rider (accessed on April 2022)) and “National Cancer Institute (NIH). Cancer Imaging Archive. 2022. Available online: https://www.cancerimagingarchive.net/access-data/ (accessed on April 2022)”. The brain MR images of 15 male and female patients of different ages were used in this step. Brain images were T1, T2, and FLAIR in sagittal and axial views and DICOM format and had a size of 512 by 512. They were saved in bitmap format. So, it was necessary to select the specific image format to fulfill the research objective.
2.2.2. Bitmap Conversion
The DICOM image input was saved as a bitmap image in this step. This step converts DICOM images into a series of raw pixel data stored in bitmap format. There are two types of MR data for the human brain, 2D and 3D. The 2D formatted pictures have different features. RadiAnt DICOM Viewer converts 2D DICOM data into bitmap image format. The proposed colorization method could also be applied to 3D images by incorporating a single extra step. The MITK software tool converts the data in 3D MHD format into bitmap image format. The colorization method proposed in this research works with 2D and 3D photographs because both kinds of input images may have identical qualities after being converted into bitmap images.
2.2.3. Noise Removal
Noise reduction improves and enhances image quality. In this technique, image filtering technologies are utilized to improve picture quality. When there is noise in an image, colorization performance suffers much more. Pixel values were changed using a weighted average to match the weighted average for the whole area or cluster of pixels. After the noise is reduced, the image quality is improved. The mean weighted average is a filtering method that is intuitive and straightforward to implement. As a consequence of this procedure, cluster density variation is decreased, and the cluster mean value is corrected. Furthermore, employing the pixel definition of each image pixel reduces noise. The value of each missing pixel is replaced by an average weighted value, which is then modified concerning its neighbors.
2.2.4. Grayscale Conversion
This step converts RGB bitmap images into grayscale images. An image may be converted into grayscale in several ways. The average weighted method is used to arrive at this conclusion. This method that takes the average of the RGB values in the image may be used to compute the average RGB value of a pixel. The r, g, and b components are averaged and projected onto the grayscale value in the averaging technique.
2.2.5. Image Enhancement
At this step, image enhancement is performed through color intensity, adjusted to be clearly viewed and processed. This step is accomplished using Gaussian high-pass filtering. This step selects pixels in an image whose average value is less than the cluster’s average value. The intensity of these pixels is then altered. Adjusting the intensity level improves image quality and enhances a picture. Pixels with black values below, above, equal to, or less than the threshold are identified using this method, and their value is modified following gray values. The gray toning technique improves the photograph’s results. After the skull is removed, the image is improved. Because the most significant pixel value is attained in the tumor region after skull removal, gray tone aids tumor identification. Finding the low and high adjustments, as a consequence, is critical for image segmentation. In this investigation, degrees of mild and high intensity of 0.41 and 0.51 were employed. The upper bound threshold affects all pixels with higher values, but the lower bound threshold affects just pixels with lower values. This activity aided in the watershed segmentation of the tumor. As an average of the pixel intensity of all tumor pixels, upper and lower bound limits are derived from the image database. The lower limit is the smallest value that one of these tumor pixels may have.
2.2.6. Image Binarization
The logical array contains only 0 s and 1 s, interpreted as black and white, respectively, known as binarization (a theory based on converting RGB images into gray images). A grayscale image (256 gray levels) is converted into binary form (black and white image) for applying further operations [43]. This operation is based on a probability operation where the probability of two maxima is used to describe the pixel’s value during binarization; for example, if the probability of an image pixel to be 255 is more significant than 0.6, then the pixel intensity is considered to be 255. On the other hand, if the probability of the pixel to be 255 is less than 0.6, then it is considered a minimum of the region. The probabilities are calculated using neighborhood values. A cluster of neighbors helps in defining the probability of a pixel.
2.2.7. Area Segmentation using Watershed Algorithm
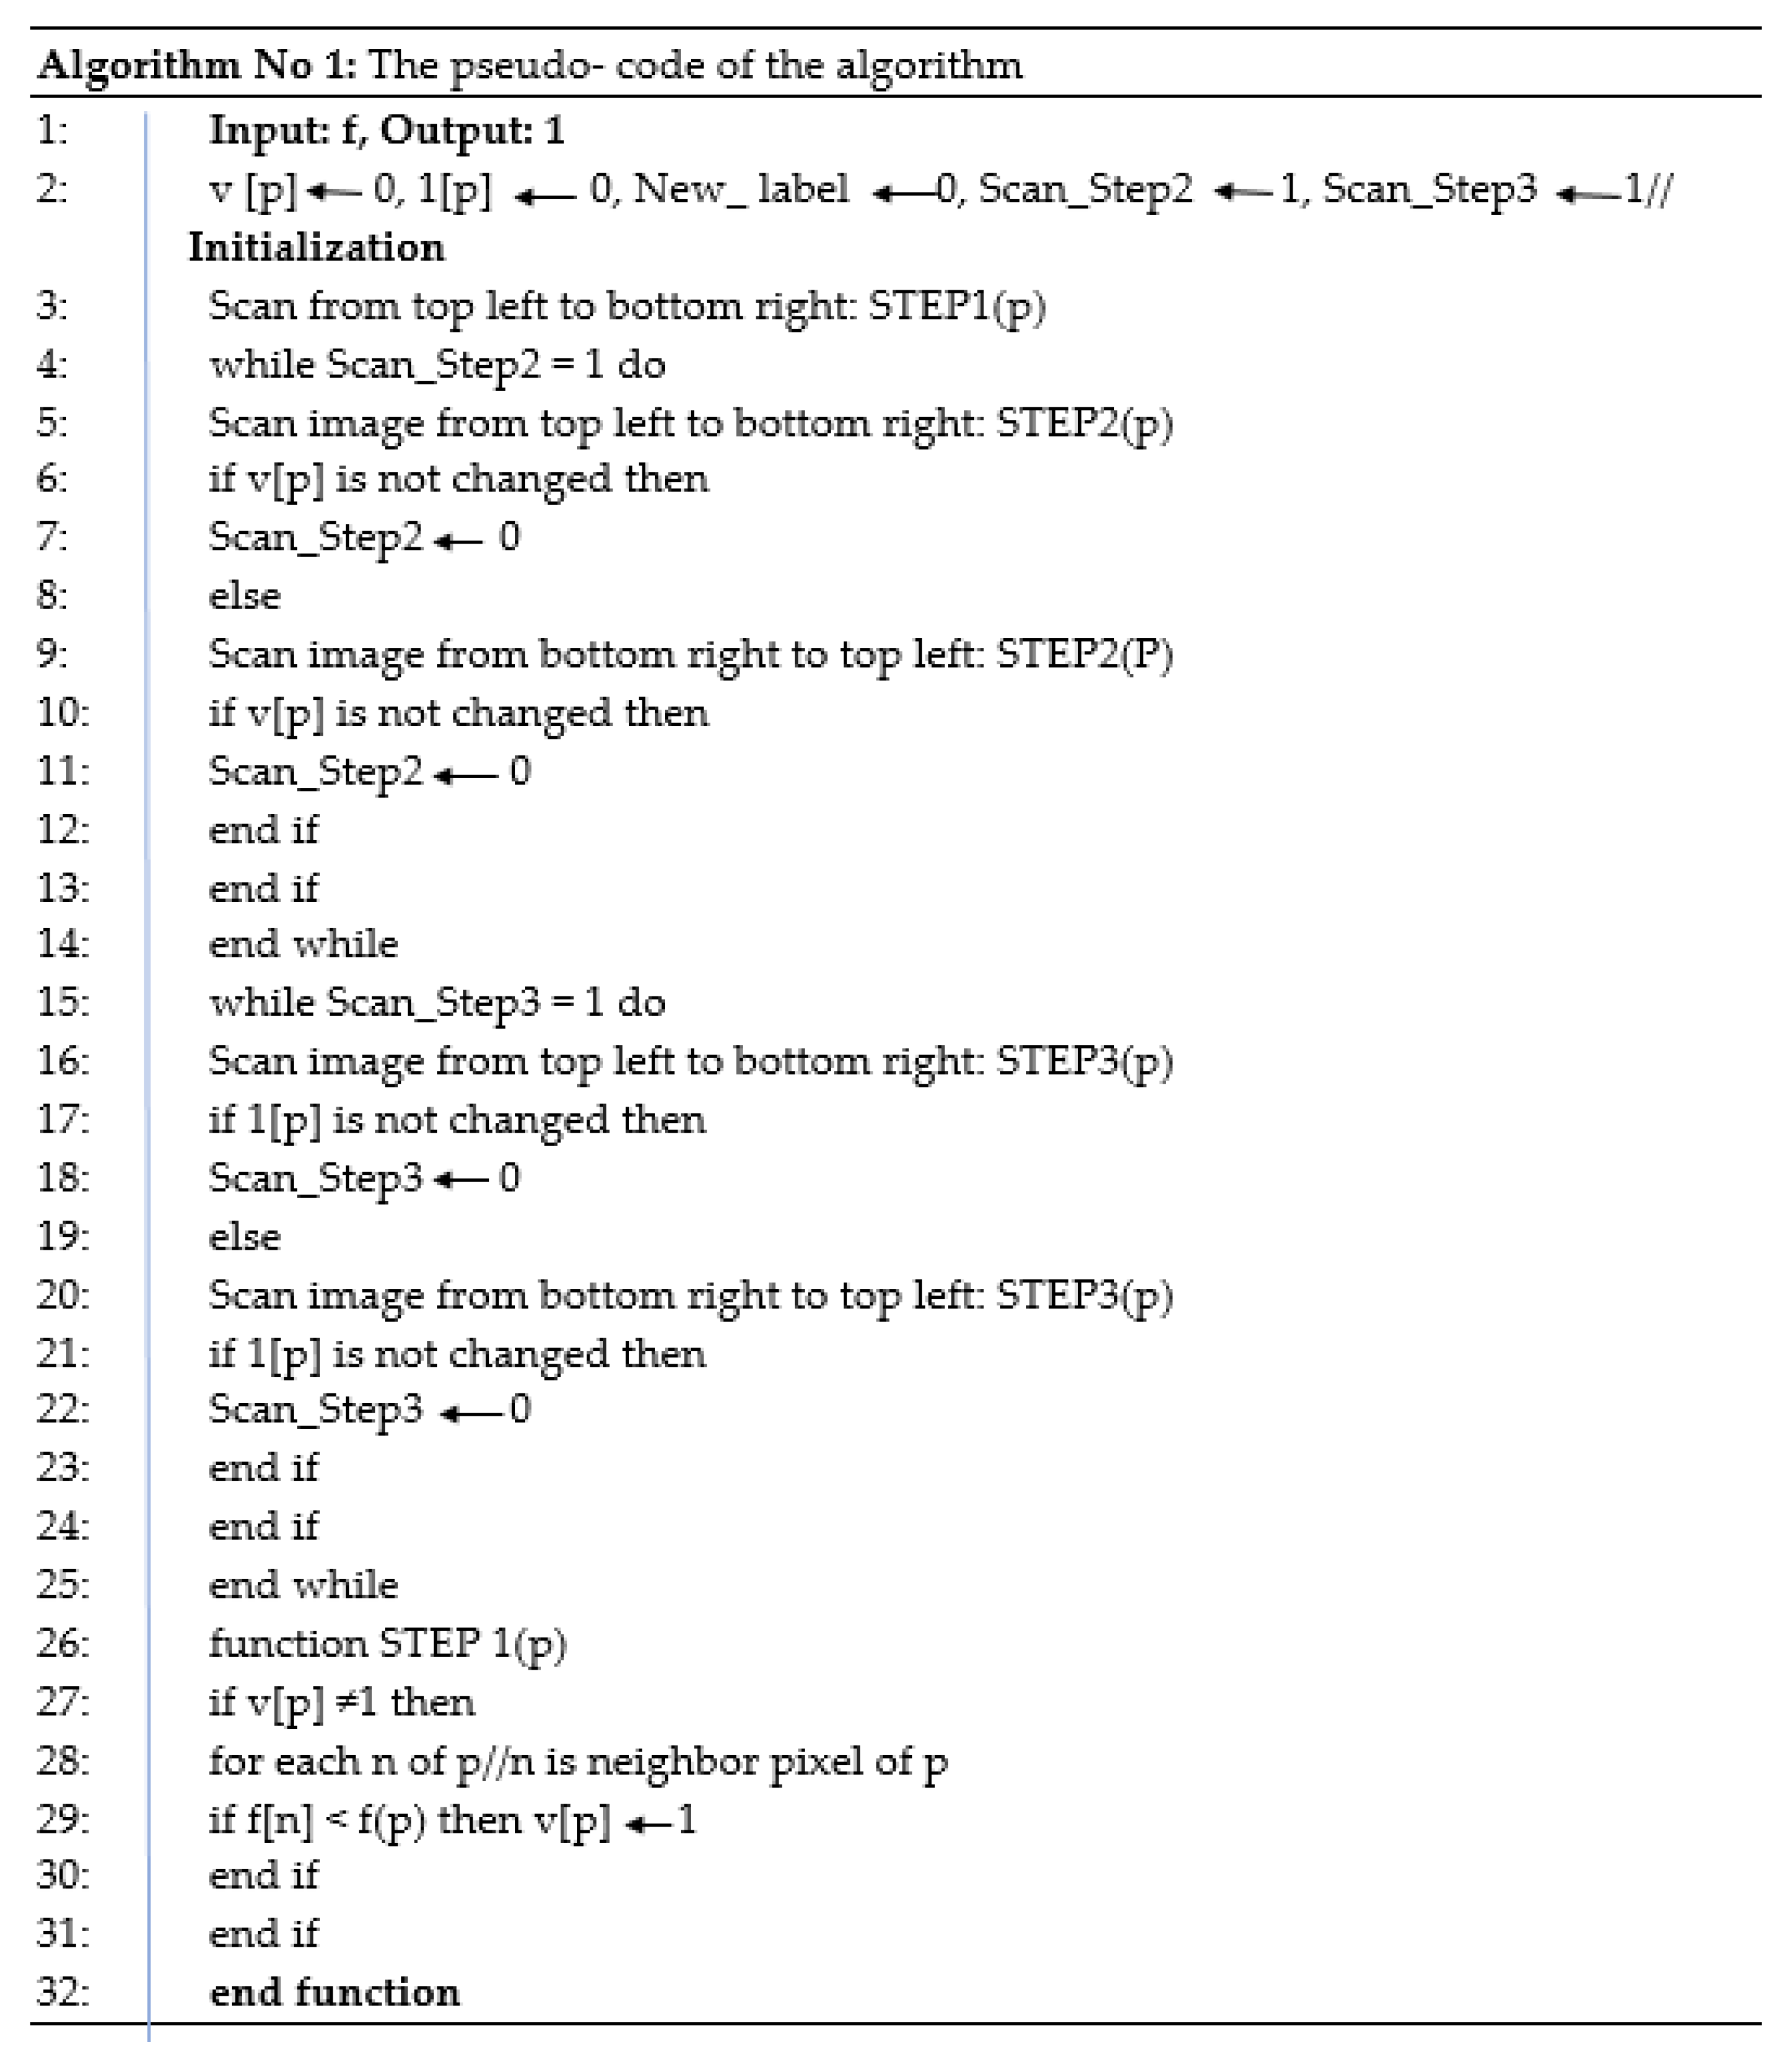
The watershed algorithm is used in image dispensation, mainly for segmentation purposes based on the topological interpretation of the image [44]. The pseudocode of the watershed segmentation algorithm is described in Figure 4. A watershed of the grayscale image is parallel to the concept of a catchment basin of a heightmap. Simple water drops next to the ramp of an image flow beside a path to reach it. The strength level symbolizes the height of the terrain. It is described as basins and mountains. For every basin, a hole is theoretical for realization, by which the rising subversive water spills and fills the basins. When the water rises, the level arrives at the basin boundary, and two or more adjacent basins merge. Dams are necessary for maintaining a partition among basins. Those dams are the boundaries of the region of segmentation. Related work on MR image segmentation using a watershed algorithm was performed by [45,46,47,48]. However, our work is based on the proposed pseudocode of the watershed segmentation algorithm and is supported by [49].
2.2.8. Region Masking and the Separation
This step marks the area that is a possible brain tumor area. This area is known as ROI. This step is performed using automatic morphological operations.
The masking schema can be applied using the ROI mask by following two techniques, edge detection, and morphological operations.
Image dispensation is performed using the edge detection method to pronounce the boundaries of items inside images. Edge finding is the famous central move toward detecting considerable discontinuities in strength values. Diverse edge finding methods and techniques are applied to brain images to detect the brain regions [50]. However, these methods are based on the behavioral revision of edges by the operator and are used for diverse edge findings [51]. These techniques include canny edge, Sobel, Prewitt, Roberts, zero crossing, and Laplacian of Gaussian (log).
On the other hand, morphology is a broad category of image processing techniques that focuses on the shape of a picture. When a morphological operation is applied to a photograph, the resulting image retains the original image’s dimensions. The morphological process determines the value of each pixel in the output image by comparing the value of each input pixel to the values of its neighbors in the original image. By adjusting the size and shape of the neighborhood, a morphological operation may be designed that reacts exclusively to particular features in the input image. The most basic morphological processes are dilation and erosion. Erosion removes pixels from the edges of objects, while dilatation adds pixels to the edges of objects in a photograph. If a photograph is being processed with a structuring element, the size and shape of the elements affect the number of pixels added or subtracted from the objects. By applying an appropriate rule to the pixel and its neighbors in the input image, it is feasible to determine the state of each pixel in the output image. A dilation or erosion rule is used to process the pixels. During this phase, morphological methods (i.e., Strel(), imerode() and Imdilate() functions()) are used to segregate the region of interest.
2.3. Proposed a Colorized Method for Masked Area Colorization
After selecting the ROI of the brain, it is applied to distinguish colors to differentiate among multiple regions of the human brain. Gray matter, white matter, and CBF are highlighted in different colors. Connected component and index-based colorization methods apply colors to different regions and abnormal areas. Both methods needed a color index table and gave the same results. After segmentation, they were applied to distinguish colors to differentiate the regions. The algorithm for area colorization was modified from the original area colorization given in Figure 5. All further steps after bitmap image conversion were performed in MATLAB 2020.
3. Results and Discussion
3.1. Experimentation Setup
The proposed methodology was implemented in MATLAB software. For this purpose, MATLAB R2018a was used. The image processing toolkit was used to provide essential image processing functions. The proposed model was evaluated by implementing it in MATLAB, and the efficiency of the algorithms was analyzed. The implementation environment is presented in Table 1.
3.2. Performance Evaluation
The quality of the colorized medical pictures was evaluated using two key characteristics: peak signal-to-noise ratio (PSNR) and structural similarity index (SSIM). These actions also enhance the colorized image and its appearance: the greater the PSNR score, the more visual information and better accuracy the colorized picture has. Results were assessed using the average PSNR values over the whole dataset. SSIM (the similarity between input and output image structures) is another aspect used. The average similarity measure is utilized to assess the process’s systemic accuracy. If the SSIM was high, a structure exists between input and output images.
Consequently, the measure tries to capture changes in people’s perceptions of their photographs and quality. A database of 35 brain images was used during the simulation and performance evaluation. These images were obtained from the Bahawal Victoria MR images dataset images (16 images) and the Rider MR Image dataset (19 images). Figure 1 describes the Rider Image dataset, and Figure 2 describes the Bahawal Victoria MR Images dataset. These images were collected and preprocessed for the better performance of our algorithmic code. These images were processed using MATLAB R2018a. Analysis of the obtained images showed that it is too hard for an ordinary person to detect a brain tumor using these images.
Brain tumor identification requires efficient area segmentation before the tumor can be identified. For this purpose, the watershed algorithm is used to segment the image area. This algorithm works using the concept of a catchment basin in a map using the height values. Imaging flow is detected until the last reached value, and then it is considered the end of that particular area. This concept is executed by grouping image pixels based on their intensities. A group of pixels is produced with similar intensity. This step is critical for its possible suffering from segmentation errors (under and over-segmentation). However, to avoid segmentation errors, the segmentation marker is chosen from the local minima of the image gradient. After choosing the local gradient minima as a marker, region merging is performed using this marker. Results after processing and evaluation of both datasets are shown below in Figure 6, Figure 7, Figure 8 and Figure 9.
The position of the marker is explicitly defined using morphological operations. The image was morphed using morphological commands, including the following:
- Strel: this command is used to create elements of morphological structure;
- Imerode: this function shrunk (eroded) the image;
- Imdilate: this function dilated the image and filled the areas after expanding.
Therefore, the accuracy of area segmentation and the brain tumor classification of images was considered to be 100%, as presented in Table 2, because the system did not identify images during classification and colorization.
As described in the images above, the ROI area was calculated to know the tumor size after detecting ROI. Tumor sizes are described in Table 3.
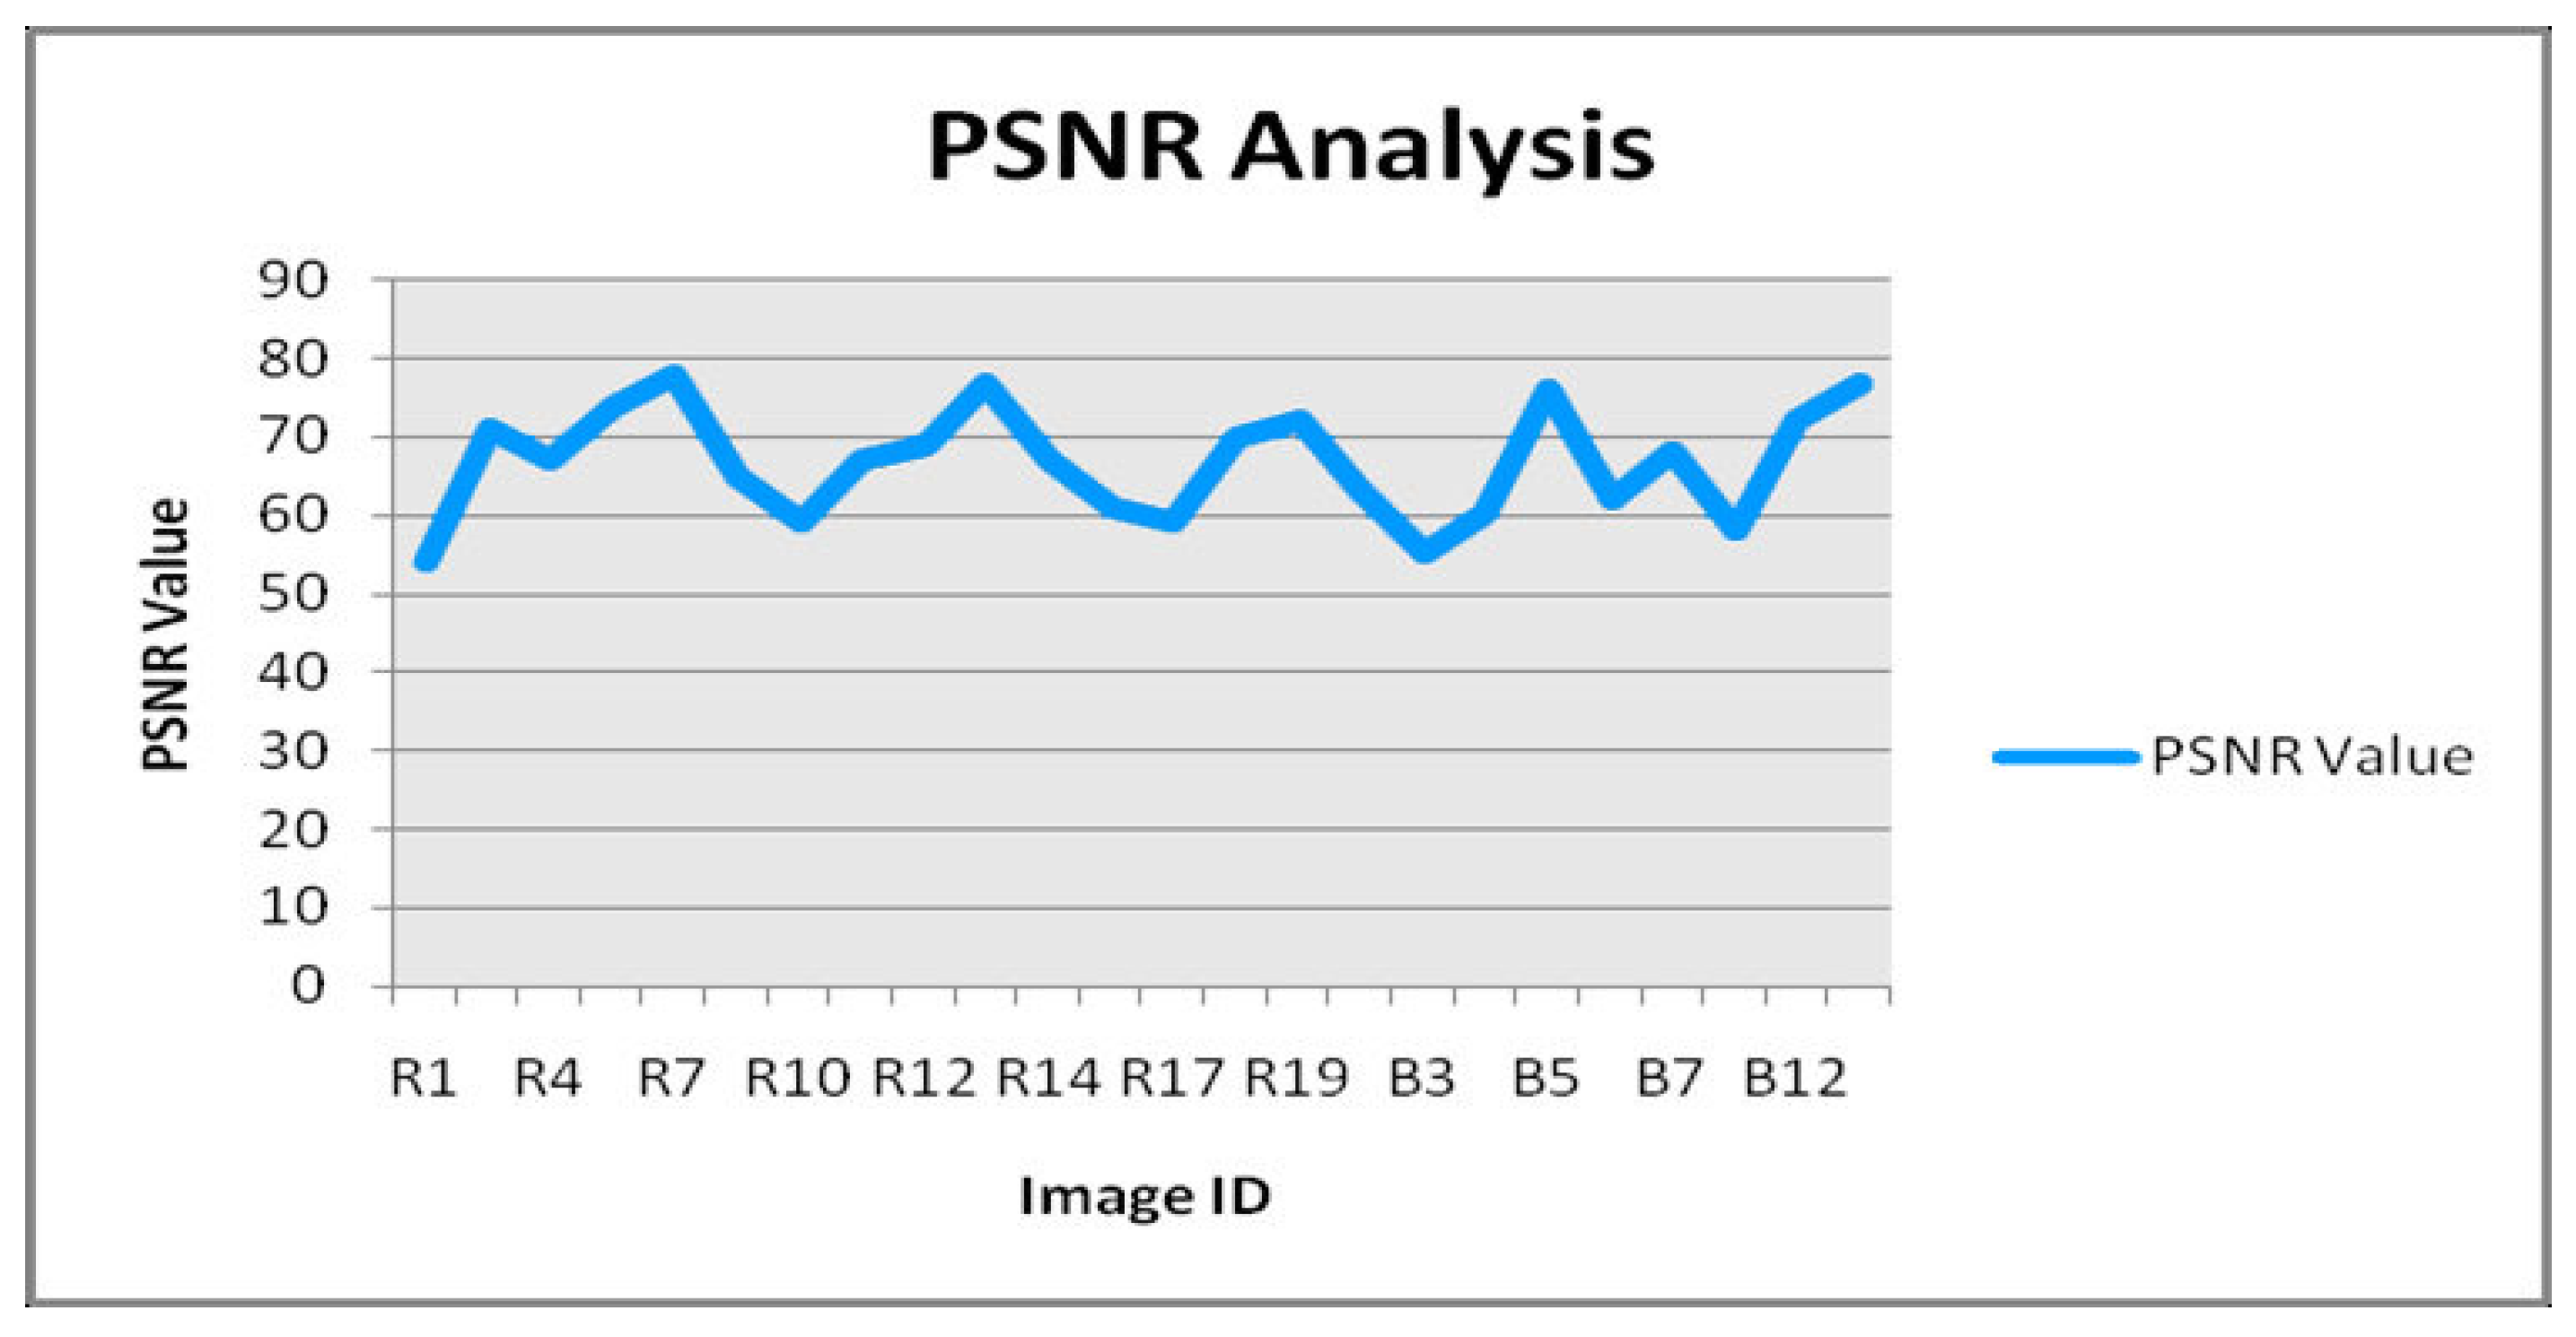
3.3. PSNR Analysis of Colorized Images
The PSNR and SSIM values of the colorized images were analyzed to examine the algorithm’s performance. Moreover, the PSNR value describes whether images are lossy formatted or the quality of the image is sharp. The measurement is described in Figure 10.
Trivial values of PSNR in lossy image compression were between 30 and 50 DB, which depended on the image’s bit depth. The PSNR value remained below 50 dB if the bit depth was 8 bits. However, in the case of 16 or 32 bits, better PSNR values were seen. However, in this 32-bit image conversion, the typical value was 50 and 80 DB. When the graph was analyzed, the PSNR values were above 60 DB. This conversion shows that the image was not lossy, and after colorization, features were preserved in the images.
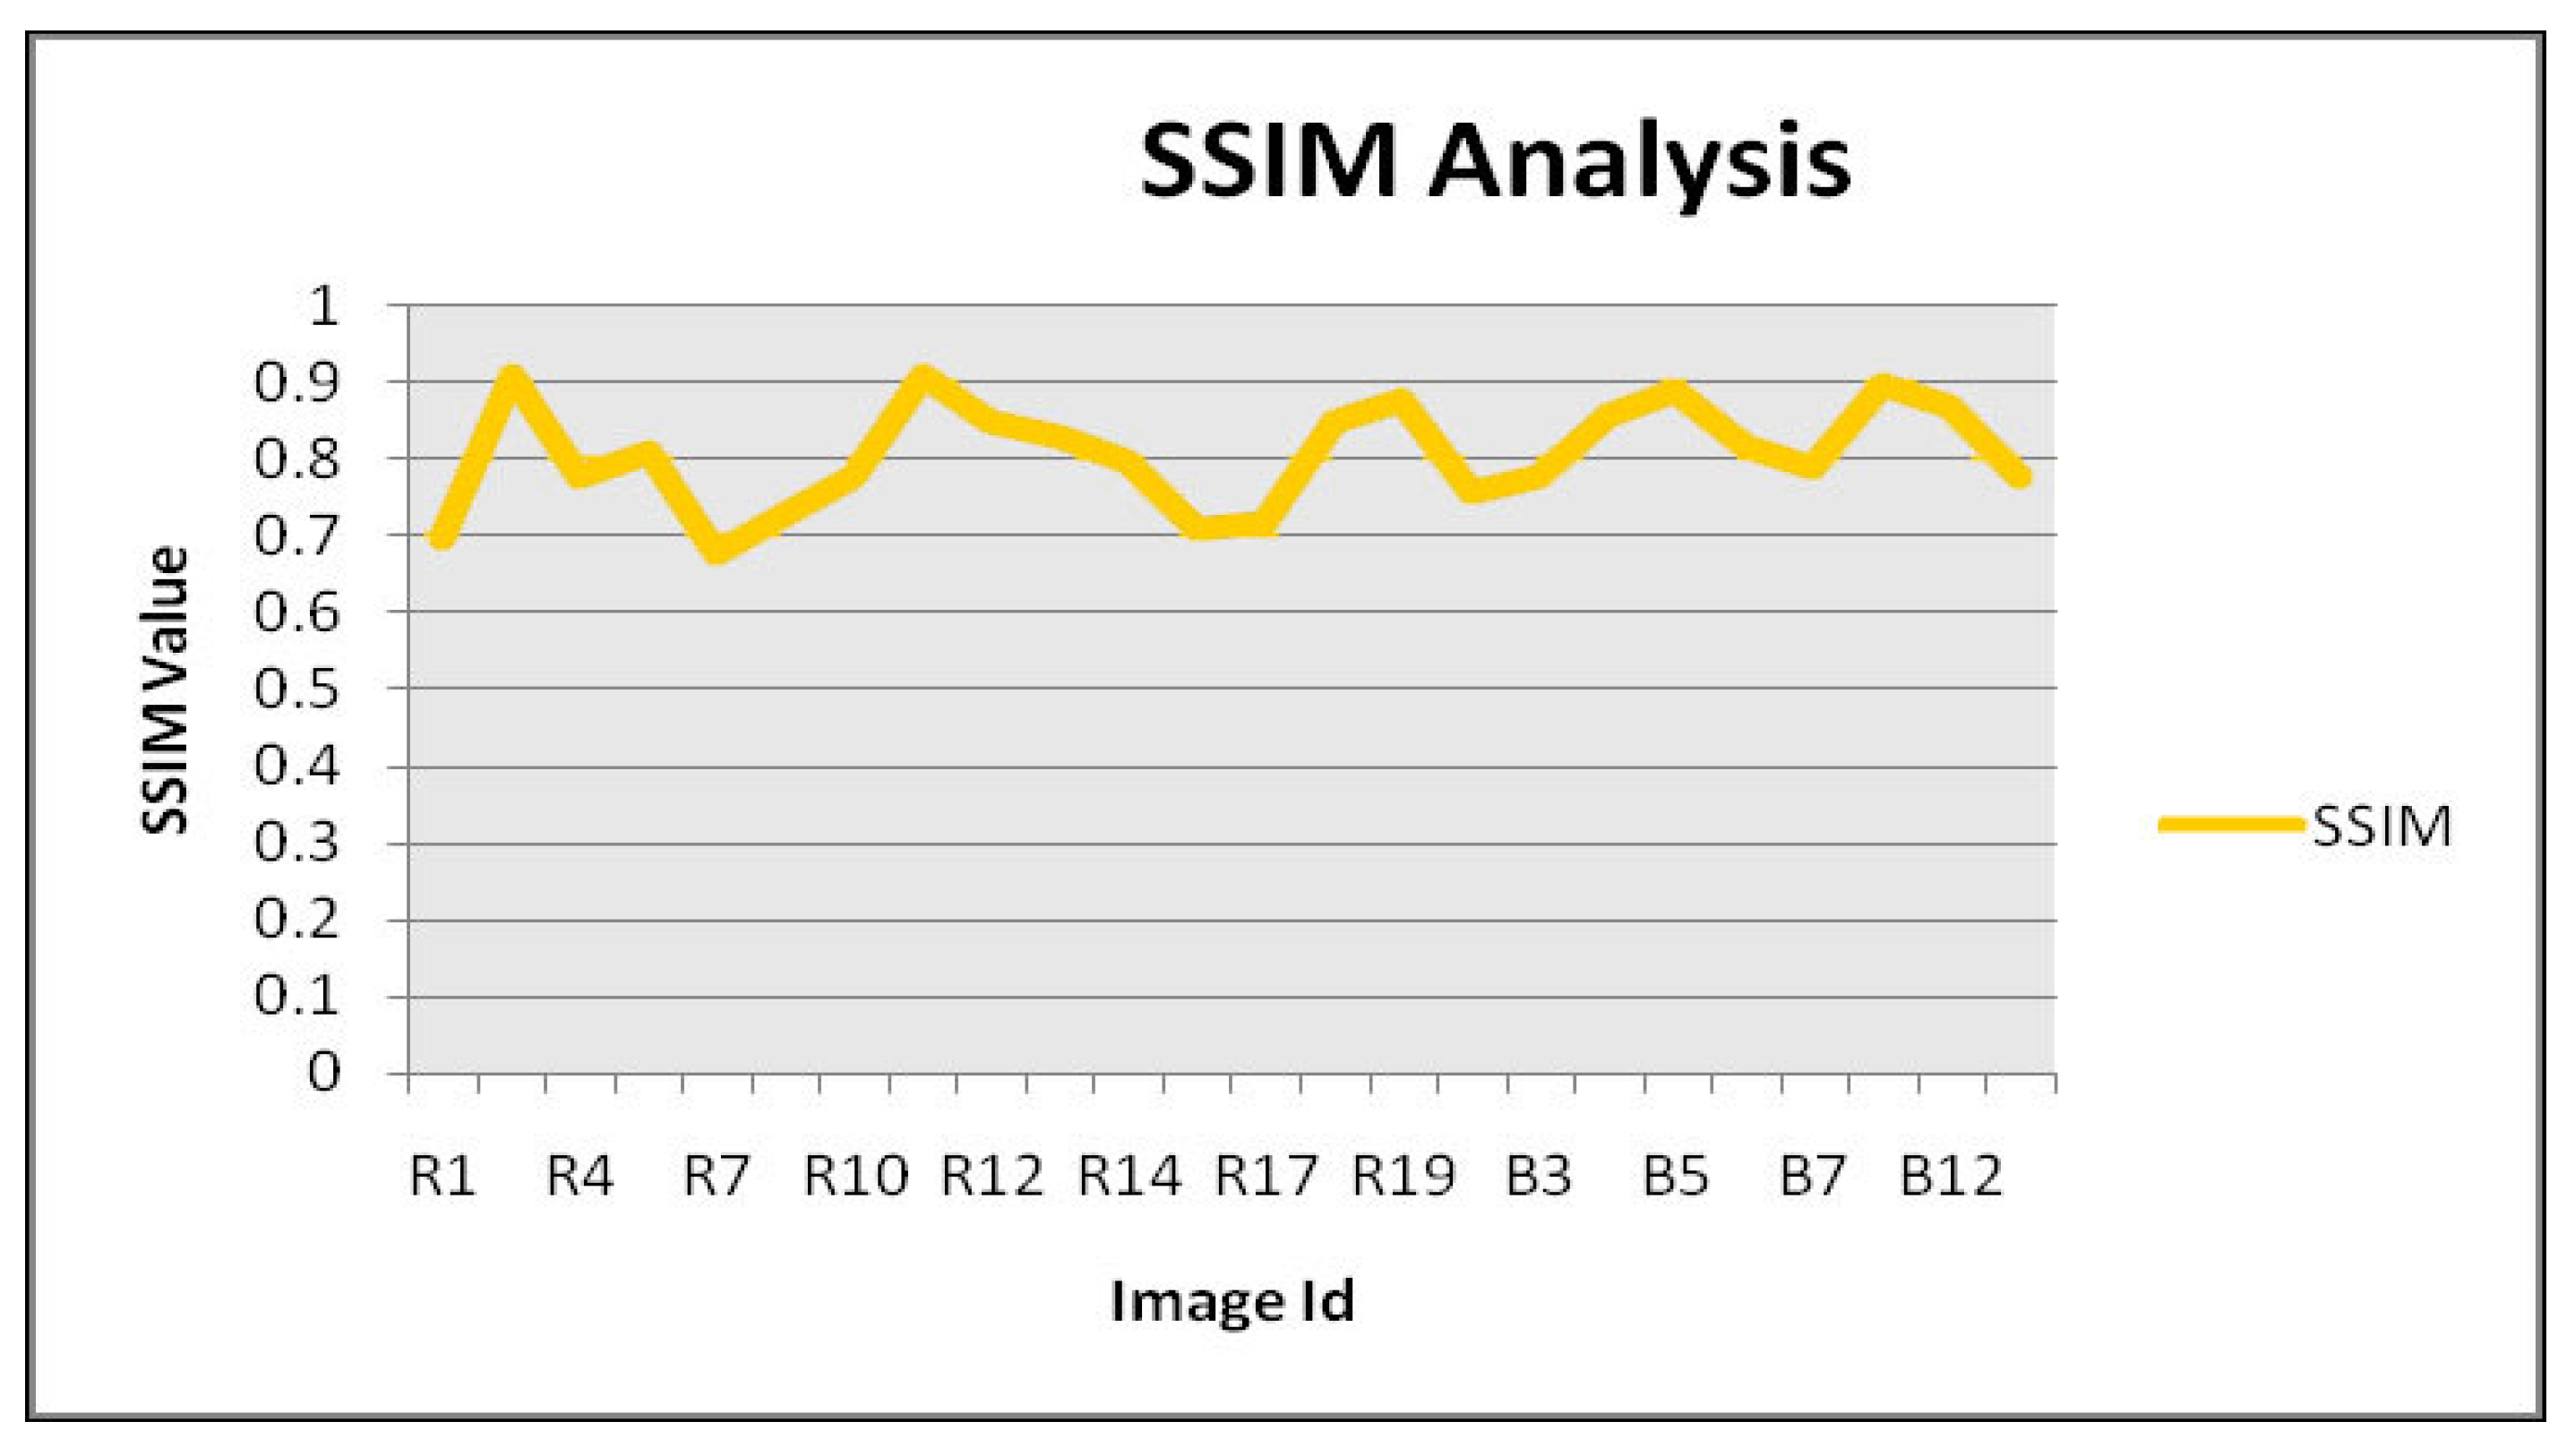
3.4. SSIM Analysis
SSIM is a structural similarity index describing image quality degradation during image processing in MATLAB. This degradation is mainly caused due to data processing and transmission. SSIM is a reference metric describing the correlation between the original and processed images. The SSIM value ranges from 0 to 1. The value describes the relatedness to the original image after processing. Analysis was performed after the colorization of the image by the proposed colorization algorithm in this study. Figure 11 describes the SSIM analysis of the images during the test phase.
3.5. Processing Overhead
The system’s processing time was analyzed to examine the processing overhead. The system took an average of 3 min to perform all the steps, namely, preprocessing, segmentation of the brain image, and colorization. A processing time of below 3 min was considered negligible for providing a colorized image for diagnosis.
4. Conclusions
This study investigated standard solutions in discriminating between normal and abnormal regions by assigning colors to grayscale human brain MR images to differentiate among different kinds of tissue. Our study describes the obtained results during the experimental evaluation of the proposed system. Results show that implementing the watershed-based area segmentation and ROI selection methods based on the morphological operation helps identify tissues during processing. The function of the colorization algorithm was evaluated after being implemented in MATLAB R2018a. Moreover, the proposed preprocessing step was evaluated after implementing MATLAB. Images were selected from two datasets for the testing phase, and their results were then interpreted for the system’s performance evaluation and overhead processing analysis. Results show that the PSNR value of the system was according to the desired and accepted standards as mentioned in the literature.
Moreover, the SSIM value of images was tested. The converted image was similar to a real one because the SSIM value was above 0.6 and below 0.9, which showed that image features were not lost during processing. Moreover, the processing time was analyzed to examine the processing overhead. Processing overhead for the critical operation of brain area segmentation and coloration was averaged below 3 min, which is not a cumbersome cost to help the support system provide the colorized medical images for diagnosis. This study also has certain limitations. For example, we used a predetermined axial slice (out of 4 images of each patient available in the dataset) to evaluate our method.
However, in the future, we aim to outline another version of this algorithm with machine-learning ability that can be used for all axial slices.
Author Contributions
Conceptualization, I.H.; methodology, I.H.; software, I.H., M.A.M. and T.M.; validation, I.H., M.A.M. and T.M.; formal analysis, I.H.; investigation, I.H.; resources, I.H. and N.U.; Data curation, T.M., N.U. and I.B.; Writing—original draft preparation, I.H.; Writing—review and editing, I.H.; visualization, I.H. All authors have read and agreed to the published version of the manuscript.
Funding
This research received no external funding.
Institutional Review Board Statement
Not applicable.
Informed Consent Statement
Not applicable.
Data Availability Statement
Not applicable.
Acknowledgments
The authors are thankful to Yang Xionan in the School of Information Engineering, Zhengzhou University, China, for his excellent supervision and regular support. The authors also thank Tehsen Mazhar, I.B., and Najib Ullah for arranging the BVH dataset and for technical and software assistance.
Conflicts of Interest
The authors declare no conflict of interest.
References
- Rangger, C.; Helbok, A.; Sosabowski, J.; Kremser, C.; Koehler, G.; Prassl, R.; Andreae, F.; Virgolini, I.J.; von Guggenberg, E.; Decristoforo, C. Tumor targeting and imaging with dual-peptide conjugated multifunctional liposomal nanoparticles. Int. J. Nanomed. 2013, 8, 4659. [Google Scholar] [CrossRef] [PubMed] [Green Version]
- Yuan, Y.; Gu, Z.-X.; Tao, X.-F.; Liu, S.-Y. Computer tomography, magnetic resonance imaging, and positron emission tomography or positron emission tomography/computer tomography for detection of metastatic lymph nodes in patients with ovarian cancer: A meta-analysis. Eur. J. Radiol. 2012, 81, 1002–1006. [Google Scholar] [CrossRef]
- Elliot, A.J. Color and psychological functioning: A review of theoretical and empirical work. Front. Psychol. 2015, 6, 368. [Google Scholar] [CrossRef] [PubMed] [Green Version]
- Luan, Q.; Wen, F.; Cohen-Or, D.; Liang, L.; Xu, Y.-Q.; Shum, H.-Y. Natural image colorization. In Proceedings of the 18th Eurographics conference on Rendering Techniques, Grenoble, France, 25–27 June 2007. [Google Scholar]
- Balinsky, A.; Mohammad, N. Colorization of natural images via L 1 optimization. In Proceedings of the 2009 Workshop on Applications of Computer Vision (WACV), Snowbird, UT, USA, 7–8 December 2009; IEEE: New York, NY, USA, 2009. [Google Scholar]
- Leifman, G.; Tal, A. Pattern-driven colorization of 3d surfaces. In Proceedings of the IEEE Conference on Computer Vision and Pattern Recognition, Portland, OR, USA, 23–28 June 2013. [Google Scholar]
- Badano, A.; Revie, C.; Casertano, A.; Cheng, W.-C.; Green, P.; Kimpe, T.; Krupinski, E.; Sisson, C.; Skrøvseth, S.; Treanor, D. Consistency and standardization of color in medical imaging: A consensus report. J. Digit. Imaging 2015, 28, 41–52. [Google Scholar] [CrossRef] [PubMed] [Green Version]
- Finn, G.M.; White, P.M.; Abdelbagi, I. The impact of color and role on retention of knowledge: A body-painting study within undergraduate medicine. Anat. Sci. Educ. 2011, 4, 311–317. [Google Scholar] [CrossRef]
- Escobar, M.M. An Interactive Color Preprocessing Method to Improve Tumor Segmentation in Digital Medical Images; Iowa State University: Ames, IA, USA, 2008. [Google Scholar]
- Bejnordi, B.E.; Litjens, G.; Timofeeva, N.; Otte-Höller, I.; Homeyer, A.; Karssemeijer, N.; van der Laak, J. Stain specific standardization of whole-slide histopathological images. IEEE Trans. Med. Imaging 2015, 35, 404–415. [Google Scholar] [CrossRef]
- Hartwig, V.; Giovannetti, G.; Vanello, N.; Lombardi, M.; Landini, L.; Simi, S. Biological effects and safety in magnetic resonance imaging: A review. Int. J. Environ. Res. Public Health 2009, 6, 1778–1798. [Google Scholar] [CrossRef] [PubMed] [Green Version]
- Sibbitt, W.L., Jr.; Sibbitt, R.R. Magnetic resonance spectroscopy and positron emission tomography scanning in neuropsychiatric systemic lupus erythematosus. Rheum. Dis. Clin. N. Am. 1993, 19, 851–868. [Google Scholar] [CrossRef]
- Amaro, E., Jr.; Barker, G.J. Study design in fMRI: Basic principles. Brain Cogn. 2006, 60, 220–232. [Google Scholar] [CrossRef]
- Cao, F.; Vu, M.; Chan, D.H.L.; Lawrence, J.M.; Harris, L.N.; Guan, Q.; Xu, Y.; Perfetti, C.A. Writing affects the brain network of reading in Chinese: A functional magnetic resonance imaging study. Hum. Brain Mapp. 2013, 34, 1670–1684. [Google Scholar] [CrossRef] [PubMed] [Green Version]
- Zhou, Y.; Wang, K.; Liu, Y.; Song, M.; Song, S.W.; Jiang, T. Spontaneous brain activity observed with functional magnetic resonance imaging as a potential biomarker in neuropsychiatric disorders. Cogn. Neurodynamics 2010, 4, 275–294. [Google Scholar] [CrossRef] [Green Version]
- Dager, S.R.; Oskin, N.M.; Richards, T.L.; Posse, S. Research applications of magnetic resonance spectroscopy (MRS) to investigate psychiatric disorders. Top. Magn. Reson. Imaging TMRI 2008, 19, 81. [Google Scholar] [CrossRef] [Green Version]
- Overman, M.J.; Modak, J.; Kopetz, S.; Murthy, R.; Yao, J.C.; Hicks, M.E. Use of research biopsies in clinical trials: Are risks and benefits adequately discussed? J. Clin. Oncol. 2013, 31, 17. [Google Scholar] [CrossRef] [PubMed]
- Olson, E.M.; Lin, N.U.; Krop, I.E.; Winer, E.P. The ethical use of mandatory research biopsies. Nat. Rev. Clin. Oncol. 2011, 8, 620–625. [Google Scholar] [CrossRef] [Green Version]
- Mori, S.; Zhang, J. Principles of diffusion tensor imaging and its applications to basic neuroscience research. Neuron 2006, 51, 527–539. [Google Scholar] [CrossRef] [Green Version]
- Levin, A.; Lischinski, D.; Weiss, Y. Colorization using optimization. In Proceedings of the ACM SIGGRAPH 2004 Papers, Los Angeles, CA, USA, 8–12 August 2004; pp. 689–694. [Google Scholar]
- Jacob, V.G.; Gupta, S. Colorization of grayscale images and videos using a semiautomatic approach. In Proceedings of the 2009 16th IEEE International Conference on Image Processing (ICIP), Cairo, Egypt, 7–10 November 2009; IEEE: New York, NY, USA, 2009. [Google Scholar]
- Dhaniya, R.D.; Umamaheswari, K.M. Brain tumor identification and classification of MRI images using data augmented support vector machine. Cogn. Neurodynamics 2022, 1–11. [Google Scholar] [CrossRef]
- Di Blasi, G.; Reforgiato, D. Fast colorization of gray images. Eurographics Ital. 2003. Available online: http://citeseerx.ist.psu.edu/viewdoc/download?doi=10.1.1.99.6839&rep=rep1&type=pdf (accessed on 2 June 2022).
- Welsh, T.; Ashikhmin, M.; Mueller, K. Transferring color to greyscale images. In Proceedings of the 29th Annual Conference on Computer Graphics and Interactive Techniques, New York, NY, USA, 23–26 July 2002. [Google Scholar]
- Tan, T.; Sim, K.S.; Tan, C.K.; Chong, A.K. CT Image Enhancement by Colorization for Brain Infarct Detection; Faculty of Engineering and Technology, Multimedia University: Melaka, Malaysia, 2008. [Google Scholar]
- Shah, A.A.; Mikita, G.; Shah, K.M. Medical image colorization using optimization technique. Int. J. Sci. Res. Publ. 2013, 62, 235–248. [Google Scholar]
- Attique, M.; Gilanie, G.; Ullah, H.; Mehmood, M.S.; Naweed, M.S.; Ikram, M.; Kamran, J.A.; Viktin, A. Colorization and automated segmentation of human T2 MR brain images for characterization of soft tissues. PLoS ONE 2012, 7, e33616. [Google Scholar] [CrossRef] [Green Version]
- Lagodzinski, P.; Smolka, B. Colorization of medical images. In Proceedings of the APSIPA ASC 2009: Asia-Pacific Signal and Information Processing Association, 2009 Annual Summit and Conference, Taipei, Taiwan, 4 October 2009. [Google Scholar]
- Zhao, Y.; Wang, L.; Jin, W.; Shi, S. Colorizing biomedical images based on color transfer. In Proceedings of the 2007 IEEE/ICME International Conference on Complex Medical Engineering, Beijing, China, 23–27 May 2007; IEEE: New York, NY, USA, 2007. [Google Scholar]
- Popowicz, A.; Smolka, B. Isoline based image colorization. In Proceedings of the 2014 UKSim-AMSS 16th International Conference on Computer Modelling and Simulation, Washington, DC, USA, 26–28 March 2014; IEEE: New York, NY, USA, 2007. [Google Scholar]
- Martinez-Escobar, M.; Foo, J.L.; Winer, E. Colorization of CT images to improve tissue contrast for tumor segmentation. Comput. Biol. Med. 2012, 42, 1170–1178. [Google Scholar] [CrossRef]
- Rathore, Y.; Dhole, A.; Giri, R.; Agrawal, U. Colorization of grayscale images using fully automated approach. Int. J. Electron. Commun. Technol. 2010, 1, 16–419. [Google Scholar]
- Cheng, Z.; Yang, Q.; Sheng, B. Deep colorization. In Proceedings of the IEEE international conference on computer vision, Santiago, Chile, 7–13 December 2015. [Google Scholar]
- Kawulok, M.; Kawulok, J.; Smolka, B. Image Colorization Using Discriminative Textural Features. In Proceedings of the IAPR Conference on Machine Vision Applications MVA 2011, Nara, Japan, 13–15 June 2011. [Google Scholar]
- Choi, Y.-C.; Murtala, S.; Jeong, B.-C.; Choi, K.-S. Deep Learning-Based Engraving Segmentation of 3-D Inscriptions Extracted From the Rough Surface of Ancient Stelae. IEEE Access 2021, 9, 153199–153212. [Google Scholar] [CrossRef]
- Li, B.; Zhao, F.; Su, Z.; Liang, X.; Lai, Y.-K.; Rosin, P.L. Example-based image colorization using locality consistent sparse representation. IEEE Trans. Image Process. 2017, 26, 5188–5202. [Google Scholar] [CrossRef] [Green Version]
- Jayadevan, R.; Lathak, N. A review on recent pseudo-coloring techniques. Int. J. Sci. Tech. Eng. 2015, 1, 344–348. [Google Scholar]
- Liu, S.; Zhang, X. Automatic grayscale image colorization using histogram regression. Pattern Recognit. Lett. 2012, 33, 1673–1681. [Google Scholar] [CrossRef]
- Bugeau, A.; Ta, V.-T. Patch-based image colorization. In Proceedings of the 21st International Conference on Pattern Recognition (ICPR2012), Tsukuba, Japan, 11–15 November 2012; IEEE: New York, NY, USA, 2012. [Google Scholar]
- Nawaz, S.A.; Khan, D.M.; Qadri, S. Brain Tumor Classification Based on Hybrid Optimized Multi-features Analysis Using Magnetic Resonance Imaging Dataset. Appl. Artif. Intell. 2022, 1–27. [Google Scholar] [CrossRef]
- National Cancer Institute (NIH). Cancer Imaging Archive. 2022. Available online: https://www.cancerimagingarchive.net/access-data/ (accessed on 2 June 2022).
- Clark, K.; Vendt, B.; Smith, K.; Freymann, J.; Kirby, J.; Koppel, P.; Moore, S.; Phillips, S.; Maffitt, D.; Pringle, M.; et al. The Cancer Imaging Archive (TCIA): Maintaining and operating a public information repository. J. Digit. Imaging 2013, 26, 1045–1057. [Google Scholar] [CrossRef] [Green Version]
- Garg, N.; Garg, N. Binarization techniques used for grey scale images. Int. J. Comput. Appl. 2013, 71, 8–11. [Google Scholar]
- Belaid, L.J.; Mourou, W. Image segmentation: A watershed transformation algorithm. Image Anal. Stereol. 2009, 28, 93–102. [Google Scholar] [CrossRef]
- Zaman, A.; Ullah, K.; Ullah, R.; Imtiaz, H.H. Image segmentation of MRI image for brain tumor detection. Int. J. Eng. Appl. Sci. Technol. 2019, 4, 50–55. [Google Scholar] [CrossRef]
- Hazra, A.; Dey, A.; Gupta, S.K.; Ansari, A. Brain tumor detection based on segmentation using MATLAB. In Proceedings of the 2017 International Conference on Energy, Communication, Data Analytics and Soft Computing (ICECDS), Chennai, India, 1–2 August 2017; IEEE: New York, NY, USA, 2017. [Google Scholar]
- Zawish, M.; Siyal, A.A.; Ahmed, K.; Khalil, A.; Memon, S. Brain tumor segmentation in MRI images using Chan-Vese technique in MATLAB. In Proceedings of the 2018 International Conference on Computing, Electronic and Electrical Engineering (ICE Cube), Quetta, Pakistan, 8–9 October 2018; IEEE: New York, NY, USA, 2018. [Google Scholar]
- Tarhini, G.M.; Shbib, R. Detection of brain tumor in MRI images using watershed and threshold-based segmentation. Int. J. Signal Process. Syst. 2020, 8, 19–25. [Google Scholar] [CrossRef]
- Jamil, M.M.A.; Oussama, L.; Hafizah, W.M.; Wahab, M.H.A.; Johan, M.F. Computational automated system for red blood cell detection and segmentation. In Intelligent Data Analysis for Biomedical Applications; Elsevier: Amsterdam, The Netherlands, 2019; pp. 173–189. [Google Scholar]
- Salman, N. Image segmentation based on watershed and edge detection techniques. Int. Arab. J. Inf. Technol. 2006, 3, 104–110. [Google Scholar] [CrossRef]
- Senthilkumaran, N.; Rajesh, R. Image segmentation-a survey of soft computing approaches. In Proceedings of the 2009 International Conference on Advances in Recent Technologies in Communication and Computing, Washington, DC, USA, 27–28 October 2009; IEEE: New York, NY, USA, 2009. [Google Scholar]
Figure 1.
BVH dataset. (a) Original image; (b) converted grayscale; (c) binarized image.

Figure 2.
Rider dataset. (a) Original image; (b) converted grayscale; (c) binarized image.

Figure 3.
Proposed step-by-step methodology of grayscale image colorization.

Figure 4.
Pseudocode of watershed segmentation algorithm with local minima.

Figure 5.
Proposed grayscale colorization method.

Figure 6.
Processing and results of BVH dataset. (a) Grayscale image; (b) segmentation; (c) morphological operations; (d) ROI selection and coloring; (e) differentiated tissue.
Figure 6.
Processing and results of BVH dataset. (a) Grayscale image; (b) segmentation; (c) morphological operations; (d) ROI selection and coloring; (e) differentiated tissue.

Figure 7.
Processing and results of an image from the Rider Neuro dataset. (a) Grayscale image; (b) segmentation; (c) morphological operations; (d) ROI selection and coloring; (e) differentiated tissue.
Figure 7.
Processing and results of an image from the Rider Neuro dataset. (a) Grayscale image; (b) segmentation; (c) morphological operations; (d) ROI selection and coloring; (e) differentiated tissue.

Figure 8.
Processing and results of BVH dataset. (a) Grayscale image; (b) segmentation; (c) morphological operations; (d) ROI selection and coloring; (e) differentiated tissue.
Figure 8.
Processing and results of BVH dataset. (a) Grayscale image; (b) segmentation; (c) morphological operations; (d) ROI selection and coloring; (e) differentiated tissue.

Figure 9.
Processing and results of an image from Rider Neuro dataset. (a) Grayscale image; (b) segmentation; (c) morphological operations; (d) ROI selection and coloring; (e) no tissue identified.
Figure 9.
Processing and results of an image from Rider Neuro dataset. (a) Grayscale image; (b) segmentation; (c) morphological operations; (d) ROI selection and coloring; (e) no tissue identified.

Figure 10.
PNSR value analysis.

Figure 11.
SSIM analysis.


Table 1.
Implementation environment.
| System Specifications | Values |
|---|---|
| Processor | Intel Core i7 |
| Memory | 8 Gb |
| MATLAB version | MATLAB R2018a |
| Operating system | Windows 10 (64 bit) |
Table 2.
Algorithmic accuracy of the system.
| Tumor Images | Non Tumor Images | ||||
|---|---|---|---|---|---|
| Total | Correctly Identified | Accuracy | Total | Correctly Identified | Accuracy |
| 24 | 24 | 100% | 11 | 11 | 100% |
Table 3.
Tumor size calculation.
| Sr. No | Image Id | Tumor Size (mm) | Image Sizing |
|---|---|---|---|
| 1 | R1 | 4390 | 200 × 200 |
| 2 | R2 | 5076 | |
| 3 | R4 | 4089 | |
| 4 | R5 | 6050 | |
| 5 | R7 | 8014 | |
| 6 | R9 | 9088 | |
| 7 | R10 | 1276 | |
| 8 | R11 | 2156 | |
| 9 | R12 | 3891 | |
| 10 | R13 | 4093 | |
| 11 | R14 | 4891 | |
| 12 | R16 | 8972 | |
| 13 | R17 | 9086 | |
| 14 | R18 | 4712 | |
| 15 | R19 | 6058 | |
| 16 | B1 | 8912 | |
| 17 | B3 | 9525 | |
| 18 | B4 | 9062 | |
| 19 | B5 | 12,908 | |
| 10 | B6 | 9012 | |
| 11 | B7 | 8420 | |
| 12 | B9 | 9150 | |
| 13 | B12 | 7056 | |
| 14 | B14 | 9630 |
Publisher’s Note: MDPI stays neutral with regard to jurisdictional claims in published maps and institutional affiliations. |
© 2022 by the authors. Licensee MDPI, Basel, Switzerland. This article is an open access article distributed under the terms and conditions of the Creative Commons Attribution (CC BY) license (https://creativecommons.org/licenses/by/4.0/).
Share and Cite
MDPI and ACS Style
Haq, I.; Ullah, N.; Mazhar, T.; Malik, M.A.; Bano, I. A Novel Brain Tumor Detection and Coloring Technique from 2D MRI Images. Appl. Sci. 2022, 12, 5744. https://0-doi-org.brum.beds.ac.uk/10.3390/app12115744
AMA Style
Haq I, Ullah N, Mazhar T, Malik MA, Bano I. A Novel Brain Tumor Detection and Coloring Technique from 2D MRI Images. Applied Sciences. 2022; 12(11):5744. https://0-doi-org.brum.beds.ac.uk/10.3390/app12115744
Chicago/Turabian StyleHaq, Inayatul, Najib Ullah, Tehsen Mazhar, Muhammad Amir Malik, and Iqra Bano. 2022. "A Novel Brain Tumor Detection and Coloring Technique from 2D MRI Images" Applied Sciences 12, no. 11: 5744. https://0-doi-org.brum.beds.ac.uk/10.3390/app12115744
Note that from the first issue of 2016, this journal uses article numbers instead of page numbers. See further details here.