Article

Complexity Analysis in the PR, QT, RR and ST Segments of ECG for Early Assessment of Severity in Cardiac Autonomic Neuropathy

by
Sharanya Senthamil Selvan
1,
Sridhar P. Arjunan
1,*,
Ramakrishnan Swaminathan
2 and
Dinesh Kant Kumar
3
1
Department of Electronics and Instrumentation Engineering, SRM Institute of Science and Technology, Kattankulathur 603203, India
2
Department of Applied Mechanics, Indian Institute of Technology Madras, Chennai 600036, India
3
Biosignals Lab, School of Engineering, RMIT University, Melbourne, VIC 3001, Australia
*
Author to whom correspondence should be addressed.
Submission received: 26 April 2022 / Revised: 26 May 2022 / Accepted: 2 June 2022 / Published: 6 June 2022
(This article belongs to the Section Biomedical Engineering)

Abstract

:
Early-stage detection of cardiac autonomic neuropathy (CAN) is important for better management of the disease and prevents hospitalization. This study has investigated the complex nature of PR, QT, RR, and ST time segments of ECG signals by computing the fractal dimension (FD) of all segments from 20 min ECG recordings of people with different severity of the disease and healthy individuals. The mean computed for each ECG time segment to distinguish between subjects was insufficient for an early diagnosis. Statistical analysis shows that the change of FD in various time segments of ECG throughout the recording was most suitable to assess the steps for severity in symptoms of CAN between the healthy and the subjects with early symptoms of CAN. The complexity of ECG features was evaluated using various classifier models, namely, support vector machine (SVM), naïve Bayes, random forest, K-nearest neighbor (KNN), AdaBoost, and neural networks. Performance measures were computed on all models, with a maximum neural network classifier having an accuracy of 96.9%. Feature ranking results show that fractal features have more significance than the time segments of ECG in differentiating the subjects. The results of statistical validation show that all the selected features based on ECG physiology proved to have an evident complexity change between normal and severity stages of CAN. Thus, this work reports the complexity analysis in all the selected time segments of ECG that can be an effective tool for early diagnostics for CAN.

1. Introduction

Over the last decade, diabetes and the consequences related to diabetes have become a major public health issue. One such underdiagnosed disorder is cardiac autonomic neuropathy (CAN), which prevails in patients with a long-standing history of diabetes. Diabetes mellitus (DM) affects about 510 million people, or 9.2% of the global population [1]. Cardiac autonomic neuropathy (CAN) is a frequent complication of DM [2] prevalent in both type I and type II DM [3]. Duration of diabetes and poor glycemic control play a substantial role in patients diagnosed with CAN [4]. CAN was a consequence of long-term diabetes, but recent studies have found its prevalence even in the preliminary stages of diabetes. Some of the abnormalities associated with CAN are resting tachycardia [5], exercise intolerance, hypertension, high BMI, higher cholesterol levels, proliferative retinopathy, polyneuropathy, and silent myocardial infarction [6]. Many symptoms are common in diabetic patients, silent in the earlier stages and proliferating faster, and increasing the risk of mortality in diabetic patients [7].
Many patients are asymptomatic in the early stages of CAN and only a few patients progress to severe symptoms [8]. Early detection of CAN leads to better health care. The routine clinical assessment for CAN requires an analysis of an electrocardiogram (ECG) [9]. There are morphological changes corresponding to CAN that are evident in heart activity, therefore better understanding of methods for interpreting the ECG is important [10].
ECG is the electrical recording associated with cardiac activity; a single heartbeat corresponds to one normal sinus cycle of ECG that is described by five indenting points: P, Q, R, S, and T. Healthy heart activity should be consistent and regular but not periodic [11], periodicity defined based on RR interval. Heart rate variability (HRV) has been reported to be associated with CAN [12,13]. A decrease in HRV is a clinical indicator of early CAN (eCAN) [14]. The majority of research on the topic has focused on the variation of the RR intervals [15], while other intervals are also associated with CAN.
QT segment indicates the systolic phase of a cardiac cycle, and a prolonged QT interval [12] is an indicator of myocardial ischemia, commonly found in CAN patients. QT interval prolongation marks a sign of definite CAN (dCAN). ST segment is associated with myocardial ischemia and is hence suitable for CAN diagnosis [13]. Depression in the ST segment implies that there are acute variations that indicate the severe CAN (sCAN) in individuals. PR segment indicates a delay between atrial and ventricular activation and is found to be associated with QT changes. Thus, four ECG segments, PR, QT, RR, and ST, have associations with different severity of the disease. However, there are significant inter-beat variations of these features because of which there can be errors. Earlier studies have focused on one of the segments.
ECG signals have self-similar patterns that are repetitive, and abnormality in the morphological functioning of the heart changes the repetitive structure of the ECG wave [16]. Identifying the ECG features specific to CAN requires accurate segmentation of the signal, which can be a challenge [17]. Fractal dimension (FD) is a measure of self-similarity [18]. It is a global feature that identifies the signal trend and is thus not disturbed by inter-segment variation. We hypothesize that FD of ECG is associated with CAN and is suitable for early detection of the disease. This study has investigated the complexity in FD of each of the four segments: PR, QT, RR, and ST. All the four segments at different instants and their corresponding fractal values are given for the linear and nonlinear models to identify the best possible feature to classify normal from the CAN group.

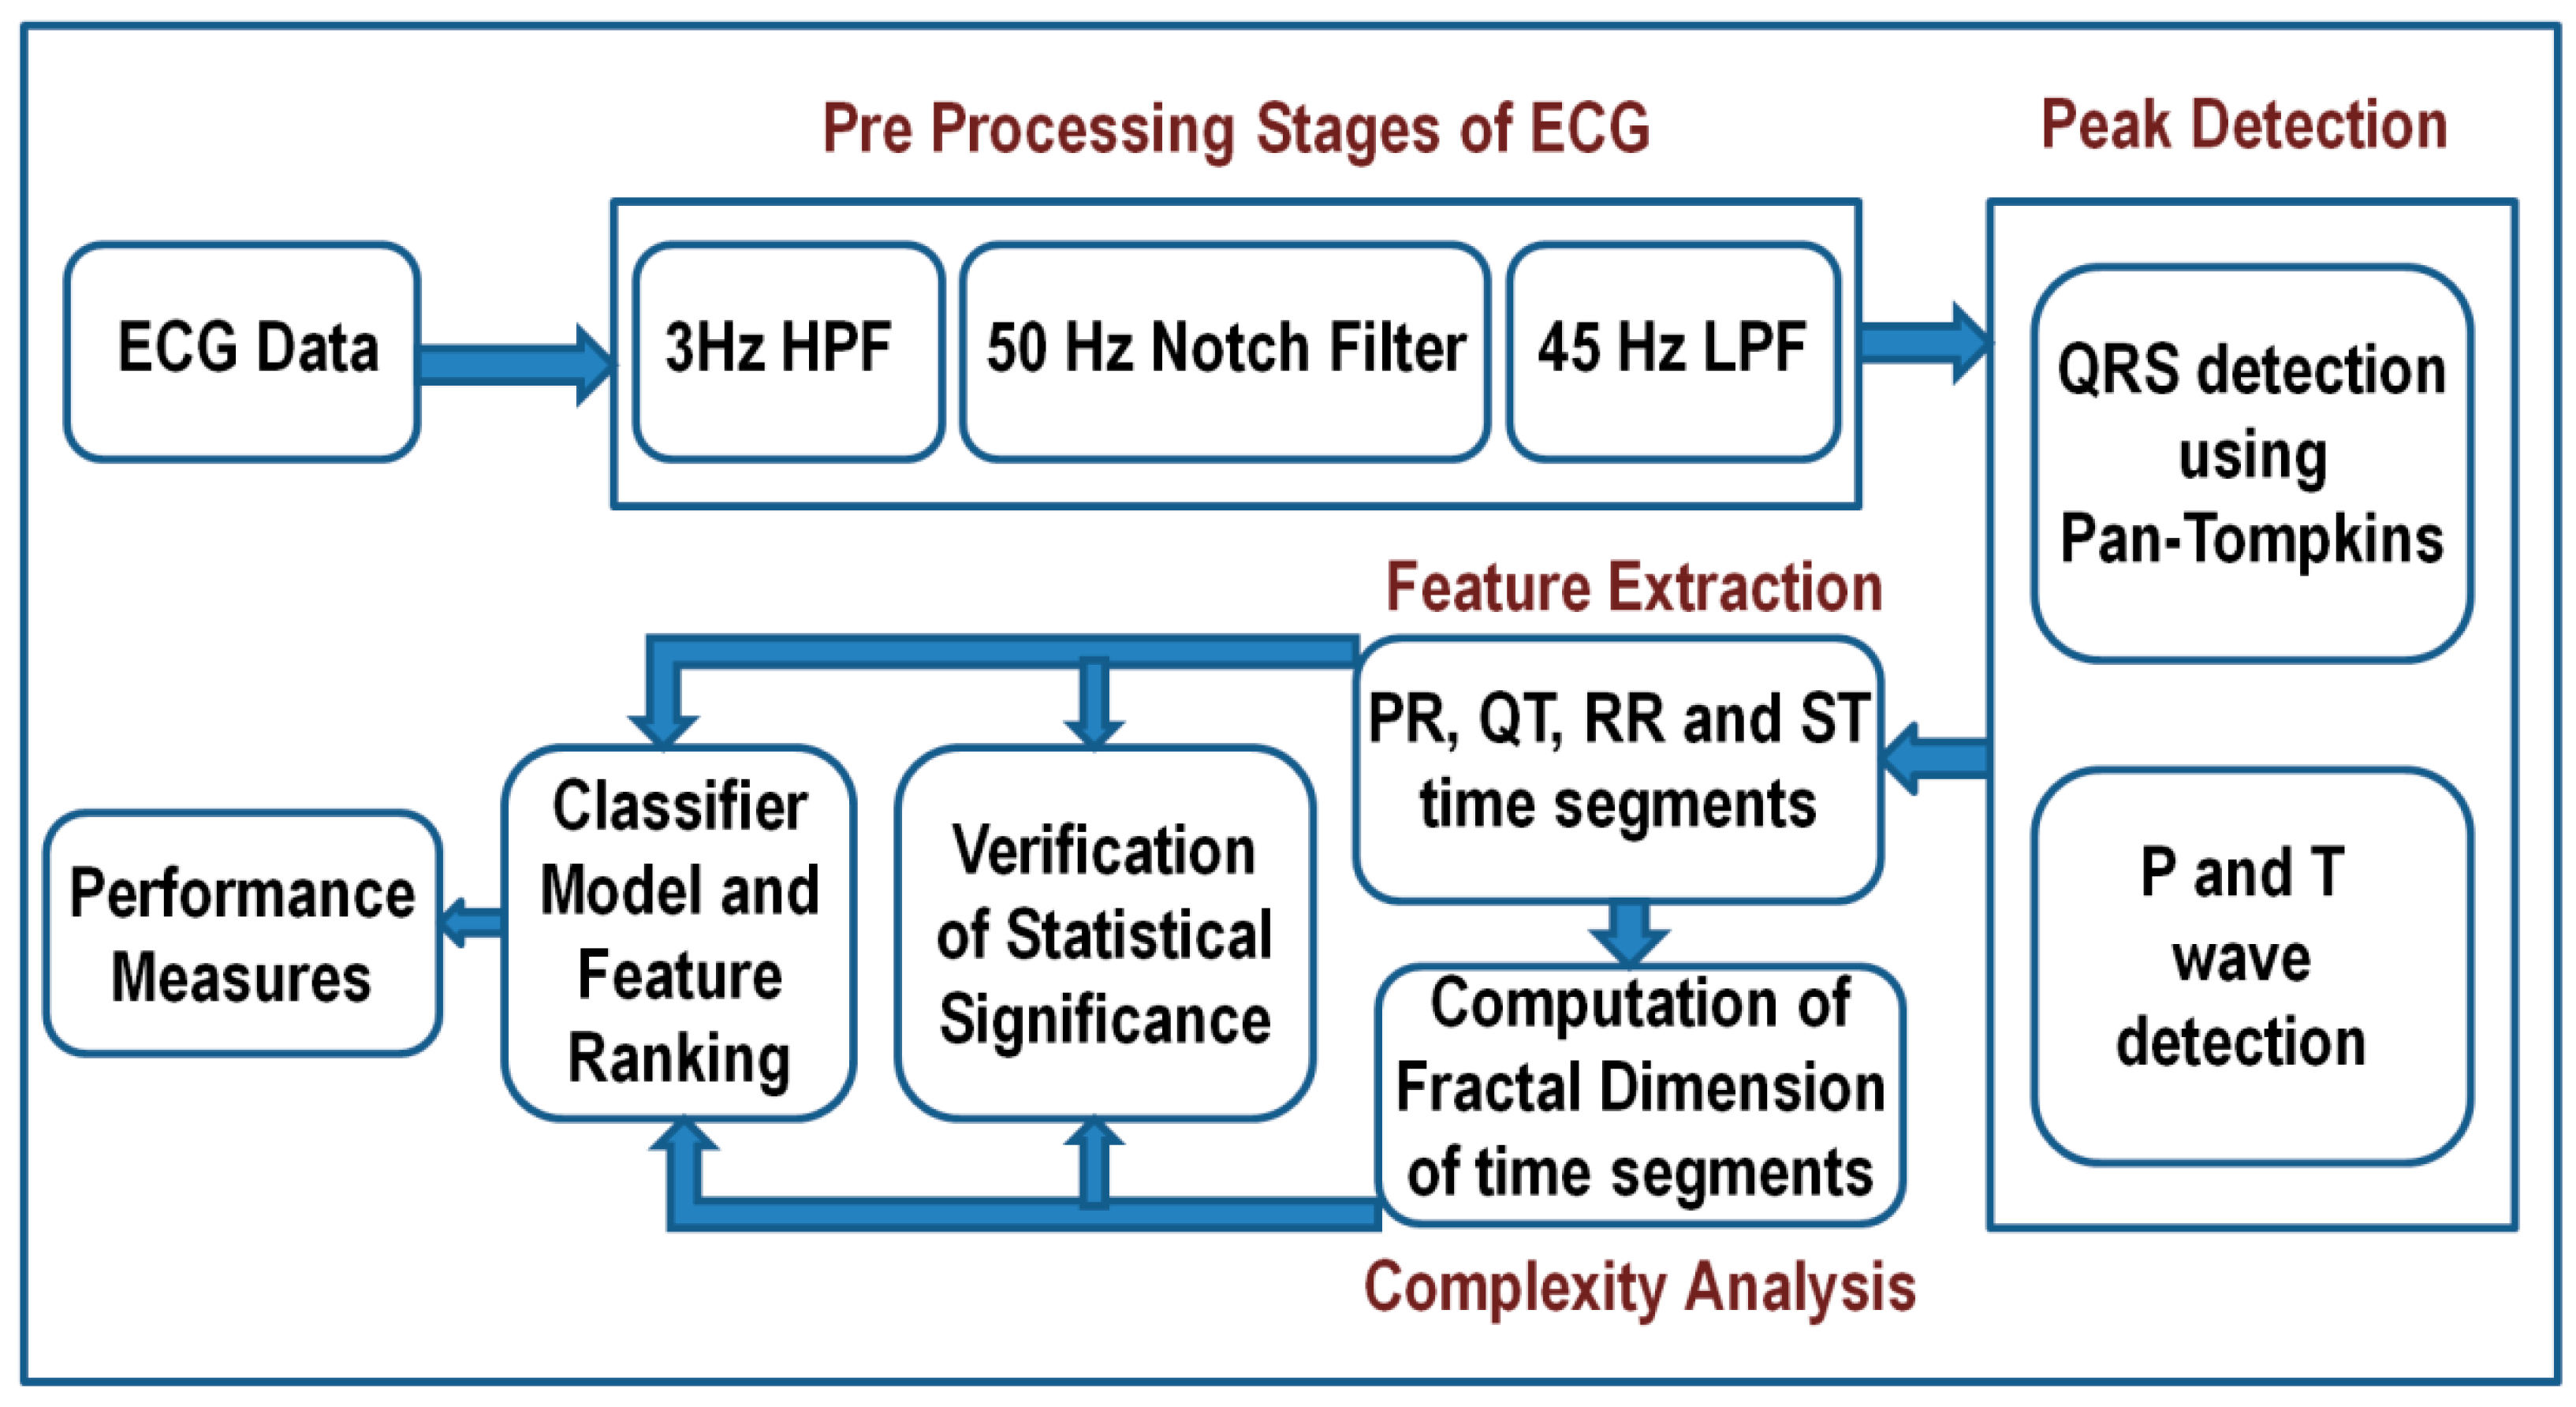
2. Material and Methods

2.1. ECG Data

This study used the data reported by Cornforth et al. [11]. ECG was recorded from participants in a supine position with a stable environmental temperature after a minimum of 5 min of rest period. ECG was recorded for 20 min using lead II configuration and digitally saved with a sampling rate of 400 samples/second. Participants were grouped based on Ewing battery score from a series of 5 bed side tests, ranging from 0 to 5 scale into normal (0–1), early CAN (1.5–2), definite CAN (2.5–3), and severe CAN (3.5–5). The clinical information of the individuals is given in Table 1.

2.2. The Schematic of Data Analysis

The steps in the proposed ECG analysis method are mentioned below and are shown in the block diagram representation in Figure 1.
  • Read the ECG signal.
  • Implement signal preprocessing to remove noise.
  • Feature extraction (QRS complex, P and T point) from ECG.
  • Extract time intervals from ECG segments (say, PR, QT, RR, and ST).
  • Analyze the data at four instants of time within the same signal for each segment to study the complexity variation.
  • Statistical validation for the analyzed time segments for identification of CAN.
  • Classification of time and complexity features with different classifier models and feature ranking.
  • Performance measure of classifiers used.

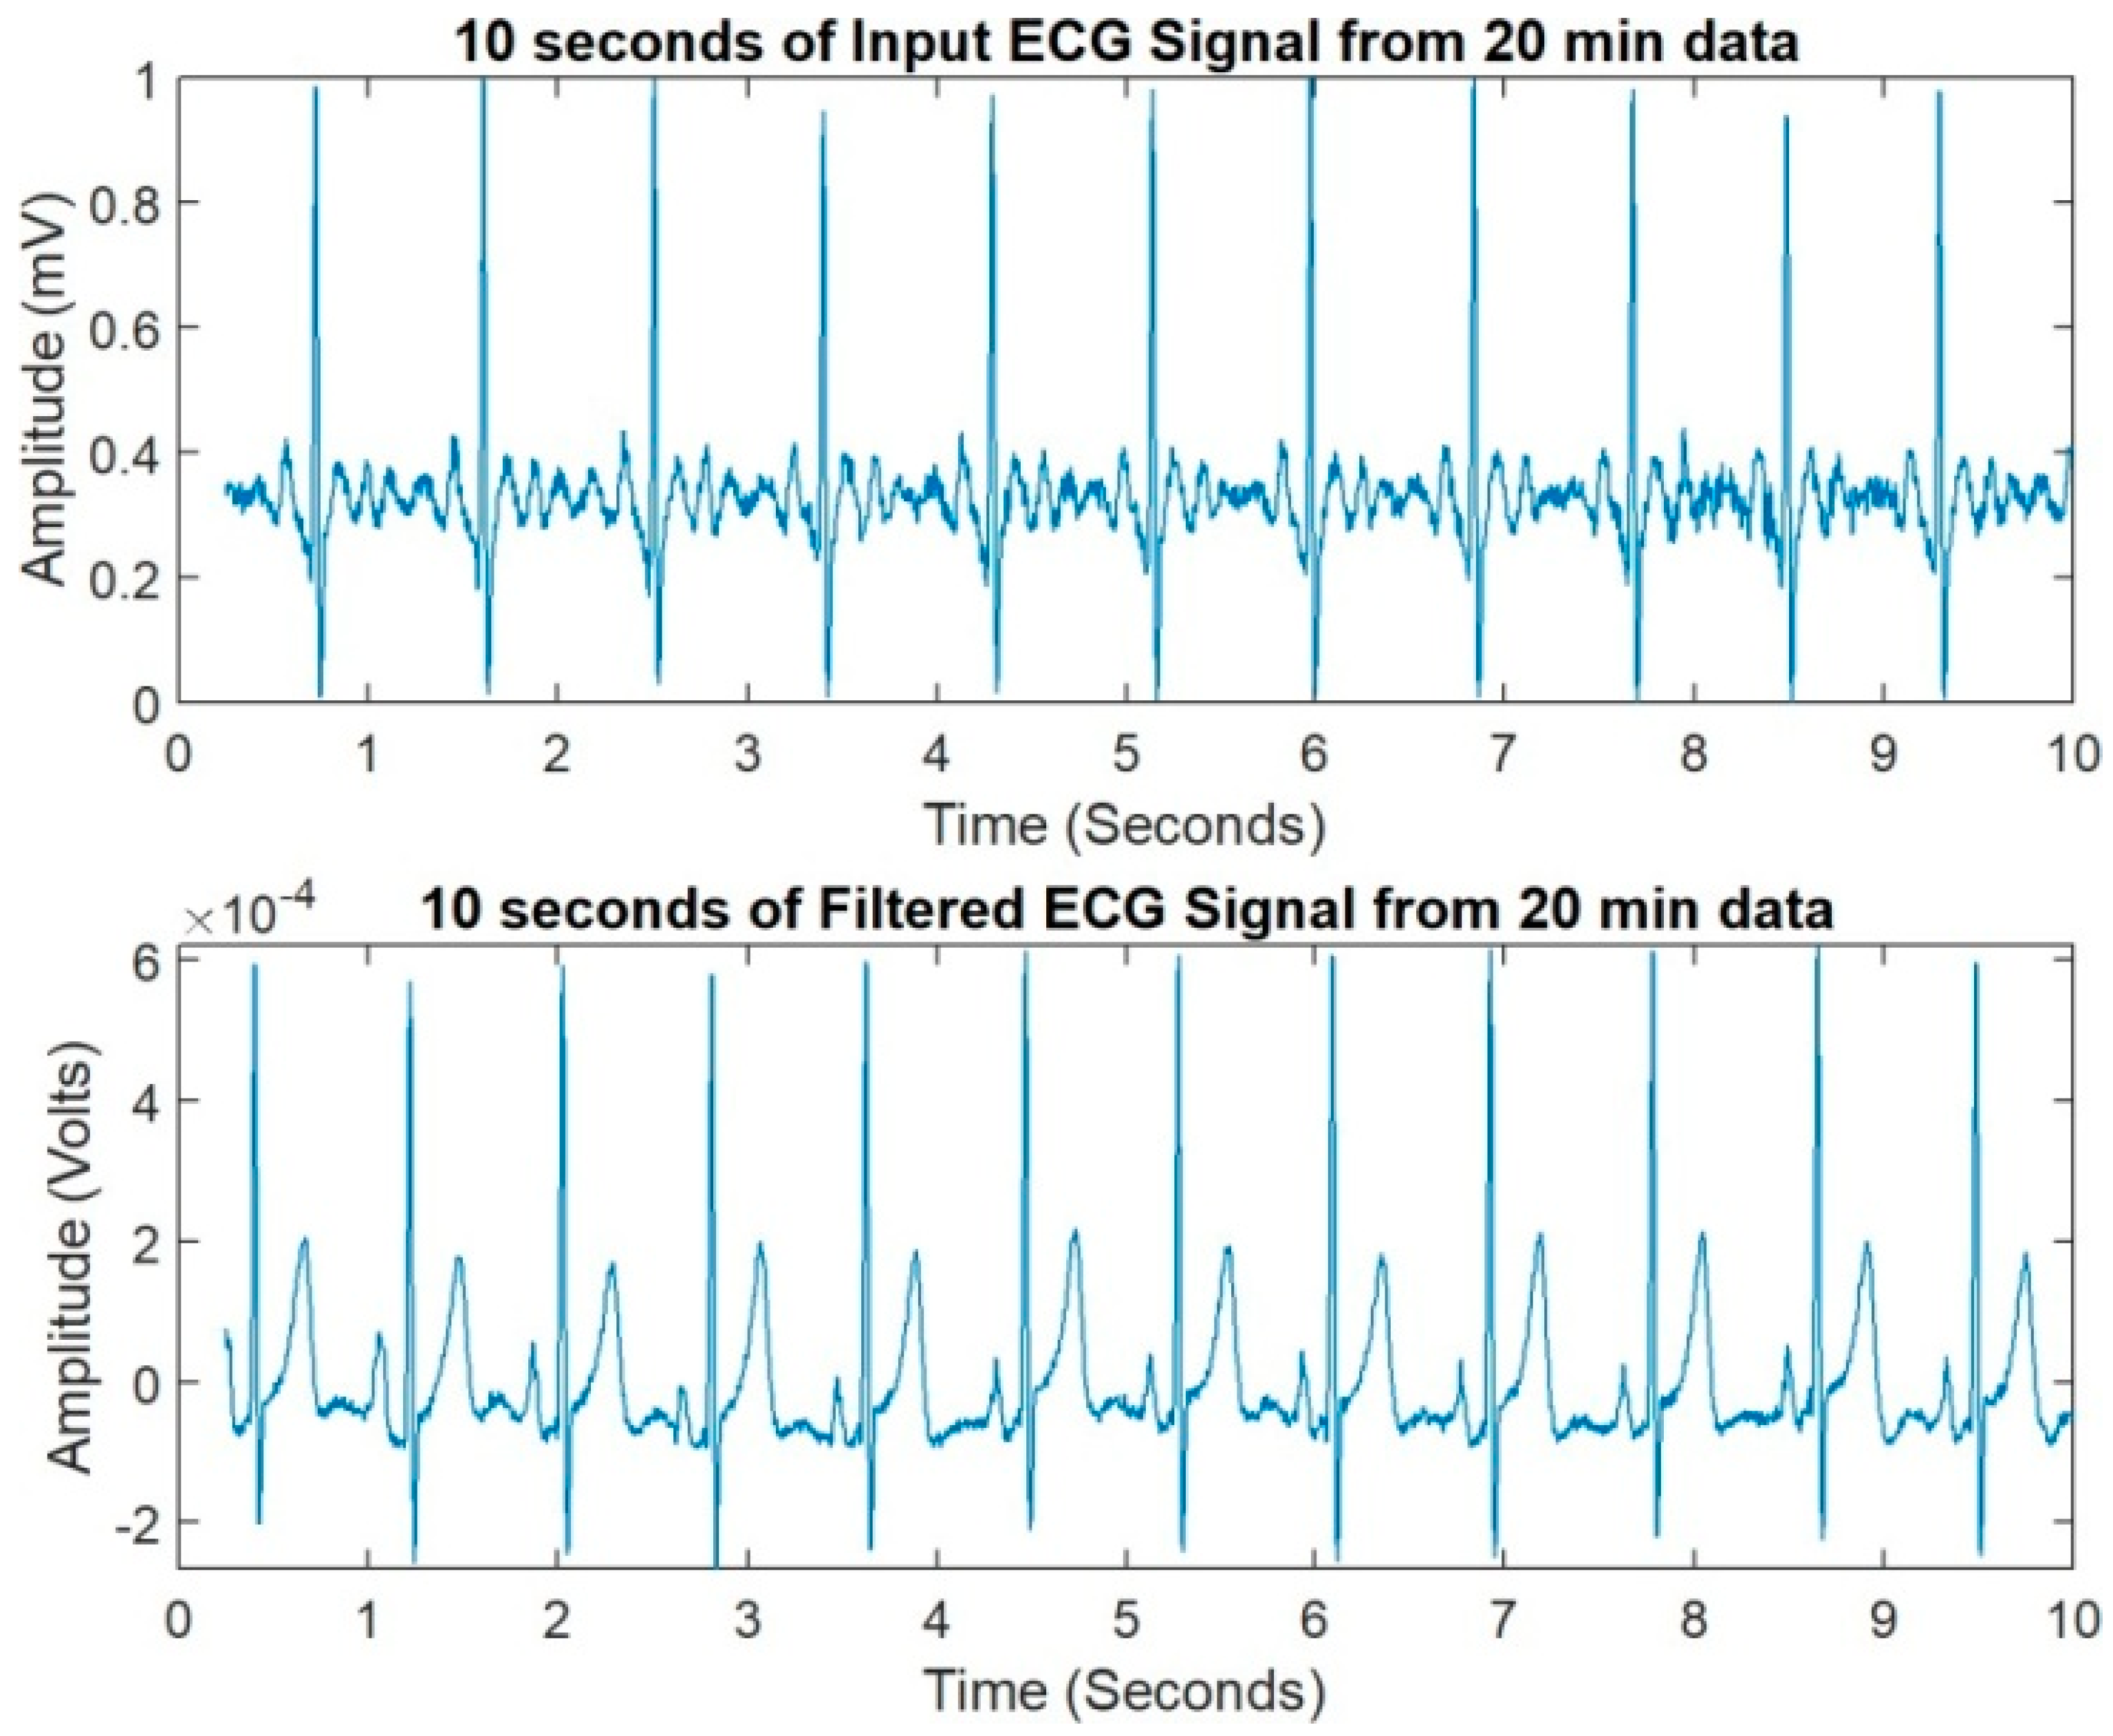
2.3. Signal Preprocessing

Preprocessing of ECG to suppress unwanted noise and artifacts, such as power line interference, base line wander, improper grounding effects, and movement artifact [19], is an important step to improve the quality of the signal. Preprocessing and extraction of ECG features of interest that are reliable/non-invasive remain a challenge and studies have reported different methods on this [20,21], with spectral filtering being the most common. The spectrum of ECG signal lies within 0.05–100 Hz; however, useful information is generally accepted to be between 0.5–45 Hz. In this study, a series of filters were used. The raw signal was high-pass filtered (second-order Butterworth) with a cut-off of 3 Hz to remove baseline drift, and a 45 Hz (second-order Butterworth) low-pass filter was employed to remove high-frequency noise. The ten-second window of the signal before and after filtering is shown in Figure 2. To visualize the signal, a time-axis magnified signal showing two consecutive R peaks is shown in Figure 3.

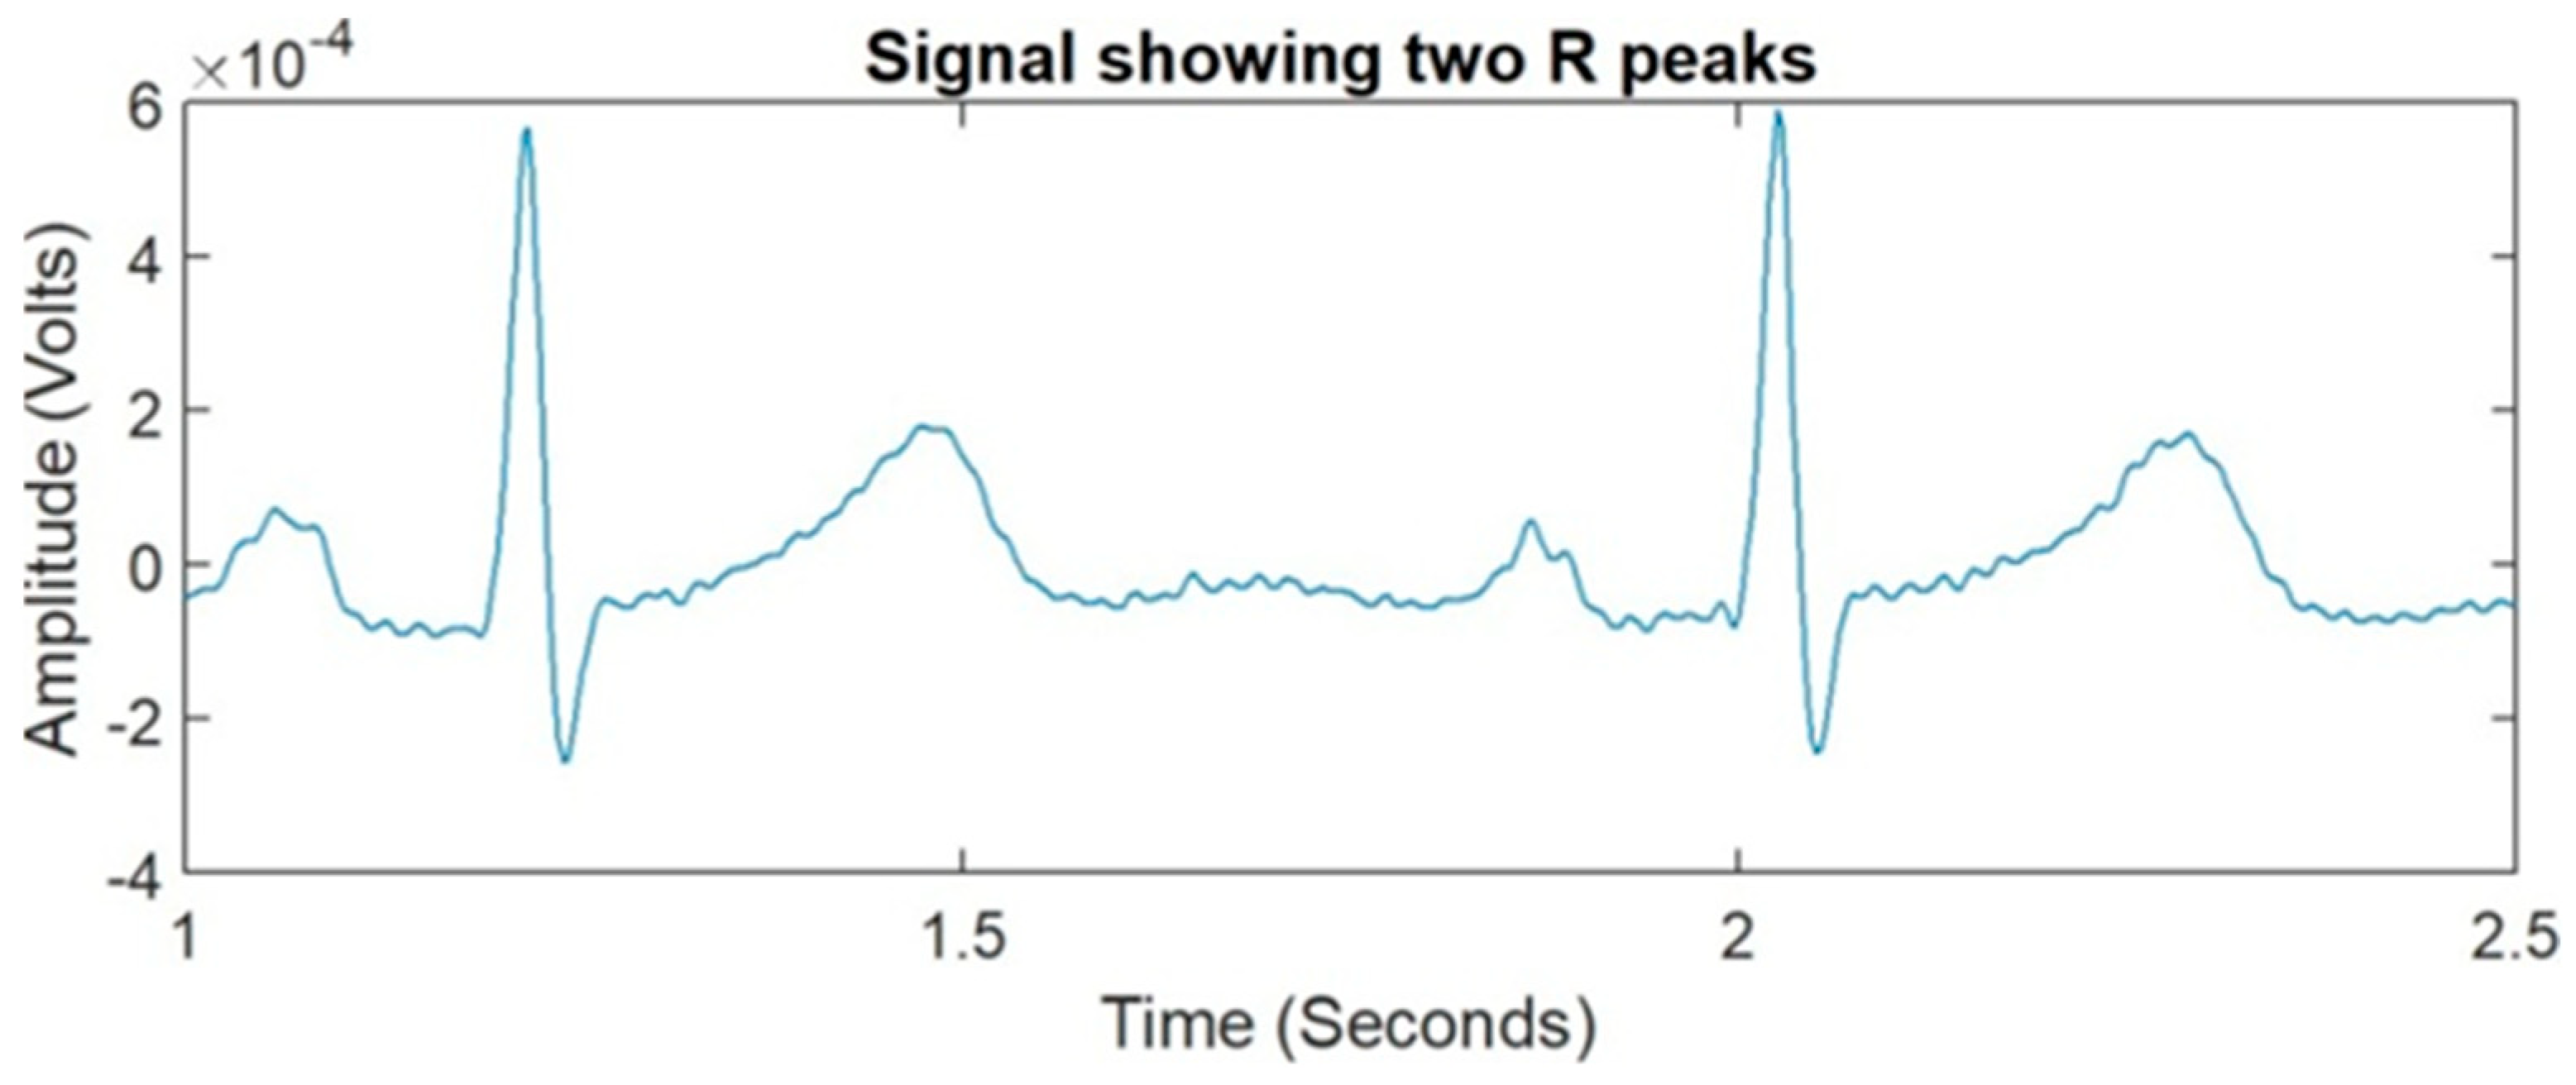
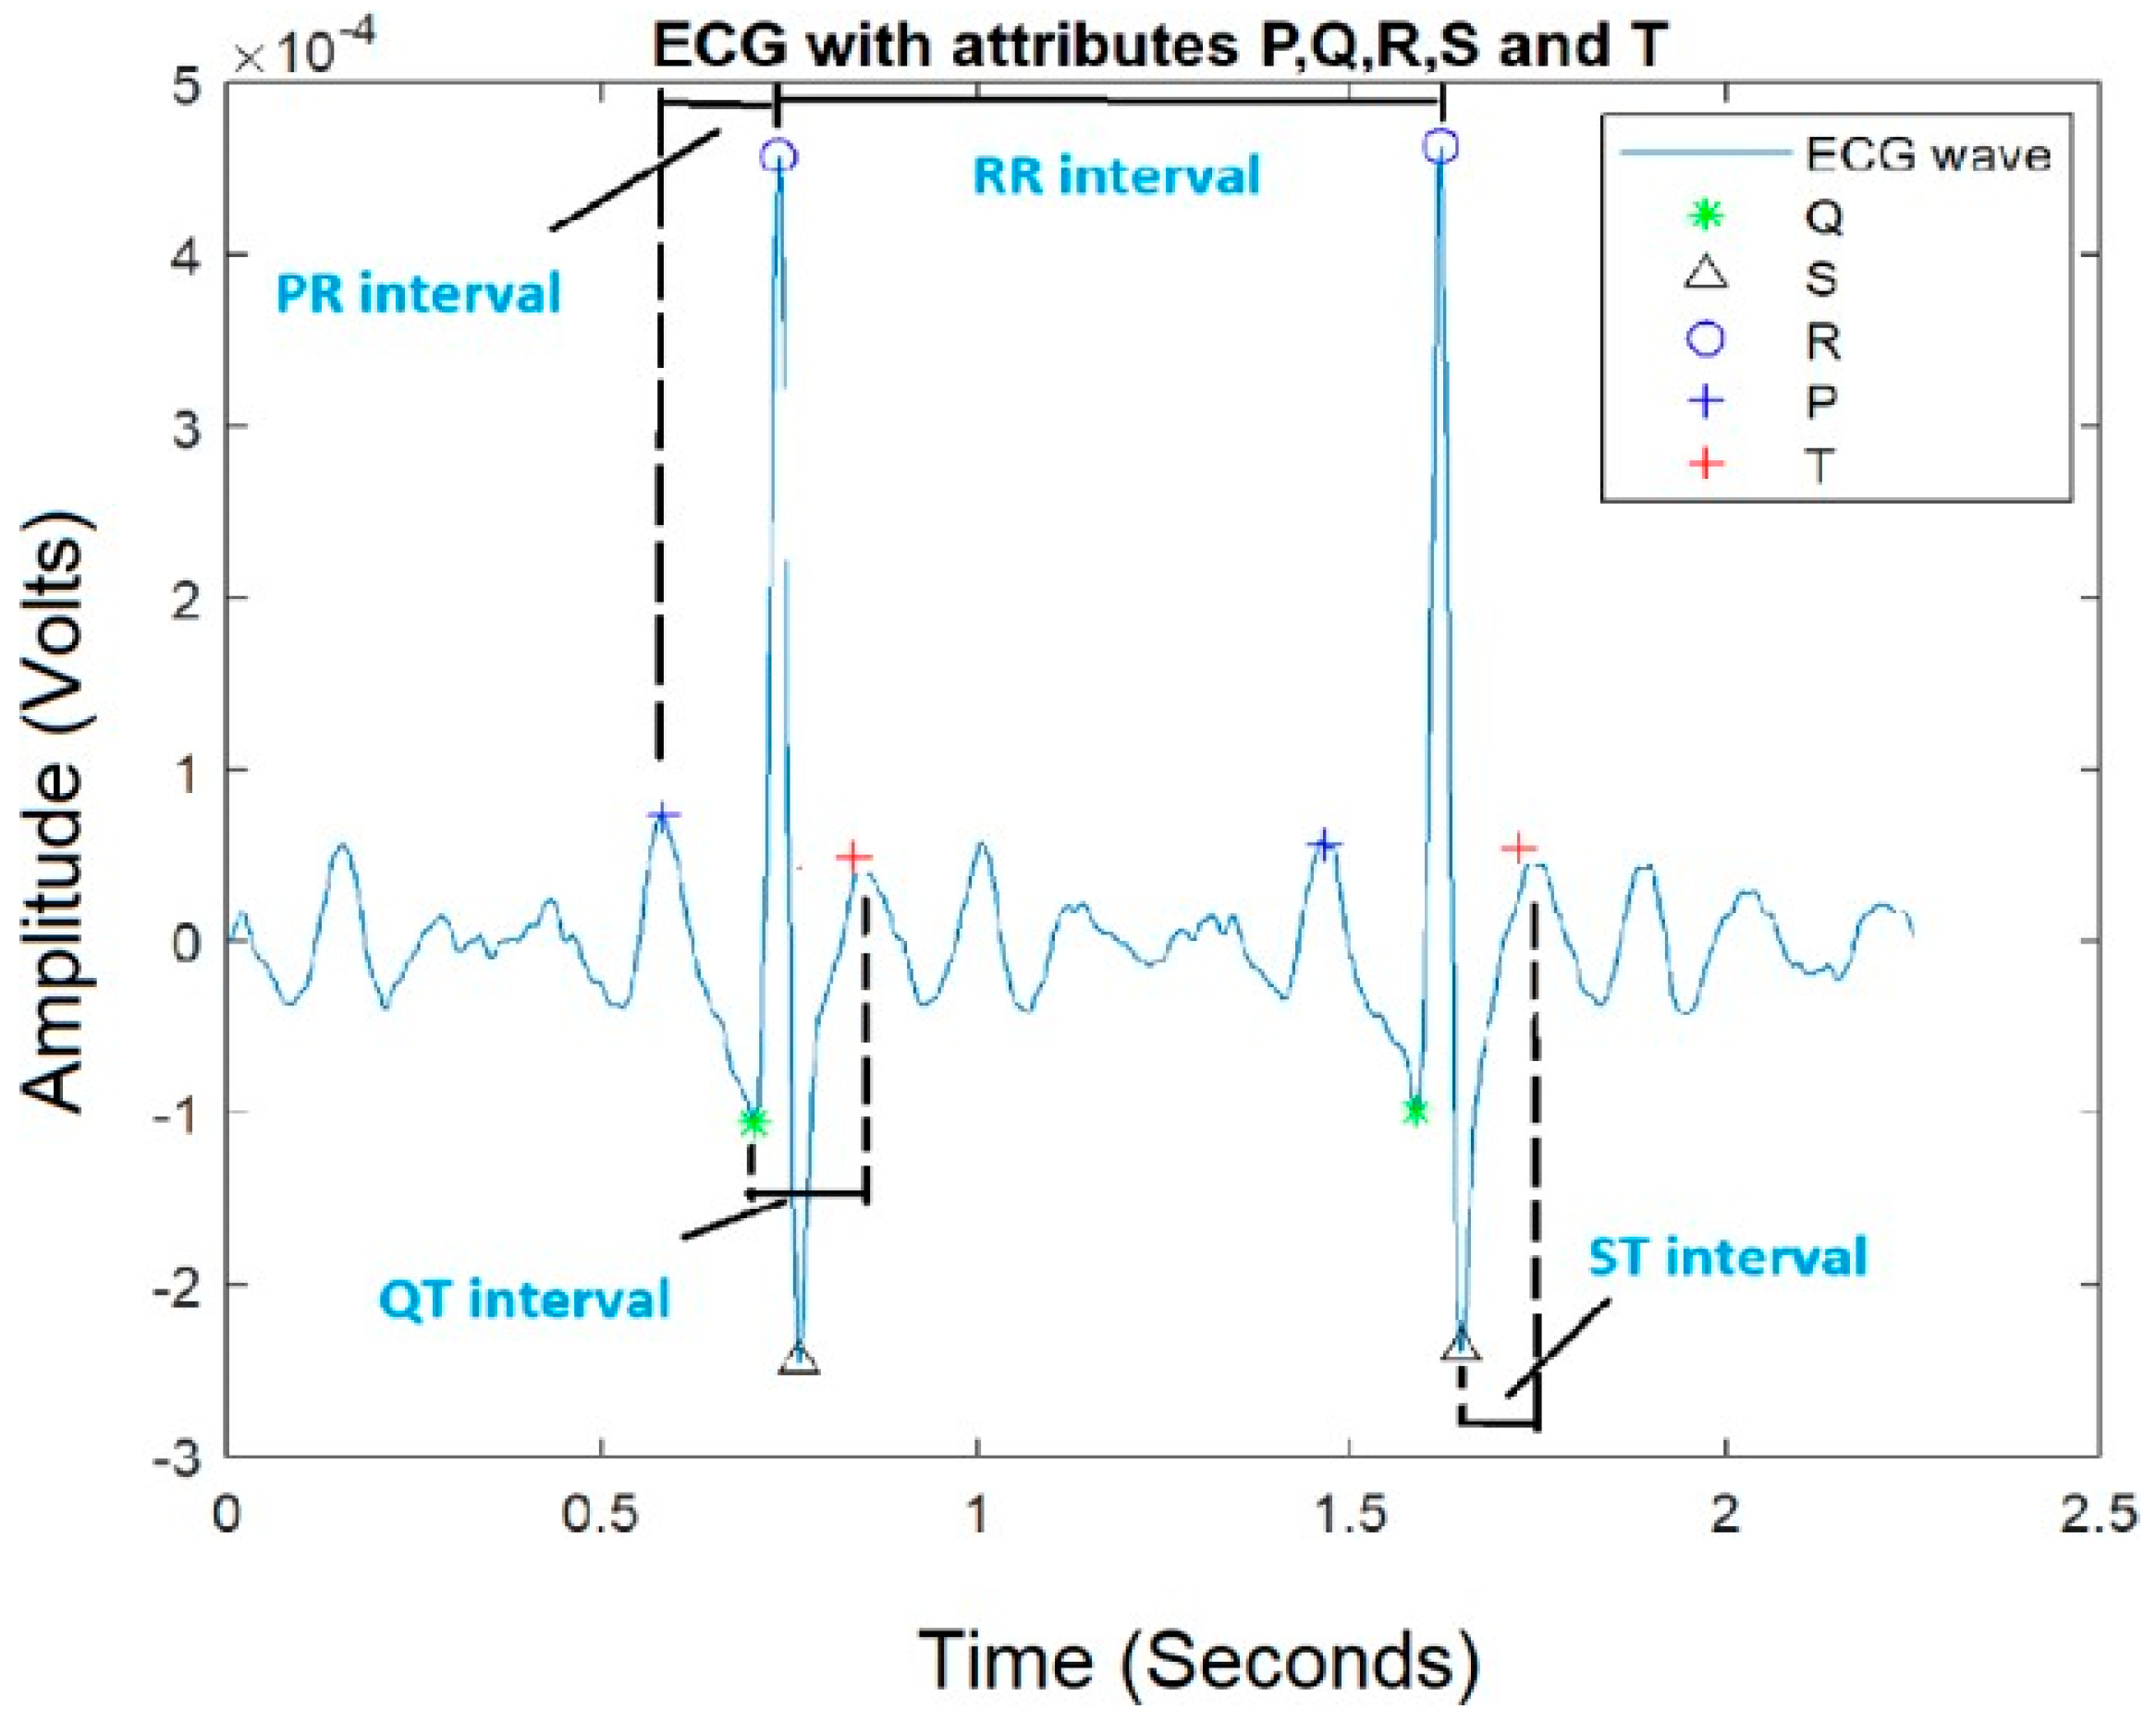
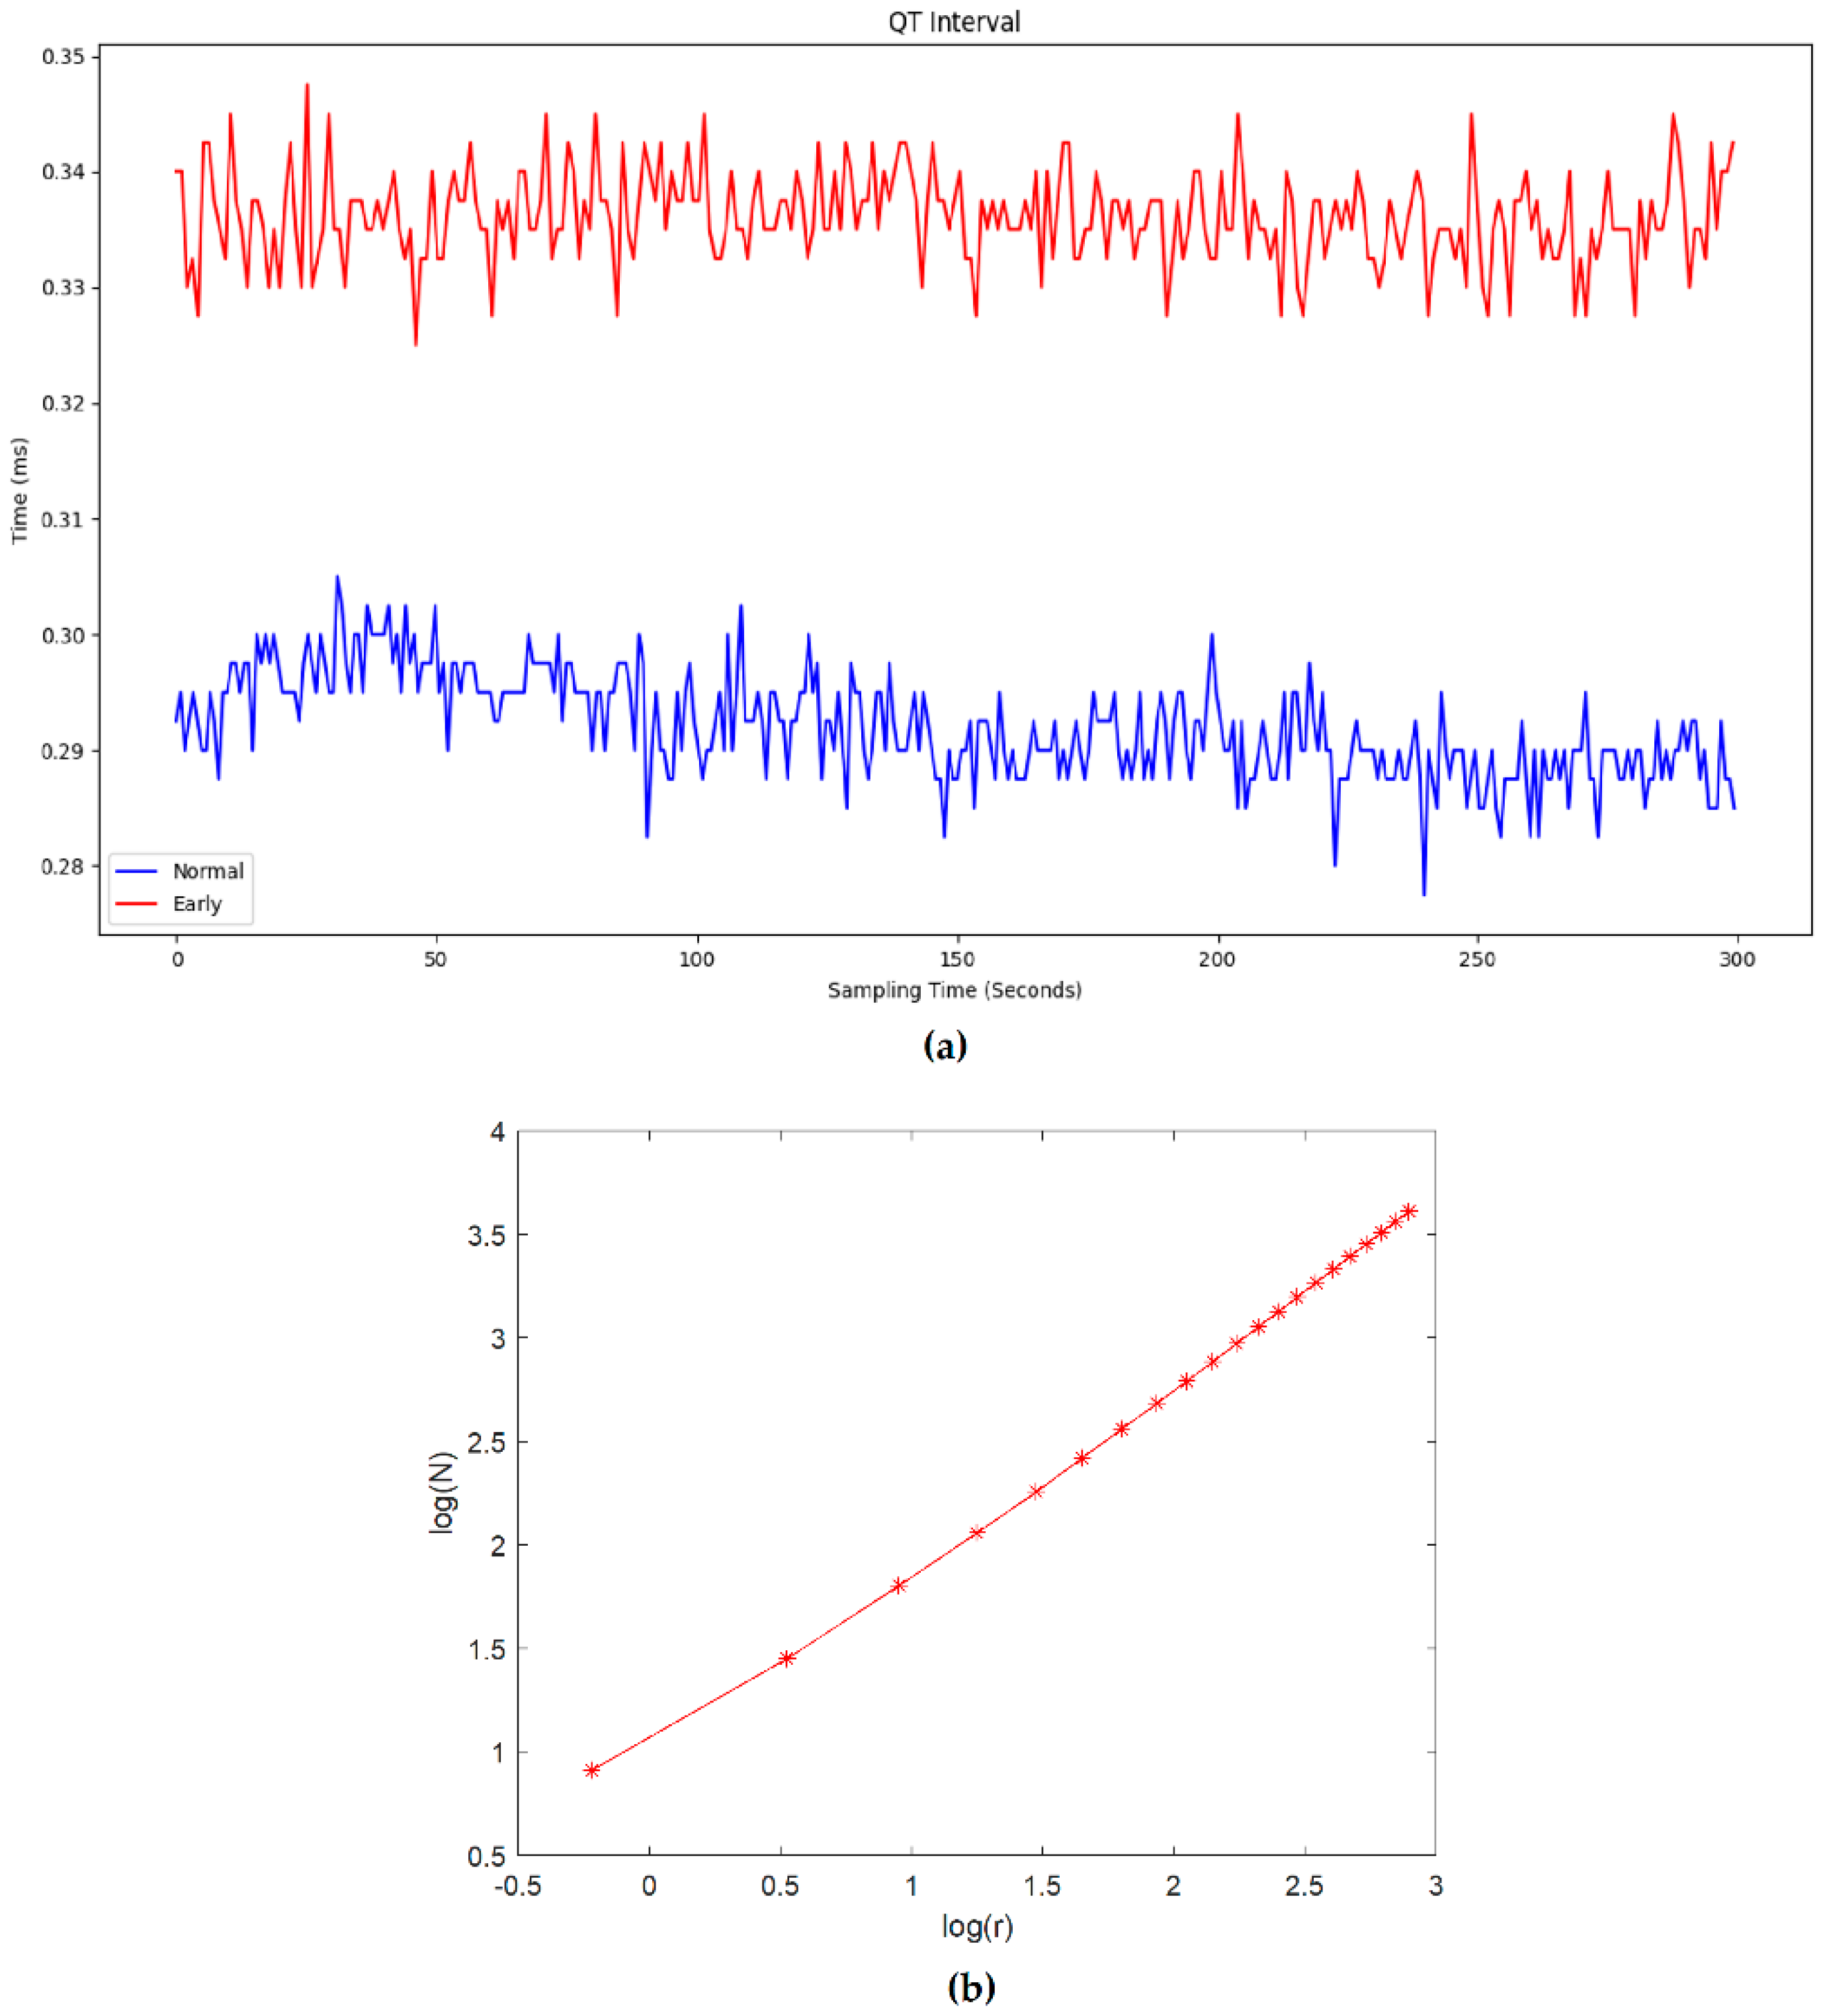
2.4. Segment Extraction from ECG

After preprocessing, the next stage was the extraction of the relevant features. This requires the detection of the five attribute points, P, Q, R, S, and T. Pan–Tompkins algorithm was used to identify the QRS complex [22], which employs a series of filters such as LPF, HPF, derivative, squaring, and moving window integration. The other two attributes, P and T, were identified using the R point as the reference. The next step was to obtain the four segments, i.e., PR, QT, RR, and ST [23]. The ECG wave with the segments is illustrated in Figure 4.

2.5. Complexity Analysis

The time intervals of all the ECG segments were computed and tabulated as time-series arrays. While there are several techniques for computing FD of ECG [24,25,26], the differential box-counting (DBC) method was used in this study [27]. A mesh is placed over the entire signal which is partitioned into boxes of size r, and N(r) specifies the largest difference between the boxes for the entire duration of the signal. FD is obtained using Equation (1):
FD   ( DBC ) = log N ( r ) log ( r )
This method was selected because it has been reported to be computationally efficient and reproducible. To compute the fractal dimension, the time intervals of the segments were extracted and one such segment (QT segment) of the normal and early CAN group is illustrated in Figure 5a. A plot between log N and log r for the computation of FD value is shown for a normal signal in Figure 5b, having 21 r values.
Two types of tests were carried out on the data, one for the complexity analysis on the entire duration (20 min), and the second one was to consider the changes in complexity using FD at every 5th minute of the ECG signal. FD value of all segments was computed for individual subjects.

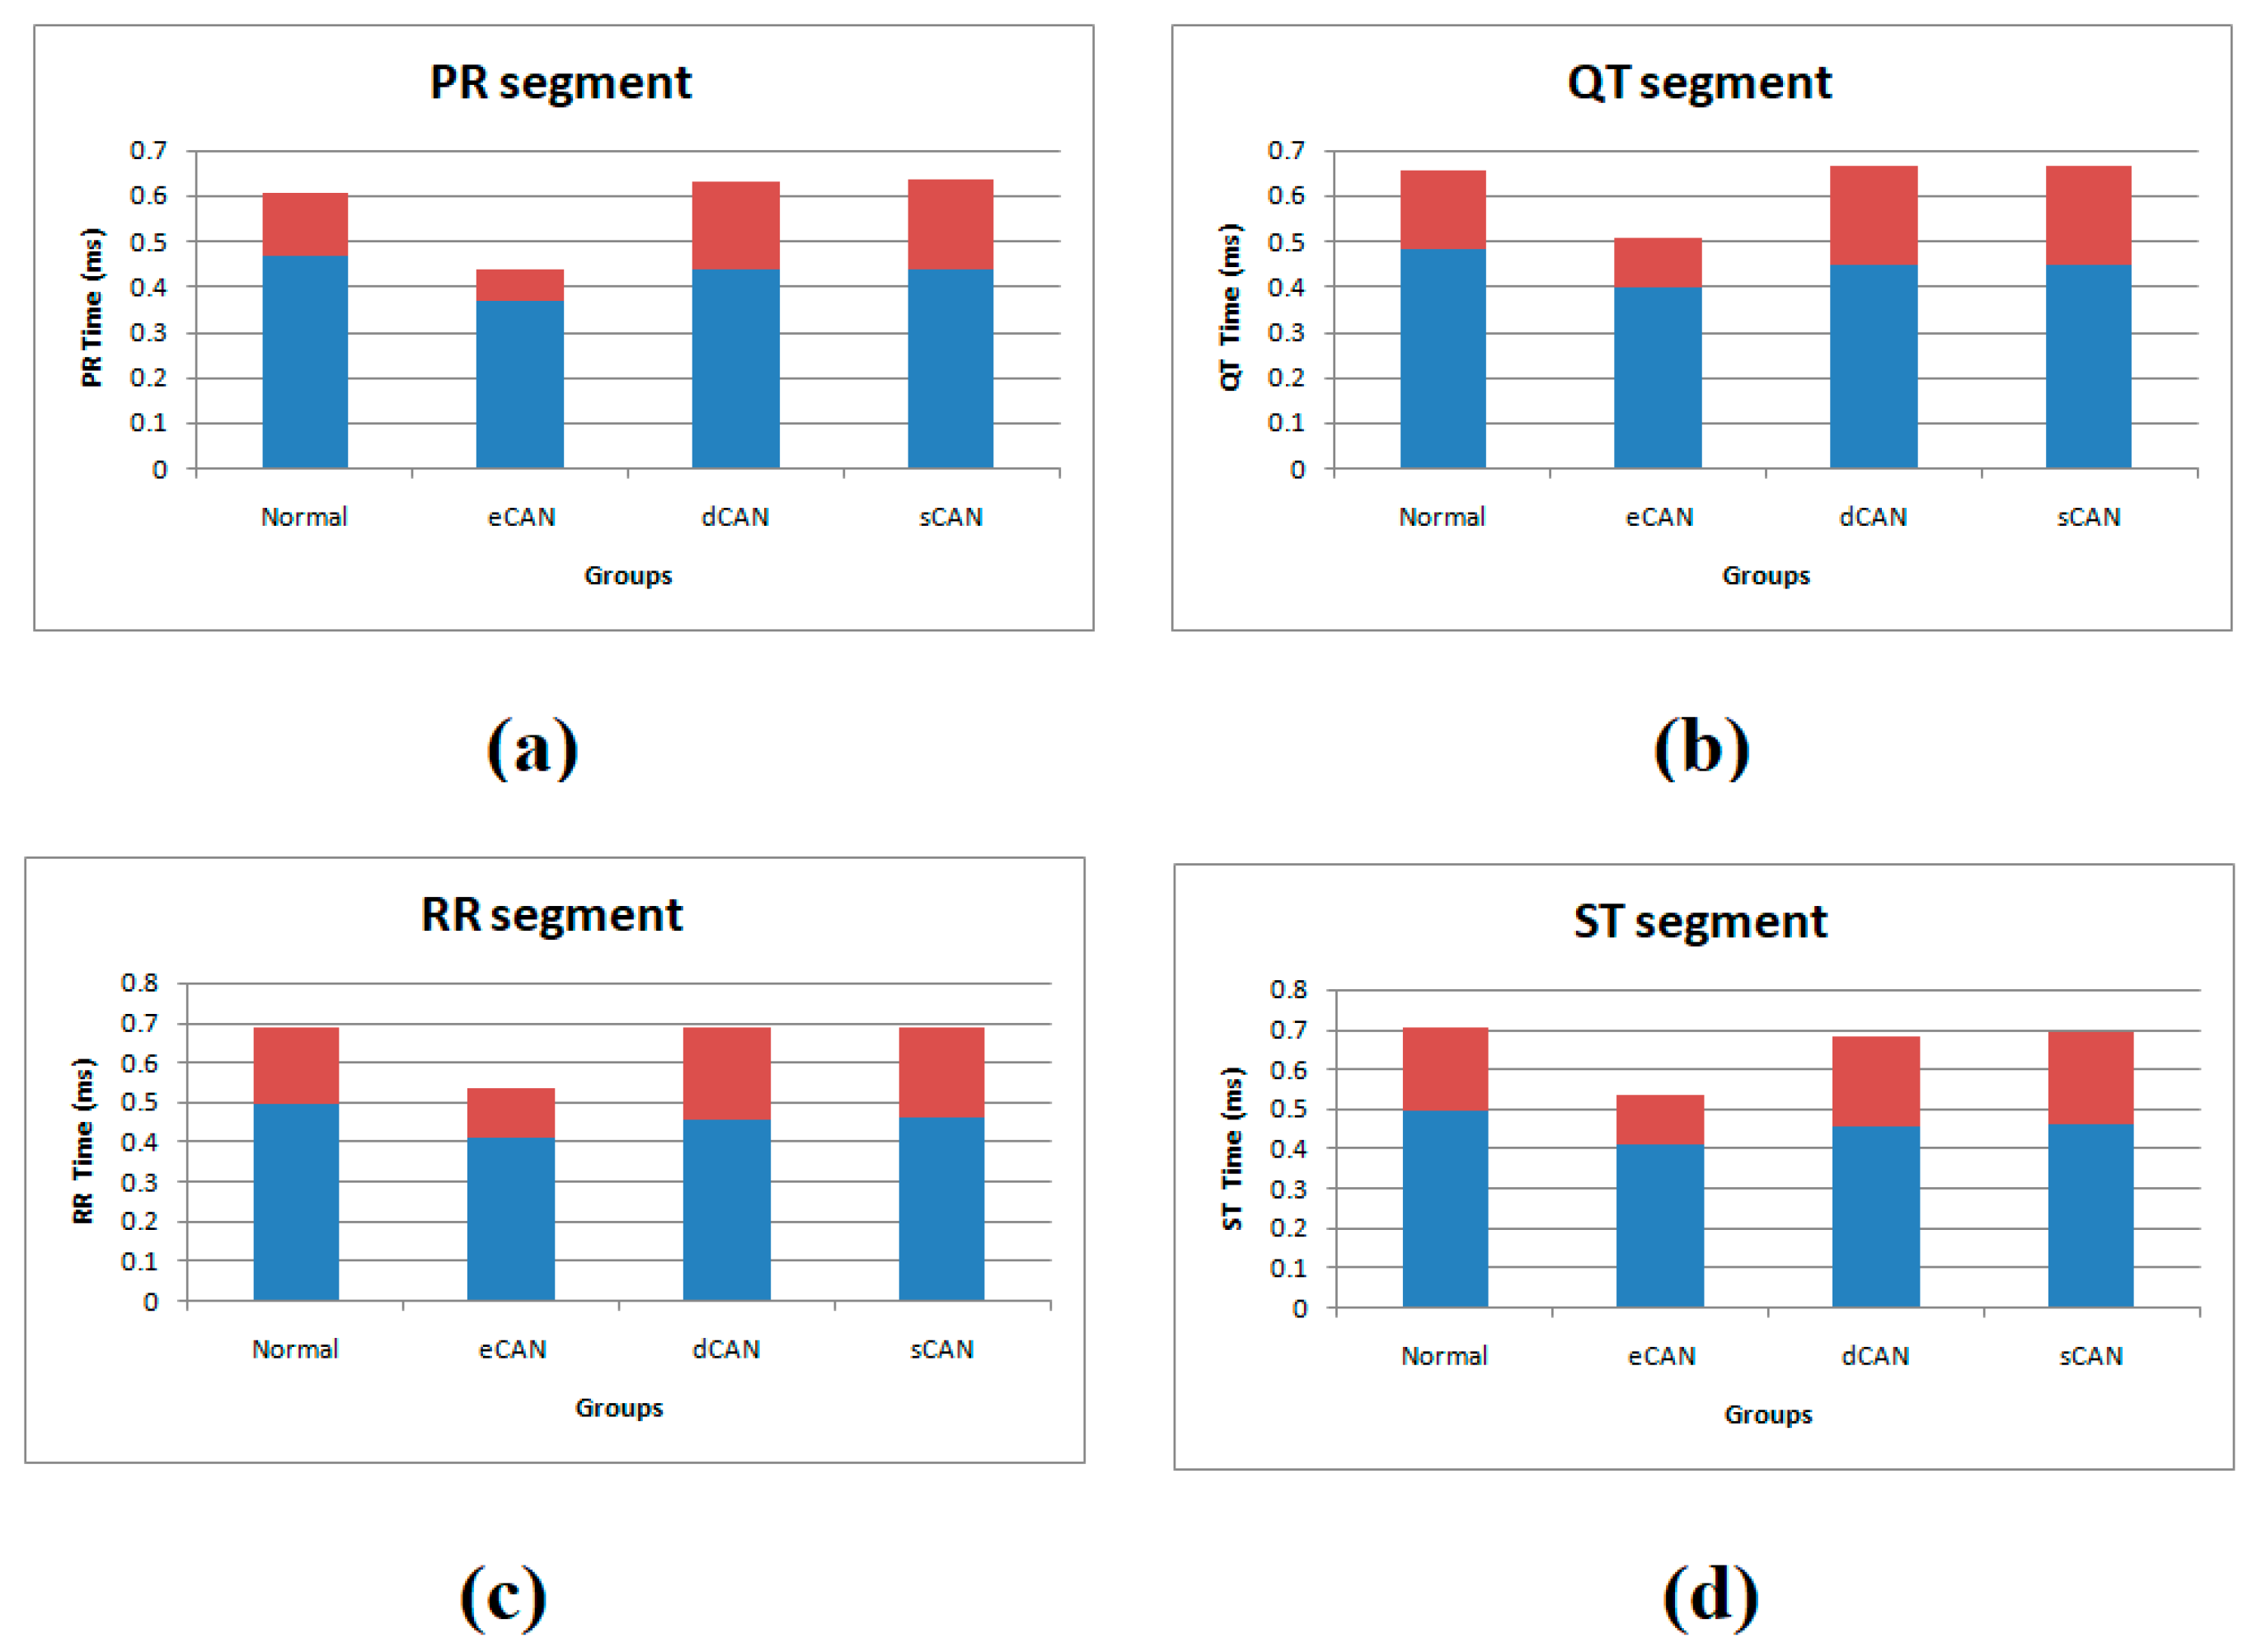
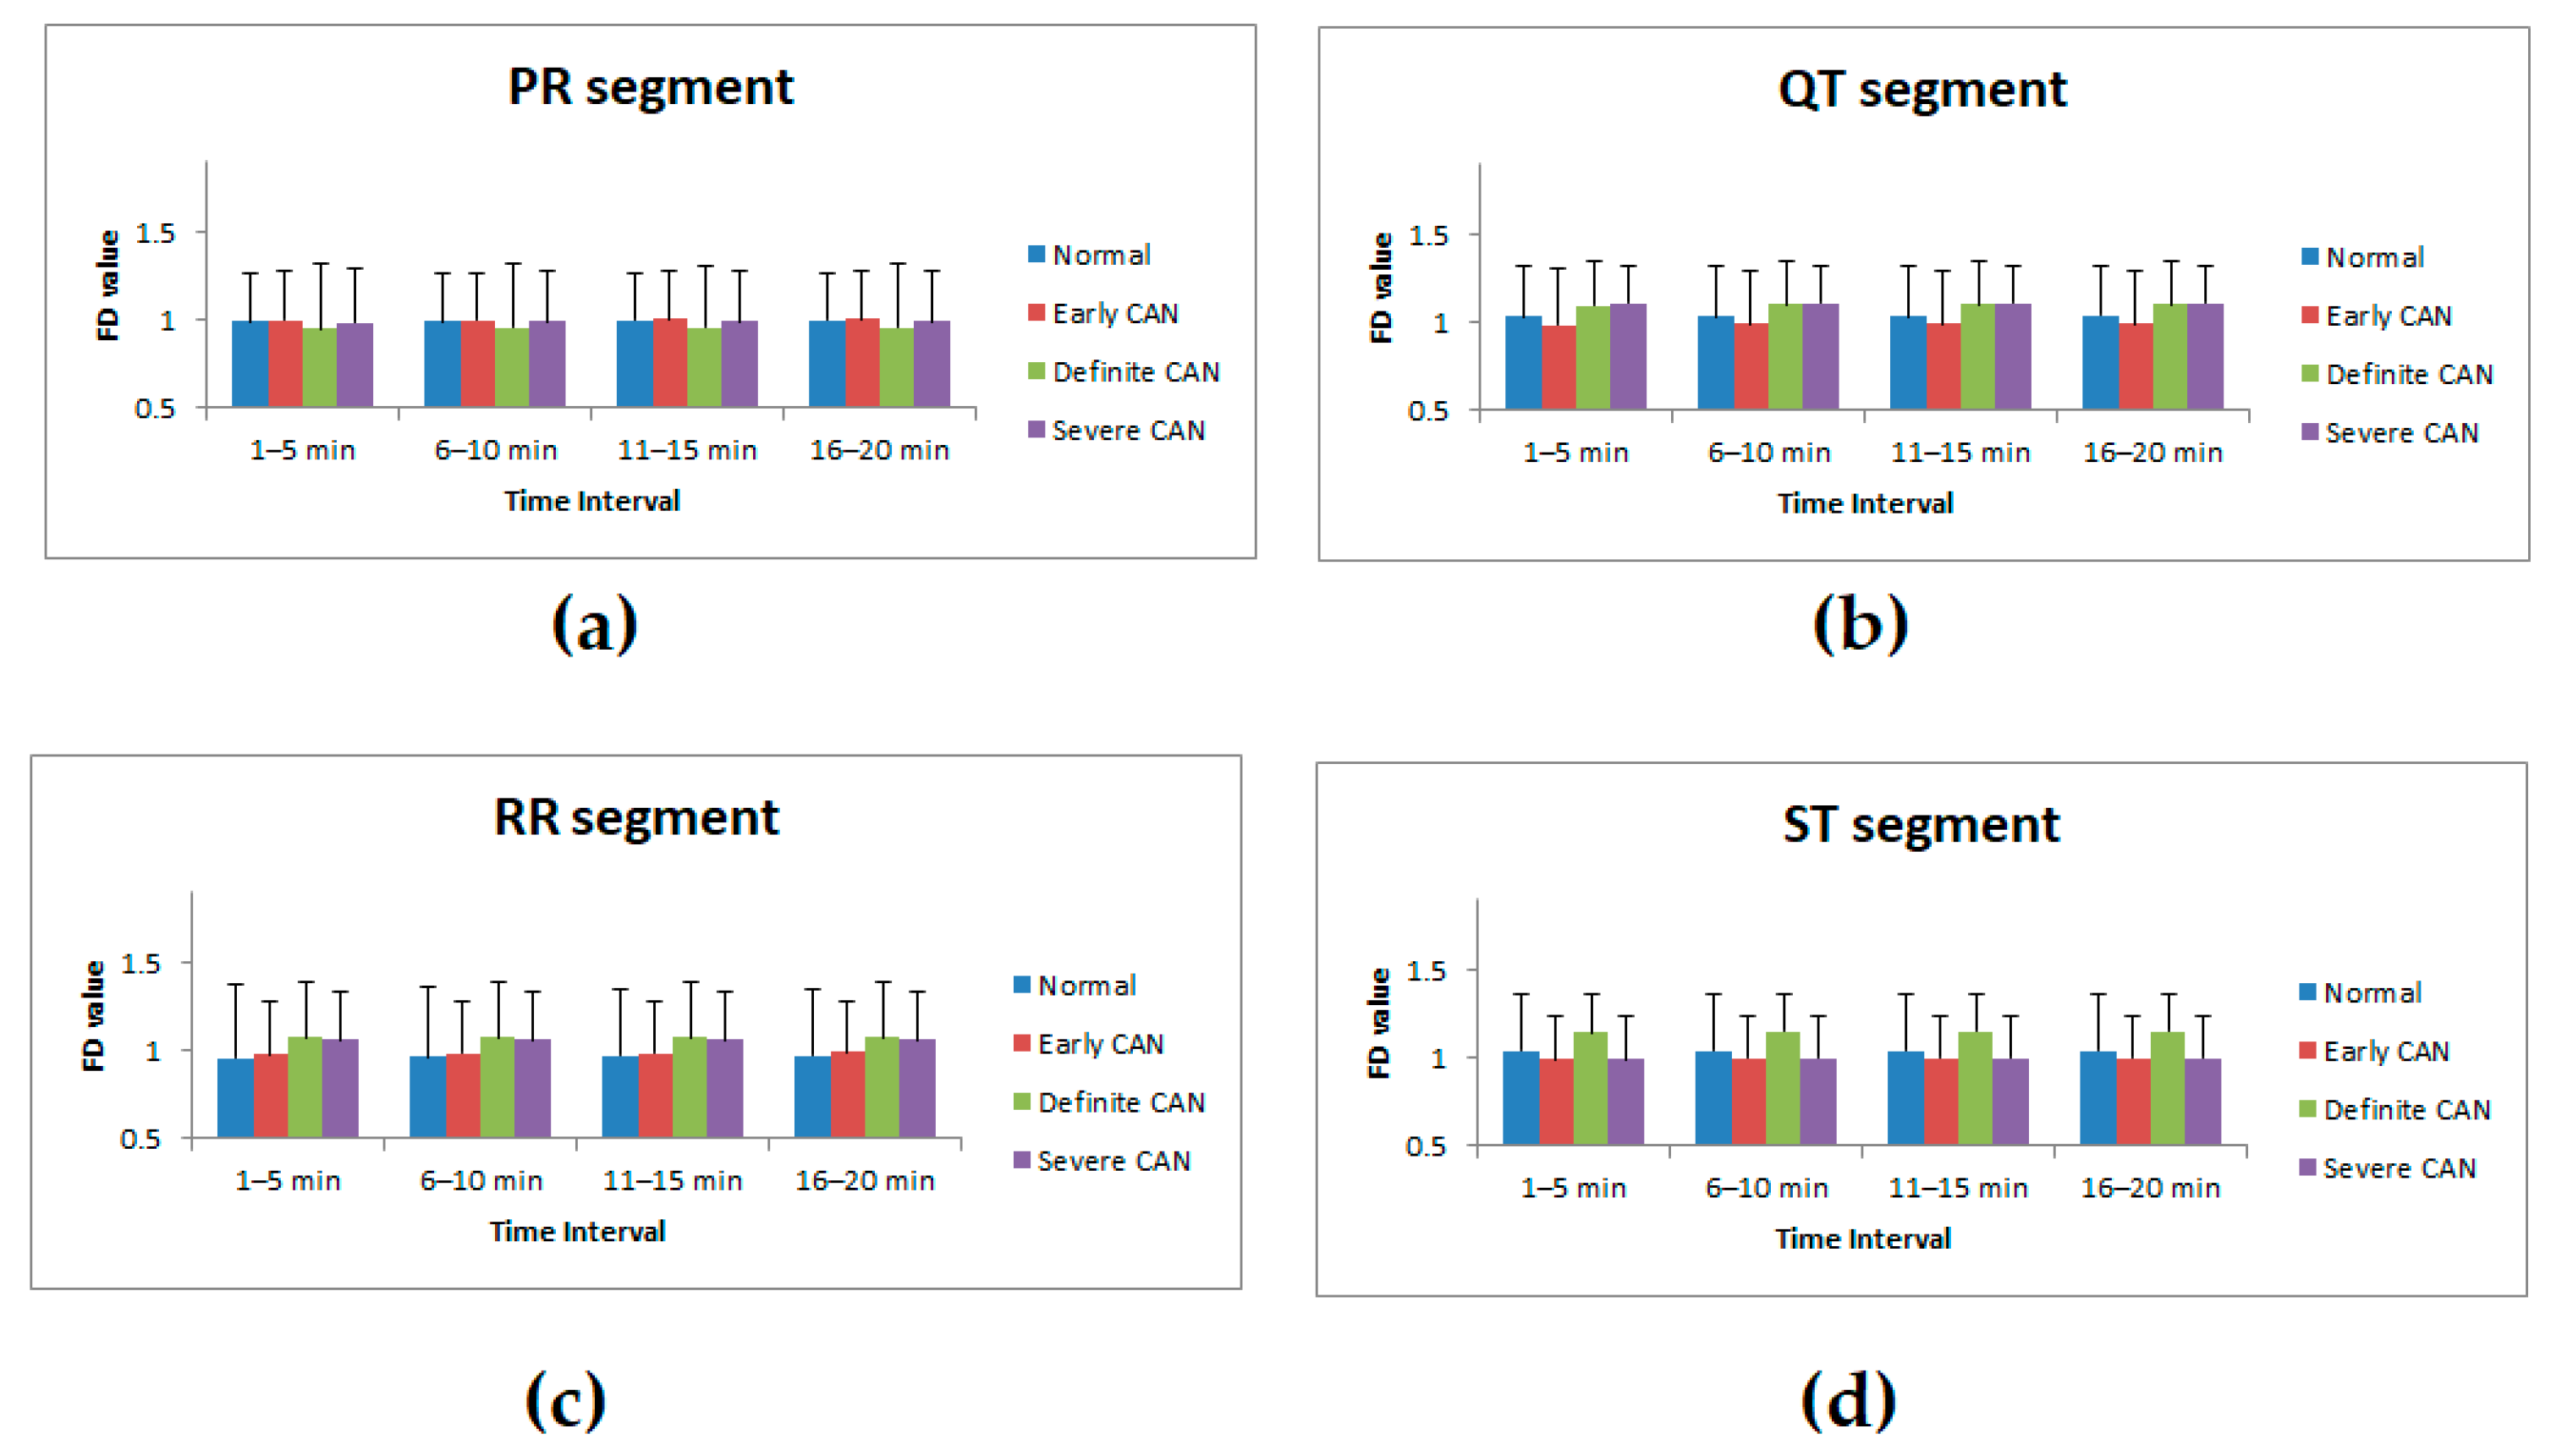
2.6. Statistical Analysis

To estimate the appropriate method of statistical analysis, the Anderson Darling test (alpha = 0.05) was performed to check if the distribution was Gaussian [28]. The results showed that the data were not normally distributed, and thus a non-parametric statistical analysis was used for testing the statistical significance. The various time segments data from ECG of different groups was tested using Kruskal–Wallis [29], a non-parametric method for testing the data. Statistical analysis was performed on the data with a confidence interval of 5%.

2.7. Classifier and Feature Validation

On statistical verification, all the features, including time segments and complexity of time segments of PR, QT, RR, and ST, were given to six supervised models [30], as shown in Figure 6. The initial parameters that were assigned for the models are as given in Table 2. The steps of the classification are given below that were implemented in Orange (version 3.31.1), which is a widely used open-source toolkit for data mining, data visualization, and machine learning [31]:
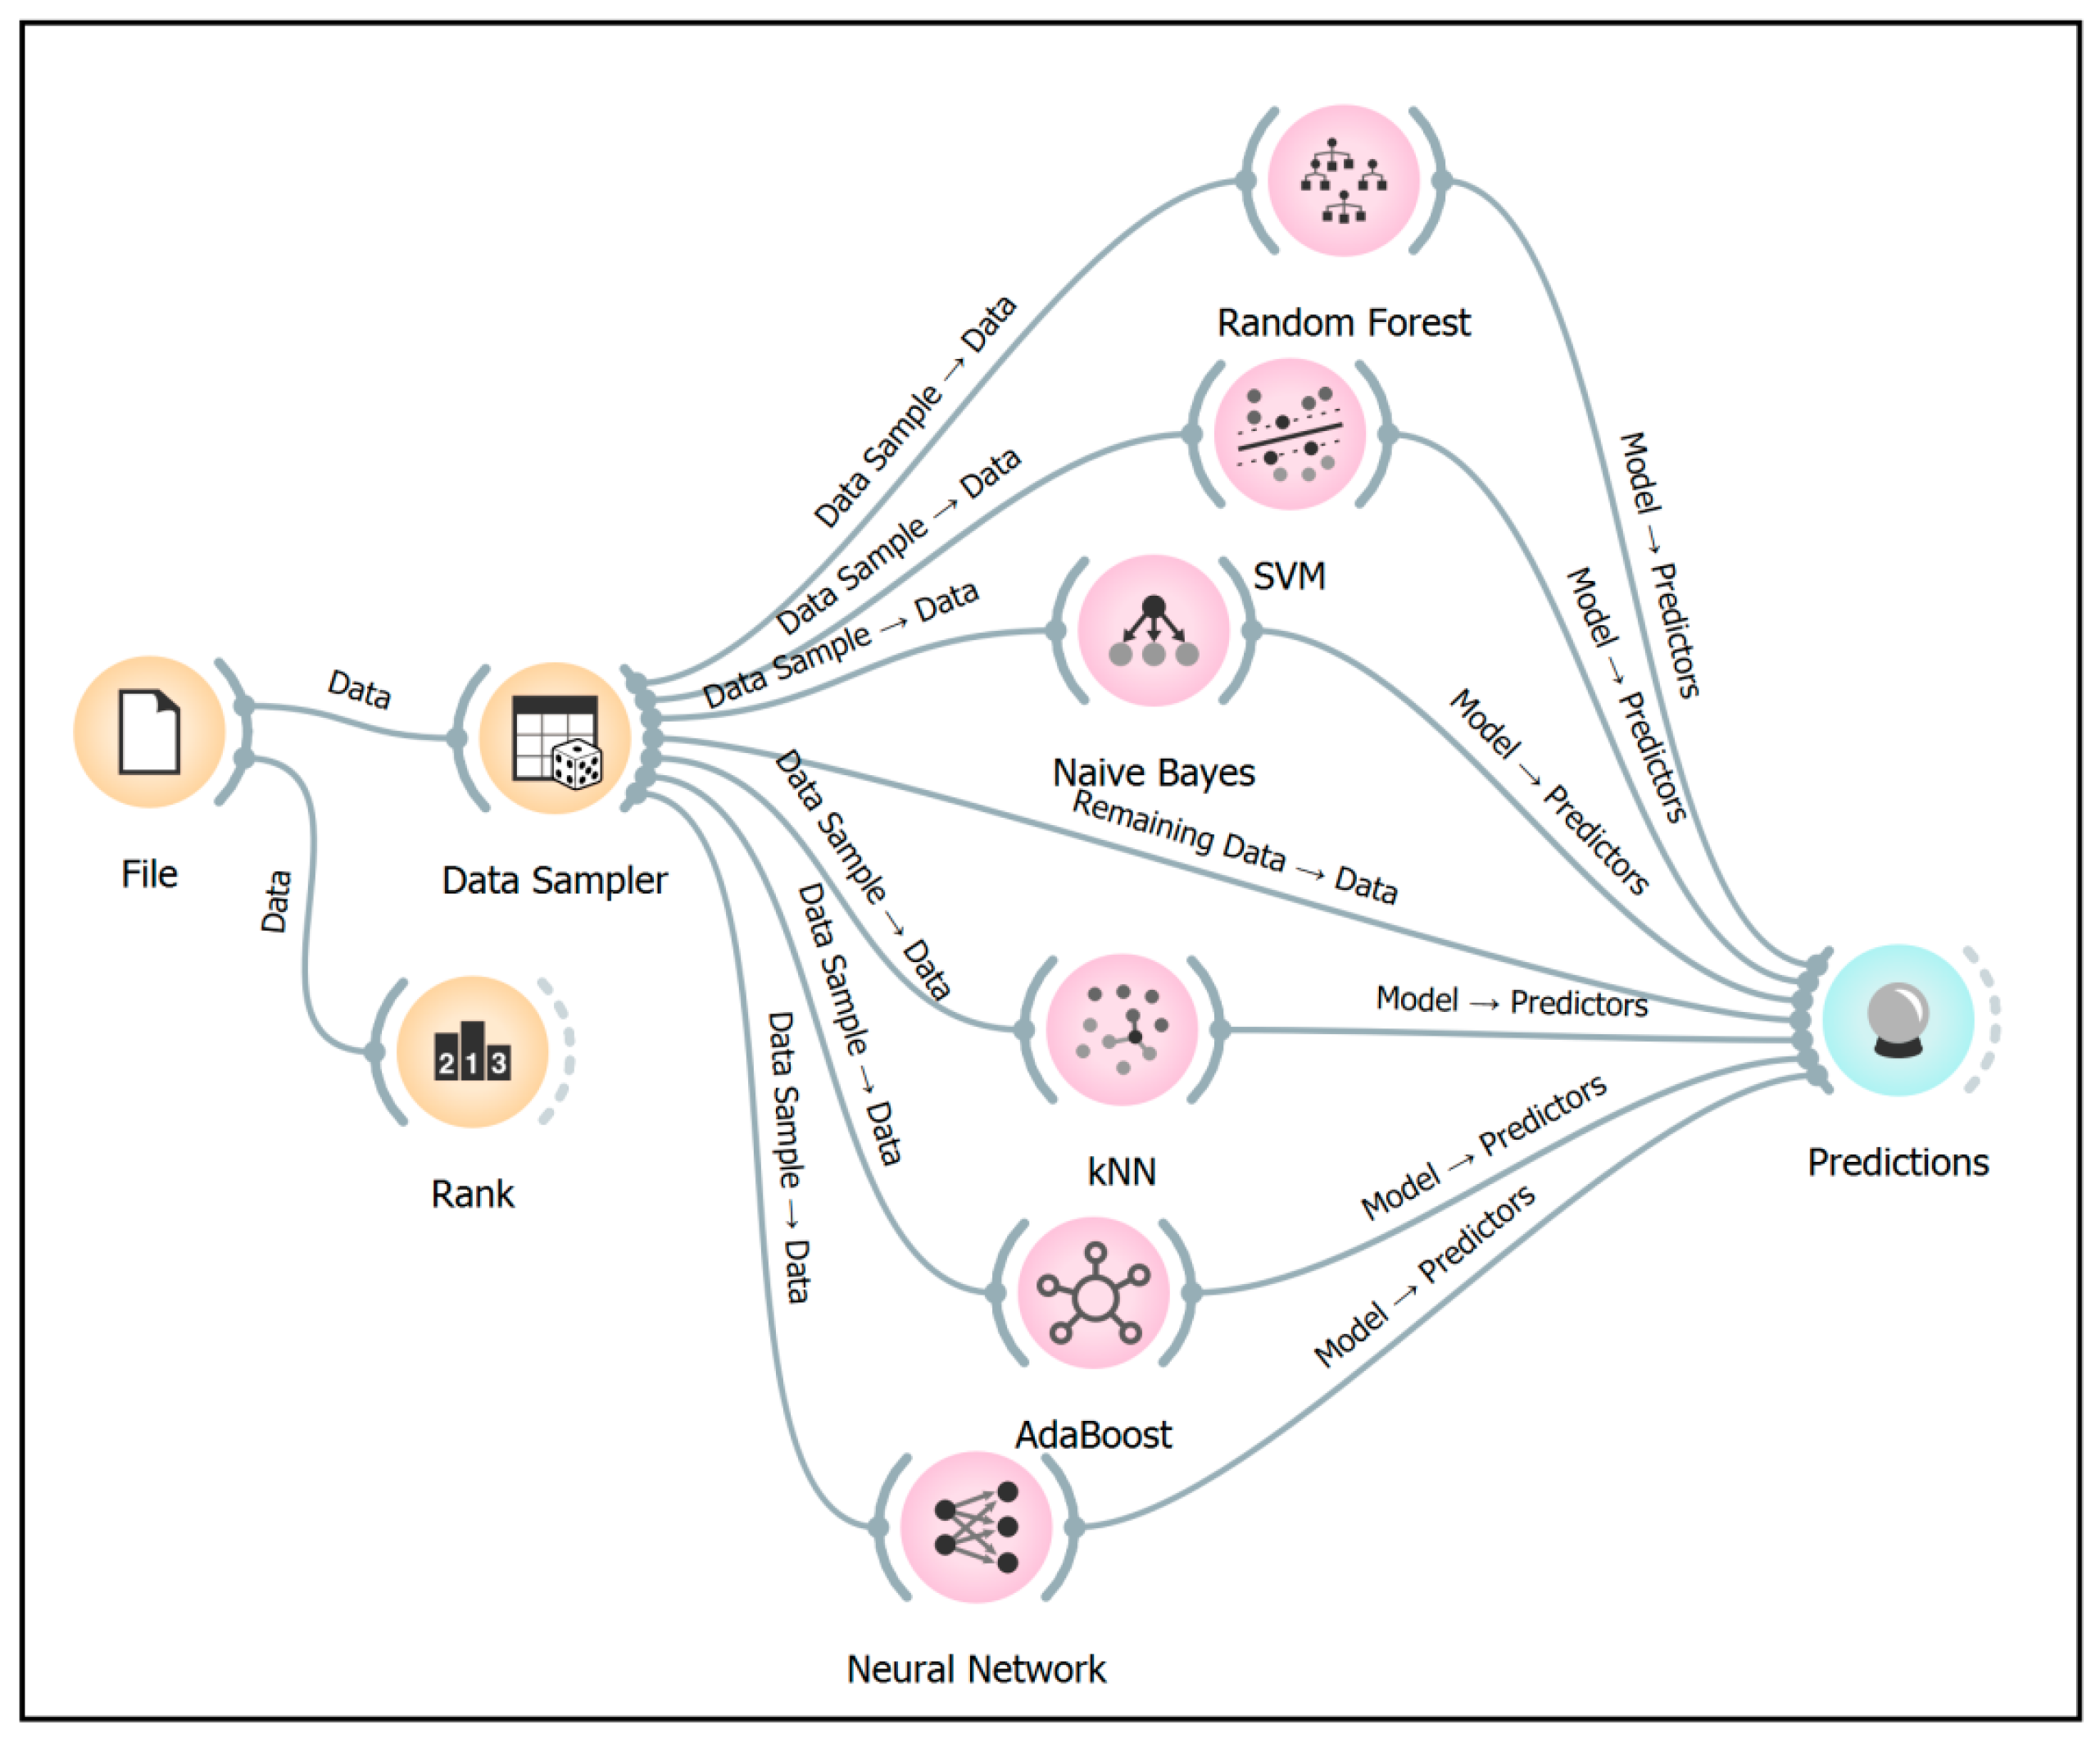
  • File upload: Consisting of ECG signal of one subject, split at every 5th interval. In each signal, approximately 44 PR, QT, RR, and ST segments were extracted and given to the classifier as separate instances (inputs). A total of 120 instances (30 signals × 4 intervals) were classified based on 180 features (4 time segments × 44 and 4 FD values).
  • Data sampler: A total of 70% of data were used for training and 30% for testing, with 10-fold cross validation performed to identify the accuracy.
    Data sample → Data: indicates the data given to the classifier model.
    Remaining data → Data: indicates the test data given to the prediction.
    Model → Predictors: indicates the trained data from model given to prediction.
  • Different supervised models, including random forest (RF), support vector machine (SVM), K-nearest neighbor (KNN), naïve Bayes (NB), AdaBoost (AB), and neural network (NN) [32], were used to classify.
  • Prediction: All the models are linked to the prediction for identifying the classification accuracy. The remaining data mentioned in the model are used as the test data for computing the classification accuracy.
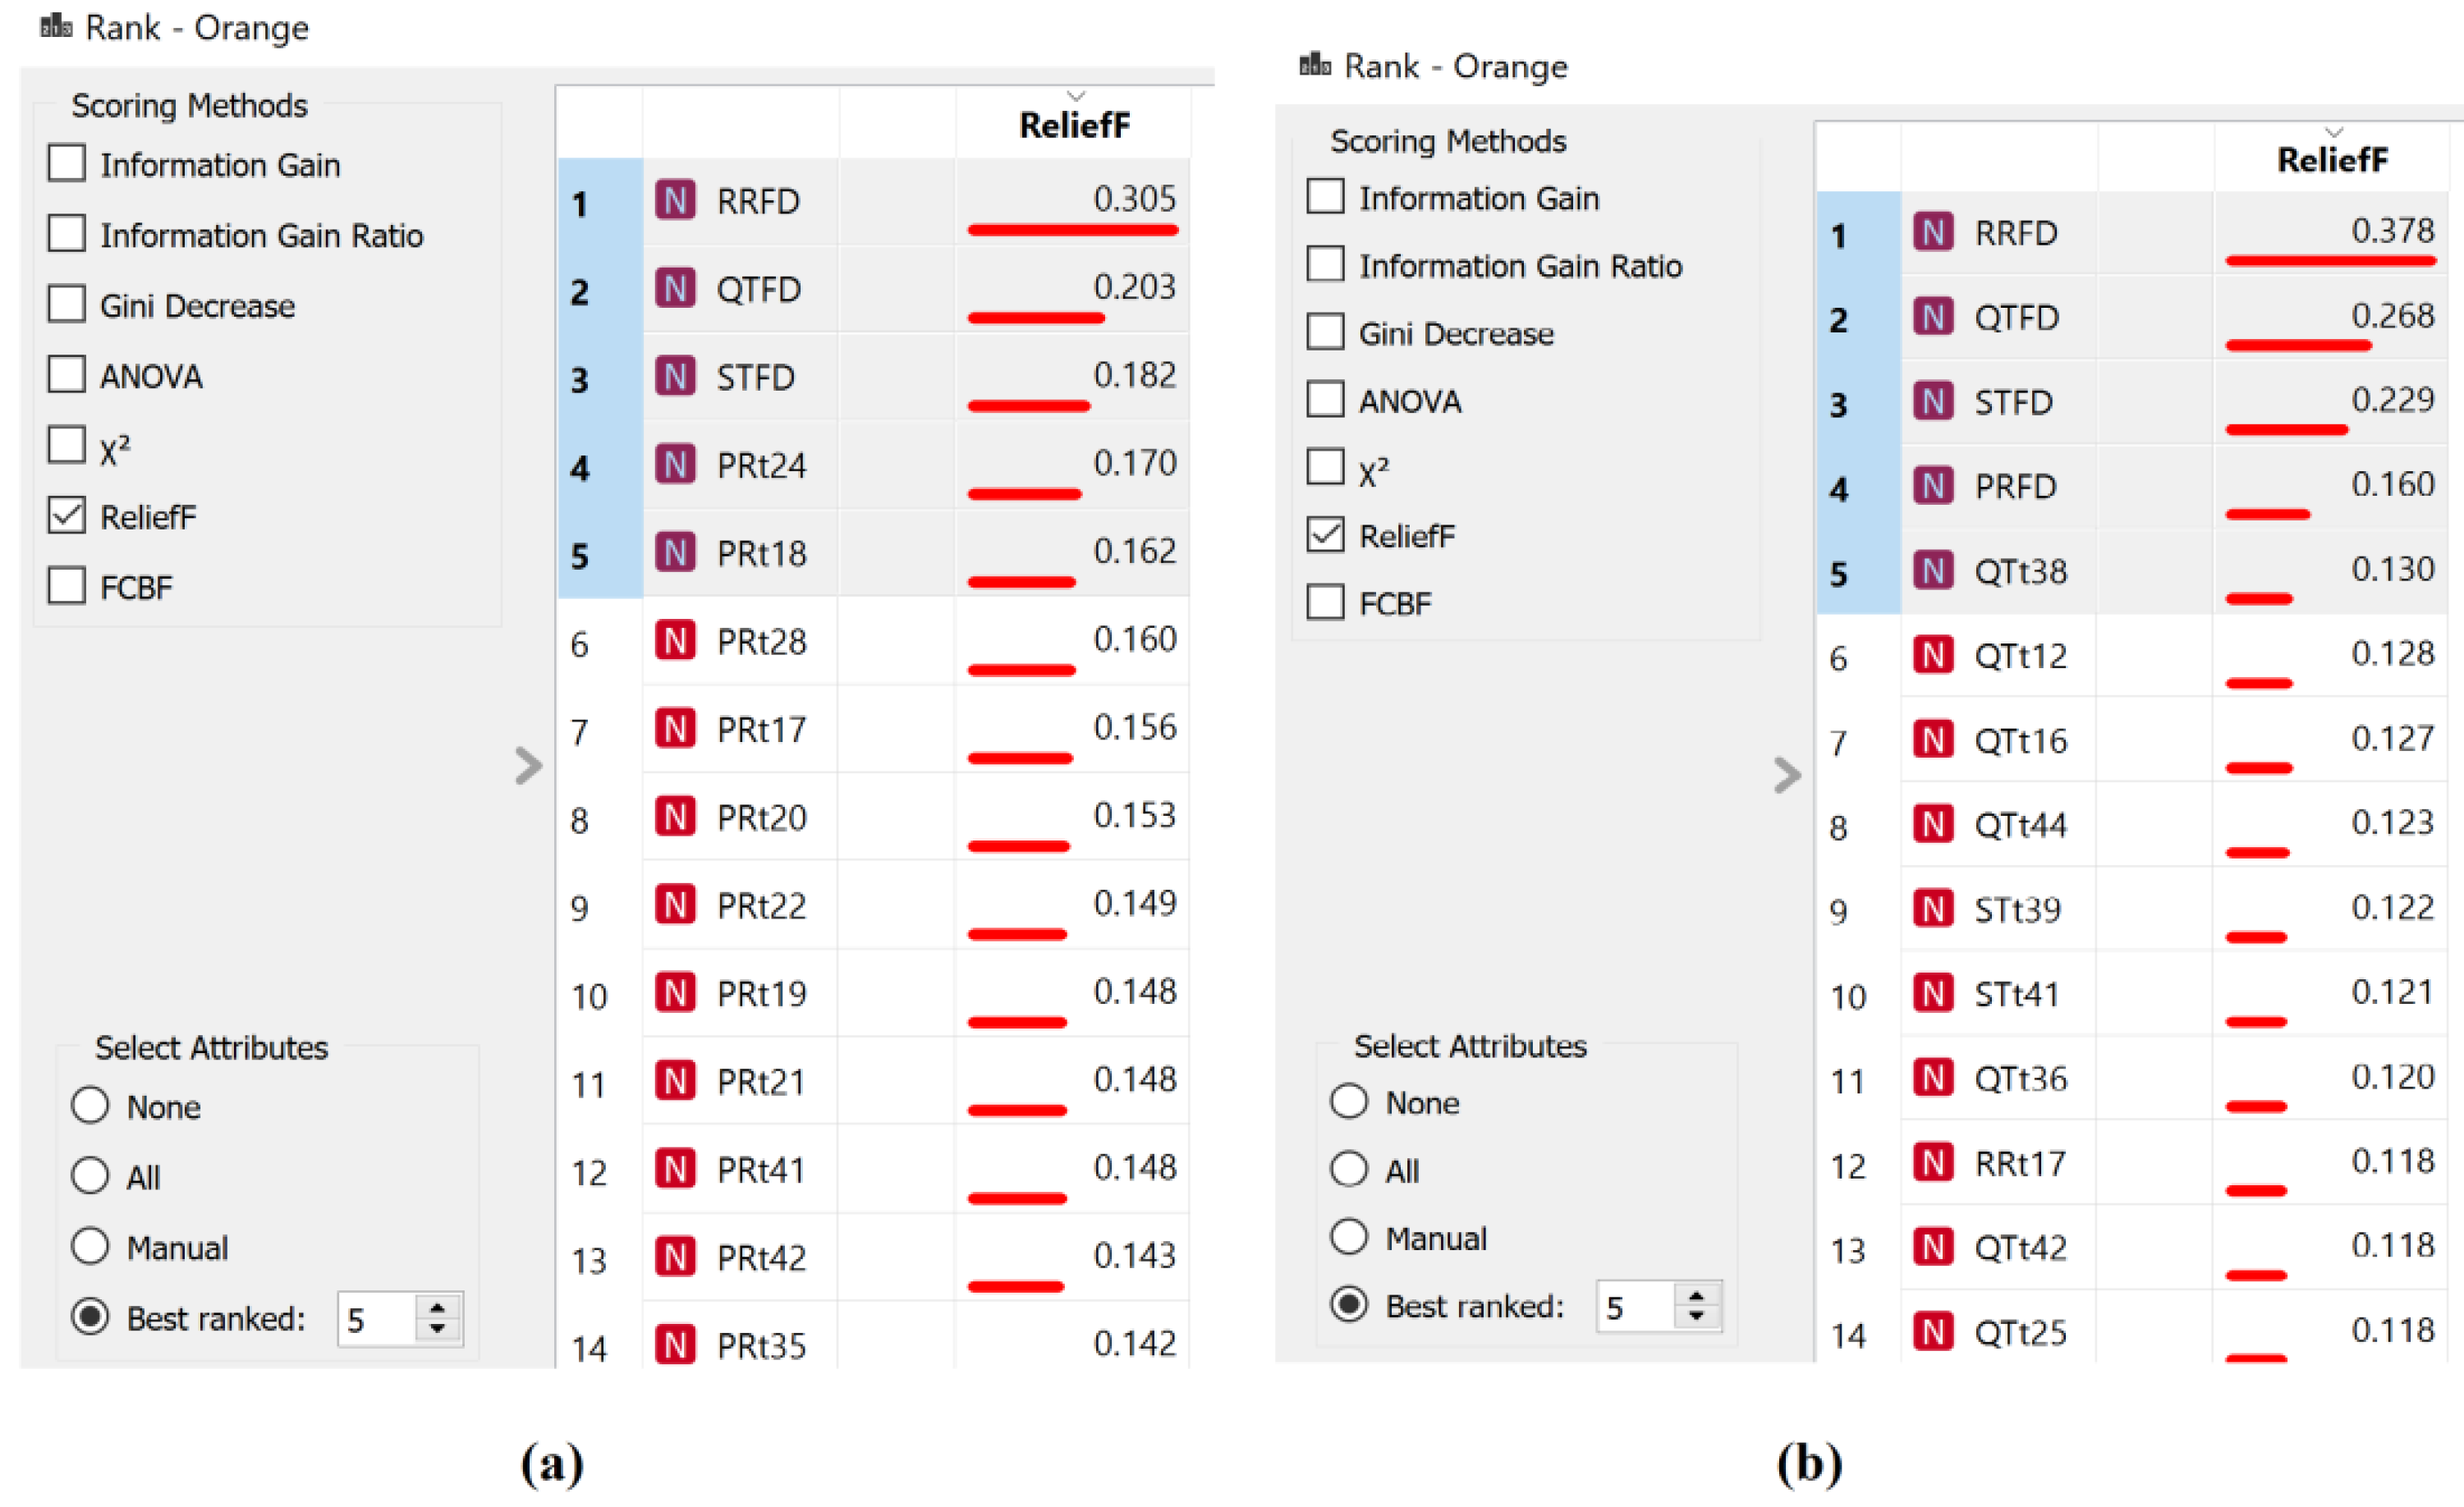
  • Ranking using ReliefF estimator [33] was analyzed, which ranks the best contributing feature for classification.

3. Results

The group mean time intervals for the different segments of ECG for the entire 20 min are shown in Figure 7, and their corresponding statistical p-values are given in Table 3.
In the second test, the mean and SD of FD values of segments at intervals (1–5th, 6–10th, 11–15th, and 16–20th minute) for the four ECG segments for all groups are shown in Figure 8.
The corresponding p-value of the ECG segments for FD analysis is obtained at every 5 min interval and compared between groups given in Table 4.
The performance metrics of the classifier model for two groups of comparisons are given in Table 5. Among the classifiers used, NN has the best accuracy in classifying the groups with all the selected features.
However, the ideology depends on identifying which feature contributes more to the prediction. To accomplish the same, the ranking method was employed using the ReliefF estimator and it was found that out of 180 features, the best five given priority are listed for both classifier models, as shown in Figure 9. The first classifier model shows normal vs. early group, in which FD values of RR, QT, and ST are prioritized, and in the second model, between normal and other stages of CAN, all four time segments are prioritized.

4. Discussion

This study advances the search in finding ECG features specific to CAN diagnosis, apart from having HRV alone as an early diagnostic parameter for CAN detection [34]. In summary, the current golden standard followed for CAN diagnosis is by using cardiac autonomic reflex fests (CARTs), which comprise five bedside measurements that also include HRV (fluctuations in RR interval) [35]. Fractal analysis of HRV alone is used widely in identifying cardiac dysfunction and as a feature to diagnose the affected subjects. The analysis of complexity in the segments of ECG signal is a crucial feature in the early diagnosis of CAN. Studies have reported the techniques to study the changes in ECG segments and it is important to observe the complex changes within the segments. Based on the results, this study provides an approach to analyze the complexity of the different ECG segments to have an affirmative early diagnosis. The fractal-based study is evident to analyze the changes in self-similar characteristics of ECG. This was also evident in the feature ranking and selection.
This technique was compared with the methods reported in the literature [5], which consider the time changes in the ECG segments. This study has shown that the complexity of these ECG segments can be related to the change in the variation within the segments of ECG.
The analysis for the entire 20 min duration (Table 3) shows that all the time segments (PR, QT, RR, and ST) show significance (p < 0.05) only between the normal and definite CAN group, and all the other group differences were insignificant. The p-value of the complexity analysis on all the four ECG segments shows that it is lowest for the normal (N) group when compared to all the other three (eCAN, dCAN, and sCAN) groups, and the mean value of FD was the highest in dCAN in all selected segments. The mean value variation between all four groups in PR, QT, RR, and ST segments seems to be the same; showing not much significance between the groups and hence failing to prove an early diagnostic for detection of CAN, which is evident from the statistical analysis of the ECG segments.
Hence, to prove a significant variation, the time intervals of ECG segments at different instants of time were extracted from the data, and complexity in the time instants of all the segments was studied (Table 4). To make an early diagnosis, the groups of interest are normal vs. eCAN, which shows a significant p-value for all the four segments (PR, QT, RR, and ST). The complexity analysis in all the selected segments was found to be statistically significant for early-stage diagnosis of CAN in diabetic patients.
In order to validate the results, the features were provided to different linear and nonlinear classifier models. However, all the analyzed segments are specific for CAN diagnosis; the idea is to identify which feature contributes more in categorizing the groups. This was accomplished by introducing feature ranking in the dataset. The results from ReliefF ranking estimator clearly show that the most significant features were the fractal dimension of the time segments denoted as RRFD, QTFD, STFD, and PRFD time segments. Hence, the ranking estimation supports the statistical verification results that the complexity in time segments is more pronounced than analyzing the time segments. This also indicates that instead of analyzing complete 20 min data, ECG at short intervals of time can be computed to provide the complexity change that is more significant.
Various linear and nonlinear measures have been developed [11] with HRV analysis that infers only the time segment data; however, to make an early diagnosis, time information alone is not sufficient to discriminate between the groups. Traditional methods of analysis used only one or two time segments of ECG to classify between groups [14]. It has also indicated that analysis of the entire 20 min data is not required, as small intervals of complexity analysis will provide more significant results. Hence, the technique in this study can be directly applied to ECG data being recorded, for complexity analysis, and can be a method for early prediction of CAN on subjective individuals.

5. Conclusions

The variation of FD for the selected features over time was found to be significantly different between healthy and early-stage CAN patients. It also indicates that HRV analysis alone cannot be a predictor for early diagnosis, as other features of ECG have a pronounced effect due to abnormalities related to CAN. This study has included all the features that are predominantly varying in CAN that can give more diagnostic reliability to CAN. The results of the statistical analysis (p-value from Table 3) show that the segment complexity for the entire dataset is not sufficient to predict the onset of CAN at an early stage, as it is not significant when compared with the complexity analysis for segments at different intervals of time. The statistical and the ranking estimator methods have proved that complexity in ECG segments is more significant. This work is intended to show a definitive approach, that complexity in time segments is more efficient in analyzing the dynamics that are pertaining to CAN. However, this work does not diminish the usefulness of the methods of interpreting the time information. This work has extended the study related to early diagnosis of CAN by interpreting the complexity of signal for measuring dynamics of the time segments.

Author Contributions

Conceptualization, S.S.S. and S.P.A.; data curation, S.S.S. and S.P.A.; formal analysis S.S.S. and S.P.A.; investigation, S.S.S. and S.P.A.; methodology, S.S.S. and S.P.A.; project administration, R.S. and S.P.A.; resources, D.K.K. and S.P.A.; software, S.S.S.; supervision, R.S. and S.P.A.; validation, S.S.S., S.P.A. and D.K.K.; writing: original draft, S.S.S.; writing: review and editing, S.P.A., R.S. and D.K.K. All authors have read and agreed to the published version of the manuscript.

Funding

This research is supported by the SERB TARE project scheme.

Institutional Review Board Statement

The ethical clearance for performing the study on normal and patients with CAN was approved by the research protocol by the CS University Ethics in Human Research Committee (03/164) and complies with the declaration of Helsinki.

Informed Consent Statement

Informed consent was obtained from all subjects involved in the study.

Data Availability Statement

The data presented in this study are available on request from the corresponding author. The data are not publicly available since the data also include other clinical information about the patients.

Acknowledgments

The authors would like to thank Herbert Jelinek for providing the data for this study.

Conflicts of Interest

The authors declare no conflict of interest.

References

  1. Bissinger, A. Cardiac Autonomic Neuropathy: Why Should Cardiologists Care about That? J. Diabetes Res. 2017, 2017, 5374176. [Google Scholar] [CrossRef] [Green Version]
  2. Bhuyan, A.K.; Baro, A.; Sarma, D.; Choudhury, B. A study of cardiac autonomic neuropathy in patients with type 2 diabetes mellitus: A North east India experience. Indian J. Endocrinol. Metab. 2019, 23, 246–250. [Google Scholar] [CrossRef] [PubMed]
  3. Moţăţăianu, A.; Maier, S.; Bajko, Z.; Voidazan, S.; Bălaşa, R.; Stoian, A. Cardiac autonomic neuropathy in type 1 and type 2 diabetes patients. BMC Neurol. 2018, 18, 126. [Google Scholar] [CrossRef]
  4. Oakley, I.; Emond, L. Diabetic cardiac autonomic neuropathy and anesthetic management: Review of the literature. AANAJ. 2011, 79, 473–479. [Google Scholar]
  5. Imam, M.H.; Karmakar, C.K.; Jelinek, H.F.; Palaniswami, M.; Khandoker, A.H. Analyzing systolic-diastolic interval interaction characteristics in diabetic cardiac autonomic neuropathy progression. IEEE J. Transl. Eng. Health Med. 2015, 3, 1900510. [Google Scholar] [CrossRef]
  6. Serhiyenko, V.A.; Serhiyenko, A.A. Cardiac autonomic neuropathy: Risk factors, diagnosis and treatment. World J. Diabetes 2018, 9, 1–24. [Google Scholar] [CrossRef] [PubMed]
  7. Vinik, A.I.; Erbas, T.; Casellini, C.M. Diabetic cardiac autonomic neuropathy, inflammation and cardiovascular disease. J. Diabetes Investig. 2013, 4, 4–18. [Google Scholar] [CrossRef]
  8. Sidek, K.A.; Jelinek, H.F.; Khalil, I. Identification of cardiac autonomic neuropathy patients using cardioid-based graph for ECG biometric. Comput. Cardiol. 2011, 38, 517–520. [Google Scholar]
  9. Tekeste, T.; Saleh, H.; Mohammad, B.; Khandoker, A.; Jelinek, H.; Ismail, M. A Nanowatt Real-Time Cardiac Autonomic Neuropathy Detector. IEEE Trans. Biomed. Circuits Syst. 2018, 12, 739–750. [Google Scholar] [CrossRef] [PubMed]
  10. Bosen, D.; Flemming, M. Beyond ECGs: Understanding electrophysiology testing, part 2. Nursing 2003, 33, cc1–cc32. [Google Scholar] [CrossRef]
  11. Cornforth, D.; Jelinek, H.F.; Tarvainen, M. A comparison of nonlinear measures for the detection of cardiac autonomic neuropathy from heart rate variability. Entropy 2015, 17, 1425–1440. [Google Scholar] [CrossRef] [Green Version]
  12. Khandoker, A.H.; Jelinek, H.F.; Moritani, T.; Palaniswami, M. Association of cardiac autonomic neuropathy with alteration of sympatho vagal balance through heart rate variability analysis. Med. Eng. Phys. 2010, 32, 161–167. [Google Scholar] [CrossRef]
  13. Khandoker, A.H.; Imam, M.H.; Couderc, J.P.; Palaniswami, M.; Jelinek, H.F. QT variability index changes with severity of cardiovascular autonomic neuropathy. IEEE Trans. Inf. Technol. Biomed. 2012, 16, 900–906. [Google Scholar] [CrossRef]
  14. Khandoker, A.H.; Boularaoui, S.; Alhussein, G.M.; Almatroushi, N.S.O.; Osman, E.A.A.; Widatalla, N.S.M.; Khalaf, K.; Jelinek, H. Screening ST segments in patients with cardiac autonomic neuropathy. Comput. Cardiol. 2012, 39, 621–623. [Google Scholar]
  15. Burguera, A. Fast QRS Detection and ECG Compression Based on Signal Structural Analysis. IEEE J. Biomed. Health Inform. 2019, 23, 123–131. [Google Scholar] [CrossRef]
  16. Khandoker, A.H.; Jelinek, H.F.; Palaniswami, M. Heart rate variability and complexity in people with diabetes associated cardiac autonomic neuropathy. Annu. Int. Conf. IEEE Eng. Med. Biol. Soc. 2008, 2008, 4696–4699. [Google Scholar] [CrossRef] [PubMed]
  17. Arjunan, S.P.; Kumar, D.K. Decoding subtle forearm flexions using fractal features of surface electromyogram from single and multiple sensors. J. Neuroeng. Rehabil. 2010, 7, 53. [Google Scholar] [CrossRef] [PubMed] [Green Version]
  18. Magrans, R.; Gomis, P.; Caminal, P.; Voss, A. Higuchi’s fractal complexity of RR and QT interval series during transient myocardial ischemia. Comput.Cardiol. 2013, 40, 421–424. [Google Scholar]
  19. Escalona, O.J.; Mendoza, M.; Villegas, G.; Navarro, C. Real-time system for high-resolution ECG diagnosis based on 3D late potential fractal dimension estimation. Comput. Cardiol. 2011, 38, 789–792. [Google Scholar]
  20. Jallouli, M.; Arfaoui, S.; Ben Mabrouk, A.; Cattani, C. Clifford wavelet entropy for fetal ECG extraction. Entropy 2021, 23, 844. [Google Scholar] [CrossRef]
  21. Limaye, H.; Deshmukh, V.V. ECG Noise Sources and Various Noise Removal Techniques: A Survey. Int. J. Appl. Innov.Eng. Manag. 2016, 5, 2319–4847. [Google Scholar]
  22. Sedghamiz, H. Matlab Implementation of Pan Tompkins ECG QRS; 2014; pp. 1–3. Available online: https://www.researchgate.net/publication/313673153_Matlab_Implementation_of_Pan_Tompkins_ECG_QRS_detector (accessed on 25 April 2022).
  23. Mary, H.M.C.; Singh, D.; Deepak, K.K. Assessment of Scale Invariance Changes in Heart Rate Signal During Postural Shift. IETEJ. Res. 2019, 2063, 308–314. [Google Scholar] [CrossRef]
  24. Jelinek, H.F.; Fernandez, E. Neurons and fractals: How reliable and useful are calculations of fractal dimensions? J. Neurosci. Methods 1998, 81, 9–18. [Google Scholar] [CrossRef]
  25. Becker, D.E. Fundamentals of electrocardiography interpretation. Anesth. Prog. 2006, 53, 53–64. [Google Scholar] [CrossRef] [Green Version]
  26. Kiani, K.; Maghsoudi, F. Classification of 7 Arrhythmias from ECG Using Fractal Dimensions. J. Bioinforma. Syst. Biol. 2019, 2, 53–65. [Google Scholar] [CrossRef]
  27. Bouda, M.; Caplan, J.S.; Saiers, J.E. Box-counting dimension revisited: Presenting an efficient method of minimizing quantization error and an assessment of the self-similarity of structural root systems. Front. Plant Sci. 2016, 7, 149. [Google Scholar] [CrossRef] [PubMed] [Green Version]
  28. Jäntschi, L.; Bolboacă, S.D. Computation of probability associated with Anderson-Darling statistic. Mathematics 2018, 6, 88. [Google Scholar] [CrossRef] [Green Version]
  29. Van Hecke, T. Power study of ANOVA versus Kruskal-Wallis test. J. Stat. Manag. Syst. 2012, 15, 241–247. [Google Scholar] [CrossRef]
  30. Jelinek, H.F.; Abawajy, J.H.; Cornforth, D.J.; Kowalczyk, A.; Negnevitsky, M.; Chowdhury, M.U.; Krones, R.; Kelarev, A.V. Multi-layer Attribute Selection and Classification Algorithm for the Diagnosis of Cardiac Autonomic Neuropathy Based on HRV Attributes. AIMS Med. Sci. 2015, 2, 396–409. [Google Scholar] [CrossRef]
  31. Naik, A.; Samant, L. Correlation Review of Classification Algorithm Using Data Mining Tool: WEKA, Rapidminer, Tanagra, Orange and Knime. Procedia Comput. Sci. 2016, 85, 662–668. [Google Scholar] [CrossRef] [Green Version]
  32. Kavakiotis, I.; Tsave, O.; Salifoglou, A.; Maglaveras, N.; Vlahavas, I.; Chouvarda, I. Machine Learning and Data Mining Methods in Diabetes Research. Comput. Struct. Biotechnol. J. 2017, 15, 104–116. [Google Scholar] [CrossRef] [PubMed]
  33. Robnik-Šikonja, M.; Kononenko, I. Theoretical and Empirical Analysis of ReliefF and RReliefF. Mach. Learn. 2003, 53, 23–69. [Google Scholar] [CrossRef] [Green Version]
  34. Aggarwal, Y.; Das, J.; Mazumder, P.M.; Kumar, R.; Sinha, R.K. Heart rate variability features from nonlinear cardiac dynamicsin the identification of diabetes using artificial neural network and support vector machine. Biocybern. Biomed. Eng. 2020, 40, 1002–1009. [Google Scholar] [CrossRef]
  35. Rolim, L.C.; de Souza, J.S.T.; Dib, S.A. Tests for early diagnosis of cardiovascular autonomic neuropathy: Critical analysis and relevance. Front. Endocrinol. 2013, 4, 2–5. [Google Scholar] [CrossRef] [PubMed] [Green Version]
Figure 1. Schematic block diagram.
Applsci 12 05746 g001
Figure 2. Raw ECG and filtered ECG signal of normal subject for 10 s.
Applsci 12 05746 g002
Figure 3. Filtered ECG and wave showing R peaks.
Applsci 12 05746 g003
Figure 4. Components marked in the ECG wave show time intervals of various segments.
Applsci 12 05746 g004
Figure 5. (a) An instant of a time segment (QT) of normal and early CAN signal; (b) log N vs. log r for a normal signal for FD computation.
Applsci 12 05746 g005
Figure 6. Classifier model with ranking estimator. Note: Data sample → Data indicates the data given to the classifier model, and Remaining data → Data indicates the test data given to the prediction. Model → Predictors indicates the trained data from model given to prediction.
Applsci 12 05746 g006
Figure 7. Mean (blue) and SD value (red) of time intervals of different segments: (a) PR segment, (b) QT segment, (c) RR segment, and (d) ST segment for the entire 20 min recording.
Applsci 12 05746 g007
Figure 8. Mean and SD value of FD after each 5 min interval of all groups of (a) PR segment, (b) QT segment, (c) RR segment, and (d) ST segment.
Applsci 12 05746 g008
Figure 9. Priority of features from ReliefF ranking estimator for (a) normal vs. early CAN, and (b) normal vs. other stages of CAN.
Applsci 12 05746 g009
Table 1. Clinical information of the participants.
GroupAgeGender
Normal (10 participants)45–60 yearsMale, 5: Female, 5
Early (10 participants)50–62 yearsMale, 5: Female, 5
Definite (7 participants)52–61 yearsMale, 4: Female, 3
Severe (3 participants)55–60 yearsMale, 2: Female, 1
Sample for study: 480,000 participants
Table 2. Initial learning parameters for classifier model.
Type of ClassifierParameter
Random ForestNumber of trees: 10
Number of attributes at each split: 5
SVMRegression loss (ε): 0.10
Kernel: radial basis function (RBF)
KNNWeight: Euclidean uniform
Number of neighbors: 5
AdaBoostNumber of estimators: 50
Regression loss function: linear
Neural Network (NN)Number of hidden layer neurons: 100
Number of iterations: 200
Activation: ReLu
Table 3. p-value from the Kruskal–Wallis test for the whole 20 min.
SegmentThe p-Value for the Whole 20-Minute Recording
Normal vs. eCANeCAN vs. dCANNormal vs. Stages of CAN
PR interval0.450.200.34
QT interval0.460.200.33
RR interval0.460.240.34
ST interval0.460.250.34
Table 4. p-value from Kruskal–Wallis test.
Segmentp-Value of FD Computed for Segments at Every 5th Minute
Normal vs. eCANeCAN vs. dCANNormal vs. Stages of CAN
FD of PR interval0.0130.005 *0.002 *
FD of QT interval0.007 *0.002 *0.0005 *
FD of RR interval0.007 *0.002 *0.0005 *
FD of ST interval0.009 *0.001 *0.0001 *
PR interval0.450.190.34
QT interval0.450.190.34
RR interval0.450.200.35
ST interval0.450.200.34
* Specifies statistical significance (p < 0.05).
Table 5. Performance analysis of different supervised classifier models.
ModelArea under ROC Curve (AUC)Classification Accuracy (CA)
Normal vs. Early CANNormal vs. Stages of CANNormal vs. Early CANNormal vs. Stages of CAN
Random Forest0.970.8887.588.9
SVM0.990.9296.894.4
KNN0.850.9771.988.9
Naïve Bayes0.890.8481.277.8
AdaBoost0.870.8787.588.9
Neural Network (NN)0.990.9996.997.2
Publisher’s Note: MDPI stays neutral with regard to jurisdictional claims in published maps and institutional affiliations.

