Article

Assessment of the Genetic and Phytochemical Variability of Italian Wild Hop: A Route to Biodiversity Preservation

by
Margherita Rodolfi
1,*,
Matteo Marieschi
2,
Benedetta Chiancone
1 and
Tommaso Ganino
1,3
1
Department of Food and Drug, University of Parma, 43124 Parma, Italy
2
Department of Chemistry, Life Sciences and Environmental Sustainability, University of Parma, 43124 Parma, Italy
3
National Research Council, Institute of BioEconomy (IBE), Via Madonna del Piano, 10, 50019 Sesto Fiorentino, Italy
*
Author to whom correspondence should be addressed.
Submission received: 15 March 2022 / Revised: 23 May 2022 / Accepted: 30 May 2022 / Published: 6 June 2022
(This article belongs to the Special Issue Frontier Research in Hop)

Abstract

:
Background: Northern Italy has an enormous heritage of hop biodiversity that need to be exploited and studied. The preservation and valorization through the characterization of the existent biodiversity is a primary goal of the European Green Deal 2023–2030. The aim of this study was to acquire information on the biodiversity of Italian wild hops. Methods: Genetic characterization of sixty accessions was done resorting to Single Sequence Repeated (SSR) markers. Phytochemical characterization of wild hops was achieved using: (i) high-performance liquid chromatography with ultraviolet detection for bitter acids quantification, (ii) steam distillation for essential oils quantification and (iii) Gas Chromatography-Mass Spectrometry for the determination of the aromatic profile. Results: The eight SSR primers showed high Polymorphic Information Content (PIC), especially HlGA23. α-Acids reached values between 0 and 4.125. The essential oils analysis highlighted variability within the studied population, with some accessions characterized by important spicy fraction, and others by fruity and floral notes. Conclusions: The present study allowed the characterization of Italian wild hops and demonstrated an interesting biodiversity. Part of this biodiversity have been shown to be potentially suitable for use in brewing. Moreover, several genotypes could be used in breeding programs to obtain new more sustainable varieties.

1. Introduction

Hop (Humulus lupulus L.) is a dioecious, herbaceous perennial climbing plant, and it grows endemic in the temperate zone of the world, including Italy, where its biodiversity is varied. Indeed, the species contains a great quantity of hereditary information and every single individual is virtually unique from the genetic point of view, due to the high polymorphism of the numerous loci present [1]. The exploitation of the wild hop germplasm biodiversity has been, and is still fundamental for breeding, both for selection and as the donor of peculiar phytochemical profiles (i.e., aroma and flavor) in cross programs [2]; especially, in the perspective of facing climate change emergency, within wild hop germplasm, characters of resistance would be individuate. To preserve and comprehend the existent hop biodiversity, its genetic and phytochemical characterization will enhance the agricultural sustainability and competitiveness, as requested by the European Green Deal 2023–2030 [3].
To evaluate genetic diversity, one of the most useful, efficient and reliable method, is the use of Single Sequence Repeated (SSR) markers [4,5,6,7,8]. Recently, Grdiša et al. [5] studied the genetic variability in eight Croatian hop populations, and the results highlighted the high genetic diversity in the wild hop germplasm but low genetic differentiation within the studied hop populations. Together with the genetic characterization, to valorize hop biodiversity, it is essential the evaluation of the secondary metabolite profile. The compounds that mainly characterize hop, important for the brewing industry and for the pharmacological sector, are bitter acids and essential oils. Indeed, bitter acids and, specifically, di- or tri-prenylated phloroglucinol derivatives and their oxidation products confer bitterness to beer, improve foam stability, suppress gushing and reduce contamination [9,10,11,12]; moreover, bitter acids, as demonstrated by experiments on mice, have antidepressant and sedative activity [11,13].
The synthesis and the complex profile of hop essential oils is highly genotype-dependent and strongly influenced by environmental and cultural conditions [14]; the hop aromatic profile is constituted mainly by three chemical groups: hydrocarbons (50–80%), oxygenated compounds (20–50%) and organosulfur compounds (<1%) [15]. Among hydrocarbons, the most representative fraction is represented by terpenes that, being highly volatile, tend to vanish during the brewing process [16,17,18]. The oxygenated fraction, composed by a mixture of alcohols, aldehydes, ketones, epoxides, esters and acids, is H2O-soluble and significantly contributes to beer organoleptic properties [17]. Finally, the organosulfur fraction is very complex and, even though it has a low flavor threshold, can strongly affect the taste and smell of beer, conferring off flavors [14]. Substances of interest for the final aroma with low threshold and belonging to different fractions, are, for example, damascenone and β-ionone, or aliphatic-volatile compounds such as ethyl 2-methylpropanoate, methyl 2-methylbutanoate, 1,5-octadien-3-one, nonanal and 1-octen-3-one, responsible for floral and fruity notes [19].
In a recent study of Dabbou Wach et al. [20], the genetic and phytochemical diversity of wild hops from Corsica were studied, showing interesting characters such as the peculiar presence in the Corsican hop essential oil of zingiberene. Italian hops were instead previously studied by Mongelli et al. [21], and they observed high xanthohumol and α-acid contents compared to previously reported results of phytochemical analysis on European wild hops. Interesting results were found also in the aromatic fraction, where selinene isomers reached values above 40% in the essential oils isolated from six samples.
If several are the studies aimed at charactering and valorizing hop biodiversity all over the world [4,20,22,23,24], few are those investigating the widely still unexplored Italian hop biodiversity [21]; it is, therefore, necessary to step up the effort to fill this gap. With this aim, in this study, 60 Italian wild hop accessions, grown in a collection field were characterized, from the genetic to the phytochemical point of view. The results of this research will allow to acquire and extend the biodiversity map of the Italian wild hop population but also will represent a resource for future breeding programs, contributing to the individuation of characters interesting for the brewing sector and for making hop cultivation more sustainable and resilient to climate change emergency.

2. Materials and Methods

2.1. Plant Material

Sixty wild hop accessions were collected in several areas, located at altitudes ranging from 20 to 1200 m ca, in two Northern Italy regions (Lombardy and Trentino Alto Adige Region) (Table 1 and Figure S1). Collected plants, propagated by rhizome, were, firstly, nursed in a greenhouse, belonging to the University of Parma (UNIPR, IT), and, then, from year 2016 to 2017, transplanted in the UNIPR hop collection field (Marano sul Panaro, IT). The hop germplasm collection field is 3400 m2, with 8 drills of 80 m in length, spaced with 2.5 m between drills and 1 m between plants in the drills. The training system is based on the Y form and the height of the structure is 2.20 m. Plants were arranged in blocks of 4 plants per accession. Wild Italian accessions were tagged with an alphanumerical code (Table 1). In 2018 and 2019, cones for chemical analysis were harvested; hop cones were picked when mature, immediately dried to 8% of humidity, vacuum packed and freeze at −20 °C until the analysis. Of the 60 accessions selected, chemical analysis have been carried out on 34, because 20 of them were male plants and the six showed scarce adaptability to the new environment and did not produce enough cones for the analysis.

2.2. Genetic Analysis

2.2.1. SSR Analysis

Genome DNA of the 60 accessions (Table 1) was extracted from young leaves collected in greenhouse, from young wild hops. Samples, after immersion in liquid nitrogen were stored at −80 °C until DNA extraction. Genomic DNA was extracted following the Cetyltrimethylammonium Bromide (CTAB) procedure [25]. For DNA amplification, eight couples of SSR primers were used, chosen for the high discriminating capacity [26] (Table 2). The Polimerize Chain Reaction (PCR) amplification was performed in a 25 µL volume containing: 1× Reaction Buffer (Biotools, B&M Labs, S.A., Madrid, Spain), 1.5 mM MgCl2 (Biotools, B&M Labs, S.A., Madrid, Spain), 0.2 mM dNTPs (Amersham Biosciences, Piscataway, NJ, USA), 0.2 lM primer (MWG Biotech, Ebersberg, Germany), 20 ng genomic DNA and 0.6 U of Taq polymerase (Biotools, B&M Labs, S.A., Madrid, Spain). For primer HlACA3, HlGA31, HlGA23, MgCl2 concentration was 2.5 mM, to obtain a better quality of amplification. The PCR amplification was optimized in thermal cycler MJ PCT 100 Research (Watertown, MA, USA), programming a first step at 95 °C for 5 min, followed by 30 cycles of 4500 at 94 °C, 3000 at the specific annealing temperature for each couple of primers and 9000 at 72 °C, for denaturation, annealing and primer extension, respectively; at the end of the cycles were allowed 8 min of incubation at 72 °C. The amplification products were separated with a CEQ 8000 Genetic Analysis System (Beckman Coulter, Inc., Brea, CA, USA) sequencer on acrylamide gel CEQ Separation Gel LPA-1 (Beckman Coulter, Inc.). A marker CEQ DNA Size Standard kit 400 (Beckman Coulter, Inc.) was used to estimate the approximate molecular weight of the amplified products. One of the two PCR primers in each reaction was end-labelled with a fluorescent dye (Cy5, MWG-Biotech, Ebersberg, Germany) [4].

2.2.2. Genetic Data Analysis

Fragments were sized by using a conservative binning approach [27] through the statistical R software (R Development Core Team 2005, Version 2.1.1, R Foundation for Statistical Computing, Vienna, Austria), which takes into account the type of replicate and compensates for the limits of fragment resolution. In order to avoid wrong estimations of allelic frequencies due to the presence of clones, individuals identical at all loci were removed from the dataset using an Excel spreadsheet (Microsoft Corporation, Redmond, WA, USA). The information content of the SSR markers was evaluated according to number of alleles per locus, allele frequency, observed (Ho) and expected (He) heterozygosity, effective number of alleles (NE) [28] and Polymorphic Information Content (PIC) [29]. Such values were obtained by using Cervus 3.0 software [30]. The level of similarity/dissimilarity among the examined Italian wild hops was obtained through the genetic similarity matrix utilizing Euclidean distance [31]. Cluster analysis and construction of the dendrogram relative to genetic distances were obtained by using the unweighted pair-group method with arithmetic mean (UPGMA) algorithm, with XLSTAT 2009 software (AddinsoftTM 1995–2009). Univariate clustering analysis was performed using XLSTAT 2009 software (AddinsoftTM 1995–2009).

2.3. Phytochemical Characterization

2.3.1. Chemicals and Solvents

Dichloromethane and anhydrous sodium sulfate were purchased from Sigma–Aldrich (Milan, Italy). Toluene was purchased from Carlo Erba (Milan, Italy). Ultra-pure H2O was in house produced by using a Milli-Q-System (Millipore, Bedford, MA, USA). Standards of caryophyllene, myrcene, humulene and (+)-linalool were purchased from Sigma–Aldrich (Milan, Italy). CH3OH (HPLC grade) was purchased from Sigma–Aldrich (Milan, Italy). Bitter acids mixture standard (International calibration extract, ICE-3) was from Labor Veritas Co. (Zürich, Switzerland). The mixture standard contained α-acids with 13.88% of cohumulone and 30.76% of n-humulone + adhumulone, and β-acids with 13.44% of colupulone and 10.84% of n-lupulone + adlupulone.

2.3.2. Bitter Acids Extraction

Hop dried cones were grinded in liquid nitrogen to avoid oxidation. Bitter acids were extracted from 0.5 g of grinded dried cones in 20 mL of CH3OH in a flask and homogenized with an Ultra Turrax mixer (IKA®, T18 Basic, Wilmington, NC, USA) twice for 20 s, to avoid sample overheating. Extracts were stirred for 3 h at room temperature in the dark to prevent degradation and photooxidation. Subsequently the extracts were centrifuged at 1800× g at 20 °C for 20 min. Supernatant was then transferred to a volumetric flask (50 mL). The exhausted matrix was reextracted with CH3OH (15 mL), centrifuged as earlier, and the supernatant was pooled with the first extract; the volumetric flask was then filled to the final volume with methanol. After filtration through a 0.45-µm polytetrafluoroethylene filter, the sample was analyzed by high-performance liquid chromatography with ultraviolet detection (HPLC-UV) [32].

HPLC-UV Analysis

The HPLC system was equipped with a pump, online vacuum degasser, auto-sampler, Peltier column oven, UV–Vis detector (Perkin Elmer Series 200, Waltham, MA, USA) and autosampler (Perkin Elmer series 220). The chromatographic data was analyzed using a Perkin Elmer Total Chrome workstation (version 6.3.1.). HPLC was equipped with Luna C18:2 column (5 µm, 100 A, 250 mm × 4.6 mm) (Phenomenex®, Castel Maggiore, Bologna, Italy). Solvent A (H2O + 0.1% H3PO4 and solvent B (CH3OH + 0.1% H3PO4) were used for the mobile phase. Chromatographic conditions were set as follows: the flow rate was 1.5 mL/ min in isocratic, the column temperature was set at 30 °C, the injection volume was 10 µL. so the analysis was performed using eluent A 5% and eluent B 95% for 15 min. Chromatograms were acquired at 314 nm. Three injections from three independent extractions were performed for each sample. For the quantification of β and α acids, a calibration curve was obtained from dilution ofs ICE-3 standard, according to the official method (Analytica-EBC, method 7.7) [32].

2.3.3. Essential Oil Extraction and GC/MS Analysis

Prior the analysis, the samples were extracted in three replicates each year (2018 and 2019) with steam distillation for 4 h to obtain essential oils for each accession. The essential oil was diluted in CH2Cl2 (1:200 v/v) in a vial and added of a small amount of anhydrous Na2SO4 to eliminate possible water’s trace. After the addition of toluene (25 µL of a solution 4000 ppm in CH2Cl2) as the internal standard, the diluted sample (1 µL) was analyzed by GC/MS. All samples were analyzed with a Thermo Scientific (San Jose, CA, USA) TRACE 1300 gas chromatograph coupled to a thermo scientific ISQTM single quadrupole mass spectrometer. The gas chromatograph was equipped with Supelcowax 10 (30 m × 0.25 mm, f.t. 0.25 µm) (Supelco, Bellefonte, PA, USA) capillary columns, and helium was used as carrier gas (constant flow of 1 mL/min). GC-MS oven temperature gradient started from 50 °C; this condition was maintained for 3 min, then the temperature was raised to 200 °C (5 °C/min). The final temperature was maintained for 18 min. The injector was maintained at 230 °C operating in split modality, ratio 1:20. The mass spectrometer was equipped with an electron impact source (EI, 70 eV), and the acquisition mode was full scan (from 40 m/z to 500 m/z). A solvent delay time of 4 min was applied. The main volatile compounds were identified on the basis of their mass spectra compared with the reference mass spectra libraries (WILEY275, NBS75K NIST mass spectral Search Program for the NIST7EPA7NIH Mass Spectral library, version 2.3 distributed by the Standard Reference Data Program of NIST, Gaithersburg, MD, USA) and of their calculated retention indexes through the application of the Kovats’ formula (KI) compared with those reported in the literature. When it was not possible to find the KI in the literature, a tentative identification was obtained by matching with mass spectra libraries data: a match quality of 98% minimum was used as a criterion. In order to determinate the Retention Index of the components, a mixture of alkanes (C8–C20) was injected in the Gas Chromatography-Mass Spectrometry (GC–MS) equipment and analyzed under the same conditions described above. The gas chromatographic signals were manually integrated, and the resulting peak areas were compared with the total sum of area and expressed in percentage [32].

2.4. Statistical Analysis

The collected phytochemical data were analyzed using one-way analysis of variance (ANOVA), followed by Tukey’s post hoc test (p ≤ 0.05) (XLSTAT 2009 software—Addinsoft™ 1995–2009). Principal component analysis (PCA) was used as an alternative way to represent interindividual relationships using essential oil profile data. The PCA analysis was performed using XLSTAT 2009 software (Addinsoft™ 1995–2009).

3. Results and Discussion

3.1. Genetic Characterization

In the genetic characterization of the 60 wild hop samples, the DNA fragments obtained using eight SSR markers, were analyzed.

3.1.1. Microsatellite Markers Polymorphism

The eight primers used to analyze the 60 accessions selected, resulted efficient to discriminate the genotypes. Allelic profile is reported in Table S1 of the Supplementary Materials. The heterozygosity analysis and allelic frequencies allow the individuation of 95 alleles (Table 3). The most polymorphic primer result HlGA23 with 31 alleles observed. He ranged between 0.550 for primer HlGT14 and 0.910 for HlGT23 primer. Ho ranged between 0.550 for primer HlGT14 and 0.783 for HlGT17. The Ho values indicate a high level of genetic diversity in the studied wild population. These data are in accord with prior study on Italian wild hop population [4] and also with a recent study on Portuguese wild hop populations [33], where Ho with the same SSR markers, ranged between 0.63 for HlAGA6 and 0.73 for HlGA23. Instead, the number of alleles per locus for the primers HlGA31 and HlGA23 are not in accord with Mafakheri et al. [34], showing that the same SSR markers could differentially perform, depending on the population analyzed. The richness of alleles present in locus HlGA23 is instead in accord with the study of Stajner et al. [26]. The lowest value for allelic frequencies is 0.008 and corresponds to the frequencies of unique alleles. The allele present with the highest frequency is instead allele 167 in HlGT14 with a frequency value of 0.608. Unique alleles are present in five loci over eight primers, with the exception of HlGA7, HlGT16 and HlAGA31. The presence of unique alleles in the wild population and not detected in cultivars already reported in previous studies, is, probably, due to genetic erosion and selection made using restricted genetic resources [35]. PIC value is an important index to evaluate the discriminant power of locus, and in our study reach, values between 0.482 for HlGA31 and 0.897 for HlGA23, thus showing the best discrimination power. These results are in accord with a prior study on an Italian hop population, where HlGA23 showed the best performances [4,33]. The use of eight SSR primers allow a good discrimination among the samples, but the primers used were not able to discriminate between sites of provenience. Similar results were obtained by Grdìsa et al. [5] in a study on the wild Croatian hop population; the genetic analysis, carried out in the study, was effective for the discrimination among the genotypes but not useful to discriminated between the eight studied Croatian populations.

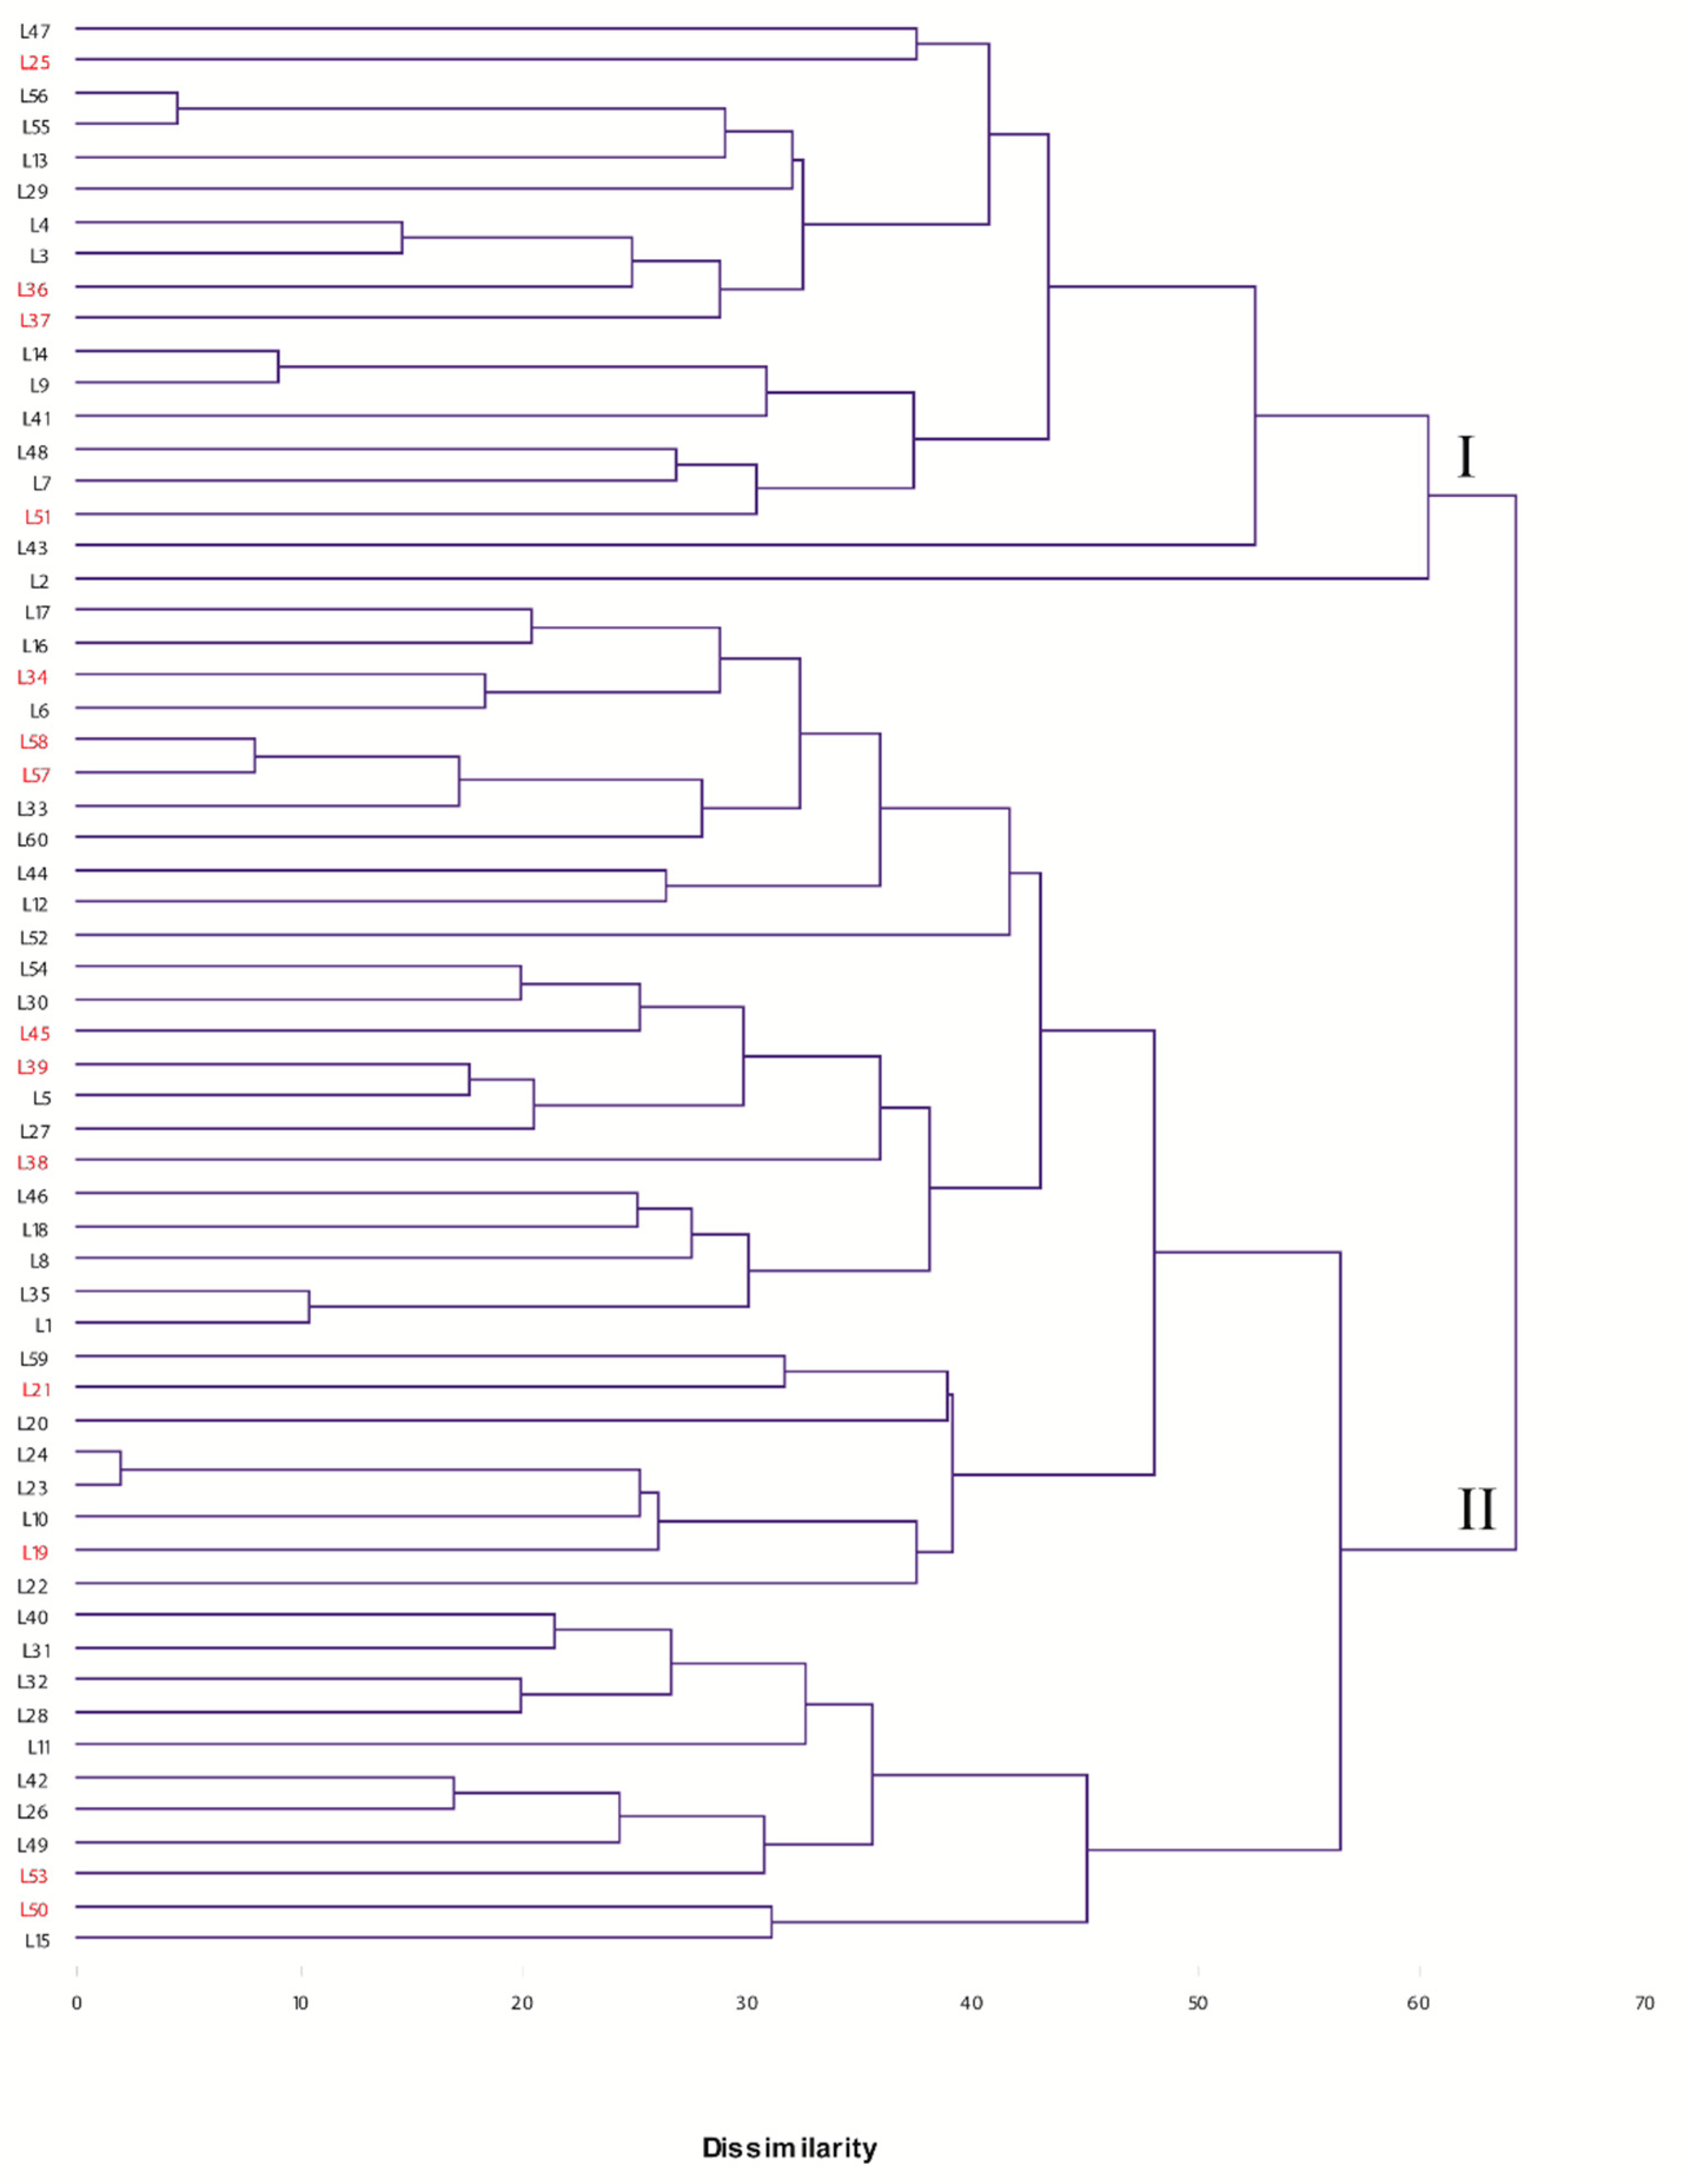
3.1.2. Cluster Analysis

The dendrogram obtained from microsatellite data is shown in Figure 1. The dendrogram shows the 65% of dissimilarity and two main groups. Trentino Alto Adige and Lombardy accessions are not separated in distinctive groups and are equally distributed along the dendrogram, thus showing that SSR analysis is not suitable to reach this achievement. Group I is more populated and contain one-third of the studied population; group II is composed by the remaining accessions. Genotypes L23 and L24 and genotypes L56 and L55 show high similarities; this similarity is, maybe, due to the proximity of the sites where these two accessions were collected.

3.2. Phytochemical Characterization

For a better observation and comprehension of the biodiversity present in the analyzed accessions, the evaluation of bitter acids content and essential oil yield were carried out. Moreover, the volatile fraction were evaluated, giving a more complete statement of the wild hop genotypes.

3.2.1. Bitter Acids Quantification

Hops α- and β-acids were analyzed and quantified using HPLC UV, revealing interesting results. In Table 4, the content of bitter acids is shown. The α-Acids values ranged from 0% in L14 to 4.125 ± 0.969% in the L21 genotype, which represents the significant highest value, together with the L7 genotype (Table 4). In the studied population, genotypes with high α-acids contents are not present; these data are in accord with prior studies on European wild hop germplasm, where bitter accessions were not found [21,36], and with a recent study on Italian wild hop germplasm, where α-acids do not exceed the value of 4.10% [33]. In Table 4, it is also possible to observe an important variability, with significant differences noticeable among the studied accessions. β-Acids, instead, ranged from 1.064 ± 0.009 in the L54 genotype to 6.462 ± 0.355 in the L53 genotype, which possess the significantly higher content of beta acid. In the studied accessions, β-acid values were tested on values higher than those reported by Patzak [36] and Mongelli et al. [21] in European wild hops. The cohumulone content is an important qualitative value for brewers and hop users, as it confers bitterness, and its value is expressed as a percentage on the total content of α-acids. L37 is the accession with the highest cohumulone value (32.046 ± 1.66%); instead, L14 possesses the lowest, since it does not contain alpha acids. The data are partially in accord with a study on wild hop in Banja Luka Area [37], in which hop samples reached the value 28.8 ± 1.2% of cohumulone. Nevertheless, the cohumulone content in the analyzed accessions showed a lower level if compared to US or Canadian wild hops; in fact, in a study by Patzak et al. [6], cohumulone in US and Canadian samples reached values of 55.37 ± 6.59 and 56.52 ± 5.37% of the total α-acids.

3.2.2. Essential Oil Yields

In the two years of data acquirement, from the three replicates each year, it was possible to observe the essential oil production of the accession present in the studied population. Essential oil quantification is shown in Table 4. Genotype L53 has the significant higher value of oil content, with 0.70% of an oil yield value; the accession that showed the lowest oil yield was L41, reaching the value of 0.20%. These data are in accord with prior studies on Italian wild hop and European wild hops [21,35,37,38,39,40], where the essential oil yield reached values from 0.2% and seldom exceed 1%.

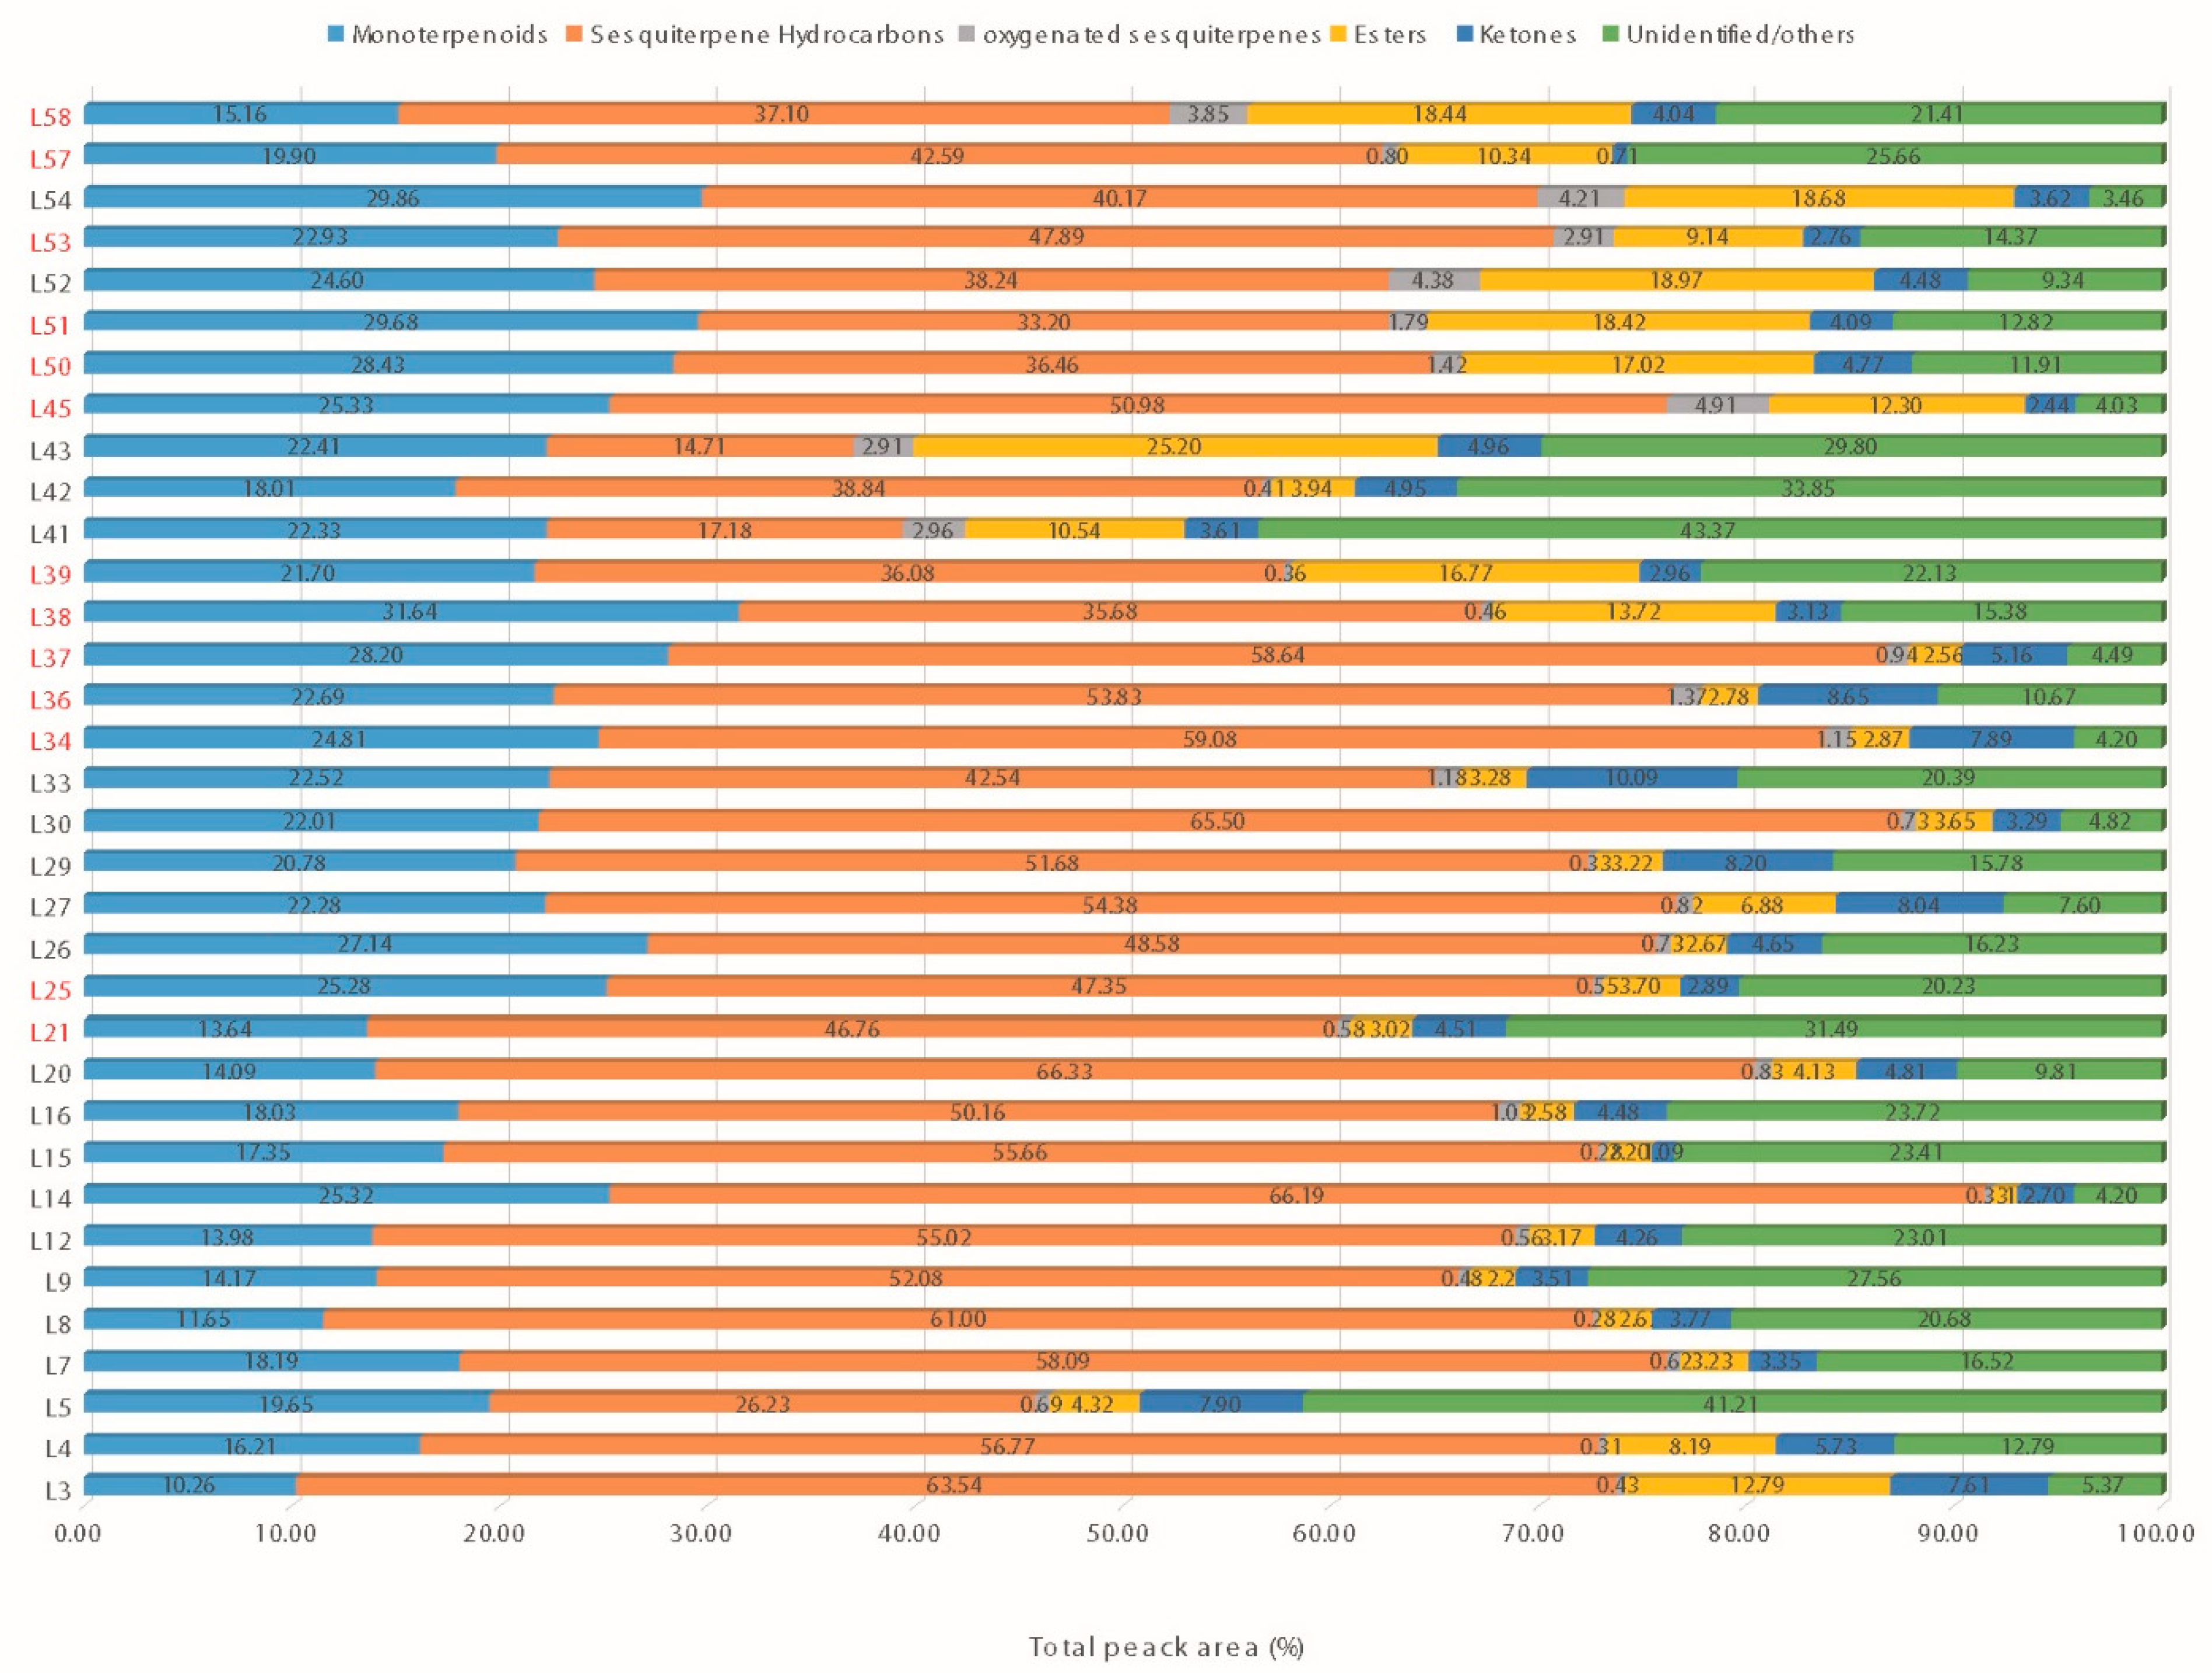
3.2.3. GC-MS Analysis-Essential Oil Profile
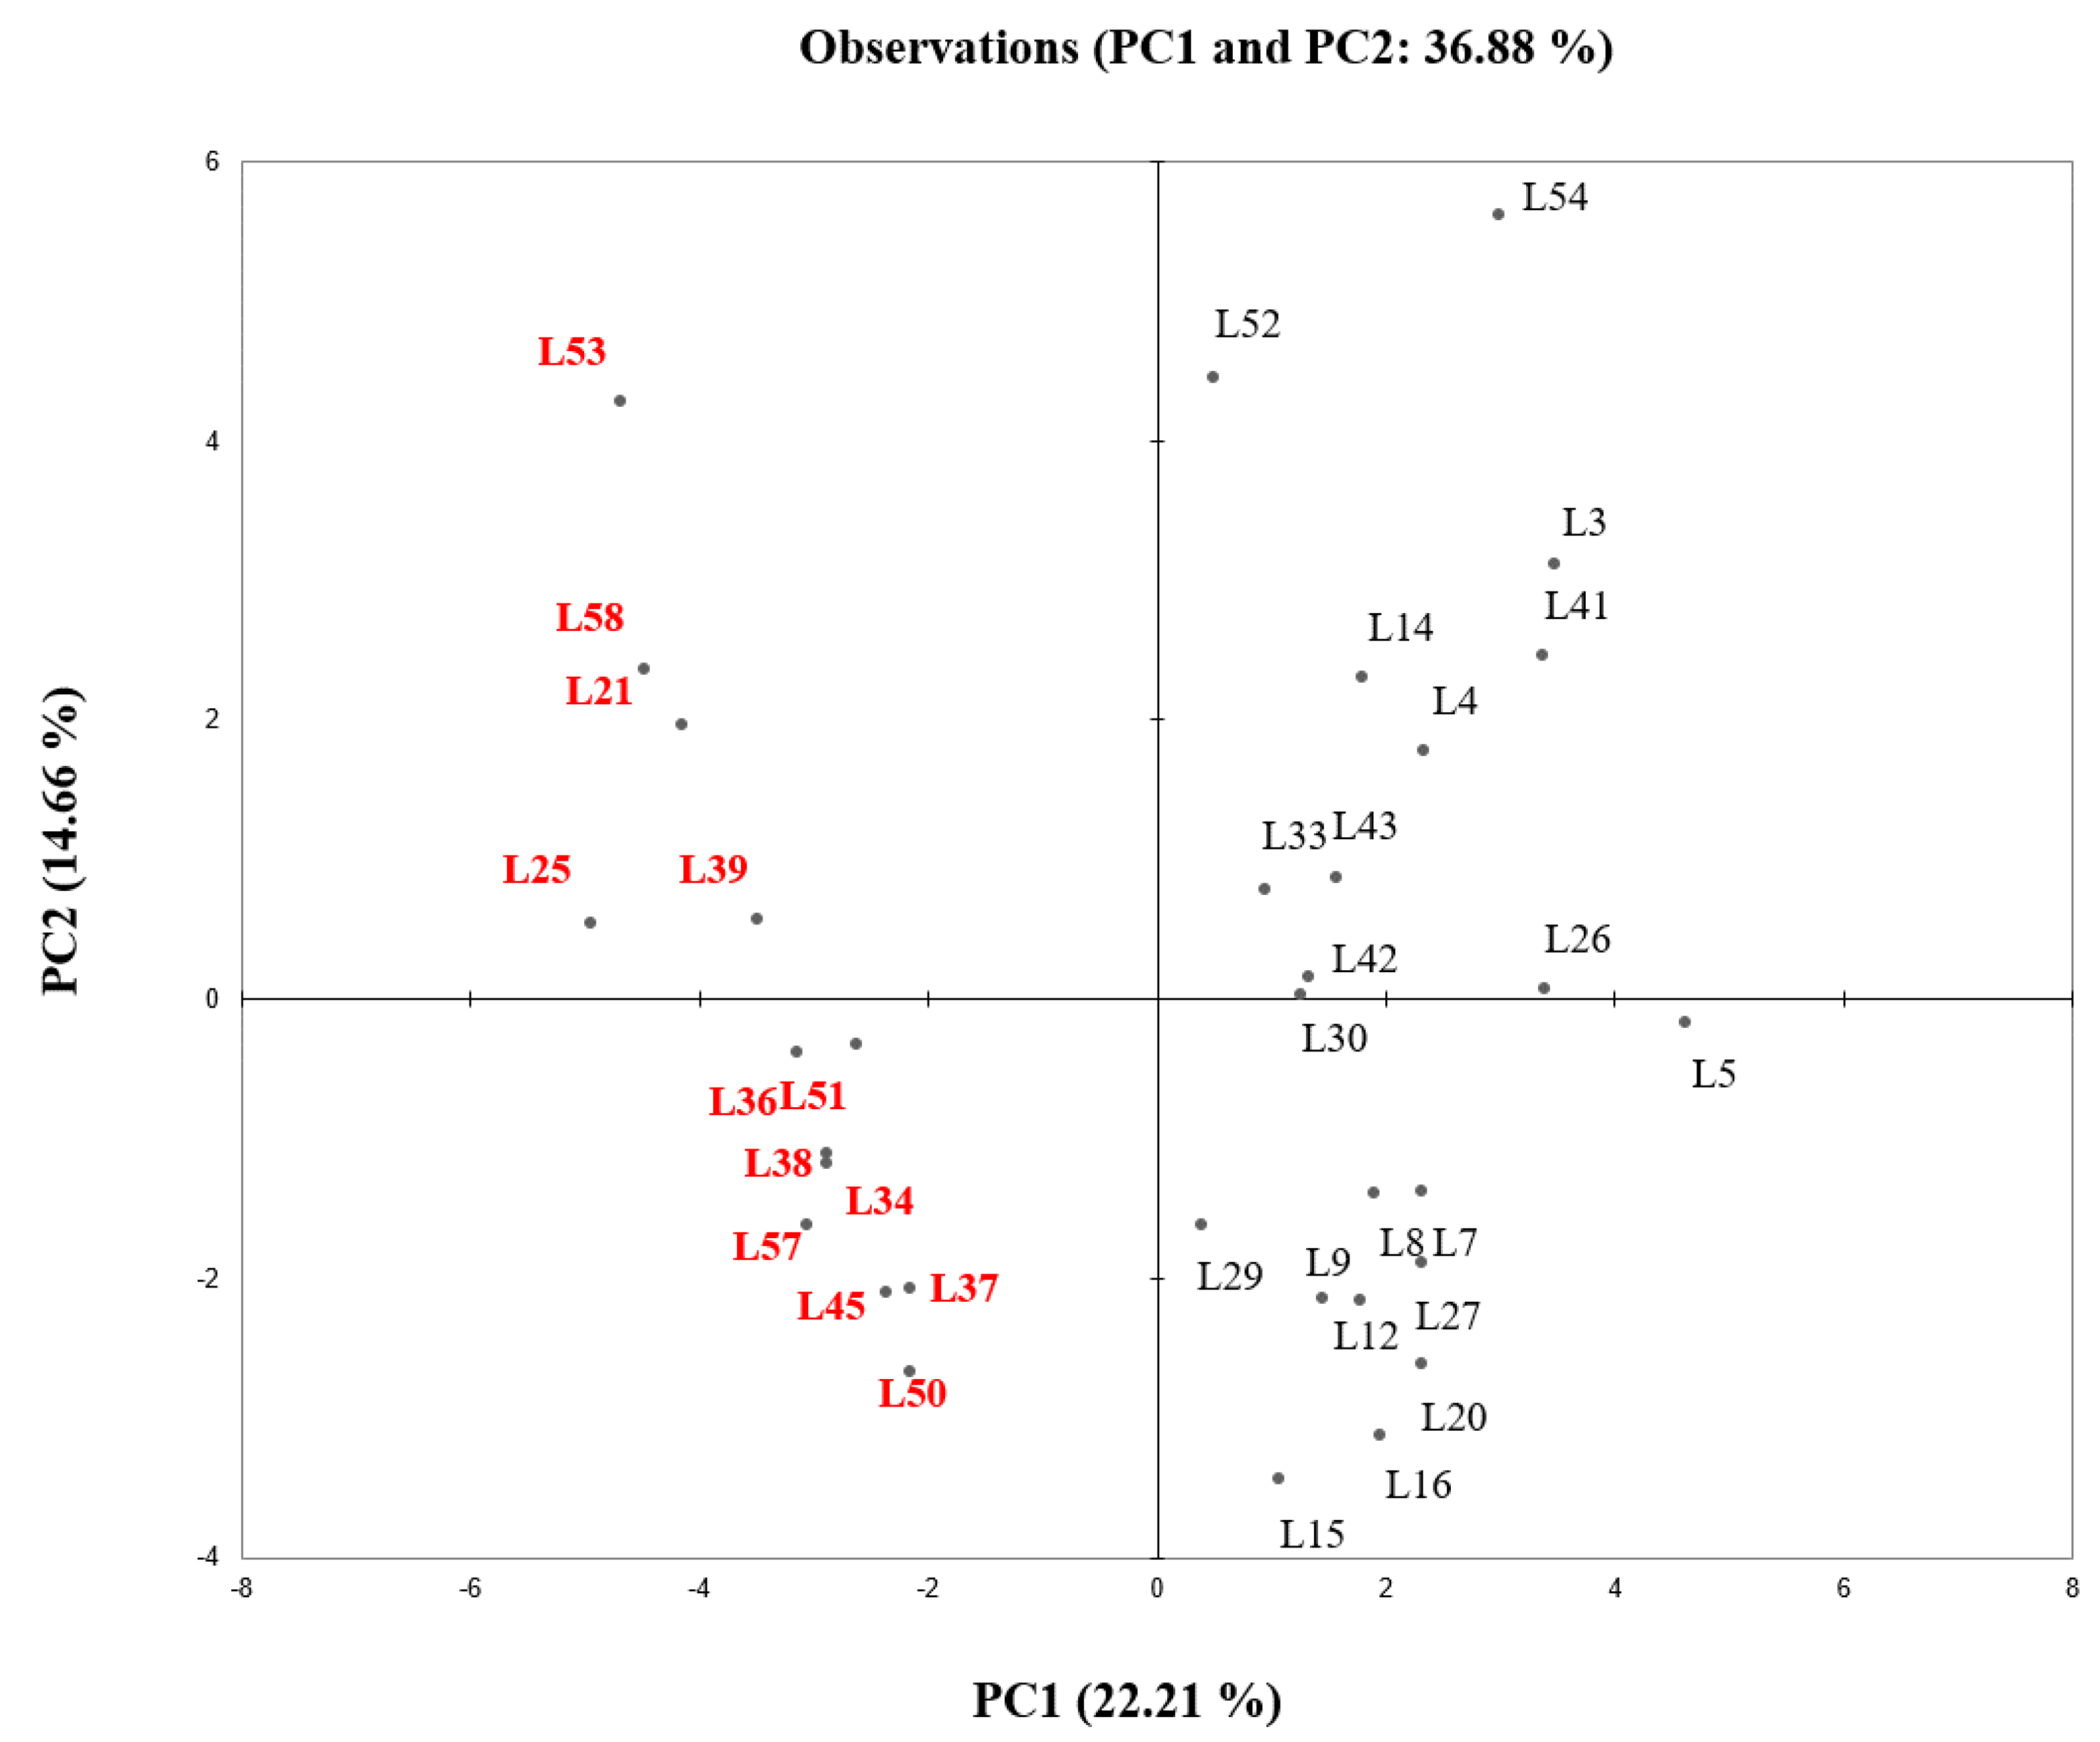
Essential oil analysis involved 34 accessions, for two years of analysis (2018–2019). 18 aroma metabolites were identified (Table S2); essential oil composition is reported in Figure 2, with volatile metabolites grouped into six different classes (Monoterpenoids, Sesquiterpenoids hydrocarbions, Oxygenated monoterpenoids, Esters, Ketones and others, where unidentified molecules are also included). It is possible to observe a high variability of the essential oil composition within the studied population, with the majority of compounds belonging to the sesquiterpene fraction for all the accessions, except for L5 and L45 (Figure 2). L3 showed the highest sesquiterpene and esters percentages (69.40% and 25.20%, respectively); instead, L5 and L45 are characterized by other compounds that do not belong to any of the considered group. In the sesquiterpene fraction, α-Humulene and α- and β-Selinene are the compounds more present and they contribute to confer to Italian wild samples fresh and spicy characterization of the Italian wild samples, in line with a previous study on European cultivars [38,39]. Moreover, the chemical composition of several of the Italian genotypes analyzed in this study appeared to have relevant similarity to cultivars known as “noble hops”, characterized by the presence of spicy/herbal notes, due to the presence of Trans-β-farnesene and the oxidation of sesquiterpenes like α-Humuluene [40,41,42] (Table S2). The monoterpene fraction is mainly composed by Myrcene, with little contribution of β-Pinene, Limonene and Bergamotene when present. Data on Myrcene presence are variable, in line with previous studies [21,32], and in the studied genotypes, the content do not exceed 31.48%. The presence of Esters, conferred marked floral and fruity notes to the wild hop samples, and L3 accessions is characterized by the highest amount (9.07%) (Figure 2). α-Humulene is instead characteristic of different wild genotypes, covering the 34.75% of the total aromatic profile in L50 and showing interesting aromatic profile. L3 and L43 showed instead the highest ketone percentage, with 7.25 and 6.19%, respectively, thus possess fruity characters. The high variability showed in the volatile composition is a demonstration of the importance of the biodiversity preservation, which is a source of characters of ecological and commercial importance. In the population studied in this research, accessions showed aromatic profiles, different for the type and amount of volatile molecules detected; genotypes characterized by spicy notes and accessions with fruity and citrusy characters were observed.

3.2.4. PCA Analysis

With the aim of better understanding differences among the genotypes, a PCA analysis was performed using essential oil composition (Figure 3 and Table S3). In Figure 3, it is possible to observe the differentiation within the analyzed samples by provenance: In the left part of the score plots, all Trentino Alto Adige accessions are grouped, instead, in the right part are Lombardy accessions. This data show a differentiation between the hop genotypes belonging from the two region, even if no differentiation were observed in the genetic analysis (Figure 1). This results suggest that the biosynthesis of a volatile fraction probably follow different pathways due to the adaptation of the accession to the two different native environments.

4. Conclusions

In conclusion, from the genetic analysis on 60 wild Italian hop accessions, it is possible to observe high variability and polymorphism. The SSR markers used exhibited a good discrimination power and showed that all the studied accessions are different and unique. Nonetheless, from the UPGMA analysis, it was not possible to discriminate accessions by provenance. Within the 34 chemically studied genotypes, there were no detected high α-acid accessions, in accordance with prior studies on Italian and European wild genotypes. A zero α variety is an interesting recovery that could have different uses, from the pharmaceutical to particular brewing styles. In the studied samples, different accessions revealed oil contents in line with European aromatic varieties and interesting aromatic profiles. The study of Italian wild hop biodiversity allows the construction of a genetic databank and a hop collection field in which a small part of the wide Italian hop biodiversity can be preserved and studied to support breeding programs and make hop culture more sustainable.

Supplementary Materials

The following supporting information can be downloaded at https://0-www-mdpi-com.brum.beds.ac.uk/article/10.3390/app12115751/s1: Figure S1: Geographical origin of the plants from Trentino and Lombardy regions (IT). Table S1: Allele profiles resulted from the 8 SSR markers on the 60 studied accessions. Trentino Alto Adige accessions are indicated in red. Table S2: Essential oil composition of the 34 studied accessions express in % on the total area. Trentino Alto Adige accessions are indicated in red. Table S3: Results from Principal Component Analysis of essential oil compositions of Trentino Alto Adige and Lombardy wild accessions.

Author Contributions

M.R. contributed to the project development, performed the chemical analysis and statistical analysis and interpreted the results and contributed to the first and final draft of the manuscript. M.M. contributed to the data acquirements, to the essential oil extraction and to the draft writing, B.C. contributed to the phytochemical data acquisition, results interpretation and to the final draft of the manuscript. T.G. planned the project concept and performed the statistical analysis and results interpretation. All authors have read and agreed to the published version of the manuscript.

Funding

This research received no external funding.

Institutional Review Board Statement

Not applicable.

Informed Consent Statement

Not applicable.

Data Availability Statement

Not applicable.

Acknowledgments

We would like to thank HIBU Brewery for the support and foresight demonstrated and Flavio Kaisermann for the kind collaboration and recruitment of the plant material in the Trentino region. Special thanks to the mayor of Marano sul Panaro (MO, IT) for making available the experimental field. This research was supported by HIBU Brewery S.r.l. and Fondazione Edmund Mach.

Conflicts of Interest

The authors declare no conflict of interest. The funders had no role in the design of the study; in the collection, analyses or interpretation of data; in the writing of the manuscript or in the decision to publish the results.

References

  1. Wilson RJ, H.; Roberts, T.R.; Smith, R.J.; Bradley, L.L.; Moir, M. The inherent foam stabilising and lacing properties of some minor, hop-derived constituents of beer. In European Brewery Convention Symposium Beer Foam Quality; Verlag Hans Carl Getränke-Fachverlag: Amsterdam, The Netherlands, 1998; pp. 188–207. [Google Scholar]
  2. Neve, R.A. Hops; Chapman and Hall: London, UK, 1991. [Google Scholar]
  3. Falco, F.L.; Feitelson, E.; Dayan, T. Spatial Scale Mismatches in the Eu Agri-Biodiversity Conservation Policy. The Case for a Shift to Landscape-Scale Design. Land 2021, 10, 846. [Google Scholar] [CrossRef]
  4. Rodolfi, M.; Silvanini, A.; Chiancone, B.; Marieschi, M.; Fabbri, A.; Bruni, R.; Ganino, T. Identification and Genetic Structure of Wild Italian Humulus lupulus L. and Comparison with European and American Hop Cultivars Using Nuclear Microsatellite Markers. Genet. Resour. Crop Evol. 2018, 65, 1405–1422. [Google Scholar] [CrossRef]
  5. Grdiša, M.; Šatović, Z.; Liber, Z.; Jakše, J.; Varga, F.; Erhatić, R.; Srečec, S. High Genetic Diversity and Low Population Differentiation in Wild Hop (Humulus lupulus L.) from Croatia. Appl. Sci. 2021, 11, 6484. [Google Scholar] [CrossRef]
  6. Patzak, J.; Nesvadba, V.; Krofta, K.; Henychova, A.; Marzoev, A.I.; Richards, K. Evaluation of Genetic Variability of Wild Hops (Humulus lupulus L.) in Canada and the Caucasus Region by Chemical and Molecular Methods. Genome 2010, 53, 545–557. [Google Scholar] [CrossRef]
  7. Bassil, N.V.; Gilmore, B.; Oliphant, J.M.; Hummer, K.E.; Henning, J.A. Genic SSRs for European and North American Hop (Humulus lupulus L.). Genet. Resour. Crop Evol. 2008, 55, 959–969. [Google Scholar] [CrossRef]
  8. Murakami, A.; Darby, P.; Javornik, B.; Pais, M.S.S.; Seigner, E.; Lutz, A.; Svoboda, P. Microsatellite DNA Analysis of Wild Hops, Humulus lupulus L. Genet. Resour. Crop Evol. 2006, 53, 1553–1562. [Google Scholar] [CrossRef]
  9. Hrnčič, M.K.; Španinger, E.; Košir, I.J.; Knez, Ž.; Bren, U. Hop Compounds: Extraction Techniques, Chemical Analyses, Antioxidative, Antimicrobial, and Anticarcinogenic Effects. Nutrients 2019, 11, 257. [Google Scholar] [CrossRef] [PubMed] [Green Version]
  10. De Keukeleire, D. Fundamentals of beer and hop chemistry. Quim. Nova 2000, 23, 108–112. [Google Scholar] [CrossRef]
  11. Van Cleemput, M.; Cattoor, K.; De Bosscher, K.; Haegeman, G.; De Keukeleire, D.; Heyerick, A. Hop (Humulus lupulus)-derived bitter acids as multipotent bioactive compounds. J. Nat. Prod. 2009, 72, 1220–1230. [Google Scholar] [CrossRef]
  12. Zhang, G.; Zhang, N.; Yang, A.; Huang, J.; Ren, X.; Xian, M.; Zou, H. Hop Bitter Acids: Resources, Biosynthesis, and Applications. Appl. Microbiol. Biotechnol. 2021, 105, 4343–4356. [Google Scholar] [CrossRef]
  13. Zanoli, P.; Zavatti, M. Pharmacognostic and Pharmacological Profile of Humulus lupulus L. J. Ethnopharmacol. 2008, 116, 383–396. [Google Scholar] [CrossRef] [PubMed]
  14. Almaguer, C.; Schönberger, C.; Gastl, M.; Arendt, E.K.; Becker, T. Humulus lupulus—A Story That Begs to Be Told. A Review. J. Inst. Brew. 2014, 120, 289–314. [Google Scholar] [CrossRef]
  15. Sharpe, F.R.; Laws, D.R.J. The essential oil of hops a review. J. Inst. Brew 1981, 87, 96–107. [Google Scholar] [CrossRef]
  16. Steenackers, B.; De Cooman, L.; De Vos, D. Chemical Transformations of Characteristic Hop Secondary Metabolites in Relation to Beer Properties and the Brewing Process: A Review. Food Chem. 2015, 172, 742–756. [Google Scholar] [CrossRef] [PubMed]
  17. Eri, S.; Khoo, B.K.; Lech, J.; Hartman, T.G. Direct Thermal Desorption-Gas Chromatography and Gas Chromatography-Mass Spectrometry Profiling of Hop (Humulus lupulus L.) Essential Oils in Support of Varietal Characterization. J. Agric. Food Chem. 2000, 4, 1140–1149. [Google Scholar] [CrossRef]
  18. Nance, M.R.; Setzer, W.N. Volatile Components of Aroma Hops (Humulus lupulus L.) Commonly Used in Beer Brewing. J. Brew. Distill. 2011, 2, 16–22. [Google Scholar]
  19. Kishimoto, T.; Wanikawa, A.; Kono, K.; Shibata, K. Comparison of the odor-active compounds in unhopped beer and beers hopped with different hop varieties. J. Agric. Food Chem. 2006, 54, 8855–8861. [Google Scholar] [CrossRef] [PubMed]
  20. Dabbous-Wach, A.; Rodolfi, M.; Paolini, J.; Costa, J.; Ganino, T. Characterization of Wild Corsican Hops and Assessment of the Performances of German Hops in Corsican Environmental Conditions through a Multidisciplinary Approach. Appl. Sci. 2021, 11, 3756. [Google Scholar] [CrossRef]
  21. Mongelli, A.; Rodolfi, M.; Ganino, T.; Marieschi, M.; Dall’Asta, C.; Bruni, R. Italian Hop Germplasm: Characterization of Wild Humulus lupulus L. Genotypes from Northern Italy by Means of Phytochemical, Morphological Traits and Multivariate Data Analysis. Ind. Crops Prod. 2015, 70, 16–27. [Google Scholar] [CrossRef]
  22. Kavalier, A.R.; Litt, A.; Ma, C.; Pitra, N.J.; Coles, M.C.; Kennelly, E.J.; Matthews, P.D. Phytochemical and Morphological Characterization of Hop (Humulus lupulus L.) Cones over Five Developmental Stages Using High Performance Liquid Chromatography Coupled to Time-of-Flight Mass Spectrometry, Ultrahigh Performance Liquid Chromatography Photodi. J. Agric. Food Chem. 2011, 59, 4783–4793. [Google Scholar] [CrossRef]
  23. McCallum, J.L.; Nabuurs, M.H.; Gallant, S.T.; Kirby, C.W.; Mills, A.A.S. Phytochemical Characterization of Wild Hops (Humulus lupulus Ssp. Lupuloides) Germplasm Resources From the Maritimes Region of Canada. Front. Plant Sci. 2019, 10, 1438. [Google Scholar] [CrossRef]
  24. Yan, D.D.; Wong, Y.F.; Shellie, R.A.; Marriott, P.J.; Whittock, S.P.; Koutoulis, A. Assessment of the Phytochemical Profiles of Novel Hop (Humulus lupulus L.) Cultivars: A Potential Route to Beer Crafting. Food Chem. 2019, 275, 15–23. [Google Scholar] [CrossRef]
  25. Doyle, J.; Doyle, J. A Rapid DNA Isolation Procedure for Small Quantities of Fresh Leaf Tissue. Phytochem. Bull. 1987, 19, 11–15. [Google Scholar]
  26. Stajner, N.; Jakse, J.; Kozjak, P.; Javornik, B. The Isolation and Characterisation of Microsatellites in Hop (Humulus lupulus L.). Plant Sci. 2005, 168, 213–221. [Google Scholar] [CrossRef]
  27. Kirby, L.T. Probability and Statistical Analysis. In DNA Fingerprinting; Springer: Berlin/Heidelberg, Germany, 1990; pp. 149–177. [Google Scholar] [CrossRef]
  28. Paetkau, D.; Calvert, W.; Stirling, I.; Strobeck, C. Microsatellite analysis of population structure in Canadian polar bears. Mol. Ecol. 1995, 4, 347–354. [Google Scholar] [CrossRef]
  29. Botstein, D.; White, R.L.; Skolnick, M.; Davis, R.W. Construction of a genetic linkage map in man using restriction fragment length polymorphisms. Am. J. Hum. Genet. 1980, 32, 314. [Google Scholar]
  30. Kalinowski, S.T.; Taper, M.L.; Marshall, T.C. Revising How the Computer Program Cervus Accommodates Genotyping Error Increases Success in Paternity Assignment. Mol. Ecol. 2007, 16, 1099–1106. [Google Scholar] [CrossRef]
  31. Ganino, T.; Fabbri, A.; Rotondi, A.; Beghè, D. Genetic Resources of Olea europaea L. in the Bologna Province (Italy): SSR Analysis and Identification of Local Germplasm; Firenze University Press: Firenze, Italy, 2008; pp. 1000–1007. [Google Scholar] [CrossRef]
  32. Mongelli, A.; Rodolfi, M.; Ganino, T.; Marieschi, M.; Caligiani, A.; Dall’Asta, C.; Bruni, R. Are Humulus lupulus L. Ecotypes and Cultivars Suitable for the Cultivation of Aromatic Hop in Italy? A Phytochemical Approach. Ind. Crops Prod. 2016, 83, 693–700. [Google Scholar] [CrossRef]
  33. Rodolfi, M.; Chiancone, B.; Liberatore, C.M.; Fabbri, A.; Cirlini, M.; Ganino, T. Changes in Chemical Profile of Cascade Hop Cones According to the Growing Area. J. Sci. Food Agric. 2019, 99, 6011–6019. [Google Scholar] [CrossRef]
  34. Mafakheri, M.; Hamidoghli, Y. Micropropagation of Hop (Humulus lupulus L.) via Shoot Tip and Node Culture. Acta Hortic. 2019, 1236, 31–35. [Google Scholar] [CrossRef]
  35. Jakse, J.; Satovic, Z.; Javornik, B. Microsatellite Variability among Wild and Cultivated Hops (Humulus lupulus L.). Genome 2004, 47, 889–899. [Google Scholar] [CrossRef] [PubMed]
  36. Riccioni, C.; Belfiori, B.; Sileoni, V.; Marconi, O.; Perretti, G.; Bellucci, M.; Rubini, A. High Genetic and Chemical Diversity of Wild Hop Populations from Central Italy with Signals of a Genetic Structure Influenced by Both Sexual and Asexual Reproduction. Plant Sci. 2021, 304, 110794. [Google Scholar] [CrossRef]
  37. Patzak, J.; Nesvadba, V.; Henychová, A.; Krofta, K. Assessment of the Genetic Diversity of Wild Hops (Humulus lupulus L.) in Europe Using Chemical and Molecular Analyses. Biochem. Syst. Ecol. 2010, 38, 136–145. [Google Scholar] [CrossRef]
  38. Kondi’ckondi’c, D.; Andrejačerenak, A.A.; Košir, I.J.; Ocvirk, M.; Krmpot, T.; Ðurić, G.Ð. Morphological and Biochemical Characterization of Wild Hop (Humulus lupulus L.) Populations from Banja Luka Area (Bosnia and Herzegovina). Agronomy 2021, 11, 239. [Google Scholar] [CrossRef]
  39. Krofta, K. Comparison of Quality Parameters of Czech and Foreign Hop Varieties. Citeseer 2003, 49, 261–268. [Google Scholar] [CrossRef] [Green Version]
  40. Van Opstaele, F.; Praet, T.; Aerts, G.; De Cooman, L. Characterization of Novel Single-Variety Oxygenated Sesquiterpenoid Hop Oil Fractions via Headspace Solid-Phase Microextraction and Gas Chromatography-Mass Spectrometry/Olfactometry. J. Agric. Food Chem. 2013, 61, 10555–10564. [Google Scholar] [CrossRef] [PubMed]
  41. Praet, T.; Van Opstaele, F.; Steenackers, B.; De Vos, D.; Aerts, G.; De Cooman, L. Flavor Activity of Sesquiterpene Oxidation Products, Formed upon Lab-Scale Boiling of a Hop Essential Oil-Derived Sesquiterpene Hydrocarbon Fraction (Cv. Saaz). J. Am. Soc. Brew. Chem. 2016, 74, 65–76. [Google Scholar] [CrossRef]
  42. Eyres, G.T.; Marriott, P.J.; Dufour, J.P. Comparison of Odor-Active Compounds in the Spicy Fraction of Hop (Humulus lupulus L.) Essential Oil from Four Different Varieties. J. Agric. Food Chem. 2007, 55. [Google Scholar] [CrossRef]
Figure 1. Dendrogram of 60 individual wild hops revealed by UPGMA cluster analysis based Euclidean distance, determined using 8 SSR markers. In red, Trentino Alto Adige accessions are highlighted.
Applsci 12 05751 g001
Figure 2. Relative composition of the 34 accessions divided into 6 compound classes. The number on bars are referred to mean % value of the two year analysis. Trentino Alto Adige accessions are indicated in red.
Applsci 12 05751 g002
Figure 3. Score plots obtained from the PCA of essential oil compositions of Trentino Alto Adige and Lombardy wild accessions. Trentino Alto Adige accessions are indicated in red.
Applsci 12 05751 g003
Table 1. List of the studied accessions with ID, name or location and region of provenance.
IDName/LocationRegionIDName/LocationRegion
L1AdrianoLombardy (IT)L31Lodi Fico 1Lombardy (IT)
L2Arcore 1Lombardy (IT)L32Lodi Fico 2Lombardy (IT)
L3Arcore 2Lombardy (IT)L33MaddalenaLombardy (IT)
L4Arcore 3Lombardy (IT)L34MarterTrentino Alto Adige (IT)
L5AsnagoLombardy (IT)L35MartinengoLombardy (IT)
L6BeveraLombardy (IT)L36Masi Trentino Alto Adige (IT)
L7BigliLombardy (IT)L37Masi VigoTrentino Alto Adige (IT)
L8Bigli 2Lombardy (IT)L38MezzanoTrentino Alto Adige (IT)
L9BognoLombardy (IT)L39Molina di FiemmeTrentino Alto Adige (IT)
L10BovisioLombardy (IT)L40MortaraLombardy (IT)
L11CanardoLombardy (IT)L41MozzanicoLombardy (IT)
L12CantùLombardy (IT)L42OcaLombardy (IT)
L13CasalnovoLombardy (IT)L43OggionoLombardy (IT)
L14CasalzunigoLombardy (IT)L44ParadisoLombardy (IT)
L15Cascina Padregnano 1Lombardy (IT)L45Ponte di PortoloTrentino Alto Adige (IT)
L16Cascina Padregnano 2Lombardy (IT)L46PusianoLombardy (IT)
L17Cascina Padregnano 2bLombardy (IT)L47RaimondiLombardy (IT)
L18Cascina V.Lombardy (IT)L48RivieraLombardy (IT)
L19Centa 1Trentino Alto Adige (IT)L49S. AntoninoLombardy (IT)
L20Cocquo Lombardy (IT)L50Santa LuciaTrentino Alto Adige (IT)
L21DoianoTrentino Alto Adige (IT)L51SoravanaTrentino Alto Adige (IT)
L22ElloLombardy (IT)L52Ticino di M.Lombardy (IT)
L23Erba 1Lombardy (IT)L53TransacquaTrentino Alto Adige (IT)
L24Erba 2Lombardy (IT)L54TrecateLombardy (IT)
L25FaiTrentino Alto Adige (IT)L55Trucazzano 1Lombardy (IT)
L26Gola SeccaLombardy (IT)L56Trucazzano 2Lombardy (IT)
L27Gola Secca 2Lombardy (IT)L57Val di NonTrentino Alto Adige (IT)
L28GorgonzolaLombardy (IT)L58VervoTrentino Alto Adige (IT)
L29IspraLombardy (IT)L59VigevanoLombardy (IT)
L30LaturLombardy (IT)L60VogheraLombardy (IT)
Table 2. List of the SSR primers used, with repeated motif, allele size in base pairs (bp) and annealing temperatures.
PrimerFor 5′→3′Rev 5′→3′Repeat Size (bp)T (°C)
HlGA31CY5-CAAACTTGGTGCTCTAAGATGAACGTTTTCCCAACACCTAGTTC(GA)1716355
HlGT14CY5-GGCATGGCTAACTCTATATGCAAATAGAAGTGCCATAACTGA(TA)3A2(TA)3CATGC(GT)1216554
HlGT16CY5-CCGTGATACAAATCTACCCAAACTCCAGTCAGCAATCTCTTCAA(AC)21(AT)822854
HlGT17CY5-GGTCCTTAGTCACTTGCCAATGACTGTTCGAAGCACAATCAA(GT)1518254
HlACA3CY5-CAAGTTGTTGGTTGATTTCACATCTCCTTCCTGTGTTCACCAC(CAA)1521552
HlAGA6CY5-GTTAGAATCTCGTTGGCAATCTGAAACTTCACTAATCATC(GAA)15N3(GAA)219255
HlAGA7CY5-ACAAGCAGTAATGATGAGGATCCAAGTCTCTCAATTAGGAA(CAT)3N3(CTT)9N3(CTT)318054
HlGA23CY5-AAGCACGAAAACTGACTTGGTTGCCCAAAATCACTGTT(CT)2424554
Table 3. Allele size (bp), allele frequency (f), number of alleles (N), Observed (Ho) and Expected Heterozygosity (He) and Polymorphism Information Content (PIC) of the studies accessions.
LocusLocusLocusLocusLocusLocusLocusLocus
HlAGA7fHlGT16fHlGT17fHlACA3fHlAGA6fHlGA23fHlGA31fHlGT14f
a1600.0252110.1081750.1672040.0081700.1672390.0081600.3421610.075
b1660.1332130.0581770.1332060.0501720.0252440.2581620.0331650.283
c1710.0082270.0671790.0922100.5171740.0422470.051640.3501670.608
d1780.0252290.3251810.0422200.1331760.0252510.0081660.2171690.017
e1810.0582310.0331830.0172220.0671820.2172550.0671680.0171750.017
f1830.0172330.2831850.3082240.0171840.0082570.0331880.042
g1850.0502350.0331870.1582280.0661860.1252650.008
h1870.5582370.0751890.0332300.0421880.2172670.033
j1900.1082390.0171910.0082320.0171910.1332690.008
k1990.017 1930.0172350.0421930.0082710.008
l 1950.0252380.0421990.0252730.008
m 2050.0082790.025
n 2810.017
o 2830.050
p 2850.017
q 2870.067
r 2890.058
s 2930.025
t 2970.017
u 2990.058
v 3010.008
w 3030.067
x 3050.025
y 3070.008
z 3090.008
aa 3110.008
ab 3130.017
ac 3150.008
ad 3170.008
ae 3190.008
af 3230.008
N10 9 11 11 12 31 6 5
He0.661 0.793 0.829 0.705 0.850 0.910 0.717 0.550
Ho0.617 0.700 0.783 0.717 0.683 0.767 0.533 0.550
PIC0.634 0.759 0.8 0.68 0.824 0.897 0.658 0.482
Table 4. Average content of hop resins and essential oils in dry cones of wild hop accessions. In red, Trentino Alto Adige accessions are indicated.
IDα-Acids % (DM)β-Acids % (DM)COH% in Tot α-AcidsOil Yield %
L31.777 ± 0.032 f–k1.323 ± 0.001 f–i19.032 ± 0.493 d–h0.329 ± 0.030 d–i
L42.216 ± 0.273 d–j1.659 ± 0.139 d–i20.806 ± 0.371 d–h0.395 ± 0.142 b–i
L52.262 ± 0.332 d–j1.445 ± 0.215 f–i24.215 ± 0.102 b–e0.351 ± 0.001 d–i
L74.105 ± 0.082 a1.735 ± 0.048 d–i25.864 ± 0.451 a–d0.630 ± 0.051 a,b,c
L81.197 ± 0.006 h–l2.022 ± 0.035 c–i18.421 ± 0.267 e–h0.514 ± 0.093 a–f
L92.193 ± 0.058 d–j1.627 ± 0.022 d–i19.911 ± 0.048 d–h0.364 ± 0.032 c–i
L121.695 ± 0.097 f–k2.798 ± 0.295 c–i16.730 ± 0.923 g,h,i0.253 ± 0.004 f–i
L140.000 ± 0.000 l2.514 ± 0.352 c–i0.000 ± 0.000 k0.294 ± 0.141 e–i
L151.982 ± 0.489 e–k1.873 ± 0.470 d–i28.391 ± 0.319 a,b,c0.434 ± 0.053 a–i
L162.853 ± 0.109 a–g1.743 ± 0.073 d–i29.163 ± 0.221 a,b0.425 ± 0.035 b–i
L203.377 ± 0.614 a–e3.890 ± 0.576 b,c16.634 ± 0.492 g–j0.347 ± 0.004 d–i
L214.125 ± 0.969 a3.283 ± 0.573 b–f18.778 ± 0.482 e–h0.454 ± 0.061 a–i
L252.361 ± 0.008 d–j2.656 ± 0.060 c–i22.424 ± 1.157 b–g0.472 ± 0.052 a–h
L263.848 ± 0.194 a,b,c2.202 ± 0.095 c–i23.853 ± 0.104 b,f0.344 ± 0.076 d–i
L272.437 ± 0.016 c–i1.543 ± 0.172 e–i22.582 ± 0.477 b–g0.436 ± 0.067 a–i
L291.945 ± 0.153 e–k1.974 ± 0.790 c–i14.432 ± 0.896 h,i,j0.452 ± 0.002 a–i
L300.596 ± 0.059 k,l1.217 ± 0.073 h,i16.506 ± 0.597 g–j0.223 ± 0.104 g,h,i
L333.449 ± 0.071 a–d1.846 ± 0.003 d–i22.061 ± 0.249 c–g0.530 ± 0.033 a–e
L341.571 ± 0.779 g–k3.088 ± 0.794 b–h24.559 ± 8.922 b–e0.286 ± 0.020 e–i
L363.049 ± 0.470 a–f4.774 ± 0.597 a,b19.819 ± 1.517 d–h0.660 ± 0.120 a,b
L371.091 ± 0.083 i–l1.426 ± 0.121 f–i32.046 ± 1.665 a0.507 ± 0.079 a–f
L381.463 ± 0.756 j,k,l2.633 ± 1.781 c–i15.988 ± 0.175 g–j0.211 ± 0.032 h,i
L393.229 ± 0.031 a–e3.520 ± 0.021 b,c,d15.097 ± 1.174 h,i,j0.420 ± 0.003 b–i
L412.949 ± 0.040 a–g3.265 ± 0.039 b–g17.078 ± 0.035 f–i0.202 ± 0.002 i
L421.105 ± 0.074 i–l3.228 ± 0.349 b–g10.802 ± 0.163 i,j0.345 ± 0.066 d–i
L431.303 ± 0.216 h–l3.473 ± 0.455 b–e16.106 ± 0.013 g–j0.267 ± 0.065 e–i
L451.687 ± 0.345 f–k2.030 ± 0.519 c–i9.785 ± 0.215 j0.345 ± 0.059 d–i
L502.836 ± 0.096 a–g2.258 ± 0.078 c–i20.337 ± 1.059 d–h0.455 ± 0.078 a–i
L512.184 ± 0.501 d–j2.658 ± 0.563 c–i18.425 ± 0.875 e–h0.567 ± 0.034 a–d
L522.636 ± 0.309 b–h2.184 ± 0.178 c–i16.137 ± 0.225 g–j0.490 ± 0.007 a–g
L534.043 ± 0.285 a,b6.462 ± 0.355 a16.841 ± 0.220 g,h,i0.700 ± 0.106 a
L542.369 ± 0.088 d–j1.064 ± 0.009 i20.468 ± 0.264 d–h0.290 ± 0.002 e–i
L571.071 ± 0.011 i–l3.198 ± 0.084 b–g14.883 ± 0.337 h,i,j0.634 ± 0.056 a,b,c
L582.134 ± 0.467 d–j3.261 ± 0.641 b–g15.805 ± 0.753 g–j0.508 ± 0.054 a–f
Different letters indicate statistical difference, at p < 0.05 with Tukey’s test. DM: Dry Matter.
Publisher’s Note: MDPI stays neutral with regard to jurisdictional claims in published maps and institutional affiliations.

