Article

Spectroscopic and Microscopic Characterization of Flashed Glasses from Stained Glass Windows

by
Teresa Palomar
1,*,
Marina Martínez-Weinbaum
2,
Mario Aparicio
1,
Laura Maestro-Guijarro
2,
Marta Castillejo
2 and
Mohamed Oujja
2,*
1
Instituto de Cerámica y Vidrio (ICV), CSIC, 28049 Madrid, Spain
2
Instituto de Quimica Fisica Rocasolano (IQFR), CSIC, 28006 Madrid, Spain
*
Authors to whom correspondence should be addressed.
Submission received: 19 May 2022 / Revised: 31 May 2022 / Accepted: 1 June 2022 / Published: 6 June 2022
(This article belongs to the Special Issue Interdisciplinary Researches for Cultural Heritage Conservation)

Abstract

:
Flashed glasses are composed of a base glass and a thin colored layer and have been used since medieval times in stained glass windows. Their study can be challenging because of their complex composition and multilayer structure. In the present work, a set of optical and spectroscopic techniques have been used for the characterization of a representative set of flashed glasses commonly used in the manufacture of stained glass windows. The structural and chemical composition of the pieces were investigated by optical microscopy, field emission scanning electron microscopy-energy dispersive X-ray spectrometry (FESEM-EDS), UV-Vis-IR spectroscopy, laser-induced breakdown spectroscopy (LIBS), and laser-induced fluorescence (LIF). Optical microscopy and FESEM-EDS allowed the determination of the thicknesses of the colored layers, while LIBS, EDS, UV-Vis-IR, and LIF spectroscopies served for elemental, molecular, and chromophores characterization of the base glasses and colored layers. Results obtained using the micro-invasive LIBS technique were compared with those retrieved by the cross-sectional technique FESEM-EDS, which requires sample taking, and showed significant consistency and agreement. In addition, LIBS results revealed the presence of additional elements in the composition of flashed glasses that could not be detected by FESEM-EDS. The combination of UV-Vis-IR and LIF results allowed precise chemical identification of chromophores responsible for the flashed glass coloration.

1. Introduction

Flashed glasses are constituted by two layers of different thicknesses; a thick one of clear or light glass, and a thin colored layer applied on top of the first one. The production of flashed glasses usually involves dipping a colorless base glass into a colored bath, producing a multi-layered glass pane in which the thickness of the colored layers controls the color tone [1]. By sandblasting or etching the flashed (thinner, brighter) layer, a striking two-tone effect can be achieved [2].
Flashed glasses have been used since medieval times in stained glass windows, especially for obtaining those of ruby-red color. The procedure to obtain this type of flashed glass is very complex as it involves the nucleation of copper nanoparticles of a suitable size in the glass matrix. If the nanoparticles are too small, light could pass through the material without interaction, while if they are too large, the glass would appear dark brown or black [3,4]. Additionally, the thickness of the colored glass layer also affects the color hue, being more intense when the glass is thicker [1]. This complexity, added to the expensive raw materials, has favored the development of these two-layer glasses, with the suitable color and the appropriate thickness to be installed in stained glass windows.
Although red-flashed glass is the most common [5,6,7,8,9,10], other colors have also been used in historical stained glass windows, including pink-purple [7,11,12], green [1,7], or blue [7]. Nowadays, flashed glasses are elaborated in almost all chromatic palettes and are commonly used for the creation and restoration of historical stained glass windows.
The characterization of glasses from stained glass windows has quickly improved in the last years. Laboratory-based techniques, such as field emission scanning electron microscopy/energy-dispersive X-ray spectroscopy (FESEM-EDS) and X-ray fluorescence spectrometry (XRF), are usually destructive, as sampling is usually necessary [13,14,15,16]. On the other hand, portable XRF instruments are becoming more and more available for in situ measurements. This technique allows one to distinguish different glass types within the same panel, identifying chromophores, enamels, grisailles, and other decoration layers; however, it is also sensible for unpolished and weathered glass surfaces because the analysis can only be undertaken very near to the glass surface due to low penetration. Therefore, the real bulk glass composition cannot be properly determined. Additionally, low Z elements, such as magnesium and sodium, elements normally used for glass type differentiation, are not detected by XRF. Another analytical technique frequently used for the study of stained glass windows is UV-Vis-IR spectroscopy, which working in transmission or absorption modes allows us to identify the glass chromophores [5,17,18]. UV-Vis-IR spectroscopy is a point analysis technique, and recent developments in in situ visible hyperspectral imaging offer alternatives for the overall analysis of whole glass windows in a few hours using sunlight as the illumination source [19].
Nowadays, valuable glass objects benefit from the availability of non-invasive or micro-invasive techniques, which allow distinguishing different glass types within the same glass panel and identifying chromophores, enamels, grisailles, and other decoration layers [20,21,22,23]. Laser spectroscopic techniques, such as laser-induced breakdown spectroscopy (LIBS) and laser-induced fluorescence (LIF), have been combined in several studies to provide complementary elemental and molecular composition in a non- or micro-invasive way [24,25,26,27,28,29,30,31,32]. LIBS is a micro-invasive technique based on the spectral analysis of the luminous plume generated by the pulsed laser ablation of a small amount of material from the surface of the sample and has the capacity for quantitative determination. LIBS has been shown to be an effective technique for the characterization of glasses from a wide variety of perspectives [30,33,34,35,36,37,38,39]. Previous works, using LIBS, have focused on finding the optimal parameters for the analysis of model soda-lime silicate [33] and historical lead silicate glasses [34], on the characterization of chromophores and opacifiers of ancient glasses, and on characterizing degradation pathologies [35,37,39,40]. From a complementary perspective, LIF spectroscopy provides valuable molecular information and facilitates the detection of trace elements and/or chromophores responsible for the glass coloration in a totally non-invasive way [30,41,42,43,44].
In this work, we present a multianalytical approach based on optical microscopy (OM) and FESEM-EDS for thickness determination of a multi-layered set of modern flashed glasses commonly used in stained glass windows. Besides, FESEM-EDS, LIBS, UV-Vis-IR spectroscopy, and LIF techniques served for their chemical characterization. FESEM-EDS and LIBS allowed the identification of most chemical elements present in both the base glasses and in their corresponding-colored layers, while UV-Vis-IR and LIF spectroscopies served for glass chromophore characterization.

2. Materials and Methods

The study was conducted in a set of 11 flashed glasses, provided by LambertsGlas®, consisting of a colorless base glass covered by layers of different colors and thicknesses (Figure 1).
The samples were compositionally and structurally characterized by OM, FESEM-EDS, UV-Vis-IR spectroscopy, LIBS, and LIF.
OM observations were carried out with a reflected light microscope Nikon SMZ1000 coupled to an Axiocam 105 color controlled with the software Zen2012 (blue edition) from Carl Zeiss Microscopy GmbH, 2011. Cross-section examinations and chemical linear analyses were performed by a field emission scanning electron microscope HITACHI S-4700. For elemental chemical linear analysis by EDS, a NORAN system six was connected to the FESEM.
Transmission spectra of original glasses were recorded with a Perkin Elmer Lambda 950 UV-Vis-IR spectrophotometer. The illumination was provided by a tungsten-halogen and deuterium light source in a double optical path covering the 200–2500 nm range with a resolution of 10 nm.
LIBS analyses were performed upon laser excitation at 266 nm (4th harmonic of a Q-switched Nd:YAG laser, 15 ns pulses, 1 Hz repetition rate) and a 0.2 m spectrograph (Andor, Shamrock Kymera-193i-A) equipped with a grating of 1200 grooves/mm, blazed at 500 nm. The output of the spectrograph was coupled to an intensified charge-coupled device (ICCD) camera from Andor Technology, Belfast, Ireland (iStar CCD 334, 1024 × 1024 active pixels, 13 µm × 13 µm pixel size). The laser beam was steered to the surface of the samples at an angle of 45° by using different mirrors. A cut-off filter of 300 nm was placed at the entrance of the spectrograph to reduce the scattered laser light and avoid second-order diffraction. The shot-to-shot fluctuation of laser pulse energy was less than 10%. The laser beam was focused on the surface of the sample with a 10 cm focal length lens achieving a fluence of 8.3 J cm−2 (2.6 mJ per pulse in a 200 µm laser spot diameter). The spectra were recorded at 50 nm intervals in the 230–300 nm wavelength range and step and glue spectrograph mode in the range of 300–600 nm with 0.2 nm resolution and with a gate delay and width of 200 ns and 3 μs, respectively, with respect to the arrival of the laser pulse to the sample surface. The spectra resulted from summing up the emissions of the ablation products after ten successive laser pulses, a number that provided good signal-to-noise ratios.
For the LIF measurements, we used the same laser source as for LIBS analysis and a 0.30 m spectrograph (TMc300 Bentham) blazed at 500 nm with a 300 grooves/mm grating coupled to an ICCD, 2151 Andor Technology device, Belfast, Ireland. In this case, the time gate was operated with a zero-time delay with respect to the arrival of the laser pulse to the sample surface and with a width of 3 μs. The sample was illuminated at an incidence angle of 45° through a pinhole, to select the central part of the unfocused laser beam, giving rise to a spot on the sample of elliptical shape with axes dimensions between 1 and 2 mm and with fluences of around 6 × 10⁻³ J/cm2. LIF spectra were recorded at 300 nm intervals in the wavelength range of 300–700 nm with 5 nm resolution. A cut-off filter at 300 nm was also used for the LIBS measurements. Each spectrum resulted from the accumulation of 10 individual ones.

3. Results and Discussion

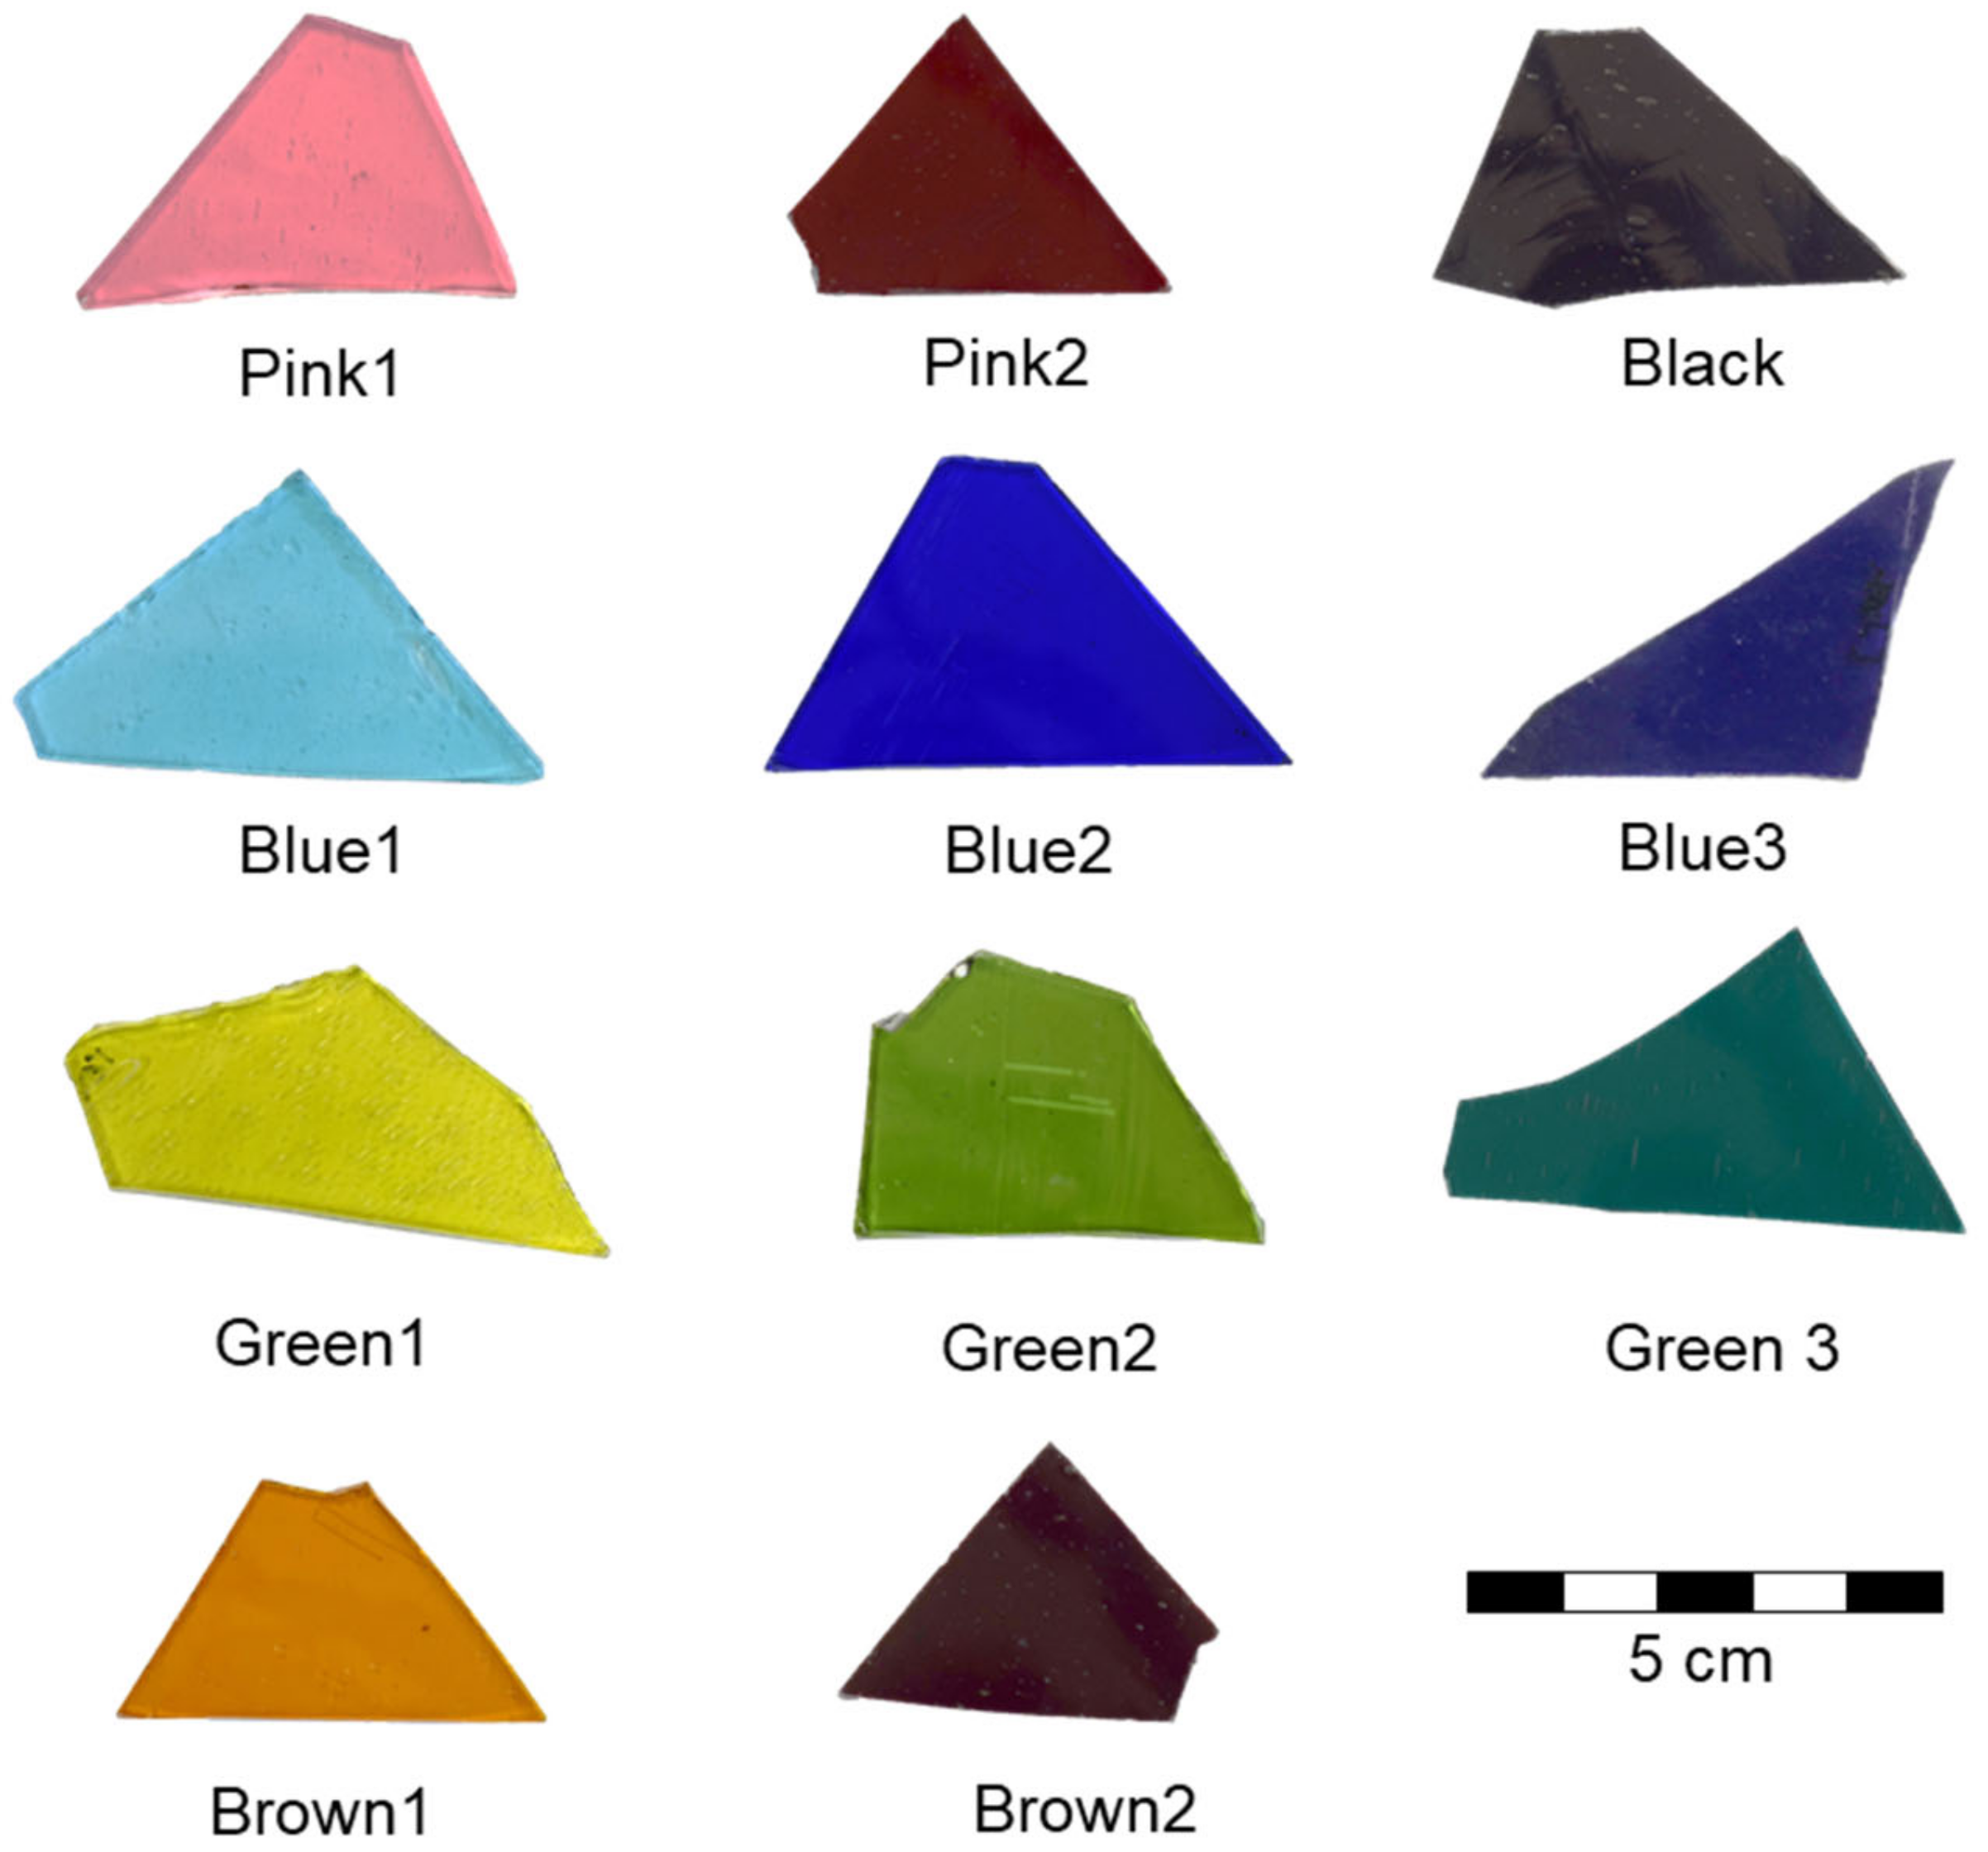
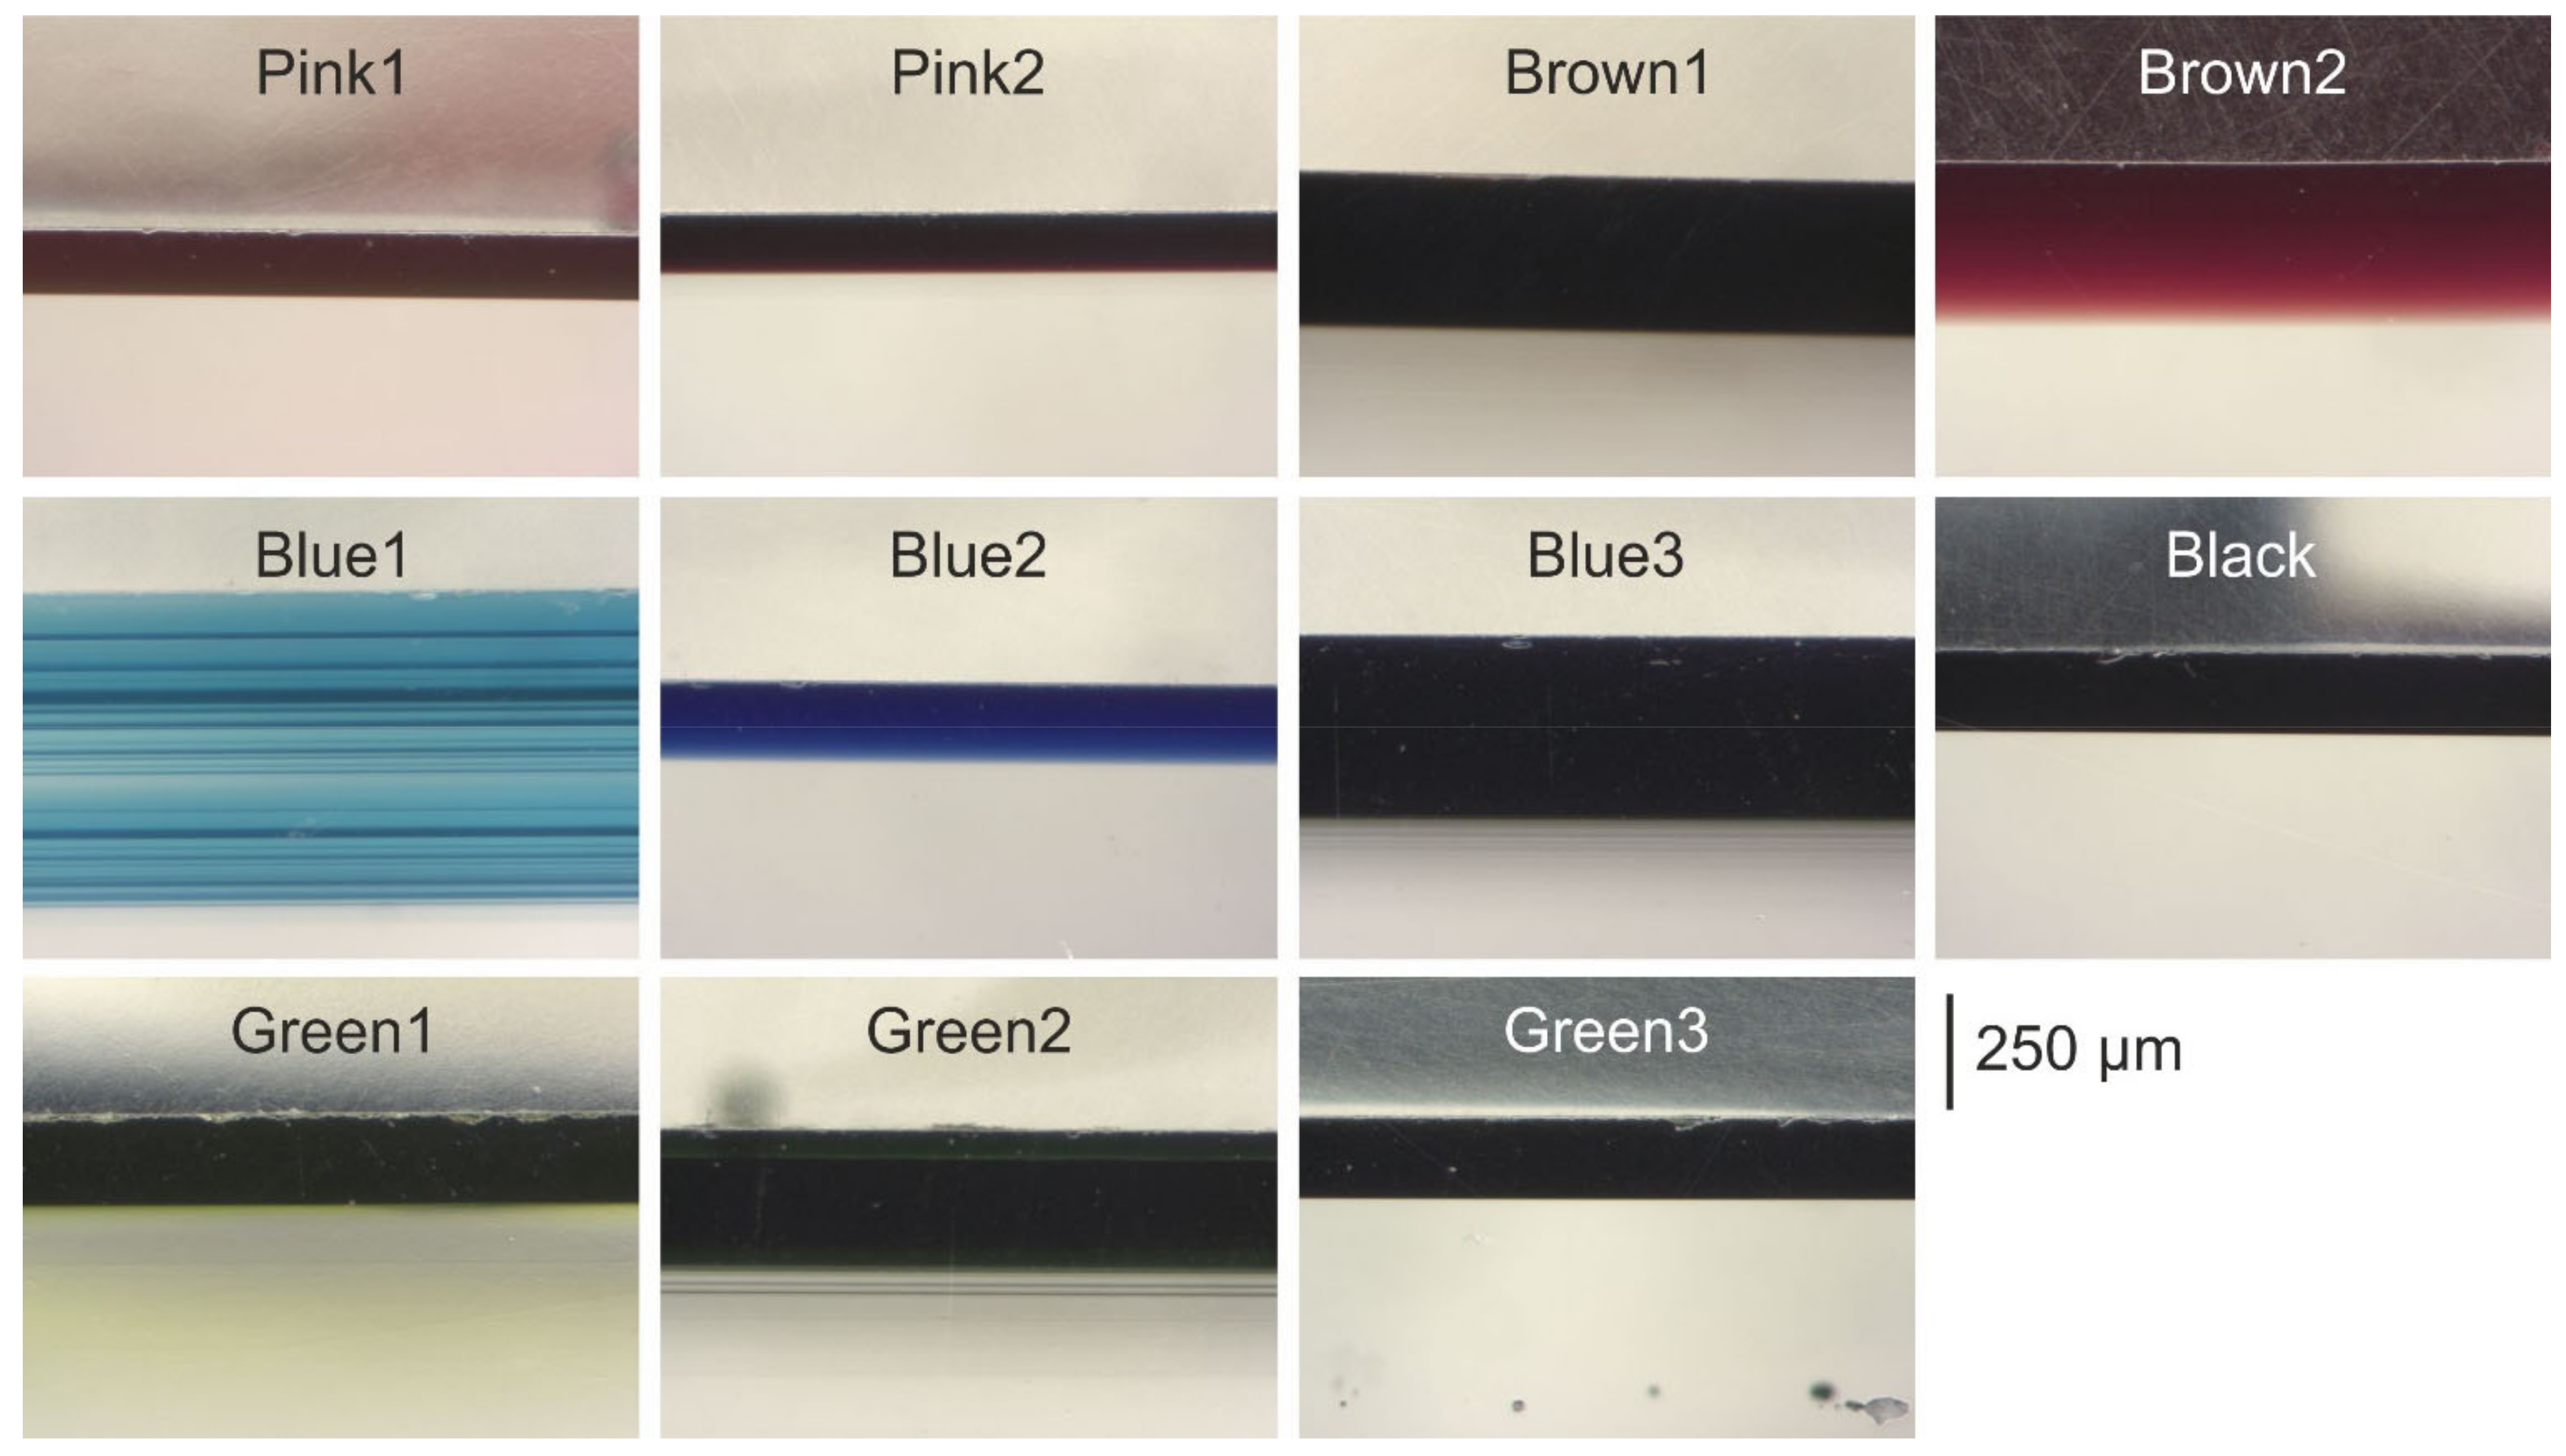
3.1. Thickness Measurements

The different colored layers on the base glasses from the considered flashed glass samples were measured by OM and FESEM-EDS.
Analysis of the flashed glasses by OM (Figure 2 and Table 1) showed a structure of parallel layers with a large range of thicknesses for the colored layers. Following the Lambert–Beer law, the thicker the colored layer, the higher the intensity of the color. Nevertheless, some of the pieces with thin layers showed dark colorations due to a high concentration of chromophores.
The pinkish and brownish glasses showed similar thicknesses; however, the bluish and greenish ones displayed completely different thicknesses. It is also interesting to note that the Blue1 and Green2 samples present a multilayer structure that could be related to their fabrication processes. The Brown2 and Blue3 glasses showed a non-homogeneous coloration in cross-section that can be related to the diffusion of the colored layer into the base colorless glass or that the fragment was not completely perpendicular in cross-section, inducing an optical effect of color fading.
The same set of glass pieces was inspected by FESEM-EDS and two different behaviors were detected. Some of the pieces (Pink1, Brown1, Black, Green1, and Green3) showed a clear surface layer that corresponds to the colored one, but the other samples behave differently (Figure 3). The differences in the hue shown in the micrographs are related to the dissimilar chemical composition (Section 3.2.) and not to the contribution of chromophores in the layer, as these could not be detected by FESEM-EDS due to their low concentrations.
In the samples with a clear layer, FESEM-EDS thickness measurements were comparable to those quantified by OM (Table 1); however, when this layer was not observable, the thickness was estimated through FESEM-EDS linear analyses by determining the profile of the chemical concentration of different elements (Figure 3). In the Pink2, Brown2, Blue2, and Blue3 samples, it was observed that the surface layer has a higher concentration of potassium or cobalt than the base glass; however, the thickness of the surface layer on the Green2 sample was estimated using calcium element, which presents a lower concentration in the colored layer in comparison with the base glass (Figure 3). The thickness was estimated as a range between the following two values: the depth at which the composition of the colored layer loses its homogeneity and the depth when the homogeneous material of the base glass appears. In this range, the chemical composition varies as a result of the ion exchange produced between the two glasses during manufacturing. This measurement method is not as accurate as that provided by OM, although the values obtained by the two methods are in good agreement (Table 1). Green2 was the only sample in which the thickness measurements did not match because OM revealed the presence of some colored lines in the bottom of the colored layer that was too thin to be detected by EDS linear analysis.

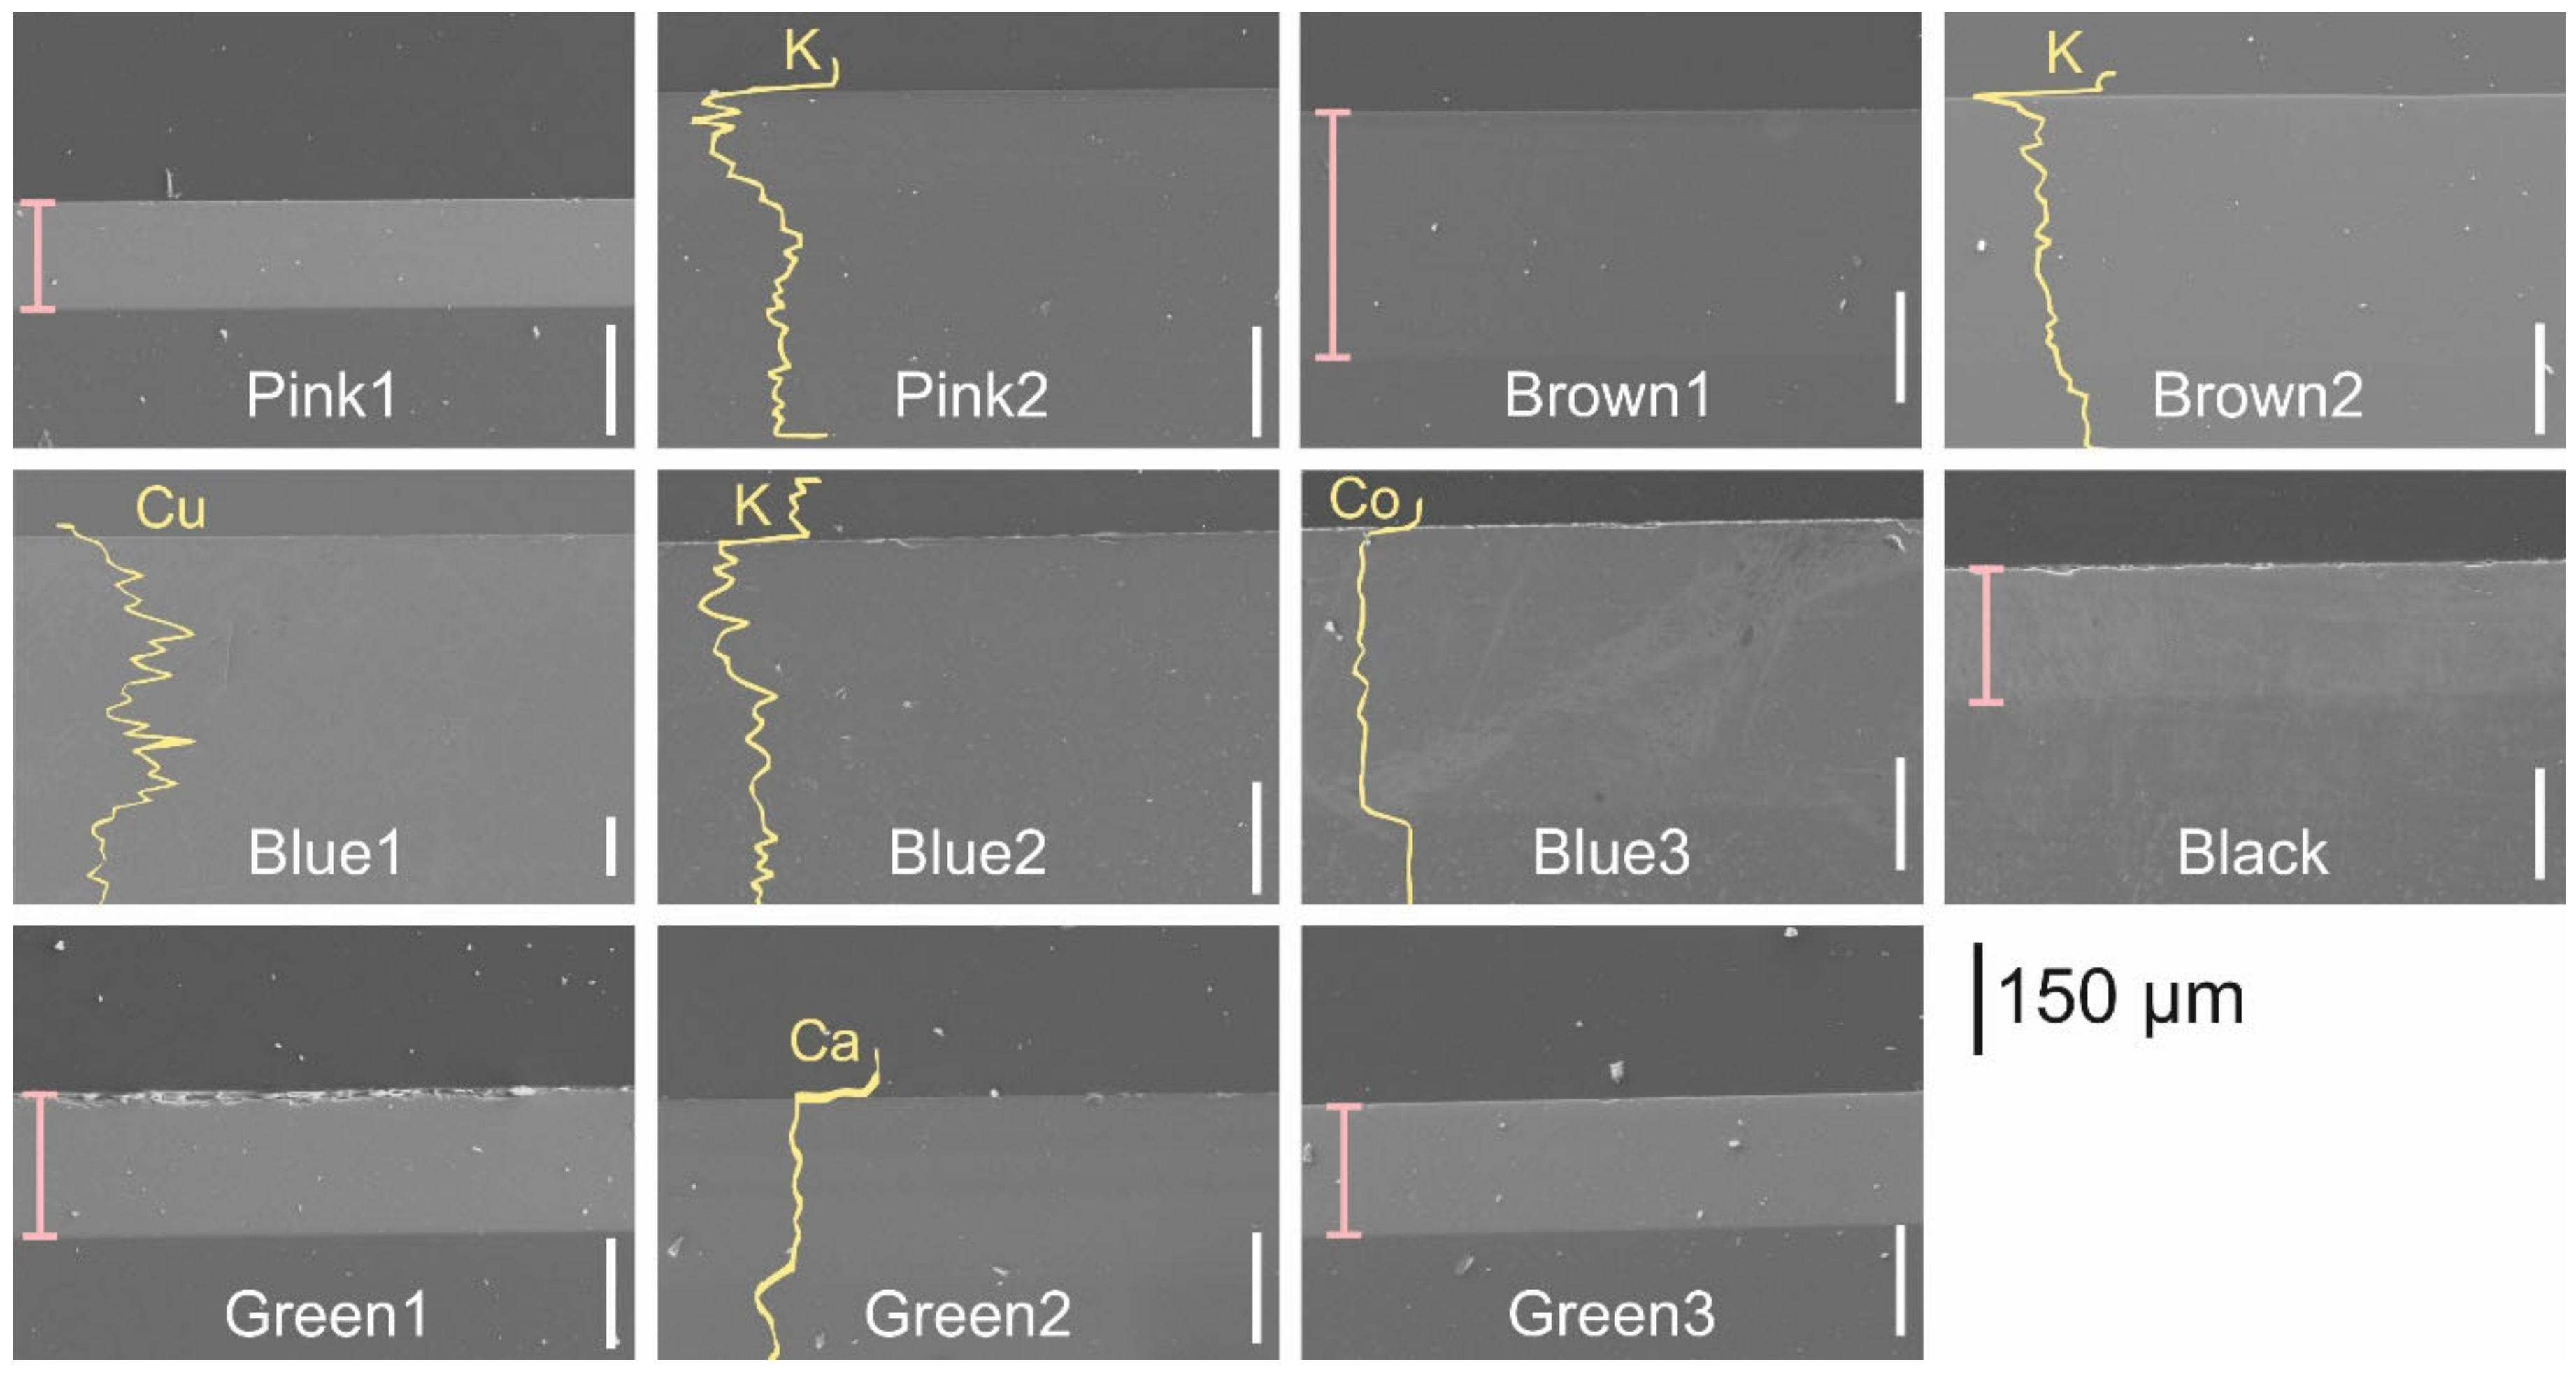
3.2. Chemical Characterization

The chemical composition of the flashed glasses was determined using FESEM-EDS, UV-Vis-IR spectroscopy, LIBS, and LIF.

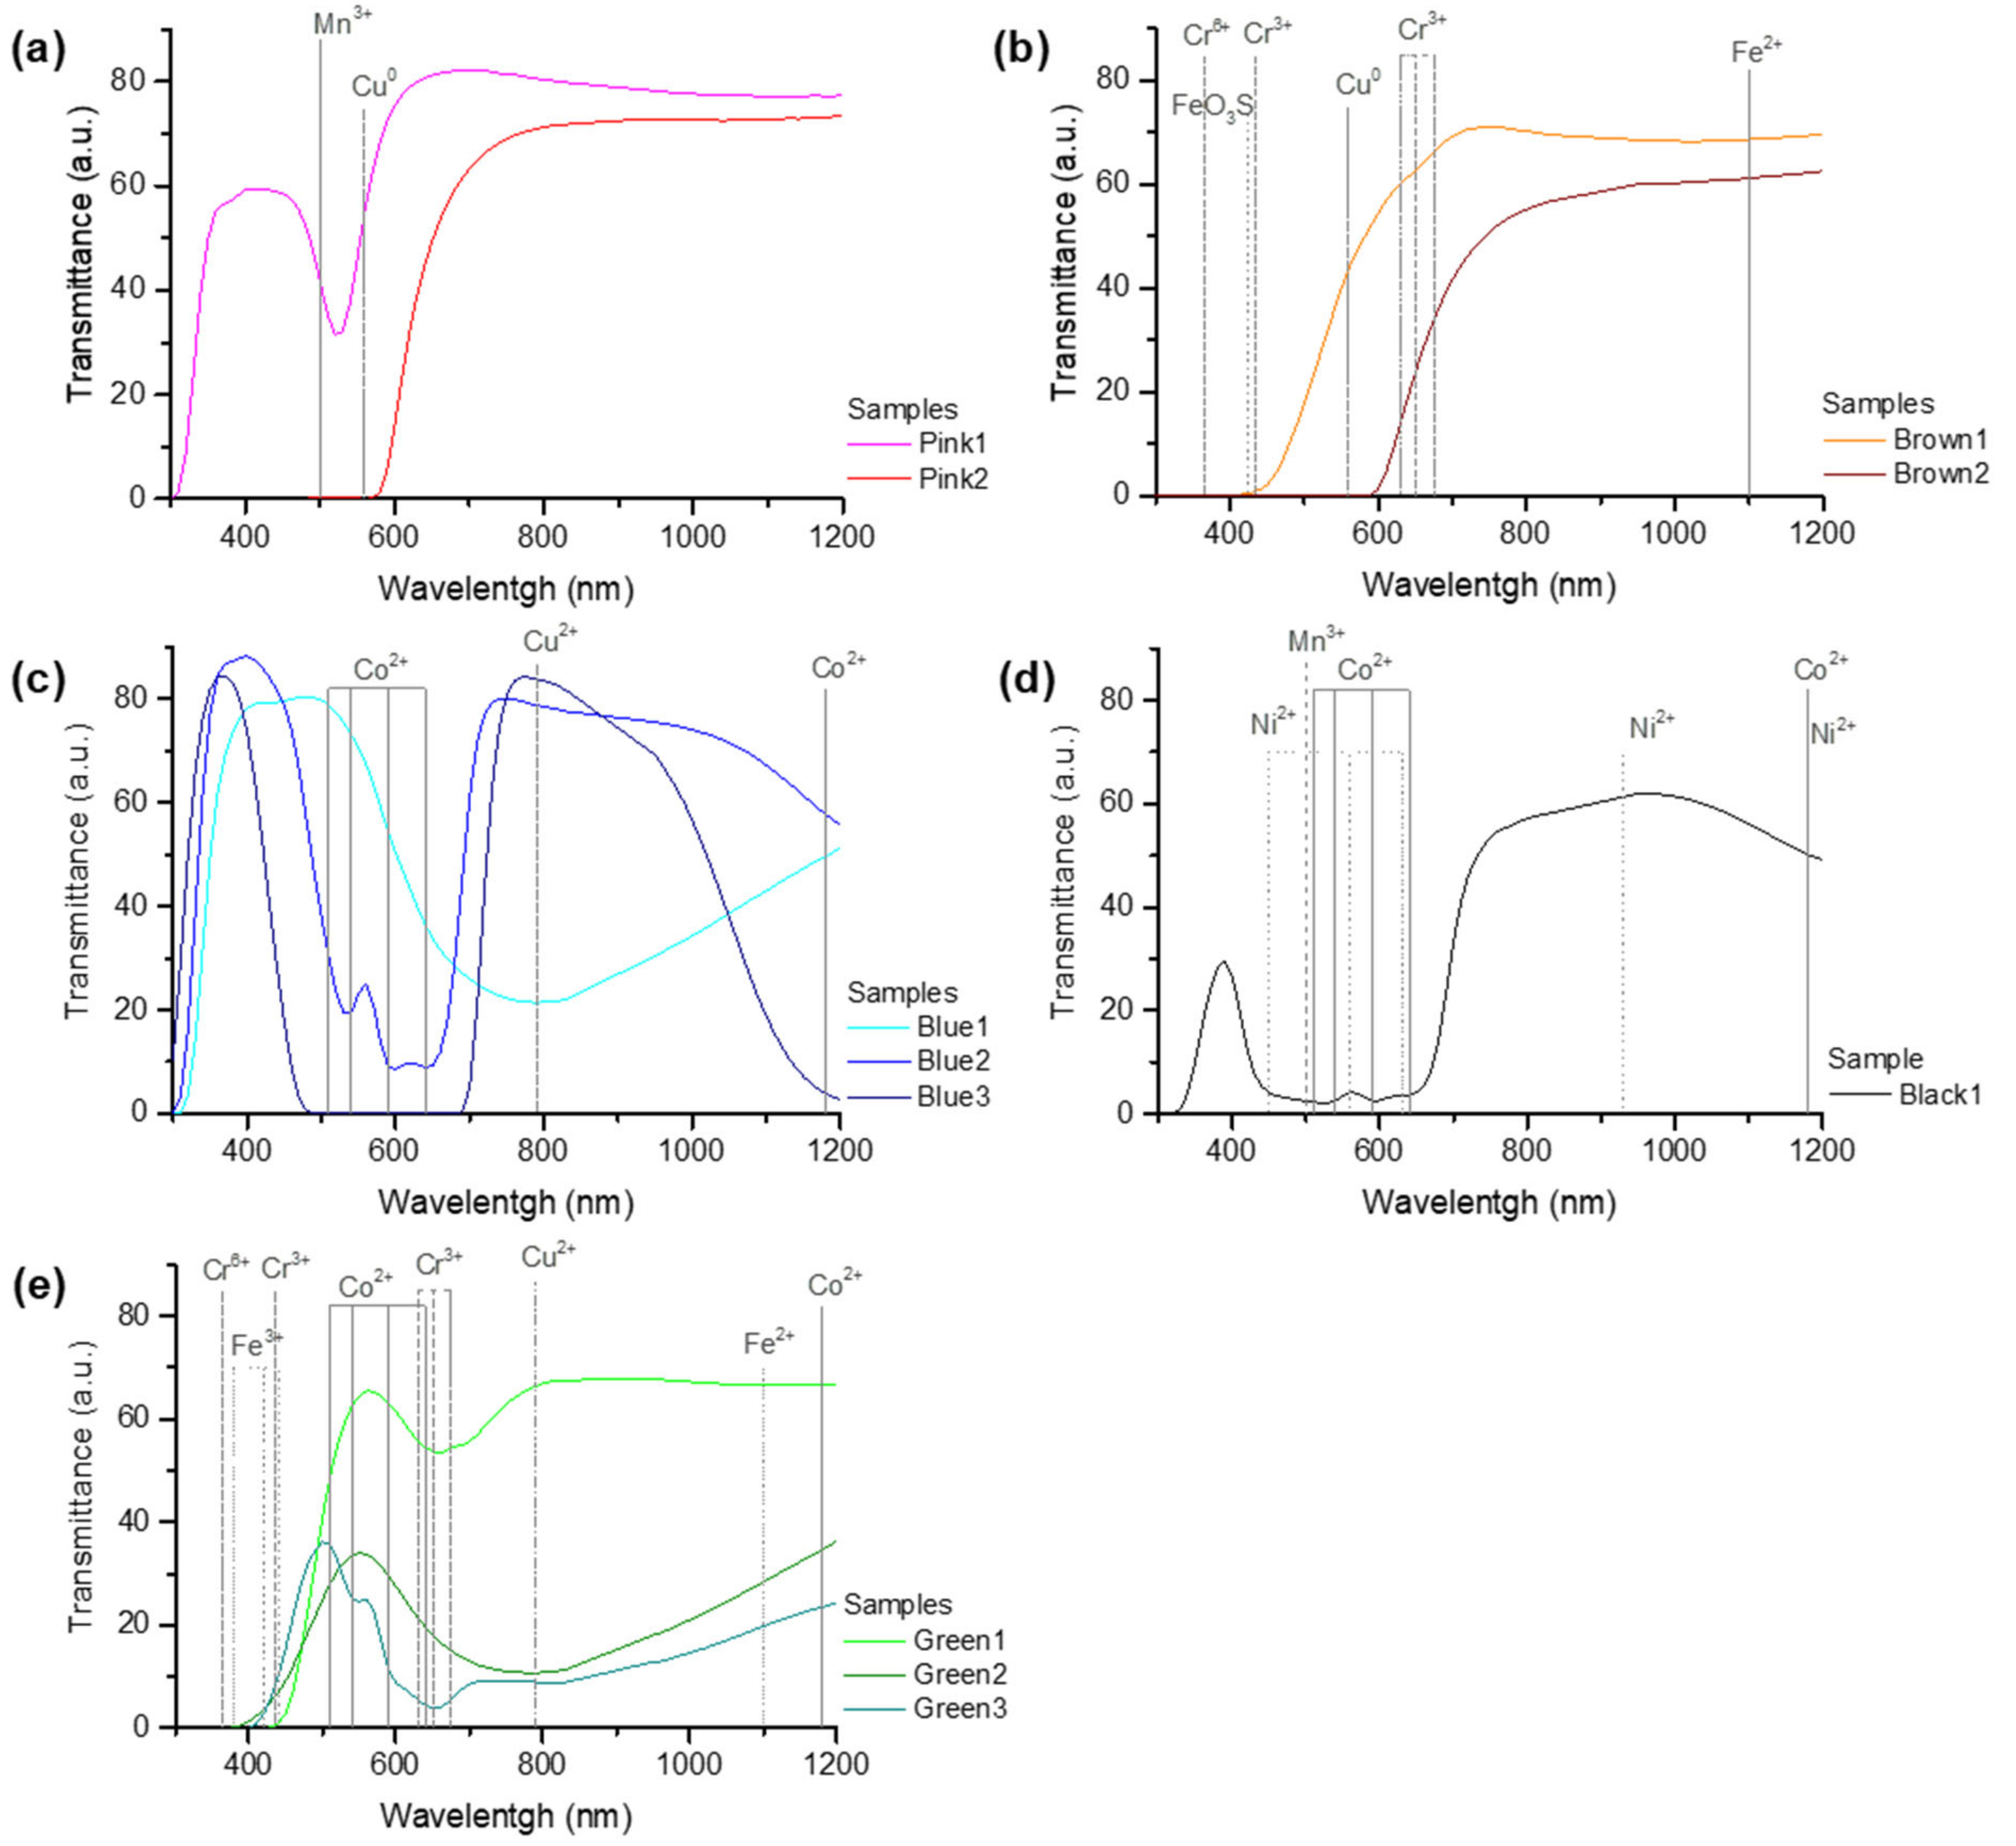
3.2.1. Field Emission Scanning Electron Microscopy/Energy-Dispersive X-ray Spectroscopy and UV-Vis-IR Spectroscopy

The FESEM-EDS analysis of the cross-sections revealed that all the base glasses are soda-lime silicate glasses with similar chemical compositions (Table 2). The content of silica varied between 63 and 72 wt.%, sodium oxide between 14 and 20 wt.%, and calcium between 9 and 14 wt.%. The base glass of the Green2 sample was slightly different, with an extra amount of around 9 wt.% of BaO. This oxide is sometimes used in substitution of PbO as it increases the refraction index of the glass and, therefore, its shine, and additionally avoids unwanted devitrification [45].
Regarding the colored layers, three samples (Pink1, Green1, and Green3) display a high content of lead. This element is commonly used to reduce the melting point of the surface layer, favoring its adherence to the base glass. These three samples, together with the Black one, are those in which the colored layer showed a clear hue under FESEM observation (Figure 3), an effect attributed to the high content of heavy elements such as lead.
About the colorant agents, most of the surface layers showed a relatively high concentration of chromophores. Pink1 is the only sample in which the chromophores were not detected by FESEM-EDS; however, in the UV-Vis-IR spectrum (Figure 4a), the band of Mn3+ was detected with a slight shift to higher wavelengths as a result of the high concentration of lead in the colored layer [19]. A low concentration of manganese may color the surface layer with a pink hue, although its concentration could not be high enough to be detected by FESEM-EDS.
In the colored layer of the Pink2 piece, CuO was detected by FESEM-EDS. However, no clear band of copper was observed in the UV-Vis-IR spectrum, except for a shift of the absorption front to ~560 nm (Figure 4a), a behavior that is related to the plasmon resonance of copper nanoparticles [19]. The chemical composition of the Brown2 sample is similar to that of Pink2 (Table 2), but the color was more intense due to the presence of larger copper nanoparticles and/or a thicker colored layer.
In the Brown1 sample, which displays a yellowish hue, high contents of Cr2O3 and Fe2O3 (Table 2) were detected. Some of the bands of Cr3+ at 630, 650, and 675 nm appeared in the visible spectrum; whereas, the bands at 435 nm (Cr3+) and 365 nm (Cr6+) are overlapped with the shift of the absorption front to ~430 nm (Figure 4b). This shift, shorter than in the Brown2 spectrum, can be attributed to an iron-amber glass [45]. In this case, the chromophore is formed by mixed tetrahedral coordination, in which one Fe3+ ion is surrounded by three oxygen ions (bonded to silicon) and one sulfide anion (bonded to alkali ions for preserving electro-neutrality) (FeO3S). To obtain this color, reductive conditions are necessary during glass fabrication. For this reason, the band at 1100 nm is assigned to Fe2+ (Figure 4b). The color observed in the surface layer is produced by the overlap of the bands of the different chromophores.
Regarding the blue samples, Blue1 has a relatively high content of CuO (~2 wt.%), which is also observed in the visible spectrum by virtue of the broad band of Cu2+ (Figure 4c). On the contrary, in Blue2 and Blue3, cobalt instead of copper was detected in the EDS analyses. The bands of Co2+ are clearly observed in the visible spectrum, being saturated in the darker glass (Figure 4c). Blue3 also contains ~1 wt.% of ZnO. The presence of this oxide decreases the dilatation coefficient of glasses, favoring their resistance to thermal shock that can be generated in bluish glasses in direct contact with the colorless ones due to their highest NIR absorption [46].
In the Black glass, a high concentration of MnO, CoO, and NiO was detected in the FESEM-EDS analyses. Mn3+ and Co2+ ions in high concentration give intense purple and blue colorations, respectively, due to their high molar extinction coefficient. NiO was also detected by FESEM-EDS and by virtue of the bands of Ni2+ in the visible spectrum (Figure 4d). The color associated with this ion depends on its type of coordination and on the nature of the glass. In silicate glasses, Ni2+ in tetrahedral coordination produces a violet color, while in octahedral coordination gives a yellow hue. If both types of coordination are present, it is common to find grey glasses. The intense coloration of the three chromophores yields the black color to the colored layer.
Finally, in the green glasses, common greenish chromophores such as Cr2O3, Fe2O3, or CuO were detected. Green1 has a high content of PbO (~36 wt.%) together with 4.4 wt.% of TiO2 and 1.5 wt.% Cr2O3. PbO favors the decrease in the melting temperature of the colored layer, but it also gives a yellowish hue due to the shift of the absorption front into the visible range. The triplet band of chromium is clearly observed in the visible spectrum, which is not the case with the band of Ti3+ at 570 nm (Figure 4e). Nevertheless, this ion may produce an amber coloration when reacting with impurities of iron oxide, giving rise to the formation of ilmenite (FeTiO3) [45]. The Green3 sample spectrum also showed the overlap of bands from chromium and copper, as well as a shift of the absorption front produced by lead. Finally, the visible spectrum of Green2, with ~6 wt.% of Fe2O3 and CuO, predominantly showed the band of Cu2+ at 790 nm (Figure 4e). This glass also has ~11 wt.% BaO, a compound that helps to stabilize the glass and increase its shine [45].

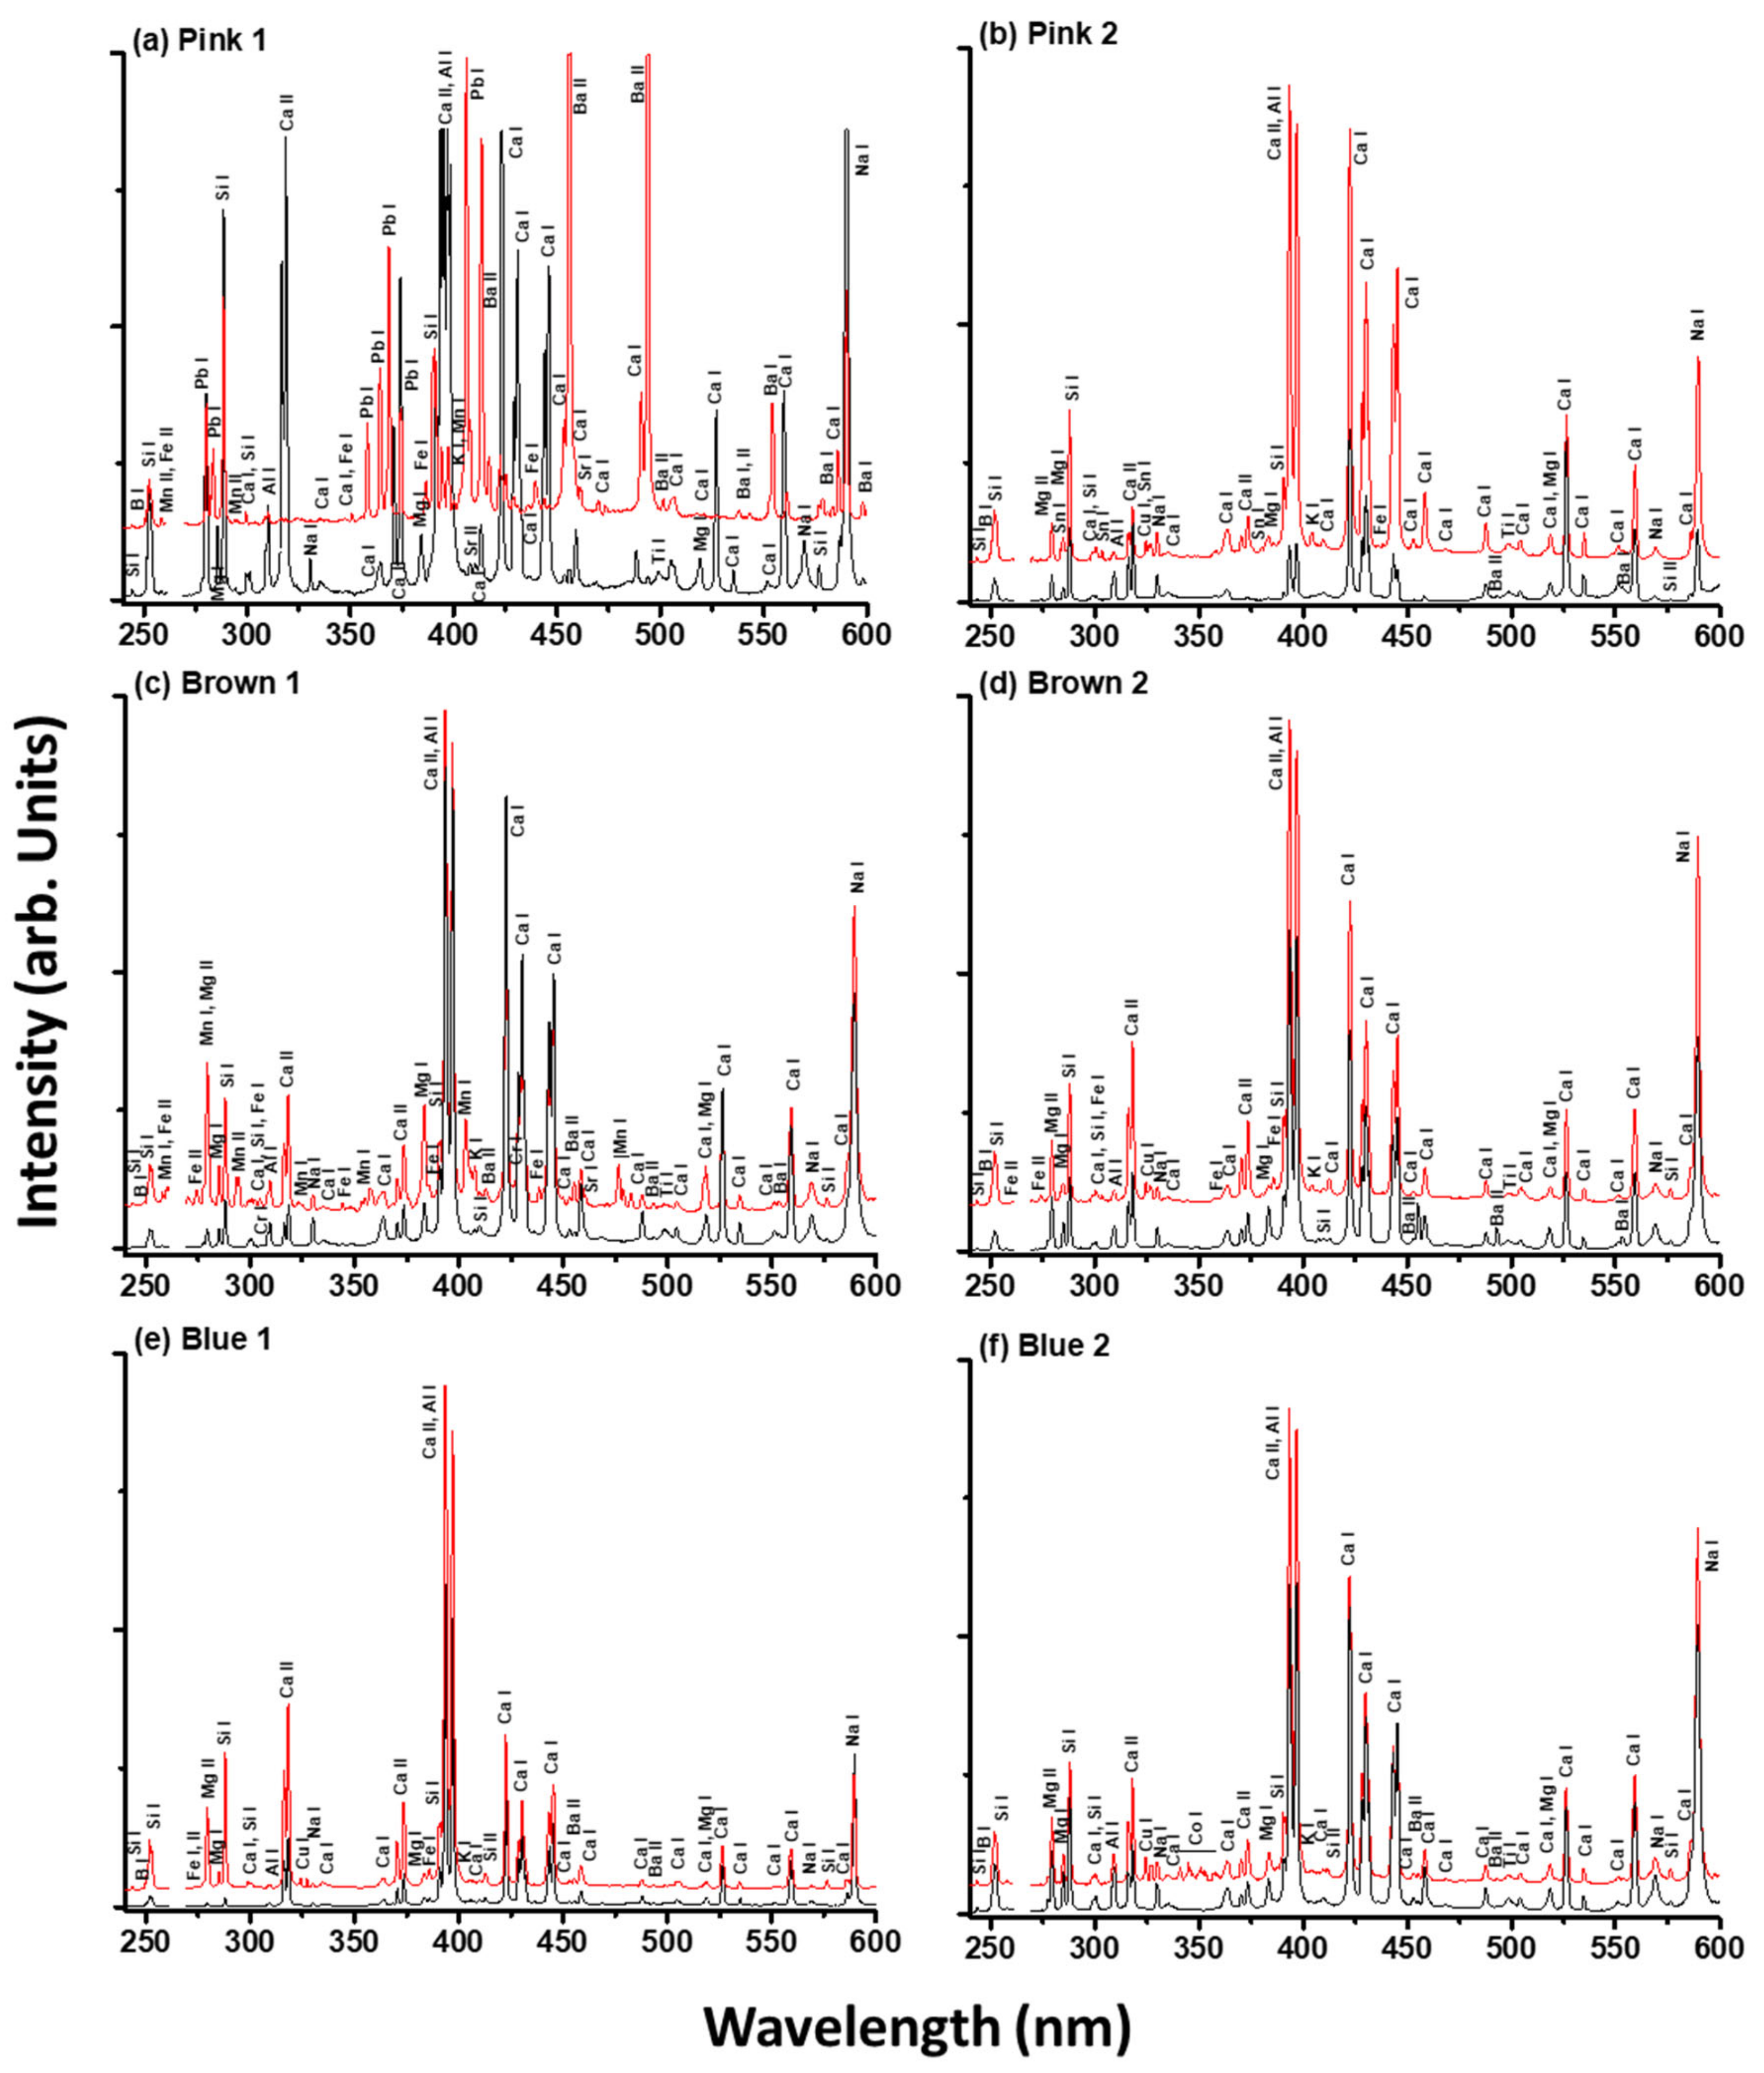
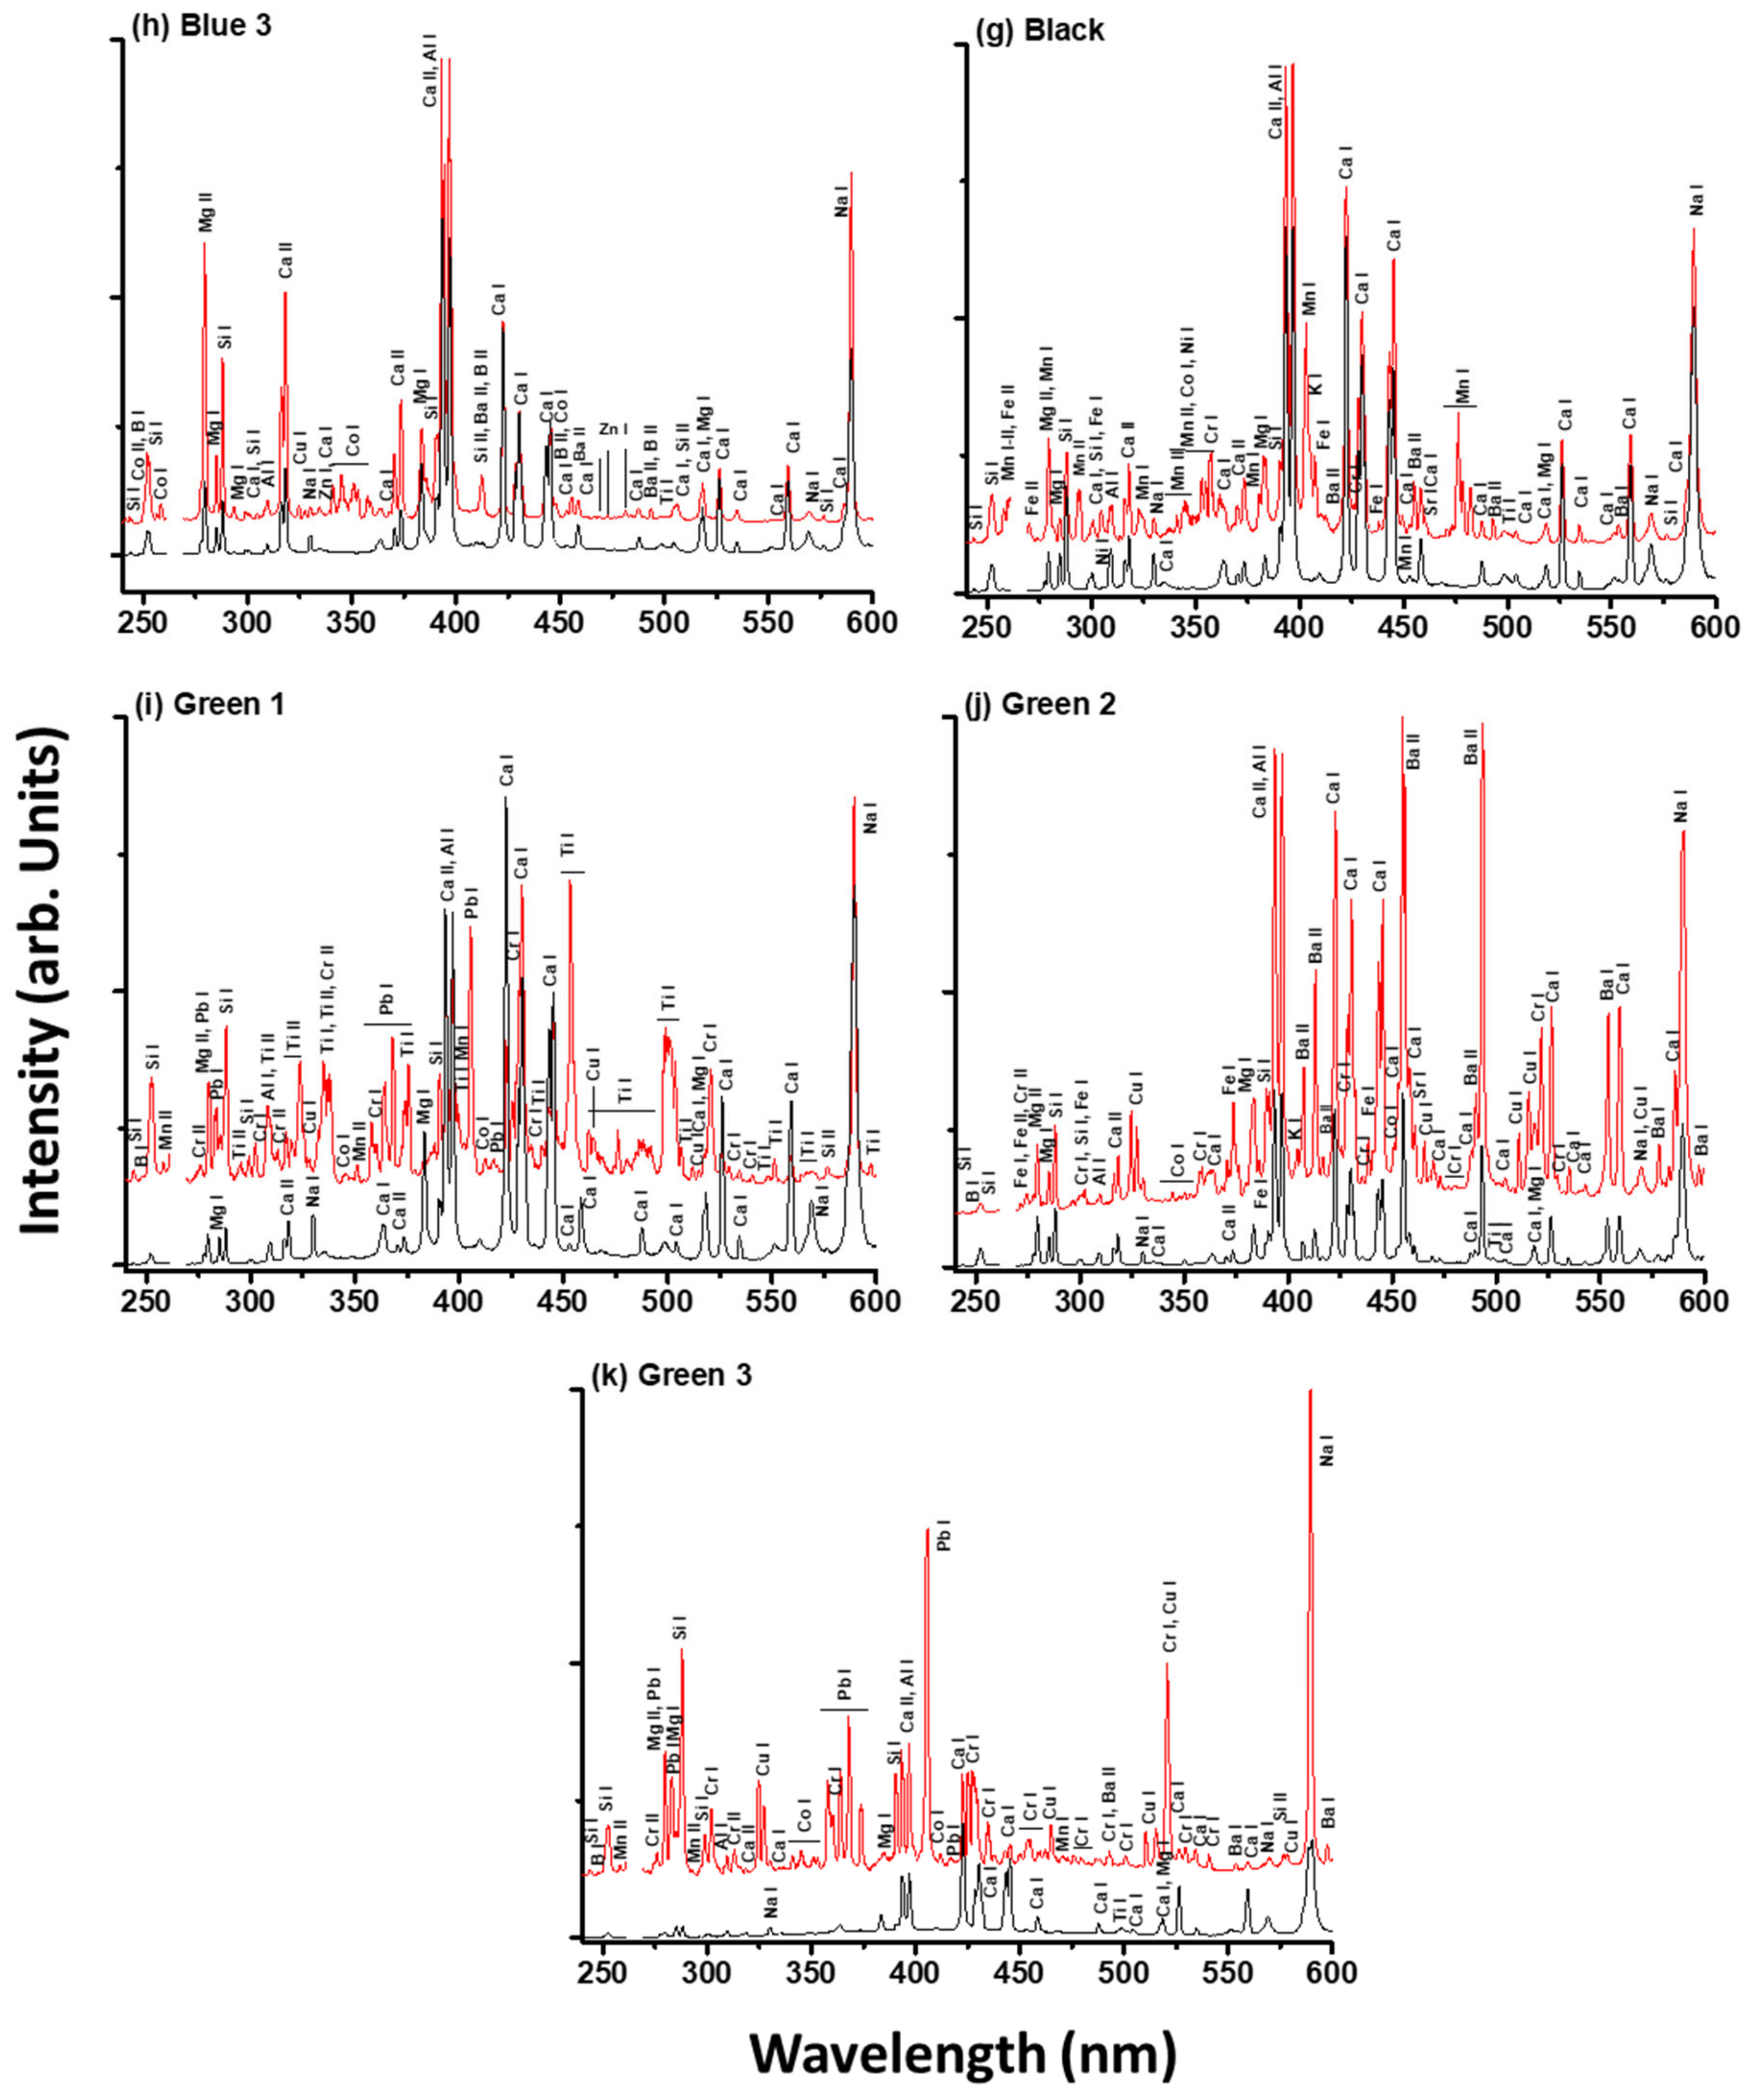
3.2.2. Laser-Induced Breakdown Spectroscopy

The LIB spectra from flashed glasses, displayed in Figure 5 were recorded on colorless base glass (lower black spectra) and on their corresponding colored layers (upper red spectra). The assignment of the spectral lines was based on the NIST database [47]. Table 3 summarizes the main elemental components of the base glasses and of the corresponding-colored layers of the considered samples, determined by the assignment of the spectral emission lines.
The spectra reveal the elemental composition of the glasses by virtue of the emission lines of the main and minor components. These are silicon, calcium, aluminum, potassium, sodium, magnesium, barium, strontium, titanium, and iron. The elements Si, Ca, Al, K, and Na correspond to the main glass components. Other components (Mg, Ba, Sr, Fe, and Ti) can be attributed to impurities from the raw materials employed in the manufacturing processes and to stabilizing agents. Sr, Fe, Ti, with Al, which could not be detected by FESEM-EDS due to their low concentrations below the detection limit of the technique, were observed by LIBS. Besides, the Brown2 and Green2 glasses showed a high content of barium in comparison to the rest of the glasses, in good agreement with FESEM-EDS results. The high content of Na observed in all base glasses indicates that these are mostly based on soda-lime silicate glass. This corroborates the EDS results (Table 2).
The LIB spectra acquired on the different colored layers are richer in line emissions than those corresponding to the colorless base glass (upper red and lower black lines, respectively, in Figure 5) due to additional elements responsible for their coloration. Besides, in most of the spectra of coloration layers, boron lines are present, testifying to the intentional use of this element alone or in combination with lead to lower its melting temperature to obtain better adhesion. Figure 5a shows the LIB spectrum of the colored layer of the Pink1 sample, revealing the presence of Si, B, Mn, Fe, Pb, Al, Ca, K, Ba, Sr, Ti, and Na emissions. The high intensity of Na lines indicates that the material is a soda-lime silicate glass. Additionally, the high-intensity Pb lines (an element also detected by FESEM-EDS) with B lines are obtain lower melting temperatures and to avoid thermal bending or other deformations of the base glass substrate during the production of the flashed glass. The presence of Fe lines, and the minor contribution of Mn lines, indicate the presence of the chromophores [45] responsible for the slight pink coloration of these colored layers. The rest of the components (Si, Al, Ca, K, Ba, Sr, and Ti) are attributed to impurities, stabilizer agents, and elements used in the fabrication of the glass.
Figure 5b shows the LIB spectrum derived from the Pink2 sample revealing a qualitatively similar composition than that of the Pink1 sample, except for the additional presence of Cu chromophore, as determined also by FESEM-EDS. The contribution of Fe to the dark pink coloration of the Pink2 sample is revealed to be minor. Emission lines assigned to Si, Ca, Al, K, and Na correspond to the main glass components, while other emissions due to Ti, Mg, and Sn are attributed to stabilizing agents and impurities of the raw materials.
The LIB spectrum from the colored layer of the Brown1 sample (Figure 5c) displays emission lines of Fe, Mn, and Cr corresponding to the chromophores. Other lines in the spectrum are attributed to Si, B, Mg, Ca, Al, K, Ba, Sr, Ti, and Na. The composition of the colored layer from sample Brown2, displayed in Figure 5d, differs from that of sample Brown1, as in the latter, Cu is the main chromophore with little Fe contribution. Sr and Ba lines are not observed for the Brown2 sample.
The LIB spectra acquired on the colored layers of Blue1, Blue2, and Blue3 samples (Figure 5e,f,h) are qualitatively similar with the exception of the lines associated with their chromophores. Cu and Fe (with less contribution) are responsible for the coloration of sample Blue1, while Cu and Co are associated with the coloration of Blue2 and Blue3 samples. With respect to the minor components, the presence of potassium is observed in samples Blue1 and Blue2 and titanium in sample Blue3, in addition to Si, B, Mg, Ca, Al, Na, and Ba.
The LIB spectrum of the colored layer of the Black sample (Figure 5g) shows the presence of a higher number of elements related to chromophores when compared to the rest of the studied samples (Fe, Mn, Ni, Co, and Cr). The additional elements are Si, Mg, Ca, Al, Na, K, Ba, Sr, and Ti.
LIB spectra of Green1, Green2, and Green3 samples are shown in Figure 5i–k. The different shades of green color of these samples (from light green for Green1 to dark green for Green3) are due to quantitative differences in the main chromophores, Cr and Cu for Green1, Fe, Cr, and Cu for Green2, and Cr, Cu, and Co for Green3.
A comparison of the results of the elemental composition of the samples retrieved from FESEM-EDS and LIBS analyses (Table 2 and Table 3, respectively) reveals that LIBS is able to detect the presence of all elements identified by FESEM-EDS in addition to other elements that could not be observed by this technique, such as light and trace elements.

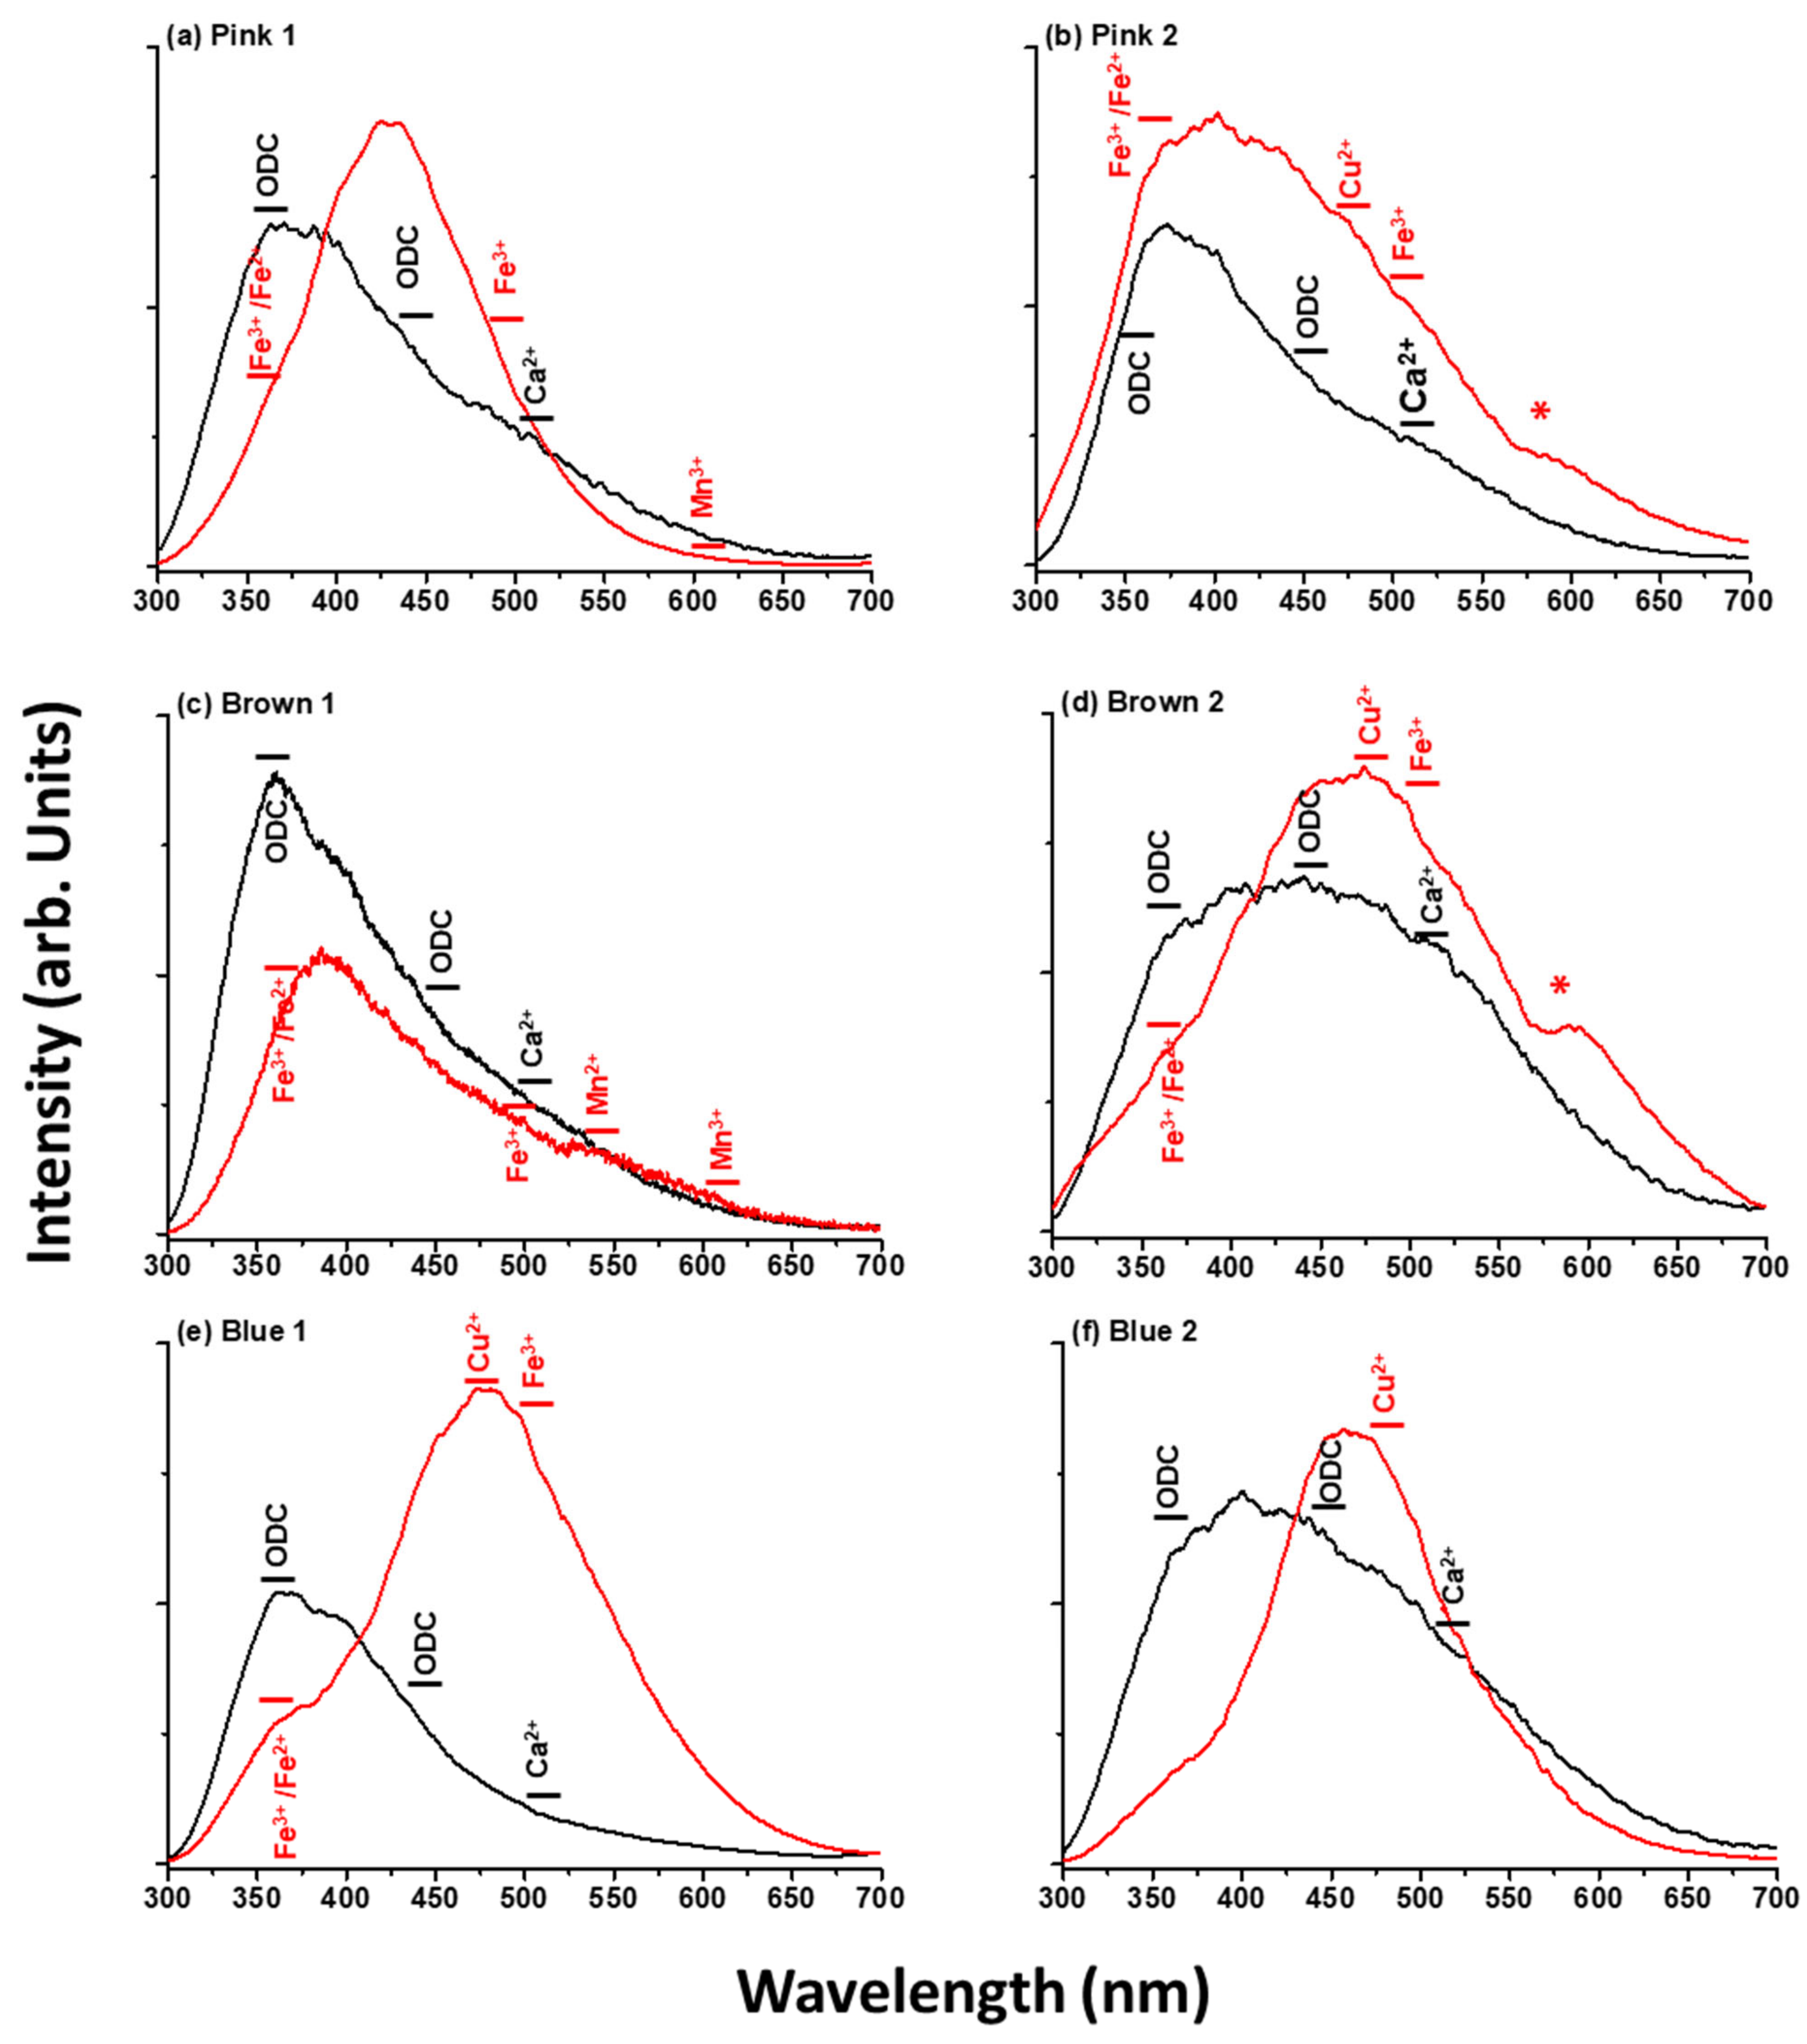
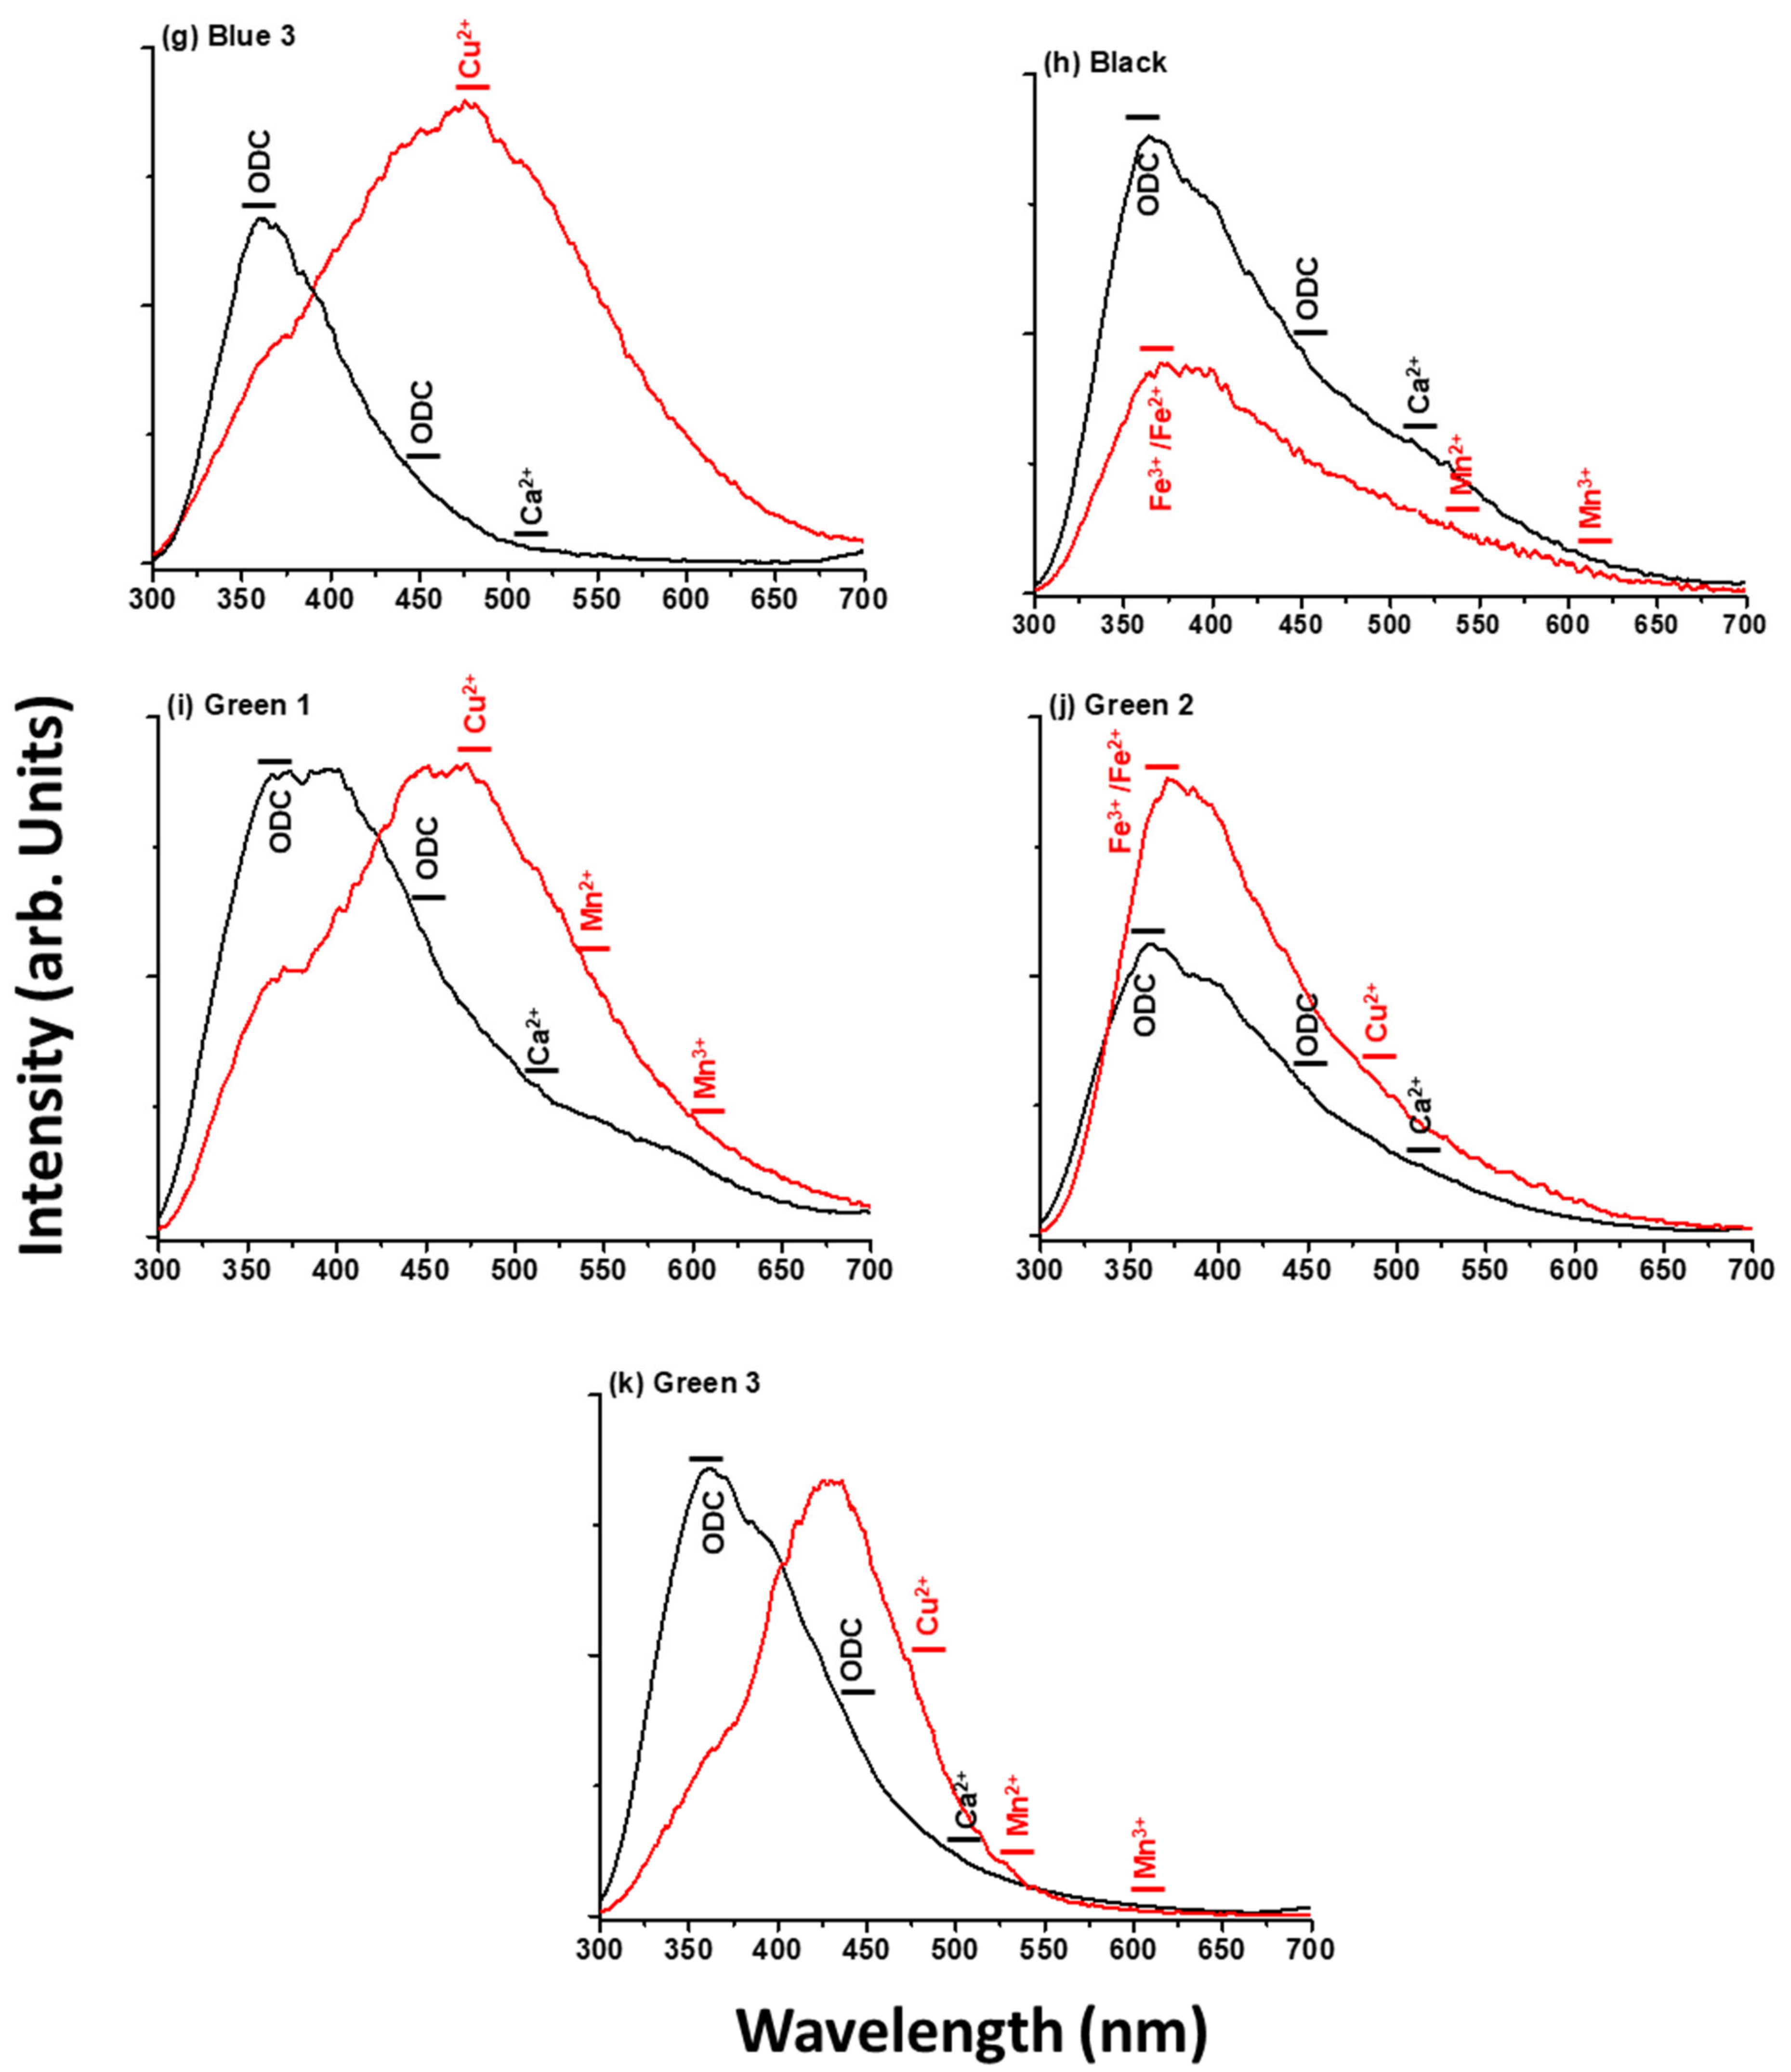
3.2.3. Laser-Induced Fluorescence

The LIF spectra collected on the flashed glasses of this study are displayed in Figure 6. All spectra consist of a broad feature in the 300–700 nm wavelength range, although each sample displays different characteristics that are associated with its chemical composition, including chromophores.
The LIF spectra corresponding to the base glass of the different samples (black lines in Figure 6) are rather similar and can be described as the sum of emissions from different glass components. The emission in the 300–500 nm range encompasses the contribution of oxygen deficiency centers (ODC) from the glass network [42,44,48]. Besides, an additional shoulder with different relative intensities in each sample is noticed around 520 nm and assigned to Ca2+ of the glass lattice [39,49].
The LIF spectra of colored layers (red lines in Figure 6) display some specific features in addition to those observed in the base glass. As already indicated and revealed by FESEM-EDS, UV-Vis-IR spectroscopy, and LIBS, chromophores based on Fe, Cu, Mn, Co, Ni, and Cr account for the different colorations. The contribution of these chromophores to fluorescence emissions of the colored layers is not much evident in the LIF spectra of the samples due to the expected reabsorption of the fluorescence from these compounds with absorption bands in the near-UV and visible spectral ranges. Despite this, the weak shoulders over-imposed on the main emission band and observed at 360, 475, 500, 540, and 610 nm have been tentatively attributed to the presence of Fe3+/Fe2+, Cu2+, Fe3+, Mn2+, and Mn3+, respectively [40,45]. On the other hand, the prominent bands observed around 580 nm, specifically for the dark-colored layers from the samples Pink2 and Brown2, may be assigned to emissions from copper nanoparticles [19].
The light coloration from samples Pink1 and Brown1 is due to the presence of Mn- and Fe-based chromophores, while the additional emissions attributed to copper nanoparticles account for the dark hue of Pink2 and Brown2 samples, in agreement with LIBS and FESEM-EDS results. Emissions attributed to different chromophores contribute to the black coloration in the Black sample, as also revealed by LIBS and FESEM-EDS. Regarding the green and blue samples, Cu, Fe, and Mn with different amounts and contributions are considered chromophores in these samples [19].
The combination of LIF and UV-Vis-IR spectroscopy techniques has been revealed to be very effective for the determination of the chromophores responsible for the coloration of glasses, although the latter has shown high sensitivity with respect to the former, revealing the presence of a very high number of chromophores.

4. Conclusions

Flashed glasses, constituted by two layers, one of a colorless glass with a thin colored layer applied on top, have been structurally and compositionally analyzed by optical microscopy, field emission scanning electron microscopy, and linear energy dispersive spectroscopy to determine the thicknesses of the colored layers. The elemental composition of the base glasses and their corresponding-colored layers was determined by laser-induced breakdown spectroscopy and field emission scanning electron microscopy-energy dispersive spectroscopy. Laser-induced fluorescence and UV-Vis-IR spectroscopy provided further information about the chemical nature of the base glasses and colored layers, signposting the presence of the main chromophores responsible for their colors. Laser-induced breakdown spectroscopy results allowed, in a micro-invasive way, the detection of light, major, minor, and trace elements, both in the base glasses and colored layers, with higher sensitivity for major and minor components as compared with the destructive cross-sectional technique of field emission scanning electron microscopy-energy dispersive spectroscopy, which in turn can yield valuable information on chronology, provenance, and manufacturing processes and adds extra value to studies in these type of glasses. Laser-induced breakdown spectroscopy has been revealed as a powerful technique to determine the elemental composition and to look for chemical differences or similarities in the composition of non-destructible samples with historical and heritage value. The speed of analysis achieved with this technique, added to the development and production of portable devices, facilitates the examination of a large number of samples in the field, at excavation sites, in museums, cathedrals, and other civil buildings. Finally, the combination of laser-induced fluorescence and UV-Vis-IR spectroscopy has been revealed to be very effective for the determining of the nature of chromophores responsible for glass coloration.

Author Contributions

Conceptualization, T.P. and M.O.; Methodology, M.O. and T.P.; Formal Analysis, T.P., M.M.-W., M.A., L.M.-G., M.C. and M.O.; Samples’ preparation, T.P.; Writing—Original Draft Preparation, T.P. and M.O.; Writing—Review and Editing, T.P., M.M.-W., M.A., L.M.-G., M.C. and M.O.; Project Administration, M.C.; Funding Acquisition, M.C. All authors have read and agreed to the published version of the manuscript.

Funding

This research has been funded by the Spanish State Research Agency (AEI) through project PID2019-104124RB-I00/AEI/10.13039/501100011033, the Fundación General CSIC (ComFuturo Programme), by project TOP Heritage-CM (S2018/NMT-4372) from Community of Madrid, and by the H2020 European project IPERION HS (Integrated Platform for the European Research Infrastructure ON Heritage Science, GA 871034).

Institutional Review Board Statement

Not applicable.

Informed Consent Statement

Not applicable.

Data Availability Statement

This study did not report any supplementary data.

Acknowledgments

All authors acknowledge support from CSIC Interdisciplinary Platform “Open Heritage: Research and Society” (PTI-PAIS) and Fernando Cortés for supplying the glass samples.

Conflicts of Interest

The authors declare no conflict of interest.

References

  1. Ceglia, A.; Meulebroeck, W.; Wouters, H.; Baert, K.; Nys, K.; Terryn, H.; Thienpont, H. Using Optical Spectroscopy to Characterize the Material of a 16th c. Stained Glass Window; Thienpont, H., Meulebroeck, W., Nys, K., Vanclooster, D., Eds.; Routledge: Kent, UK, 2012; p. 84220A. [Google Scholar]
  2. Rich, C.; Mitchell, M.; Ward, R. Stained Glass Basics: Techniques, Tools & Projects; Sterling Publishing Company, Inc.: New York, NY, USA, 1997. [Google Scholar]
  3. Weyl, W.A. Coloured Glasses; Society of Glass Technology: Sheffield, UK, 1951; ISBN 9780900682797. [Google Scholar]
  4. Drünert, F.; Blanz, M.; Pollok, K.; Pan, Z.; Wondraczek, L.; Möncke, D. Copper-Based Opaque Red Glasses—Understanding the Colouring Mechanism of Copper Nanoparticles in Archaeological Glass Samples. Opt. Mater. 2018, 76, 375–381. [Google Scholar] [CrossRef]
  5. Meulebroeck, W.; Wouters, H.; Nys, K.; Thienpont, H. Authenticity Screening of Stained Glass Windows Using Optical Spectroscopy. Sci. Rep. 2016, 6, 37726. [Google Scholar] [CrossRef] [PubMed] [Green Version]
  6. Adlington, L.W.; Freestone, I.C. Using Handheld PXRF to Study Medieval Stained Glass: A Methodology Using Trace Elements. MRS Adv. 2017, 2, 1785–1800. [Google Scholar] [CrossRef]
  7. Marchesi, V.; Negri, E.; Messiga, B.; Riccardi, M.P. Medieval Stained Glass Windows from Pavia Carthusian Monastery (Northern Italy). Geol. Soc. Lond. Spec. Publ. 2006, 257, 217–227. [Google Scholar] [CrossRef]
  8. Alonso Abad, M.P.; Capel, F.; Valle Fuentes, F.J.; de Pablos Pérez, Á.; Ortega-Feliú, I.; Gómez-Tubio, B.M.; Respaldiza Galisteo, M.Á. Caracterización de Un Vidrio Rojo Medieval Procedente de Las Vidrieras Del Monasterio de Las Huelgas de Burgos. Bol. Soc. Esp. Ceram. Vidr. 2009, 48, 179–186. [Google Scholar]
  9. Farges, F.; Etcheverry, M.P.; Scheidegger, A.; Grolimund, D. Speciation and Weathering of Copper in “Copper Red Ruby” Medieval Flashed Glasses from the Tours Cathedral (XIII Century). Appl. Geochem. 2006, 21, 1715–1731. [Google Scholar] [CrossRef]
  10. Kunicki-Goldfinger, J.J.; Freestone, I.C.; McDonald, I.; Hobot, J.A.; Gilderdale-Scott, H.; Ayers, T. Technology, Production and Chronology of Red Window Glass in the Medieval Period—Rediscovery of a Lost Technology. J. Archaeol. Sci. 2014, 41, 89–105. [Google Scholar] [CrossRef]
  11. Palomar, T. Chemical Composition and Alteration Processes of Glasses from the Cathedral of León (Spain). Bol. Soc. Esp. Ceram. Vidr. 2018, 57, 101–111. [Google Scholar] [CrossRef]
  12. Machado, A.; Wolf, S.; Alves, L.C.; Katona-Serneels, I.; Serneels, V.; Trümpler, S.; Vilarigues, M. Swiss Stained-Glass Panels: An Analytical Study. Microsc. Microanal. 2017, 23, 878–890. [Google Scholar] [CrossRef] [Green Version]
  13. Atrei, A.; Scala, A.; Giamello, M.; Uva, M.; Pulselli, R.M.; Marchettini, N. Chemical Composition and Micro Morphology of Golden Laminae in the Wall Painting “La Maestà” by Simone Martini: A Study by Optical Microscopy, XRD, FESEM-EDS and ToF-SIMS. Appl. Sci. 2019, 9, 3452. [Google Scholar] [CrossRef] [Green Version]
  14. Legrand, S.; Van der Snickt, G.; Cagno, S.; Caen, J.; Janssens, K. MA-XRF Imaging as a Tool to Characterize the 16th Century Heraldic Stained-Glass Panels in Ghent Saint Bavo Cathedral. J. Cult. Herit. 2019, 40, 163–168. [Google Scholar] [CrossRef]
  15. Bernady, E.; Goryl, M.; Walczak, M. XRF Imaging (MA-XRF) as a Valuable Method in the Analysis of Nonhomogeneous Structures of Grisaille Paint Layers. Heritage 2021, 4, 3193–3207. [Google Scholar] [CrossRef]
  16. Van der Snickt, G.; Legrand, S.; Caen, J.; Vanmeert, F.; Alfeld, M.; Janssens, K. Chemical Imaging of Stained-Glass Windows by Means of Macro X-Ray Fluorescence (MA-XRF) Scanning. Microchem. J. 2016, 124, 615–622. [Google Scholar] [CrossRef]
  17. Capobianco, N.; Hunault, M.O.J.Y.; Balcon-Berry, S.; Galoisy, L.; Sandron, D.; Calas, G. The Grande Rose of the Reims Cathedral: An Eight-Century Perspective on the Colour Management of Medieval Stained Glass. Sci. Rep. 2019, 9, 3287. [Google Scholar] [CrossRef] [PubMed] [Green Version]
  18. Hunault, M.O.J.Y.; Bauchau, F.; Boulanger, K.; Hérold, M.; Calas, G.; Lemasson, Q.; Pichon, L.; Pacheco, C.; Loisel, C. Thirteenth-Century Stained Glass Windows of the Sainte-Chapelle in Paris: An Insight into Medieval Glazing Work Practices. J. Archaeol. Sci. Rep. 2021, 35, 102753. [Google Scholar] [CrossRef]
  19. Palomar, T.; Grazia, C.; Pombo Cardoso, I.; Vilarigues, M.; Miliani, C.; Romani, A. Analysis of Chromophores in Stained-Glass Windows Using Visible Hyperspectral Imaging in-Situ. Spectrochim. Acta Part A Mol. Biomol. Spectrosc. 2019, 223, 117378. [Google Scholar] [CrossRef]
  20. Rahrig, M.; Torge, M. 3D Inspection of the Restoration and Conservation of Stained Glass Windows Using High Resolution Structured Light Scanning. In International Archives of the Photogrammetry, Remote Sensing and Spatial Information Sciences—ISPRS Archives; International Society of Photogrammetry and Remote Sensing (ISPRS): Hanover, Germany, 2019; Volume 42, pp. 965–972. [Google Scholar]
  21. Targowski, P.; Góra, M.; Wojtkowski, M. Optical Coherence Tomography for Artwork Diagnostics. Laser Chem. 2007, 2006, 35373. [Google Scholar] [CrossRef] [Green Version]
  22. Liang, H.; Cid, M.G.; Cucu, R.G.; Dobre, G.M.; Podoleanu, A.G.; Pedro, J.; Saunders, D. En-Face Optical Coherence Tomography—A Novel Application of Non-Invasive Imaging to Art Conservation. Opt. Express 2005, 13, 6133. [Google Scholar] [CrossRef] [PubMed]
  23. Filippidis, G.; Massaouti, M.; Selimis, A.; Gualda, E.J.; Manceau, J.M.; Tzortzakis, S. Nonlinear Imagig and THz Diagnostic Tools in the Service of Cultural Heritage. Appl. Phys. A Mater. Sci. Process. 2012, 106, 257–263. [Google Scholar] [CrossRef]
  24. Anglos, D. Laser-Induced Breakdown Spectroscopy in Art and Archaeology. Appl. Spectrosc. 2001, 55, 186A–205A. [Google Scholar] [CrossRef]
  25. Anglos, D.; Detalle, V. Cultural Heritage Applications of LIBS. In Springer Series in Optical Sciences; Springer: Berlin/Heidelberg, Germany, 2014; Volume 182, pp. 531–554. ISBN 9783642450846. [Google Scholar]
  26. Nevin, A.; Spoto, G.; Anglos, D. Laser Spectroscopies for Elemental and Molecular Analysis in Art and Archaeology. Appl. Phys. A Mater. Sci. Process. 2012, 106, 339–361. [Google Scholar] [CrossRef]
  27. Tognoni, E.; Palleschi, V.; Corsi, M.; Cristoforetti, G. Quantitative Micro-Analysis by Laser-Induced Breakdown Spectroscopy: A Review of the Experimental Approaches. Spectrochim. Acta-Part B At. Spectrosc. 2002, 57, 1115–1130. [Google Scholar] [CrossRef]
  28. Melessanaki, K.; Mateo, M.; Ferrence, S.C.; Betancourt, P.P.; Anglos, D. The Application of LIBS for the Analysis of Archaeological Ceramic and Metal Artifacts. Appl. Surf. Sci. 2002, 197–198, 156–163. [Google Scholar] [CrossRef]
  29. Giakoumaki, A.; Melessanaki, K.; Anglos, D. Laser-Induced Breakdown Spectroscopy (LIBS) in Archaeological Science-Applications and Prospects. Anal. Bioanal. Chem. 2007, 387, 749–760. [Google Scholar] [CrossRef]
  30. Oujja, M.; Sanz, M.; Agua, F.; Conde, J.F.; García-Heras, M.; Dávila, A.; Oñate, P.; Sanguino, J.; Vázquez De Aldana, J.R.; Moreno, P.; et al. Multianalytical Characterization of Late Roman Glasses Including Nanosecond and Femtosecond Laser Induced Breakdown Spectroscopy. J. Anal. At. Spectrom. 2015, 30, 1590–1599. [Google Scholar] [CrossRef] [Green Version]
  31. Martínez-Hernández, A.; Oujja, M.; Sanz, M.; Carrasco, E.; Detalle, V.; Castillejo, M. Analysis of Heritage Stones and Model Wall Paintings by Pulsed Laser Excitation of Raman, Laser-Induced Fluorescence and Laser-Induced Breakdown Spectroscopy Signals with a Hybrid System. J. Cult. Herit. 2018, 32, 1–8. [Google Scholar] [CrossRef]
  32. Bai, X.; Syvilay, D.; Wilkie-Chancellier, N.; Texier, A.; Martinez, L.; Serfaty, S.; Martos-Levif, D.; Detalle, V. Influence of Ns-Laser Wavelength in Laser-Induced Breakdown Spectroscopy for Discrimination of Painting Techniques. Spectrochim. Acta—Part B At. Spectrosc. 2017, 134, 81–90. [Google Scholar] [CrossRef] [Green Version]
  33. Muller, K.; Stege, H. Evaluation of the Analytical Potential of Laser-Induced Breakdown Spectrometry (LIBS) for the Analysis of Historical Glasses. Archaeometry 2003, 45, 421–433. [Google Scholar] [CrossRef]
  34. Carmona, N.; Oujja, M.; Gaspard, S.; García-Heras, M.; Villegas, M.A.; Castillejo, M. Lead Determination in Glasses by Laser-Induced Breakdown Spectroscopy. Spectrochim. Acta—Part B At. Spectrosc. 2007, 62, 94–100. [Google Scholar] [CrossRef]
  35. Carmona, N.; Oujja, M.; Rebollar, E.; Römich, H.; Castillejo, M. Analysis of Corroded Glasses by Laser Induced Breakdown Spectroscopy. Spectrochim. Acta—Part B At. Spectrosc. 2005, 60, 1155–1162. [Google Scholar] [CrossRef]
  36. Palomar, T.; Oujja, M.; García-Heras, M.; Villegas, M.A.; Castillejo, M. Laser Induced Breakdown Spectroscopy for Analysis and Characterization of Degradation Pathologies of Roman Glasses. Spectrochim. Acta—Part B At. Spectrosc. 2013, 87, 114–120. [Google Scholar] [CrossRef]
  37. Klein, S.; Stratoudaki, T.; Zafiropulos, V.; Hildenhagen, J.; Dickmann, K.; Lehmkuhl, T. Laser-Induced Breakdown Spectroscopy for on-Line Control of Laser Cleaning of Sandstone and Stained Glass. Appl. Phys. A Mater. Sci. Process. 1999, 69, 441–444. [Google Scholar] [CrossRef]
  38. Gerhard, C.; Hermann, J.; Mercadier, L.; Loewenthal, L.; Axente, E.; Luculescu, C.R.; Sarnet, T.; Sentis, M.; Viöl, W. Quantitative Analyses of Glass via Laser-Induced Breakdown Spectroscopy in Argon. Spectrochim. Acta—Part B At. Spectrosc. 2014, 101, 32–45. [Google Scholar] [CrossRef]
  39. Oujja, M.; Palomar, T.; Martínez-Weinbaum, M.; Martínez-Ramírez, S.; Castillejo, M. Characterization of Medieval-like Glass Alteration Layers by Laser Spectroscopy and Nonlinear Optical Microscopy. Eur. Phys. J. Plus 2021, 136, 859. [Google Scholar] [CrossRef]
  40. Oujja, M.; Agua, F.; Sanz, M.; Morales-Martin, D.; García-Heras, M.; Villegas, M.A.; Castillejo, M. Multiphoton Excitation Fluorescence Microscopy and Spectroscopic Multianalytical Approach for Characterization of Historical Glass Grisailles. Talanta 2021, 230, 122314. [Google Scholar] [CrossRef]
  41. Romani, A.; Clementi, C.; Miliani, C.; Favaro, G. Fluorescence Spectroscopy: A Powerful Technique for the Noninvasive Characterization of Artwork. Acc. Chem. Res. 2010, 43, 837–846. [Google Scholar] [CrossRef] [PubMed]
  42. Fournier, J.; Néauport, J.; Grua, P.; Jubera, V.; Fargin, E.; Talaga, D.; Jouannigot, S. Luminescence Study of Defects in Silica Glasses under Near-UV Excitation. Phys. Procedia 2010, 8, 39–43. [Google Scholar] [CrossRef] [Green Version]
  43. Reisfeld, R. Inorganic Ions in Glasses and Polycrystalline Pellets as Fluorescence Standard Reference Materials. J. Res. Notionol Bureou Stondords A Phys. Chem. 1972, 76, 613–635. [Google Scholar] [CrossRef]
  44. Skuja, L. Optically Active Oxygen-Deficiency-Related Centers in Amorphous Silicon Dioxide. J. Non. Cryst. Solids 1998, 239, 16–48. [Google Scholar] [CrossRef]
  45. Fernández Navarro, J.M. El Vidrio, 3rd ed.; Consejo Superior de Investigaciones Científicas; Madrid, Spain; Sociedad Española de Cerámica y Vidrio: Madrid, Spain, 2003; ISBN 8400081587. [Google Scholar]
  46. Palomar, T.; Enríquez, E. Evaluation of the Interaction of Solar Radiation with Colored Glasses and Its Thermal Behavior. J. Non. Cryst. Solids 2022, 579, 121376. [Google Scholar] [CrossRef]
  47. NIST Atomic Spectra Database. Available online: http://physics.nist.gov/asd (accessed on 15 January 2022).
  48. Stevens-Kalceff, M.A. Cathodoluminescence Microcharacterization of Point Defects in α-Quartz. Mineral. Mag. 2009, 73, 585–605. [Google Scholar] [CrossRef]
  49. Chen, H.; Peng, J.; Yu, L.; Chen, H.; Sun, M.; Sun, Z.; Ni, R.; Alamry, K.A.; Marwani, H.M.; Wang, S. Calcium Ions Turn on the Fluorescence of Oxytetracycline for Sensitive and Selective Detection. J. Fluoresc. 2020, 30, 463–470. [Google Scholar] [CrossRef] [PubMed]
Figure 1. Images of the flashed glasses considered in the present study.
Applsci 12 05760 g001
Figure 2. OM images of the colored layers on the flashed glasses in cross-section. Colored layer (top) and base glass (bottom). All the samples have the same scale.
Applsci 12 05760 g002
Figure 3. FESEM images of the colored layers in the flashed glasses in cross-section. The scale is the same for all the images.
Applsci 12 05760 g003
Figure 4. Transmittance spectra of the different colored flashed glasses: (a) pink, (b) brown, (c) blue, (d) black, and (e) green.
Applsci 12 05760 g004
Figure 5. LIB spectra of base glass (lower black spectra) and colored layers (upper red spectra) from flashed glasses. The assigned neutral (I) and ionic (II) atomic lines are indicated. The gap at wavelengths between 260 and 270 nm has been intentionally left to avoid the scattering light from the excitation laser at 266 nm. (ak) correspond to LIBS spectra of samples Pink1, Pink2, Brown1, Brown2, Blue1, Blue2, Blue3, Black, Green1, Green2 and Green3, respectively.
Applsci 12 05760 g005aApplsci 12 05760 g005b
Figure 6. LIF spectra of base glass (lower black spectra) and colored layers (upper red spectra) from flashed glasses. ODC and (*) refer to bands due to oxygen deficiency centers and copper nanoparticles, respectively. Possible chromophores are tentatively assigned and marked by horizontal bars. (ak) correspond to LIF spectra of samples Pink1, Pink2, Brown1, Brown2, Blue1, Blue2, Blue3, Black, Green1, Green2 and Green3, respectively.
Applsci 12 05760 g006aApplsci 12 05760 g006b
Table 1. Thickness of the colored layers measured in the cross-section of the glasses using OM, FESEM, and chemical linear analyses with FESEM-EDS.
SampleThickness (µm)
OMFESEMLinear FESEM-EDS Analyses
Pink1137 ± 1147 ± 1-
Pink2127 ± 1-106–206
Brown1331 ± 2334 ± 2-
Brown2351 ± 1-306–403
Blue1675 ± 1 652–747
Blue2173 ± 2-176–226
Blue3386 ± 2-373–391
Black175 ± 1177 ± 2-
Green1193 ± 2195 ± 1-
Green2352 ± 1-235–314
Green3175 ± 1180 ± 2-
Table 2. Chemical composition (wt.%) of the surface-colored layer and of the base glass analyzed by FESEM-EDS. CL: Colored layer, BG: Base glass.
Na2OMgOSiO2K2OCaOTiO2Cr2O3MnOFe2O3CoONiOCuOZnOBaOPbO
Pink1CL0.9-29.15.5---------3.760.8
BG14.5-71.31.113.1----------
Pink2CL10.7-71.65.111.5------1.0---
BG15.0-69.61.414.0----------
Brown1CL8.7-48.92.39.3-16.7-14.1------
BG15.3-70.40.813.5----------
Brown2CL11.8-72.45.49.7------0.7---
BG15.30.870.40.712.6----------
Blue1CL14.9-70.71.610.9------1.9---
BG17.0-70.31.211.5----------
Blue2CL15.00.669.82.110.6----1.8-----
BG17.60.670.40.610.8----------
Blue3CL16.61.264.31.18.9----6.7--1.1--
BG19.01.669.00.49.9----------
BlackCL12.90.660.01.68.9--12.8-1.21.9----
BG17.1-71.90.510.5----------
Green1CL2.5-46.69.4-4.41.5-------35.6
BG18.31.870.4-9.5----------
Green2CL11.71.255.50.46.6---6.3--6.7-11.5-
BG16.71.463.10.49.1--------9.3-
Green3CL2.3-44.410.5--1.4----3.9--37.4
BG19.31.968.20.410.2----------
Table 3. Elemental composition of base glass and colored layers of flashed glasses as determined by LIBS. The main components and possible chromophores are indicated in bold black and bold red, respectively. BS: Base glass, CL: Colored layer.
SamplesElemental Composition as Determined by LIBS
Pink1CLSi, B, Mn, Fe, Pb, Al, Ca, K, Ba, Sr, Ti, Na
BGSi, Mg, Al, Ca, Na, K, Ba, Sr, Ti
Pink2CLSi, B, Mg, Sn, Al, Ca, Cu, Na, K, Fe, Ti
BGSi, Mg, Al, Ca, Na, K, Ba, Sr, Ti
Brown1CLSi, B, Fe, Mn, Mg, Ca, Al, Cr, K, Ba, Sr, Ti, Na
BGSi, Mg, Al, Ca, Na, K, Ba, Sr, Ti
Brown2CLSi, B, Fe, Mg, Ca, Al, Cu, Na, K, Ti
BGSi, Mg, Al, Ca, Na, K, Ba, Ti
Blue1CLSi, B, Mg, Ca, Al, Cu, Na, Fe, K, Ba, Ti
BGSi, Mg, Al, Ca, Na, Fe, K, Ba, Ti
Blue2CLSi, B, Mg, Ca, Al, Cu, Na, Co, K, Ba, Ti
BGSi, Mg, Al, Ca, Na, K, Ba, Ti
Blue3CLSi, B, Co, Mg, Ca, Al, Cu, Na, Ba, Ti, Zn
BGSi, Mg, Al, Ca, Na, Ba, Ti
BlackCLSi, Mg, Fe, Mn, Ca, Al, Ni, Na, Co, K, Ba, Cr, Sr, Ti
BGSi, Mg, Al, Ca, Na, K, Ti
Green1CLSi, B, Mg, Mn, Ca, Al, PbCr, Ti, Cu, Co, K, Na
BGSi, Mg, Al, Ca, Na, K, Ti
Green2CLSi, B, Fe, Cr, Mg, Al, Ca, Cu, Co, K, Ba, Sr, Na
BGSi, Mg, Al, Ca, Na, Ba, Sr, Ti
Green3CLSi, B, Mn, Cr, Mg, Pb, Al, Ca, Cu, Co, Ba, Na
BGSi, Mg, Al, Ca, Na, Ti
Publisher’s Note: MDPI stays neutral with regard to jurisdictional claims in published maps and institutional affiliations.

