Article

The Effect of Terpenoid Compounds on the Formation of Advanced Glycation Endproducts (AGEs) in Model Systems

by
Antonis Vlassopoulos
1,
Theano Mikrou
1,
Artemis Papantoni
1,
Georgios Papadopoulos
2,
Maria Kapsokefalou
1,
Athanasios Mallouchos
1 and
Chrysavgi Gardeli
1,*
1
Laboratory of Food Chemistry and Analysis, Department of Food Science and Human Nutrition, Agricultural University of Athens, Iera Odos 75, 11855 Athens, Greece
2
Laboratory of Plant Breeding and Biometry, Department of Crop Science, Agricultural University of Athens, Iera Odos 75, 11855 Athens, Greece
*
Author to whom correspondence should be addressed.
Submission received: 2 December 2021 / Revised: 10 January 2022 / Accepted: 13 January 2022 / Published: 17 January 2022
(This article belongs to the Special Issue Nutraceuticals: Food and Nutritional Applications)

Abstract

:
Background: Terpenoid compounds, despite their established antioxidant ability, are neglected as potential glycation regulators. Methods: In-vitro model systems of lysine (0.1 M) with glucose (0.1 M and 1 M) were incubated at 80 °C and 100 °C for 3 h in the presence of aniseed oil, thymol and linalool (2–8 μΜ). Color development, absorbance at UV-Vis (280 nm, 360 nm, 420 nm), fluorescence intensity (λexc = 370 nm, λemm = 440 nm) and lysine depletion (HPLC-FL) were measured to monitor the progress of the Maillard reaction. Response Surface Methodology was used to analyze the impact of the five experimental conditions on the glycation indices. Results: All terpenoid compounds promoted color development and did not affect lysine depletion. The choice of terpenoid compound impacted glycation at 280 nm, 360 nm and 420 nm (p < 0.02). The effect was stronger at lower temperatures (p < 0.002) and 0.1 M glucose concentrations (p < 0.001). Terpenoid concentration was important only at 360 nm and 420 nm (p < 0.01). No impact was seen for fluorescence intensity from the choice of terpenoid compounds and their dose (p = 0.08 and p = 0.44 respectively). Conclusion: Terpenoid compounds show both anti- and proglycative activity based on the incubation conditions. Thymol showed the largest antiglycative capacity, followed by aniseed oil and linalool. Maximal antiglycative capacity was seen at 0.1 M glucose, 2 μΜ terpenoid concentration, 80 °C and 1 h incubation.

1. Introduction

Essential oils (EOs) constitute a large class of secondary plant metabolites with important defensive and attractive role between plants and their environment [1]. Liquid at ambient temperature, their volatile fraction is composed principally by mono-, sesqui- and di-terpenes alongside some volatile phenolic substances like phenylpropanoids [2]. Their ability to act as hydrogen donators or radical scavengers has been linked with inhibition of lipid peroxidation [3]. This ability to terminate the lipid peroxidation chain reaction is the main application of EOs as natural food antioxidants and it is linked to their terpenoid content [4].
Among terpenoids, those with phenolic ring like thymol and carvacrol possess the highest antioxidant activity followed by the monoterpene hydrocarbons with strongly activated methylene group like terpinolene, α-terpinene and γ-terpinene. Linalool, a tertiary allylic alcohol, shows a pro-oxidant effect while benzene derivatives (other than thymol and carvacrol) like estragol, a phenylopropanoid, are more efficient in preventing the formation of primary lipid oxidation products [5].
On the other hand, little is known about the impact of terpenoid compounds on other oxidative reaction in foods. Glycation is an important chemical reaction occurring mainly during food processing when a free amino group of protein interacts with the carbonyl group of glucose or other reducing sugars [6,7,8]. Among the complex mixture of compounds produced, several carbonyl derivatives such as Strecker aldehydes and dicarbonyls (glyoxal, methylglyoxal, 3-deoxyglucosone) are formed [9,10]. Those highly reactive carbonyl derivatives can react with the ε-amino group of lysine or the guanidino group of arginine to generate products known as Advanced Glycation End-products (AGEs). AGEs are a very heterogeneous group of compounds and can be classified into fluorescent (such as pentosidine) and nonfluorescent AGEs (such as Nε-(carboxymethyl)lysine CML) as well as cross-linking and non-cross-linking AGEs. Some AGEs exhibit both fluorescent and cross-linking properties, while others show none of the mentioned characteristics [7,11].
Mainly produced through the thermal processing of foods, mitigation of AGEs formation in foods is often dealt through modifications in heating time and temperature [12]. Alternatively, molecules that exhibit enhanced antioxidant activity, sugar autoxidation inhibition, reactive dicarbonyls trapping, and amino group binding, could be used as AGEs inhibitors [13,14]. Many synthetic inhibitors, have been used to control AGEs production in food systems and in humans (aminoguanidine, metformin, irbesartan, pyridoxamine, etc.) but their severe side effects highlight the need for effective and safe alternatives like natural plant extract [8]. Phenolic compounds with potent antioxidant and free radical scavenging activity and the ability to trap reactive carbonyl species are commonly studied [11,13]. Phenolic acids such as ferulic and isoferulic acid [15,16], cinnamic [17], chlorogenic [14], vanillic, syringic, sinapic, p-coumaric and caffeic acids [18,19] have showed satisfactory AGEs inhibition in vitro. In food systems, flavonoids such as rutin, quercetin, genistein and narigenin, stilbenes (resveratrol) [13,20] and tannins (punicalagin) [21] have been identified as potent AGEs inhibitors. In addition, several herbal infusions of medicinal plants have been successfully screened as inhibitors [22]. Hydroxytyrosol, the main phenolic compound in olive oil, was also recently identified as a potential AGEs inhibitor through the binding of methylglyoxal [23].
Despite their antioxidant and radical scavenging properties, EOs have not been fully studied as AGEs inhibitors. In a PatchDock study, limonene was shown to inhibit albumin glycation through hydrophobic binding of its monoterpene hydrocarbon [24]. In another study, the essential oil of caraway which consists mainly of S-carvone (a monoterpene aldehyde), prevented the formation of early Maillard intermediates. Interestingly, the antiglycative capacity of caraway oil was not linked to the carbonyl group in the S-carvone structure. The same study, also showed that anethole and thymol the major constituents in sweet cumin, were more likely to act as glycation promoters than inhibitors [25].
In the present study, linalool and thymol, two monoterpene compounds as well as aniseed oil, a commercial product purchased by Sigma Aldrich were selected to be studied, in terms of their role in lysine glycation. The main essential oil compound in aniseed oil is anethole (about 80–90%) together with small amounts of estragol, an isomer of anethole. The terpenoid compounds’ choice was based on the fact that they are main essential oil compounds of herbs used in European cuisine. The objective of this study was to test the impact of these terpenoid compounds on lysine glycation models representative of thermal food processing. Their role as potential Maillard modulators was tested for different terpenoid concentrations, temperatures, heating times and glucose concentrations.

2. Materials and Methods

2.1. Reagents

D-Glucose, L-Lysine monohydrochloride and linalool were purchased from Acros Organics, thymol from Applichem and anise oil from Sigma Aldrich (CAS: 8007-70-3, nature identical, synonym: aniseed oil). All solutions (glucose, lysine and the test compounds) were prepared in phosphate buffer 0.1 M, pH 7.2 ± 0.1 (PBS, Bectron, Dickinson and Company, Bergen County, NJ, USA) and Tween 80 (Serva Electrophoresis GmbH, Heidelberg, Germany) which helps to incorporate aniseed oil and thymol in phosphate buffer. As linalool possesses a very good aqueous solubility at pH 7.0, the use of Tween 80 was not necessary [26].
2-Mercaptoethanol (MCE ≥ 99.0%), phthaldialdehyde (OPA ≥ 99.0%) and hydrochloric acid solution (0.1 N) were purchased from Sigma Aldrich (Steinheim, Germany). Sodium hydroxide (≥98%) and boric acid (≥99.5%) were purchased from Honeywell International Inc (Muskegon, MI, USA). Di-potassium hydrogen phosphate, potassium dihydrogen phosphate and sodium acetate trihydrate were purchased from MERCK (Darmstadt, Germany). Water, methanol and acetonitrile (HPLC grade) were purchased from Fisher Scientific (Loughborough, UK).

2.2. Experimental Model of Protein Glycation

A glucose:lysine model with or without (control) the presence of terpenoid compounds were used as the protein glycation model. Two different glucose:lysine concentrations (10:1 and 1:1 molar ratios) were used. Each reaction mixture consisted of 3 mL of glucose either 1 M or 0.1 M, 3 mL of lysine 0.1 M and 6.25, 12.5, 18.75 and 25 μL of terpenoid compounds working solutions 2 mM, resulting to a final concentration of 2, 4, 6 and 8 μM. The models were added to glass vials with ribbed stopers and heated using a Thermo Shaker LLG, Unithermix 1 Pro at 80 °C and 100 °C at a fixed 600 rpm rotational speed for a total of 3 h. All working solutions were freshly prepared at 100 mL final volume and in the case of aniseed oil and thymol they were mixed under magnetic stirring for 1 min followed by homogenization using an UltraTurrax appliance for 1 min to achieve better dispersion of the lipophilic droplets into the aqueous phase. All experiments were performed in duplicate. Samples and controls were taken at, 1, 2 and 3 h of heating. Aliquots of 200 μL of the reaction mixtures and controls were transferred into wells of a 96-well plate and kept at −20 °C until analysis.

2.3. Non-Specific Markers of Maillard Reaction

2.3.1. Color Development Assay

The color of the studied model systems was determined using a Lovibond Spectrocolorimeter LC100. CIE L*a*b* values were measured using daylight (D 65/10°) with brightness. Color development was quantified using controls at t = 1, 2 and 3 h as the reference value and via the measurement of lightness, redness and yellowness values following the equation:
Color   Development ( %   difference   from   control ) = ( L * L ° ) + ( a * a ° ) + ( b * b ° )
L = lightness, a = redness, b = yellowness and L°, α°, and b° are the color of the control at t = 1, 2 and 3 h of heating respectively [27].

2.3.2. Assessment of the Maillard Reaction Evolution by Ultraviolet–Visible (UV-Vis) Spectroscopy

UV-Vis spectroscopy (Epoch 2, BioTek Instruments, Inc., Winooski, VT, USA) in three distinct wavelengths was used to measure the concentration of Maillard products at each experimental point expressed in arbitrary units. Absorbance at 280 nm was used for the quantification of early-stage products such as Schiff bases and Amadori rearrangement products. Intermediate products such as unsaturated carbonyls, dicarbonyls, ROS and furans that come from the dehydration, oxidation and fragmentation of initial products were measured at 360 nm, and the final products of non-enzymatic browning such as cross-linked products, aromatic compounds and colored polymers were determined at 420 nm [28].
The ability of each terpenoid compound to impact the formation of early, intermediate and advanced glycation products was calculated by the following equation:
Absorbance   ( %   difference   from   control ) = (   A b s 280 _ 360 _ 420 _ s a m p l e A b s 280 _   360 _ 420 _ c o n t r o l   A b s 280 _ 360 _ 420 _ c o n t r o l ) × 100
where Abs280_360_420_sample is the absorbance of the reaction mixtures with the presence of the test molecules and Abscontrol is the absorbance of the reaction mixtures without the presence of the test molecules.

2.3.3. Measurement of Fluorescent AGEs Formation

Following incubation at 80 °C and 100 °C for 1, 2 and 3 h, fluorescence intensity was measured using a fluorescent spectrometer (Victor X2 Fluorimeter 2030, Perkin-Elmer-Massachusetts, USA) at an excitation wavelength of λexc = 370 nm and an emission wavelength of λemm = 440 nm. The capacity (%) of each terpenoid compound to impact the formation of fluorescent AGEs was based on [22] and calculated by the following equation:
Fluorescence   Intensity   ( %   difference   from   control ) = [ F l u o s a m p l e F l u o c o n t r o l F l u o c o n t r o l ] × 100
where Fluosample is the fluorescence intensity of each tested molecule with glycation models; Fluocontrol is the fluorescence intensity of the glycation models.

2.4. HPLC Determination of Lysine

2.4.1. Preparation of Solutions

Standard stock solutions of lysine (10 μmol/mL) were prepared in 0.1 M HCl. For derivatization, it is essential that the pH value of the standard is in the range of pH 7. Therefore, the standard was first diluted 1:1 with 0.1 M NaOH. The stock solution was then diluted with water to prepare the standard working solutions ranging from 0.1 to 0.5 μmol/mL for calibration. Solutions were stored at 4 °C.
The derivatization reagent was prepared by mixing 1 mL of OPA solution (10 mg/mL, dissolved in methanol) in 10 mL of borate buffer (consisting of 0.8 M borate buffer in KCl and 0.8 M NaOH with a final pH of 9.9) and 16 μL MCE. The derivatization reagent is stable within 9 days [29].
For the preparation of the samples, 50 μL of the heated model system were transferred to a 10 mL volumetric flask and then filled with analytical grade water.

2.4.2. Derivatization Procedure

The derivatization took place manually by mixing 250 μL of the diluted sample or the standard solution with 150 μL of derivatization reagent. After 2 min, 50 μL of the mixture were added to 200 μL of neutralization solution (as described in Section 2.4.3) [30] and 20 μL of the final solution were injected into the HPLC system.

2.4.3. Liquid Chromatography

The determination of lysine was performed [31] using high-performance liquid chromatography and fluorescence detection. A JASCO HPLC system (JASCO International Co., Ltd., Tokyo, Japan) was used, consisting of a quaternary pump (PU-2089 Plus), an autosampler (AS-1555), and a fluorescence detector (FP-920). Separation was accomplished with a Kinetex EVO C18 column (100 mm × 4.6 mm i.d., 2.6 μm, Phenomemex, Torrance, CA, USA). The flow rate was set at 0.8 mL/min, and the injection volume was 20 μL. The mobile phase was composed of sodium phosphate (20 mM; pH 7.2) (A) and acetonitrile–methanol (50:50, v/v) (B) under gradient elution condition: 97–40% A at 0–20 min, 40–97% A at 20–23 min and 97% A until 25 min. The excitation and emission wavelength were set at 340 nm and 455 nm, respectively.

2.5. Statistical Analysis and Response Surface Methodology

Descriptive statistics, specifically box and whiskers plots, were used to estimate the data distribution and to explore potential differences between the terpenoid compounds and their impact on amino acid glycation.
A D-Optimal design was combined with Response Surface Methodology (RSM) as a post hoc analysis [32]. A reduced quadratic randomized model was retrofitted to the experimental conditions. Time, temperature, glucose concentration and terpenoid compounds were used as numerical values and forced to predefined values as described above (fixed values), while the choice of terpenoid compounds was set as a categorical value. A total of 33 runs were determined by a selection criterion chosen during the experimental design (Table 1).
Color Development, Absorbance at 280 nm, 360 nm and 420 nm and Fluorescence Intensity expressed as (%) difference from the control were used for response prediction. For this purpose, a randomly selected sample was used for response prediction. The model’s fitness was confirmed by analysis of variance (ANOVA) and the determination coefficient (R2) using p-values. Dependent variables were analyzed either via a Linear or 2FI model. Model choice was based on the following criteria: test of normality for residuals, residuals versus predicted and residuals versus runs plots, Predicted R2 and Lack of Fit test. Box-Cox analysis were used to identify the most suitable data transformations. Namely, Color development underwent an inverse square root transform, and Absorbance at 420 nm underwent a power transform with a λ = 2.56 and k = 66.583. Color Development was analyzed with a linear model and Absorbances at 280 nm, 360 nm and 420 nm and Fluorescence Intensity were analyzed with a 2FI model. Significance level was set at α = 0.05. All analyses were carried out using the IBM SPSS Statistics 25 Software and Design-Expert 11.0.5.0 (Stat-Ease, Inc., Minneapolis, MN, USA).

3. Results

3.1. Non-Specific Markers of Maillard Reaction

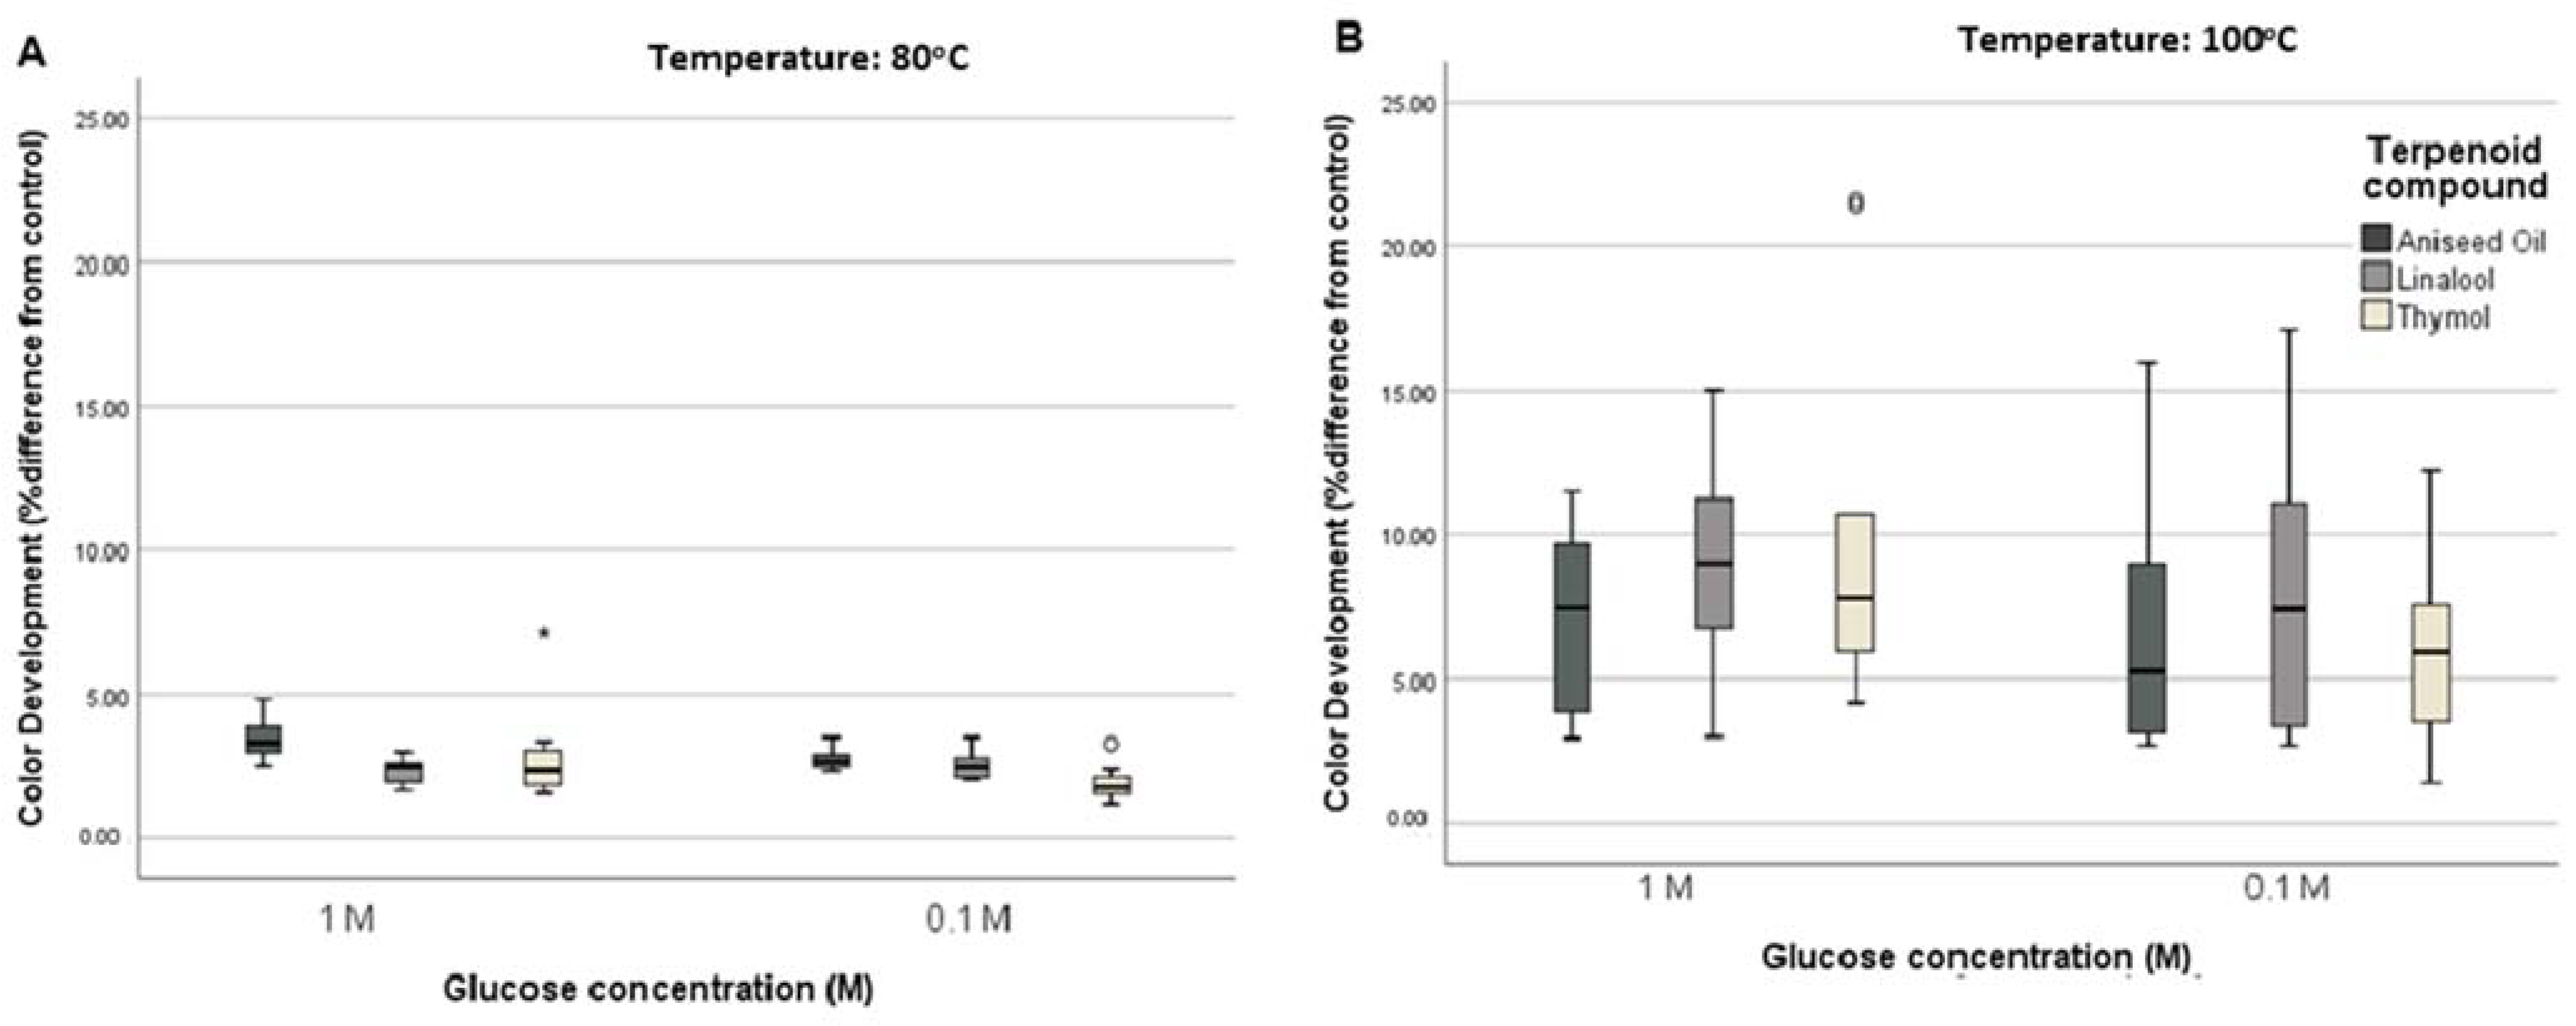
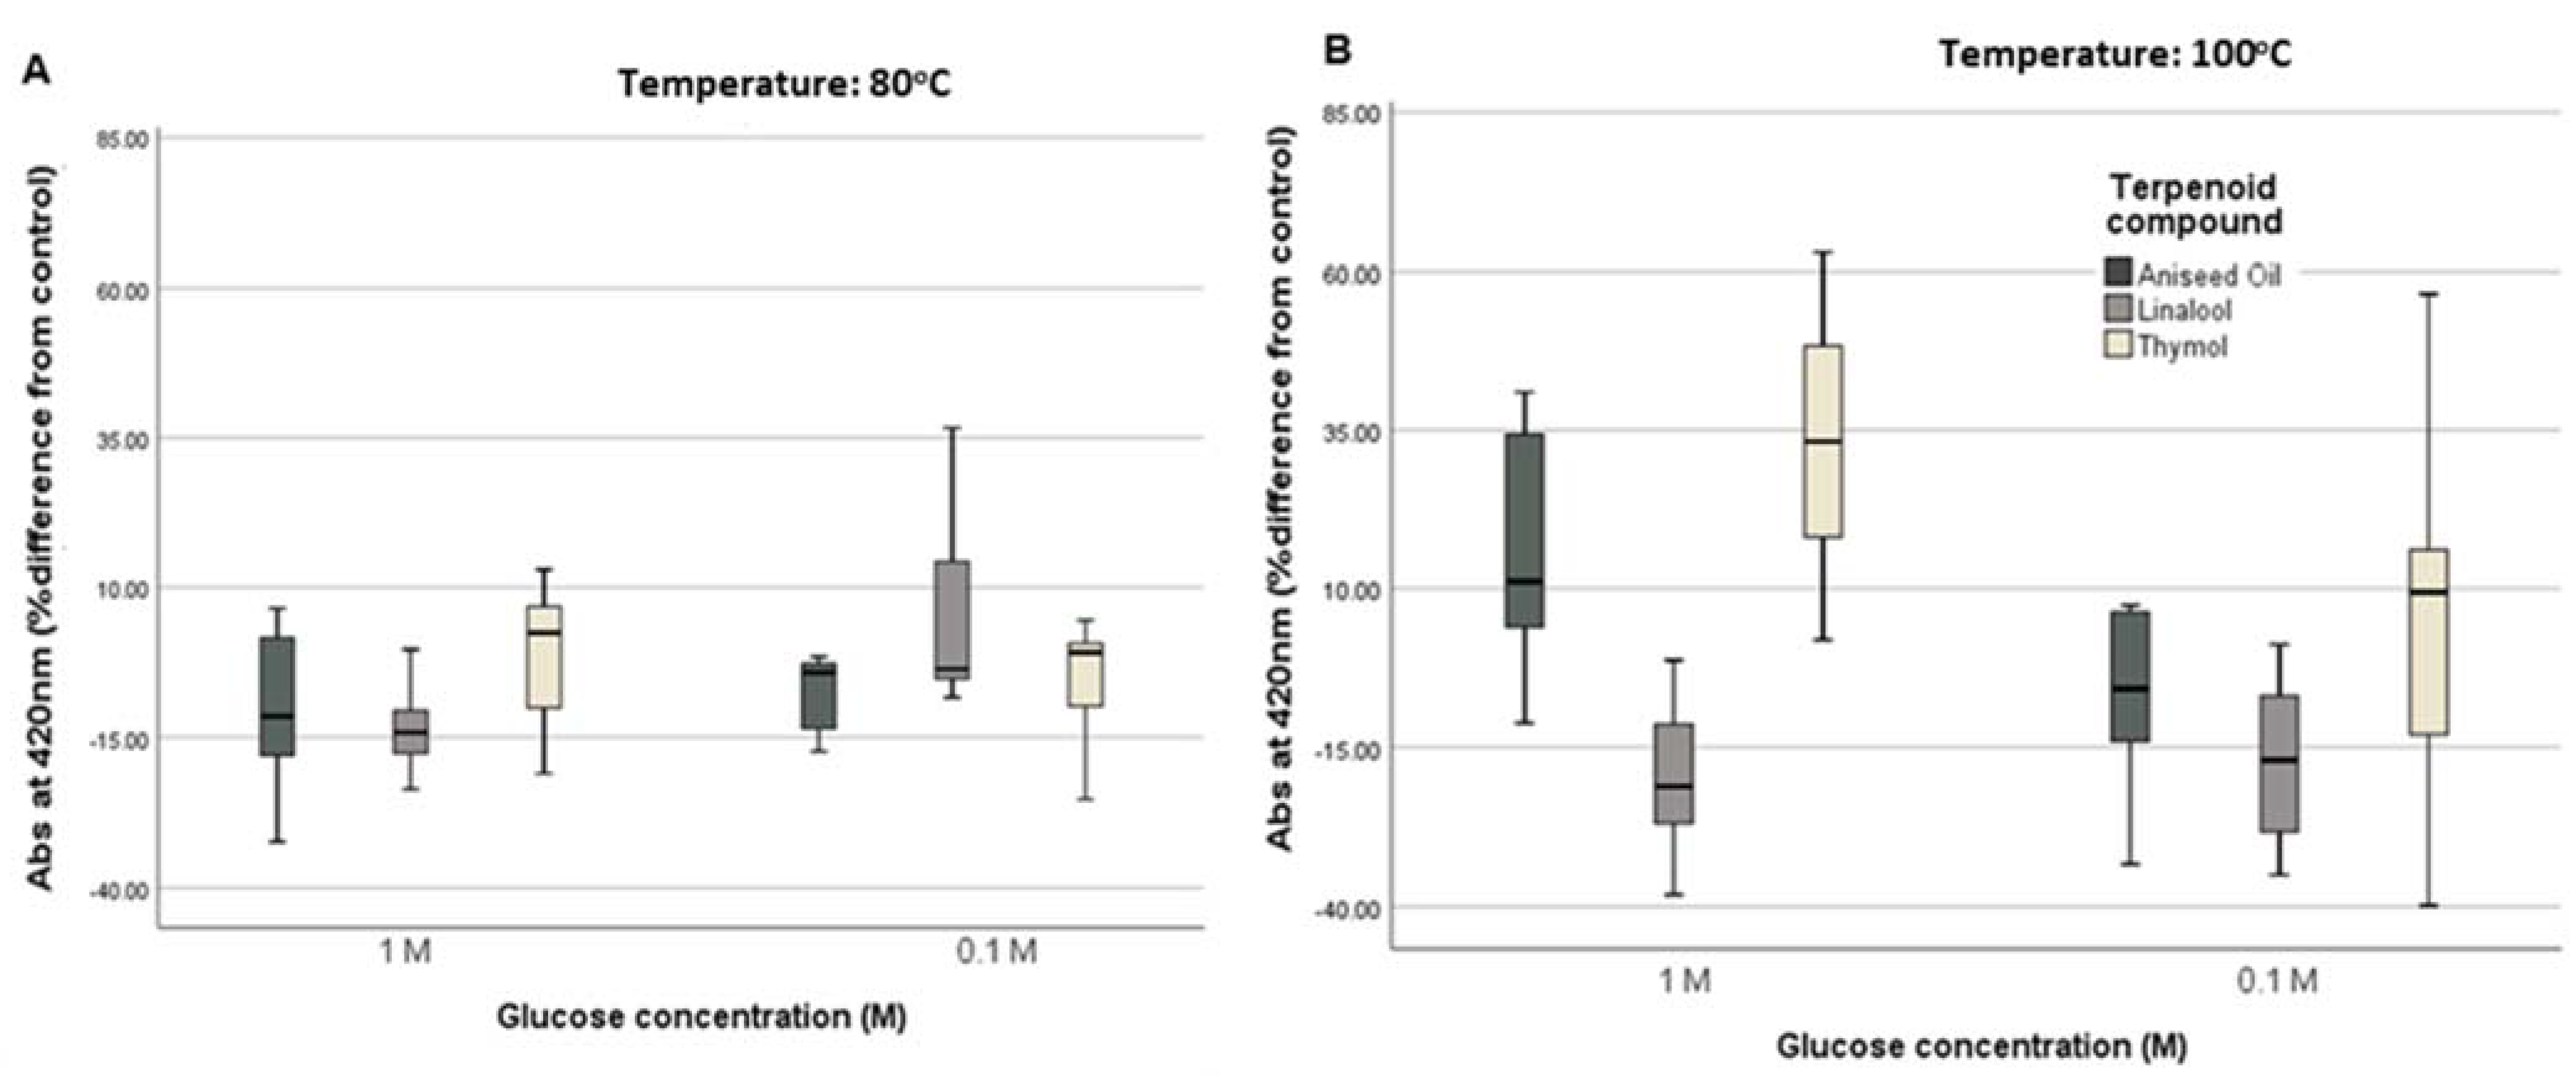
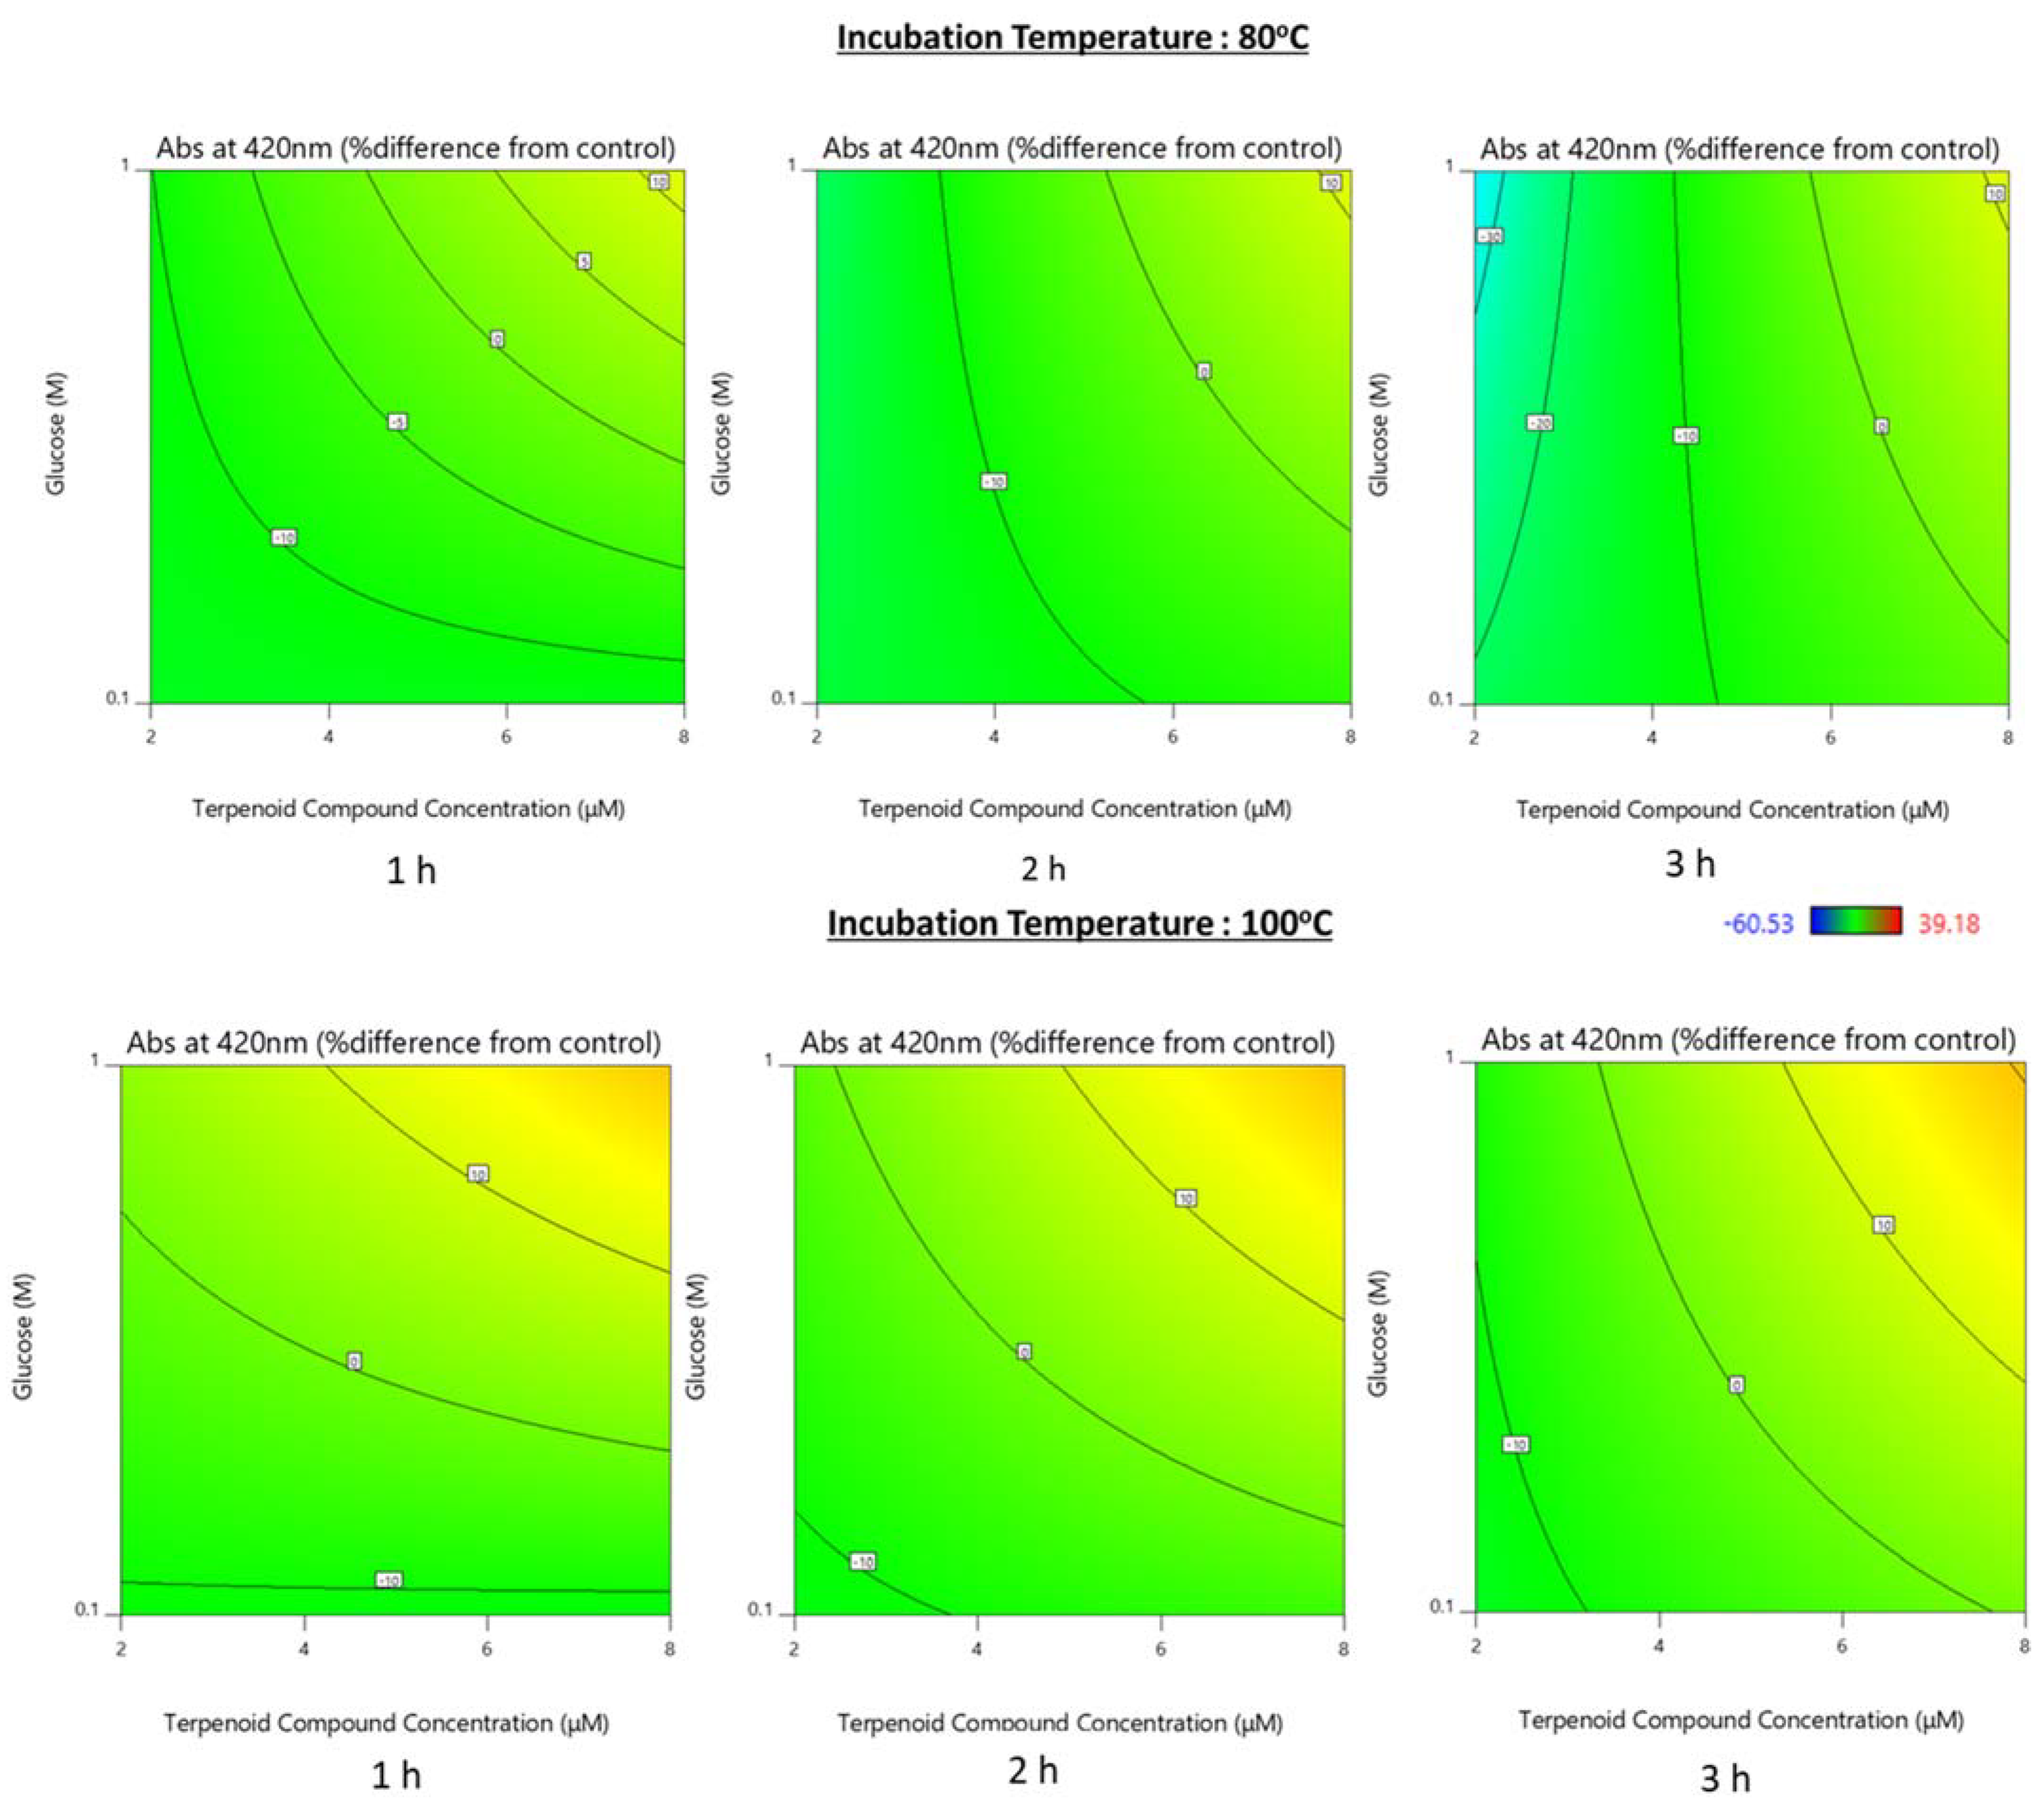
3.1.1. Color Development

The addition of terpenoid compounds during the heat treatment of the glucose/lysine solutions resulted to positive color development. All terpenoid compounds tested were associated with greater color development at all time-points. Not only color development was larger at 100 °C as indicated by the greater median values in all systems, but all systems also showed greater variability at 100 °C as indicated by the large interquartile ranges (Figure 1). Large variabilities were considered a positive finding in this study, as it indicated potential differences in the Maillard reaction process among the different study conditions.
Based on the RSM analysis, temperature was the only factor significantly and positively associated with color development (p < 0.001). No differences were seen among the different terpenoid compounds (Figure 1) or their concentration (p = 0.10 and p = 0.38 respectively).

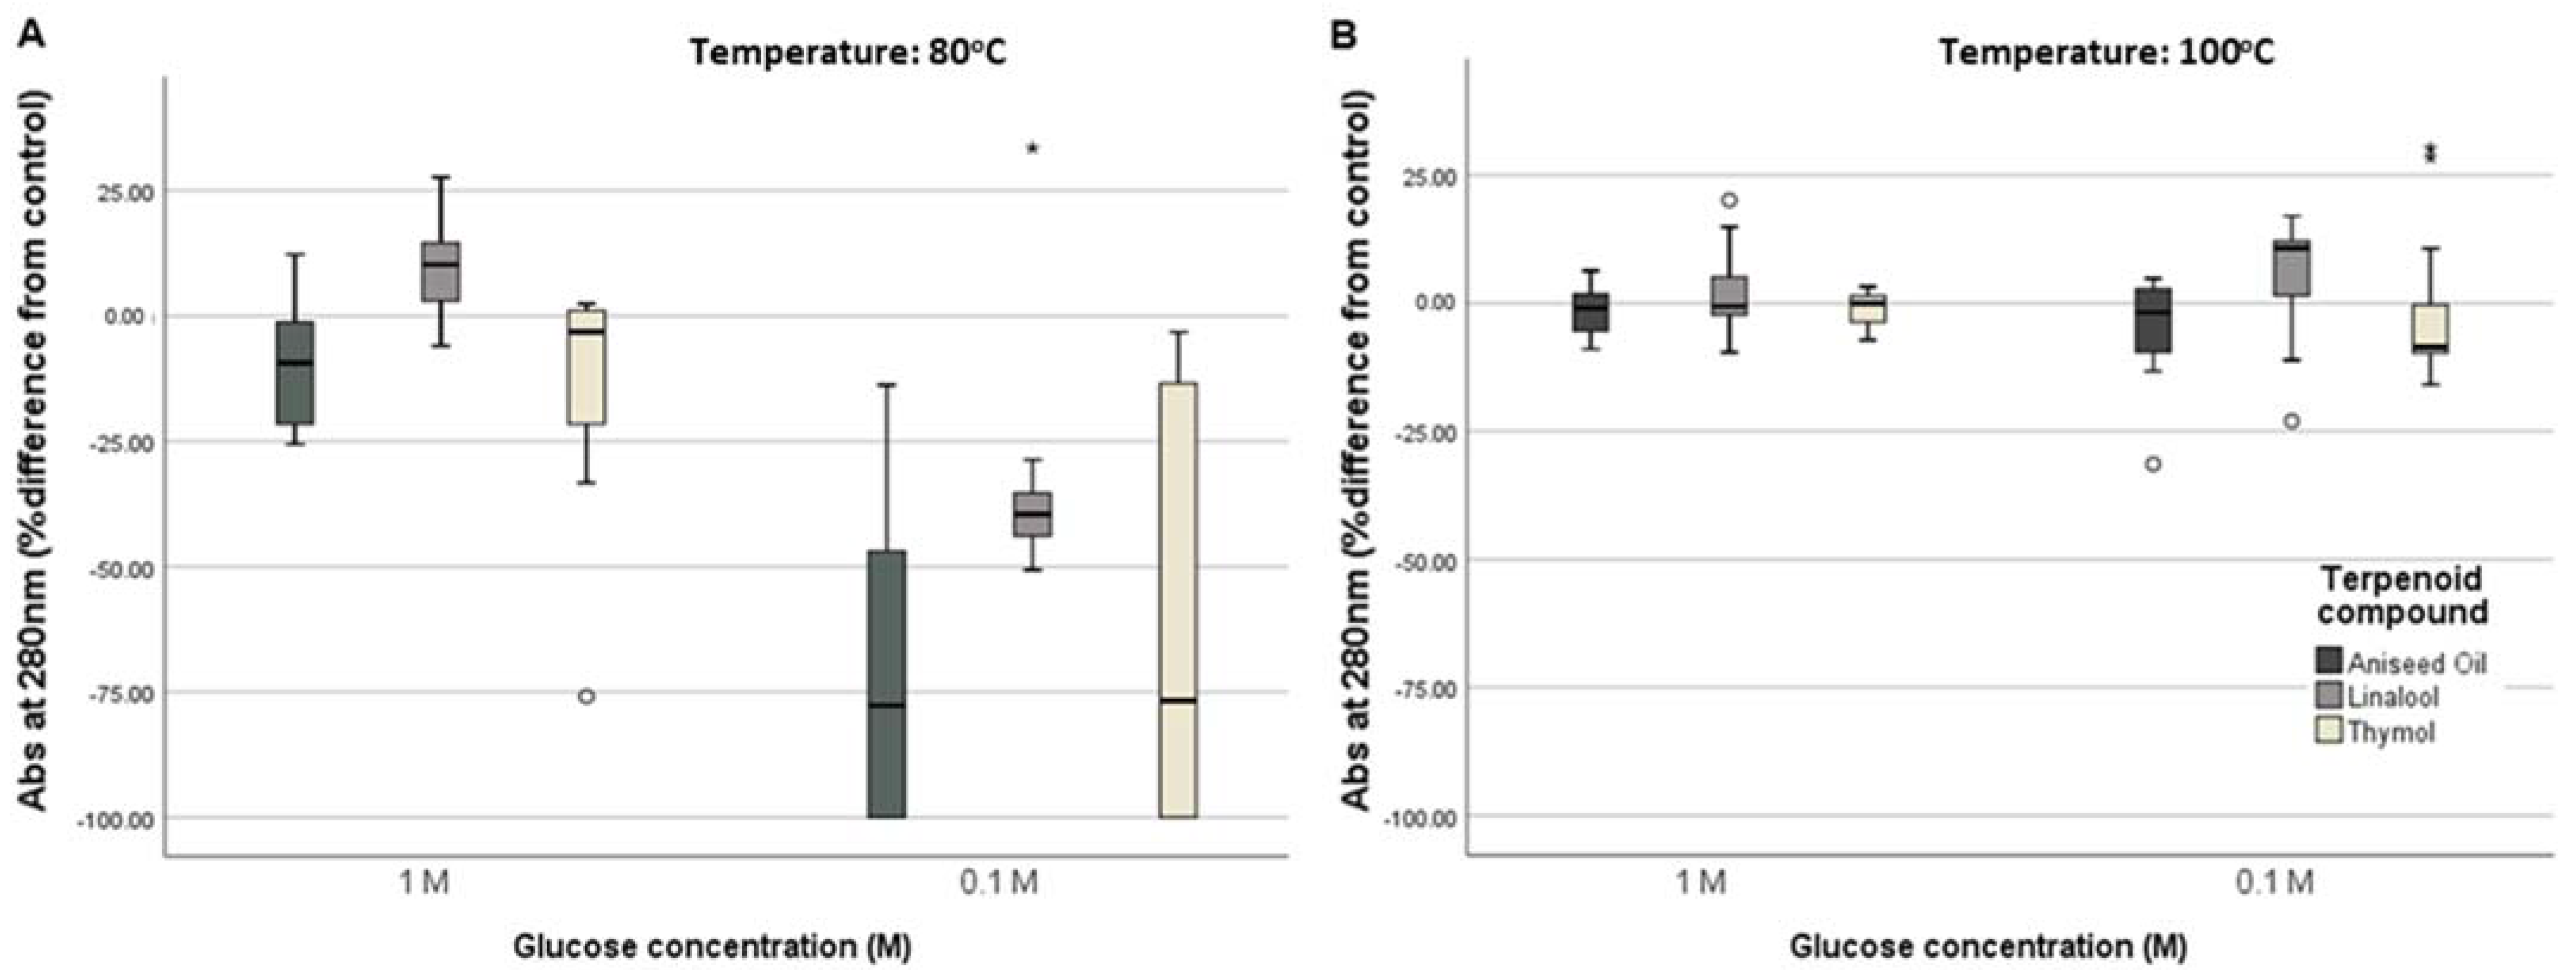
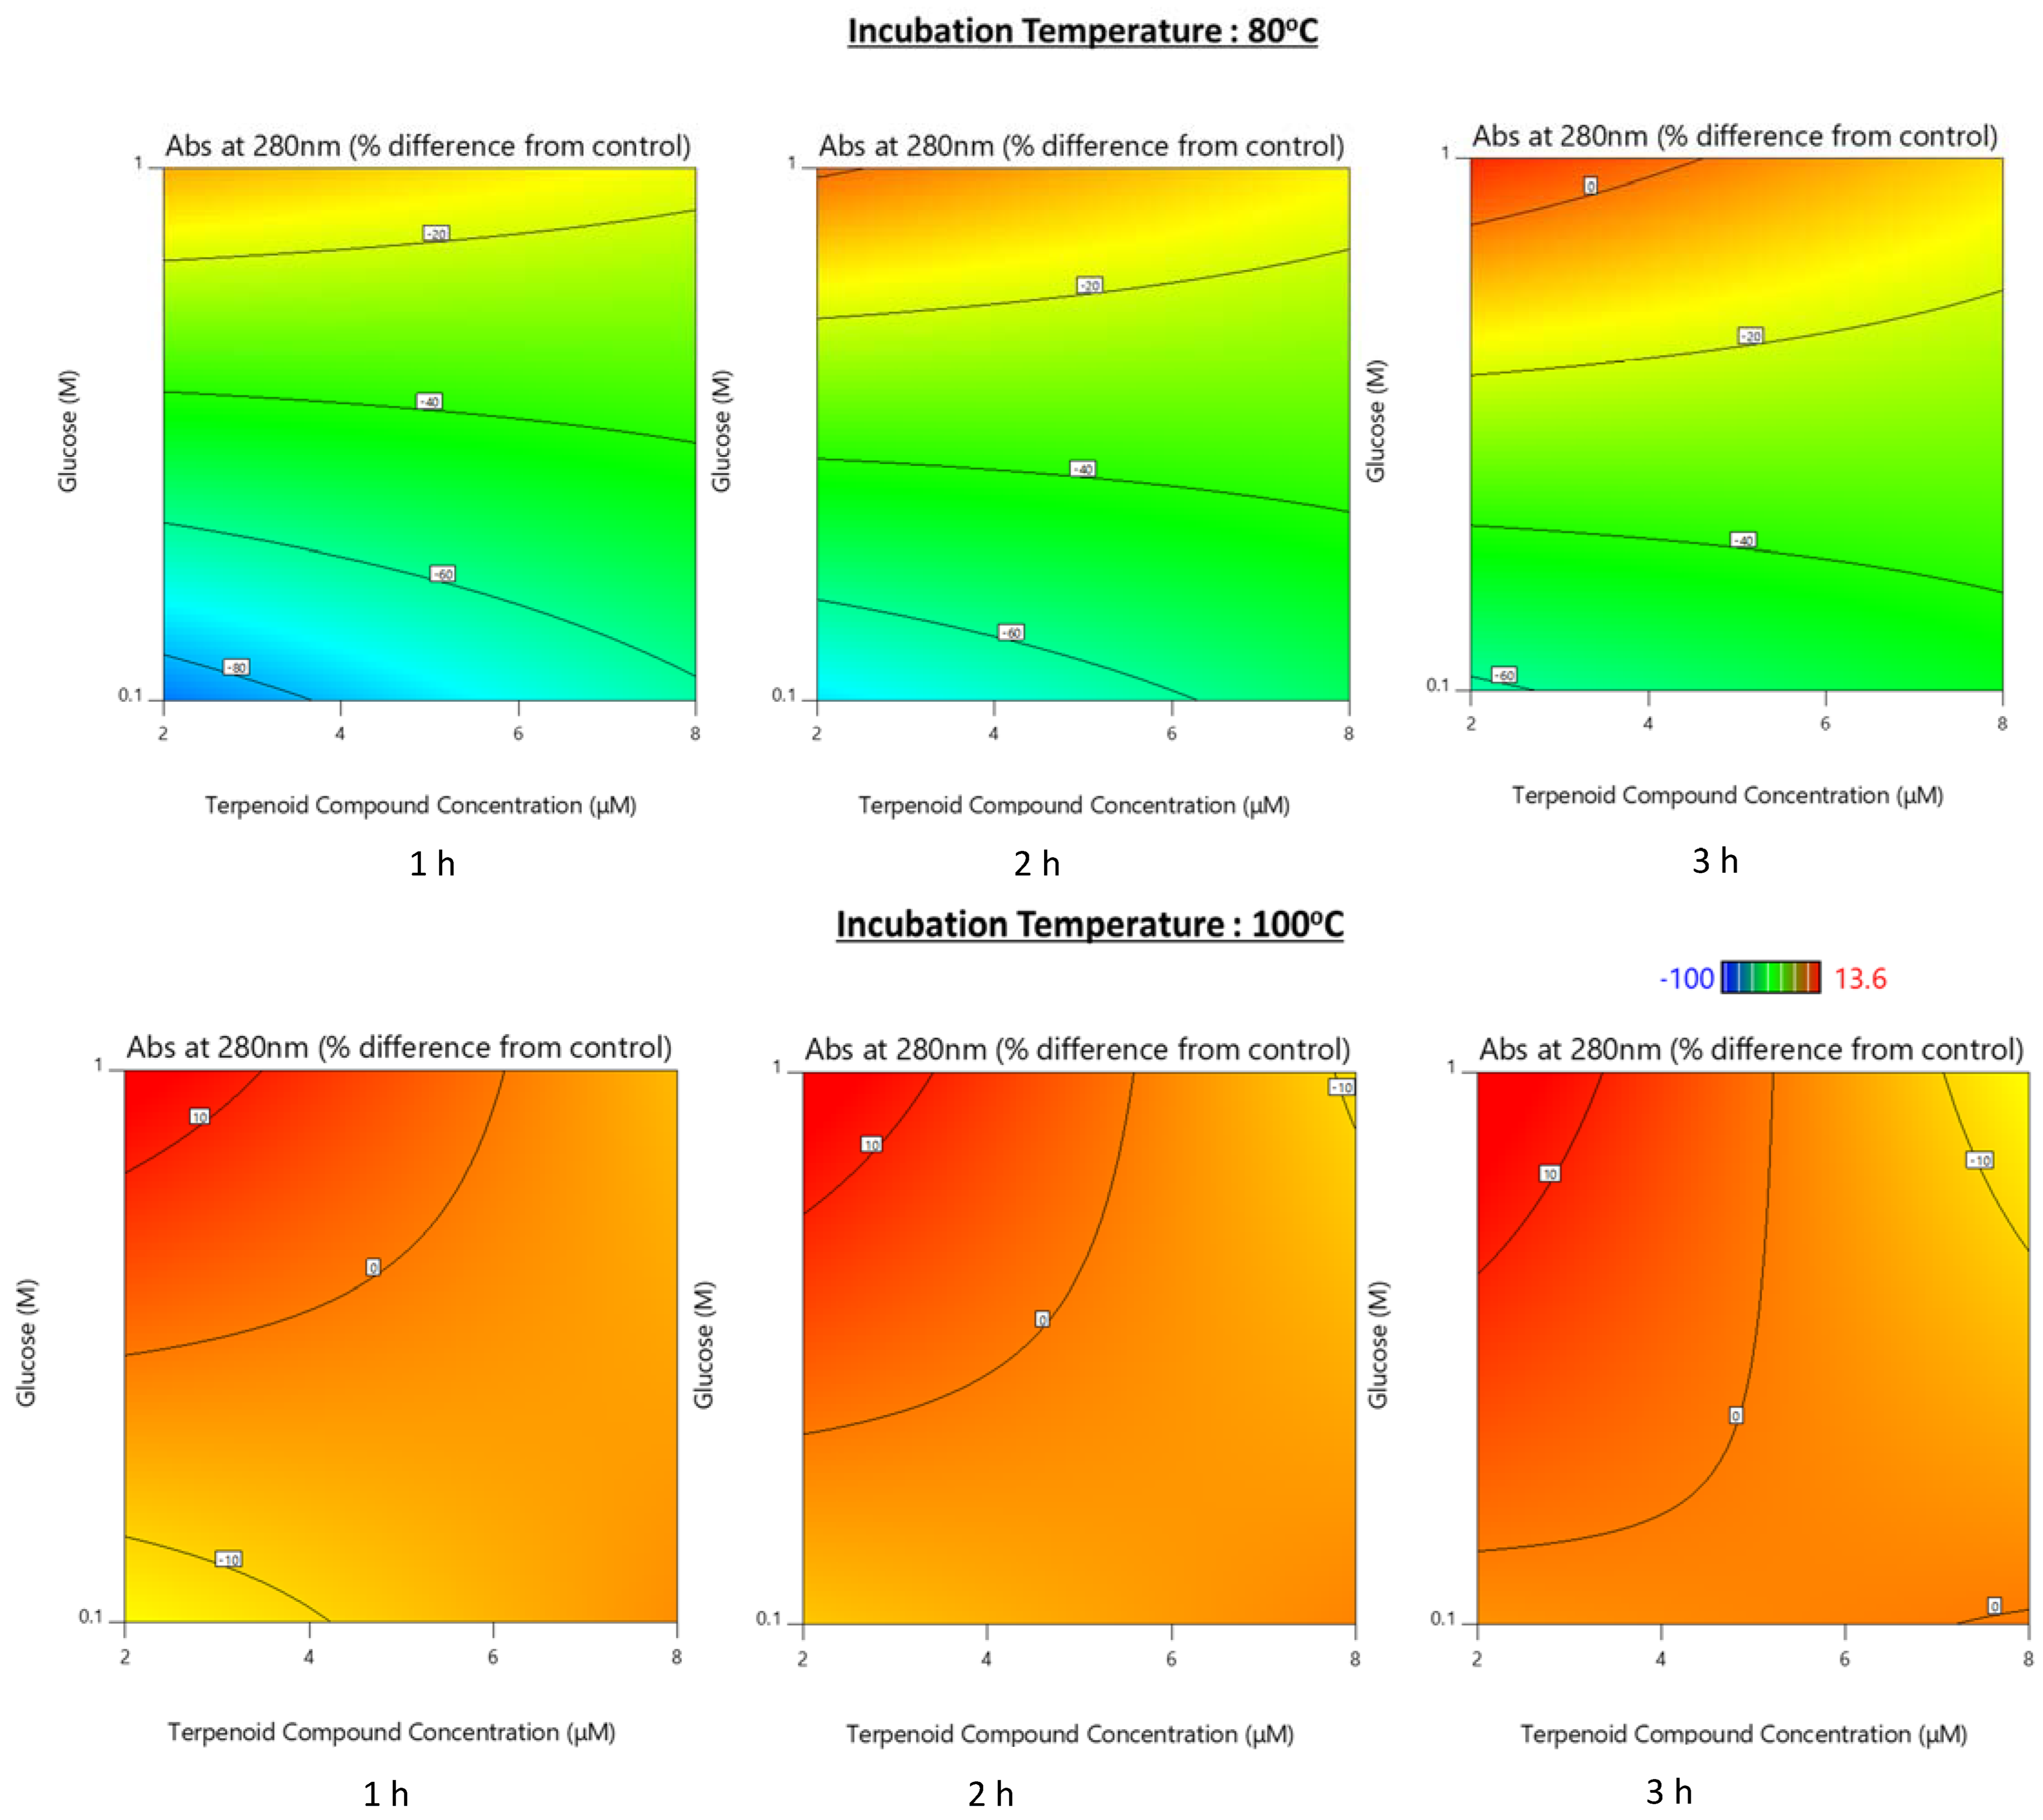
3.1.2. Assessment of the Maillard Reaction Evolution by Ultraviolet–Visible (UV–Vis) Spectroscopy

The measurement of the absorbance in specific wavelengths associated with different stages of the Maillard reactions, however, highlighted differences among the terpenoid compounds behavior. As shown in Figure 2, the terpenoid compounds tested have different effects on the absorbance measurements at 280 nm, both among them and in different incubation conditions. In 80 °C systems, aniseed oil (median—77.7%) and thymol (median—80.5%) were associated with 100% lower concentrations of early glycation products in 0.1 M glucose in the first hour of incubation (Supplementary Table S1) which were reduced over time. Linalool (median—39.6%) showed a constant association with reduced levels of early glycation products throughout the 3 h of incubation. In 1 M glucose at 80 °C, aniseed oil (median—9.35%) and thymol (median—5.35%) showed reduced inhibitory activity, if any, while linalool (median 10.25%) was associated with promotion of the early glycation product formation as early as the first hour of incubation (Supplementary Table S1). For incubations at 100 °C the effects of terpenoid compounds on early glycation products formation indicated almost no effect at 1 M glucose (for aniseed median—1.0%, for thymol median—0.15% and for linalool median—0.6%) whereas at 0.1 M glucose, thymol (median—8.7%) and aniseed oil (median—1.8%) showed small inhibitory activity. In addition, the inhibitory activity of aniseed oil and thymol was seen after 3 h of incubation at all glucose concentration (Supplementary Table S1). At 100 °C, all systems showed a much smaller variability in absorbance values at 280 nm compared to the incubations at 80 °C. At 80 °C and low glucose concentration the variability was larger as indicated by the interquartile range which was more pronounced for aniseed oil and thymol than linalool. Interestingly at 80 °C and 0.1 M glucose the net effect of all terpenoid compounds was towards reduced absorbance (inhibitory effect) (Figure 2).
The RSM model confirmed that, the choice of terpenoid compound (p = 0.001), glucose concentration (p < 0.001), temperature (p < 0.001) and time (p = 0.02) were associated with different effects on absorbance at 280 nm. Significant effects were also seen for the interactions between glucose concentration and temperature (p < 0.001), temperature and terpenoid compound (p = 0.004), glucose concentration and terpenoid compound concentration (p = 0.004) and terpenoid compound and its concentration (p = 0.046). At both temperatures, in low glucose levels (0.1 M) higher terpenoid compound concentrations were associated with reduced inhibitory capacity overtime, while the opposite effect was seen in high glucose levels (1 M) (Figure 3). These were specifically true for linalool and aniseed oil.
On the contrary overtime higher thymol concentrations were associated with higher inhibitory capacity in all temperatures and glucose levels (data not shown).
In terms of their effect on intermediate glycation products measured at 360 nm unlike what was seen at 280 nm, all systems showed a smaller variability in absorbance measurements at 360 nm at 80 °C compared to 100 °C, with the greatest variability (interquartile ranges) seen at 100 °C and 1 M glucose (Figure 4).
Aniseed oil and thymol showed 8–14% inhibitory capacity on average at 80 °C (Supplementary Table S2), with greater inhibition in lower glucose concentration (Figure 4A). At 100 °C the same terpenoid compounds showed inhibitory capacity at 2 h and 3 h of incubation (Supplementary Table S2), but only in low glucose concentrations (for aniseed median—13.35% and for thymol median—9.3%) (Figure 4Β). Aniseed oil (median 18.75%) and thymol (median 24.55%) promoted the production of intermediate glycation products at 100 °C and high glucose concentration (Figure 4B). Linalool (median—13.85%) successfully inhibited the production of intermediate glycation products at higher glucose concentrations and that only for the 2 h and 3 h timepoints (Supplementary Table S2).
According to the RSM analysis, all factors were associated with differences in absorbance at 360 nm (p < 0.02). Significant effects were also seen for the interactions between time and temperature (p = 0.03), glucose concentration and terpenoid compound concentration (p = 0.03), terpenoid compound and its concentration (p = 0.02), glucose concentration and temperature (p = 0.007), glucose concentration and terpenoid compound (p = 0.02) as well as terpenoid compound and temperature (p = 0.02).
At both temperatures, there was inhibition of the formation of intermediate glycation products at 0.1 M glucose at all time points, however there was stronger inhibitory effects with increasing time at higher glucose levels (1 M) (Figure 5). At 1 M glucose, increasing terpenoid concentration was associated with lower inhibitory effect (Figure 5). The later was seen in all terpenoid compounds tested. Interestingly, at 0.1 M glucose aniseed oil and linalool showed a positive association between terpenoid concentration and inhibitory effect (data not shown). The relationship between thymol concentration and its inhibitory effect remained negative at 0.1 M glucose as well.
At 420 nm, at 80 °C thymol showed no inhibition (at 1 M glucose median—0.5%, at 0.1 M glucose median—0.95%) compared to the other two terpenoid compounds in both glucose systems (for aniseed oil at 0.1 M median—4.25%, at 1 M glucose median—11.55% and for linalool −3.65 and −14.25, respectively). At 100 °C, linalool showed higher inhibitory effect in both glucose systems (at 0.1 M glucose median—17.5% and at 1 M glucose median—21.2%) (Figure 6B) compared to the other two terpenoids compounds tested. In the higher glucose concentration thymol promoted the production of advanced glycation products in high temperature (median 26.8%) throughout the heating time. Similar effects were seen for aniseed oil at higher glucose concentration (median 11.1%) (Supplementary Table S3). Once again, larger variability in absorbance measurements at 420 nm was seen at higher temperatures (Figure 6).
According to the RSM model, absorbance at 420 nm was influenced by glucose concentration, incubation temperature, the choice of terpenoid compound and its concentration (p < 0.003 for all). Interactions between terpenoid compound choice and its concentration, terpenoid compound and glucose concentration and terpenoid compound and temperature also significantly impacted absorbance at 420 nm (p < 0.003).
More specifically, linalool showed the greatest inhibitory capacity followed by aniseed oil, while thymol did not show any inhibitory capacity (data not shown). As far as the interactions between terpenoid concentration, glucose concentration and temperature are concerned, for all compounds tested increasing concentrations were associated with lower inhibitory capacity at 1 M glucose concentration in both temperatures (Figure 7). At 0.1 M glucose, linalool and aniseed oil showed a positive relationship between terpenoid concentration and inhibitory capacity (data not shown). However, thymol showed decreasing inhibitory capacity with higher concentration in both glucose levels (data not shown).

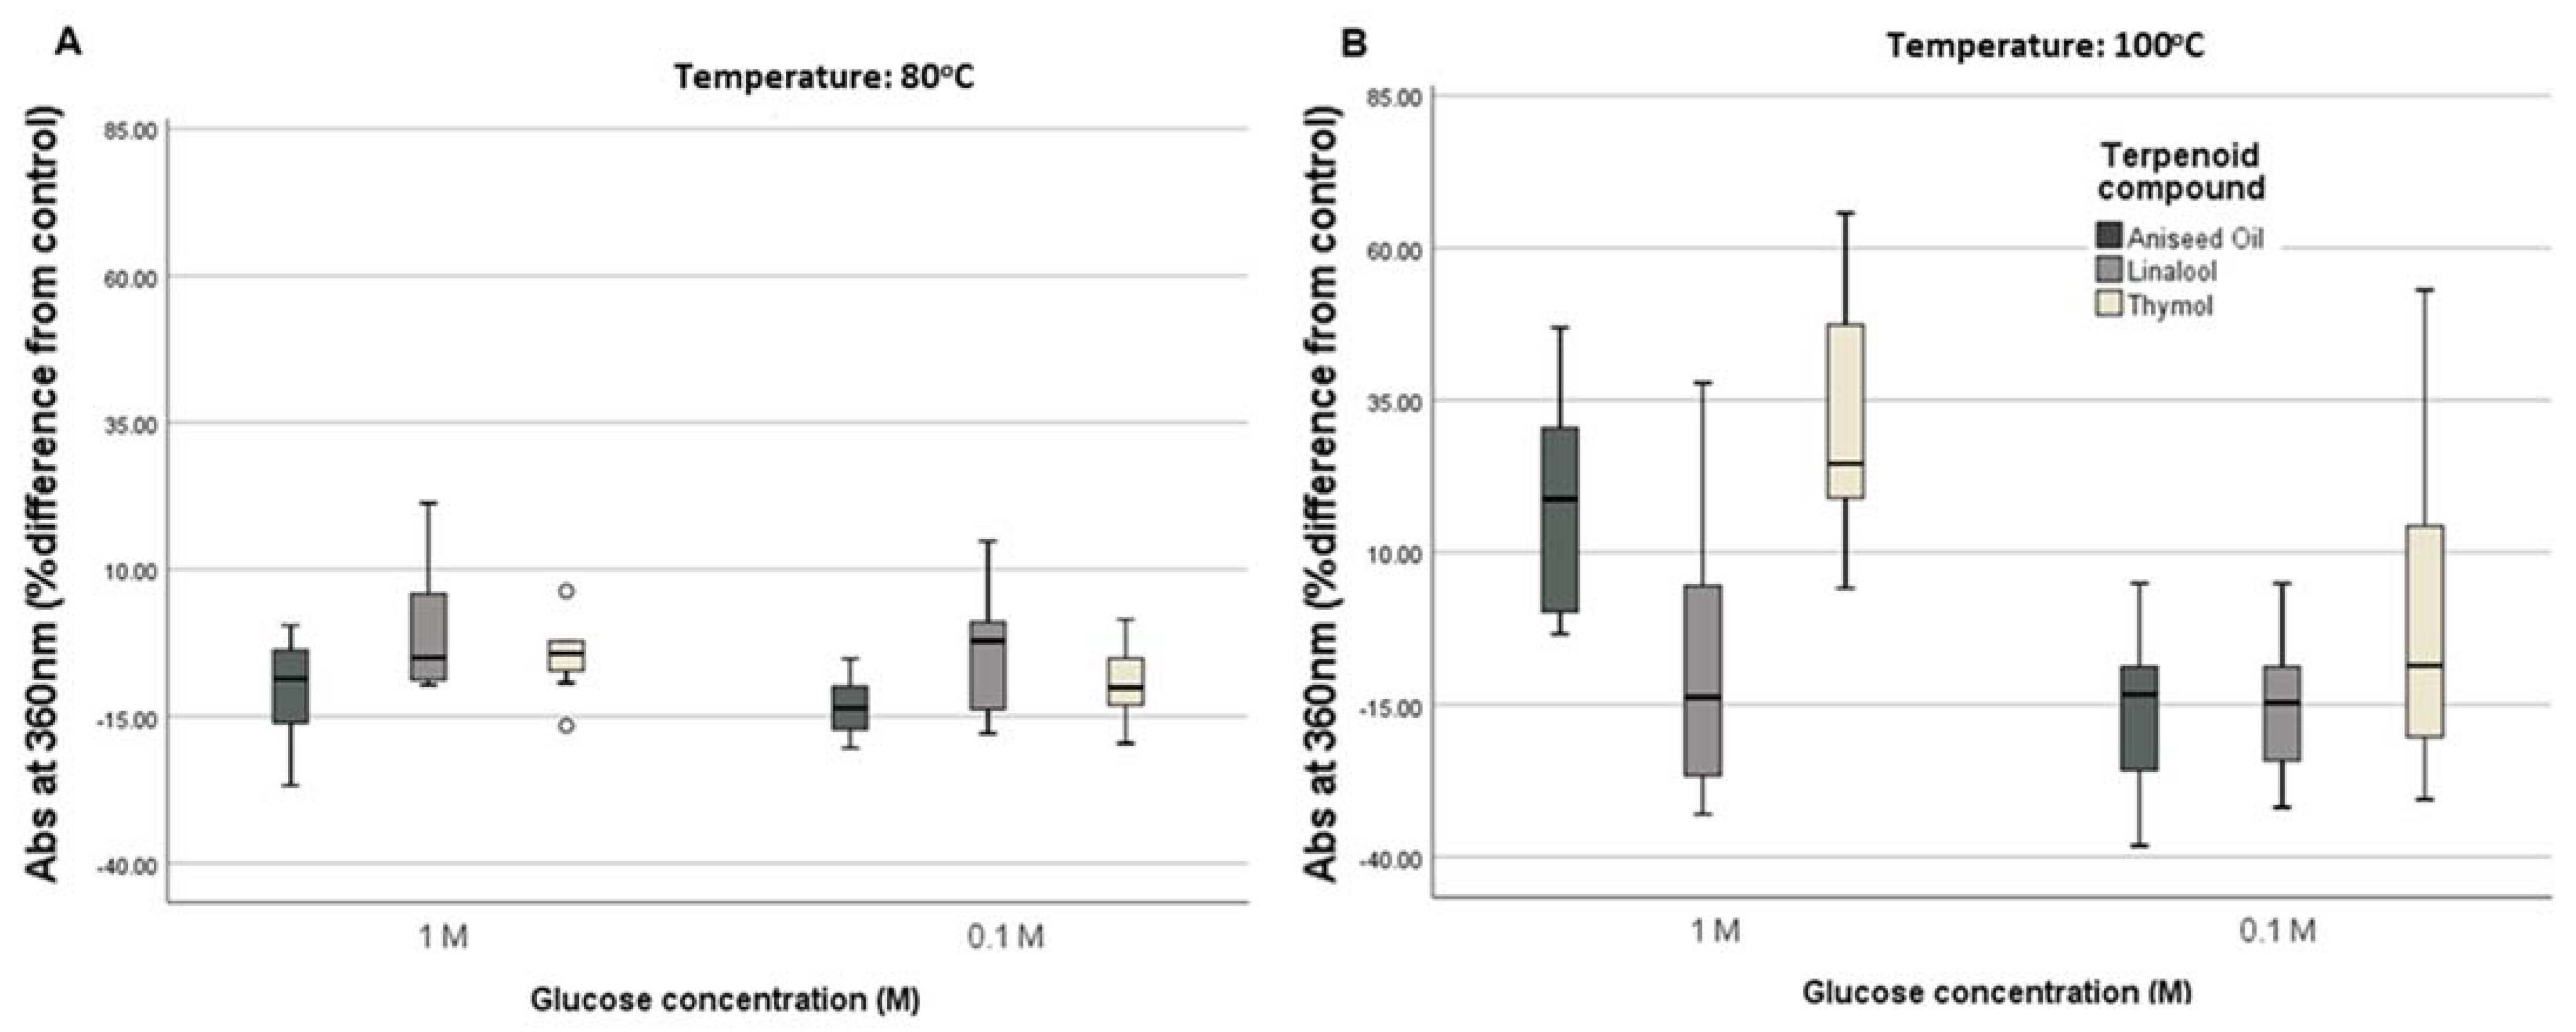
3.1.3. Measurement of Fluorescent AGEs Formation

At 80 °C terpenoid concentration was negatively associated with the inhibitory effects specifically. aniseed oil had a similar inhibitory effect at all concentrations, while for thymol and linalool showed reduced inhibitory capacity with increasing concentrations (at 80 °C).
More specifically aniseed oil showed the greatest inhibitory capacity of all three terpenoid compounds tested at 80 °C both at 0.1 M (median—25.45%) and 1 M glucose (median—14.38%), followed by thymol (for 0.1 M median—18.01% and for 1 M median—10.67%) (Figure 8A). Linalool only inhibited the production of fluorescent glycation products at 80 °C and low glucose concentrations (median—25.45%) and that after 2 h of heating (Supplementary Table S4). As far as variability is concerned, in the case of fluorescence intensity there is no clear pattern between temperatures and glucose concentrations. The highest interquartile ranges were observed at 100 °C incubation but for linalool that effect was seen at 1 M glucose, while for aniseed oil and thymol at 0.1 M glucose (Figure 8B).
The RSM showed that time, glucose concentration and temperature were significantly associated with differences in fluorescence intensity (p < 0.006 for all). The interactions between terpenoid compound and its concentration and terpenoid compound and temperature were also significant factors of fluorescence intensity (p = 0.004 and p = 0.02 respectively). A positive relationship between terpenoid concentration and inhibition of fluorescent product formation at both glucose concentration is seen at 100 °C where at 80 °C seems to be independent as increasing the heating time. Overall, inhibition of fluorescent product formation was only seen at 80 °C and not at 100 °C (Figure 9).

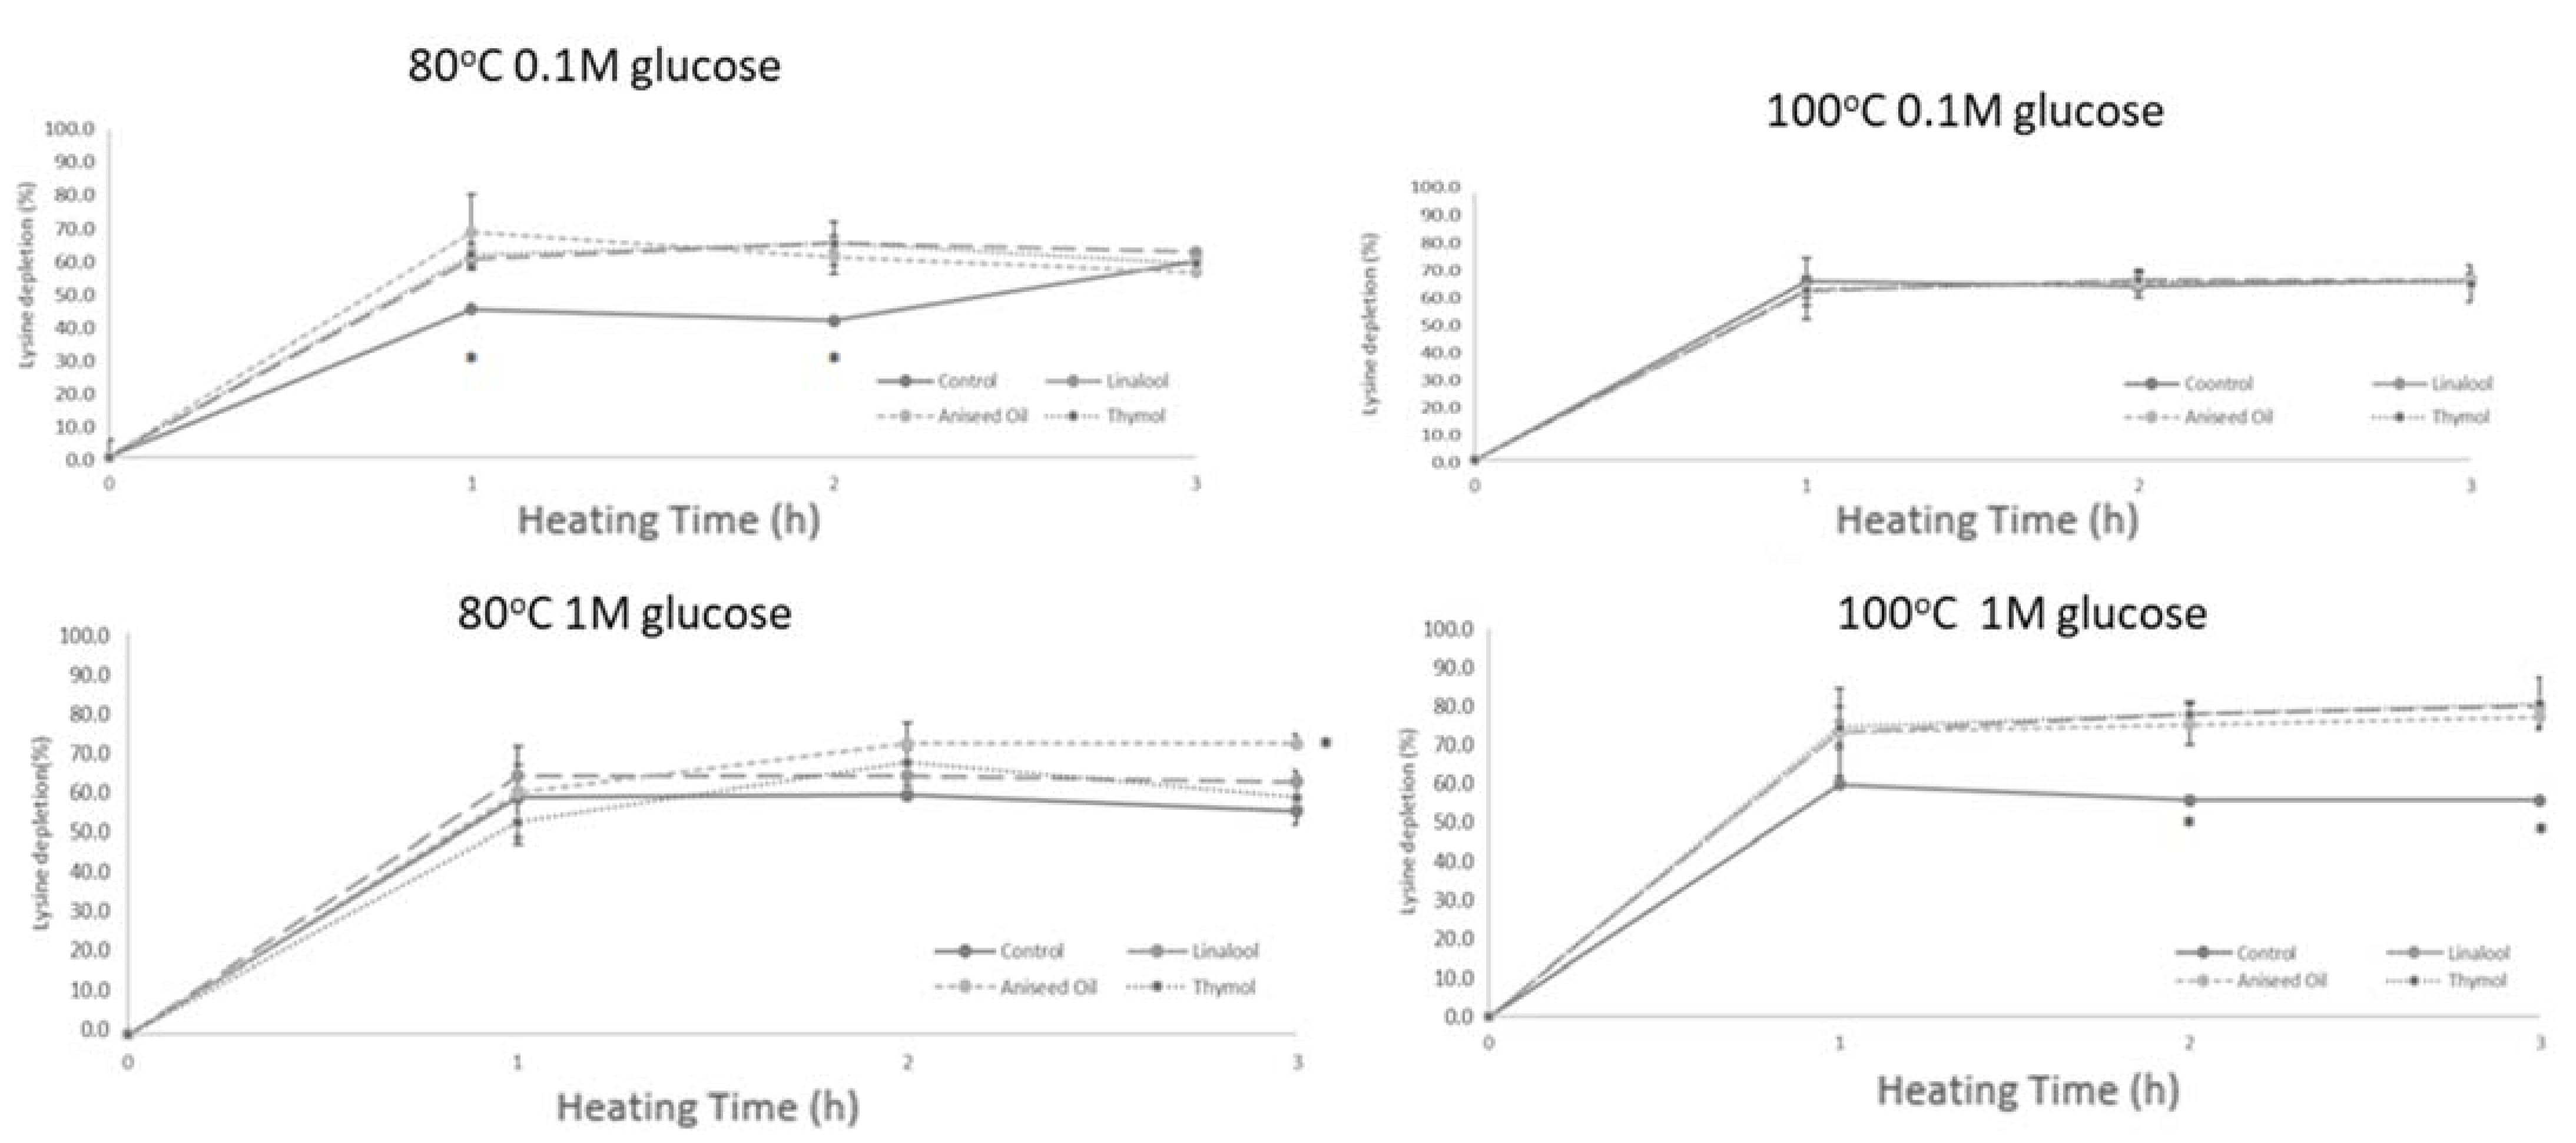
3.2. Specific Markers of Maillard Reaction—HPLC Determination of Lysine

As terpenoid compound concentration had a significant impact on the Maillard reaction products only in specific wavelengths and for the extreme terpenoid concentrations, lysine depletion was studied only in the case when 8 μM of each was added into the model systems.
In terms of the overall intensity of the Maillard reactions in the system tested, the addition of aniseed oil, linalool and thymol showed an increase in the amount of lysine lost during the three hours of heating at both 80 °C and 100 °C. As shown in Figure 10, this effect was the same among the compounds tested and the controls (p > 0.05) where the depletion of lysine reaches a plateau after the first hour of heating. In the high glucose concentration system at 100 °C lysine depletion was the highest among the conditions tested reached more than 70% after the first hour of heating.

4. Discussion

This is one of the few studies that investigate the role of terpenoid compounds on the evolution of Maillard reaction. The study highlighted a general promotion of glycation by terpenoid compounds as measured by color development and lysine depletion. However, measurement of absorbance and fluorescence intensity showed both antiglycative and proglycative capacity, depending on terpenoid compound concentration but most importantly the temperature and glucose concentration of the system. In detail, all terpenoid showed some antiglycative capacity at low glucose levels (0.1 M) and low temperatures (80 °C). In terms of effect sizes, thymol and aniseed oil showed stronger inhibitory capacity reducing the concentration of early glycation products by approximately 100% compared to the control, at least for the first hour of heating, while linalool showed much smaller inhibitory capacity if any. The RSM model allowed to test for the most desirable experimental condition in order to minimize the extent of the Maillard reactions and the production of AGEs in all five parameters tested. According to this model, for aniseed oil a system with 0.1 M glucose, 4 μΜ aniseed oil heated at 80 °C for 1 h would be the optimal solution (Desirability = 0.845). For thymol and linalool, a system with 0.1 M glucose, 2 μΜ aniseed oil heated at 80 °C for 1 h would be the optimal solution (Desirability = 0.949 and 0.713, respectively). According to the RSM analysis, the overall antiglycative capacity of the terpenoid compounds tested could be ranked Thymol > Aniseed Oil > Linalool.
Such a behavior could be attributed to the high antioxidant activity of thymol and aniseed oil. Research has highlighted that not only phenols (like thymol and carvacrol) but also compounds with methylene groups show high antioxidant activity [5]. Anethole and estragole, the main compounds of the aniseed oil, possess methylene groups on their structure which may be responsible for the observed inhibition. A pro-oxidant behavior for linalool was also observed in the same research article. On the other hand, the presence of anethole and thymol in sweet cumin were positively linked with the formation of early radical intermediates on experiment where equimolar amounts of glucose and glycine with varying amounts of pure terpenoid solutions were refluxed for 1 h [25]. The dual role of terpenoid compounds to act as antioxidant and prooxidant depending on their concentration was underlined by many researchers [4].
At the same time, a dose response relationship was rarely observed and when observed the direction of the relationship was unusual. In the cases of a dose response, it was the extreme terpenoid concentrations, of 2 μΜ and 8 μM, which showed the antiglycative activity and the middle terpenoid concentrations that showed a proglycative activity. Although the increasingly stronger antiglycative capacity with increasing terpenoid concentrations could be physiologically relevant, the fact that the smallest concentration tested in this experiment (2 μΜ) showed the same antiglycative capacity as 8 μΜ terpenoid concentrations was an unexpected finding. Previous research on the influence of terpenoid compounds on AGEs inhibition revealed that higher concentrations are more effective for such a behavior. Particularly cymene, an aromatic monoterpene, inhibited by 56.6% the total AGEs fluorescence when used at a concentration of 100 μM [24]. In the same study, the inhibitory capacity of cymene was attributed to the stabilization effect of the compound on the secondary structure of BSA. Based on our findings we could only stipulate those different mechanisms of action are responsible for the antiglycative activity at extreme terpenoid concentrations. One possible mechanism could be that the molecules antioxidant activity is linked with its antiglycative capacity at high terpenoid concentrations, whereas for the low terpenoid concentrations, mechanisms like hydrophobic binding on glycation sites should be further tested in the future [33].
Inhibition of the formation of fluorescent AGEs was only seen at 80 °C. This temperature is representative of a gentle cooking procedure as that obtained in traditional earthenware pots, consisting integral part of the Mediterranean culinary tradition [34], and it is concluded that it facilitates the action of terpenoid compounds towards inhibition of AGEs formation. On the contrary, cooking at 100 °C, representative of boiling procedure, promoted the formation of AGEs in both glucose levels.
Thymol and aniseed oil seems to have a uniform behavior toward the formation of the Amadori products during the early stage of the glycation in the equimolar system perhaps through their antioxidant and antiradical properties. Such a behavior was nοt observed in the higher glucose concentration suggesting that the compounds under investigation were nοt involved in glucose autoxidation. Previous research has showed that molecules with more than one phenolic rings such as hydroxytyrosol, and flavonoids possess the ability to act during the intermediate stages of glycation by trapping glyoxal and methylglyoxal and inhibiting AGEs formation [6,13,23]. Based on the later, thymol and aniseed oil molecules with one and none phenolic rings, respectively, are not expected to exhibit dicarbonyl trapping activities and hence would have limited impact on glucose autoxidation driven reactions.
As with many in vitro trials, this study possesses a series of questions for future research. This initial screening showed that the terpenoid compounds have both antiglycative and proglycative capacity depending on the glycation conditions and that these compounds may be modulating glycation in more than one mechanism. Although these findings are interesting, the study of mechanisms of action as well as the translation of the current findings to actual foods would require the experiments to be repeated in model systems using intact protein molecules like albumin. Especially the possibility of terpenoid–amino acid interactions that allow for binding and the creation of a physical barrier around glycation sites could only be tested in systems involving intact protein molecules.
Furthermore, if dose–response is a factor of interest, then future research should focus either on larger terpenoid concentrations than the ones tested herein, or even more to study terpenoid concentrations potentially smaller than 2 μΜ and understand their impact on protein glycation. As essential oils are rarely added in foods, small dose of these terpenoid compounds have a larger relevance to the conditions of thermal processing of foods. As terpenoid rich herbs and spices are often added during the thermal processing of foods, the final food is enriched in the terpenoid compounds of the herb/spice but during cooking the transfer of lipophilic compounds from the herb/spice to the food system is likely to be small. The addition of more objective markers of glycation like the measurement of dicarbonyl compounds and cross-link agents, even the production of reactive oxygen species would be an important addition to better describe the chemical transformations taking place in these systems.
Despite those limitations, this study is still valuable as it is to our knowledge the first study to simultaneously study the impact of five experimental conditions (glucose, temperature, time, terpenoid compounds and terpenoid compound dose) on lysine glycation. It is this design that allowed the detection of the opposing behavior of terpenoid compounds on glycation markers based on the experimental conditions and to pose novel research questions that could further explore the potential of terpenoid compounds to be used as antiglycative agents during thermal processing.

5. Conclusions

Terpenoid compounds commonly found in essential oils have the capacity to regulate Maillard reactions observed as a promotion of color development and lysine depletion in model systems. The qualitative impact of those compounds on specific stages of the Maillard reaction, however, is more complex including both anti- and pro-glycative effects which are dependent on the incubation conditions.

Supplementary Materials

The following are available online at https://0-www-mdpi-com.brum.beds.ac.uk/article/10.3390/app12020908/s1, Table S1: Raw values of absorbance at 280 nm at 1, 2, 3 h for model systems with various concentrations of terpenoid compounds, in two different glucose concentrations and in two different temperatures; Table S2: Raw values of absorbance at 360 nm at 1, 2, 3 h for model systems with various concentrations of terpenoid compounds, in two different glucose concentrations and in two different temperatures; Table S3: Raw values of absorbance at 420 nm at 1, 2, 3 h for model systems with various concentrations of terpenoid compounds, in two different glucose concentrations and in two different temperatures; Table S4: Raw values of fluorescence intensity at λexc = 370 nm, λemm = 440 nm at 1, 2, 3 h for model systems with various concentrations of terpenoid compounds, in two different glucose concentrations and in two different temperatures.

Author Contributions

Conceptualization, C.G.; methodology, C.G., A.V., A.M. and T.M.; software, T.M., A.V. and C.G.; formal analysis, T.M. and A.V.; investigation, T.M., A.P. and C.G.; resources, M.K.; data curation, A.V., C.G. and T.M.; writing—original draft preparation, A.V. and C.G.; writing—review and editing, A.V., G.P. and C.G.; visualization, G.P., A.V. and C.G.; supervision, C.G.; project administration, C.G. All authors have read and agreed to the published version of the manuscript.

Funding

This research received no external funding. AV is co-funded by Greece and the European Union (European Social Fund—ESF) through the Operational Programme «Human Resources Development, Education and Lifelong Learning» in the context of the project “Reinforcement of Postdoctoral Researchers—2nd Cycle” (MIS-5033021), implemented by the State Scholarships Foundation (ΙΚΥ).

Institutional Review Board Statement

Not applicable.

Informed Consent Statement

Not applicable.

Data Availability Statement

All raw data are presented in the supplement.

Acknowledgments

The authors would like to thank Panagiota-Kyriaki Revelou for the support in the RSM analysis.

Conflicts of Interest

The authors declare no conflict of interest.

References

  1. Figueiredo, A.C.; Barroso, J.G.; Pedro, L.G.; Scheffer, J.J.C. Factors affecting secondary metabolite production in plants: Volatile components and essential oils. Flavour Fragr. J. 2008, 23, 213–226. [Google Scholar] [CrossRef]
  2. Naeem, A.; Abbas, T.; Ali, T.M.; Hasnain, A. Essential oils: Brief background and uses. Ann. Short Rep. 2018, 1, 6. [Google Scholar]
  3. Graßmann, J. Terpenoids as Plant Antioxidants. In Vitamins & Hormones; Elsevier: Amsterdam, The Netherlands, 2005; Volume 72, pp. 505–535. ISBN 978-0-12-709872-2. [Google Scholar]
  4. Gonzalez-Burgos, E.; Gomez-Serranillos, M.P. Terpene Compounds in Nature: A review of their potential antioxidant activity. Curr. Med. Chem. 2012, 19, 5319–5341. [Google Scholar] [CrossRef]
  5. Ruberto, G.; Baratta, M.T. Antioxidant activity of selected essential oil components in two lipid model systems. Food Chem. 2000, 69, 167–174. [Google Scholar] [CrossRef]
  6. Navarro, M.; Morales, F.J. In vitro investigation on the antiglycative and carbonyl trapping activities of hydroxytyrosol. Eur. Food Res. Technol. 2016, 242, 1101–1110. [Google Scholar] [CrossRef] [Green Version]
  7. Nowotny, K.; Schröter, D.; Schreiner, M.; Grune, T. Dietary advanced glycation end products and their relevance for human health. Ageing Res. Rev. 2018, 47, 55–66. [Google Scholar] [CrossRef]
  8. Peng, X.; Ma, J.; Chen, F.; Wang, M. Naturally occurring inhibitors against the formation of advanced glycation end-products. Food Funct. 2011, 2, 289–301. [Google Scholar] [CrossRef]
  9. Hidalgo, F.J.; Zamora, R. Interplay between the maillard reaction and lipid peroxidation in biochemical systems. Ann. N. Y. Acad. Sci. 2005, 1043, 319–326. [Google Scholar] [CrossRef] [PubMed]
  10. Nguyen, H.T.; Van Der Fels-Klerx, H.J.; Van Boekel, M.A.J.S. Nϵ-(carboxymethyl)lysine: A review on analytical methods, formation, and occurrence in processed food, and health impact. Food Rev. Int. 2014, 30, 36–52. [Google Scholar] [CrossRef]
  11. Wei, Q.; Liu, T.; Sun, D.-W. Advanced glycation end-products (AGEs) in foods and their detecting techniques and methods: A review. Trends Food Sci. Technol. 2018, 82, 32–45. [Google Scholar] [CrossRef]
  12. Delgado-Andrade, C. Carboxymethyl-lysine: Thirty years of investigation in the field of AGE formation. Food Funct. 2016, 7, 46–57. [Google Scholar] [CrossRef] [PubMed]
  13. Khan, M.; Liu, H.; Wang, J.; Sun, B. Inhibitory effect of phenolic compounds and plant extracts on the formation of advance glycation end products: A comprehensive review. Food Res. Int. 2020, 130, 108933. [Google Scholar] [CrossRef]
  14. Uribarri, J.; Del Castillo, M.D.; De La Maza, M.P.; Filip, R.; Gugliucci, A.; Luevano-Contreras, C.; Macías-Cervantes, M.H.; Markowicz Bastos, D.H.M.; Medrano, A.; Menini, T.; et al. Dietary advanced glycation end products and their role in health and disease. Adv. Nutr. 2015, 6, 461–473. [Google Scholar] [CrossRef] [PubMed]
  15. Meeprom, A.; Sompong, W.; Chan, C.B.; Adisakwattana, S. Isoferulic Acid, a new anti-glycation agent, inhibits fructose- and glucose-mediated protein glycation in vitro. Molecules 2013, 18, 6439–6454. [Google Scholar] [CrossRef] [Green Version]
  16. Sadowska-Bartosz, I.; Bartosz, G. Prevention of protein glycation by natural compounds. Molecules 2015, 20, 3309–3334. [Google Scholar] [CrossRef] [PubMed]
  17. Adisakwattana, S.; Sompong, W.; Meeprom, A.; Ngamukote, S.; Yibchok-Anun, S. Cinnamic acid and its derivatives inhibit fructose-mediated protein glycation. Int. J. Mol. Sci. 2012, 13, 1778–1789. [Google Scholar] [CrossRef] [PubMed]
  18. Liu, H.; Chen, X.; Zhang, D.; Wang, J.; Wang, S.; Sun, B. Effects of highland barley bran extract rich in phenolic acids on the formation of Nε-Carboxymethyllysine in a biscuit model. J. Agric. Food Chem. 2018, 66, 1916–1922. [Google Scholar] [CrossRef] [PubMed]
  19. Wang, Y.; Liu, H.; Zhang, D.; Liu, J.; Wang, J.; Wang, S.; Sun, B. Baijiu vinasse extract scavenges glyoxal and inhibits the formation of Nε-Carboxymethyllysine in dairy food. Molecules 2019, 24, 1526. [Google Scholar] [CrossRef] [Green Version]
  20. Sadowska-Bartosz, I.; Galiniak, S.; Bartosz, G. Kinetics of Glycoxidation of Bovine Serum Albumin by Glucose, Fructose and Ribose and Its Prevention by Food Components. Molecules 2014, 19, 18828–18849. [Google Scholar] [CrossRef] [Green Version]
  21. Liu, W.; Ma, H.; Frost, L.; Yuan, T.; Dain, J.A.; Seeram, N.P. Pomegranate phenolics inhibit formation of advanced glycation endproducts by scavenging reactive carbonyl species. Food Funct. 2014, 5, 2996–3004. [Google Scholar] [CrossRef]
  22. Ho, S.-C.; Chang, P.-W.; Tong, H.-T.; Yu, P.-Y. Inhibition of fluorescent advanced glycation end-products and N-Carboxymethyllysine formation by several floral herbal infusions. Int. J. Food Prop. 2014, 17, 617–628. [Google Scholar] [CrossRef] [Green Version]
  23. Navarro, M.; Morales, F.J. Mechanism of reactive carbonyl species trapping by hydroxytyrosol under simulated physiological conditions. Food Chem. 2015, 175, 92–99. [Google Scholar] [CrossRef] [PubMed]
  24. Joglekar, M.M.; Panaskar, S.N.; Chougale, A.D.; Kulkarni, M.J.; Arvindekar, A.U. A novel mechanism for antiglycative action of limonene through stabilization of protein conformation. Mol. BioSyst. 2013, 9, 2463–2472. [Google Scholar] [CrossRef] [PubMed]
  25. Chawla, H.M.; Sahu, S.N. Effect of spice essential oils on maillard browning model reaction of glucose and glycine: An uv-visible and reverse phase hplc analysis. J. Food Sci. Technol. 2007, 44, 602–606. [Google Scholar]
  26. Kamatou, G.P.P.; Viljoen, A.M. Linalool–a review of a biologically active compound of commercial importance. Nat. Prod. Commun. 2008, 3, 1934578X0800300727. [Google Scholar] [CrossRef] [Green Version]
  27. Li, H.; Wu, C.-J.; Yu, S.-J. Impact of microwave-assisted heating on the ph value, color, and flavor compounds in glucose-ammonium model system. Food Bioprocess Technol. 2018, 11, 1248–1258. [Google Scholar] [CrossRef]
  28. Delgado-Andrade, C.; Seiquer, I.; Haro, A.; Castellano, R.; Navarro, M.P. Development of the maillard reaction in foods cooked by different techniques. Intake of maillard-derived compounds. Food Chem. 2010, 122, 145–153. [Google Scholar] [CrossRef]
  29. Zhang, M.; Zhang, Y.; Ren, S.; Zhang, Z.; Wang, Y.; Song, R. Optimization of a precolumn OPA derivatization HPLC assay for monitoring of l-Asparagine depletion in serum during l-Asparaginase therapy. J. Chromatogr. Sci. 2018, 56, 794–801. [Google Scholar] [CrossRef] [Green Version]
  30. KNAUER Determination of Amino Acids by UHPLC with Automated OPADerivatization by the Autosampler. Available online: https://www.knauer.net/Application/application_notes/vbs0029n_opa_amino_acids_uhplc_1310.pdf (accessed on 9 November 2021).
  31. Phenomenex HPLC Application #23092: Amino Acid Analysis Using OPA on Kinetex 5u EVO C18 150 × 4.6 mm. Available online: https://www.phenomenex.com/Application/Detail/23092 (accessed on 9 November 2021).
  32. Pukelsheim, F. Optimal Design of Experiments; SIAM: New York, NY, USA, 2006; ISBN 0-89871-604-7. [Google Scholar]
  33. Vlassopoulos, A.; Lean, M.E.J.; Combet, E. Protein–phenolic interactions and inhibition of glycation–combining a systematic review and experimental models for enhanced physiological relevance. Food Funct. 2014, 5, 2646–2655. [Google Scholar] [CrossRef] [Green Version]
  34. Pellegrini, N.; Fogliano, V. Cooking, industrial processing and caloric density of foods. Curr. Opin. Food Sci. 2017, 14, 98–102. [Google Scholar] [CrossRef]
Figure 1. The effect of terpenoid compounds on color development in heated glucose/lysine solutions at 0.1 M and 1 M glucose at pH 7.2 and (A) 80 °C and (B) 100 °C. Symbols (*, °) outside the boxplots indicate outliers.
Applsci 12 00908 g001
Figure 2. The effect of terpenoid compounds on early glycation products formation (280 nm) in heated glucose/lysine solutions at 0.1 M and 1 M glucose at pH 7.2 and (A) 80 °C and (B) 100 °C. Symbols (*, **, °) outside the boxplots indicate outliers.
Applsci 12 00908 g002
Figure 3. The effect of terpenoid compound concentration and glucose concentration on early glycation products formation (280 nm) expressed as percentage difference from control (no terpenoid compound added) at pH 7.2 and 80 °C and 100 °C. Figures indicate average values of all three terpenoid compounds (linalool, aniseed oil and thymol).
Applsci 12 00908 g003
Figure 4. The effect of terpenoid compounds on intermediate glycation products formation (360 nm) in heated glucose/lysine solutions at 0.1 M and 1 M glucose at pH 7.2 and (A) 80 °C and (B) 100 °C. Symbols (°) outside the boxplots indicate outliers.
Applsci 12 00908 g004
Figure 5. The effect of terpenoid compound concentration and glucose concentration on intermediate glycation products formation (360 nm) expressed as percentage difference from control (no terpenoid compound added) at pH 7.2 and 80 °C and 100 °C. Figures indicate average values of all three terpenoid compounds (linalool, aniseed oil and thymol).
Applsci 12 00908 g005
Figure 6. The effect of terpenoid compounds on advanced glycation products formation (420 nm) in heated glucose/lysine solutions at 0.1 M and 1 M glucose at pH 7.2 and (A) 80 °C and (B) 100 °C. Symbols outside the boxplots indicate outliers.
Applsci 12 00908 g006
Figure 7. The effect of terpenoid compound concentration and glucose concentration on advanced glycation products formation (420 nm) expressed as percentage difference from control (no terpenoid compound added) at pH 7.2 and 80 °C and 100 °C. Figures indicate average values of all three terpenoid compounds (linalool, aniseed oil and thymol).
Applsci 12 00908 g007
Figure 8. The effect of terpenoid compounds on fluorescence intensity at λexc = 370 nm, λemm = 440 nm in heated glucose/lysine solutions at 0.1 M and 1 M glucose at pH 7.2 and (A) 80 °C and (B) 100 °C. Symbols (*,°) outside the boxplots indicate outliers.
Applsci 12 00908 g008
Figure 9. The effect of terpenoid compound concentration and glucose concentration on fluorescence intensity expressed as percentage difference from control (no terpenoid compound added) at pH 7.2 and 80 °C and 100 °C. Figures indicate average values of all three terpenoid compounds (linalool, aniseed oil and thymol).
Applsci 12 00908 g009
Figure 10. The effect of terpenoid compounds on lysine depletion in heated glucose/lysine solutions at 0.1 M and 1 M glucose at pH 7.2 and 80 °C and 100 °C. * Denotes p < 0.05 control vs. terpenoid compound.
Applsci 12 00908 g010
Table 1. Independent experimental factors and design layout runs.
RunA: TimeB: Terpenoid Compound ConcentrationC: Glucose ConcentrationD: TemperatureE: Terpenoid Compound
UnitsHrμΜM°C-
1240.1100Linalool
2341100Linalool
322180Linalool
4280.1100Linalool
5260.180Thymol
6180.1100Thymol
7381100Aniseed Oil
812180Linalool
9261100Thymol
10261100Thymol
11340.180Linalool
12380.180Aniseed Oil
13160.180Linalool
14260.180Thymol
15360.1100Thymol
16180.180Thymol
17161100Linalool
1814180Thymol
19320.1100Aniseed Oil
2016180Linalool
21220.1100Thymol
22260.1100Aniseed Oil
23220.1100Thymol
24120.180Aniseed Oil
2532180Thymol
26341100Linalool
2734180Aniseed Oil
28120.1100Linalool
2918180Aniseed Oil
30260.1100Aniseed Oil
3126180Aniseed Oil
32121100Aniseed Oil
3338180Linalool
Publisher’s Note: MDPI stays neutral with regard to jurisdictional claims in published maps and institutional affiliations.

