
Comparison Uncertainty of Different Types of Membership Functions in T2FLS: Case of International Financial Market


1
Institute of Informatics, Faculty of Business and Management, Brno University of Technology, 61200 Brno, Czech Republic
2
Faculty of Economic Informatics, University of Economics in Bratislava, 85235 Bratislava, Slovakia
*
Author to whom correspondence should be addressed.
Appl. Sci. 2022, 12(2), 918; https://0-doi-org.brum.beds.ac.uk/10.3390/app12020918
Submission received: 3 December 2021
/
Revised: 8 January 2022
/
Accepted: 10 January 2022
/
Published: 17 January 2022
(This article belongs to the Special Issue Women in Artificial intelligence (AI))
Abstract
:This article deals with the determination and comparison of different types of functions of the type-2 interval of fuzzy logic, using a case study on the international financial market. The model is demonstrated on the time series of the leading stock index DJIA of the US market. Type-2 Fuzzy Logic membership features are able to include additional uncertainty resulting from unclear, uncertain or inaccurate financial data that are selected as inputs to the model. Data on the financial situation of companies are prone to inaccuracies or incomplete information, which is why the type-2 fuzzy logic application is most suitable for this type of financial analysis. This paper is primarily focused on comparing and evaluating the performance of different types of type-2 fuzzy membership functions with integrated additional uncertainty. For this purpose, several model situations differing in shape and level or degree of uncertainty of membership functions are constructed. The results of this research show that type-2 fuzzy sets with dual membership functions is a suitable expert system for highly chaotic and unstable international stock markets and achieves higher accuracy with the integration of a certain level of uncertainty compared to type-1 fuzzy logic.
1. Introduction
Fuzzy set theory was first introduced by Lotfi Zadeh in the 1960s as a way to capture the uncertainty and ambiguity often overlooked in complex systems. It can be considered as a generalization of the theory of classical sets. As research into fuzzy logic continues, fuzzy sets (FS) are gradually being refined to better reflect the original idea of modeling linguistic variables, which builds on the pillars of inaccuracy, vagueness and ambiguity that arise in language variables. This resulted in three main streams of fuzzy set representation: (a) type-1 fuzzy set (T1FS); (b) general type-2 fuzzy sets (GT2FS); (c) interval type-2 fuzzy sets (IT2FS). However, the computations with type-2 fuzzy sets are complex [1]. To solve this, simplification of type-2 is conducted through a special kind of type-2 fuzzy set called interval type-2 fuzzy set. Interval type-2 fuzzy sets manage uncertainty in membership functions, but computations are less intense, keeping the capabilities to process uncertainties [2,3]. The first mentioned fuzzy sets are considered to be a very simplified form of representation of linguistic variables, which is able to integrate exclusively a certain degree of uncertainty according to [4,5], while type-2 interval fuzzy sets are able to integrate uncertainty in the form of intervals, thus not limiting the level of uncertainty. Although IT2FS are more computationally intensive and more complex to design, according to [6], these sets are better able to deal with the additional noise and the nonlinear and chaotic environment of input data from various disciplines.
The reason for the widespread use and ever-increasing popularity of fuzzy logic in many scientific fields lies in the fact that it is able to better understand human thinking and, above all, is able to process uncertain, ambiguous and incomplete data. The selection and setting of the correct membership functions and the determination of the relevant fuzzy rules on the basis of which the model provides outputs is absolutely essential for the correct and accurate functionality of the fuzzy model. While setting fuzzy rules can be solved using a team of experts or through neural networks, such as the ANFIS model, the construction of fuzzy membership functions and the adequate setting of their parameters is a demanding task and prone to errors [7]. Thanks to the possibility of the parameterization of standard and widely used fuzzy functions (for example triangular, trapezoidal or Gaussian) it is possible to directly and consistently compare the performance of these functions in type-1 and type-2 fuzzy models. As described by [6], in addition to these standard functions, less common fuzzy functions can be found; however, these can also be easily converted from type-1 to type-2 by parameterization. As [8] point out, the choice of the correct fuzzy function, including the appropriate setting of parameters, thus plays a fundamental and indispensable role in the design, implementation, performance and subsequent interpretation of the fuzzy model. The authors add that these parameters of fuzzy functions are possibilistic in nature and depend on the specific area or domain in which the model is applied. Expert research or other sophisticated methods that set the parameters are necessary for the correct selection and setting of fuzzy functions. Study in [9] emphasizes that the correct choice of fuzzy functions depends to a large and not negligible extent on the subjective perception of inaccurate or vague data. In other words, there are no criteria or consensus to determine the appropriate fuzzy functions for a particular area, although, as [10] points out, these functions play a central role in the high performance of the fuzzy model. Thus, fuzzy functions can be considered as building blocks of fuzzy set theory. However, fuzzy functions must satisfy the necessary condition that they must be in the range 0 to 1. If this condition is met, fuzzy functions can take various shapes and forms.
It can thus be concluded that the correct choice of fuzzy functions is a specific problem, and many researchers and experts have justifiably given the attention of this issue. The next part provides an overview of the literature dealing with finding a suitable fuzzy function. When using different MFs for a given problem, it has usually been found that Gaussian and triangular MFs have very good results, better than other types of MFs. Research in [11] compared the response of the system with different MFs and expressed the view that a triangular MF is better than other MFs. In fact, if one does not have priority for the MF shape, triangular or trapezoidal shapes are easy to implement and calculate quickly. However, if someone has certain priorities for their shapes (e.g., from histograms on sampled data), it may be interesting to create MFs with shapes derived from these apriori shapes after some smoothing, if necessary, according to [10]. In their research, paper [12] used the Gaussian membership function in the ANFIS model to test data on investment instruments. The fuzzy model is applied to the Tehran stock exchange index (TEPIX). The created model was able to predict the development of the stock index with high accuracy. A similar recommendation can be found in [13], which also recommends Gaussian membership functions. The authors further emphasize that this feature best reflects the nature of stock market data. [14] modified the conventional adaptive neuro-fuzzy inference model (ANFIS) using Gaussian functions of layer 4 membership instead of standard polynomial functions. The modified model achieved better computational performance for stock market prediction tasks. In contrast, in the study by [15] integrated technical indicators into the fuzzy system as input variables broken down into seven attributes, which they described using triangular fuzzy functions.
Fuzzy sets are used to express ambiguities in the member function of fuzzy sets. However, so far, as follows from the above, there is no consensus on the geometry of the membership functions. These member functions are usually constructed using numeric data or a range of classes. However, there is uncertainty about the form of membership, i.e., whether it is a function of membership in a triangle or a function of trapezoidal membership, or other. When creating any fuzzy model, strong emphasis should be placed on membership functions, which are neglected and insufficiently researched in most research papers, which can cause significant problems with the functionality of the model. The expression of membership functions depends on both the subject (how deep the researcher’s experience is) and the context (where the problem is). For this reason, the present research focuses on the use of membership functions with varying degrees of uncertainty, which is gradually increasing. Furthermore, not only one type of membership function is used, as is usual in the vast majority of studies, but triangular, trapezoidal, Gaussian and bell membership functions are gradually created. Not to rely solely on one membership function is intentional, because in addition to the knowledge base, membership functions are essential for the proper functioning of the model. Incorrect description of input data through membership functions can provide incorrect outputs. Especially when applied to the stock market, incorrect description of fuzzy functions can cause significant differences in the profitability of the investment strategy and can cause generating incorrect investment signals, which can cause losses to potential investors.
The paper is organized as follows: Section 1 introduction the subject matter, including the identification of the urgency of the problem and the definition of the aim of the work; Section 2 provides the theoretical background and examines already published works; Section 3 is focused on the theory of fuzzy mathematical background of fuzzy system type-1 and type-2; Section 4 is devoted to the methodology and experiments on the data of the international stock market; Section 5 discusses obtained results and evaluation of the created model; Finally, Section 6 summarizes outputs of the paper, recognized limits and suggestions for the subsequent research.
2. Theoretical Background
Numerous papers and research focused on the prediction of financial time series of stock indices using type-1 fuzzy logic can be found in the literature. However, classical type-1 fuzzy sets are not able to fully capture the additional uncertainty that is a feature of stock markets. For this reason, in recent years, research has focused on the application of type-2 fuzzy logic in economic areas. The latest research in this area is described below. The aim was to select research studies, taking into account the membership functions used, but there are not many articles focused on this topic. The type of function is not specified, as the vast majority of researchers do not pay much attention to choosing the appropriate membership function, but the accuracy of fuzzy model outputs and researchers state the function they use in their fuzzy models.
Authors in [16] use several stock indices to predict market trends: Bombay Stock Exchange; CNX Nifty; and S&P 500. The authors chose the type-1 fuzzy model, which integrates ANFIS, to predict them. The authors used fuzzy sets in the Gaussian fuzzy model. However, the authors point out that the integration of neural networks through the ANFIS model significantly reduces the interpretability of the created system. Researches [17,18] apply triangular fuzzy functions to the moving average prediction and the obtained forecast is implemented on the share at Bombay Stock Exchange. Paper [19] develops a fuzzy trading system integrating technical indicators on the basis of which they predict the development of the stock index. [20] predict the stock price of the State Bank of India (SBI) and the Dow-Jones Industrial Average (DJIA) using a fuzzy model. As part of fuzzification, the authors use a triangular fuzzy function, which is very simple and widespread, as the authors note. Other paper [21] integrates technical indicators into the model in order to improve the portability of the Athens Stock Exchange stock price forecast. The output of the strategy are signals to buy or sell a specific share. Authors [22] use two US stock indices, the DOW30 and the NASDAQ100 modified ANFIS model to predict. According to their empirical results, the bell functions of membership outperform trapezoids in performance. The authors also draw attention to a fundamental finding: the numbers and types of fuzzy functions have a fundamental and substantial influence in the process of predicting for financial time series. Paper [23] proposes a type-2 fuzzy model for stock index forecasting: Taiwan Stock Exchange Capitalization Weighted Stock Index, the Dow Jones Industrial Average and the National Association of Securities Dealers Automated Quotation. As an input variable, they use a time series delayed by one day in the fuzzy model. [24] predict the closing prices of TAIEX and NASDAQ stock indices. They also note that membership functions are an important aspect of prediction. The authors use triangular MF, because according to their knowledge and experience they provide better performance than Gaussian. Authors [25] use T2FLS to form a profit analysis decision support model. The authors apply type-2 fuzzy sets because type-1 is too noisy. [26] in their research suggest the creation of T2FLS to improve and refine the effectiveness of the TAIEX and COVID-19 stock index prediction model.
As is mentioned above, the stock market, and therefore the entire financial system, is characterized by a highly unstable environment that is constantly changing. This is also one of the reasons why it is not possible to choose a universal form of membership functions within decision-making models or stock market prediction (see Table 1). However, this is a crucial area, as incorrect description of input data through membership functions results in incorrect output. In this case, incorrect investment signals or the indication of false signals to buy or sell, which may ultimately lead to the loss of investors or the impairment of their funds. The above literature review of scientific and research papers shows the following:
- there is no consensus on the choice of fuzzy model membership functions in the stock market. Different authors choose different membership functions, mostly resorting to the simplest ones without deeper examination and deeper links to the nature of the input data sources;
- it has been shown that type-2 fuzzy logic, the respective dual functions of this type of fuzzy sets, are insufficiently explored in the stock market, as this is an area that has only been widely applied in recent years;
- in the case of dual membership functions, the uncertainty or degree of uncertainty contained between these functions is insufficient or not fully examined to provide more accurate outputs of the respective more accurate predictions.
For this reason, the authors of this paper consider this area to be very important, especially a detailed examination of membership functions in terms of not only their appropriate shape (T1FL and T2FL) resulting from the nature of the selected dataset, but also the appropriate degree of uncertainty between dual membership functions (T2FLS) resulting from the nature of the stock market.
3. Type-2 Fuzzy Logic
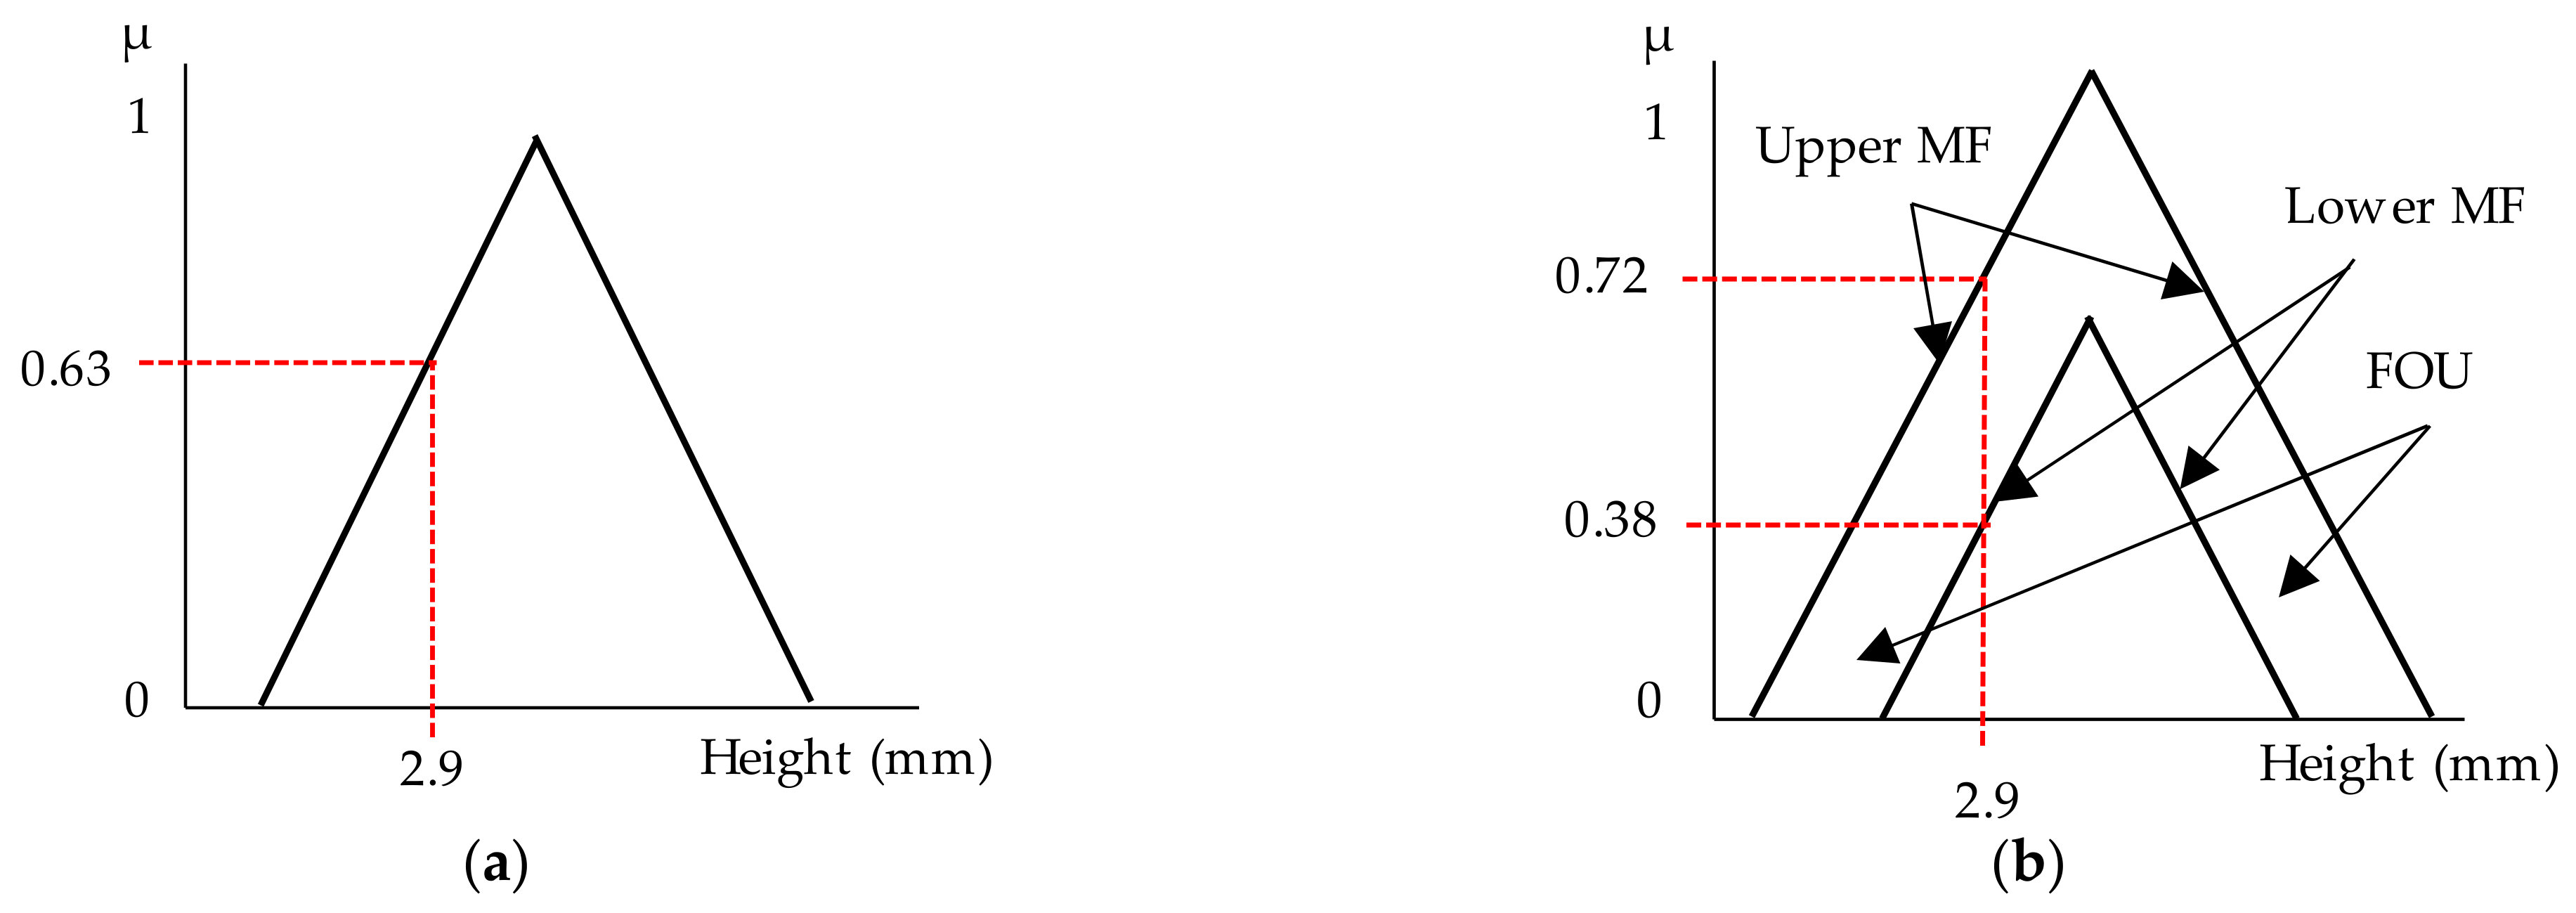
The fuzzy inference is very similar for type-1 and type-2 fuzzy logic. First, a fuzzification process is performed, in which the measured real data are transformed into language variables. Authors [27] state that these language variables are represented by attributes, while the number of these attributes is normally in the range from 3 to 7. The degrees of attributes are then graphically represented by a mathematical function (see Figure 1). Within the higher level of fuzzy logic, there are three possible variants of fuzzification: (a) sharp set; (b) type-1 fuzzy set; (c) type-2 fuzzy set. The former is used if the input data is perfect, i.e., it does not contain noise. Otherwise, fuzzy sets are selected. It is necessary to note that data with stationary noise are modeled as type-1 fuzzy sets and data with non-stationary noise are modeled as type-2 fuzzy sets.
The distribution function, which represents type-2 fuzzy set, can be according to [28,29] write as:
where x is the primary variable is the primary membership of , is the second variable, and is secondary possibility distribution at .
Paper [30] generalized the fuzzy set interval and defined the term IT2FLS. The requirement for secondary possibility distribution is a condition of normality, which means that the elements are fully distributed for , which are defined as follows. IT2FLS is:
where x is the primary variable, is the primary membership of , is the second variable, and is secondary possibility distribution at .
For interval type-2 fuzzy set are upper possibility distribution defined as and lower possibility distribution defined as type-1 possibility distribution. According to Mendel et al., 2006 the footprint uncertainty of is defined as:
Interval type-2 fuzzy set , where and are type-1 fuzzy sets of are reference points of the IT2FLS, indicates the reference point of in the upper possibility function, indicates the reference point of in lower possibility function, , and . From a mathematical point of view, the lower and upper possibility distribution can be written as follows:
Subsequently, a comparative approach based on the possibility of uncertain mean and variation coefficient for IT2FLS is introduced, as described below.
As stated by [31], for all IT2FLS , whose possibility uncertainty mean value are as follows:
where possibility uncertainty means of the upper membership function and lower membership function are respectively written as:
is an increasing function satisfying and .
Authors [31] further describe that the variation coefficient is written for all IT2FLS as:
where is very small value to present the approximate is the variation values. The is mathematically written as:
where is an increasing function satisfying and .
According to [31], two IT2FLS and are considered, whose benchmarks are defined as follows:
It expresses that > means “larger than”, < means “less than” and ∼ means “same order”.
3.1. Probability Information and Its Measure
Assume that is a variable that expresses the value of . The probability distribution is modeled as: . Here, for each indicates the probability , that the value is in , and satisfies .
Consequently, it can be stated that for each fuzzy subset also has its probability, which indicates that lies in , that is . This is written as and .
The calculation of the probability of a fuzzy set was proposed by [32]. Let be a fuzzy subset of such that is membership grade of in . It is recommended, according to Wu and Mendel (2009), that:
Obviously, is a crisp set if if and if .
Let be a prime variable from the with the corresponding probabilities . Subsequently, the entropy of the distribution can be written as follows:
3.2. Combining Information about Possibilities and Probabilities
Considers a variable X taking values from , provides probabilistic information, and provides information on the distribution of options.
Author [32] originally proposed a probability for a fuzzy subset of . Suppose that is a fuzzy subset of for , then the probability for fuzzy subset is defined as:
where is the value of the uncertainty of the possibilities with respect to the fuzzy set theory, is the probability value for the fuzzy event .
A few years later, [33] generalized the probability theory and constructed a mathematical notation for calculating the probability of fuzzy event , which is shown as:
where represents the probability distribution of indicates the distribution function of the probability .
Suppose that is a variable that takes values in space , the probability of uncertainty is modeled by , is a fuzzy subset of with represented possibility of distribution . For each the conditional probability distribution based on conditioning with can be denoted as:
where indicates probability that is taken of the , and satisfying requirements .
4. Data and Methodology
Stock market price change is a dynamic system that is constantly changing, and these sudden changes and movements of stock price movements doubles the complication of successful stock price prediction. In addition, stock markets are characterized by their highly non-linear nature that makes it difficult for investors to make quick decisions about the right investments. It is essential to develop an intelligent system for obtaining real-time price information, reducing one investor obsession and helping them maximize their profits. However, financial time series show relatively complicated and non-stationary behavior, with the variable not having a linear trend or clear tendency to move to a fixed value according to [34]. Mainly for the reasons described above, researchers are increasingly focusing on the use of alternative techniques that can be used to predict the development of financial time series. These techniques certainly include fuzzy logic, which is able to include the uncertainty, nonlinearity and noise that occur in financial time series.
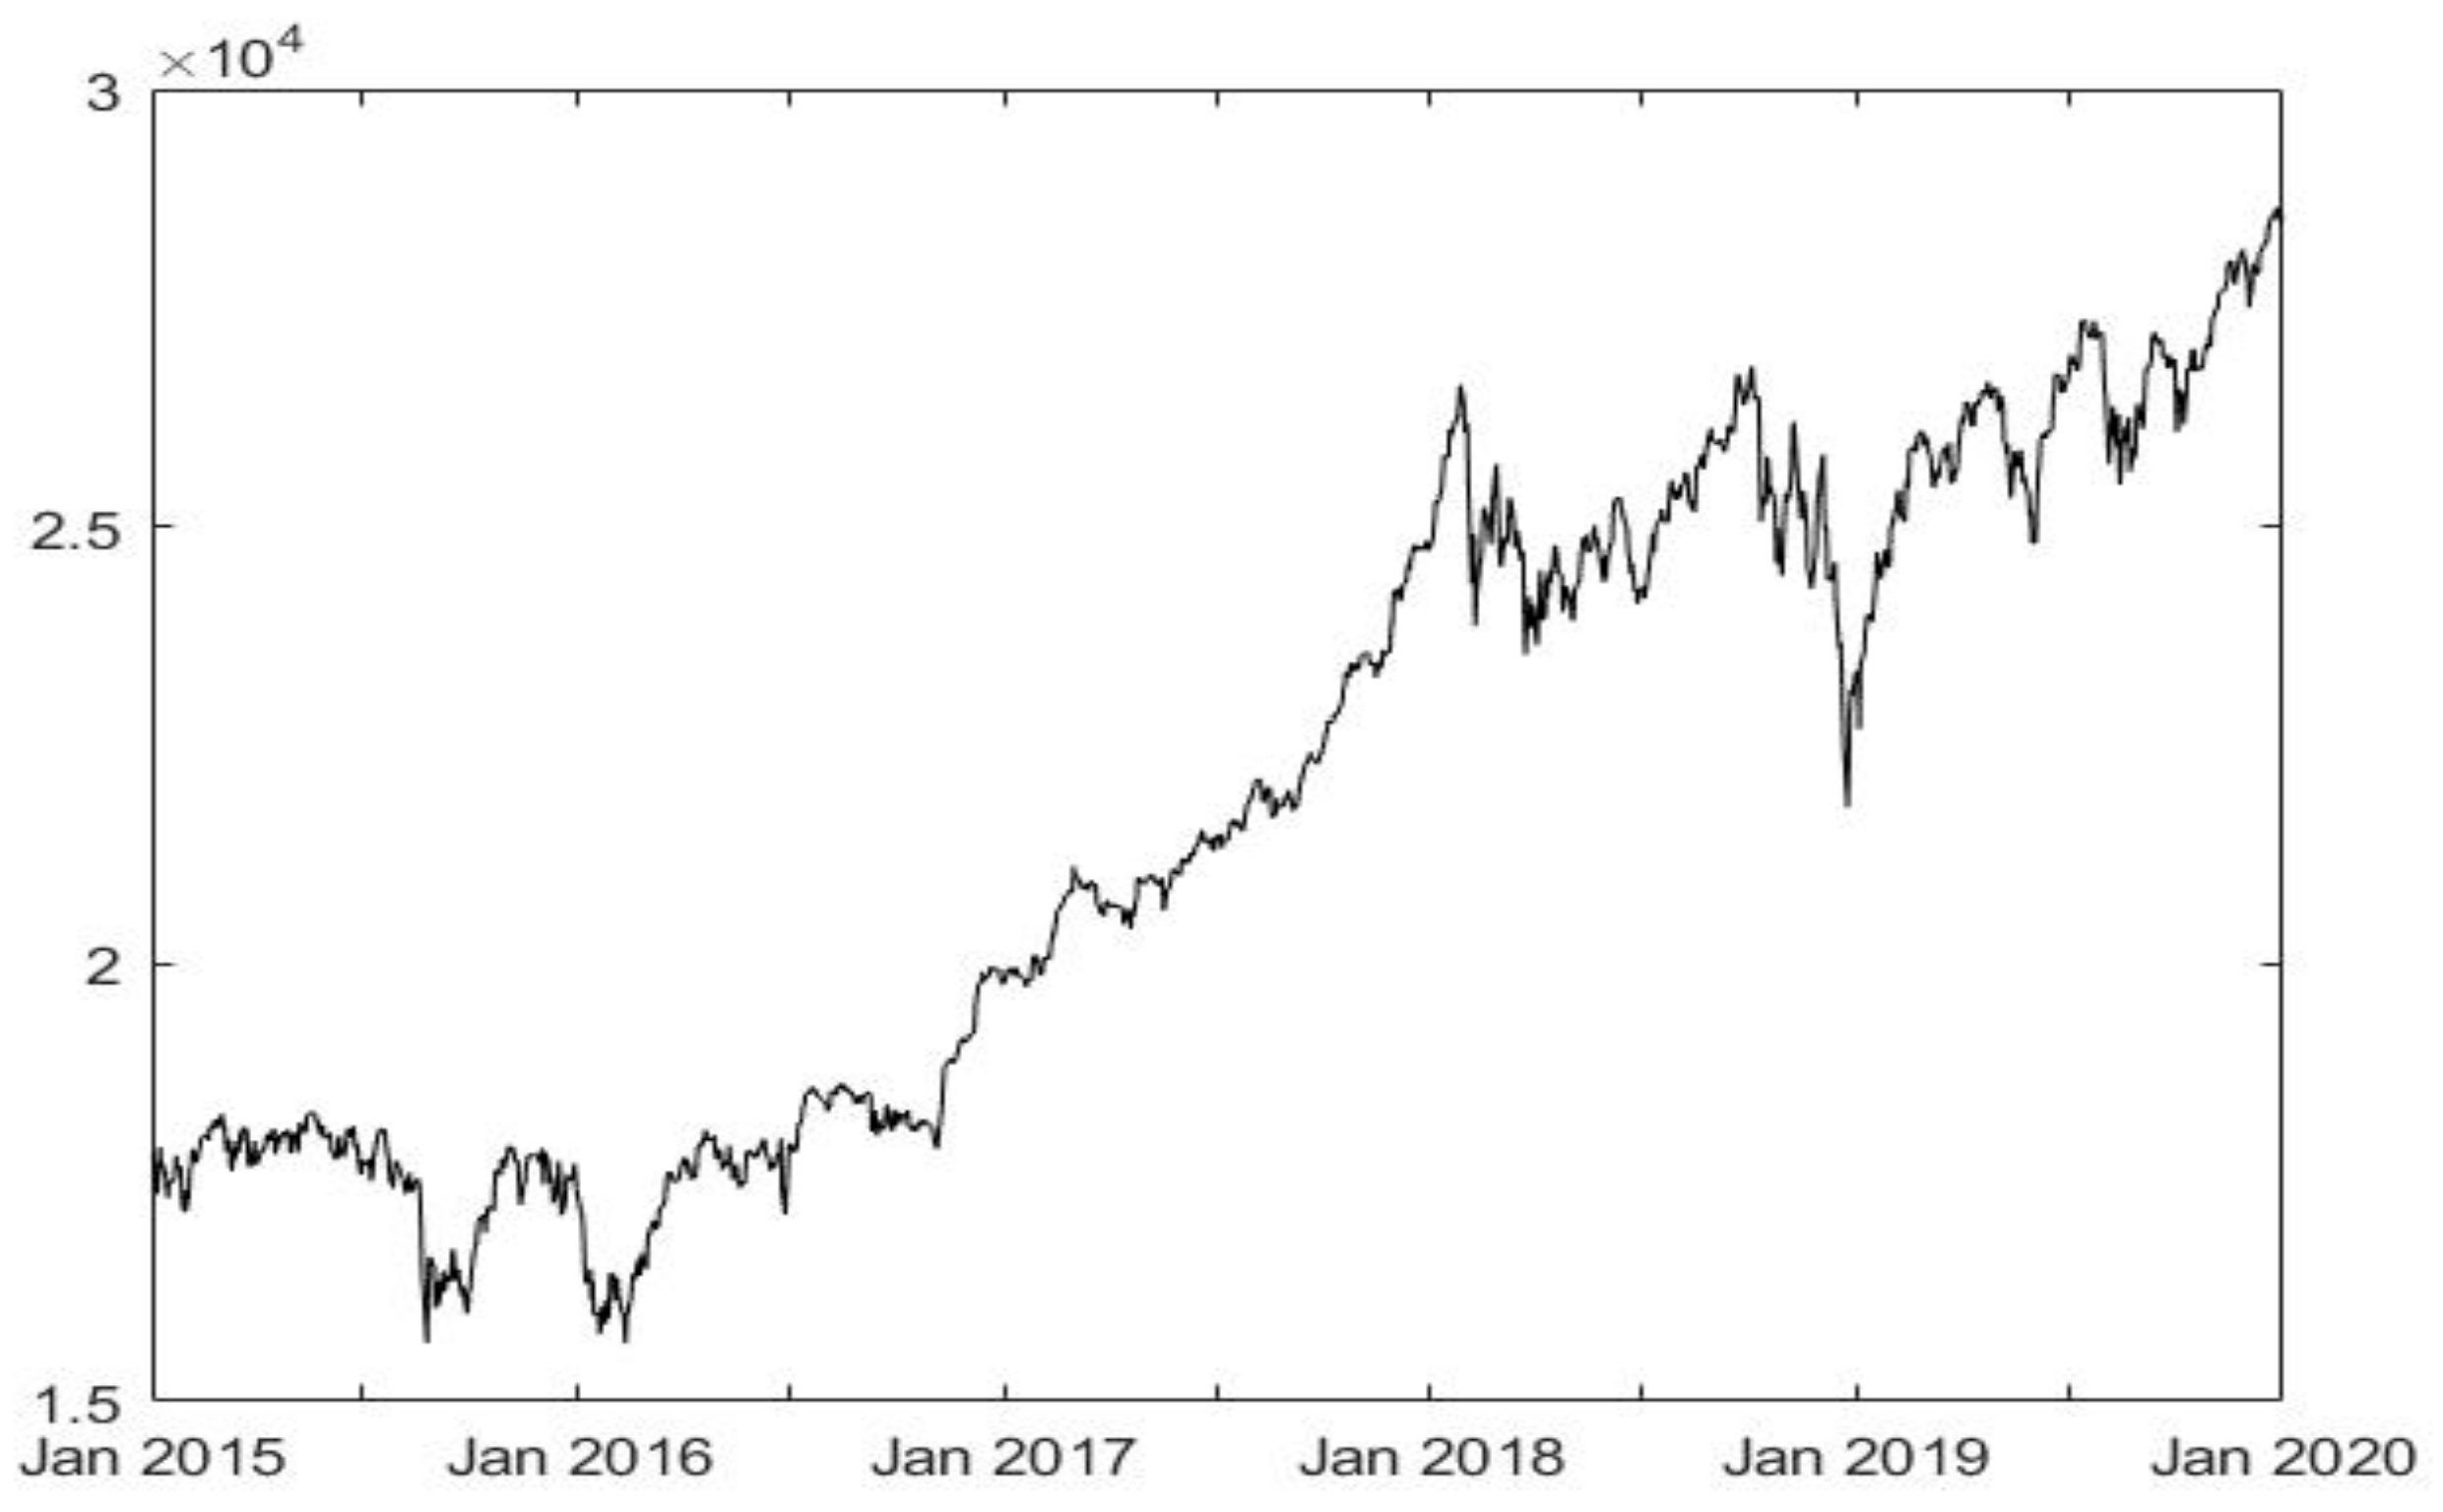
The Dow Jones Industrial Average (DJIA) is one of the best-known indicators of developments in the US stock market. The DJIA is named after its founder, Charles Dow, and its business partner, Edward Jones. The index was first calculated on 26 May 1896. At that time, it contained 12 exclusively industrial companies focused on areas such as the railway industry, cotton, tobacco, sugar cane, natural gas, etc. Today, the DJIA consists of 30 American companies, many of these are the largest and the most traded (blue-chip companies). The historical development of the DJIA index for the observed period is shown in Figure 2.
Table 2 shows the basic statistics of selected stock index. The average price of the DJIA index for the selected period from January 2015 to January 2020 was 21,736.94. The price of the index rose to a maximum value of 28,645.26 and fell to a minimum value of 15,660.8. The standard deviation is a simple measure of the volatility of stock indices. For the DJIA index, the price fluctuated 3718.25. Skewness is a measure of asymmetry, or, more precisely, a lack of symmetry. Based on the values, it can be stated that the stock index has a positive asymmetric distribution of price probabilities. Furthermore, Kurtosis values show that it does not have a value close to 3, which is a theoretical value for the Gaussian probability distribution. This suggests that none of the probability distributions of this time series appear to be normally distributed. To confirm this assumption, the Jarque-Bera test was conducted with a zero hypothesis that the respective probability distribution was Gaussian (chi-square with 2 degrees of freedom). The reported values led to the rejection of the null hypothesis for all stock indices. This lack of normality is in line with the well-known “stylized facts” of market returns, as pointed out in previous studies [35].
Daily stock index closing rates for the selected period January 2015 to January 2020 are used, a medium-term period of 5 years. It is also clear from the Figure 2 that this is a bullish trend or a rising trend without long-term bearish trends. The time period is deliberately ended in January 2020, before a sharp decline due to the COVID-19 pandemic situation. This is a sudden event that would significantly distort the output of the fuzzy model. Real data are processed through standard procedures applied in [36,37]. This step is purposeful, as the value of the stock index shows large fluctuations, which would not have to provide relevant outputs without pre-processing.
where is the closing daily price of the stock index at time and . Delayed data of the selected index are then selected as the input vector for the fuzzy model, up to a delay of three days, as described here:
The delay of up to three days proved to be the most accurate in an earlier survey by [38], which is why the application is also performed here.
The whole practical part is processed using MATLAB 2021a software and a special fuzzy logic toolbox was used to create the fuzzy model. The fuzzy model for stock market research consists of three input variables (value at time t-3, t-2 and t-1), one rule block and one output variable (value at time t).
5. Results and Evaluations
As previously described, fuzzy logic has a number of advantages, in particular being able to work with vague terms, chaotic and dynamic environments and nonlinear behaviors that are typical of everyday use in stock market analysis. Specifically, this paper applies a higher level of fuzzy logic known as type-2 fuzzy logic, whose milked fuzzy functions are able to include additional uncertainty.
The Mamdani fuzzy inference method has been widely applied in processing fuzzy rule-based systems. The Mamdani model is suitable if the modeled area is described using natural language. The input data is converted into fuzzy sets as part of the fuzzification process using mathematical functions. A total of nine models are created for each of the four shapes of the fuzzy sets: L—low, M—medium and H—high. Triangular, trapezoidal, Gaussian and bell member functions in the range [0; 1] were used to create fuzzy models and to examine the degrees of uncertainty in each of these MFs. A total of nine models were created for each MF, which differ in the magnitude of the uncertainty contained in the duplicate membership functions. Examined MF with varying levels of uncertainty are graphically illustrated in Appendix A.
When compiling fuzzy sets, the parameters lower membership function scaling factor, specified as a positive scalar less than or equal to 1, are used. Next, the lag value is set. This delay defines the point at which the lower membership function value starts increasing from zero based on the value of the upper membership function. For example, a lag value of 0.1 indicates that the lower membership function becomes positive when the upper membership function has a membership value of 0.1. For demonstration in this example, several values indefinitely are used to evaluate the accuracy of the created models. Gradually, a total of nine models are created, which differ in the degree of uncertainty contained in fuzzy sets describing the input variables. Model 1 contains membership functions with lower scale 1 and lower lag 0, essentially classical fuzzy sets of type 1. Model 2 consists of membership functions that already contain another degree of uncertainty, which was not mentioned for model 1. Specifically, model 2 contains fuzzy sets with lower scale 0.9 and lower lag 0.1. The following models contain more and more uncertainty, as can be seen from the figures corresponding to the membership functions. An overview of the plotting of the investigated types of IT2 FL MF is shown in Appendix A, where triangular, trapezoidal, Gaussian and bell MFs are plotted. The figure also shows how the distance between the individual functions gradually increases with the addition of uncertainty.
Thus, a total of nine models are constructed for each type of fuzzy membership function. The level of uncertainty with which the individual models differ is as follows:
- Model (1): T1FLS: LowerScale 1; LowerLag 0
- Model (2): T2FLS: LowerScale 0.95; LowerLag 0.05
- Model (3): T2FLS: LowerScale 0.90; LowerLag 0.10
- Model (4): T2FLS: LowerScale 0.85; LowerLag 0.15
- Model (5): T2FLS: LowerScale 0.80; LowerLag 0.20
- Model (6): T2FLS: LowerScale 0.75; LowerLag 0.25
- Model (7): T2FLS: LowerScale 0.70; LowerLag 0.30
- Model (8): T2FLS: LowerScale 0.65; LowerLag 0.35
- Model (9): T2FLS: LowerScale 0.60; LowerLag 0.40
The knowledge base represents rules in the form “IF-THEN” and expresses expert knowledge about the relationship between the delayed values of the DJIA stock index and the current value of this index. There are 27 defined fuzzy rules based on a team of experts. These rules are essential for the proper functioning of the fuzzy model and to describe the behavior of the fuzzy system. The antecedent part of fuzzy rules includes all the actual combinations of language values of the input variables. The result is the evaluation of all combinations, i.e., the assignment of linguistic values to the output variables.
The created fuzzy inference model is necessary to verify whether the presented outputs are sufficiently accurate and applicable in practice. For this purpose, several evaluation metrics are selected, which are used to verify and evaluate the error rate or accuracy of individual illustrative models of fuzzy logic. Specifically, the Root Mean Square Deviation (RMSE) indicator is selected, which compares the original data and the data obtained from the output of the model . RMSE assigns a relatively higher weight to large prediction errors. This is especially useful when high error rates are undesirable. In the case of predicting the development of the stock index, this indicator can be considered the most appropriate. This indicator is also applied in many equally focused studies such as [16,17,23]. In addition to the above indicator, Mean Absolute Percentage Error (MAPE), Mean Absolute Error (MAE), Mean Squared Error (MSE) indicators are also applied and calculated. MAPE is suitable for comparing forecasts between different time series because it is expressed on a relative scale. The MAE indicates the size of the data set prediction error regardless of the direction of its development. It basically gives a linear error rate, which means that the differences have the same average weight. MSE is a suitable indicator to determine whether the examined data set does not show more outlying prediction values showing a high error rate. Unlike MAE, it places more weight on outliers due to the quadratic part of its calculation. However, this means that a single bad prediction can significantly increase the error rate. In particular, RMSE can be reported together with MAE, because the larger the size of the deviation between the two indicators, the greater the variance in the error rate of the examined data set. Based on the outputs of these indicators, it is then possible to evaluate which fuzzy model, or which type of fuzzy function and level of uncertainty, achieves the most accurate results on the stock market. In general, the lower the values of these indicators, the more accurate the model. The formulas of these evaluations are shown below:
For subsequent comparison of models created on the basis of the above error and performance indicators, it is necessary to obtain predicted output values of individual models, based on which the performance of T2FLS models with membership functions with different levels of uncertainty is determined. These data are entered in Table 3, Table 4, Table 5 and Table 6.
Table 3 shows the evaluation of accuracy and error rate for triangular MF IT2 FL. A total of nine models were examined, which differed in the degree of uncertainty involved in the membership functions. The RMSE indicator was used to compare the quality of models. A lower RMSE value indicates a better model. The table shows that model 8 had a value of 0.1512, which indicates a better model compared to another model form triangular IT2 MF. The value of the MAPE indicator is a dimensionless characteristic by which different models can be compared. The highest value was reached by model 1 with a MAPE indicator value of 90.32, while the lowest value was shown by model 7 with a MAPE indicator value of 74.74. Thus, in terms of this indicator, model 7 achieved a lower error rate and deviated less from reality in comparison with all other models with the same MF. The shortcoming in the MAE indicator was eliminated by first converting each error to a positive value using an absolute value, and the errors from all observations were then averaged as in the first cases. The MSE indicator converted negative error values to positive ones by amplifying them. The result is a large number and because large errors, i.e., large deviations of the forecasts from the actual situation, were given a large weight, while small errors were given much less weight. For both of these indicators, model 8 achieved the lowest error rate with a value of 0.1456.
The trapezoidal MF IT2 FL in Table 4 can be evaluated similarly. The same indicators as for triangular MFs were used for evaluation and comparison. The lowest RMSE is in the last model examined with a high level of uncertainty, namely with LowerScale 0.6 and LowerLag 0.4. This indicator showed a lower value (0.0985) than the triangular MF. This type of MF also achieved better results for other indicators, where MSE shows a value of 0.0097, MAE 0.0957 and MAPE 48.05. Even the worst model with a trapezoidal function (model 1) showed better results in all monitored metrics than the best model with a triangular function.
The penultimate form of the MF IT2 FL investigated is the Gaussian function. This form of function is very often used in stock market analysis see [38,39]. However, in this research, three-dimensional Gaussian functions showed the worst result. The best model in terms of Gaussian MFs was model 5 (LowerScale 0.8 LowerLag 0.2). It can be seen that, unlike the previous two types of MF, the Gaussian function showed the best results at the lowest level of uncertainty, while the other two types (triangular, trapezoidal) showed the best performance when including a large dose of uncertainty and uncertainty.
The last investigated shape of the MF IT2 FL is the bell function. Based on the comparison with the previous mathematical functions, the bell function achieved excellent results with a very low level of uncertainty LowerScale 0.95 LowerLag 0.05, resp. LowerScale 0.9 LowerLag 0.1. However, in terms of quality and error rate, even the bell MF could not be compared much with the trapezoidal function. This type of fuzzy set with triangular fuzzy sets showed very close results.
T2 FS are characterized by three-dimensional MF. The degree of membership for each element of a type-2 fuzzy set is a fuzzy set in [0,1]. The third dimension provides additional degrees of freedom to capture more information. Type-2 fuzzy sets are useful in circumstances where it is difficult to determine the exact membership function for fuzzy sets, which is useful for incorporating uncertainties. However, the use of type-2 fuzzy sets in practice has been limited due to the significant increase in computational complexity required to implement them. IT2 FS are characterized by secondary membership functions that have only values of 0 or 1. This limitation greatly simplifies the computational requirements associated with performing inferences with type-2 sets.
Based on the evaluation and comparison of individual forms of mathematical functions of fuzzy logic according to selected indicators, it can be stated that the trapezoidal form of MF is best suited to the analysis of the stock market. This is followed by a triangular and bell shape, and the worst results were achieved by the widely used Gaussian shape MF. Another finding resulting from the evaluation is the fact that while the trapezoidal MF shows the best performance, this excellent performance was only achieved with a large dose of uncertainty or uncertainty included in the three-dimensional functions that IT2 FL uses. It is similar with triangular MF. On the contrary, although the bell and Gaussian functions performed worse, they did not need as much uncertainty for their best performance.
6. Conclusions
The article shows which new and sophisticated methods should be used to achieve a high level of probability of successful stock market analysis with expected benefits. We present specific advanced methods for decision-making areas for successful investments. Specifically, IT2 FL was used with a focus on examining the appropriate membership function with different levels of uncertainty. According to the literature review, this area is insufficiently researched in the context of financial time series. Based on the results, it can be stated that when examining the stock index, the trapezoidal membership function showed the best results, but this was using the high level of uncertainty contained in three-dimensional MF. Triangular MFs also required similarly high levels of vagueness. On the other hand, the bell and Gaussian MF did not require such a high level of vagueness to be included in order to achieve their best performance at low uncertainty of the membership function, but the results were a bit worse than for a trapezoidal and triangular fuzzy set with a high level of uncertainty.
The benefits of the presented paper can be seen in three dimensions:
- A detailed examination of the four basic forms of membership functions (triangular, trapezoidal, Gaussian and bell), which were chosen with regard to the nature of the input data originating from the stock market;
- A detailed examination of the degree of uncertainty contained among the milked fuzzy membership functions in type-2 fuzzy logic. Several fuzzy models were created with varying degrees of uncertainty ranging from 0‰ to 40‰;
- An application of type-2 fuzzy logic, which is neglected in the literature, lagging behind the more well-known and simpler type-1 fuzzy logic.
These outputs can be used in practical applications in the stock market and in education related to investments. The outputs of the expert system, specifically the fuzzy model, which provided the most accurate results or the lowest error rate, can be used to provide investment signals that can be placed directly on the stock market. The created model of support for investment decisions thus provides certain proposals for profitable investment strategies for investors, especially institutional investors, banks, investment companies and the like. This model is able to indicate the growth or decline of the DJIA stock index and thus send investment signals to buy or sell stock index shares.
However, it is also necessary to draw attention to the limits of research. This application of the model is made exclusively on the US stock market, which is characterized by high liquidity and efficiency. It would also be appropriate to verify the results on other US stock market stock indices, such as the S&P 500, or on other stock markets, whether equally developed or emerging. However, it can be assumed that a universal position regarding the shape of the fuzzy function is not possible, because the correct shape depends on the input characteristic data of the researched issue. It is necessary to pay close attention to this issue, as a well-chosen form of fuzzy function and degree of uncertainty can significantly affect the accuracy of outputs, which is extremely important, especially in stock markets, as even a slight improvement can cause investors significant profits or losses.
Author Contributions
Z.J.: conceptualization, methodology, software, validation, investigation, resources, data curation, writing—original draft preparation, visualization, project administration, funding acquisition; E.R.: formal analysis, writing—review and editing, supervision. All authors have read and agreed to the published version of the manuscript.
Funding
This paper was supported by project No. FP-S-20-6376 ‘Modeling and optimization of business processes in conditions of digital transformation’ from the Internal Grant Agency at Brno University of Technology. The partial support of KEGA project No. 025EU-4/2021 of the Ministry of Education, Science, Research and Sport of the Slovak Republic is kindly appreciated.
Institutional Review Board Statement
Not applicable.
Informed Consent Statement
Not applicable.
Data Availability Statement
No new data were created or analyzed in this study. Data sharing is not applicable to this article.
Conflicts of Interest
The authors declare no conflict of interest.
Appendix A

Table A1.
Examined MF with varying levels of uncertainty-.
| Triangular | Trapezoidal | Gaussian | Bell | |
| 1 |  |  |  |  |
| 2 |  |  |  |  |
| 3 |  |  |  |  |
| 4 |  |  |  |  |
| 5 |  |  |  |  |
| 6 |  |  |  |  |
| 7 |  |  |  |  |
| 8 |  |  |  |  |
| 9 |  |  |  |  |
References
- Pincay, J.; Portmann, E.; Terán, L. Fuzzifying Geospatial Data to Identify Critical Traffic Areas. In Proceedings of the 19th World Congress of the International Fuzzy Systems Association, The 12th Conference of the European Society for Fuzzy Logic and Technology (IFSA-EUSFLAT 2021), Bratislava, Slovakia, 19–24 September 2021. [Google Scholar]
- Li, R.; Jiang, C.; Zhu, F.; Chen, X. Traffic flow data forecasting based on interval type-2 fuzzy sets theory. IEEE/CAA J. Autom. Sin. 2016, 3, 141–148. [Google Scholar]
- Mendel, J.M. Type-2 fuzzy sets and systems: An overview. IEEE Comput. Intell. Mag. 2007, 2, 20–29. [Google Scholar] [CrossRef]
- Eren, M. Forecasting of the Fuzzy Univariate Time Series by the Optimal Lagged Regression Structure Determined Based on the Genetic Algorithm. Econ. Comput. Econ. Cybern. Stud. Res. 2018, 52, 201–215. [Google Scholar]
- Puška, A.; Kozar, S.; Stevic, Ž.; Stovrag, J. A New Way of Applying Interval Fuzzy Logic in Group Decision Making For Supplier Selection. Econ. Comput. Econ. Cybern. Stud. Res. 2018, 52, 217–234. [Google Scholar]
- Castro, J.R.; Sanchez, M.A.; Gonzalez, C.I.; Melin, P.; Castillo, O. A New Method for Parameterization of General Type-2 Fuzzy Sets. Fuzzy Inf. Eng. 2018, 10, 31–57. [Google Scholar] [CrossRef]
- Yankova, T.; Ilieva, G.; Klisarova, S. The bezier curve as a fuzzy membership function shape. Math. Appl. Ann. Acad. Rom. Sci. 2018, 10, 245–265. [Google Scholar]
- Wijayasekara, D.; Manic, M. Data Driven Fuzzy Membership Function Generation for Increased Understandability. In Proceedings of the IEEE International Conference on Fuzzy Systems, Beijing, China, 6–11 July 2014; pp. 133–140. [Google Scholar]
- Kayacan, E.; Sarabakha, A.; Coupland, S.; John, R.; Khanesar, M.A. Type-2 fuzzy elliptic membership functions for modeling uncertainty. Eng. Appl. Artif. Intell. 2018, 70, 170–183. [Google Scholar] [CrossRef] [Green Version]
- Sadollah, A. Introductory Chapter: Which Membership Function is Appropriate in Fuzzy System? In Fuzzy Logic Based in Optimization Methods and Control Systems and Its Applications; Sadollah, A., Ed.; IntechOpen: London, UK, 2018. [Google Scholar]
- Zhao, J.; Bose, B.K. Evaluation of membership functions for fuzzy logic controlled induction motor drive. In Proceedings of the 28th Annual IEEE Conference of the Industrial Electronics Society, Sevilla, Spain, 5–8 November 2002. [Google Scholar]
- Esfahanipour, A.; Aghamiri, W. Adapted Neuro-Fuzzy Inference System on indirect approach TSK fuzzy rule base for stock market analysis. Expert Syst. Appl. 2010, 37, 4742–4748. [Google Scholar] [CrossRef]
- Talpur, N.; Salleh, M.N.M.; Hussain, K. An investigation of membership functions on performance of ANFIS for solving classification problems. IOP Conf. Ser. Mater. Sci. Eng. 2017, 226, 012103. [Google Scholar] [CrossRef]
- Vlasenko, A.; Vynokurova, O.; Vlasenko, N.; Peleshko, M. A Hybrid Neuro-Fuzzy Model for Stock Market Time-Series Prediction. In 2018 IEEE Second International Conference on Data Stream Mining & Processing (DSMP); IEEE: New York, NY, USA, 2018; pp. 352–355. [Google Scholar]
- Ghandar, A.; Michalewicz, Z.; Schmidt, M.; To, T.; Zurbrugg, R. Computational intelligence for evolving trading rules. IEEE Trans. Evol. Comput. 2009, 13, 71–86. [Google Scholar] [CrossRef]
- Rajab, S.; Sharma, V. An interpretable neuro-fuzzy approach to stock price forecasting. Soft Comput. 2017, 23, 921–936. [Google Scholar] [CrossRef]
- Gautam, S.S.; Abhishekh. A Novel Moving Average Forecasting Approach Using Fuzzy Time Series Data Set. J. Control Autom. Electr. Syst. 2019, 30, 532–544. [Google Scholar] [CrossRef]
- Abhishekh, G.S.S.; Singh, S.R. A New Type 2 Fuzzy Time Series Forecasting Model Based on Three-Factors Fuzzy Logical Relationships. Int. J. Uncertain. Fuzziness Knowl.-Based Syst. 2019, 27, 251–276. [Google Scholar] [CrossRef]
- Pinto, É.A.N.; Schnitman, L.; Reis, R.A. A Fuzzy Based Recommendation System for Stock Trading. In Fuzzy Information Processing, Proceedings of the NAFIPS 2018: Communications in Computer and Information Science, West Lafayette, IN, USA, 7–9 June 2018; Barreto, G., Coelho, R., Eds.; Springer: Cham, Switzerland, 2018; Volume 831. [Google Scholar]
- Liu, Z.; Zhang, T. A second-order fuzzy time series model for stock price analysis. J. Appl. Stat. 2019, 46, 2514–2526. [Google Scholar] [CrossRef]
- Chourmouziadis, K.; Chourmouziadou, D.K.; Chatzoglou, P.D. Embedding Four Medium-Term Technical Indicators to an Intelligent Stock Trading Fuzzy System for Predicting: A Portfolio Management Approach. Comput. Econ. 2021, 57, 1183–1216. [Google Scholar] [CrossRef]
- Sharma, D.K.; Hota, H.S.; Rababaah, A.R. Forecasting US stock price using hybrid of wavelet transforms and adaptive neuro fuzzy inference system. Int. J. Syst. Assur. Eng. Manag. 2021. [Google Scholar] [CrossRef]
- Jiang, J.-A.; Syue, C.-H.; Wang, C.-H.; Wang, J.-C.; Shieh, J.-S. An Interval Type-2 Fuzzy Logic System for Stock Index Forecasting Based on Fuzzy Time Series and a Fuzzy Logical Relationship Map. IEEE Access 2018, 6, 69107–69119. [Google Scholar] [CrossRef]
- Bhattacharya, D.; Konar, A. Self-adaptive type-1/type-2 hybrid fuzzy reasoning techniques for two-factored stock index time-series prediction. Soft Comput. 2018, 22, 6229–6246. [Google Scholar] [CrossRef]
- Lathamaheswari, M.; Nagarajan, D.; Kavikumar, J.; Broumi, S. Triangular interval type-2 fuzzy soft set and its application. Complex Intell. Syst. 2020, 6, 531–544. [Google Scholar] [CrossRef]
- Zare, A.; Shoeibi, A.; Shafaei, N.; Moridian, P.; Alizadehsani, R.; Halaji, M.; Khosravi, A. Accurate Prediction Using Triangular Type-2 Fuzzy Linear Regression. arXiv 2021, arXiv:2109.05461. [Google Scholar]
- Janková, Z.; Dostál, P. Type-2 Fuzzy Expert System Approach for Decision-Making of Financial Assets and Investing under Different Uncertainty. Math. Probl. Eng. 2021, 2021, 3839071. [Google Scholar] [CrossRef]
- Sang, X.; Zhou, Y.; Yu, X. Uncertain possibility-probability information fusion method under interval type-2 fuzzy environment and its application in stock selection. Inf. Sci. 2019, 504, 546–560. [Google Scholar] [CrossRef]
- Mendel, J.M.; John, R.I.; Liu, F. Interval type-2 fuzzy logic systems made simple. IEEE Trans. Fuzzy Syst. 2006, 14, 808–821. [Google Scholar] [CrossRef] [Green Version]
- Mendel, J.M. Uncertain Rule-Based Fuzzy Logic Systems; Prentice Hall: Los Angeles, CA, USA, 2001. [Google Scholar]
- Sang, X.; Liu, X. Possibility mean and variation coefficient based ranking methods for type-1 fuzzy numbers and interval type-2 fuzzy numbers. J. Intell. Fuzzy Syst. 2016, 30, 2155–2168. [Google Scholar] [CrossRef]
- Zadeh, L.A. Probability measures of fuzzy events. J. Math. Anal. Appl. 1968, 23, 421–427. [Google Scholar] [CrossRef] [Green Version]
- Zimmermann, H.J. Possibility Theory, Probability Theory, and Fuzzy Set Theory; Springer: Dordrecht, The Netherlands, 1996. [Google Scholar]
- Chang, P.C.; Liu, C.H. A TSK type fuzzy rule based system for stock price prediction. Expert Syst. Appl. 2008, 34, 135–144. [Google Scholar] [CrossRef]
- Polanco-Martínez, J.M.; Fernández-Macho, J.; Neumann, M.B.; Faria, S.H. A pre-crisis vs. crisis analysis of peripheral EU stock markets by means of wavelet transform and a nonlinear causality test. Phys. A Stat. Mech. Appl. 2018, 490, 1211–1227. [Google Scholar] [CrossRef]
- Li, R.J.; Xiong, Z.B. Forecasting stock market with fuzzy neural networks. In Proceedings of the 2005 International Conference on Machine Learning and Cybernetics, Guangzhou, China, 18–21 August 2005; Volume 6, pp. 3475–3479. [Google Scholar]
- Zhai, F.; Wen, Q.; Yang, Z.; Song, Y. Hybrid forecasting model research on stock data mining. In Proceedings of the 4th International Conference on New Trends in Information Science and Service Science, Gyeongju, Korea, 11–13 May 2010; pp. 630–633. [Google Scholar]
- Janková, Z.; Dostál, P. Prediction of European Stock Indexes Using Neuro-fuzzy Technique. Trendy Ekon. Manag. 2020, 14, 45–57. [Google Scholar] [CrossRef]
- Janková, Z.; Janková, Z.; Jana, D.K.; Dostál, P. Investment Decision Support Based on Interval Type-2 Fuzzy Expert System. Inz. Ekon.-Eng. Econ. 2021, 32, 118–129. [Google Scholar]
Figure 1.
The difference between (a) T1FS and (b) T2FS.

Figure 2.
Historical development of the DJIA stock index.

Table 1.
Summary of literature background.
| Author | Fuzzy Sets | Type | Problem |
|---|---|---|---|
| [16] | Gaussian | T1FS | stock index prediction |
| [23] | Triangular | T2FS | stock index prediction |
| [17] | Triangular | T1FS | stock index prediction |
| [18] | Triangular | T1FS | stock index prediction |
| [19] | Trapezoidal | T2FS | stock index prediction |
| [20] | Triangular | T1FS | stock index prediction |
| [22] | Bell | ANFIS | stock index prediction |
| [21] | Bell | T1FS | stock prediction |
| [24] | Triangular | T1FS; T2FS | stock index prediction |
| [25] | Triangular | T2FS | profit prediction |
| [26] | Triangular | T2FS | stock index prediction |
Table 2.
Summary statistics of DJIA index for the observed period.
| Statistics | DJIA Index |
|---|---|
| Mean | 21,736.94 |
| Standard deviation | 3718.25 |
| Minimum | 15,660.18 |
| Maximum | 28,645.26 |
| Skewness | 0.08 |
| Kurtosis | −1.52 |
| Jarque-Bera test | 122.98 ** |
** indicates p-value lower than 0.01.
Table 3.
Evaluation the level of uncertainty for triangular IT2 MF.
| Model | RMSE | MSE | MAE | MAPE |
|---|---|---|---|---|
| Model (1) | 0.1763 | 0.0311 | 0.1660 | 90.32 |
| Model (2) | 0.1753 | 0.0307 | 0.1659 | 89.57 |
| Model (3) | 0.1736 | 0.0301 | 0.1651 | 88.28 |
| Model (4) | 0.1705 | 0.0291 | 0.1629 | 86.05 |
| Model (5) | 0.1656 | 0.0274 | 0.1586 | 82.56 |
| Model (6) | 0.1585 | 0.0251 | 0.1523 | 78.72 |
| Model (7) | 0.1517 | 0.0230 | 0.1457 | 74.74 |
| Model (8) | 0.1512 | 0.0229 | 0.1456 | 75.19 |
| Model (9) | 0.1690 | 0.0286 | 0.1593 | 80.69 |
Table 4.
Evaluation the level of uncertainty for trapezoidal IT2 MF.
| Model | RMSE | MSE | MAE | MAPE |
|---|---|---|---|---|
| Model (1) | 0.1250 | 0.0156 | 0.1213 | 63.75 |
| Model (2) | 0.1227 | 0.0151 | 0.1193 | 62.16 |
| Model (3) | 0.1200 | 0.0144 | 0.1167 | 60.25 |
| Model (4) | 0.1168 | 0.0137 | 0.1137 | 58.05 |
| Model (5) | 0.1132 | 0.0128 | 0.1101 | 55.50 |
| Model (6) | 0.1094 | 0.0120 | 0.1064 | 53.33 |
| Model (7) | 0.1052 | 0.0111 | 0.1025 | 51.12 |
| Model (8) | 0.1001 | 0.0100 | 0.0972 | 48.36 |
| Model (9) | 0.0985 | 0.0097 | 0.0957 | 48.05 |
Table 5.
Evaluation the level of uncertainty for Gaussian IT2 MF.
| Model | RMSE | MSE | MAE | MAPE |
|---|---|---|---|---|
| Model (1) | 0.1918 | 0.0368 | 0.1812 | 99.66 |
| Model (2) | 0.1864 | 0.0347 | 0.1767 | 96.55 |
| Model (3) | 0.1847 | 0.0341 | 0.1756 | 95.45 |
| Model (4) | 0.1840 | 0.1840 | 0.1752 | 94.90 |
| Model (5) | 0.1839 | 0.0338 | 0.1755 | 94.74 |
| Model (6) | 0.1847 | 0.0341 | 0.1763 | 95.04 |
| Model (7) | 0.1864 | 0.0347 | 0.1780 | 95.90 |
| Model (8) | 0.1890 | 0.0357 | 0.1805 | 97.28 |
| Model (9) | 0.1924 | 0.0370 | 0.1837 | 99.15 |
Table 6.
Evaluation the level of uncertainty for bell IT2 MF.
| Model | RMSE | MSE | MAE | MAPE |
|---|---|---|---|---|
| Model (1) | 0.1754 | 0.0308 | 0.1621 | 91.47 |
| Model (2) | 0.1675 | 0.0280 | 0.1566 | 87.23 |
| Model (3) | 0.1674 | 0.0280 | 0.1568 | 87.18 |
| Model (4) | 0.1693 | 0.0287 | 0.1586 | 88.18 |
| Model (5) | 0.1716 | 0.0295 | 0.1607 | 89.46 |
| Model (6) | 0.1741 | 0.0303 | 0.1629 | 90.83 |
| Model (7) | 0.1767 | 0.0312 | 0.1651 | 92.23 |
| Model (8) | 0.1795 | 0.0333 | 0.1701 | 95.25 |
| Model (9) | 0.1825 | 0.0333 | 0.1701 | 95.25 |
Publisher’s Note: MDPI stays neutral with regard to jurisdictional claims in published maps and institutional affiliations. |
© 2022 by the authors. Licensee MDPI, Basel, Switzerland. This article is an open access article distributed under the terms and conditions of the Creative Commons Attribution (CC BY) license (https://creativecommons.org/licenses/by/4.0/).
Share and Cite
MDPI and ACS Style
Janková, Z.; Rakovská, E. Comparison Uncertainty of Different Types of Membership Functions in T2FLS: Case of International Financial Market. Appl. Sci. 2022, 12, 918. https://0-doi-org.brum.beds.ac.uk/10.3390/app12020918
AMA Style
Janková Z, Rakovská E. Comparison Uncertainty of Different Types of Membership Functions in T2FLS: Case of International Financial Market. Applied Sciences. 2022; 12(2):918. https://0-doi-org.brum.beds.ac.uk/10.3390/app12020918
Chicago/Turabian StyleJanková, Zuzana, and Eva Rakovská. 2022. "Comparison Uncertainty of Different Types of Membership Functions in T2FLS: Case of International Financial Market" Applied Sciences 12, no. 2: 918. https://0-doi-org.brum.beds.ac.uk/10.3390/app12020918
Note that from the first issue of 2016, this journal uses article numbers instead of page numbers. See further details here.