
Feature Importance Analysis for Postural Deformity Detection System Using Explainable Predictive Modeling Technique


1
Department of Neurosurgery, Inje University Ilsan Paik Hospital, College of Medicine, Goyang 10380, Korea
2
Neuroscience & Radiosurgery Hybrid Research Center, Inje University, Goyang 10380, Korea
3
Allbareun Neurosurgery Clinic, Incheon 21972, Korea
*
Author to whom correspondence should be addressed.
Appl. Sci. 2022, 12(2), 925; https://0-doi-org.brum.beds.ac.uk/10.3390/app12020925
Submission received: 30 November 2021
/
Revised: 7 January 2022
/
Accepted: 13 January 2022
/
Published: 17 January 2022
(This article belongs to the Topic Artificial Intelligence in Healthcare)
Abstract
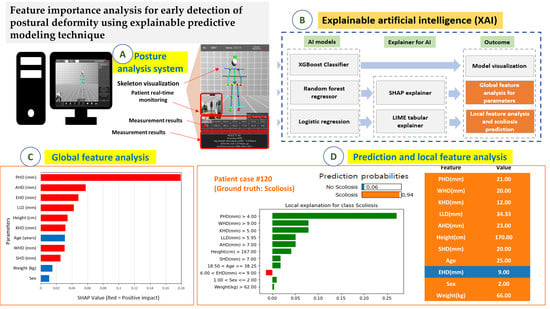
:This study aimed to analyze feature importance by applying explainable artificial intelligence (XAI) to postural deformity parameters extracted from a computer vision-based posture analysis system (CVPAS). Overall, 140 participants were screened for CVPAS and enrolled. The main data analyzed were shoulder height difference (SHD), wrist height difference (WHD), and pelvic height difference (PHD) extracted using a CVPAS. Standing X-ray imaging and radiographic assessments were performed. Predictive modeling was implemented with XGBoost, random forest regressor, and logistic regression using XAI techniques for global and local feature analyses. Correlation analysis was performed between radiographic assessment and AI evaluation for PHD, SHD, and Cobb angle. Main global features affecting scoliosis were analyzed in the order of importance for PHD (0.18) and ankle height difference (0.06) in predictive modeling. Outstanding local features were PHD, WHD, and KHD that predominantly contributed to the increase in the probability of scoliosis, and the prediction probability of scoliosis was 94%. When the PHD was >3 mm, the probability of scoliosis increased sharply to 85.3%. The paired t-test result for AI and radiographic assessments showed that the SHD, Cobb angle, and scoliosis probability were significant (p < 0.05). Feature importance analysis using XAI to postural deformity parameters extracted from a CVPAS is a useful clinical decision support system for the early detection of posture deformities. PHD was a major parameter for both global and local analyses, and 3 mm was a threshold for significantly increasing the probability of local interpretation of each participant and the prediction of postural deformation, which leads to the prediction of participant-specific scoliosis.
1. Introduction
Normal spinal posture is essential for maintaining spine health and biomechanical function including longevity. However, changes in physiological spinal curvature occur through natural aging or pathological processes because of various causes [1]. Early functional changes gradually accelerate, leading to irreversible and structural spinal deformation. Functional or structural spinal deformation affects spinal posture balance, causing uneven height differences between the shoulders and pelvis, and changes the axis of normal weight distribution causing deformation that protrudes unilaterally from the coronary plane of the spine. This imbalance in weight distribution further increases the difference in the asymmetric height between the shoulder and pelvis, causing structural deformation and pain in the spinal curve where pressure is concentrated [2,3]. The normal physiological spinal curvature can be restored through functional changes by removing or improving the factors that cause posture asymmetry. Maintaining spinal health is very important to detect posture imbalance before spinal deformation progresses irreversibly and results in structural spinal deformation. Specifically, early diagnosis of scoliosis should include not only structural scoliosis but also functional posture changes, and the normal posture should be restored by mitigating the cause of spinal deformation.
Some parameters are related to scoliotic detection. The parameters can be extracted through radiographic assessment and screening. Generally, the Cobb angle, age, weight, spinal vertebral rotation angle, pelvic height difference (PHD), and shoulder height difference (SHD) have been used for scoliosis diagnosis and scoring [4,5,6,7]. The presence, degree, and severity of scoliosis can be determined by identifying and calculating some characteristic features among various parameters.
The presence, degree, or severity of scoliosis is basically evaluated by measuring the curvature of the spine through X-ray imaging [8]. However, other studies have been conducted to evaluate the structural deformity by various methods than direct use of X-ray imaging [9,10]. Various predictive investigations of scoliosis have been reported in recent artificial intelligence (AI) research trends [11,12,13,14]. Alharbi et al. studied scoliosis prediction by using deep learning and calculating the Cobb angle (average error of 2.9°) using 800 X-ray images to replace manual Cobb angle measurement through radiographic assessment [11]. Yang et al. conducted deep learning research related to the screening system using non-ionizing radiation. They developed a machine learning algorithm that can identify cases with a curve ≥20° using 3640 unclothed back images [14].
Adolescent idiopathic scoliosis (AIS) is the most common spinal disease in adolescents, with a worldwide prevalence of 0.5–5.2% [2,15,16]. The aforementioned studies used artificial intelligence to develop high levels of prediction accuracy and performance but could not explain the inference process of the predictive models. Thus, it is necessary to apply the explainable artificial intelligence (XAI) technique that can explain the inference of the results like a white box given the black box characteristics of the machine learning model [17].
Spinal deformity diagnosis requires X-ray imaging to identify or monitor the disorder. During this process, the patients are exposed to radiation [8]. However, mild scoliosis can be observed without the use of regular radiation, and moderate-to-severe scoliosis can be detected at an early stage, providing an opportunity for treatment and posture correction using the detection system of postural deformity utilizing non-ionizing radiation. In this process, the aforementioned method using artificial intelligence can be applied. Various artificial intelligence studies have been published to quantitatively detect spinal deformities or scoliosis using only the radiographic images, but this study is characterized as an artificial intelligence study using feature importance analysis based on parameters extracted from a computer vision-based posture analysis system (Table 1).
In this study, postural deformity as a result of prediction probability was derived for the early detection of suspected scoliosis through artificial intelligence models based on skeleton point information extracted from the computer vision-based posture analysis system (CVPAS) using non-ionizing radiation. Moreover, contributions of prognostic factors to the results were analyzed by the inference process for the prediction outcomes.
2. Materials and Methods
In this section, the acquisition of dataset, the artificial intelligence models used, explainers, and evaluation method with a research diagram are described.
2.1. Data Acquisition and Participant Characteristics
First, 140 participants who visited the institutions for scoliosis examination from January 2020 to January 2021 were included. In these participants, the following difference metrics in upper and low body skeletal points were measured: shoulder height difference, elbow height difference (EHD), wrist height difference (WHD), pelvic height difference, knee height difference (KHD), and ankle height difference (AHD). A computer vision-based posture analysis system (PA3017; Driom, Incheon, South Korea) was used, and scoliosis diagnostic analysis results were obtained (Figure 1). The Cobb angle, shoulder height difference, and pelvic height difference were radiographically measured in standing body X-ray images.
2.2. Predictive Models and Model Explainers
Second, three machine learning models with two model explainers for predictive interpretation were used in this study. Extreme gradient boosting (XGBoost) is a decision tree-based ensemble machine learning algorithm using a gradient boosting framework. Gradient descent is used as the boosting method in the ensemble model [18]. Herein, a tree-based decision branch was used in the schematization. Random forest regressor is an ensemble method for learning multiple decision trees. Random forest can rank the importance of parameters (shoulder height difference, pelvic height difference, ankle height difference, etc.) for the predictive outcome to cause scoliosis [19]. Logistic regression was used to create a predictive model for the outcome by functionalizing the relationship between the dependent variable and the independent variable [20]. Briefly, as a method of explaining the dependent variable as a linear combination of independent variables, given input data, the result of the corresponding data was divided into a specific classification, that is, whether scoliosis will appear or not.
Shapley additive explanations (SHAP) originate from the method of calculating the contribution of each player to the outcome in game theory and can explain the contribution of prognostic factors affecting the prediction result in a machine learning model [21]. Local interpretable model-agnostic explanation (LIME) is a method that enables local interpretation of factors that contribute to the results of the machine learning model. Moreover, by calculating the contribution of individual parameters in the local data space, it is a method for interpretation with improved accuracy for each local case [22].
2.3. Research Process for Predictive Modeling
Third, XGBoost classifier, random forest regressor, and logistic regression were used for scoliosis predictive modeling (Figure 2). A 5-fold cross-validation method was used to maximize the use of data available for training and model testing. Relationships between features were evaluated using mutual information (MI) metrics. Shapley additive explanations and local interpretable model-agnostic explanation explainers were also used to implement an artificial intelligence model that can be explained in black box AI. Shapley additive explanations enable global interpretation of parameters for predicting scoliosis, and local interpretable model-agnostic explanations allow local interpretation for individual participants. Consequently, model visualization, feature analysis for parameters, and scoliosis prediction probability were analyzed. Paired t-test analysis was also performed on pelvic height difference, shoulder height difference, and scoliosis outcomes among the parameters for the Cobb angle, pelvic height difference, and shoulder height difference obtained through radiographic assessment and parameters obtained using a CVPAS with significance at p-value < 0.05. Python 3.8.3, scikit-learn 0.23.1 for predictive modeling, SHAP 0.36.0, and LIME 0.2.0.1 modules were used in the programming environment. IBM SPSS 25.0 was used for statistical analysis (Supplementary Materials).
3. Results
In this section, the results of predictive modeling performance, feature analysis for the parameters, and global and local interpretation are presented.
3.1. Radiographic Assessment and Statistical Analysis
First, the results of participant characteristics analysis are shown in Table 2. For the scoliosis curve, thoracic, thoracolumbar, and lumbar types were combined. When the Cobb angle was <10°, the normal type was indicated. The radiographic assessment results of the participants were analyzed to obtain the Cobb angle (mean 6.16° ± 8.50), SHD (mean 1.12 ± 3.27 mm), and PHD (mean 2.89 ± 4.22 mm). The values of the parameters for predictive modeling are continuous variables. Moreover, the results obtained through the three variables and the posture analysis system, and the results obtained through the paired t-test, are shown in Figure 3. Significant parameters were SHD, Cobb angle, and scoliosis (p < 0.001).
3.2. Predictive Modeling Performance
Second, the performance of each machine learning model used for predictive modeling is shown in Table 3. The maximum scores of the training and test split sets due to k-fold cross-validation are described. The mean accuracy, sensitivity, specificity, and area under the curve (AUC) of the three models were 0.79 ± 0.00, 0.78 ± 0.05, 0.80 ± 0.02, and 0.77 ± 0.11, respectively.
3.3. Model Visualization for the Predictive Model
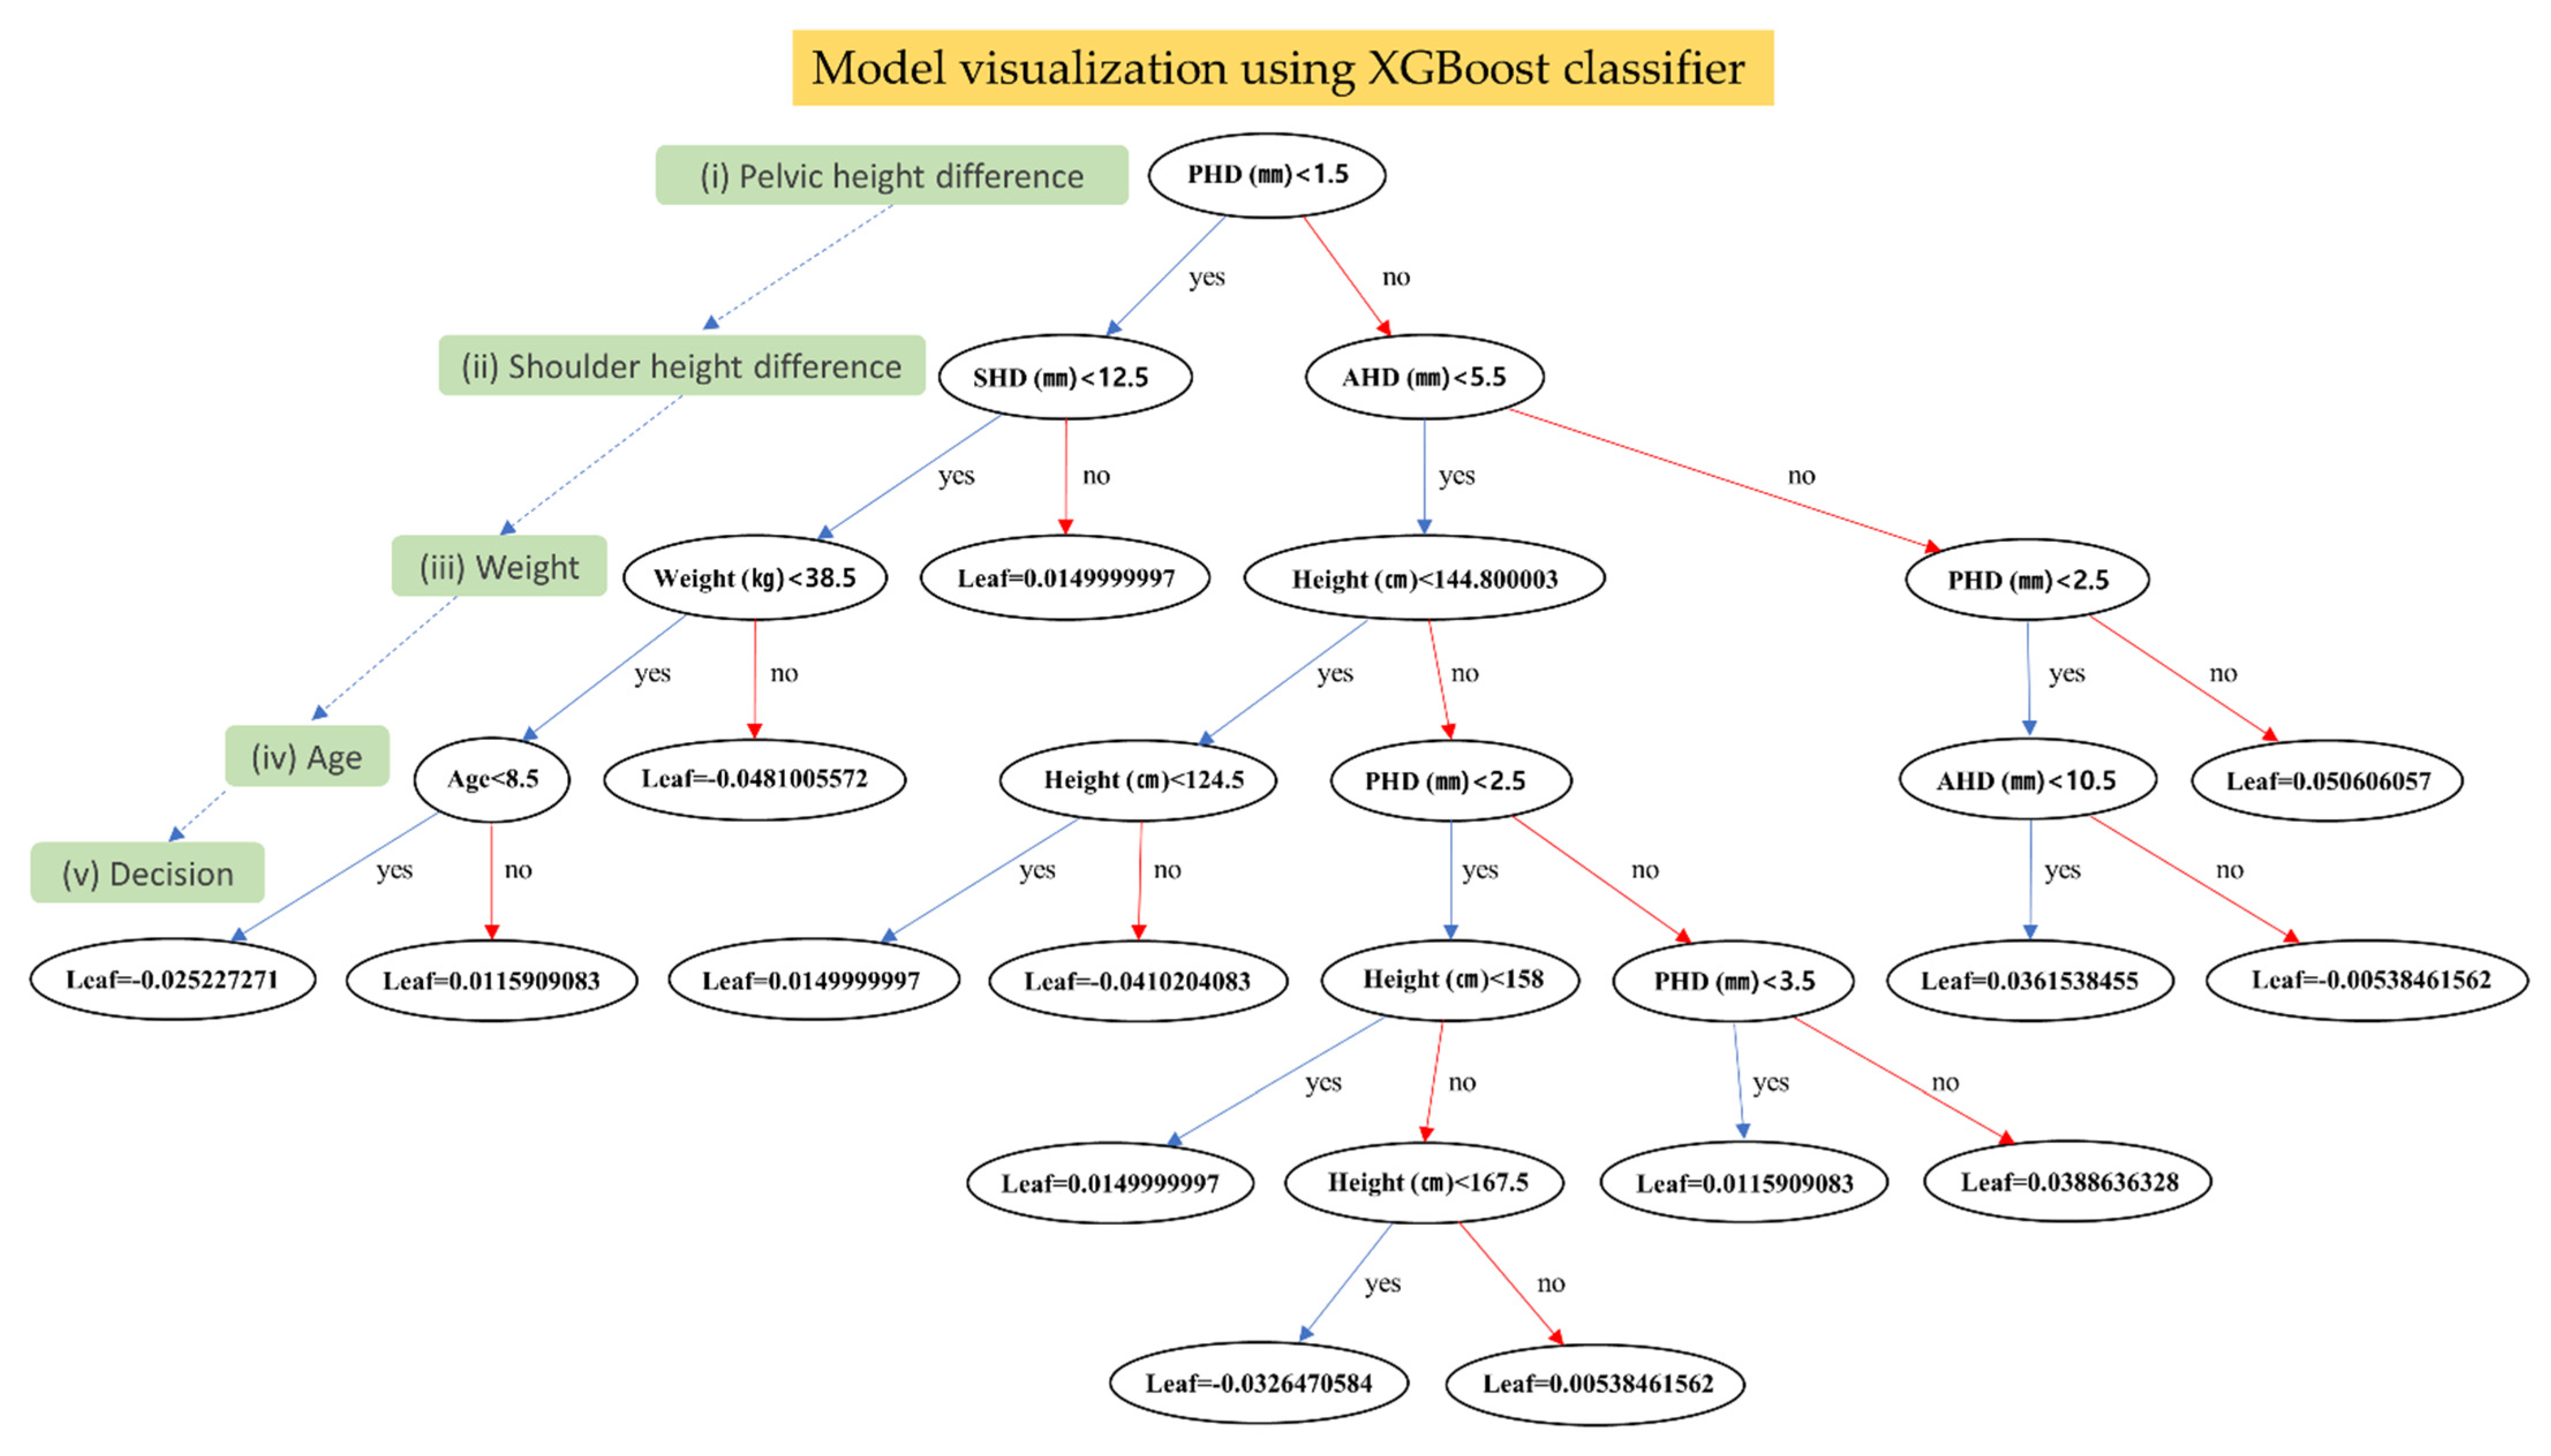
Third, results of the visual analysis of the scoliosis predictive model using the aforementioned parameters are presented in Figure 4. The model architecture was visualized by charting the decision-making process for XGBoost. It can help users better understand the flow of judgment going on inside the model. The metric is important not only to describe the performance of the model, but to understand the thresholds of each feature and the output values by each node. In detail, XGBoost classifier considers ankle height difference when PHD (mm) is greater than the threshold value of 1.5 mm and develops the scoliosis probability based on the PHD value of 2.5 mm (the most right outer branch and leaf). It also indicated that the tree was constructed using PHD, SHD, ankle height difference, weight, height, age, and their respective threshold values for scoliosis prediction.
3.4. Feature Analysis for the Parameters and Global Interpretation
Fourth, in order to identify relevant features of the model in the dataset, it is necessary to remove less important features that do not significantly contribute to the occurring spinal deformity. Key feature selection is the process of selecting the features that contribute the most to the output. Thus, feature importance by Shapley additive explanations gives a score for each feature in the data, and the higher the score, the more important or relevant the feature to spinal deformity. PHD, ankle height difference, and elbow height difference were analyzed as factors affecting scoliosis (in this order) in predictive modeling (Figure 5A). Red and blue bars mean positive and negative effects, respectively. That is, the greater the difference in PHD, the greater the probability of scoliosis diagnosis, and the younger the age, the greater the predictive probability of scoliosis. However, this importance cannot be applied to each participant. Meanwhile, the contribution was analyzed in the order of PHD, age, knee height difference, and wrist height difference in a specific participant (participant #15) with a predictive probability of scoliosis of 90%. That is, the interpretation indicates that the order of factors is different from Figure 5A (Figure 5B).
3.5. Scoliosis Prediction and Local Interpretation
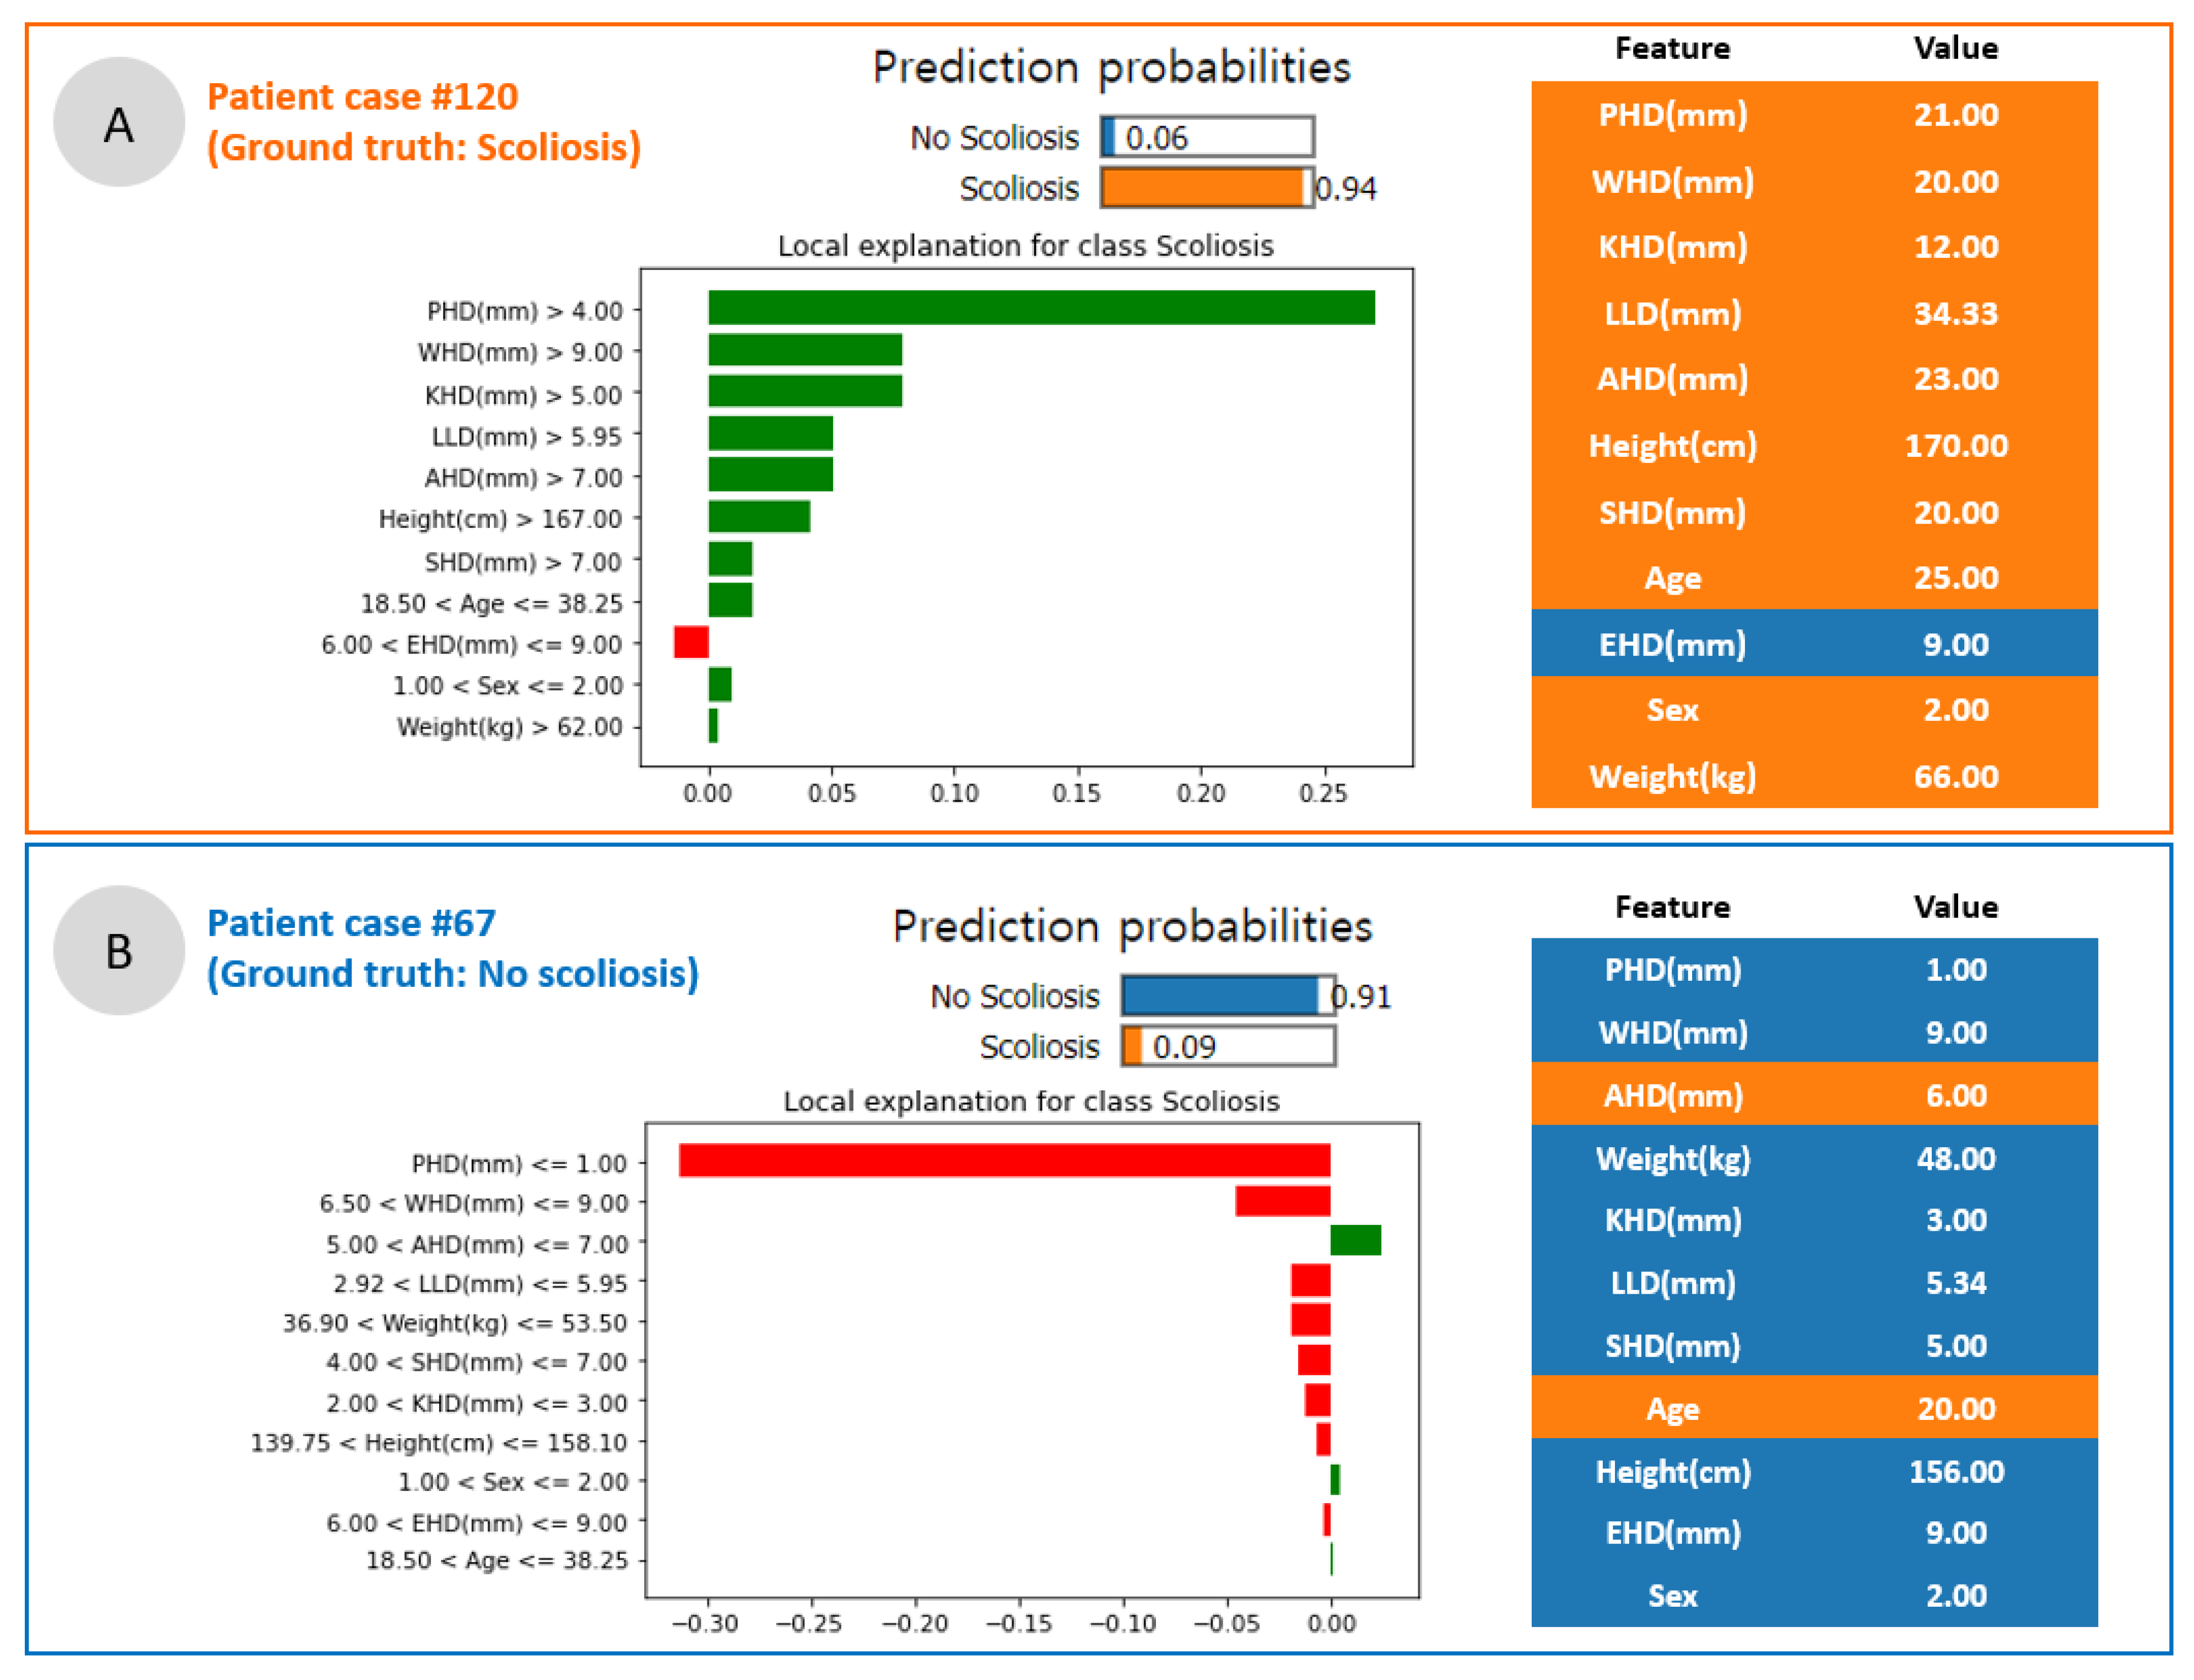
Fifth, scoliosis prediction results and feature importance for each participant are indicated in Figure 6. Participant #120 (female of 25 years old) was diagnosed with lumbar scoliosis with a Cobb angle of 11° on radiographic assessment. For this participant, the predictive probability of scoliosis was 94%, and PHD, wrist height difference, and knee height difference (green bars: positive effect) analyzed with high height differences were examined as important factors that predominantly increased the probability of scoliosis (Figure 6A). Conversely, in a 20-year-old woman with a Cobb angle of 0° and healthy spine curve, the predictive probability of scoliosis was 9%, and PHD and wrist difference of low height (red bars: negative effect) were analyzed as important factors that contributed to lowering the probability of occurrence of scoliosis (Figure 6B).
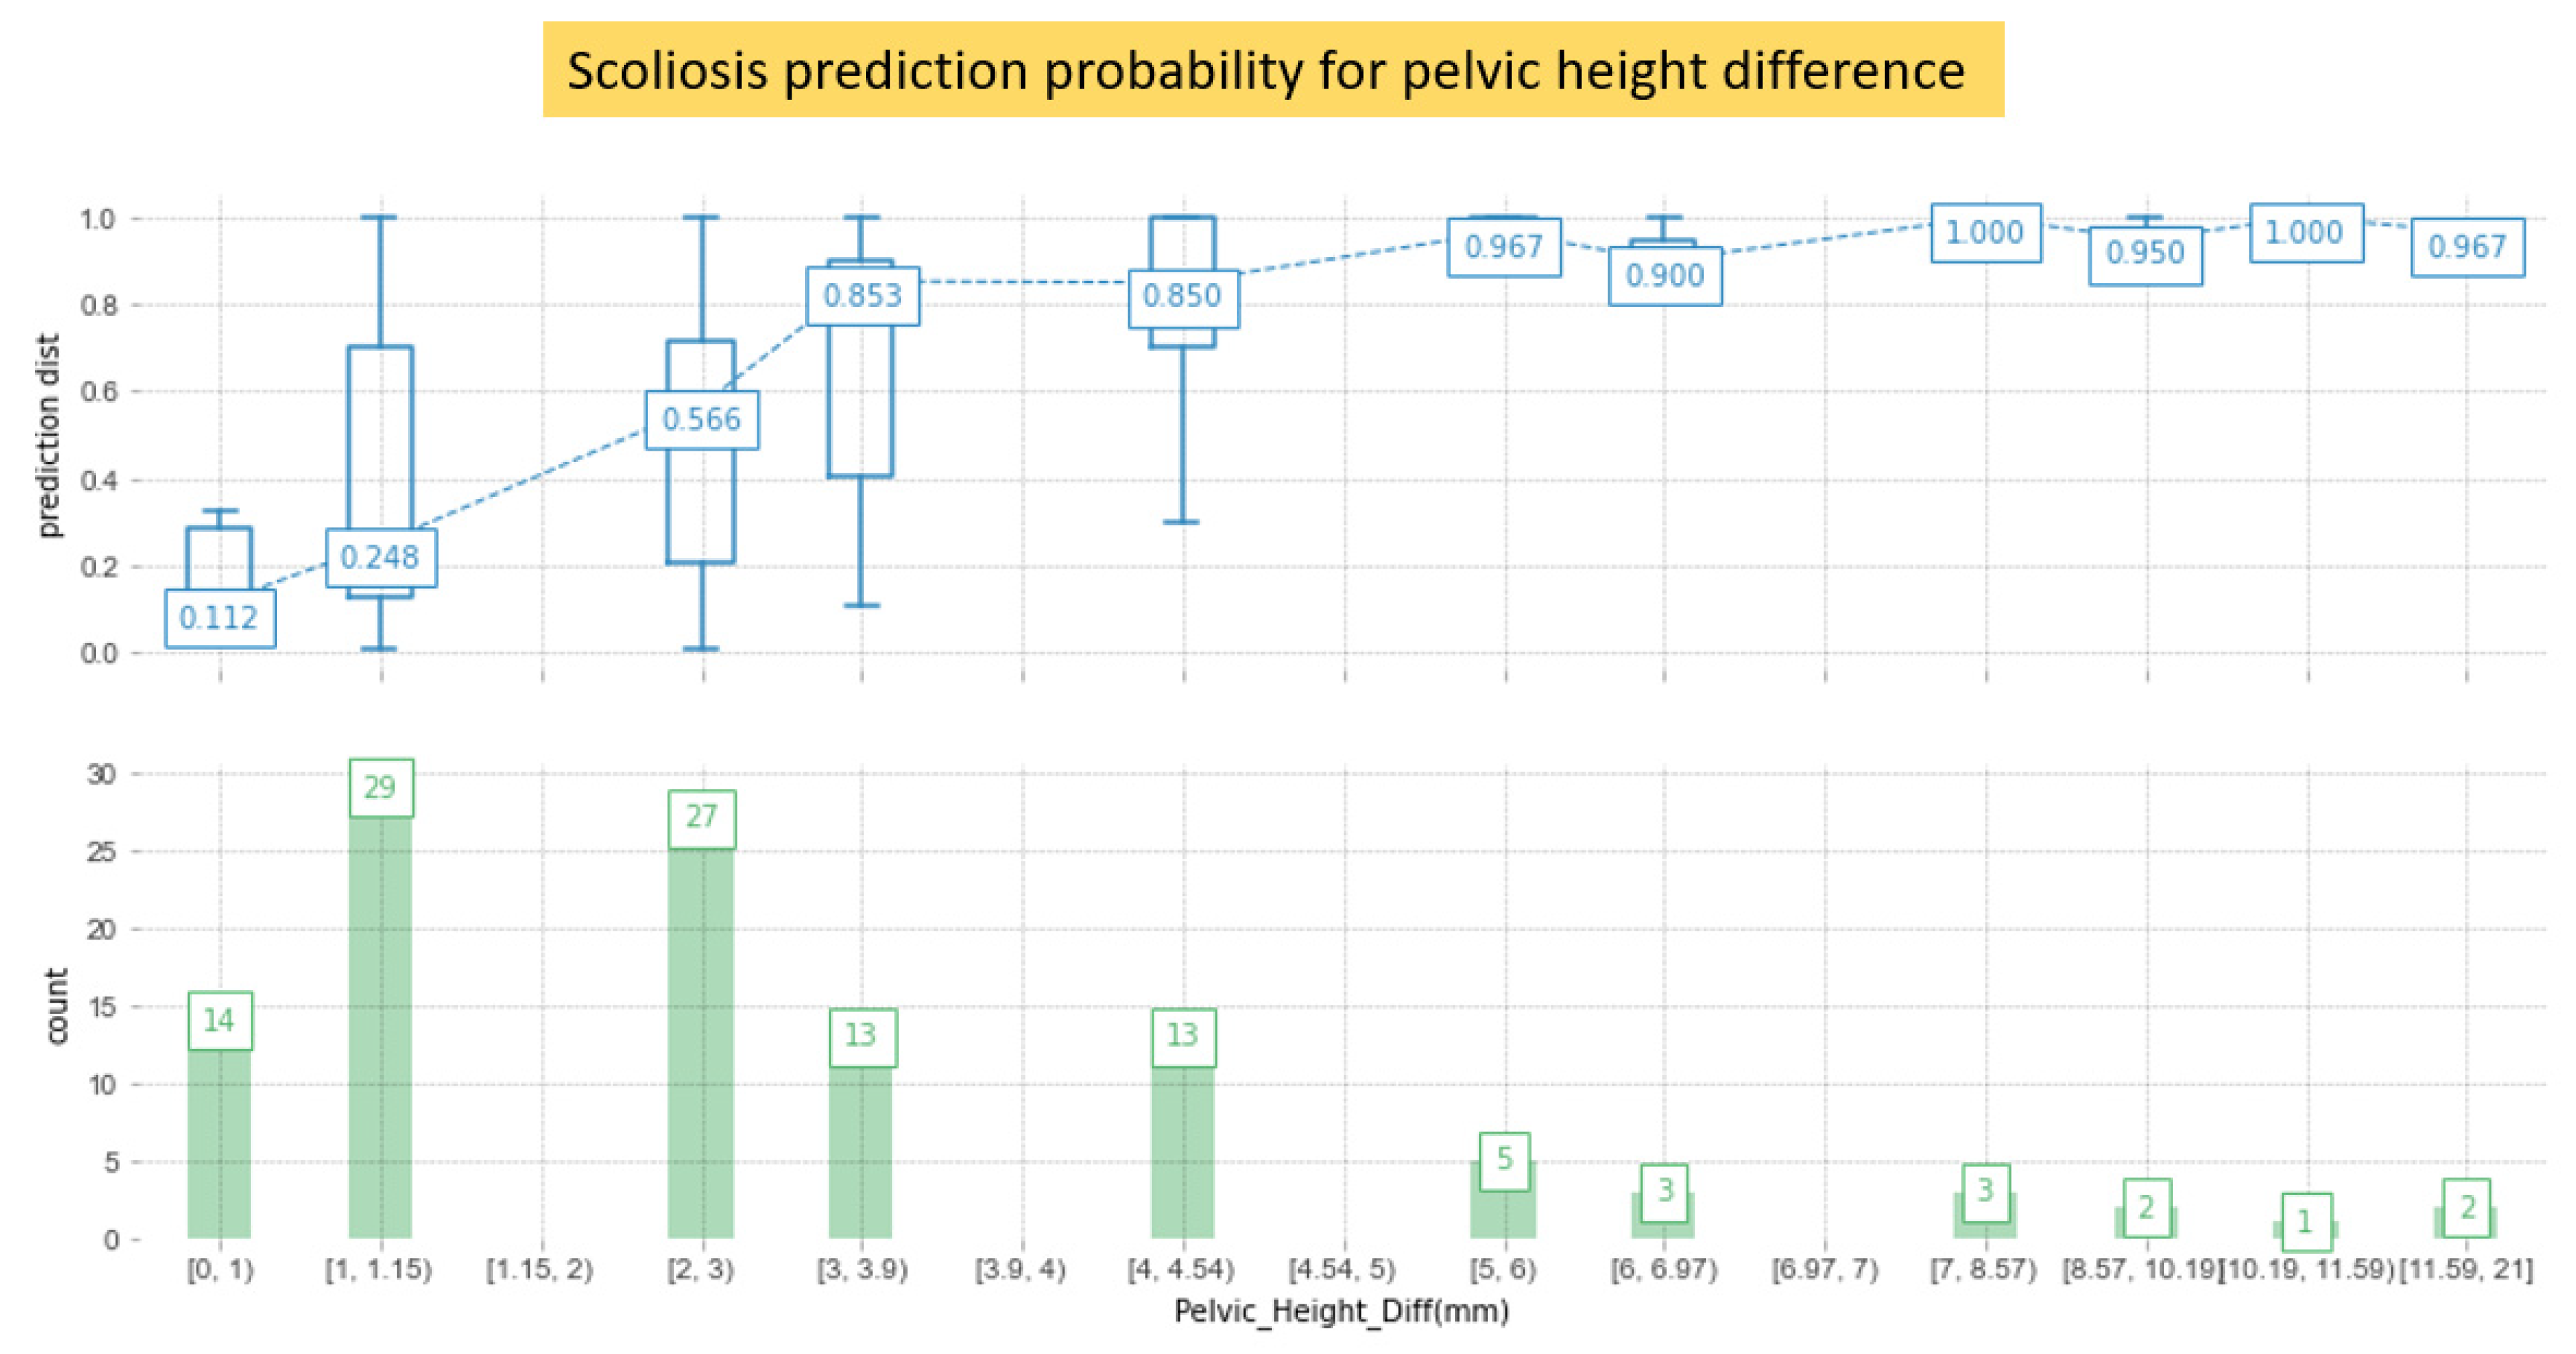
Conversely, the distribution of predictions using detailed numerical values, in which PHD was one of the dominant parameters that affected scoliosis, was analyzed (Figure 7). If the PHD is <2 mm, the prediction probability is small at 24.6%. However, if the PHD is >3 mm, the probability of diagnosing scoliosis sharply increases to 85.3%.
Finally, mutual information (MI) metrics were evaluated in Table 4. MI is a measure of the similarity between two features in the same dataset. In Table 4, PHD (0.22) and knee height difference (0.09) are the most dependent factors, but wrist height difference (0.00) and ankle height difference (0.00) are independent factors. This means that PHD and knee height difference are related to the lower extremities in body parts. However, age and weight factors are less dependent. They relate to the output of spinal deformities in the same dataset.
4. Discussion
The clinical decision support system (CDSS) is leading the paradigm shift in modern medical diagnosis and treatment [23]. Recently, in various studies for screening scoliosis, machine learning or deep learning methods have been implemented in radiographic image analysis to classify and predict an early diagnosis of changes in the spinal curvature [13,14]. Tajdari et al. reported that CDSS applying mechanical neural network modeling to the spinal model of each patient was very useful for the early detection of AIS [13,14].
With further improvements in CDSS development and utilization, more studies are being conducted for the development and application of parameters such as age, height, weight, gender, gait features, electromyography, and mechanical characteristics of the spine for screening prediction [10,13,24,25].
In this study, postural parameters for scoliosis detection such as PHD, SHD, and WHD were evaluated using an AI prediction algorithm combined with CVPAS and CDSS, and the AI model predicted the scoliosis of each participant and analyzed features related to scoliosis.
4.1. Scoliosis Screening System Combined with AI
By inferring the causal relationship between the results of predictive modeling and parameters, this study is different from studies that combine physical information with adapted participant-specific skeletal points and their difference, and AI was provided by a CVPAS [11,14] in Table 5. However, if three-dimensional (3D) image information can be extracted in addition to Cobb angle measurement and SHD and PHD obtained from the scoliosis screening system, it will be possible to further improve both geometrical and analytic accuracy. For example, Pasha et al. used 3D spinal alignment (vertebral positions and rotations) data, and Tajdari et al. used participant-specific spinal bone geometry using surface registration [12,13]. When using 3D images for the input dataset, AI models that process tabular data should be replaced with neural network-based models. In this study, we tried to analyze postural features such as PHD, SHD, and WHD using the explainable artificial intelligence algorithm, and to provide an explainability for the prediction results using the SHAP and local interpretable model-agnostic explanation methods for each participant’s spinal deformity probability (Table 5).
4.2. Use of Explainable Artificial Intelligence for In-Depth Predictive Modeling
AI models have the limitation of being a black box, as it does not reveal information on the processes and mechanisms [17]. Thus, the interpretability of AI models was introduced [17]. However, there is a trade-off between model interpretability and model accuracy [26]. For example, rule-based learning and logistic regression have lower model accuracy than deep learning but higher model interpretability [26]. Meanwhile, the accuracy of the prediction result may vary depending on the bias of the input dataset because the output is predicted based on a model that has been trained and established according to the characteristics of the input dataset [26]. The accuracy presented in this study used logistic regression and random forest, as shown in Table 3. The accuracy of the model is relatively lower than that of deep learning models that show higher accuracy performance. However, we used models with better explanatory capabilities to evaluate the interpretation ability of CDSS combining CVPAS and AI [26]. Ultimately, the optimal model-specific analysis that can improve both model interpretability and accuracy is required in developing an AI algorithm through predictive modeling. Therefore, our study requires an optimized modeling approach adapted to improve both model interpretability and accuracy in subsequent studies.
4.3. Global vs. Local Interpretation for the Parameters
In Figure 5, global feature importance was analyzed using SHAP. Briefly, it is optimal to list representative values for parameters sequentially through the generalization of parameters for all participants. However, this is an analysis of the average effect on all participants, and results do not apply to each participant. Therefore, to overcome this limitation, the local interpretable model-agnostic explanations analysis method was used (Figure 6). LIME enables local interpretation for individual participants, enabling the analysis of participant-specific parameters. Ultimately, the predictive probabilities of AI models should be more accurate in each case than their average predictive accuracy. Meanwhile, the use of the LIME model causes a stability issue. When the model is employed recurrently under the same conditions it may return different results. However, we did not conduct further studies to improve the stability of LIME. Note that complementary indices such as the variables stability index (VSI) and coefficients stability index (CSI) can be used to evaluate stability improvement for increasing performance of the prediction system [27].
4.4. Limitations of Dataset
How much of the dataset can we use to maximize the accuracy of AI models? It has been a critical subject of much debate so far. Although we used 140 patients’ data in this study, we intuitively know that the prediction accuracy of the model can be improved by using a larger number of datasets with various deviations [28]. One of the reasons for the difficulty in using AI applications through predictive modeling in clinics includes the lack of dataset [29]. The distribution of the Cobb angle to predict scoliosis in the study participants was 6.16° ± 8.50 (Table 2). Therefore, the dataset cannot be used as a training dataset to analyze mild and severe scoliosis (Cobb angle > 40°). Therefore, the results of this study can be applied to normal and mild scoliosis predictive modeling. In addition, this study used a clinical tabular dataset to reveal the correlation between scoliosis-related parameters by extracting participant characteristics through the CVPAS. Therefore, it was difficult to apply data augmentation using image rotation and transformation adapting in deep learning applications using images [30]. However, the data augmentation studies related to parameters can be considered in the next study. The use of cross validation to improve accuracy using insufficient datasets will be an example of model optimization.
5. Conclusions
Analyzing the feature importance using explainable artificial intelligence (XAI) to postural deformity parameters extracted from a computer vision-based posture analysis system (CVPAS) is a useful prediction method for the early detection of postural deformities. It was found that the pelvic height difference (PHD) was the most influential parameter for both global and local analyses, and 3 mm was the threshold to significantly increase the probability of local interpretation of each participant and the prediction of postural deformation, which leads to the prediction of participant-specific scoliosis. Complementary indices such as the variables stability index (VSI) and coefficients stability index (CSI) can also be evaluated regarding stability improvement of explainer models in a further study.
Supplementary Materials
The following are available online at https://0-www-mdpi-com.brum.beds.ac.uk/article/10.3390/app12020925/s1, the code for this study is attached.
Author Contributions
Conceptualization: K.H.K., M.-J.S., W.-J.C.; recruitment and management of participants: W.-J.C., M.-J.S.; data acquisition and system management: W.-J.C.; data curation and formal analysis: K.H.K.; investigation: K.H.K., M.-J.S., W.-J.C.; methodology: K.H.K., W.-J.C., M.-J.S.; supervision: M.-J.S.; validation: K.H.K., M.-J.S., W.-J.C.; writing–original draft: K.H.K.; writing–review & editing: K.H.K., M.-J.S., W.-J.C. All authors have read and agreed to the published version of the manuscript.
Funding
This research was supported by the Basic Science Research Program through the National Research Foundation of Korea (NRF) funded by the Ministry of Education (NRF-2020R1I1A3073930).
Institutional Review Board Statement
Not applicable.
Informed Consent Statement
Not applicable.
Data Availability Statement
Not applicable but the research code was attached.
Conflicts of Interest
The authors declare no conflict of interest.
References
- Hawes, M.C.; O’brien, J.P. The transformation of spinal curvature into spinal deformity: Pathological processes and implications for treatment. Scoliosis 2006, 1, 1–9. [Google Scholar] [CrossRef] [PubMed] [Green Version]
- Balagué, F.; Pellisé, F. Adolescent idiopathic scoliosis and back pain. Scoliosis Spinal Disord. 2016, 11, 1–15. [Google Scholar] [CrossRef] [PubMed] [Green Version]
- Improvement of back pain with operative and nonoperative treatment in adults with scoliosis. Neurosurgery 2009, 65, 86–94. [CrossRef]
- Akel, I.; Pekmezci, M.; Hayran, M.; Genc, Y.; Kocak, O.; Derman, O.; Erdoğan, I.; Yazici, M. Evaluation of shoulder balance in the normal adolescent population and its correlation with radiological parameters. Eur. Spine J. 2008, 17, 348–354. [Google Scholar] [CrossRef] [Green Version]
- Malfair, D.; Flemming, A.K.; Dvorak, M.F.; Munk, P.L.; Vertinsky, A.T.; Heran, M.K.; Graeb, D.A. Radiographic evaluation of scoliosis. Am. J. Roentgenol. 2010, 194, S8–S22. [Google Scholar] [CrossRef] [PubMed] [Green Version]
- Soucacos, P.N.; Zacharis, K.; Soultanis, K.; Gelalis, J.; Xenakis, T.; Beris, A.E. Risk factors for idiopathic scoliosis: Review of a 6-year prospective study. Orthopedics 2000, 23, 833–838. [Google Scholar] [CrossRef]
- Walker, A.; Dickson, R. School screening and pelvic tilt scoliosis. Lancet 1984, 324, 152–154. [Google Scholar] [CrossRef]
- Alrehily, F.; Hogg, P.; Twiste, M.; Johansen, S.; Tootell, A. Scoliosis imaging: An analysis of radiation risk in the CT scan projection radiograph and a comparison with projection radiography and EOS. Radiography 2019, 25, e68–e74. [Google Scholar] [CrossRef]
- Mahaudens, P.; Banse, X.; Mousny, M.; Detrembleur, C. Gait in adolescent idiopathic scoliosis: Kinematics and electromyographic analysis. Eur. Spine J. 2009, 18, 512–521. [Google Scholar] [CrossRef] [Green Version]
- Cho, J.-s.; Cho, Y.-S.; Moon, S.-B.; Kim, M.-J.; Lee, H.D.; Lee, S.Y.; Ji, Y.-H.; Park, Y.-S.; Han, C.-S.; Jang, S.-H. Scoliosis screening through a machine learning based gait analysis test. Int. J. Precis. Eng. Manuf. 2018, 19, 1861–1872. [Google Scholar] [CrossRef]
- Alharbi, R.H.; Alshaye, M.B.; Alkanhal, M.M.; Alharbi, N.M.; Alzahrani, M.A.; Alrehaili, O.A. Deep Learning Based Algorithm For Automatic Scoliosis Angle Measurement. In Proceedings of the 2020 3rd International Conference on Computer Applications & Information Security (ICCAIS), Riyadh, Saudi Arabia, 19–21 March 2020; pp. 1–5. [Google Scholar]
- Pasha, S.; Shah, S.; Newton, P.; Group, H.S. Machine Learning Predicts the 3D Outcomes of Adolescent Idiopathic Scoliosis Surgery Using Patient–Surgeon Specific Parameters. Spine 2021, 46, 579–587. [Google Scholar] [CrossRef]
- Tajdari, M.; Pawar, A.; Li, H.; Tajdari, F.; Maqsood, A.; Cleary, E.; Saha, S.; Zhang, Y.J.; Sarwark, J.F.; Liu, W.K. Image-based modelling for Adolescent Idiopathic Scoliosis: Mechanistic machine learning analysis and prediction. Comput. Methods Appl. Mech. Eng. 2021, 374, 113590. [Google Scholar] [CrossRef]
- Yang, J.; Zhang, K.; Fan, H.; Huang, Z.; Xiang, Y.; Yang, J.; He, L.; Zhang, L.; Yang, Y.; Li, R. Development and validation of deep learning algorithms for scoliosis screening using back images. Commun. Biol. 2019, 2, 1–8. [Google Scholar] [CrossRef]
- Cheng, J.C.; Castelein, R.M.; Chu, W.C.; Danielsson, A.J.; Dobbs, M.B.; Grivas, T.B.; Gurnett, C.A.; Luk, K.D.; Moreau, A.; Newton, P.O. Adolescent idiopathic scoliosis. Nat. Rev. Dis. Primers 2015, 1, 1–21. [Google Scholar] [CrossRef] [PubMed] [Green Version]
- Hresko, M.T.; Talwalkar, V.; Schwend, R. Early detection of idiopathic scoliosis in adolescents. JBJS 2016, 98, e67. [Google Scholar] [CrossRef] [PubMed] [Green Version]
- Gunning, D.; Stefik, M.; Choi, J.; Miller, T.; Stumpf, S.; Yang, G.-Z. XAI—Explainable artificial intelligence. Sci. Robot. 2019, 4, eaay7120. [Google Scholar] [CrossRef] [Green Version]
- Chen, T.; He, T.; Benesty, M.; Khotilovich, V.; Tang, Y.; Cho, H. Xgboost: Extreme gradient boosting. R Package Version 0.4-2. Microsoft. 2015, 1, 1–4. [Google Scholar]
- Segal, M.R. Machine Learning Benchmarks and Random Forest Regression; Kluwer Academic Publisher: Dordrecht, The Netherlands, 2004. [Google Scholar]
- Christodoulou, E.; Ma, J.; Collins, G.S.; Steyerberg, E.W.; Verbakel, J.Y.; Van Calster, B. A systematic review shows no performance benefit of machine learning over logistic regression for clinical prediction models. J. Clin. Epidemiol. 2019, 110, 12–22. [Google Scholar] [CrossRef]
- Van den Broeck, G.; Lykov, A.; Schleich, M.; Suciu, D. On the tractability of SHAP explanations. arXiv 2020, arXiv:2009.08634. [Google Scholar]
- Ribeiro, M.T.; Singh, S.; Guestrin, C. Model-agnostic interpretability of machine learning. arXiv 2016, arXiv:1606.05386. [Google Scholar]
- Sutton, R.T.; Pincock, D.; Baumgart, D.C.; Sadowski, D.C.; Fedorak, R.N.; Kroeker, K.I. An overview of clinical decision support, systems: Benefits, risks, and strategies for success. NPJ Digit. Med. 2020, 3, 1–10. [Google Scholar] [CrossRef] [Green Version]
- Chen, K.; Zhai, X.; Sun, K.; Wang, H.; Yang, C.; Li, M. A narrative review of machine learning as promising revolution in clinical practice of scoliosis. Ann. Transl. Med. 2021, 9. [Google Scholar] [CrossRef] [PubMed]
- Liang, R.; Yip, J.; To, K.-T.M.; Fan, Y. Machine Learning Approaches to Predict Scoliosis. In International Conference on Applied Human Factors and Ergonomics; Springer: Cham, Switzerland, 2021; pp. 116–121. [Google Scholar]
- Arrieta, A.B.; Díaz-Rodríguez, N.; Del Ser, J.; Bennetot, A.; Tabik, S.; Barbado, A.; García, S.; Gil-López, S.; Molina, D.; Benjamins, R. Explainable Artificial Intelligence (XAI): Concepts, taxonomies, opportunities and challenges toward responsible AI. Inf. Fusion 2020, 58, 82–115. [Google Scholar] [CrossRef] [Green Version]
- Visani, G.; Bagli, E.; Chesani, F.; Poluzzi, A.; Capuzzo, D. Statistical stability indices for LIME: Obtaining reliable explanations for machine learning models. J. Oper. Res. Soc. 2020, 1–11. [Google Scholar] [CrossRef]
- Deshpande, G.; Ruhe, G.; Saunders, C. How Much Data Analytics is Enough? The ROI of Machine Learning Classification and its Application to Requirements Dependency Classification. arXiv 2021, arXiv:2109.14097. [Google Scholar]
- Staartjes, V.E.; Stumpo, V.; Kernbach, J.M.; Klukowska, A.M.; Gadjradj, P.S.; Schröder, M.L.; Veeravagu, A.; Stienen, M.N.; van Niftrik, C.H.; Serra, C. Machine learning in neurosurgery: A global survey. Acta Neurochir. 2020, 162, 3081–3091. [Google Scholar] [CrossRef]
- Abdollahi, B.; Tomita, N.; Hassanpour, S. Data augmentation in training deep learning models for medical image analysis. In Deep Learners and Deep Learner Descriptors for Medical Applications; Springer: Cham, Switzerland, 2020; pp. 167–180. [Google Scholar]
Figure 1.
Participant data acquisition using computer vision-based posture analysis system for predictive modeling analysis.
Figure 1.
Participant data acquisition using computer vision-based posture analysis system for predictive modeling analysis.

Figure 2.
Research diagram for scoliosis predictive modeling. Global and local feature analyses were performed through the predictive modeling process using the explainable artificial intelligence technique. Radiographic assessment results and major parameters acquired from computer vision-based posture analysis systems were evaluated, and correlation analysis was also performed.

Figure 3.
Statistical analysis of the pelvic height difference, shoulder height difference, and scoliosis results between radiographic analysis and computer vision-based posture analysis using paired t-test.
Figure 3.
Statistical analysis of the pelvic height difference, shoulder height difference, and scoliosis results between radiographic analysis and computer vision-based posture analysis using paired t-test.

Figure 4.
Model visualization using XGBoost classifier which uses an ensemble boosting model with a decision tree structure.
Figure 4.
Model visualization using XGBoost classifier which uses an ensemble boosting model with a decision tree structure.

Figure 5.
Feature analysis for the parameters using global interpretation. (A) Shapley additive explanation values for dominant parameters in the order of importance for all 140 participants. (B) Specific case analysis for the parameter of the 15th participant among 140 participants.
Figure 5.
Feature analysis for the parameters using global interpretation. (A) Shapley additive explanation values for dominant parameters in the order of importance for all 140 participants. (B) Specific case analysis for the parameter of the 15th participant among 140 participants.

Figure 6.
Scoliosis prediction for specific cases using local interpretation. (A) A 25-year-old woman with 94% prediction probability and ground truth of 1 (Cobb angle 11°). (B) A 20-year-old woman with 9% prediction probability and ground truth of 0 (Cobb angle 0°).
Figure 6.
Scoliosis prediction for specific cases using local interpretation. (A) A 25-year-old woman with 94% prediction probability and ground truth of 1 (Cobb angle 11°). (B) A 20-year-old woman with 9% prediction probability and ground truth of 0 (Cobb angle 0°).

Figure 7.
Scoliosis prediction probability for one of the major parameters, i.e., PHD. A threshold value of 3 mm of PHD results in >85% probability for scoliosis prediction.
Figure 7.
Scoliosis prediction probability for one of the major parameters, i.e., PHD. A threshold value of 3 mm of PHD results in >85% probability for scoliosis prediction.


Table 1.
Artificial intelligence research using feature importance analysis to detect spinal deformity.
Table 1.
Artificial intelligence research using feature importance analysis to detect spinal deformity.
| Authors | Feature Importance | Dataset | Modeling | Outcome |
|---|---|---|---|---|
| Alharbi et al. [11] | None | Radiographic images | Deep learning | Scoliosis angle measurement |
| Pasha et al. [12] | None | Radiographic images | Machine learning | Surgical outcome |
| Tajdari et al. [13] | None | Radiographic images | Machine learning | Biomechanic prediction |
| Yang et al. [14] | None | Radiographic images | Deep learning | Scoliotic area prediction |
| This study | Shoulder height difference, wrist height difference, pelvic height difference, etc. | Tabular data | Machine learning | Feature importance analysis and postural deformity prediction |
Table 2.
Participant characteristics and parameters using a computer vision-based posture analysis system for predictive modeling analysis.
Table 2.
Participant characteristics and parameters using a computer vision-based posture analysis system for predictive modeling analysis.
| Category | Characteristics | Mean | p-Value | Data Type | Values | |
|---|---|---|---|---|---|---|
| Parameters from computer vision-based posture analysis system | Age (years) | 24.94 ± 17.36 | 0.245 | Float | 3 to 69 | |
| Sex | Male | 59 (42.14%) | 0.549 | Binary | 1: Male, | |
| Female | 81 (57.86%) | 2: Female | ||||
| Height (cm) | 153.43±18.57 | 0.671 | Float | 94 to 186 | ||
| Weight (kg) | 51.51±18.13 | 0.966 | Float | 14.6 to 98 | ||
| SHD (mm) | 4.91±4.78 | 0.142 | Float | 0 to 31 | ||
| EHD (mm) | 6.41±5.30 | 0.041 | Float | 0 to 36 | ||
| WHD (mm) | 7.29±7.26 | 0.017 | Float | 0 to 58 | ||
| PHD (mm) | 2.49±2.73 | <0.01 | Float | 0 to 21 | ||
| KHD (mm) | 3.94±3.73 | <0.01 | Float | 0 to 27 | ||
| AHD (mm) | 6.03±6.16 | <0.01 | Float | 0 to 39 | ||
| LLD (mm) | 4.54±4.73 | 0.005 | Float | 0 to 34.33 | ||
| Radiographic assessment | Cobb angle | 6.16°±8.50 | NA | |||
| SHD (mm) | 1.12±3.27 | |||||
| PHD (mm) | 2.89±4.22 | |||||
| Curve type | Normal range | 61 (43.57%) | ||||
| Thoracic | 39 (27.86%) | |||||
| Thoraco-lumbar | 22 (15.71%) | |||||
| lumbar | 18 (12.86%) | |||||
Note: SHD: shoulder height difference; EHD: elbow height difference; WHD: wrist height difference; PHD: pelvic height difference; KHD: knee height difference; AHD; ankle height difference; LLD: leg length discrepancy; Normal range: Cobb angle within 10 degrees; NA: not applicable.
Table 3.
Model performances for the predictive modeling.
| Models | Accuracy | Sensitivity | Specificity | AUC |
|---|---|---|---|---|
| Logistic regression | 0.78 | 0.72 | 0.83 | 0.63 |
| Random forest regression | 0.79 | 0.83 | 0.77 | 0.89 |
| XGBoost classifier | 0.79 | 0.79 | 0.79 | 0.79 |
| mean | 0.79 ± 0.00 | 0.78 ± 0.05 | 0.80 ± 0.02 | 0.77 ± 0.11 |
Table 4.
The mutual information (MI) of the parameter.
| Parameters | MI Scores |
|---|---|
| PHD (mm) | 0.22 |
| KHD (mm) | 0.09 |
| Age | 0.08 |
| LLD (mm) | 0.06 |
| Weight (kg) | 0.05 |
| EHD (mm) | 0.02 |
| WHD (mm) | 0.00 |
| Sex | 0.00 |
| Height (cm) | 0.00 |
| SHD (mm) | 0.00 |
| AHD (mm) | 0.00 |
Note: SHD: shoulder height difference; EHD: elbow height difference; WHD: wrist height difference; PHD: pelvic height difference; KHD: knee height difference; AHD; ankle height difference; LLD: leg length discrepancy; normal range.
Table 5.
AI studies for scoliosis or postural deformity analysis.
| Authors | Aim | Dataset (n) | AI models | Evaluation | Results | Year | Reference |
|---|---|---|---|---|---|---|---|
| Pasha et al. | To predict the 3D radiographic outcomes of the spinal surgery in AIS | 371 | Random forest | Accuracy and AUC | The surgical factors, upper and lower instrumented vertebrae, and the operating surgeon were important surgical predictors (Accuracy = 75% and Max AUC = 0.86) | 2021 | [12] |
| Tajdari et al. | To propose a mechanistic machine learning algorithm in order to study patient-specific AIS curve progression | 353 | Mechanistic neural network | RAE | Age identification using X-ray images (RAE for 68 months (1.37%), 84 months (2.55%) and 127 months (0.87%)) | 2021 | [13] |
| Alharbi et al. | Scoliosis prediction by using deep learning | 800 | Convolutional neural network | Accuracy | Absolute Cobb angledifference < 5° in 69 images, 5°–10° in 50 images, and 10°–15° in 45 images (Accuracy = 90%) | 2020 | [11] |
| Yang et al. | To develop screening system using non-ionizing radiation in order to identify cases with a curve ≥20° | 3640 | Faster-RCNN and Resnet | AUC, sensitivity, specificity, and PPV | The level of trunk asymmetry revealed in the heat maps (AUC (0.946), sensitivity (87.5%), specificity (83.5%), and PPV (86.2%)) | 2019 | [14] |
| Cho et al. | Automatic cognition of gaitchanges due to scoliosis using gait measures | 42 | Support vector machine | Accuracy, sensitivity, and specificity | Analysis of the lower limb joint angle based on gait phase segmentation and clustering of scoliosis patients (Accuracy (90.5%), specificity (88.8%), and sensitivity (91.6%)) | 2018 | [10] |
| This study | To analyze feature importance to postural deformity parameters extracted from a CVPAS | 140 | Logistic regression, random forest, and XGBoost with SHAP and LIME (XAI) | Accuracy, AUC, sensitivity, and specificity | PHD was a major parameter with a difference of 3 mm threshold (Mean accuracy (0.79), sensitivity (0.78), specificity (0.80), and AUC (0.77)) | Present | - |
Note: 3D: three-dimensional; AIS: adolescent idiopathic scoliosis; AUC: area under the curve; ROC: receiver operating characteristics; RAE: relative approximation error; RCNN: region-based convolutional neural network; ResNet: residual neural network; PPV: positive predictive value; CVPAS: computer vision-based posture analysis system; XGBoost: Extreme gradient boosting; SHAP: Shapley additive explanations; LIME: local interpretable model-agnostic explanations; XAI: explainable artificial intelligence.
Publisher’s Note: MDPI stays neutral with regard to jurisdictional claims in published maps and institutional affiliations. |
© 2022 by the authors. Licensee MDPI, Basel, Switzerland. This article is an open access article distributed under the terms and conditions of the Creative Commons Attribution (CC BY) license (https://creativecommons.org/licenses/by/4.0/).
Share and Cite
MDPI and ACS Style
Kim, K.H.; Choi, W.-J.; Sohn, M.-J. Feature Importance Analysis for Postural Deformity Detection System Using Explainable Predictive Modeling Technique. Appl. Sci. 2022, 12, 925. https://0-doi-org.brum.beds.ac.uk/10.3390/app12020925
AMA Style
Kim KH, Choi W-J, Sohn M-J. Feature Importance Analysis for Postural Deformity Detection System Using Explainable Predictive Modeling Technique. Applied Sciences. 2022; 12(2):925. https://0-doi-org.brum.beds.ac.uk/10.3390/app12020925
Chicago/Turabian StyleKim, Kwang Hyeon, Woo-Jin Choi, and Moon-Jun Sohn. 2022. "Feature Importance Analysis for Postural Deformity Detection System Using Explainable Predictive Modeling Technique" Applied Sciences 12, no. 2: 925. https://0-doi-org.brum.beds.ac.uk/10.3390/app12020925
Note that from the first issue of 2016, this journal uses article numbers instead of page numbers. See further details here.