
Influence of Wind Barriers with Different Curvatures on Crosswind Aerodynamic Characteristics of a Train-Bridge System


Abstract
:1. Introduction
2. Numerical Simulation
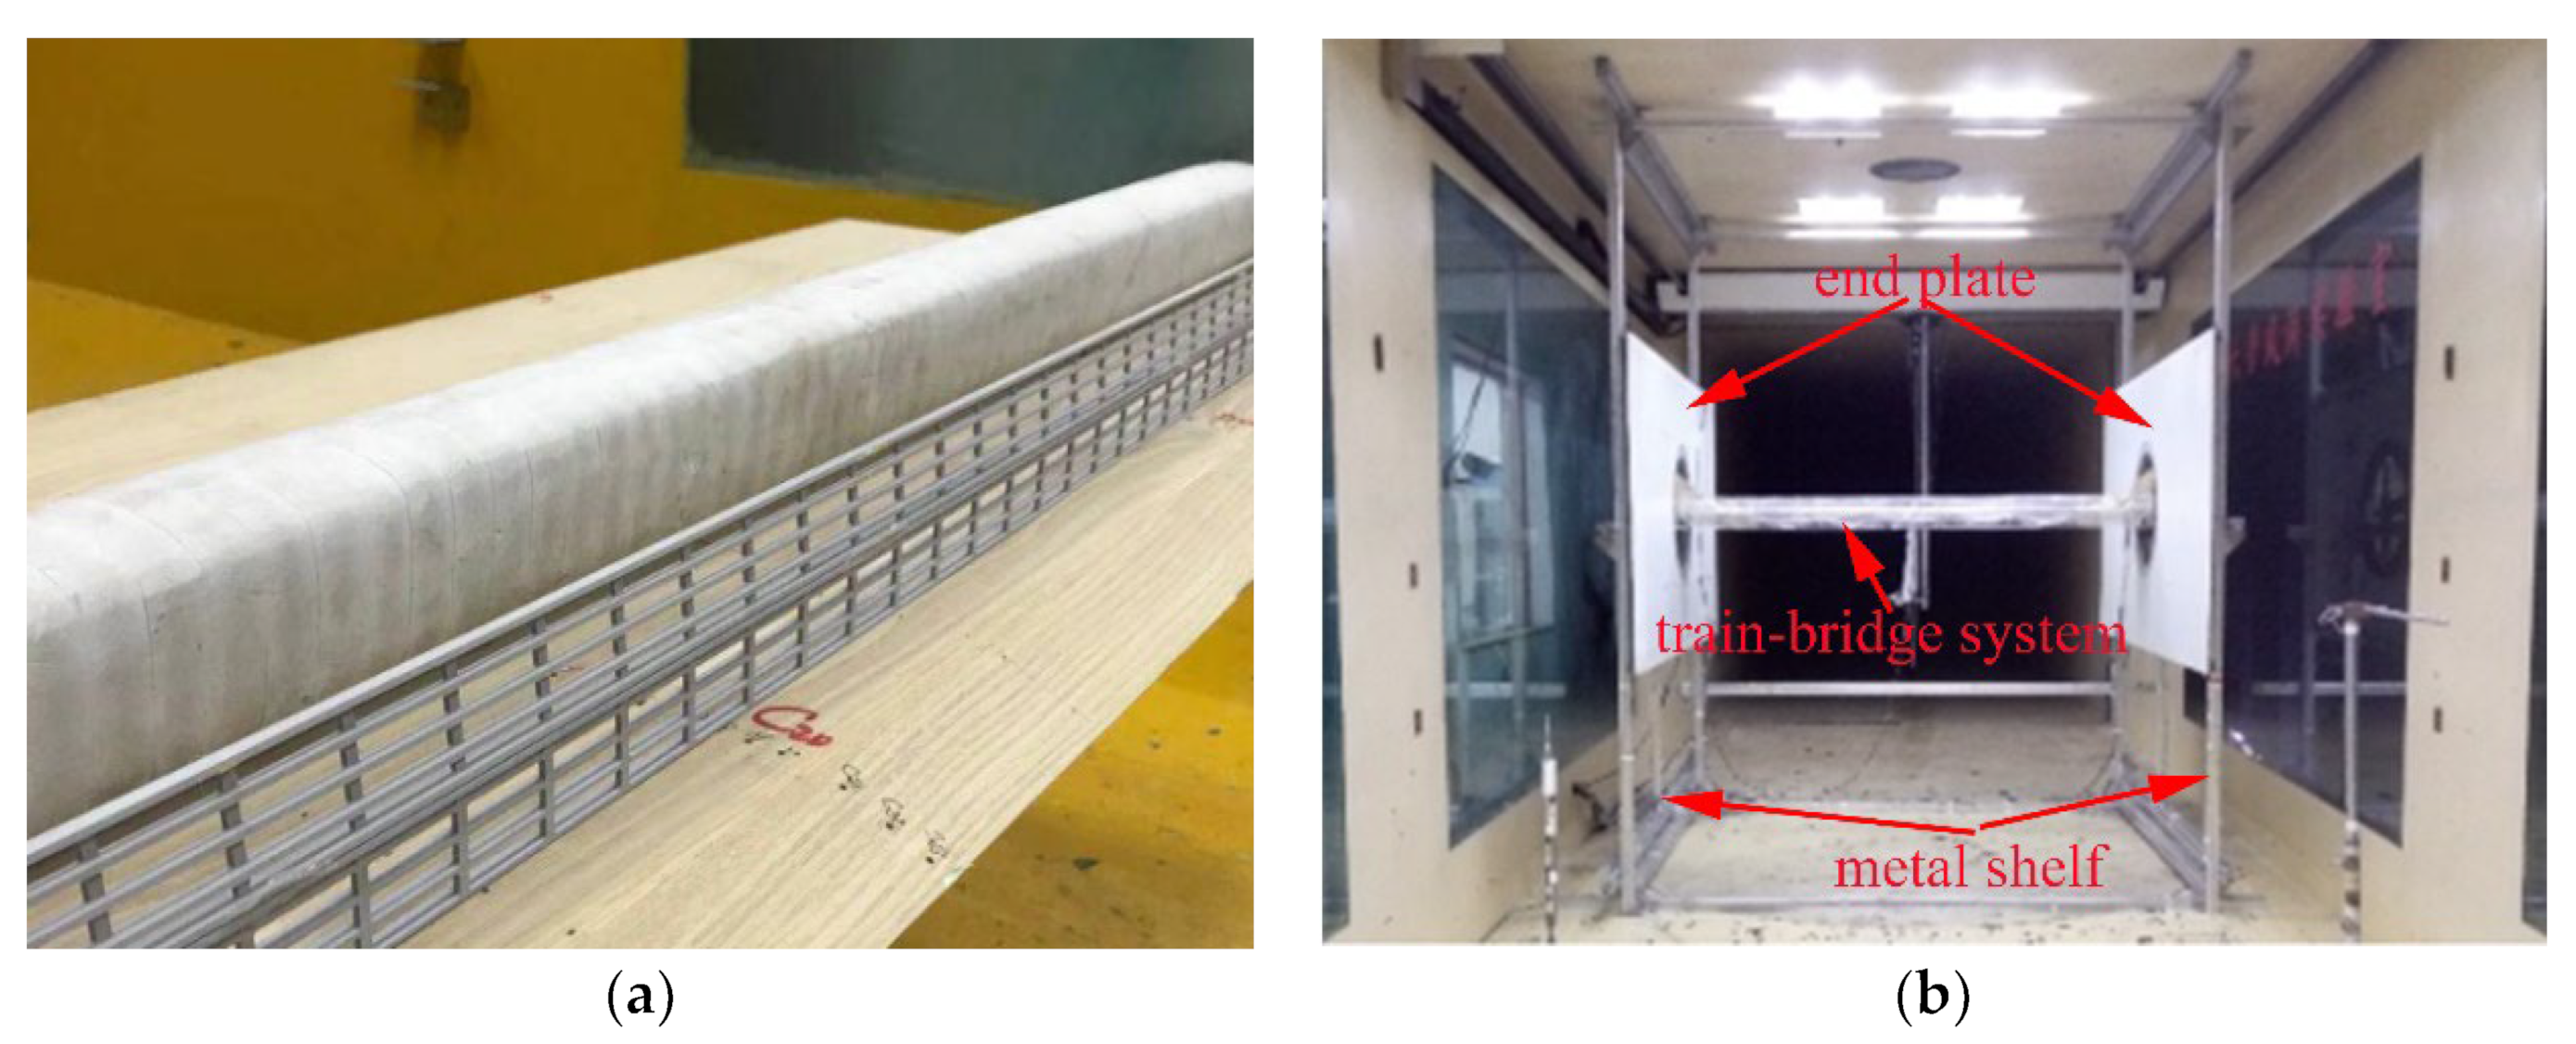
2.1. Geometric Model
2.2. Numerical Method
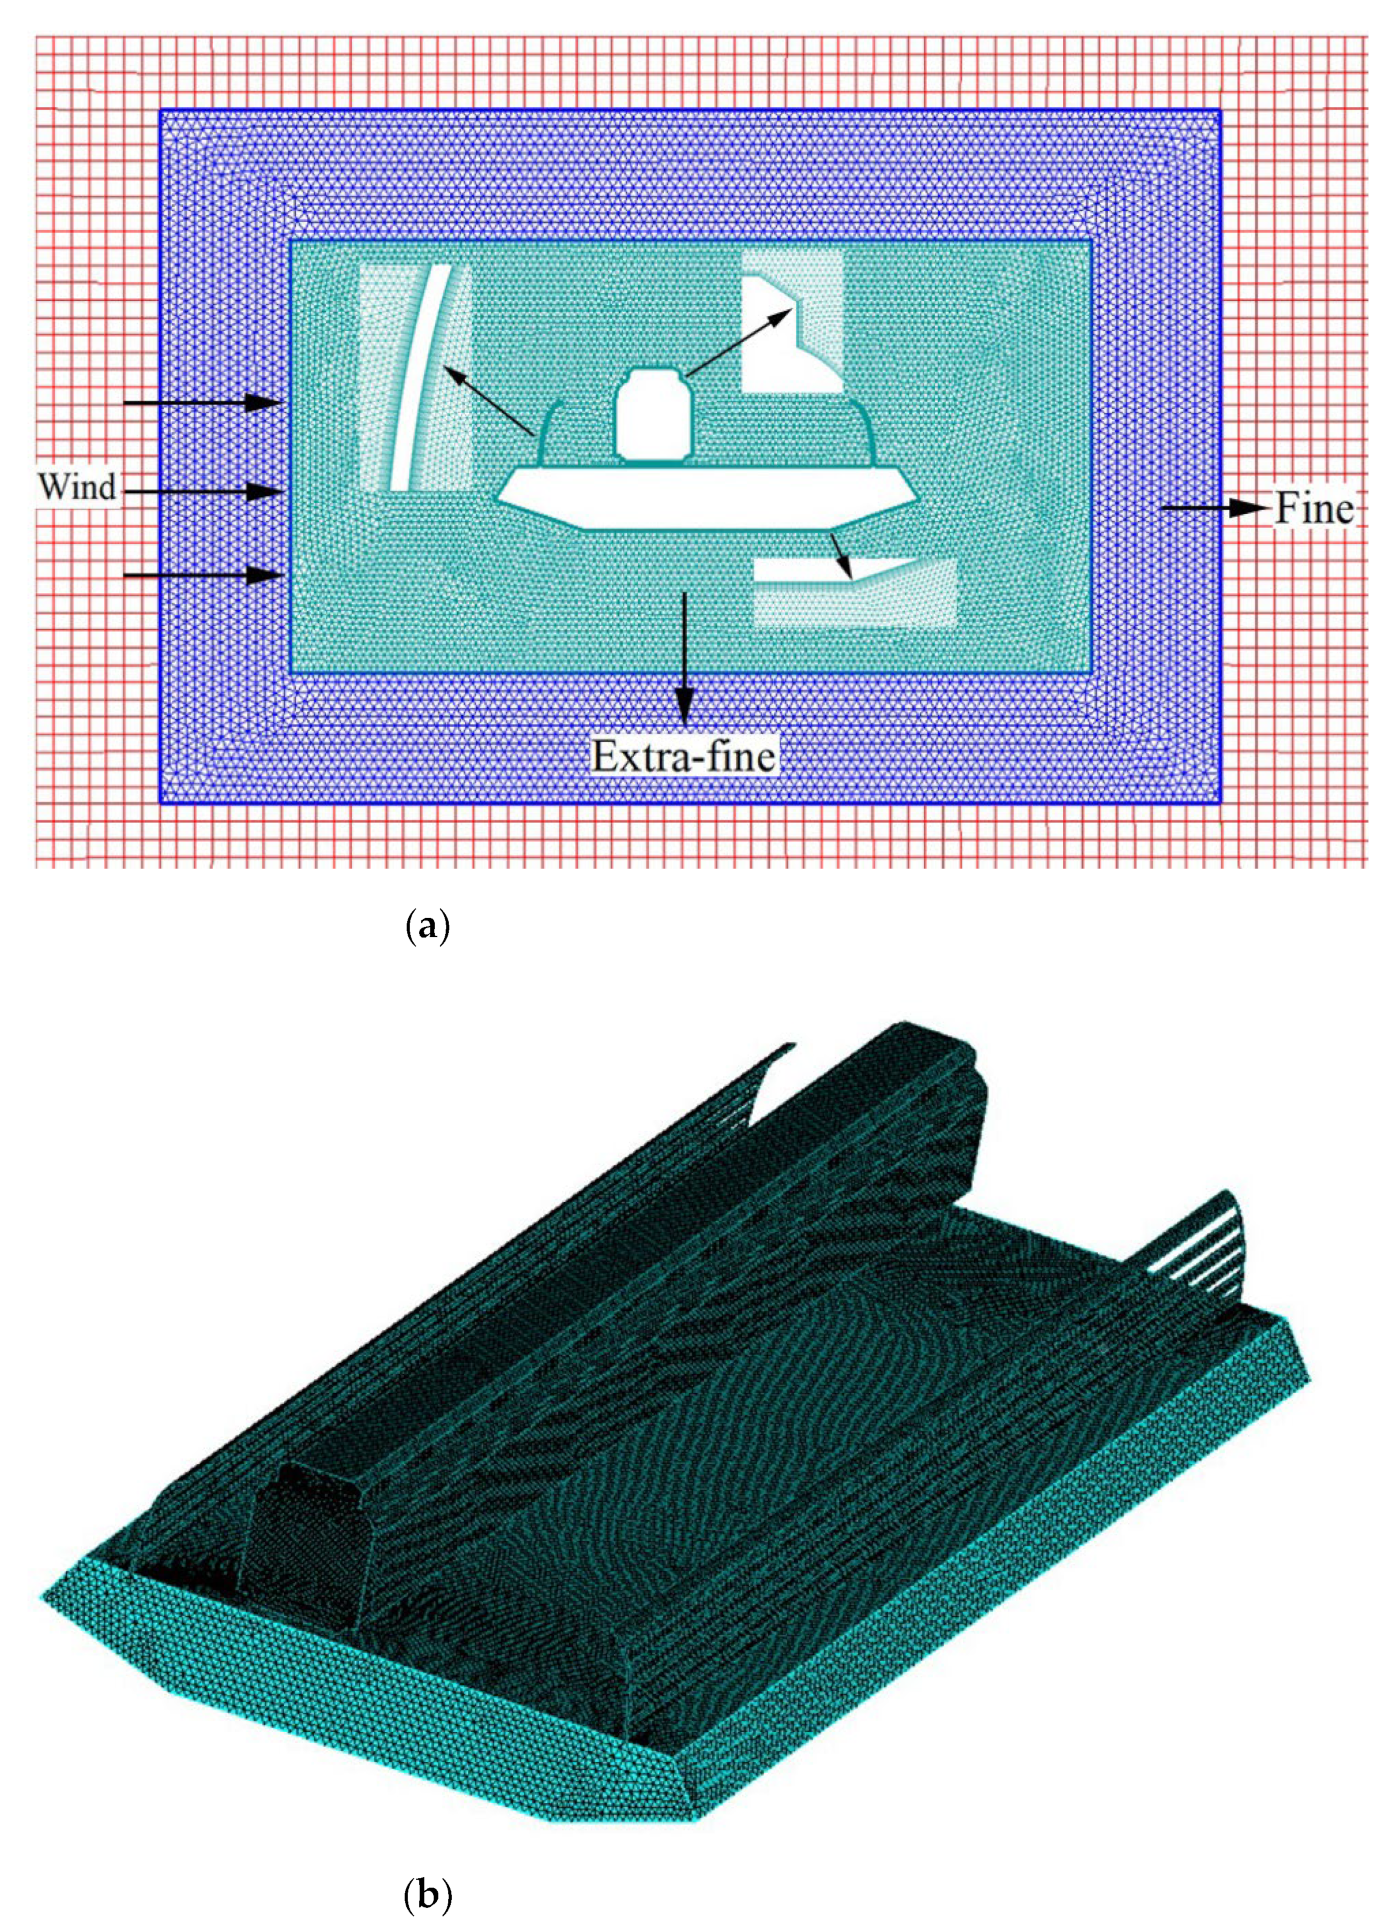
2.3. Computational Domain and Grid Generation
2.4. Parameter Definition
3. Validation of the Numerical Simulation
4. Results and Discussion
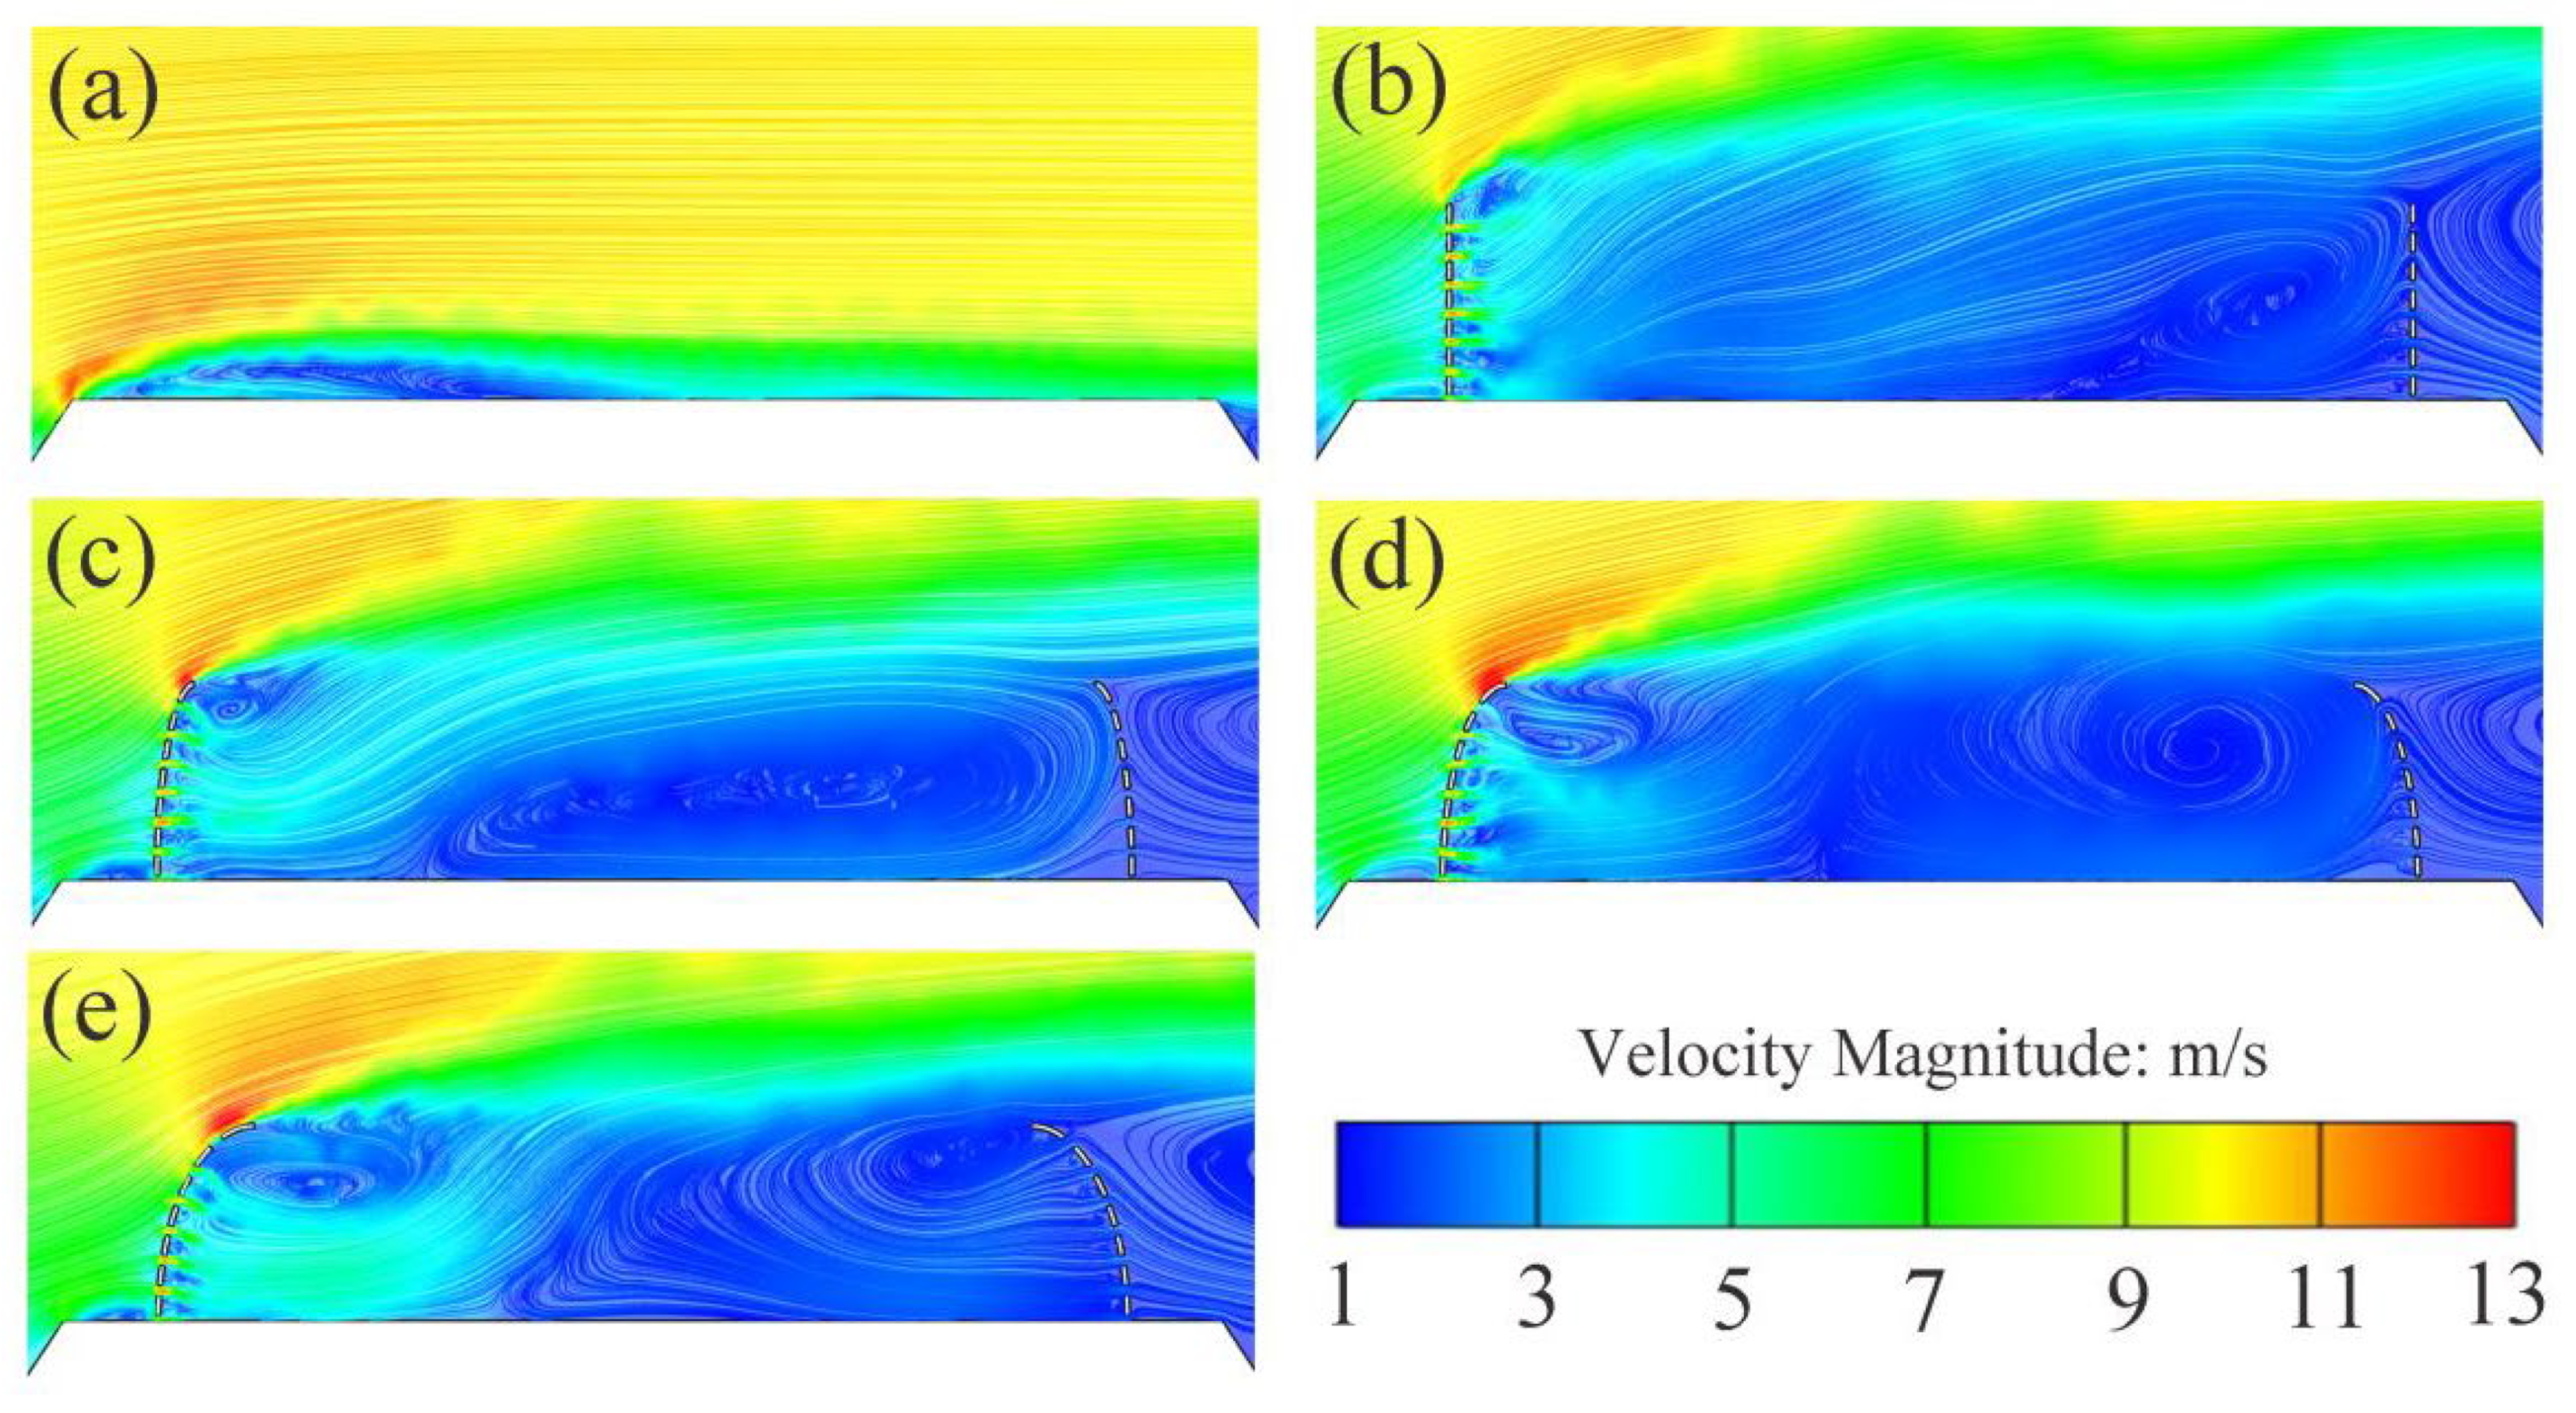
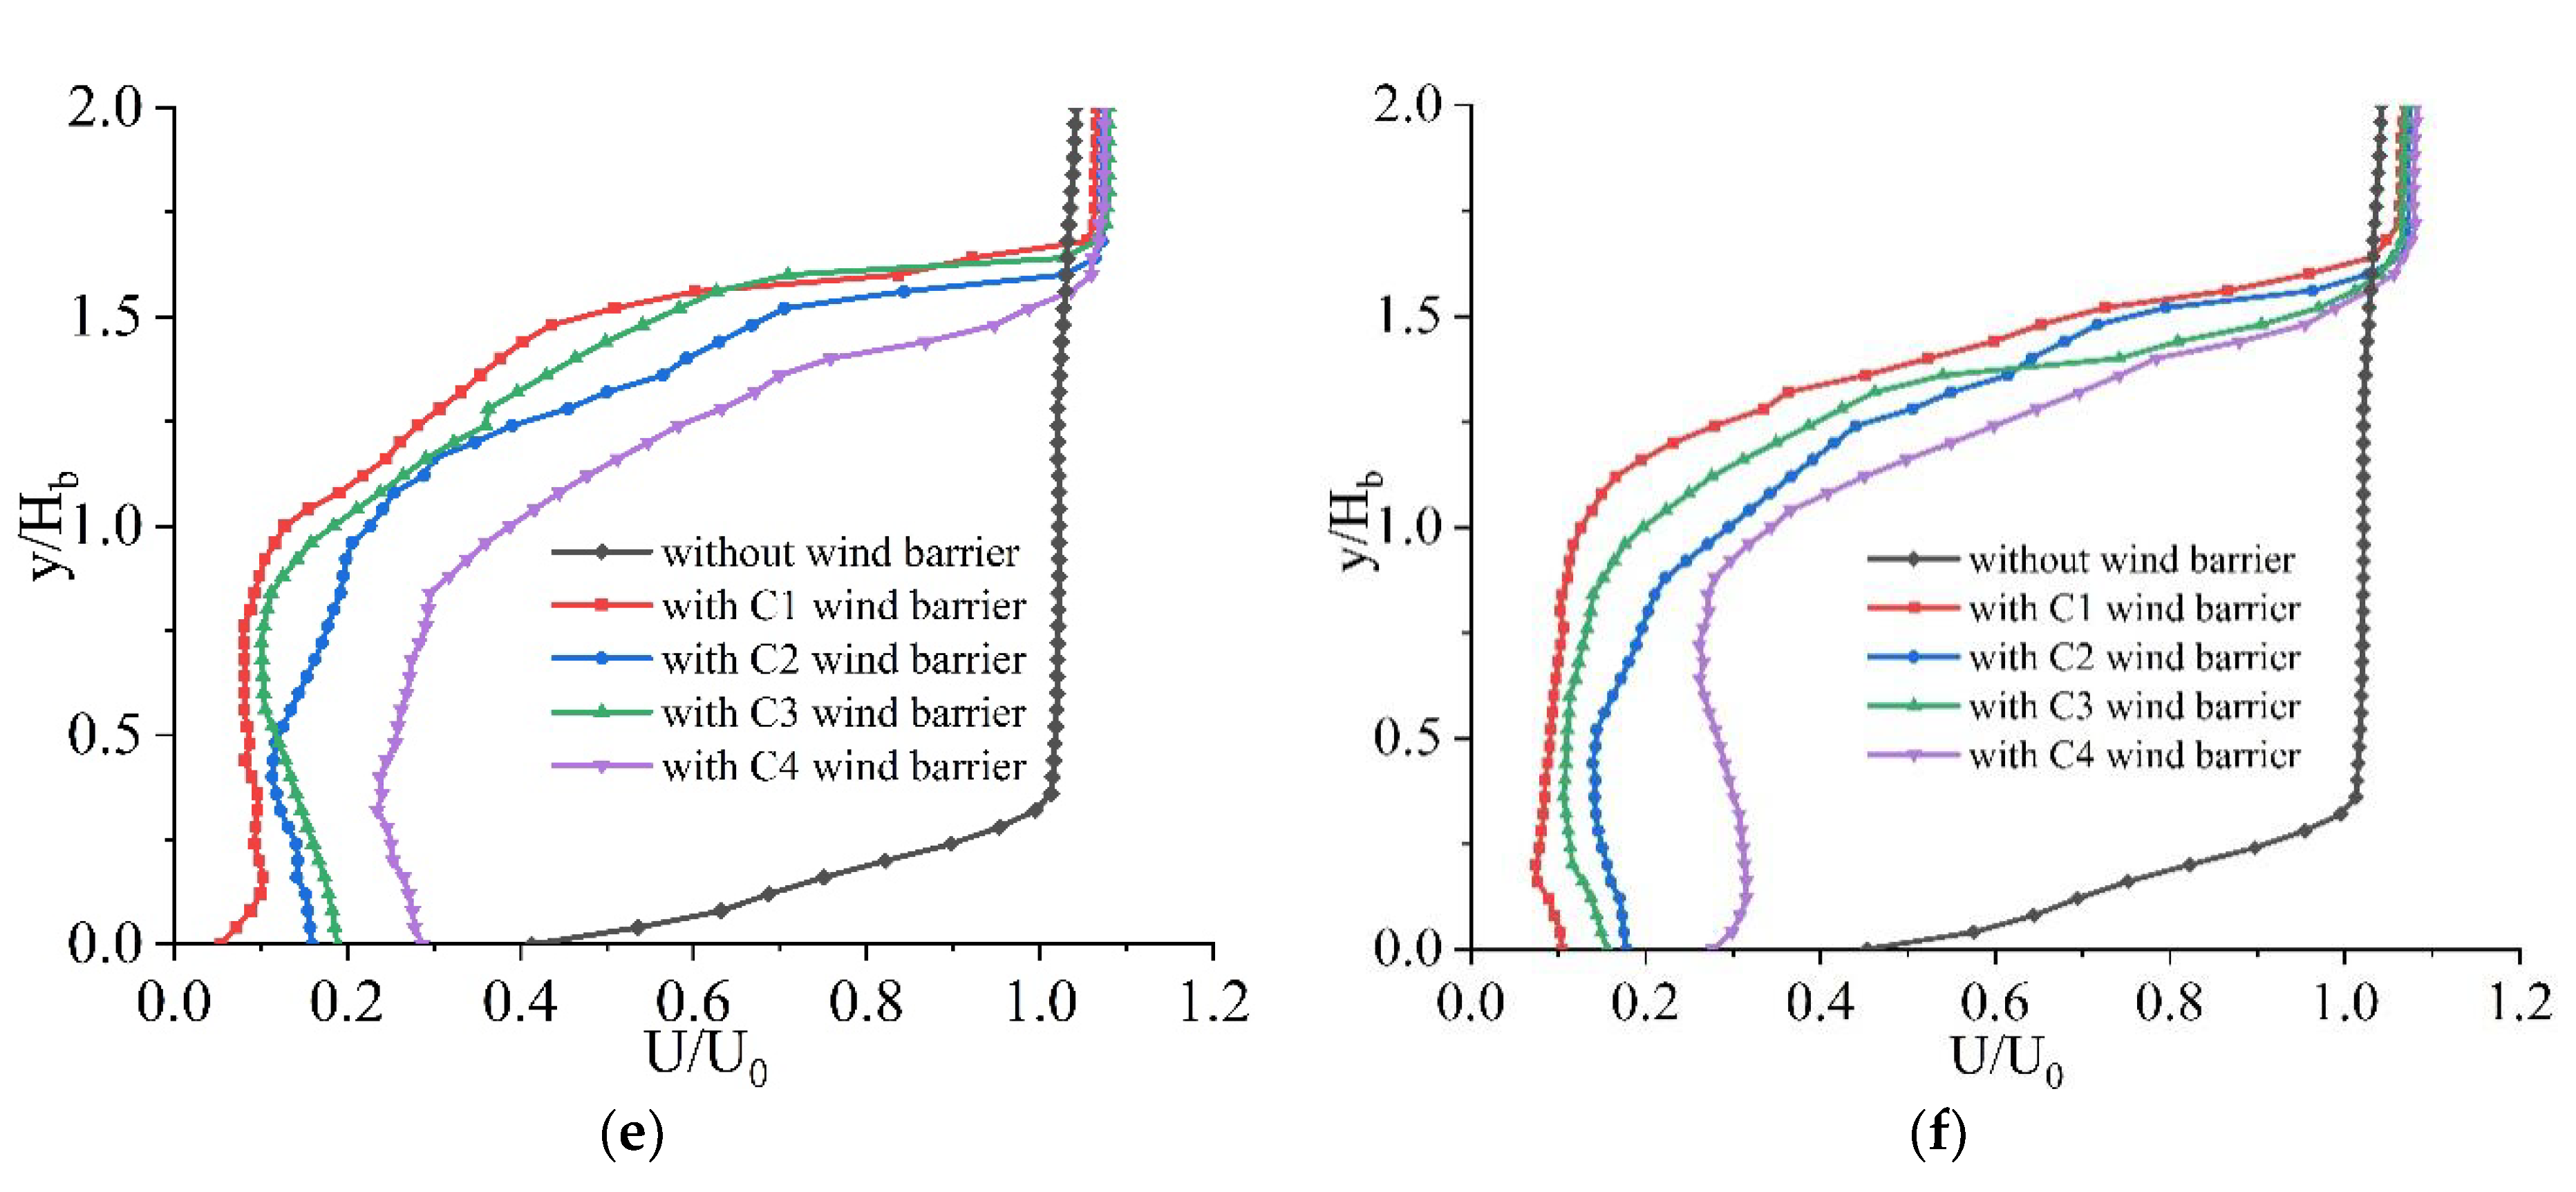
4.1. The Influence of the Wind Barrier with Different Curvatures on the Aerodynamic Characteristics of the Bridge
4.2. Effects of the Curved Wind Barrier on the Aerodynamic Characteristics of the Train-Bridge System
4.3. Influence of Curved Wind Barrier on the Aerodynamic Characteristics of the Train with Different Train-Bridge Combinations
5. Conclusions
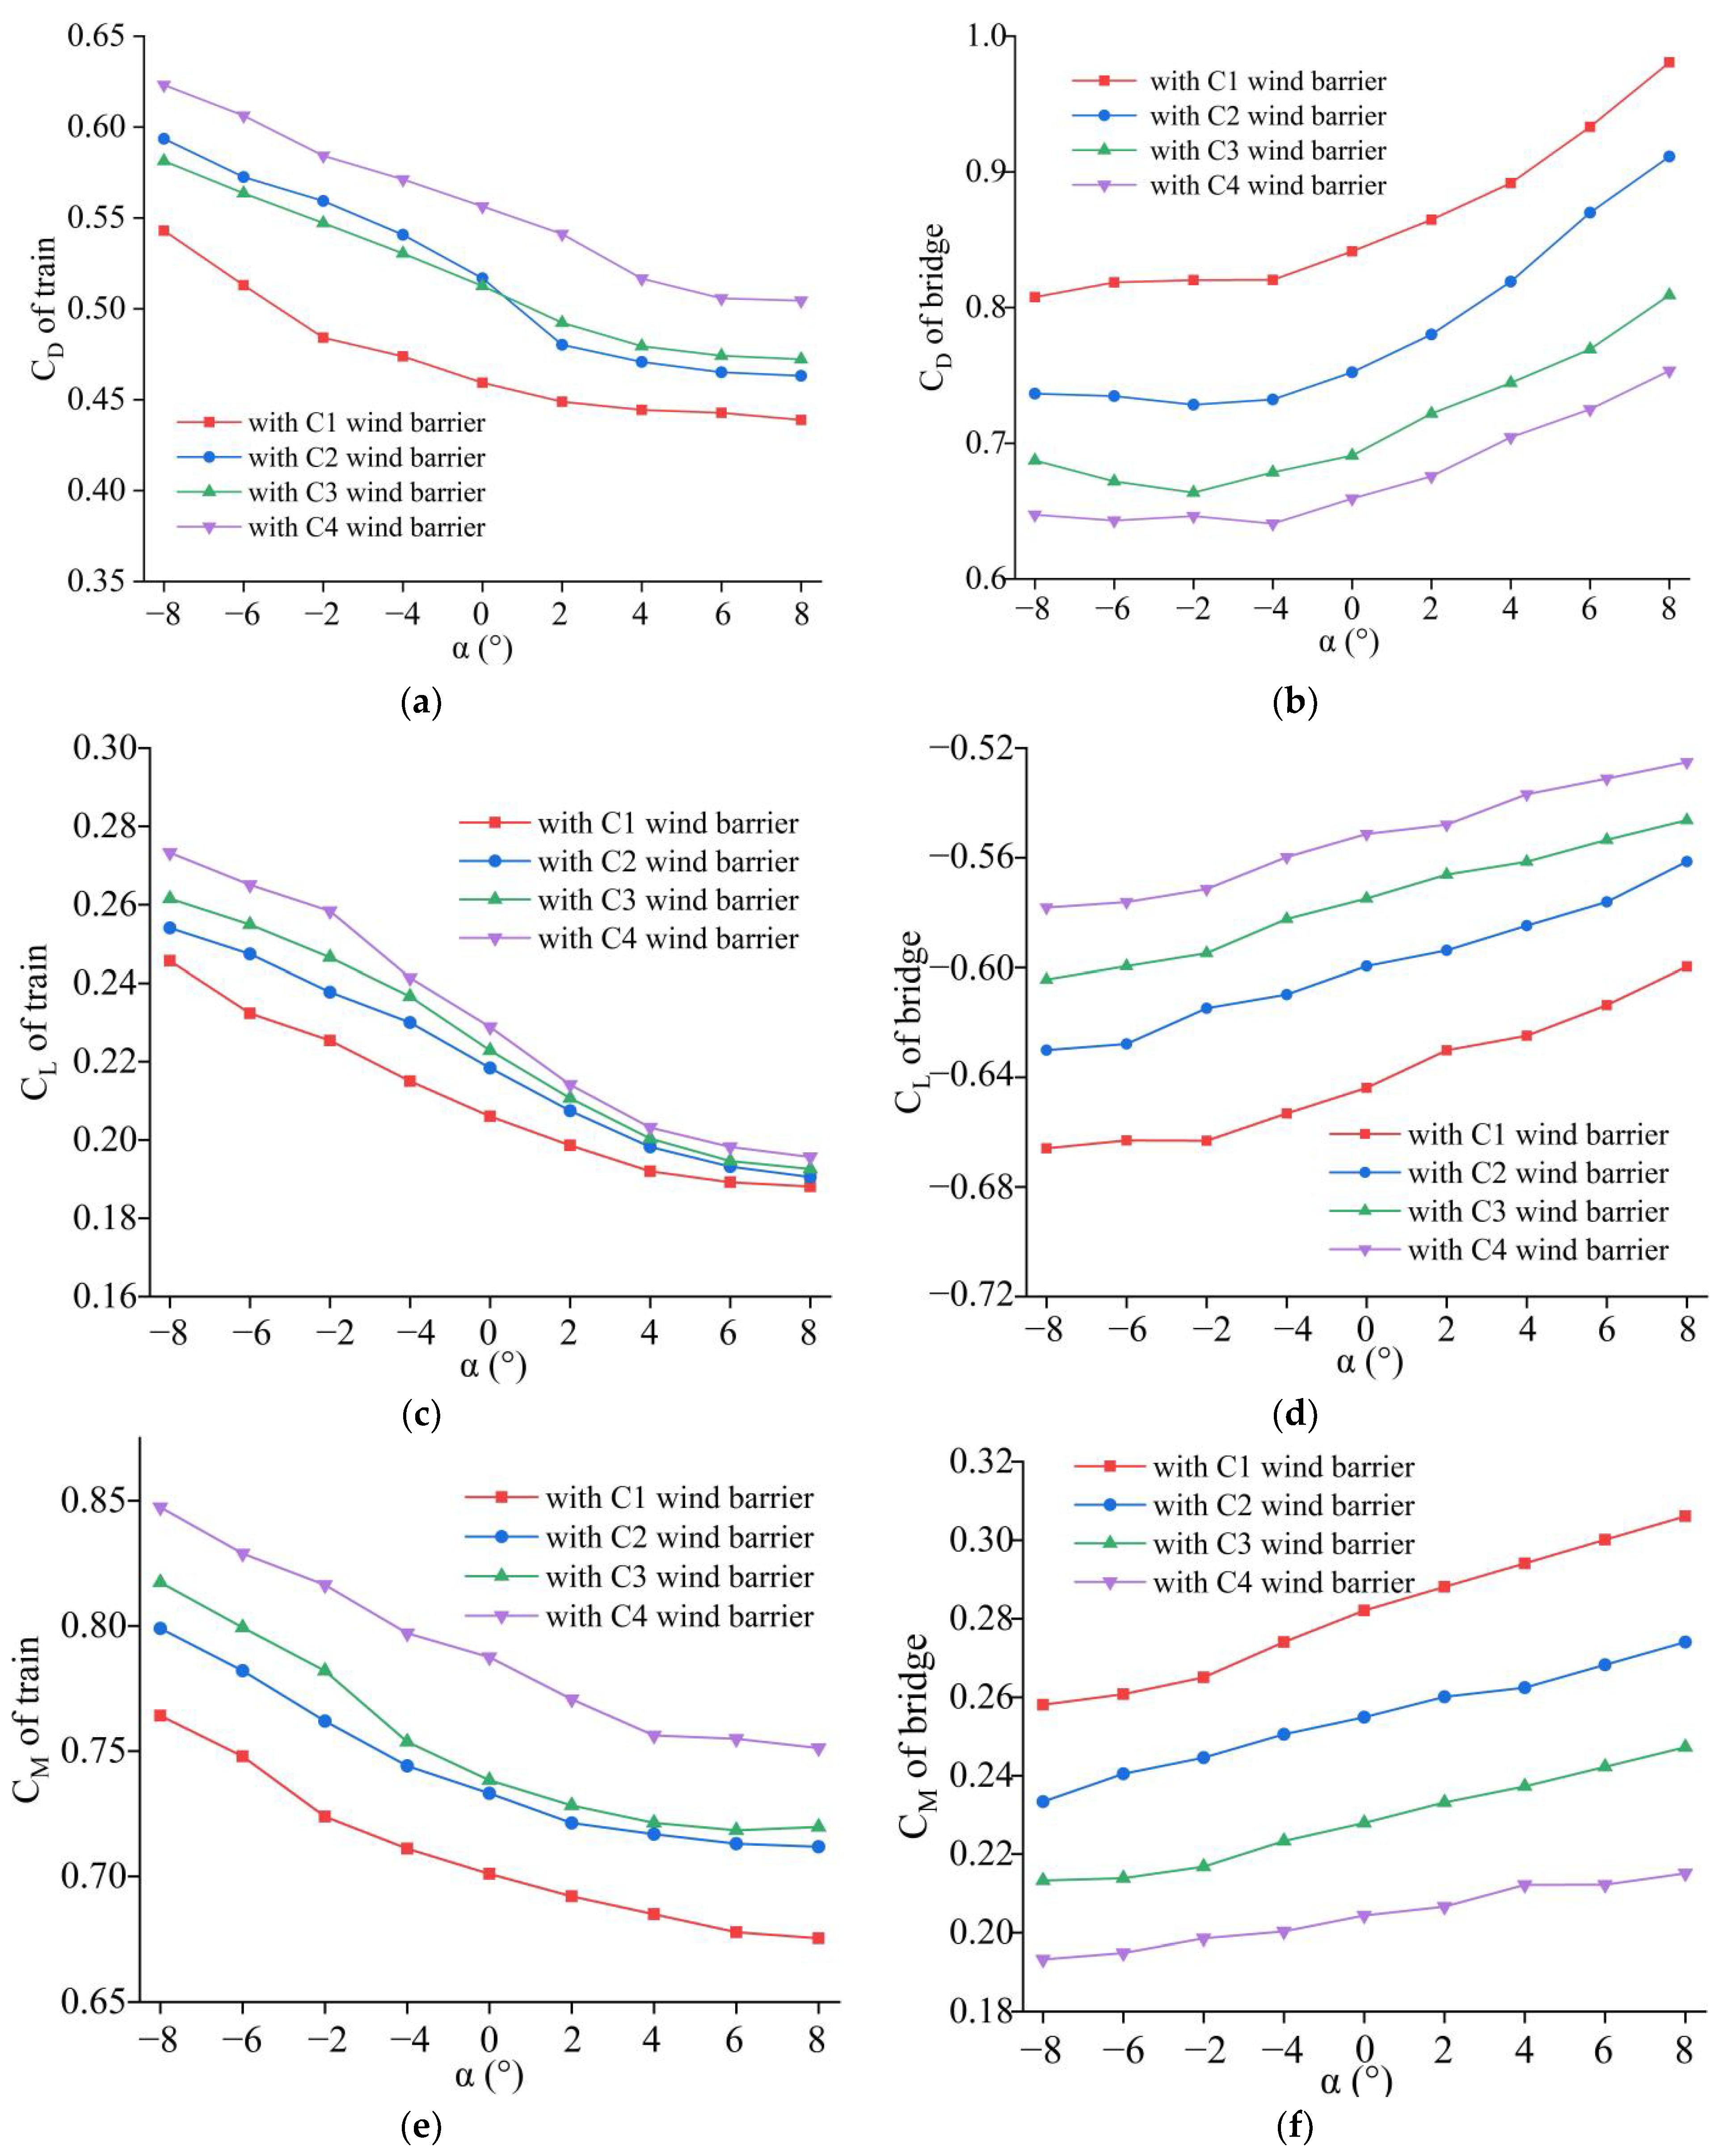
- (a)
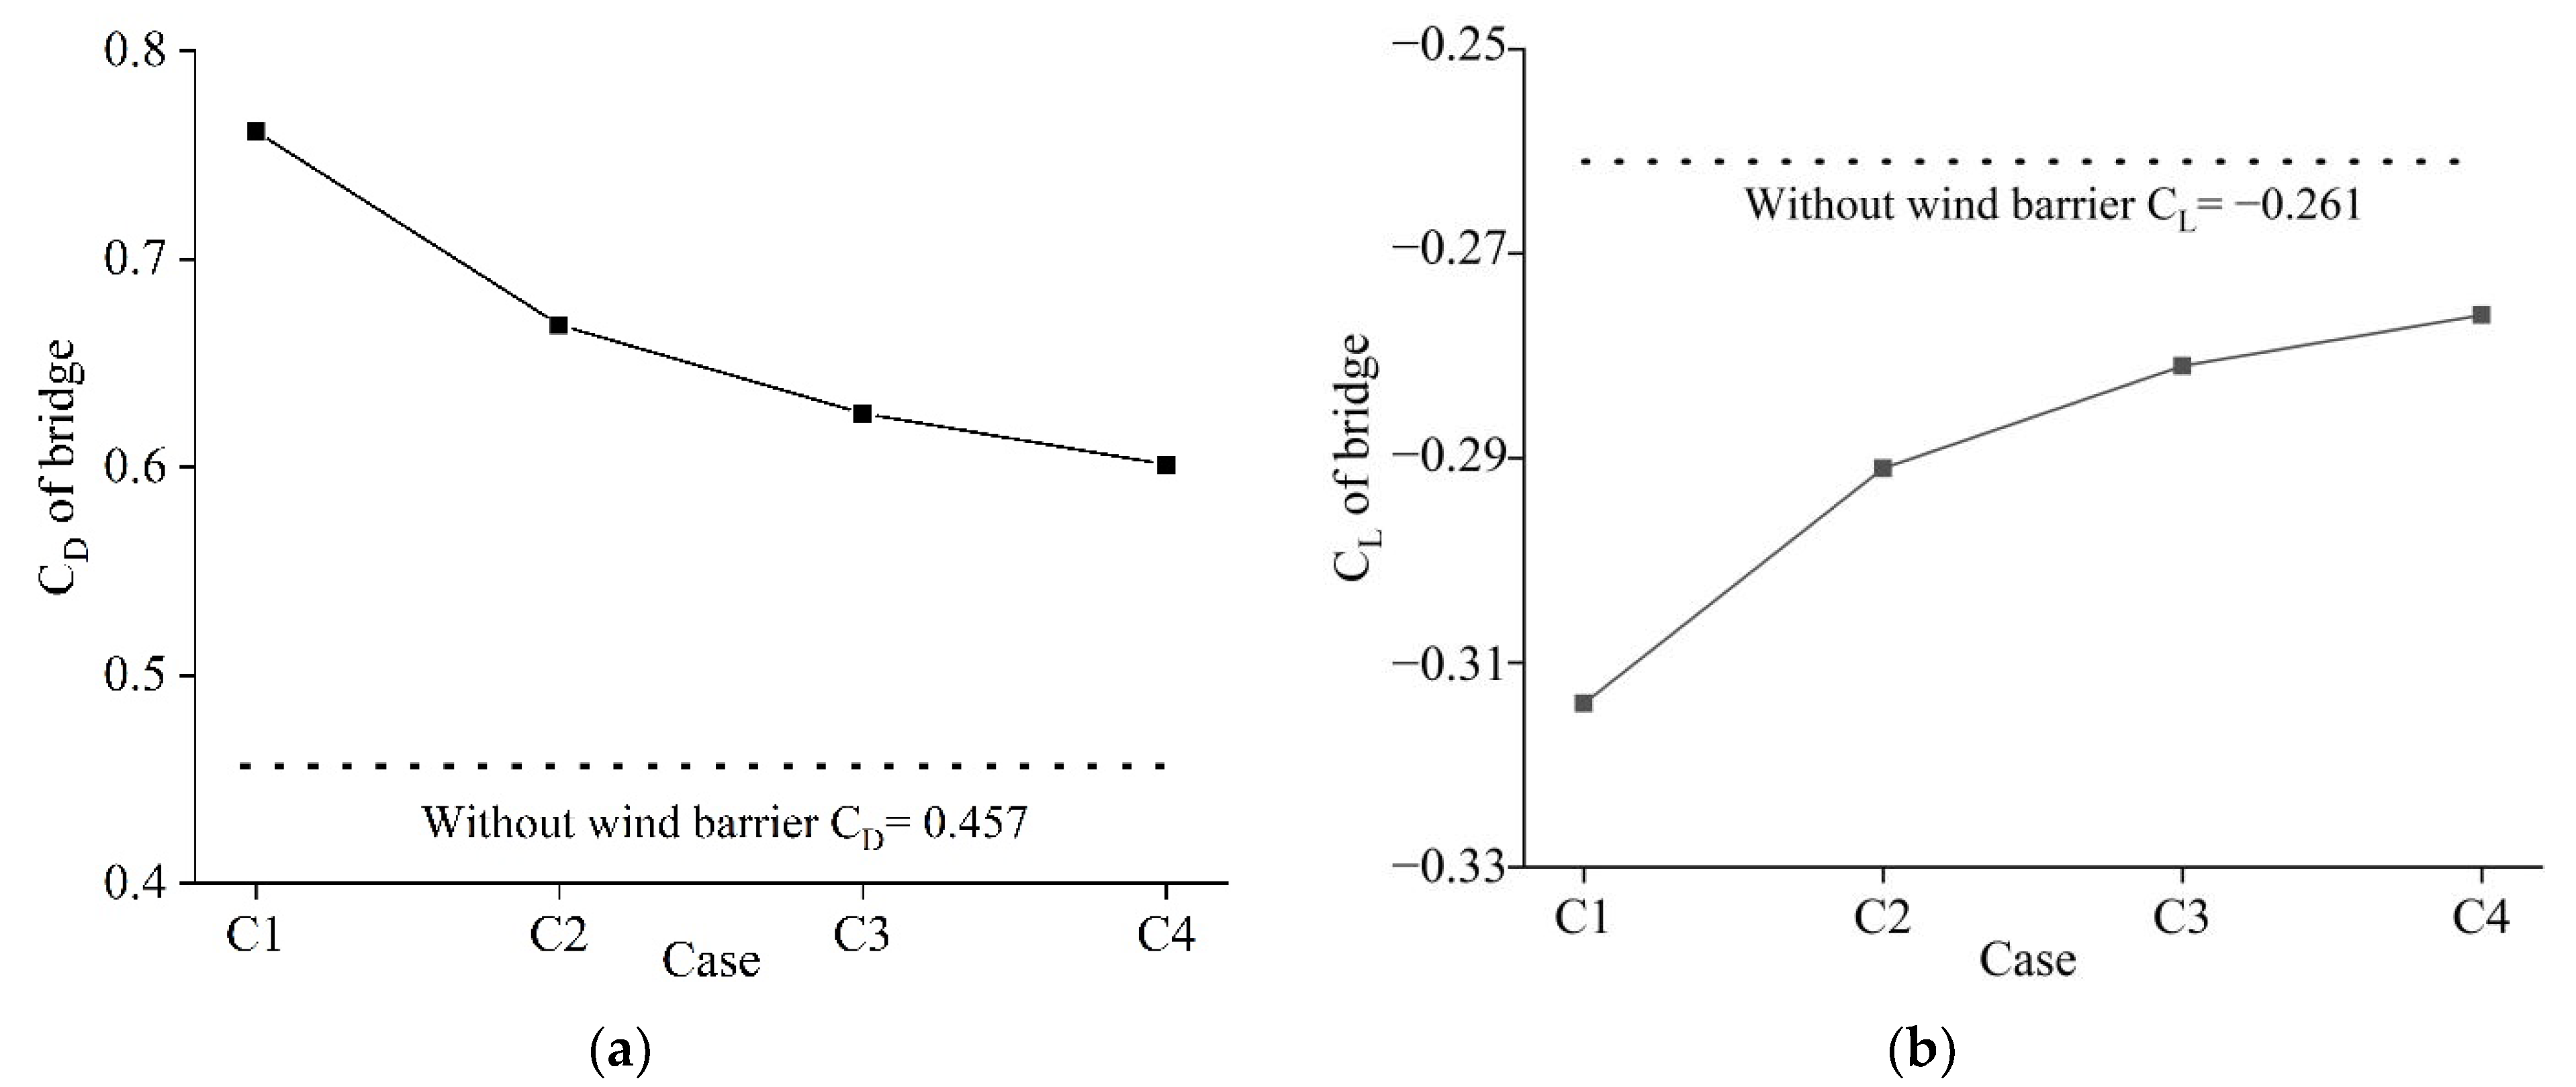
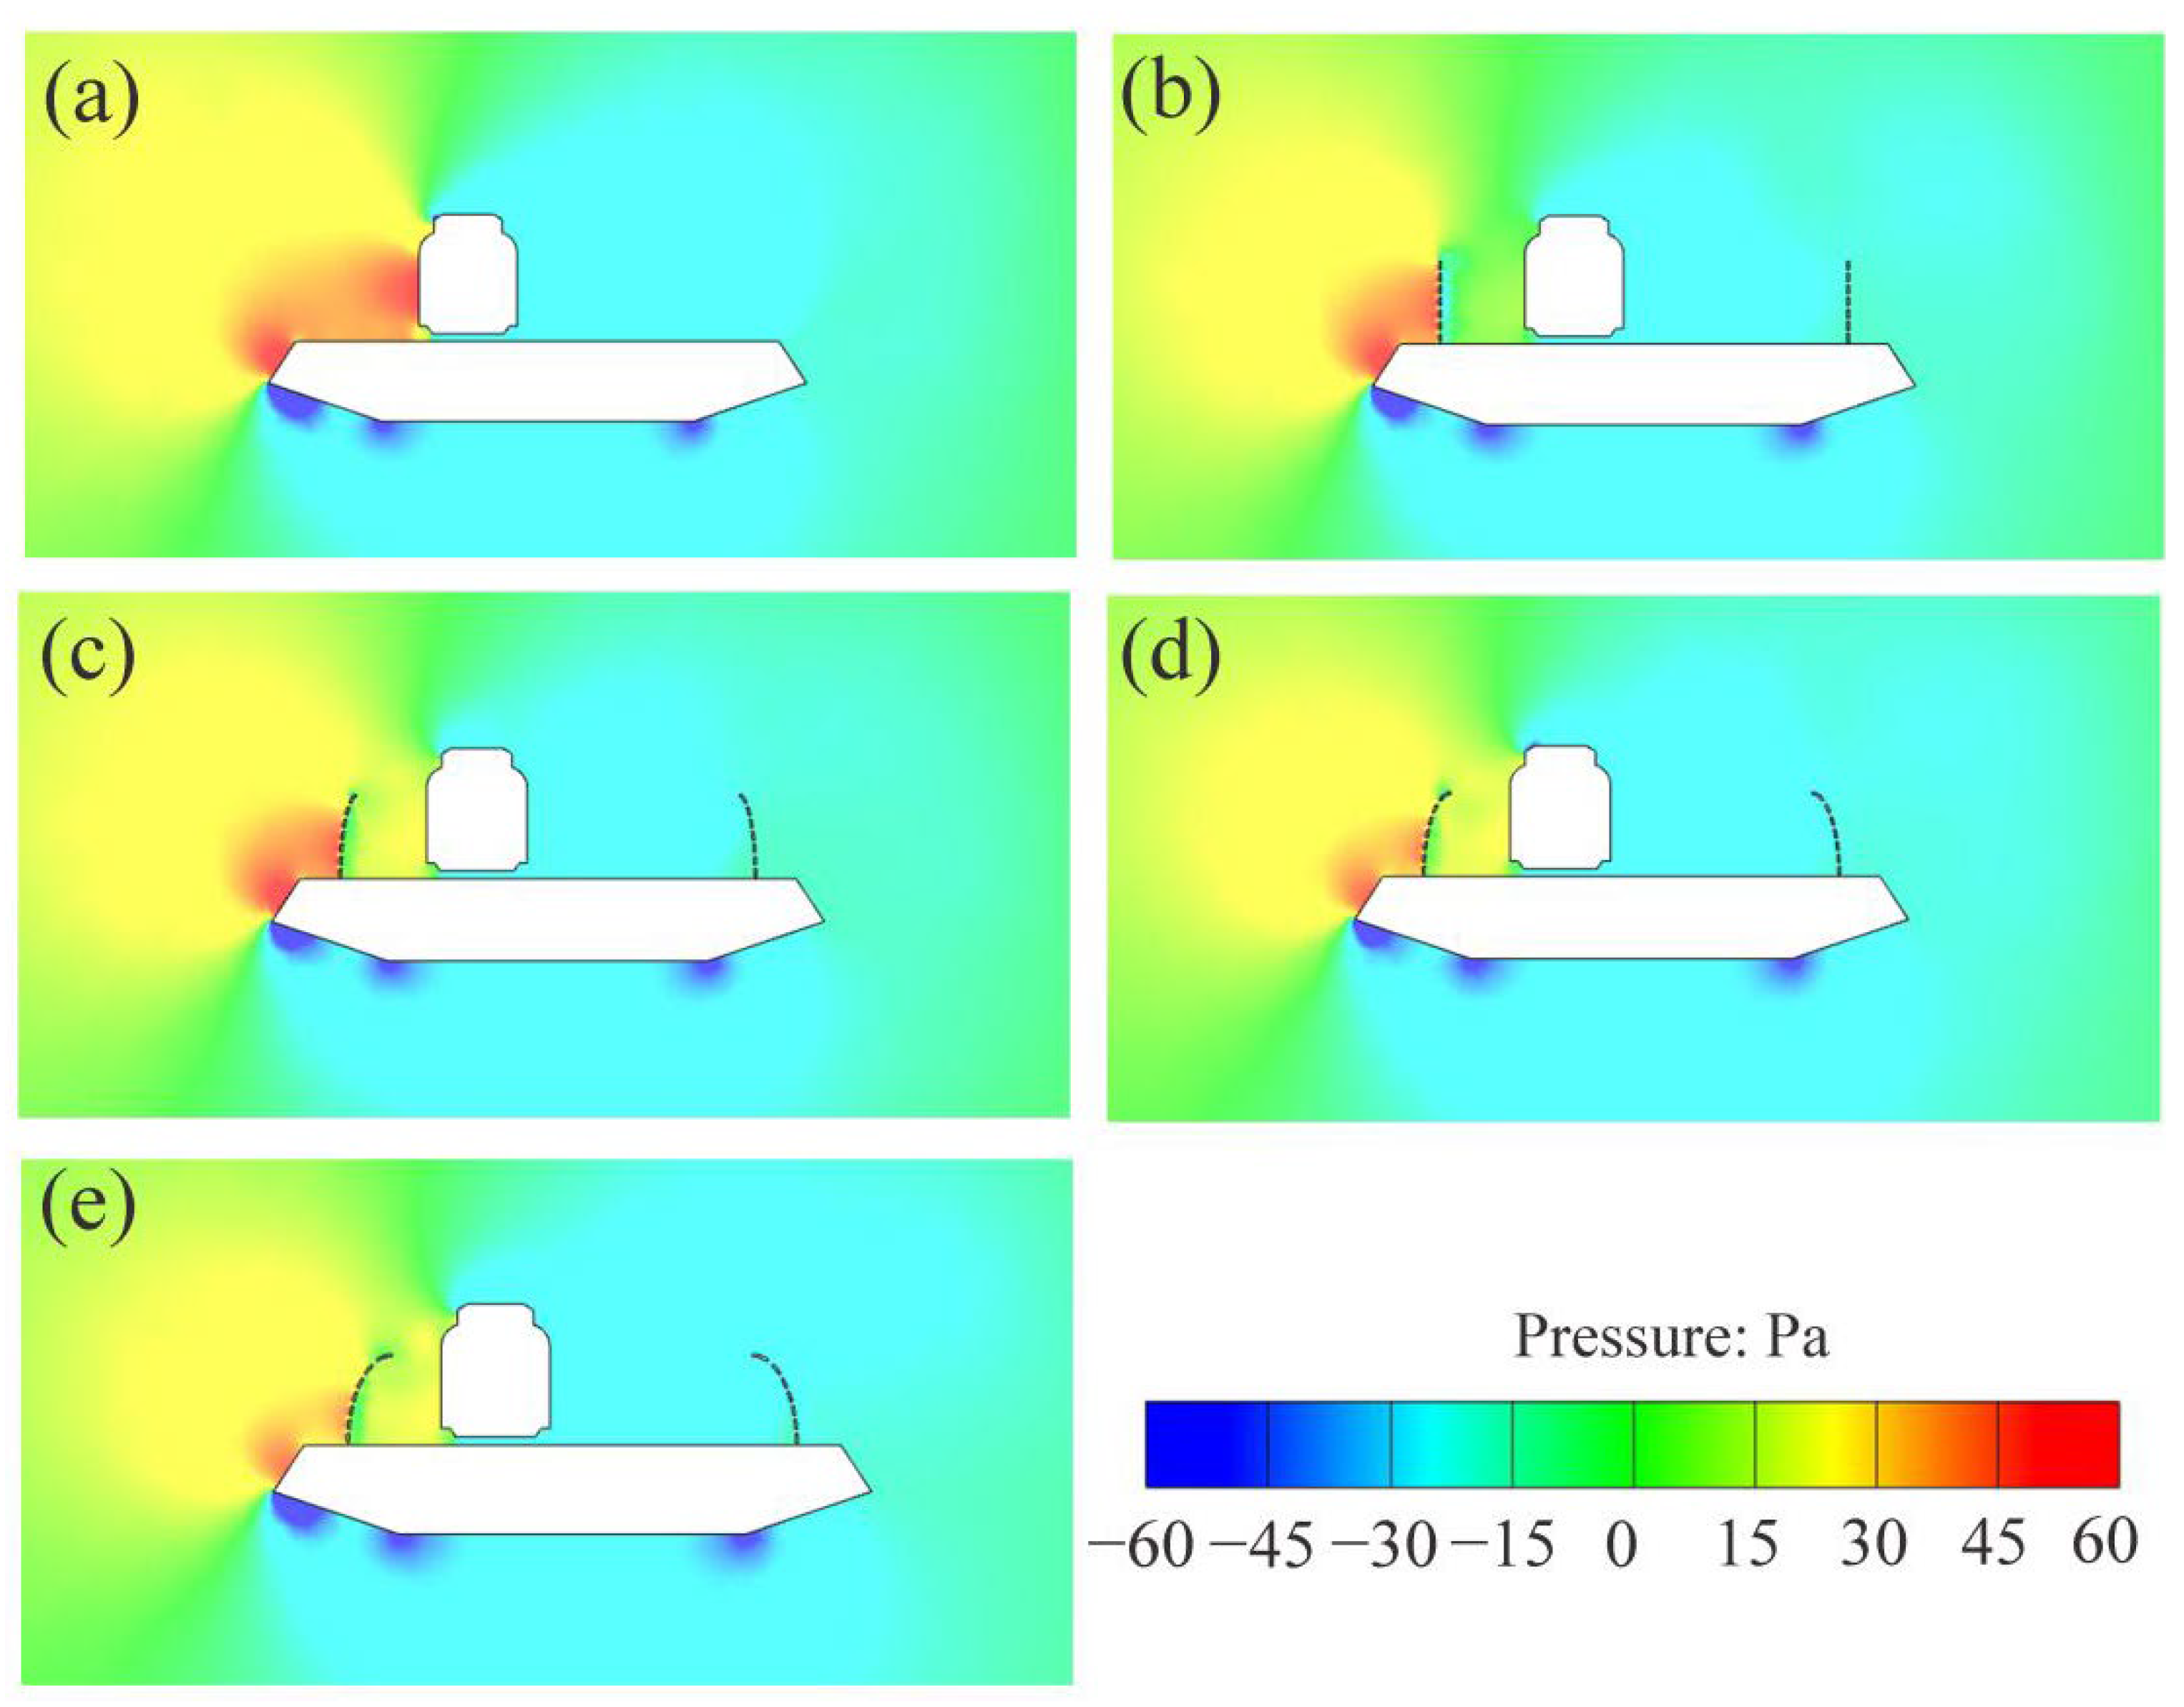
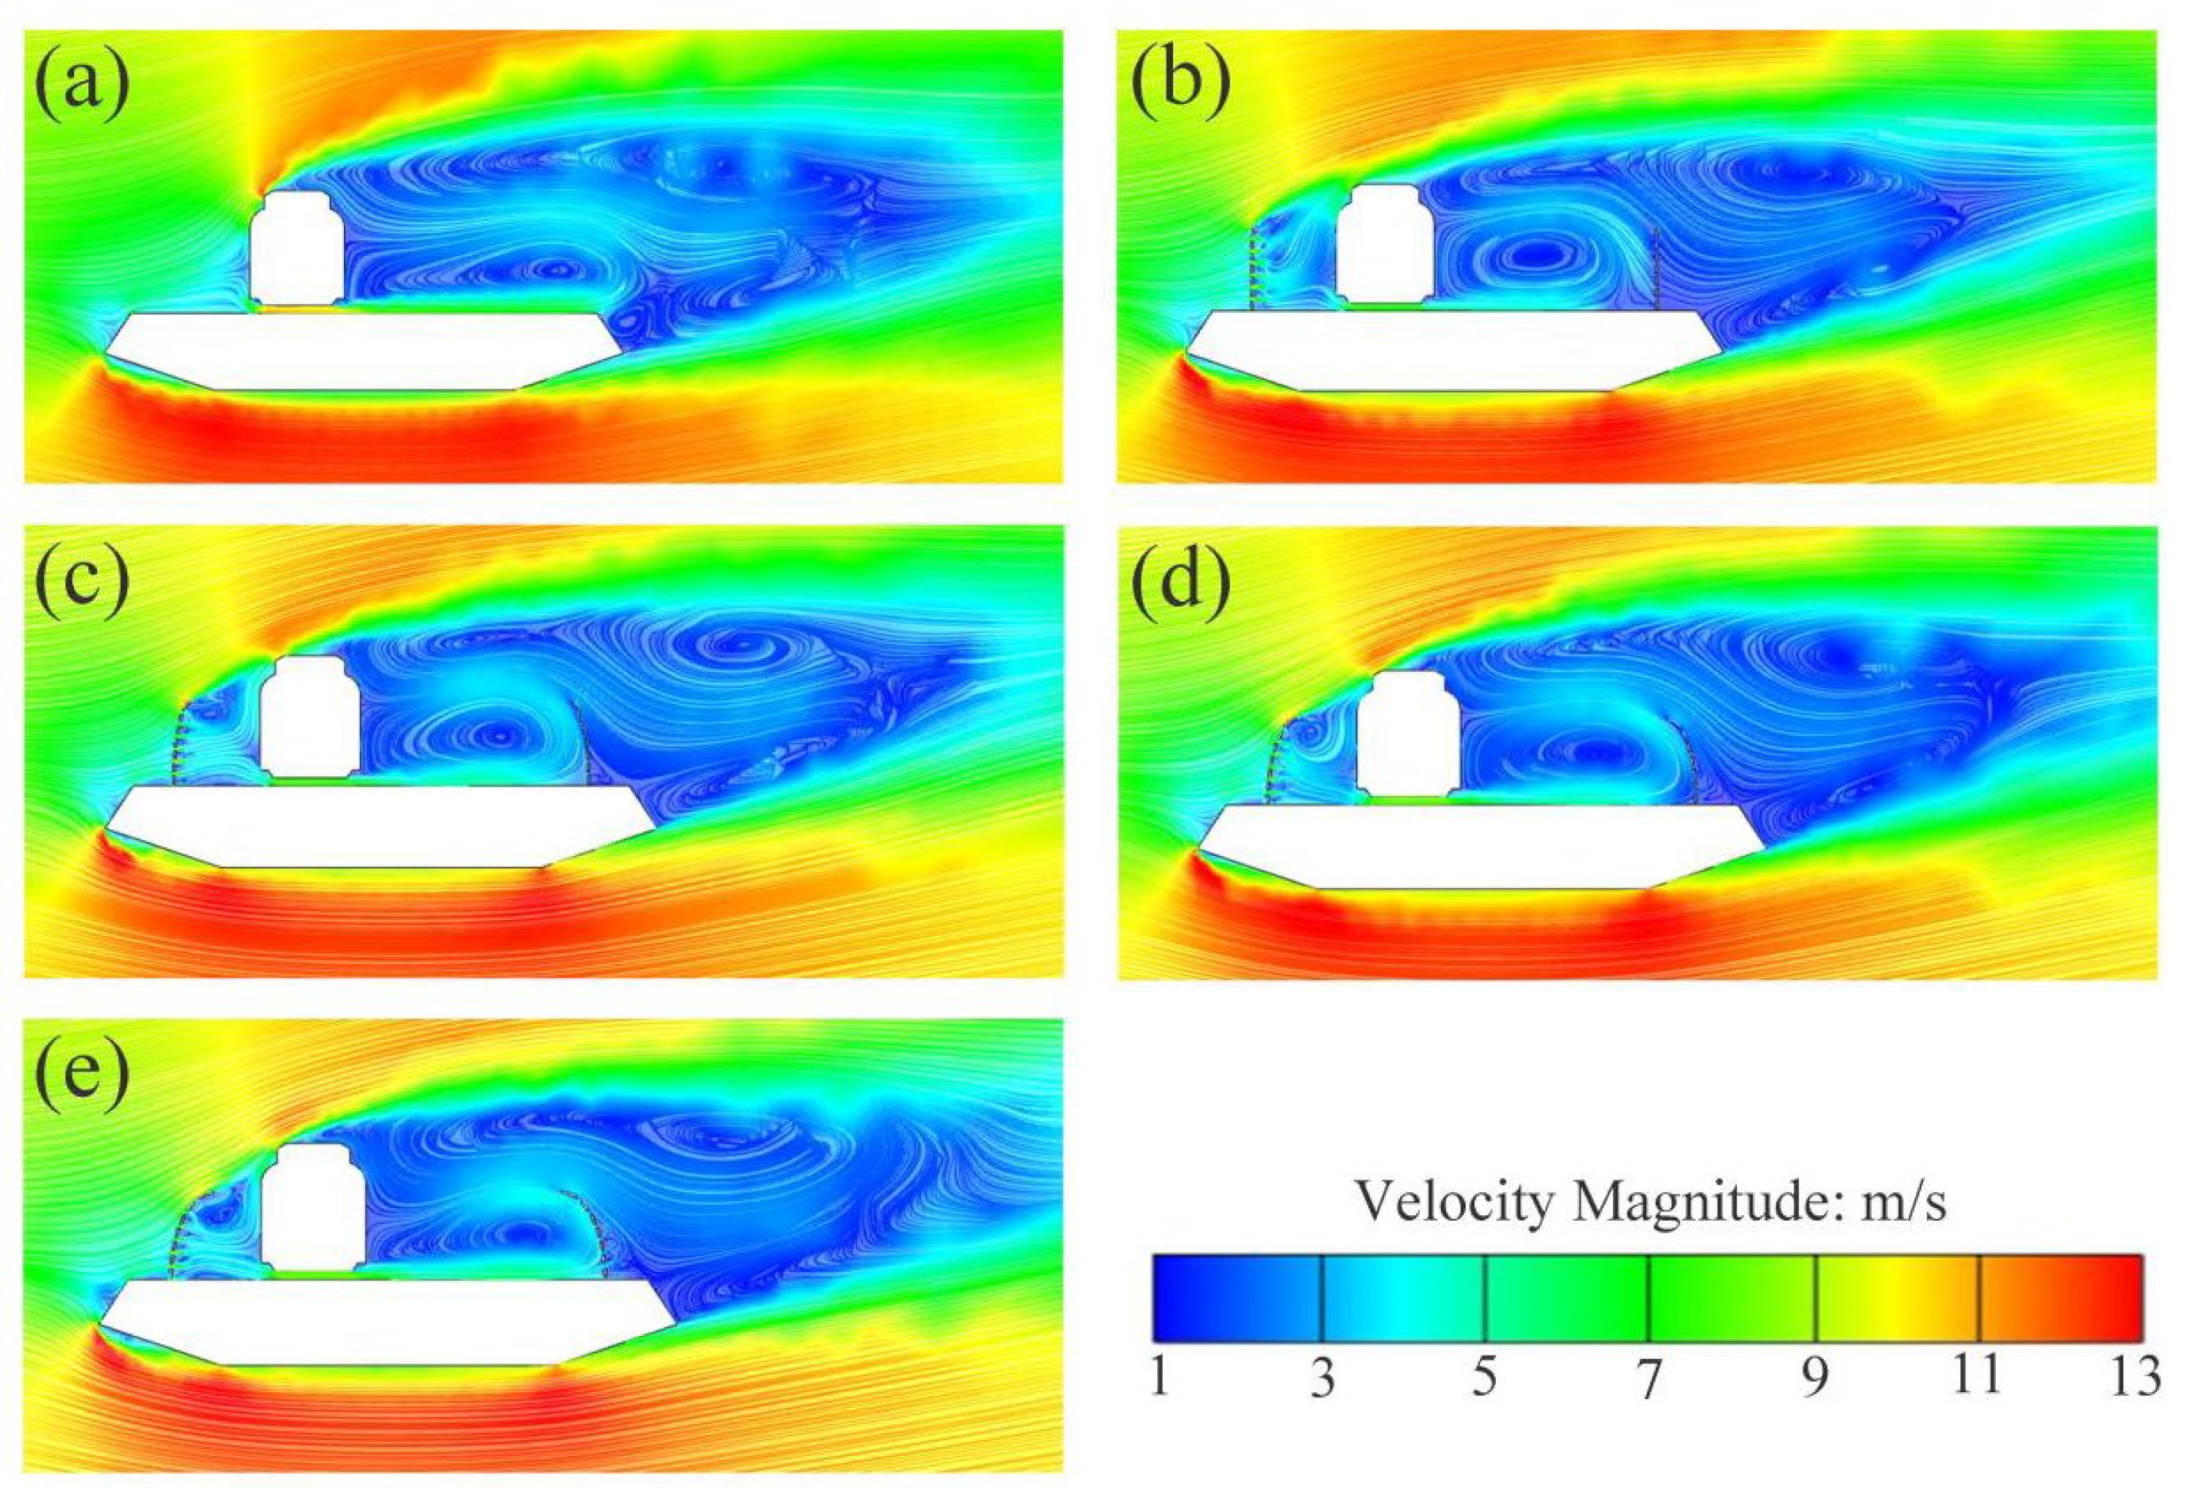
- Curved wind barriers can effectively reduce the wind speed in the region below 1.5 times of the height of the wind barrier on the bridge deck. The C4 wind barrier with the largest curvature has the worst deceleration effect on the airflow and may cause strong interference to the flow field around the train. The C1 wind barrier with 0 curvature has the best effect on airflow deceleration, but after the C1 wind barrier is installed, the aerodynamic coefficients of the bridge increase significantly.
- (b)
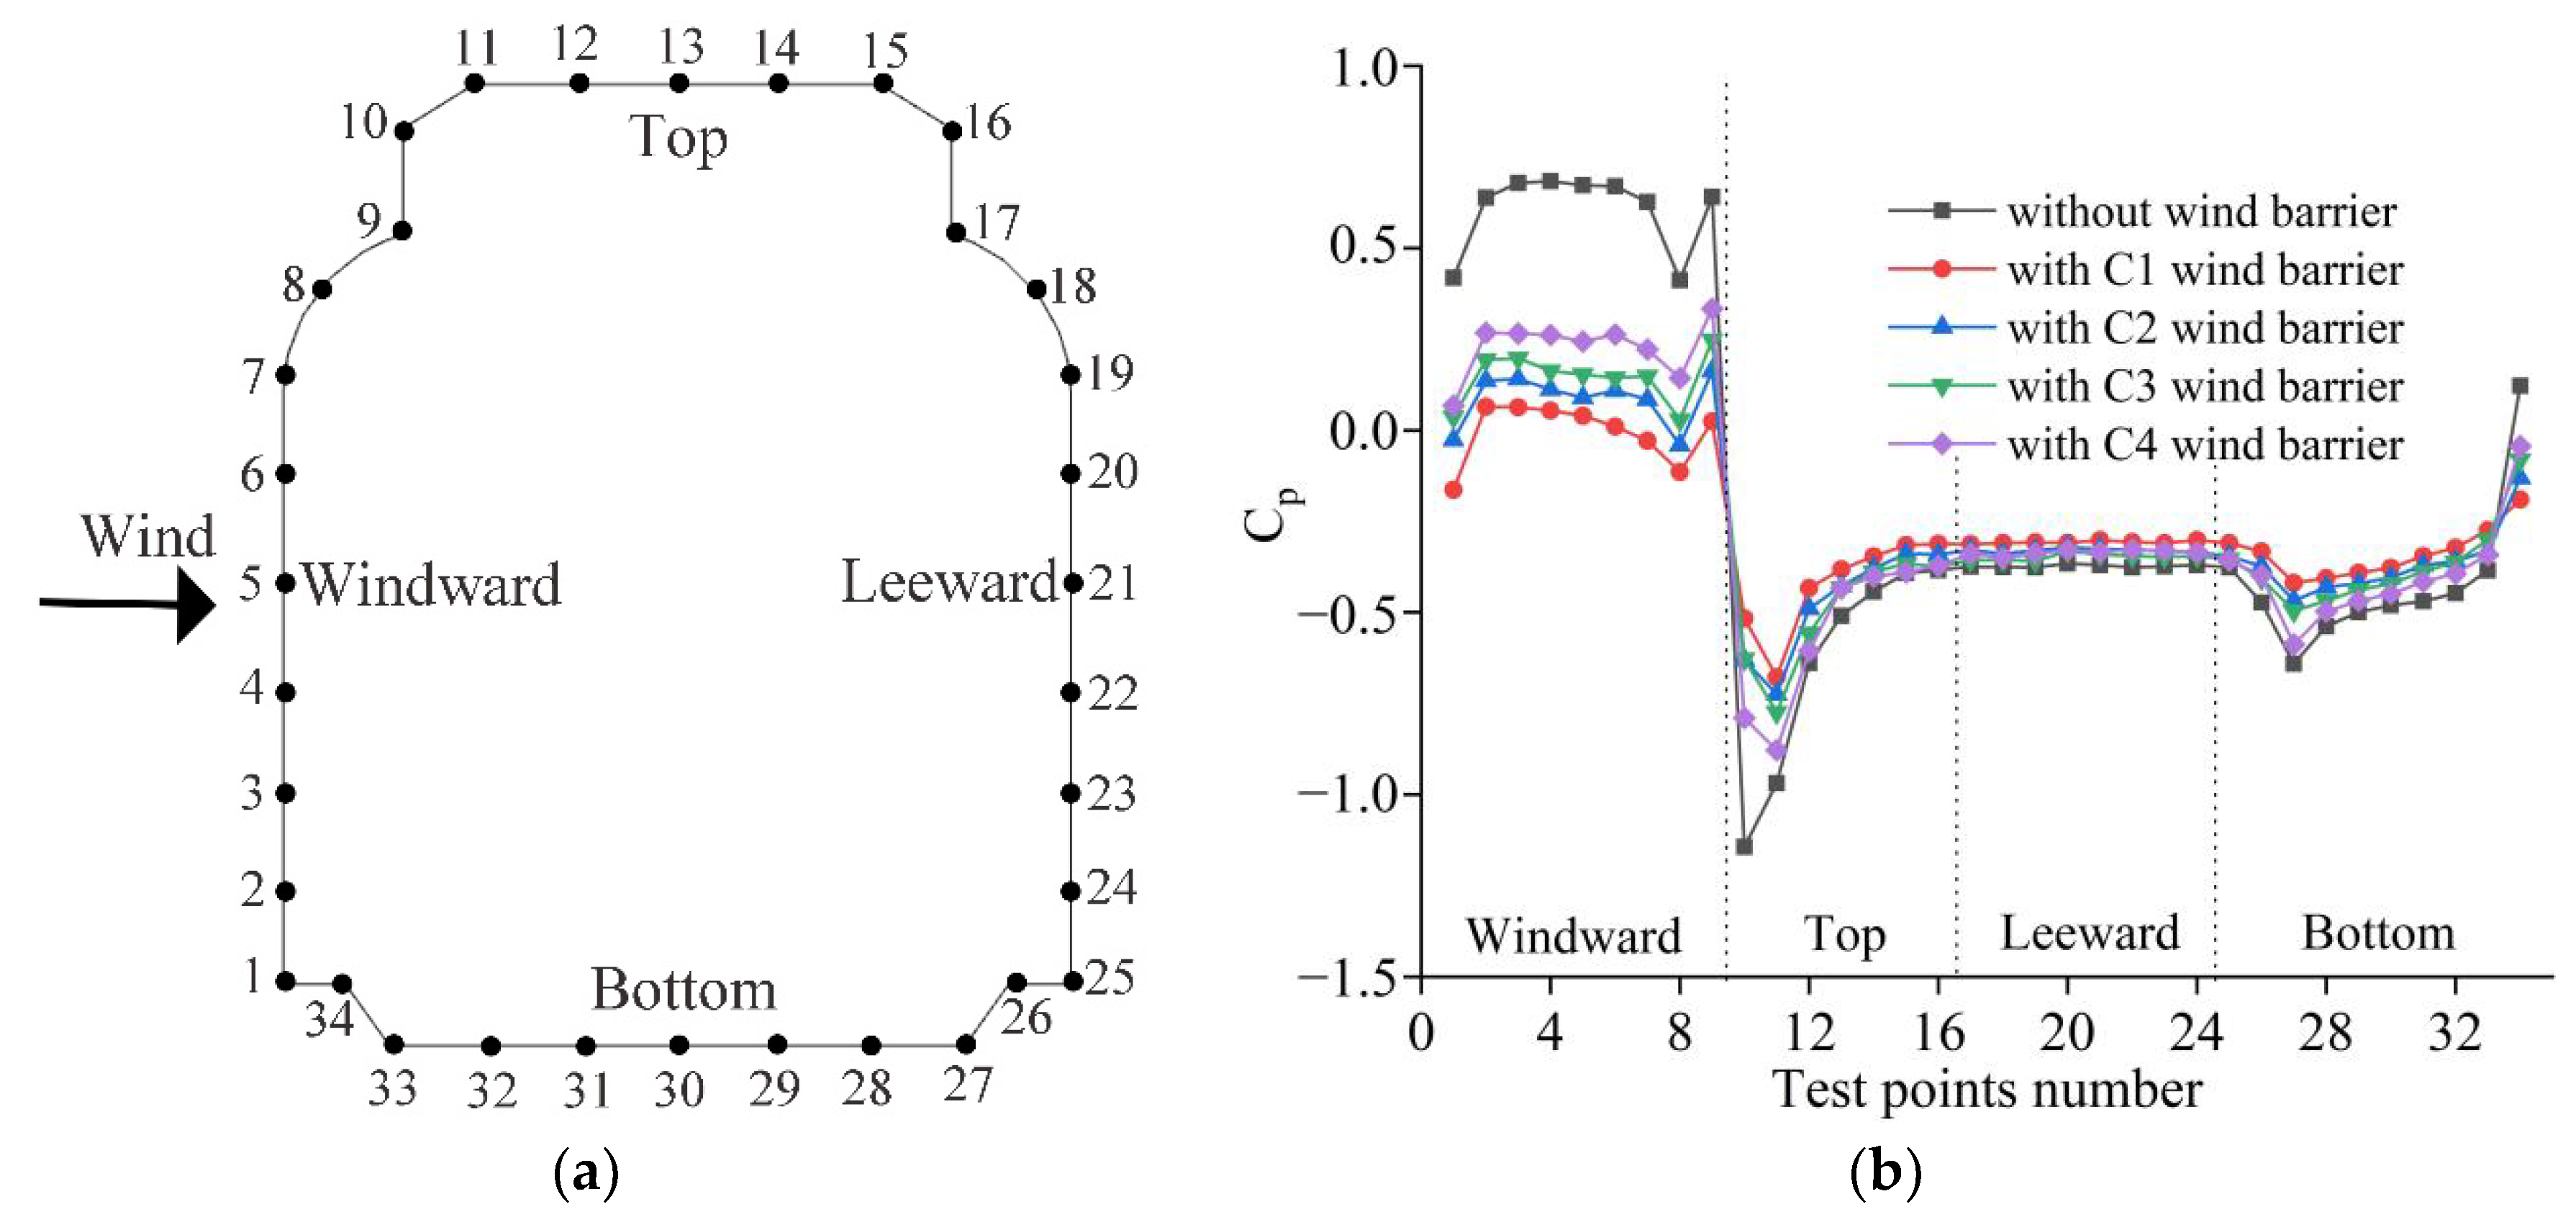
- The smaller the curvature of curved wind barrier, the stronger the protective effect on the train, but the greater the adversely impact on the wind resistance of the bridge. When the wind attack angle of airflow changes from negative to positive, the aerodynamic coefficients of train increase, while the aerodynamic coefficients of bridge decrease. The C3 wind barrier with a curvature of 0.35 can effectively reduce the aerodynamic coefficients and surface wind pressure of the train, and at the same time, has little impact on the wind resistance of the bridge; thus, it is more suitable for the safety protection of the train-bridge system in this study.
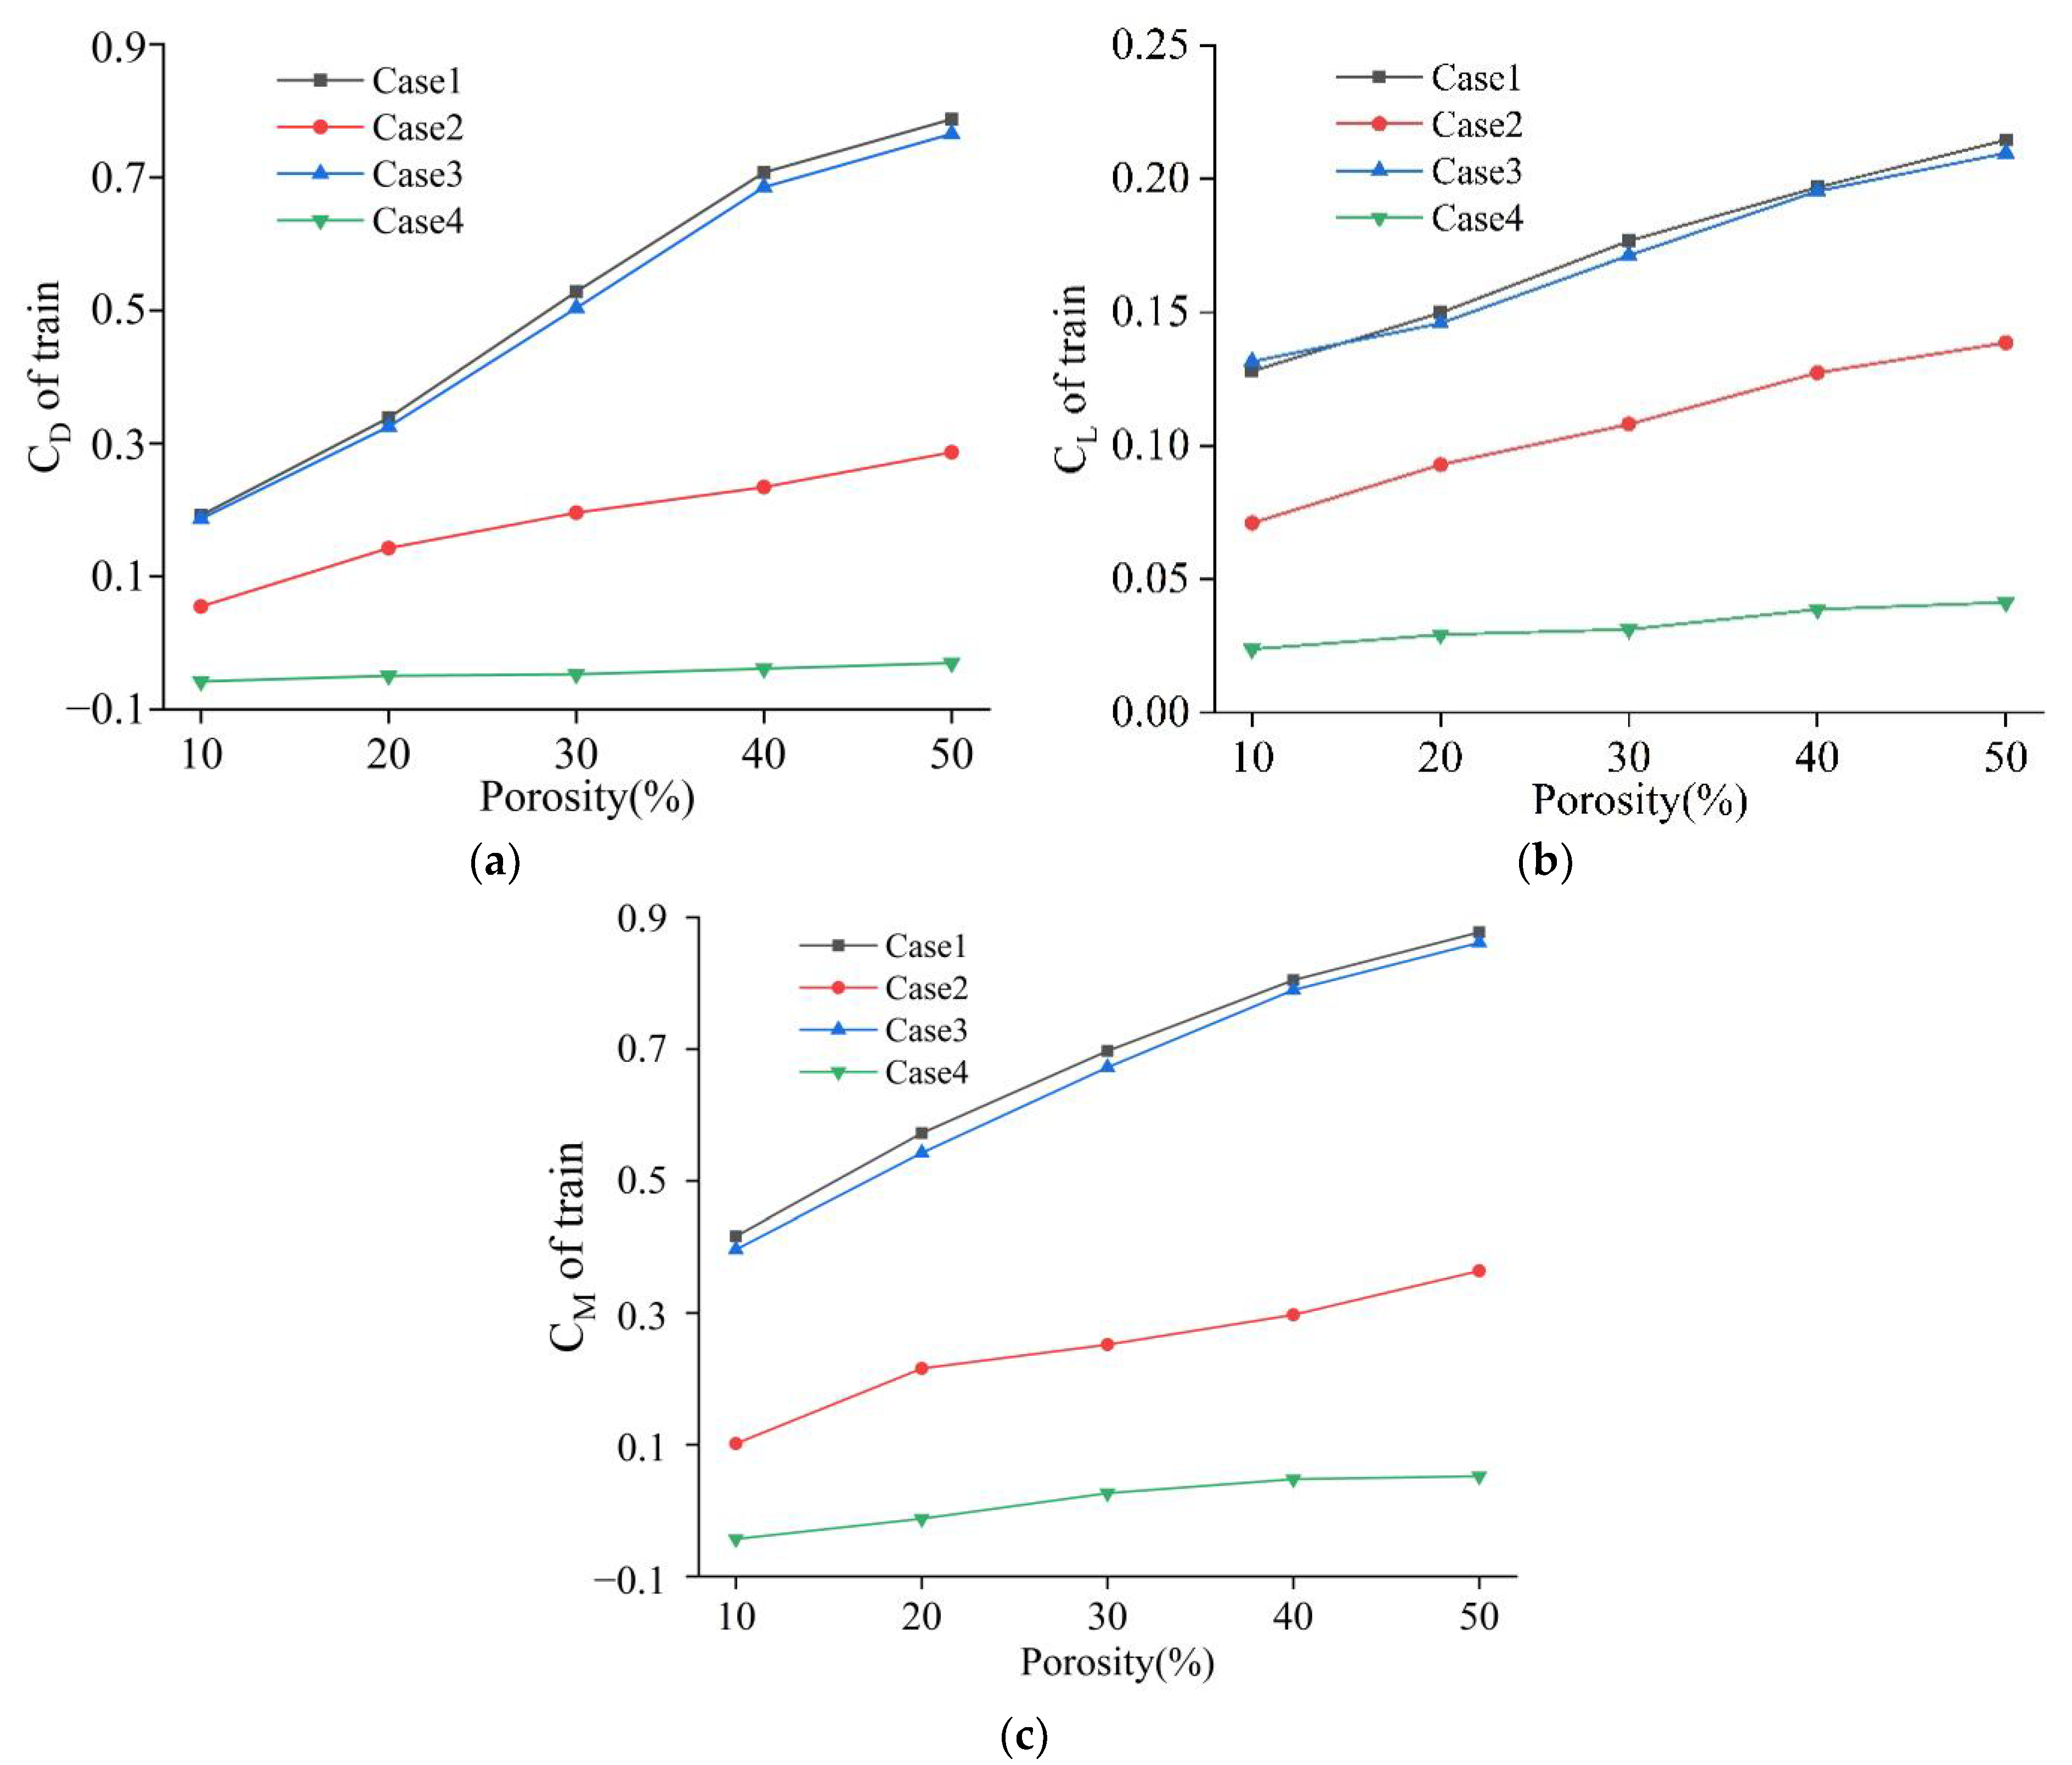
- (c)
- The aerodynamic performance of the test train is greatly affected by the combinations of the train and bridge. When only a single test train is arranged on the bridge, whether on the windward side or leeward side of the bridge, the aerodynamic coefficient and surface wind pressure coefficient of the test train increase with the increase of the porosity of the wind barrier. The aerodynamic and wind pressure coefficients of the test train on the windward side of the bridge are larger than those of the test train on the leeward side of the bridge under the same conditions. When there are trains on both sides of the bridge, the aerodynamic performance of the test train on the windward side of the bridge is slightly affected by the train on the leeward side. However, the test train on the leeward side of the bridge is completely in the wake of the bridge, wind barrier, and train on the windward side. The aerodynamic and wind pressure coefficients are small and insensitive to the porosity of the curved wind barrier.
Author Contributions
Funding
Institutional Review Board Statement
Informed Consent Statement
Data Availability Statement
Conflicts of Interest
References
- Baker, C. The flow around high speed trains. J. Wind Eng. Ind. Aerodyn. 2010, 98, 277–298. [Google Scholar] [CrossRef]
- Suzuki, M.; Tanemoto, K.; Maeda, T. Aerodynamic characteristics of train/vehicles under cross winds. J. Wind Eng. Ind. Aerodyn. 2003, 91, 209–218. [Google Scholar] [CrossRef]
- Baker, C.; Cheli, F.; Orellano, A.; Paradot, N.; Proppe, C.; Rocchi, D. Cross-wind effects on road and rail vehicles. Veh. Syst. Dyn. 2009, 47, 983–1022. [Google Scholar] [CrossRef]
- Dorigatti, F.; Sterling, M.; Baker, C.J.; Quinn, A.D. Crosswind effects on the stability of a model passenger train-A comparison of static and moving experiments. J. Wind Eng. Ind. Aerodyn. 2015, 138, 36–51. [Google Scholar] [CrossRef]
- Avila-Sanchez, S.; Lopez-Garcia, O.; Cuerva, A.; Meseguer, J. Characterisation of cross-flow above a railway bridge equipped with solid windbreaks. Eng. Struct. 2016, 126, 133–146. [Google Scholar] [CrossRef] [Green Version]
- Zou, Y.F.; Fu, Z.Y.; He, X.H.; Cai, C.Z.; Zhou, J.; Zhou, S. Wind load characteristics of wind barriers induced by high-speed trains based on field measurements. Appl. Sci. 2019, 9, 4865. [Google Scholar] [CrossRef] [Green Version]
- Xiang, H.Y.; Li, Y.L.; Chen, B.; Liao, H.L. Protection Effects of Railway Wind Barrier on Running Safety of Train Under Cross Winds. Adv. Struct. Eng. 2014, 17, 1177–1187. [Google Scholar] [CrossRef]
- Hashmi, S.A.; Hemida, H.; Soper, D. Wind tunnel testing on a train model subjected to crosswinds with different windbreak walls. J. Wind Eng. Ind. Aerodyn. 2019, 195, 104013. [Google Scholar] [CrossRef]
- Gu, H.Y.; Liu, T.H.; Jiang, Z.W.; Guo, Z.J. Reserach on the wind-sheltering performance of different forms of corrugated wind barriers on railway bridges. J. Wind Eng. Ind. Aerodyn. 2021, 217, 104735. [Google Scholar]
- Kozmar, H.; Procino, L.; Borsani, A.; Bartoli, G. Sheltering efficiency of wind barriers on bridges. J. Wind Eng. Ind. Aerodyn. 2012, 107, 274–284. [Google Scholar] [CrossRef] [Green Version]
- Kozmar, H.; Procino, L.; Borsani, A.; Bartoli, G. Optimizing height and porosity of roadway wind barriers for viaducts and bridges. Eng. Struct. 2014, 81, 49–61. [Google Scholar] [CrossRef]
- He, X.H.; Wu, T.; Zou, Y.F.; Han, Y.; Shi, K. Aerodynamic characteristics of a trailing rail vehicles on viaduct based on still wind tunnel experiments. J. Wind Eng. Ind. Aerodyn. 2014, 135, 22–33. [Google Scholar] [CrossRef]
- Zhang, T.; Xia, H.; Guo, W.W. Analysis on running safety of train on bridge with barriers subjected to cross wind. Wind Struct. 2013, 17, 203–225. [Google Scholar] [CrossRef]
- Deng, E.; Yang, W.C.; He, X.H.; Zhu, Z.H.; Wang, H.F.; Wang, Y.W.; Wang, A.; Zhou, L. Aerodynamic response of high-speed trains under crosswind in a bridge-tunnel section with or without a wind barrier. J. Wind Eng. Ind. Aerodyn. 2021, 210, 104502. [Google Scholar] [CrossRef]
- Mohebbi, M.; Rezvani, M.A. Analysis of the effects of lateral wind on a high speed train on a double routed railway track with porous shelters. J. Wind Eng. Ind. Aerodyn. 2019, 184, 116–127. [Google Scholar] [CrossRef]
- Guo, W.W.; Xia, H.; Karoumi, R.; Zhang, T.; Li, X.Z. Aerodynamic effect of wind barriers and running safety of trains on high-speed railway bridges under cross winds. Wind Struct. 2015, 20, 213–236. [Google Scholar] [CrossRef]
- Buljac, A.; Kozmar, H.; Pospisil, S.; Machacek, M. Aerodynamic and aeroelastic characteristics of typical bridge decks equipped with wind barriers at the windward bridge-deck edge. Eng. Struct. 2017, 137, 310–322. [Google Scholar] [CrossRef]
- Zhou, Q.; Zhu, L.D.; Guo, Z.S. Numerical simulation for curve windshield barrier effects on wind environment around bridge deck. J. Wuhan Univ. Technol. 2010, 32, 38–44 (In Chinese). (In Chinese) [Google Scholar]
- Ogueta-Gutiérrez, M.; Franchini, S.; Alonso, G. Effects of bird protection barriers on the aerodynamic and aeroelastic behaviour of high speed train bridges. Eng. Struct. 2014, 81, 22–34. [Google Scholar] [CrossRef]
- Spalart, P.R.; Deck, S.; Shur, M.L.; Squires, K.D. A new version of detached-eddy simulation, resistant to ambiguous grid densities. Theor Comp Fulid Dyn. 2006, 20, 181–195. [Google Scholar] [CrossRef]
- Menter, F.R. Two-equation eddy-viscosity turbulence models for engineering applications. AIAA J. 1994, 32, 1598–1605. [Google Scholar] [CrossRef] [Green Version]
- Zhao, D.X.; He, B.J. Effects of architectural shapes on surface wind pressure distribution: Case studies of oval-shaped tall buildings. J. Build. Eng. 2017, 12, 219–228. [Google Scholar] [CrossRef]
- Telenta, M.; Duhovnik, J.; Kosel, F.; Sajn, V. Numerical and experimental study of the flow through a geometrically accurate porous wind barrier model. J. Wind Eng. Ind. Aerodyn. 2014, 124, 99–108. [Google Scholar] [CrossRef]


| Aerodynamic Coefficients | ||||||||||
|---|---|---|---|---|---|---|---|---|---|---|
| Porosity | 0% | 20% | 40% | 0% | 20% | 40% | 0% | 20% | 40% | |
| Train | Test | −0.098 | 0.252 | 0.629 | 0.126 | 0.186 | 0.249 | 0.381 | 0.597 | 0.793 |
| Numerical Simulation | −0.092 | 0.266 | 0.618 | 0.133 | 0.194 | 0.241 | 0.397 | 0.582 | 0.779 | |
| Error/% | 6.522 | 5.263 | 1.781 | 5.263 | 4.124 | 3.320 | 4.030 | 2.577 | 1.797 | |
| Bridge | Test | 2.011 | 1.351 | 0.665 | −0.301 | −0.543 | −0.696 | 0.199 | 0.257 | 0.297 |
| Numerical Simulation | 1.906 | 1.367 | 0.701 | −0.314 | −0.567 | −0.684 | 0.203 | 0.264 | 0.288 | |
| Error/% | 5.509 | 1.170 | 5.136 | 4.140 | 4.233 | 1.754 | 1.970 | 2.652 | 3.125 | |
| Case | Schematic Diagram |
|---|---|
| Case1 |  |
| Case2 |  |
| Case3 |  |
| Case4 |  |
Publisher’s Note: MDPI stays neutral with regard to jurisdictional claims in published maps and institutional affiliations. |
© 2022 by the authors. Licensee MDPI, Basel, Switzerland. This article is an open access article distributed under the terms and conditions of the Creative Commons Attribution (CC BY) license (https://creativecommons.org/licenses/by/4.0/).
Share and Cite
Lou, P.; Tao, W.; Cai, C.; He, X.; Zou, Y.; Ai, Y. Influence of Wind Barriers with Different Curvatures on Crosswind Aerodynamic Characteristics of a Train-Bridge System. Appl. Sci. 2022, 12, 1747. https://0-doi-org.brum.beds.ac.uk/10.3390/app12031747
Lou P, Tao W, Cai C, He X, Zou Y, Ai Y. Influence of Wind Barriers with Different Curvatures on Crosswind Aerodynamic Characteristics of a Train-Bridge System. Applied Sciences. 2022; 12(3):1747. https://0-doi-org.brum.beds.ac.uk/10.3390/app12031747
Chicago/Turabian StyleLou, Ping, Wei Tao, Chenzhi Cai, Xuhui He, Yunfeng Zou, and Yuyan Ai. 2022. "Influence of Wind Barriers with Different Curvatures on Crosswind Aerodynamic Characteristics of a Train-Bridge System" Applied Sciences 12, no. 3: 1747. https://0-doi-org.brum.beds.ac.uk/10.3390/app12031747