Article

SCADA-Compatible and Scaleable Visualization Tool for Corrosion Monitoring of Offshore Wind Turbine Structures

by
Joachim Verhelst
1,*,
Inge Coudron
1,2 and
Agusmian Partogi Ompusunggu
1
1
Flanders Make, Corelab Decisions, Oude Diestersebaan 133, 3920 Lommel, Belgium
2
Faculty of Applied Engineering, University of Antwerp, Groenenborgerlaan 171, 2020 Antwerpen, Belgium
*
Author to whom correspondence should be addressed.
Submission received: 1 December 2021 / Revised: 25 January 2022 / Accepted: 29 January 2022 / Published: 8 February 2022

Abstract

:

Featured Application

Structural corrosion monitoring for offshore wind turbines.

Abstract

The exploitation of offshore windfarms (WFs) goes hand in hand with large capital expenditures (CAPEX) and operational expenditures (OPEX), as these mechanical installations operate continuously for multiple decades in harsh, saline conditions. OPEX can account for up to 30% of the levelised cost of energy (LCoE) for a deployed offshore wind farm. To maintain the cost-competitiveness of deployed offshore WFs versus other renewable energy sources, their LCoE has to be kept in check, both by minimising the OPEX and optimising the offshore wind energy production. As corrosion, in particular uniform corrosion, is a major cause of failure of offshore wind turbine structures, there is an urgent need for corrosion management systems for deployed offshore wind turbine structures (WTs). Despite the fact that initial corrosion protection solutions are already integrated on some critical structural components such as WT towers, WT transition pieces or WT sub-structure (fixed or floating platforms), these components can still be harshly damaged by the corrosive environmental offshore conditions. The traditional preventive maintenance strategy, in which regular manual inspections by experts are necessary, is widely implemented nowadays in wind farm applications. Unfortunately, for such challenging operating environments, regular human inspections have a significant cost, which eventually increase the OPEX. To minimise the OPEX, remote corrosion monitoring solutions combined with supporting software (SW) tools are thus necessary. This paper focuses on the development of a software (SW) tool for the visualisation of corrosion measurement data. To this end, criteria for efficient structural corrosion analysis were identified, namely a scaleable, SCADA-compatible, secure, web accessible tool that can visualise 3D relationships. In order to be effective, the SW tool requires a tight integration with decision support tools. This paper provides three insights: Firstly, through a literature study and non-exhaustive market study, it is shown that a combined visualisation and decision SW tool is currently non-existing in the market. This gap motivates a need for the development of a custom SW tool. Secondly, the capabilities of the developed custom software tool, consisting of a backend layer and visualisation browser designed for this task are demonstrated and discussed in this paper. This indicates that a SCADA-compatible visualisation software tool is possible, and can be a major stepping stone towards a semi-automated decision support toolchain for offshore wind turbine corrosion monitoring.

1. Introduction

The renewable energy markets in the world have reached a mature state and continue growing at a significant rate [1,2]. Among others, wind-sourced electricity production has the potential to deliver a significant contribution to the electric energy portfolio of the world within the next decades. This attracts many new investors and augments market interactions, thereby increasing the importance of optimisation of operational costs and efficiency gains [1].
Europe is a leading player in this domain, notably for offshore wind turbine manufacturing, as (in 2015) European manufacturers produced around 41 to 50% of annually installed wind power installations worldwide. While this market share had increased up to 61% in 2017 [3], in the last five years, both China and USA have made an unprecedented comeback, partially driven by expiring government subsidies. In 2020 [4], the Chinese wind market dominated the global wind market, totalling 97 GW that year, with a share of 40% of the newly installed production capacity worldwide, both onshore and offshore.
As the world’s landmass is rather limited and already under tremendous pressure, offshore installations are becoming ever more popular. The mean cost per produced energy unit for offshore exploitation is rapidly decreasing, thereby closing the gap compared to conventional energy generation methods and onshore wind farms; therefore, many large investors in the domain of windfarm operations move towards larger wind turbines and offshore windfarms. Some sources predict that the global offshore wind farm (WF) market size will continue to grow at a rate of 12% per year [5].
These off-shore investments currently result in a typical levelised cost of (produced) electricity (LCoE) in the range between USD 70 to USD 210 per MWh [2], with a mean around USD 90 per MWh, which is currently still higher than that of most onshore wind turbines estimates (USD 47–60 per MWh p r o d u c e d ) [6]. These costs are mainly composed of three items: capital expenditures (CAPEX) for power production, conversion and transmission installations; operational expenses (OPEX) and the weighted average cost of capital (WACCs) for financing related costs, such as the cost of depth and risk premiums.
This market growth and shift of deployment area does have consequences: Weather conditions and corrosion effects are more severe in offshore and saline environments, making structural stability more critical, while decreasing maintenance time windows. This leads to increased costs for operation and maintenance (O&M) compared to onshore installations, signalling an economic opportunity for (data-driven or model based) optimisation of maintenance scheduling. Due to the unpredictable nature of corrosion, both for installations that are approaching the end of design lifetime and more recent deployments (which may be engineered with lower tolerances), regular inspection and preventive maintenance is crucial to monitor, track and predict the individual status of structural health of individual wind turbines. Moreover, near the end of the planned turbine lifetime, decommissioning should be scheduled and performed.
The scheduling of these maintenance tasks is a complex planning problem [7], wherein the two key bottlenecks of failure mode analysis are: the availability of suitable measurement data and expert insights to interpret the data correctly. In order to bridge this gap, further research is warranted.
The contributions of this paper are threefold:
  • The shifting needs for the wind farm sector with regard to structural corrosion monitoring are identified and listed;
  • A market analysis is performed and presented for existing, commercially available software solutions that combine these needs;
  • A solution for the identified knowledge domain gap is presented, in the form of an open-source platform based software tool that can combine available SCADA data and web-based datastreams.
In the following sections, the state-of-the-art of corrosion monitoring is presented (Section 2), together with a market analysis (Section 3.1) and a presentation of our custom software (SW) tool (Section 3.3.2) developed to tackle these specific needs.

2. State-of-the-Art

In order to analyse the needs and benchmark available software solutions for structural stability evaluation of wind turbines, objective criteria are needed. Several existing wind farm operation market studies were taken as a guideline for this comparison [5,8,9], together with input from EU-project partners involved in the WATEREYE project [10].
In the case of offshore wind turbines, a large variety of support-structure types are used. The most prevalent design is a monopile structure mounted on the seabed floor, yet other structures such as a tripod structures, jacket type or gravity-based structures are used as well [11], while even floating turbines are in the research phase for the deployment of offshore wind turbines in deep waters. A few examples are given in Figure 1.
Therefore, especially for new, non-standard installations such as floating wind turbines, expert supervision for structural analysis will likely be required. Visualisation and decision support tools can assist them in this analysis. A breakdown of the needs for these roles, lead to the following standard practices and derived criteria for structural stability monitoring.

2.1. Maturity of the Wind Turbine Market

The collective world experience with regard to offshore wind turbine structural corrosion is rather limited: Most of the experience regarding corrosion of offshore wind turbine structures is condensed in Europe, especially in Denmark, the Netherlands, Germany and the UK, as 90% of the globally installed offshore installations (by capacity) were produced and installed by European companies [13].
The first offshore windfarm was constructed in 1991 (Ørsted), yet these demonstrators contained small wind turbines (0.5 to 2 MW each) installed in shallow water (3–5 m), whereas in the last decade, the trend is to go towards larger sizes and capacities per wind turbine (3 to 12 MW each), and with anchoring on ever deeper seabeds [13]. In the US, the first commercial offshore wind farm was only constructed in 2016, near Rhode Island. In China, the first commercial offshore windpark was deployed in 2010 [14].

2.2. Standard Practices for Structural Stability Monitoring

Most wind turbine manufacturers offer tools for operational management of their wind turbines; however, the focus of these tools is mostly on the rotating components (gearbox, generator, etc.), whereas the evaluation of structural stability of the wind turbine pylons are rarely addressed in these tools [15].
The default inspection mode for structural stability of offshore wind turbines, are visual (RGB-camera-based) inspections and flooded member detection. For submerged parts, this is traditionally performed by divers or remotely operated vehicles, with a frequency between one and five years. These types of inspections and full scale post construction impact evaluation campaigns [16]; however, can be costly in terms of vessel time, and involve hazards to personnel [17].
Therefore, in more recent constructions, manufacturers or operators often embed sensors to detect and quantify structural loading, flooding or corrosion effects, for example accelerometers, saline senors, displacement measurements or acoustic emission systems.
In this data-rich environment, it is not the data capture that is the main difficulty. Rather, the robustification of the measurements, the detection of all failure modes and the subsequent evaluation and analysis of the captured data is what leads to understanding and effective decision making.

2.3. Criteria for Structural Analysis of WT

From existing literature reviews and interviews, including [17,18,19,20], multiple features for structural analysis of wind turbines are extracted and subsequently condensed in criteria. A holistic SW tool for structural health monitoring of offshore WF should be:
  • Graphical, as structural integrity is related to spatial distribution and location of occurrence.
  • Scaleable and modular. WFs are modular and scaleable by nature, consisting of one, up to several hundreds, of WTs. Modular—to include other, non-corrosion wind-turbine failure modes (blade monitoring, gearbox monitoring, inverter monitoring, ).
  • SCADA compatible, in order to leverage the vast amount of data already captured at the wind turbine (WT) and WF level.
  • Web-based and secure, in order to allow data-analysis by experts, independent of the WF location and shielded from external tampering or unauthorised access.
  • Maintenance planning-inclusive, as the data-based insights can trigger condition-based maintenance maintenance (CBM) or predictive maintenance (PdM) scheduling decisions, actively reducing OPEX.
These identified criteria are subsequently used to evaluate existing SW solutions in the market.

3. Software Solutions

3.1. Existing Windfarm Visualisation Tools

Both for wind-farm development [21] and for structural monitoring and maintenance planning, visualisation tools are indispensable. Dozens of software packages exist in the market for these applications. The scope of this review is not to be exhaustive, nor to provide a judgement or ranking. Rather, the aim is to classify a subset of existing software tools that are publicly advertised, according to the criteria presented in Section 2.
This exercise results in the non-exhaustive overview shown in Table 1. This table shows that there are multiple software providers; each offering unique, functional pieces of software; however, to the author’s knowledge, none of these suppliers currently offer a holistic and tailored solution specifically for the structural monitoring of the windfarm market, including 3D corrosion visualisation and maintenance task planning.

3.2. Existing Visualisation Tools in Other Industries (Oil and Gas)

Beyond the domain of WF, it makes sense to extend the search into an other domain where metal structures are deployed in offshore, saline environments, where corrosion monitoring is important, namely, the offshore oil and gas industry.
Since the economic loss in these industries due to corrosion can be extremely high, monitoring and managing corrosion in the oil and gas industry is paramount importance; therefore, this industry has deployed and is inspecting and maintaining ten-thousands of offshore drilling platforms, undersea pipelines and supporting pylons.
Offshore oil drilling platforms have a long history: the first deep-sea oil-rig was erected in 1947 in the gulf of Mexico, whereas the first platform might have been built around 1890 (Grand Lake, St. Maris) [22].
A similar classification exercise was undertaken for this industry, using the same criteria as stipulated in Section 2.3, in order to carry over suitable approaches and frameworks (where available) to tackle monitoring of renewable energy projects.
Interested readers are directed to existing literature reviews in this field, including (among others) following book [23] and paper [24]. These authors describe common practices for design, maintenance and monitoring of offshore installations.
Table 2 summarises our (non-exhaustive) market analysis of structural corrosion analysis tools used in the oil and gas industry. There are uncountable sources and software packages published online, that list multiple (hundreds) of software packages in this industry [25], that may be applied (with minimal modifications) to WF applications.
From our investigation, most software packages offer one or more of the required functionalities of the listed criteria, yet to our knowledge, no single application offers a holistic solution fitting the needs of the WT structural corrosion monitoring. Furthermore, there is a need for adapting these solutions to the needs of the offshore windfarm industry. Even if one would fit all criteria, it is not certain that it is applicable in plug-and-play fashion to monitor the structural health of wind farms.

3.3. Custom SW Tool

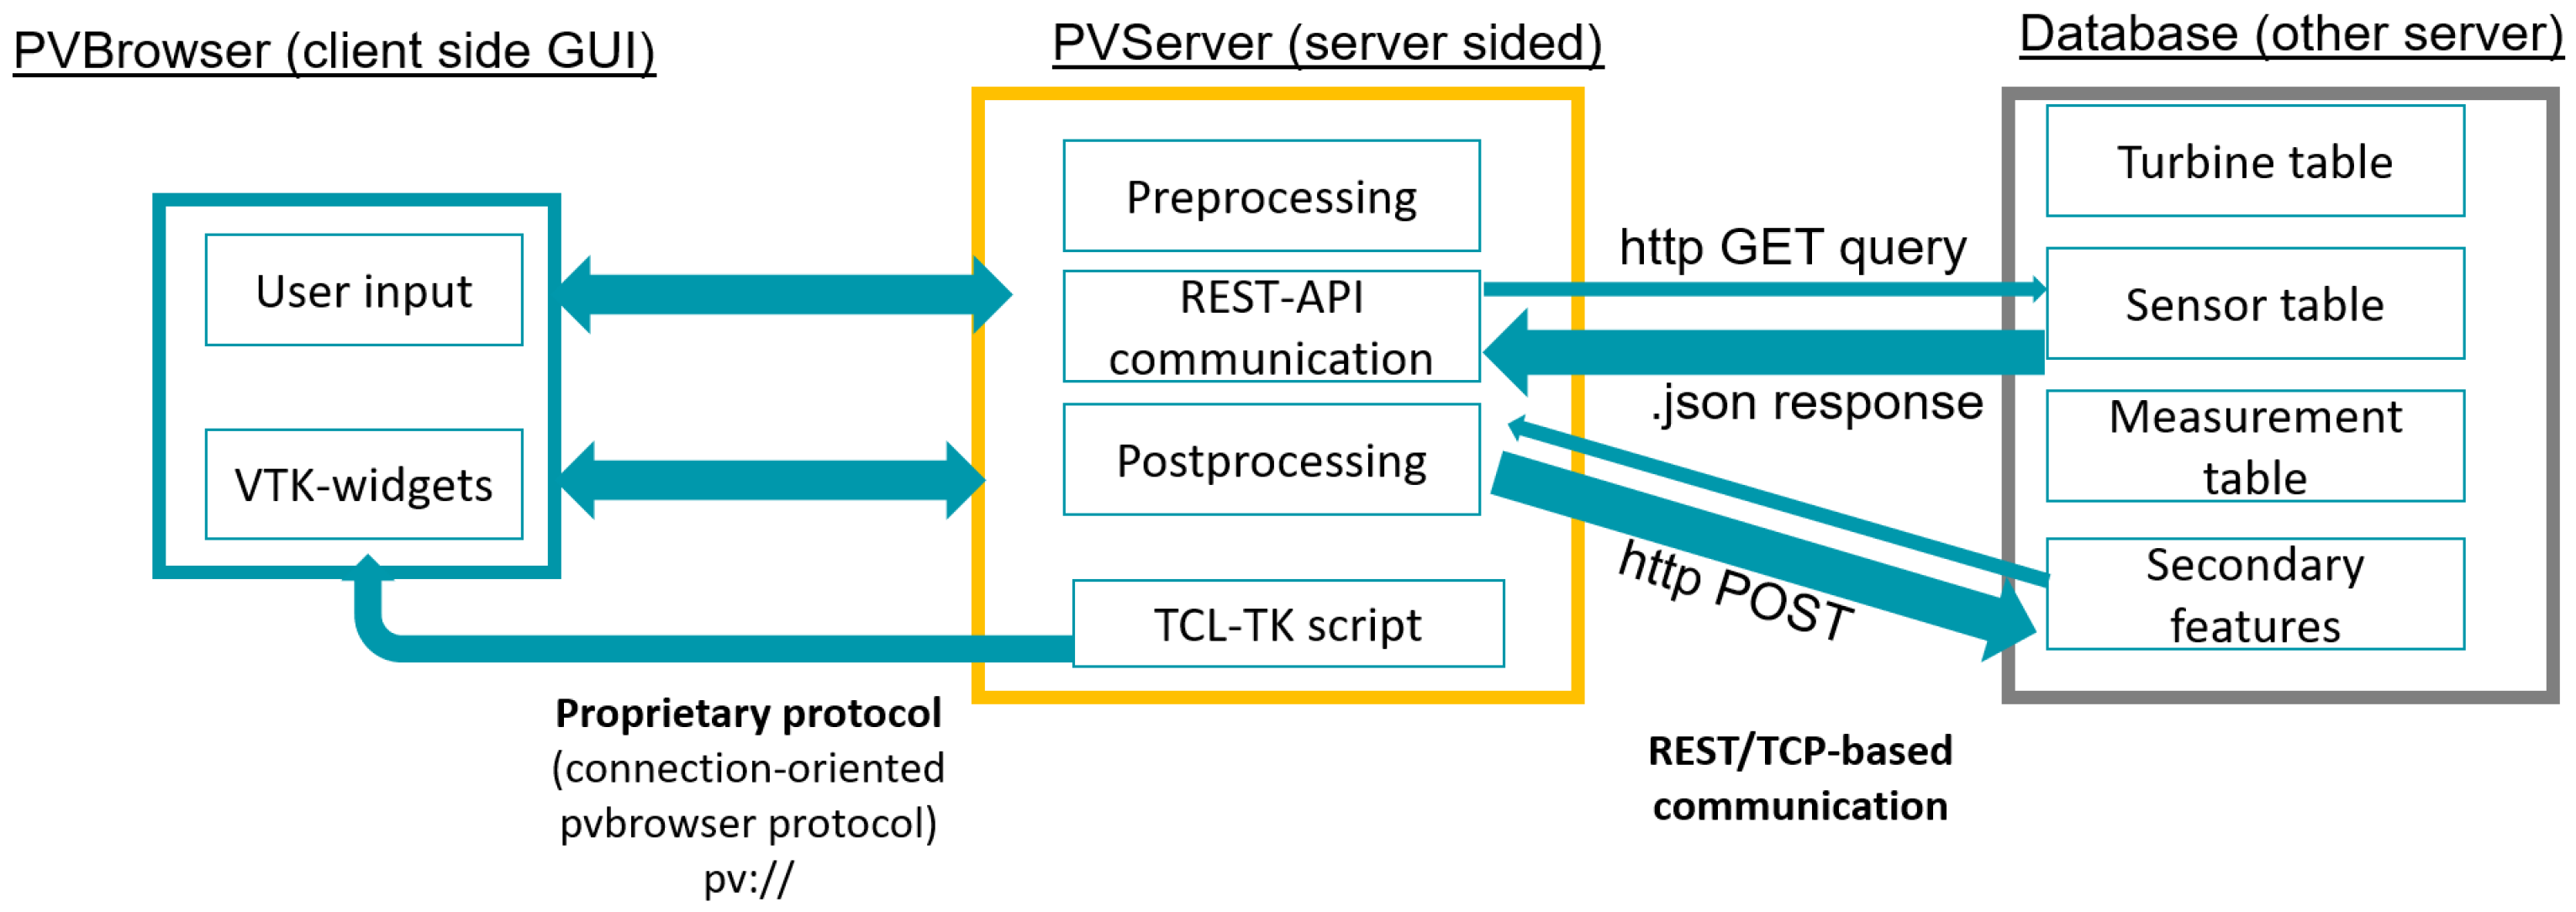
3.3.1. Custom Architecture

In offshore wind turbines, failures of structural components, caused by corrosion at tower including the “tower-platform” junction and the entire splash-zone can cause significant and critical down-times and subsequent loss of electricity production. As no holistic commercially available tool was identified, to the best of the authors’ knowledge, in the framework of the ongoing WATEREYE research project [10], a custom SW demonstrator tool was developed. The initial concept and architecture of the custom SW tool was developed in our previous work [26]. In this paper, the concept and architecture are further refined and finally implemented into a demonstrable and deployable SW tool.
In the WATEREYE project [10], corrosion monitoring and O&M planning tools for offshore wind farms and turbine structures are developed and integrated in (a subsequent version of) the custom SW-tool. Further, in the scope of the WATEREYE project, technologies for monitoring, data analytics, modelling, and diagnosis and for wind turbine (WT) and wind farm (WF) O&M advanced control strategies have been investigated and implemented.
The analysis listed in Table 1, resulted in the design and development of an SW-tool that attempts to cover all criteria identified in Section 2.3. For the framework of this SW tool, Qt [27] was chosen. Because of its highly scaleable characteristics, it allows developers to build components that can run on embedded, desktop and mobile computers, and it supports graphical development (inclusion via widgets). Qt supports all of today’s user interface paradigms, controls and behaviors, making it easy to design really attractive HMIs that users intuitively understand. Furthermore, Qt uses the latest SSL and TLS implementations to safely encrypt data communications for cyber-secure remote-access.
In order to leverage both web-based and SCADA-capabilities, pvbrowser [28] was chosen, which is an open source C++ GUI framework, built on top of Qt. This application framework provides a specialised browser for the client computer and an integrated development environment for creating servers that interact with data acquisition programs (daemons) for many SCADA protocols [28].
The stock architecture of pvbrowser is shown in Figure 2a. PvBrowser is available under the GPL v2 (program) and GNU LGPLv3 (library) licence frameworks.
For 3D-visualisation purposes, the visualisation toolkit (VTK) [29] was used. This C++ based open source toolbox is capable of filtering, processing and visualising large datasets, with numerous user and SCADA interaction capabilities. Pvbrowser provides some support for VTK, but the default browser does not support it out of the box. To setup the VTK-based Qt-widget and to streamline the interaction between the user and the widget, TCL-TK scripts (Graphical toolkit for TCL) were used, available under a BSD-type licence [30].

3.3.2. Custom Visualisation SW Tool

In the WATEREYE project [10], measurements containing corrosion status information are generated using mobile and fixed sensors. These data are stored in a secure database, accessible through a Representational State Transfer application Programming interface (REST-API). A visualisation tool is needed to support O&M experts to understand the status of an offshore wind turbine, based on gathered measurement data. To this end, a visualisation SW tool was developed according to the criteria developed defined in Section 2.
This framework was used to develop a custom web interface, which takes (maintenance staff) user input, queries a REST-datbase to fetch the measurement and prediction data from a windfarm database and subsequently presents the data on a custom pv-dashboard. The user can interact with these data, either visually (in 3D or 2D), or by downloading the underlaying data and processing it offline.
This combination results in the following architecture, depicted in Figure 3. It was based on pvbrowser, but with modified architecture, as explained in Figure 2b. This SW tool is capable of:
  • Querying measurement and geometric data from the database using a REST-API, based on user inputs in the GUI.
  • Pre-processing these data, merging the inputs from different sources into key performance indicators (KPI’s) such as relative corrosion rate (mm/y).
  • Exporting these data toward data-files and image.
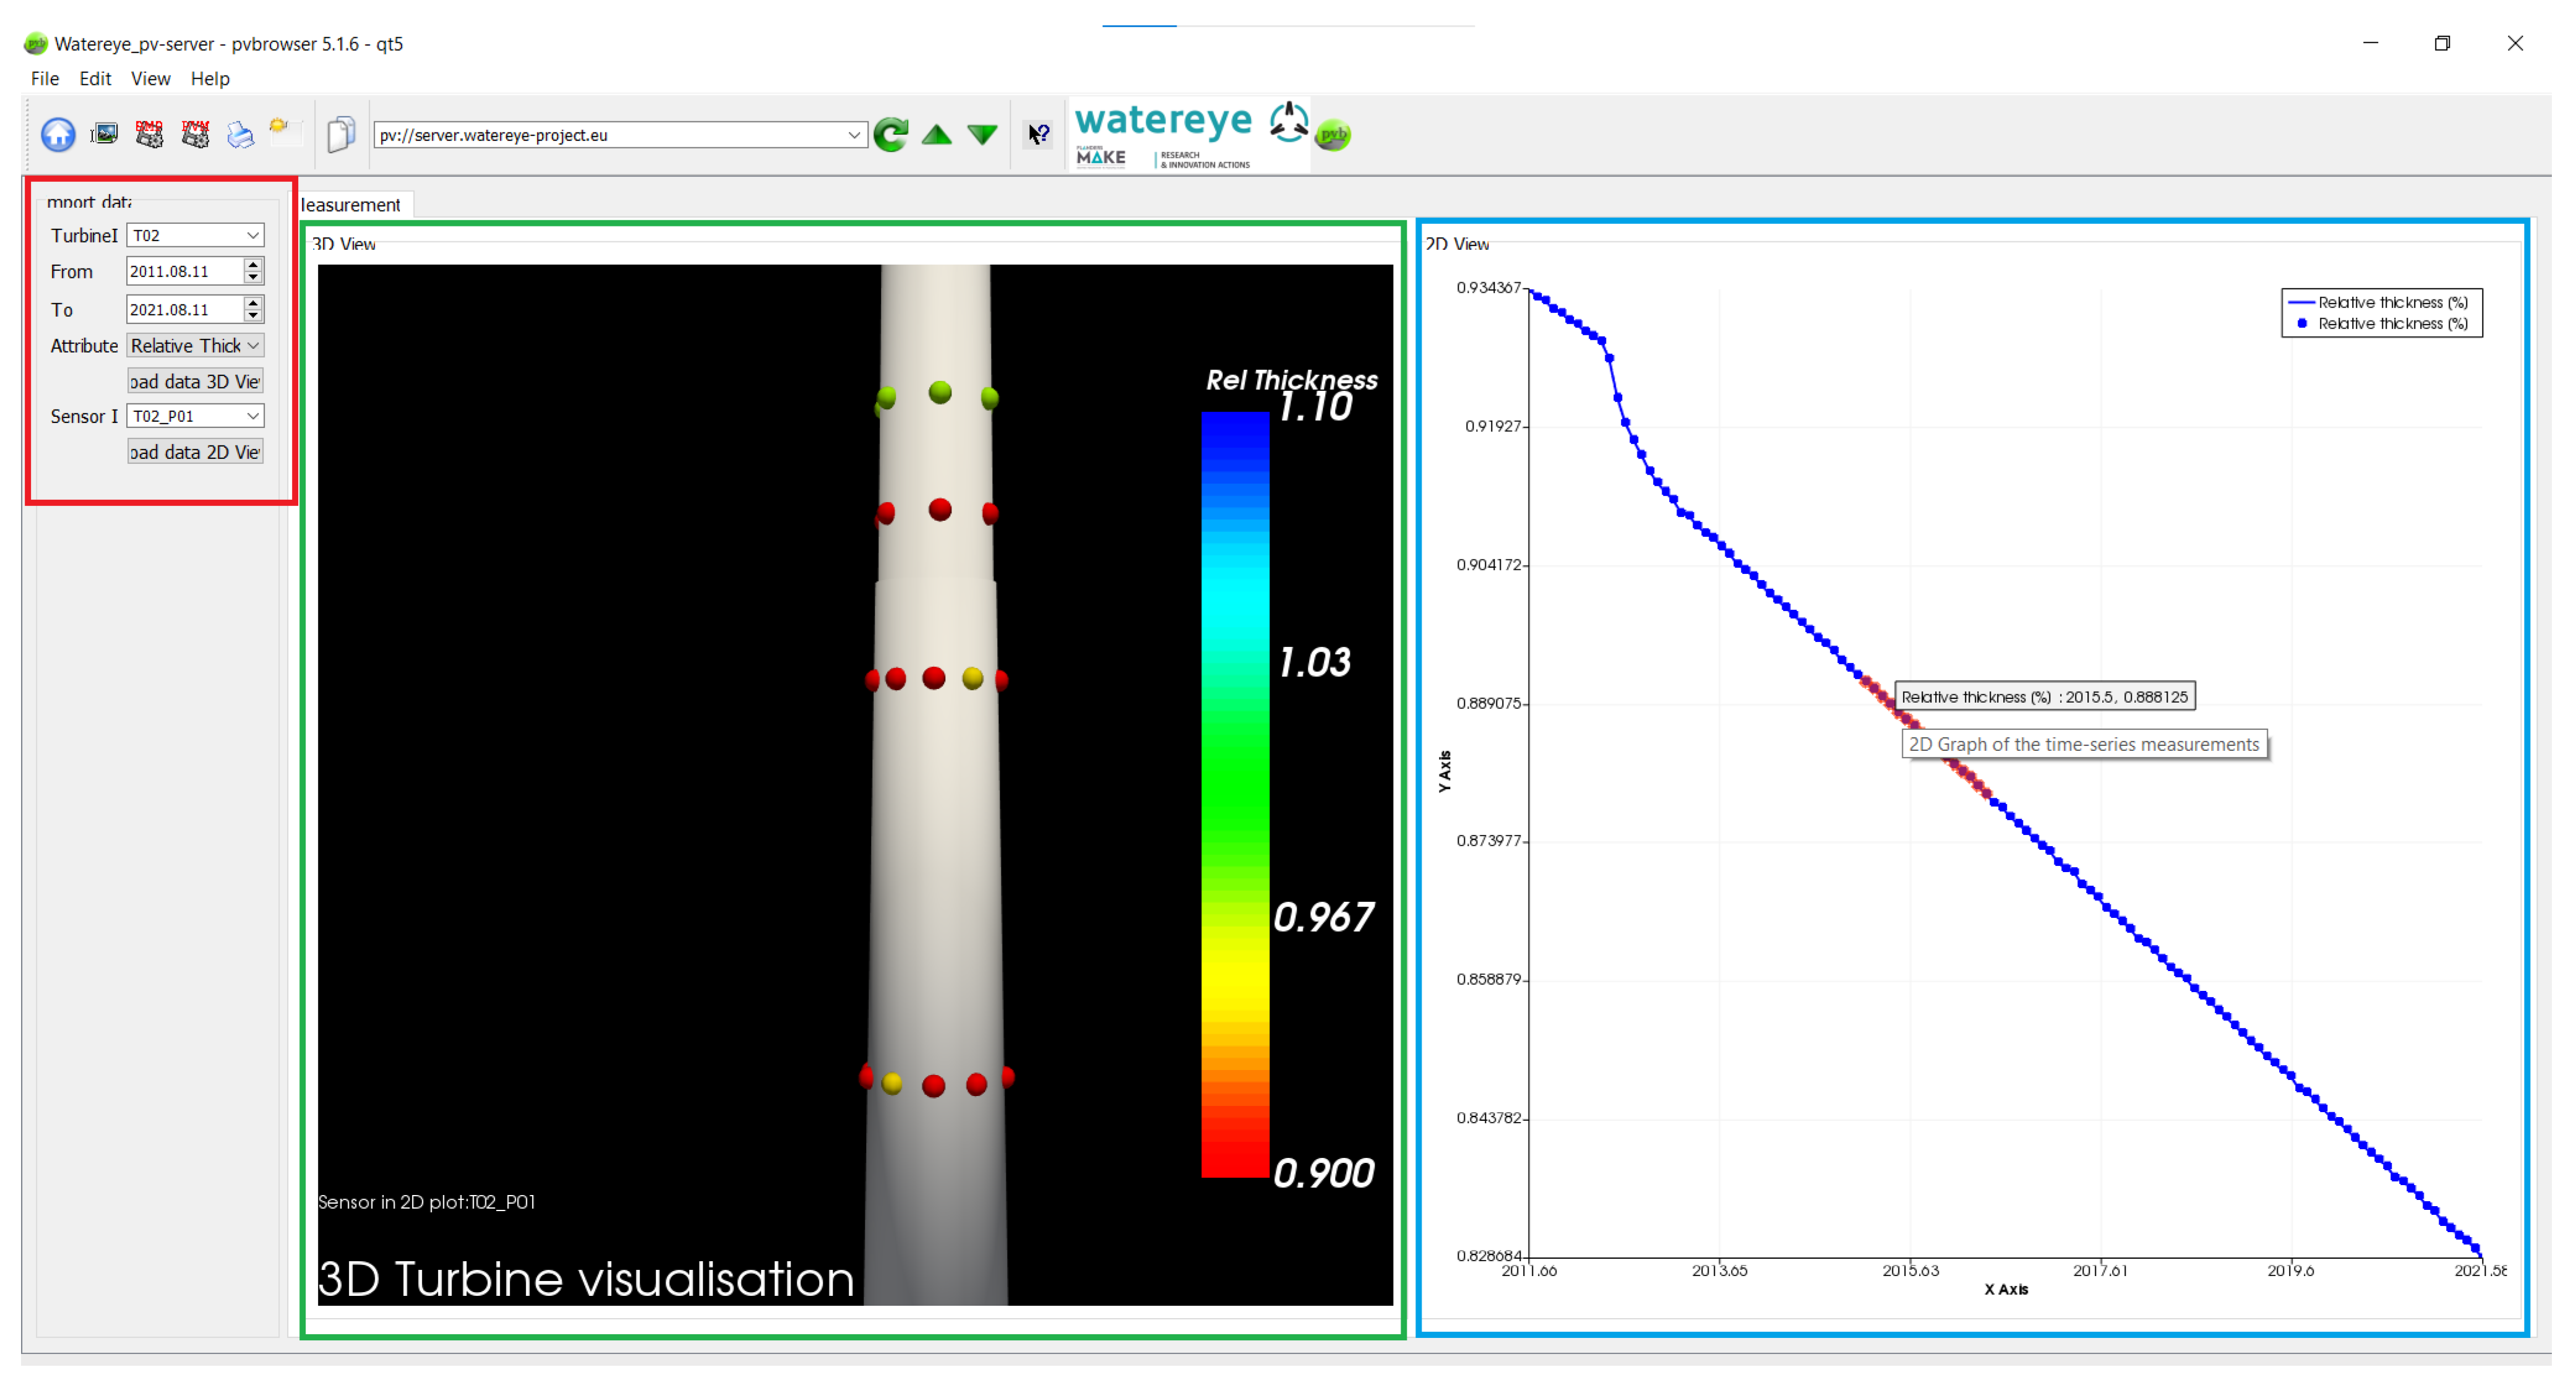
  • Visualising these data in interactive 3D and 2D visualisations.
Through the browser client, the user can access and interact with the data, using a browser-like application. The user can use the software, agnostic of the architecture or changes at server side.
The server architecture allows us to centrally manage and adapt both the data and visualisation output from different windfarms and users.
Based on the chosen parameters, the server component makes a query to the data-server, parses the data and presents them to the user in predefined widgets in the browser side (see Figure 4). There, the user can interact with the data (zoom, query, rotate) to increase his/her understanding of spatial and time relationships, or adapt the query for additional data.
The core functionalities of this SW tool are:
  • Initialisation, with connection to the database, and auto-populating of the dropdown menus for all wind turbines and sensor data available in the database.
  • Selection of a wind turbine to present in 2D and 3D views.
  • Selection of parameters, such as attributes and sensors to visualise and time period of interest.
  • Modularity and expandability, for future functionality (as described in following section).
Any change in the parameters above, triggers the visualisation of:
  • The 3D visualisation of the sensor values at each sensor position on the wind turbine, as shown in Figure 5a,b.
  • The 2D or 3D visualisation of derived the wall thickness loss/defect features or relative thickness.
  • The 2D visualisation of a time series of a selected attribute, at a selected position, over the selected time period, shown in Figure 5c.
The user-friendliness and responsiveness of the tool is further enhanced by enabling 3D-panning, rotating and zooming, sensor highlighting, 2D-point picking and informational tooltips, as shown in Figure 5b,c.

3.4. Discussion

The presented market analysis shows the potential and opportunities present in this growing market of structural monitoring of offshore wind turbine parks, both for applied research and further commercialisation of dedicated software solutions.
The technological readiness level (TRL) of the SW-tool presented here is relatively low (not production ready), as it is not deployed in the field yet, nor tested by a large userbase; however, it does form a profound starting point for further developments.
Paths toward industrial uptake could focus on security and robustness, as well as on an improved user-friendliness and modularity. Further research includes the extension of this SW-tool to stochastic estimates of corrosion processes and inclusion of risk-assessment and economic impact of different degradation scenarios. Moreover, with minimal effort it is possible to transition the SW tool to other fields where 3D visualisation of corrosion measurement data is relevant.

4. Conclusions and Further Research

Based on the insights presented in Section 2 and the existing tools identified in Section 3.3.2, it is clear that there currently is a lack of commercial tools that consider and address all the needs for corrosion monitoring of offshore wind turbine structures.
Furthermore, as corrosion is a slow, stochastic process influenced by multiple disturbances, it is very hard to quantify theoretically; therefore, data-based and risk aware maintenance planning is crucial to ensure the structural integrity of offshore wind assets throughout their intended service life. This improves the risk–return balance of CAPEX and OPEX, thereby further reducing the weighted average cost of capital (WACC).
The SCADA-compatible software tool presented here, can help wind turbine/wind farm operators to translate corrosion-related information to insights on the wind turbine structural degradation. Furthermore, it can assist the operators with the economic scheduling of preventive maintenance interventions.

Author Contributions

J.V.: Software, Methodology, Writing—original draft, Writing—review & editing; I.C.: Conceptualisation, Software, Methodology, Validation; A.P.O.: Conceptualisation, Supervision, Project administration, Funding acquisition, Writing—review & editing. All authors have read and agreed to the published version of the manuscript.

Funding

This research was carried within the WATEREYE project that has received funding from the European Union’s Horizon 2020 research and innovation programme under grant agreement No. 851207.

Institutional Review Board Statement

This study did not involve any testing on animals.

Informed Consent Statement

This study did not involve any testing on humans.

Data Availability Statement

The software described in this paper, developed in the framework of this H2020 WATEREYE project, is defined as a proprietary deliverable. Therefore, the source code of this software cannot be made open source or shared through open access.

Acknowledgments

The authors are grateful for the technical support of Stijn Helsen and Jia Wan during the development of the SW tool.

Conflicts of Interest

The authors declare no conflict of interest. The funding agencies had no role in the design of the study; in the collection, analyses, or interpretation of data; in the writing of the manuscript, or in the decision to publish the results.

References

  1. Alliance, C.G. Creating a Road to Market for Renewables. 2021. Available online: https://cleangridalliance.org/about/history (accessed on 1 August 2021).
  2. Department of Energy, National Renewable Energy Laboratory Transparent Cost Database. 2021. Available online: https://openei.org/wiki/Transparent_Cost_Database (accessed on 11 August 2021).
  3. Lacal-Arantegui, R. Globalization in the wind energy industry: Contribution and economic impact of European companies. Renew. Energy 2019, 134, 612–628. [Google Scholar] [CrossRef]
  4. BloombergNEF Global Wind Industry Had a Record, Near 100GW, Year. Available online: https://about.bnef.com/blog/global-wind-industry-had-a-record-near-100gw-year-as-ge-goldwind-took-lead-from-vestas/ (accessed on 3 August 2021).
  5. Research, C.M. 7th Edition Global Wind Farm Operation Market Report. 2021. Available online: https://www.cognitivemarketresearch.com/service–software/wind-farm-operation-market-report (accessed on 2 August 2021).
  6. Lee, A. Offshore Wind Power Price Plunges by a Third in a Year: BNEF. Available online: https://www.rechargenews.com/transition/offshore-wind-power-price-plunges-by-a-third-in-a-year-bnef/2-1-692944 (accessed on 3 August 2021).
  7. Kovács, A.; Erdős, G.; Viharos, Z.J.; Monostori, L. A system for the detailed scheduling of wind farm maintenance. CIRP Ann. 2011, 60, 497–501. [Google Scholar] [CrossRef]
  8. U.S. Energy Information Administration. Levelized Costs of New Generation Resources in the Annual Energy Outlook. 2021. Available online: https://www.eia.gov/outlooks/aeo/pdf/electricity_generation.pdf (accessed on 2 August 2021).
  9. Ziegler, L.; Gonzalez, E.; Rubert, T.; Smolka, U.; Melero, J.J. Lifetime extension of onshore wind turbines: A review covering Germany, Spain, Denmark, and the UK. Renew. Sustain. Energy Rev. 2018, 82, 1261–1271. [Google Scholar] [CrossRef] [Green Version]
  10. WATEREYE_H2020. O&M Tools Integrating Accurate Structural Health in Offshore energy. Available online: http://www.watereye-project.eu/ (accessed on 15 November 2021).
  11. Fraunhofer Institute for Wind Energy Systems Condition Monitoring of Wind Turbines: State of the Art, User Experience and Recommendations. Available online: https://www.vgb.org/vgbmultimedia/383_Final+report-p-9786.pdf (accessed on 16 August 2021).
  12. Shutterstock. 3D Models. Available online: https://www.turbosquid.com/Search/Index.cfm?keyword=offshore+wind+turbine (accessed on 5 October 2021).
  13. IEA. Offshore Wind Outlook. 2019. Available online: https://iea.blob.core.windows.net/assets/495ab264-4ddf-4b68-b9c0-514295ff40a7/Offshore_Wind_Outlook_2019.pdf (accessed on 11 August 2021).
  14. Zhang, D.; Zhang, X.; He, J.; Chai, Q. Offshore wind energy development in China: Current status and future perspective. Renew. Sustain. Energy Rev. 2011, 9, 4673–4684. [Google Scholar]
  15. Adey, R.; Peratta, C.; Baynham, J. Corrosion Data Management Using 3D Visualisation and a Digital Twin; Whitepaper NACE International; Perdido Beach Resort and Wharf Event Center: Orange Beach, AL, USA, 2020; C2020-14535. [Google Scholar]
  16. Dong energy, C. Barrow Offshore Wind Farm (Denmark), Post Construction Monitoring Report. Available online: https://tethys.pnnl.gov/sites/default/files/publications/Barrow_Offshore_Wind_Monitoring_Report.pdf (accessed on 2 August 2021).
  17. Giuliani, B. Structural Integrity of Offshore Wind Turbines. In Proceedings of the Earth and Space 2010: Engineering, Science, Construction and Operation in Challenging Environments, Honolulu, HI, USA, 14–17 March 2010. [Google Scholar] [CrossRef]
  18. Wilkinson, M.; Darnell, B.; van Delft, T.; Harman, K. Comparison of methods for wind turbine condition monitoring with SCADA data. IET Renew. Power Gener. 2014, 8, 390–397. [Google Scholar] [CrossRef]
  19. Zhu, C.; Li, Y. Reliability Analysis of Wind Turbines. In Stability Control and Reliable Performance of Wind Turbines; Okedu, K.E., Ed.; IntechOpen: London, UK, 2018. [Google Scholar] [CrossRef] [Green Version]
  20. Tautz-Weiniter, W. Using SCADA data for wind turbine condition monitoring—A review. In Special Issue: Wind Turbine Condition Monitoring, Diagnosis and Prognosis; Institution of Engineering and Technology (IET): London, UK, 2016. [Google Scholar] [CrossRef] [Green Version]
  21. Avolio, F. Visualisation tools for wind farms development. In Wind Energy and Landscape; CRC Press: London, UK, 1998; Chapter 6; ISBN 9781003078159. [Google Scholar]
  22. Oil, A.; Society, G.H. Overview of Offshore Oil & Gas History. Available online: https://aoghs.org/offshore-oil-history/ (accessed on 14 September 2021).
  23. Wang, G.; Serratella, C.K.S. Current practices in condition assessment of aged ships and floating offshore structures. In Condition Assessment of Aged Structures; Elsevier Ltd.: Amsterdam, The Netherlands, 2008; pp. 3–35. [Google Scholar]
  24. Sadeghi, K. An Overview of Design, Analysis, Construction and Installation of Offshore Petroleum Platforms Suitable for Cyprus Oil/Gas Fields. J. Soc. Appl. Sci. 2011, 2, 1–16. [Google Scholar]
  25. Clinic, C. List of Corrosion Prediction Software. Available online: https://www.corrosionclinic.com/corrosion%20prediction%20and%20corrosion%20modeling.htm#list_of_corrosion_prediction_software (accessed on 29 September 2021).
  26. Ompusunggu, A.P.; Coudron, I.; Wan, J. Towards a digital twin for corrosion monitoring and health estimation of offshore wind turbine structures. In Proceedings of the WESC2021 Conference Book, Theme 07: Reliability, Monitoring and Sensing Technology, Hannover, Germany, 25–28 May 2021. [Google Scholar]
  27. Sterz. Modernizing SCADA HMIs. Industrial Applications, iPhone Expectations, KDAP Whitepaper. 2019. Available online: https://www.kdab.com/making-industrial-applications-match-iphone-expectations/ (accessed on 11 August 2021).
  28. Lehrig, S. Pvbrowser Manual; Lehrig Software Engineering. 2016. Available online: https://github.com/pvbrowser/pvb/commits/master (accessed on 11 August 2021).
  29. Kitware Inc. The VTK User’s Guide; Kitware Inc.: New York, NY, USA, 2010; ISBN 978-1-930934-23-8. [Google Scholar]
  30. Sun Microsystems, University of Carolina, Scriptics Corporation TCL-TK Licence. Available online: https://tcl.tk/software/tcltk/license.html (accessed on 11 August 2021).
Figure 1. Some commercial offshore wind turbine structures: (a) monopile wind turbine; (b) floating wind turbine; (c) lattice type wind turbine. Images are courtesy of [12].
Applsci 12 01762 g001
Figure 2. (a) Original pvbrowser architecture [28] and (b) modified architecture and data flow, to support the WATEREYE project [10] needs.
Applsci 12 01762 g002
Figure 3. Architecture of custom SW tool, with main components: QT-based (customised) pvserver (orange box) and VTK-enabled pvbrowser (blue box), fetching data from a database (grey box).
Applsci 12 01762 g003
Figure 4. Example of the browser window of our SW-tool. It consists of three areas: user input (red box), a 3D visualisation area (green box) and a 2D time series visualisation (blue box). All widgets are interactive and responsive, as explained in Section 3.3.2.
Applsci 12 01762 g004
Figure 5. (a) Example of the browser 3D window, with a large 3D wind turbine model. (b) Example of the browser 3D window, with 3D model, measurement location and status visualisation capability. (c) Example of the browser 2D window, with interaction and picking capability.
Applsci 12 01762 g005
Table 1. Non-exhaustive list and classification of commercial wind turbine corrosion visualisation and maintenance planning software tools.
NameApplicationGraphicalModular *SCADAWeb-BasedPlanningReference
WindFarmer: AnalystDesign2DmapV (import)XXXdnv.com accessed on 30 July 2021
Surfacepro 3DCorrosion3DVVXXeddyfi.com accessed on 28 July 2021
YokagawaEMS (Energy Management System)2DVVVVyokagawa.com accessed on 8 October 2021
BraveDigitalBespoke (EWT)2DVV (OPC)VXbravedigital.com accessed on 28 July 2021
PingMonitorBlade monitoringXVVVV (forecast)pingmonitor.co accessed on 28 July 2021
Effector OctavisEMSXVVVV (diagnosis)ifm.com accessed on 14 september 2021
Multilevel Wind SCADA CenterEMSVVVVXsiemens.com accessed on 28 July 2021
nCodeFatigue analysisVXVXXhbm.com accessed on 16 August 2021
General ElectricDigital twinVVVXVge.com accessed on 12 September 2021
* 1 Scaleability and Modularity.
Table 2. Non-exhaustive list and classification of commercial oil and gas industry corrosion visualisation and maintenance planning software tools.
NameApplicationGraphicalModular *SCADAWeb-BasedPlanningReference
SmartCETDesignx (reporting)VVVX (alarms)honeywell.com accessed on 14 September 2021
rysco-corrosionSensingxVVXXryscocorrosion.com accessed on 14 September 2021
BeasyCorrosion3DVVXXnace.org, [15] accessed on 8 October 2021
SGS Corrosion monitoringMonitoringxXXXV (alarms)www.sgsgroup.com.cn accessed on 14 July 2021
Corrosion ClinicManual analysisVXXXX[25]
* 1 Scaleability and Modularity.
Publisher’s Note: MDPI stays neutral with regard to jurisdictional claims in published maps and institutional affiliations.

