Article

Mapping of Hydrothermal Alteration Zones in the Kelâat M’Gouna Region Using Airborne Gamma-Ray Spectrometry and Remote Sensing Data: Mining Implications (Eastern Anti-Atlas, Morocco)

1
Laboratory Physico-Chemistry of Processes and Materials, Research Team Geology of the Mining and Energetics Resources, Faculty of Sciences and Technology, Hassan First University of Settat, Settat 26002, Morocco
2
Laboratory of Applied Geology and Geo-Environment, Faculty of Science, Ibn Zohr University, Agadir 80000, Morocco
3
Structural Geology and Thematic Mapping Laboratory, Earth Sciences Department, Faculty of Science, Ibn Zohr University, Agadir 80000, Morocco
4
Laboratory for Sustainable Innovation and Applied Research, Universiapolis, Technical University of Agadir, Agadir 80000, Morocco
5
Laboratory of Geoengineering and Environment, Department of Geology, Faculty of Sciences, University of Moulay Ismail, BP 11201 Zitoune, Meknes 50000, Morocco
6
Dipartimento di Scienze Matematiche e Informatiche, Scienze Fisiche e Scienze della Terra, Università degli Studi di Messina, Via F. Stagno d’Alcontres, 31-98166 Messina, Italy
7
GeoloGIS s.r.l. Spin Off of Università degli Studi di Messina, 31-98166 Messina, Italy
*
Authors to whom correspondence should be addressed.
Submission received: 3 December 2021 / Revised: 3 January 2022 / Accepted: 13 January 2022 / Published: 18 January 2022
(This article belongs to the Special Issue Future Transportation)

Abstract

:
The mapping of hydrothermal alteration zones associated with mineralization is of paramount importance in searching for metal deposits. For this purpose, targeting alteration zones by analyzing airborne geophysical and satellite imagery provides accurate and reliable results. In the Kelâat M’Gouna inlier, located in the Saghro Massif of the Moroccan Anti Atlas, natural gamma-ray spectrometry and ASTER satellite data were used to map hydrothermal alteration zones. Natural gamma-ray spectrometry data were processed to produce maps of Potassium (K in %), Uranium (eU in ppm), Thorium (eTh in ppm) and ratios of K/eTh and K/eU. In addition, four-band ratios were computed, on ASTER data, to map the distribution of clay minerals, phyllitic minerals, propylitic minerals, and iron oxides. The combined results obtained from geophysical and satellite data were further exploited by fuzzy logic modelling using the Geographic Information System (GIS) to generate a mineral prospectivity map. Seven hydrothermal alteration zones likely to be favorable for mineralization have been identified. They show a spatial correlation with (i) known surface prospects and mineral occurrences, (ii) the granite-encasing contact zone, and (iii) the fault zones (Sidi Flah and Tagmout faults). This research therefore provides important information on the prospecting of mineral potential in the study area.

1. Introduction

The mapping of hydrothermal alteration zones associated with mineralized systems is of great importance in mineral exploration, especially in the early stages of metal de-posit exploration [1,2,3,4,5,6,7,8,9,10,11]. However, the hydrothermal alteration minerals formed can vary significantly, depending on the chemical composition of the primary rock and hydrothermal fluids, the nature of the host, temperature and pressure conditions, and the tectonic setting [12].
Many methods have been proposed to map the spatial distribution of hydrothermal alteration zones. The method of processing multispectral satellite images, especially those of the ASTER sensor, is qualified among the most used approaches [4,6,7,8,10,11,13,14,15,16,17,18]. Apart from remote sensing data, processing of geophysical data contributes assuredly to minerals exploration through their different geophysical components (gravimetric, magnetometric, electrical, electromagnetic and natural gamma spectrometric methods) [19,20,21,22,23,24]. The natural gamma-ray spectrometric method has been widely and successfully used in mineral exploration and identification of alteration zones [20,21,25,26,27,28,29,30]. However, few studies have been tested the application of this method in conjunction with the open accessible free satellite images.
In this regard, we used satellite data from the ASTER sensor, airborne natural gamma-ray spectrometry and surface geological data to identify potential mineral explo-ration sites in the area of Kelâat M’Gouna/Morocco. This area is located in the Jbel Saghro massif, one of the most important massifs of Morocco’s Anti-Atlassic chain, which is recognized for its composition in mineral raw material (Figure 1). This area has recently been the subject of mining exploration activity that has led to discovering three gold deposits: Ismlal, Talat-n-Tabarought and Tawrirt-n-Çwalh. These deposits are controlled by complex hydrothermal processes such as silicification, chloritization, hematization and sericitization [31,32]. These processes occurred under specific geodynamic conditions that characterized the geological history of the Anti-Atlas.
The aim of this study is to conduct a geological mapping of mineral composition in Kelâat M’Gouna area by combining geophysical and remote sensing data. This study was conducted with main objective of (i) accurately mapping hydrothermal alteration zones; (ii) developing a mineral prospectivity maps by combining thematic layers using fuzzy logic modelling; (iii) relating mineral formation processes to hydrothermal events; and (iv) clarifying the characteristics of the mineral formations in the different tectonic units of the study area.

2. Material and Methods

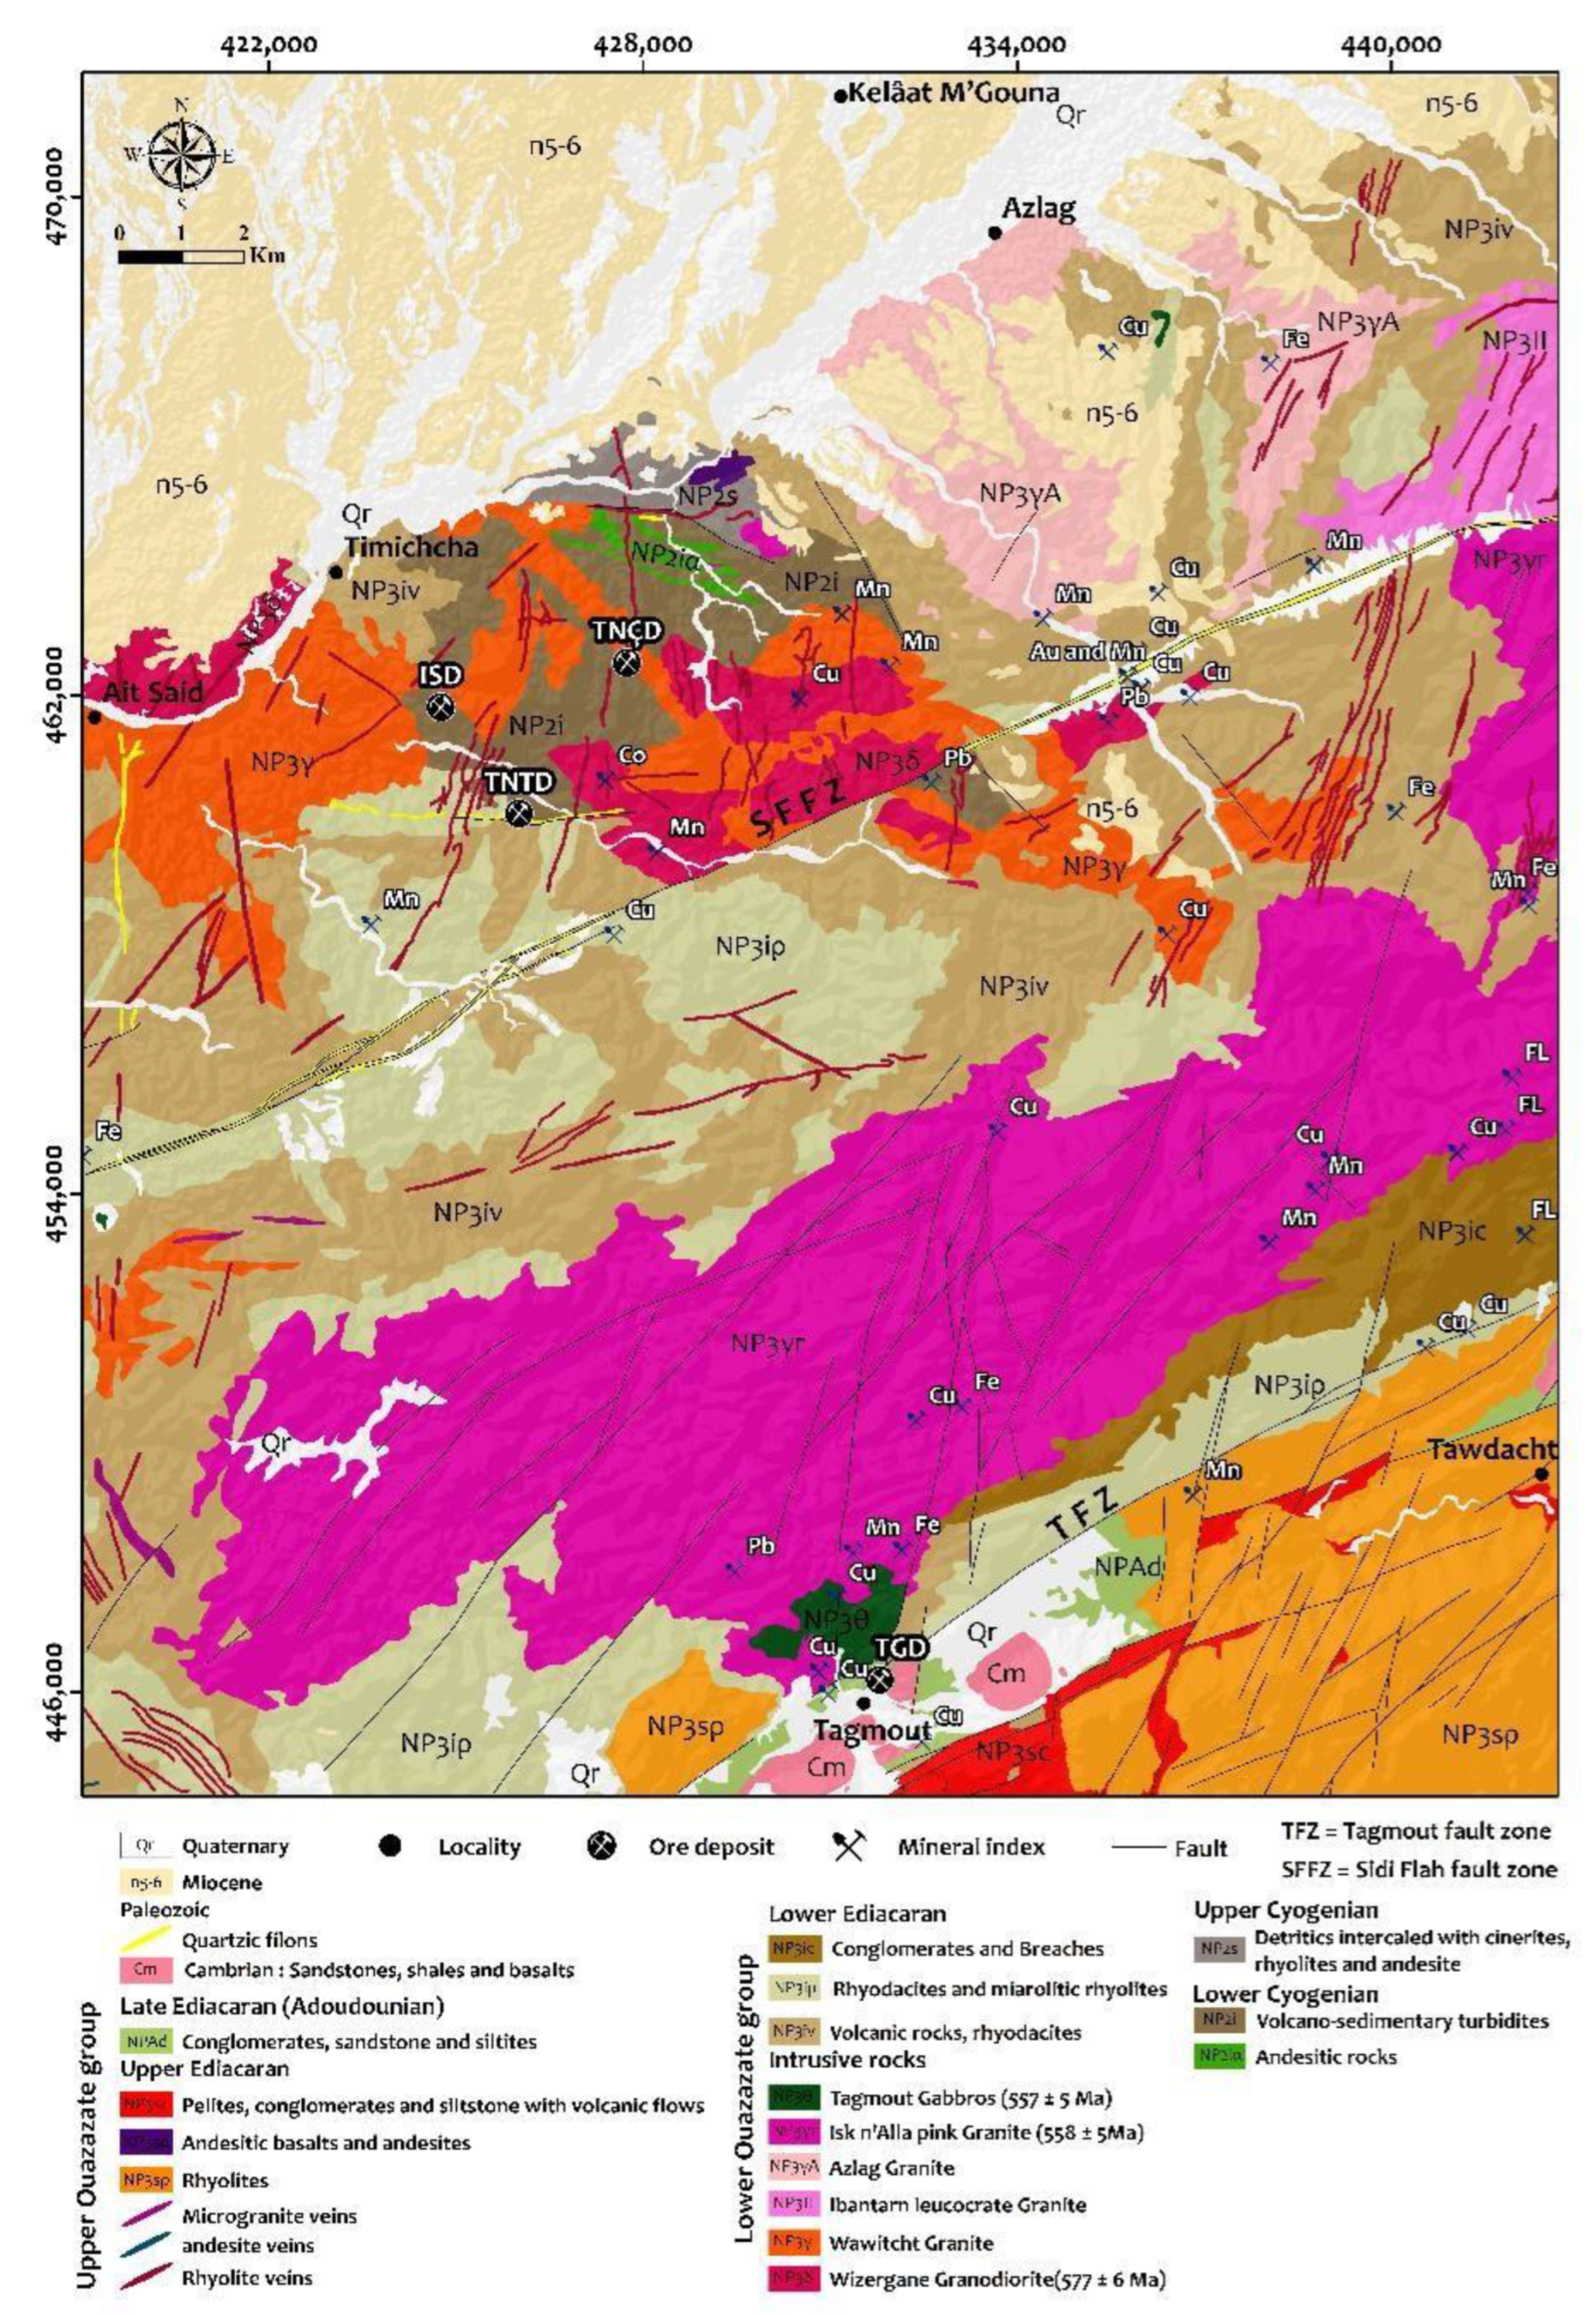
2.1. Geological Context of the Study Area

The Saghro massif is located NE of the major accident of the Anti-Atlas (Figure 1b), which is interpreted as a Pan-African suture following the identification of a complex ophiolite that stakes it [38]. It is subdivided into three domains, (i) the Western Saghro corresponding to the Sidi Flah and Bouskour inliers, (ii) the Central Saghro corresponding to the Kelâat M’Gouna inlier and (iii) the Eastern Saghro formed by the Boumalne and Imiter inliers (Figure 1).
The study area corresponds to the geological sheet of Kelâat M’Gouna, at 1:50,000 scales. It is geographically attached to the Kelâat M’Gouna inlier, between meridians 6°00 W and 6°15 W and parallels 31°00 N and 31°15 N. This area contains a wide range of geological formations ranging in age from Cryogenian to the present day (Figure 2). The Lower Cryogenian formations, which are volcano-sedimentary and metamorphic, are the oldest in the Jbel Saghro massif and correspond to turbidites interbedded with basic volcanic flows and intruded by gabbros, diorites and granites [32,39,40,41,42]. They are overlain in anomalous contact, by Upper Cryogenian conglomerates, sandstones, limestones, cinerites, rhyolites and andesites [36,43], and they are overlain by the formations of the Ouarzazate Group, which in turn, comprises two discordant sets on top of each other [31]. The first set corresponds to the Lower Ediacaran or the Lower Ouarzazate Group, composed of potassium-rich volcanic and granitic formations that intrude all the previous geological formations. The second set corresponds to the Upper Ediacaran or Upper Ouarzazate Group, consisting of detrital and volcanic formations intruded by rhyolite and microgranite dikes. The formations of the Upper Ouarzazate Group are tectonically continuous with the Adoudounian sedimentary formations. The Paleozoic formations are poorly represented in the study area. They are limited to the Tagmout graben (Figure 2), where they are exposed in conglomerates, pink sandstones with basalt intercalation, Paradoxides shales and Tabanites sandstones [31]. The Cenozoic-Quaternary sedimentary deposits correspond to the filling of the Ouarzazate basin.

2.2. Structural and Tectonic Context of the Study Area

The Saghro Massif is affected by the major phase of the Pan-African Orogeny (B1) dated at 685 ± 15 Ma [44]. This phase is responsible for the emplacement of diorite, quartz diorite and granodiorite massifs along N130° troughs at Bouskour [45,46] and at Boumalne-Dadès [47]. This phase is followed by the late phase (B2) of weak intensity and without metamorphic transformation. It is responsible for the development of granitic massifs in the Bouskour and Ougnat inliers.
The formations, which outcrop on the Kelâat M’Gouna sheet, have undergone the various tectonic events that affected the Anti-Atlas. These events are reflected by the dominance of brittle structures classified in general according to their orientation in three families:
  • The first family-oriented NE-SW is the most dominant and with plurikilometer lengths. The most important faults of this family are the Sidi Flah fault and the faults bordering the Tagmout graben (Figure 2). The Sidi Flah fault shows a sinister set related to its reactivation under the effects of the Hercynian orogeny [31]. The Tagmout graben corresponds to the western extension of the great graben located in the heart of the Saghro massif [48,49].
  • The second family is oriented NNW-SSE and shows a dexterous set in coherence with the antithetic movement [31].
  • The third family is oriented NNE-SW and corresponds to dolerite and rhyolite dikes that were emplaced in the echelon distension fractures of the synthetic Riedel faults playing in shear in the same stress field around 564 Ma [50].

2.3. Ore Deposits of the Study Area

Many distinct categories of mineralization have been identified on the Kelâat M’Gouna sheet and constitute about 50 showings and deposits such as gold, copper, iron, lead, fluorine, manganese, cobalt and silver (Figure 2). The most important mineralization is represented by gold deposits represented by three gold occurrences that are so far in the development phase: Ismlal, Talat-n-Tabarought and Tawrirt-n-Çwalh [31,32,41]. According to mineralogical, textural, structural and chemical aspects of these occurrences, two main types of mineralization have been distinguished: an old porphyry type system, followed by a younger epithermal type system [41,51]. At Ismlal, gold mineralization is hosted in Lower Cryogenian volcano-sedimentary turbidites (NP2i), intruded by granodiorites of Lower Ediacaran age (NP3i). It occurs as quartz veins ranging from N0° to N120°, in breccias of general orientation N120° and dissemination in the volcano-sedimentary turbidites of NP2i. Gold grades are estimated at 0.5 g/t. The length of this mineralized zone is about 800 m, and its width is about 200 m [31,32]. At Talat-n-Tabarought, the gold-bearing structure is in the form of the NW-SE, and NE-SW trending T. Gold grades (between 0.1 and 0.3 g/t) is low compared to those at Ismlal [31]. The mineralization host is NP2i sandstone, and it presents quartz micro veins at the edge of pyrite granodiorite and tourmaline granodiorite intrusions. At Tawrirt-n-Çwalh, the gold mineralization is discontinuous in an NNE-SW direction and is 800 m in extent. The host of this mineralization corresponds to a metamorphic sandstone-pelitic alternation of NP2i age injected by quartz veins and potassic feldspars with gold visible to the naked eye [31,41]. Gold grades are interesting and range from 1 to 9 g/t [31,32,41]. In addition, copper mineralization is well recognized in the region, the most important of which is Tagmout which is located south of the study area (Figure 2). It is a hydrothermal vein deposit hosted by gabbros, monzogabbros and granites of the Upper Neoproterozoic. The metallogenic study of the deposit identified a copper paragenesis dominated by chalcopyrite, chalcocite, bornite, covellite, cuprite, grey copper and malachite [31].

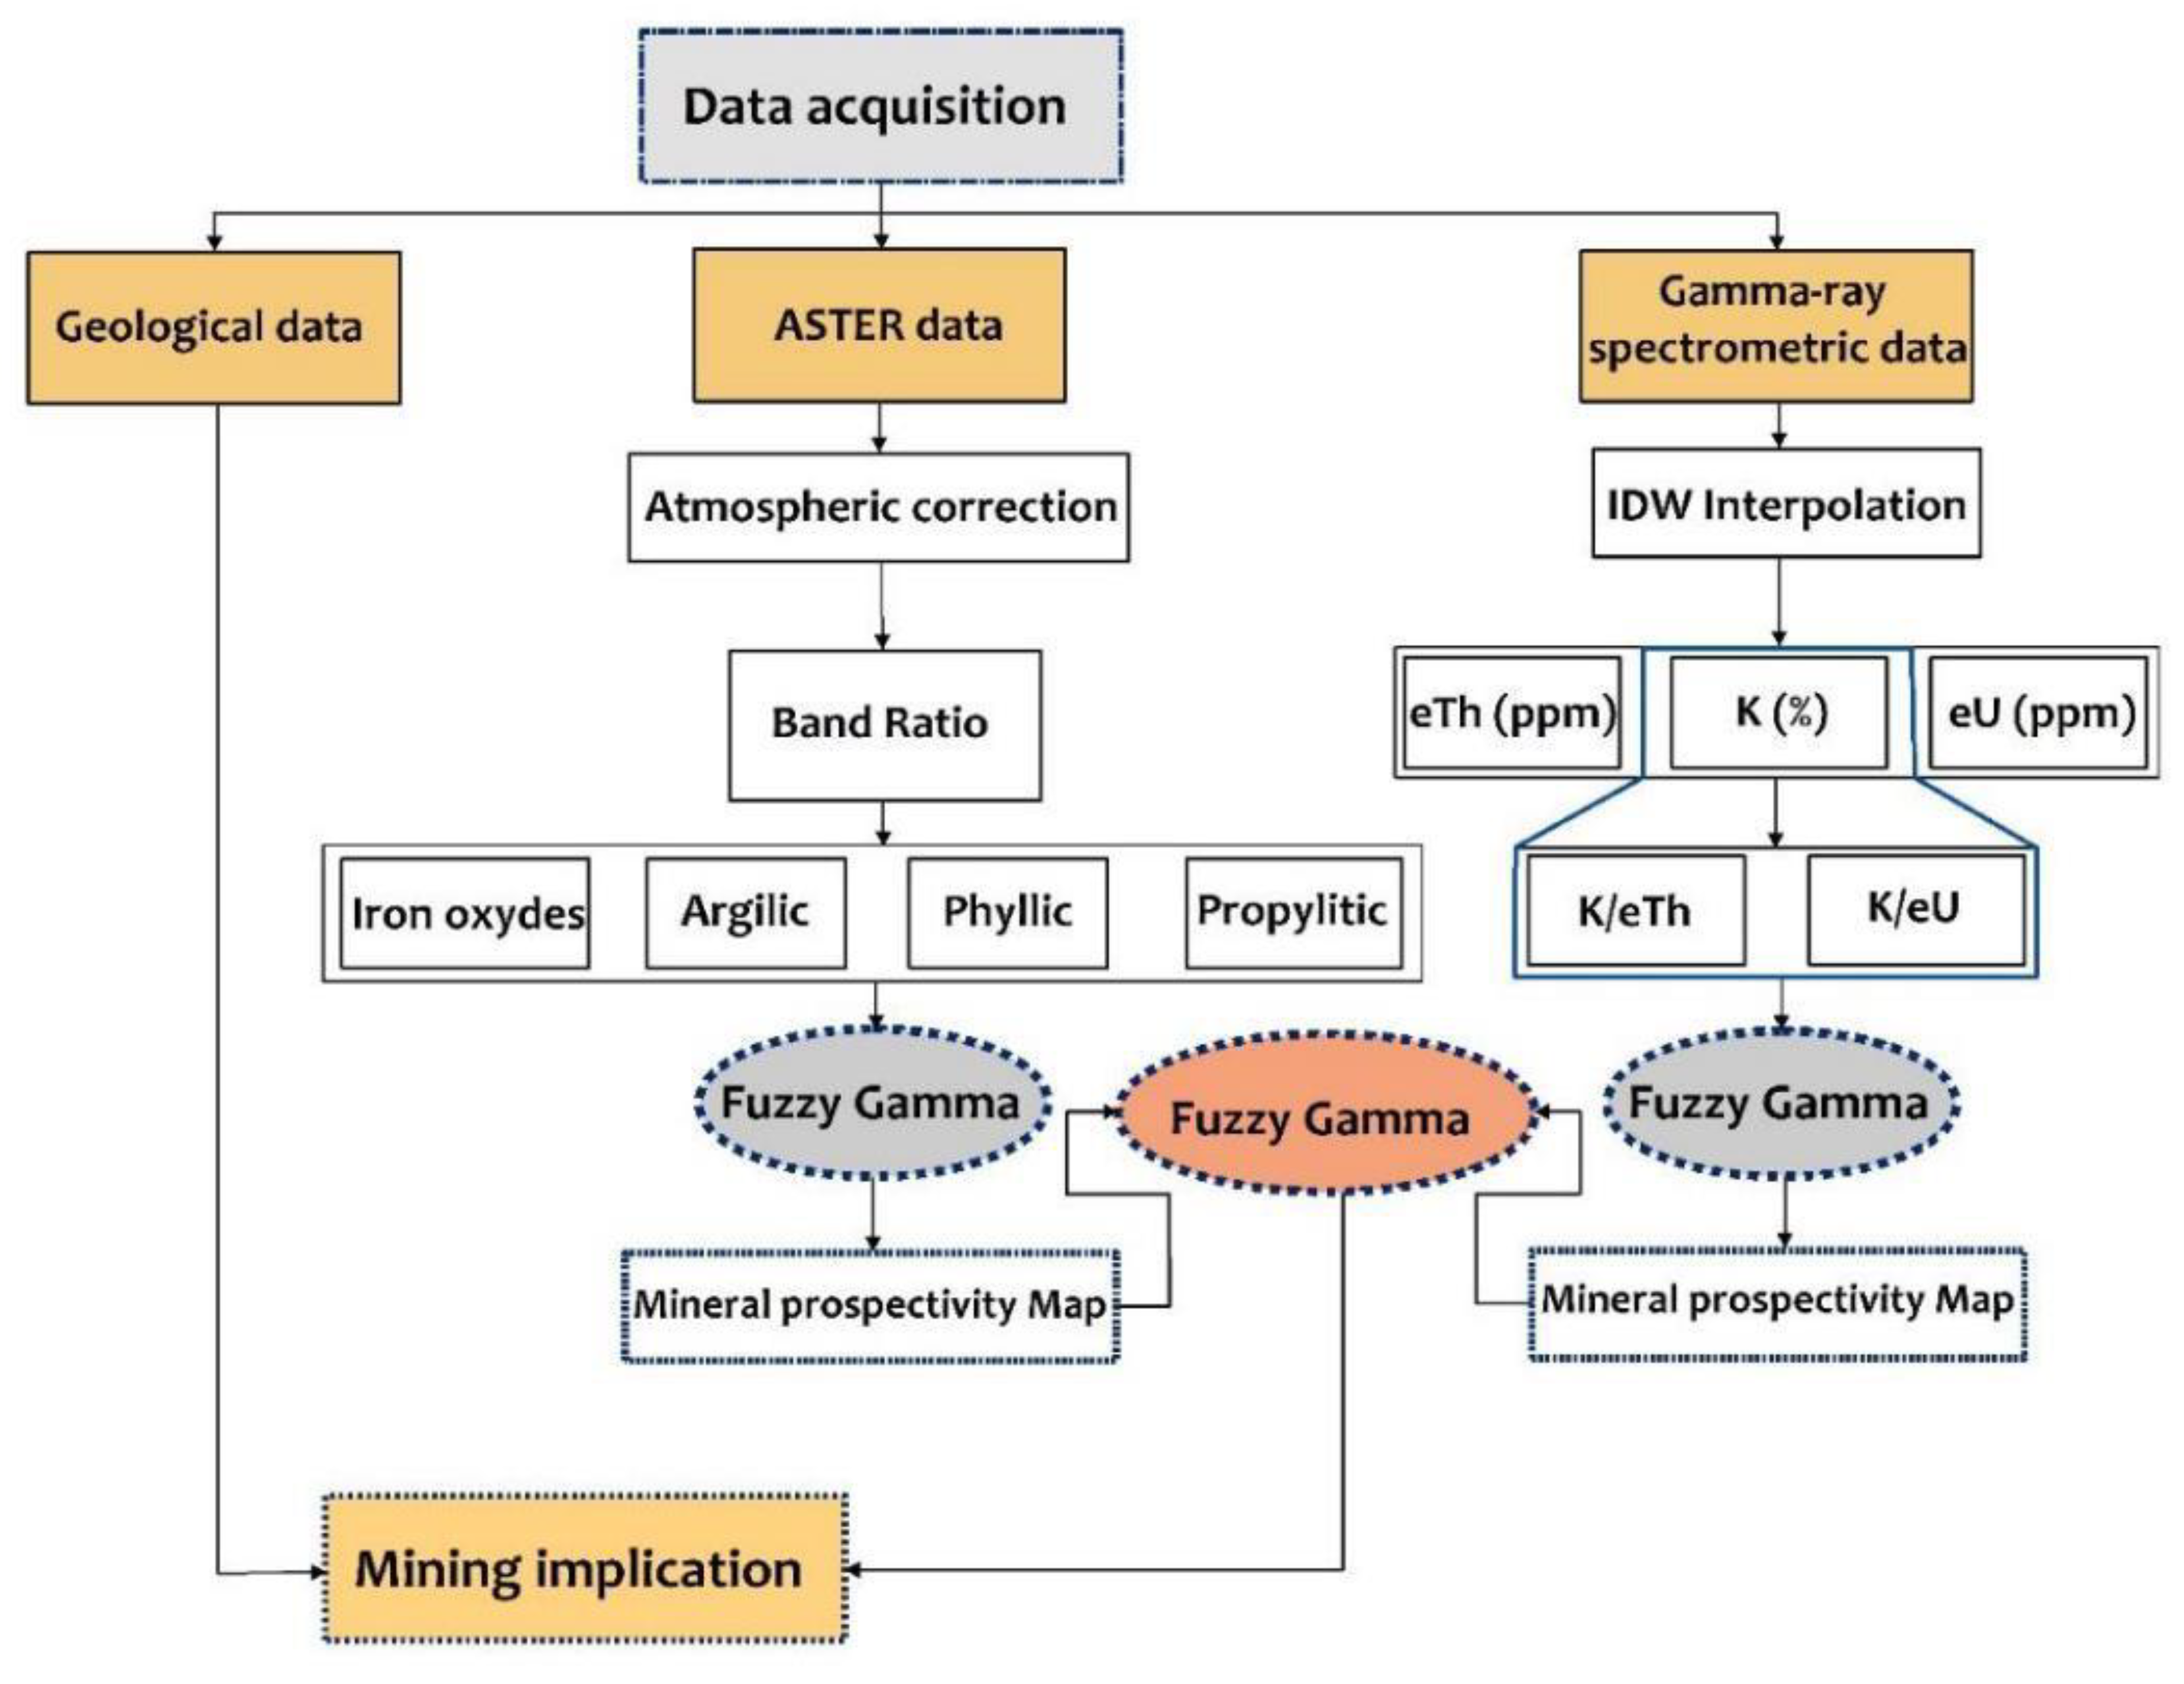
2.4. Geophysical and Remote Sensing Data

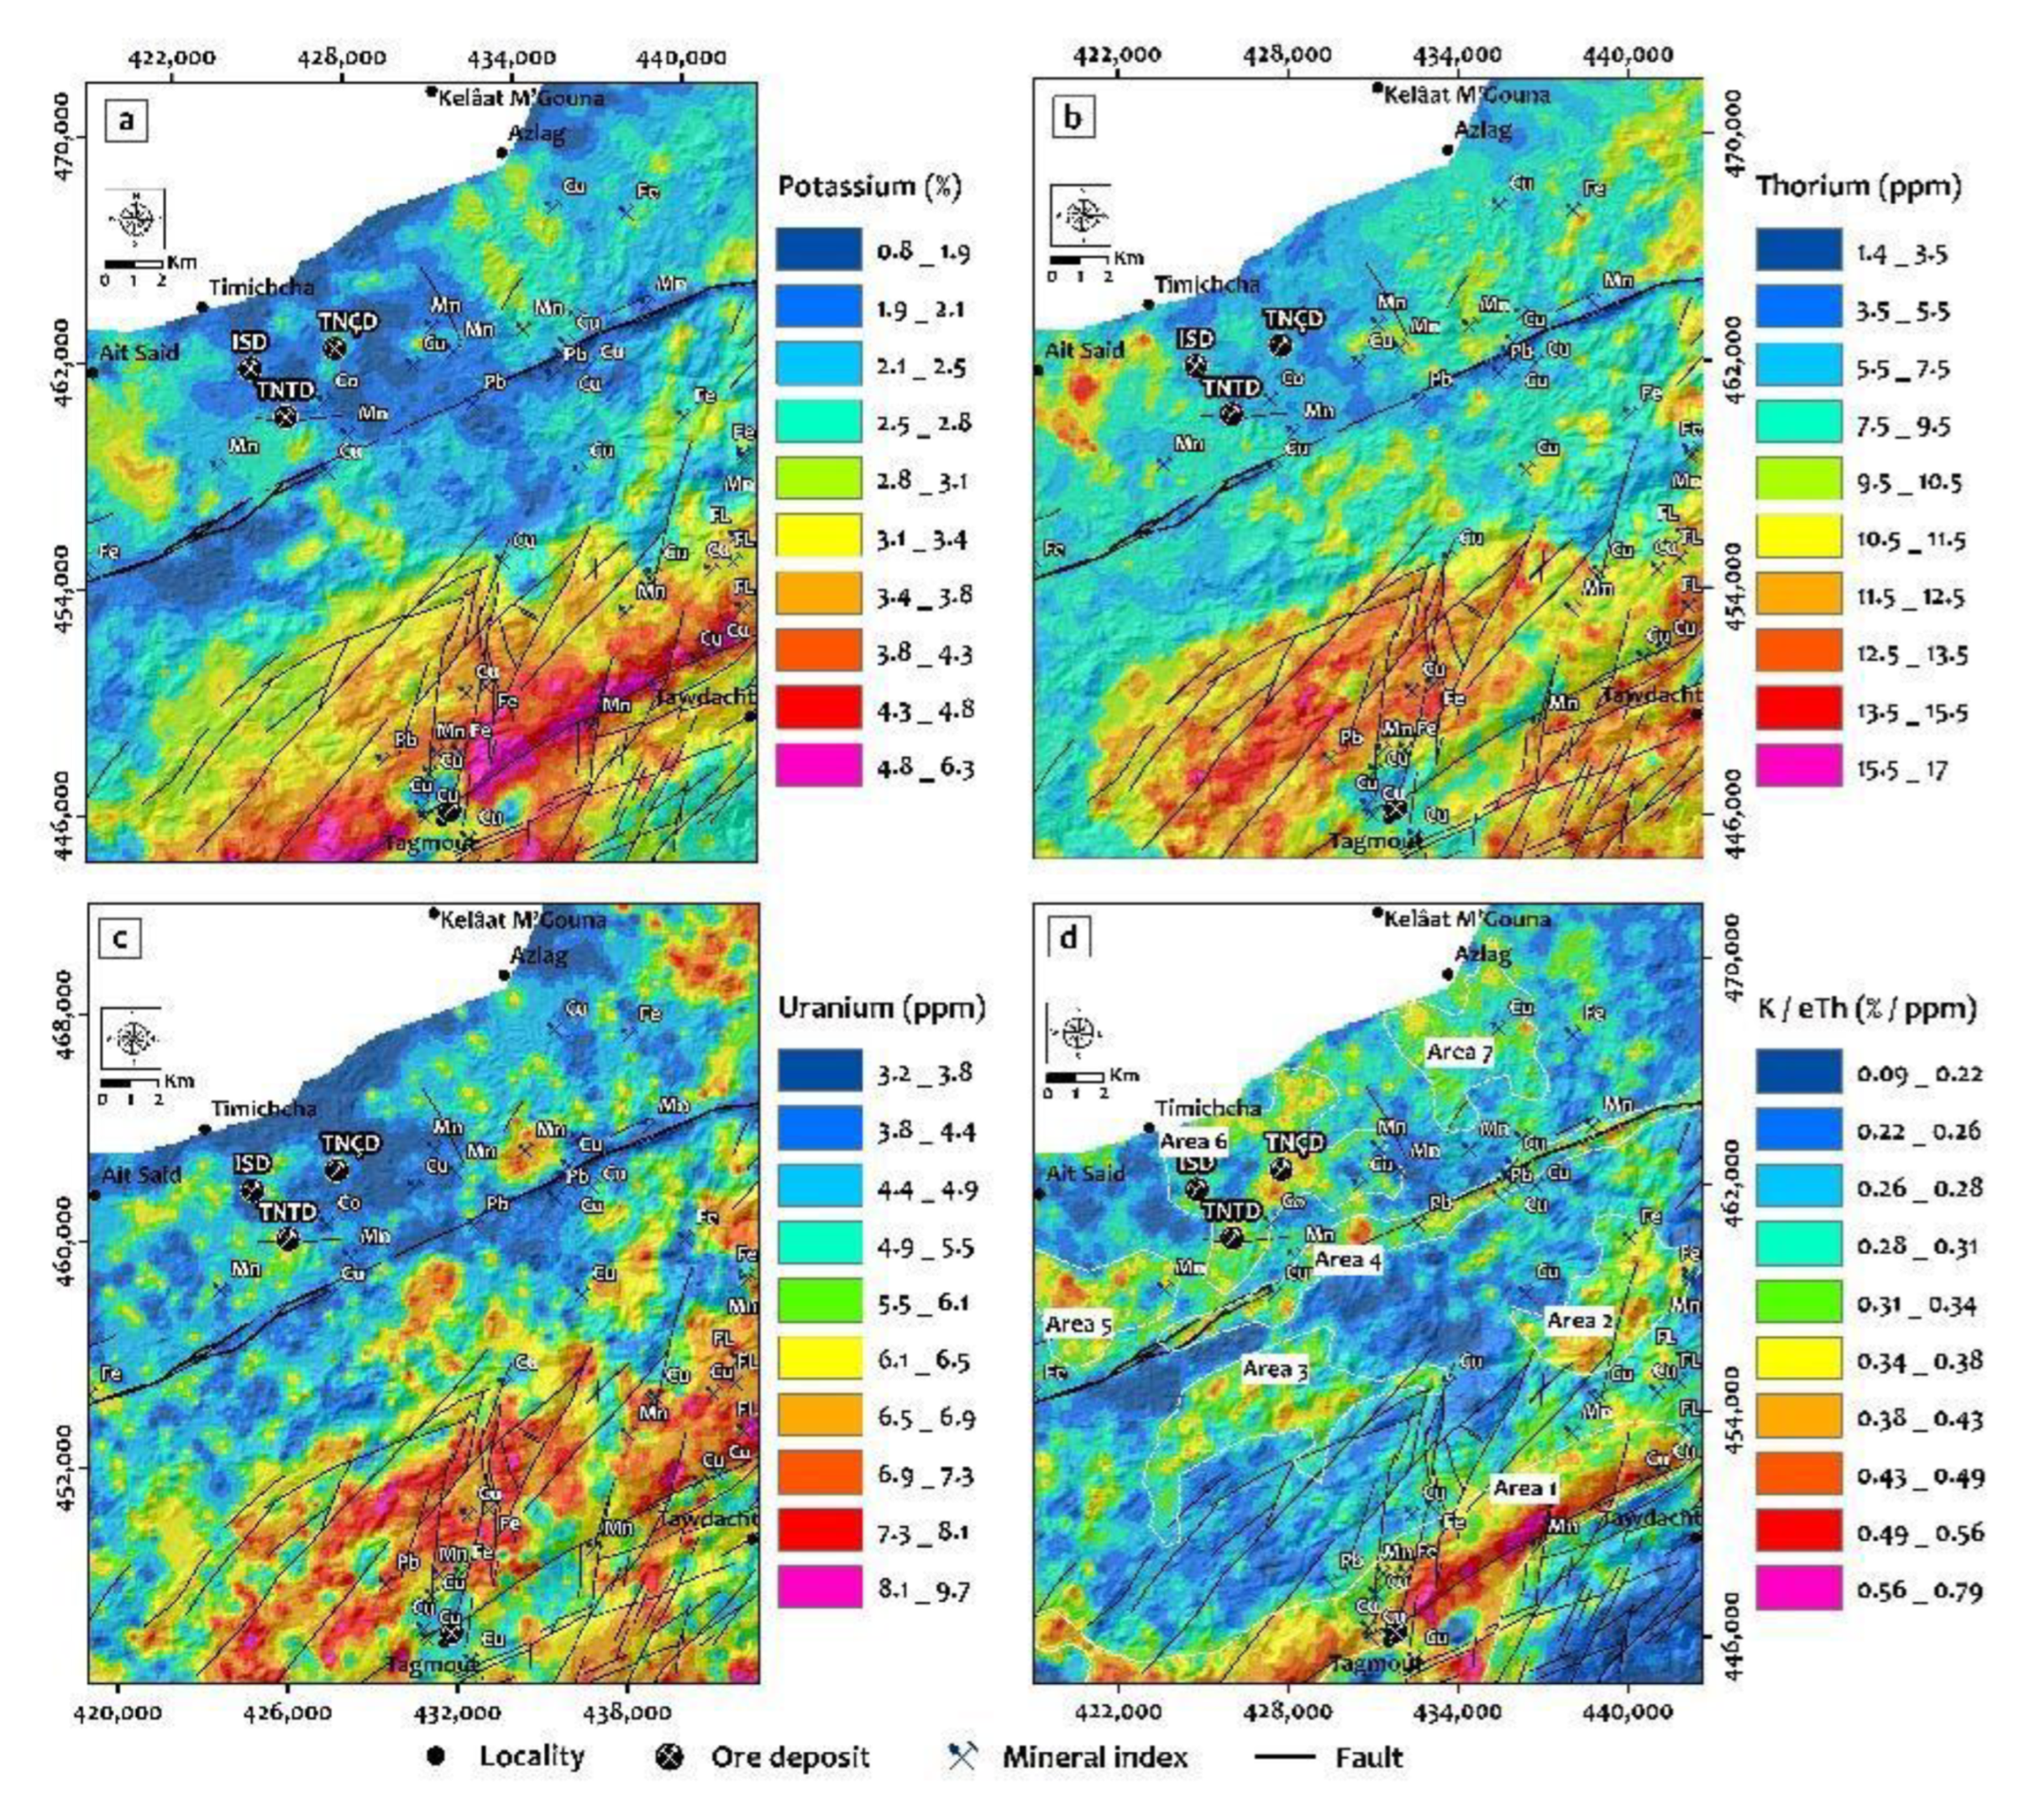
2.4.1. Radiometric Data

Airborne geophysics based on gamma-ray spectrometry estimates the concentration of Potassium (K), Uranium (eU) and Thorium (eTh) at the earth’s surface down to 30–45 cm [52,53,54,55]. These radioelements occur in widely varying concentrations in the rocks that form the earth’s crust. The Table 1 shows the concentrations of the three radioelements in the main rocks categories.
The airborne gamma-ray spectrometry data used in this study were acquired in the Moroccan Anti Atlas in 1998 by the company Géoterrx-Dighem for the Ministry of Energy and Mines. The measurements were made with an average ground clearance of 60 m by the Exploranium GR-830/3 spectrometer. The flight lines are oriented N315° and spaced at 500 m. The flight line crossings are N45° and 4000 m apart. Gamma-ray emissions were recorded from the ground and air over an energy range of 0 to 3 MeV with 8 downward and 2 upward crystals, respectively. Count rates were determined within three windows corresponding to natural radiogenic concentrations of Potassium (K, 1.46 MeV), Uranium (U, 1.76 MeV and Thorium (Th, 2.62 MeV). The radiometric data were recorded at a lower frequency (1 Hz) and with an average spacing of 63 m. The recorded data then underwent a series of corrections which are: (i) activity time correction; (ii) calculation of effective ground clearance at standard temperature and pressure conditions; (iii) subtraction of cosmic and helicopter noise; (iv) subtraction of radon background (assessed by upward facing detector measurements); (v) Compton effect correction and (vi) attenuation corrections.
These radiometric data were provided to us in the form of digital maps. Using ArcGIS 10.3 software, these maps were first georeferenced and digitized to create a digital database (by digitizing the intersection of the iso-value curves and the flight lines). They were then interpolated using the inverse distance weighting (IDW) interpolation method to obtain maps representing the horizontal variation of radioactive concentrations of three elements: (i) Potassium (K in %), (ii) equivalent Thorium (eTh in ppm), and (iii) equivalent Uranium (eU in ppm). Furthermore, ratios of K/eTh and K/eU were calculated to delineate Potassium enrichment zones as indicators of potential mineral resource-related alteration zones [25,28,56,57,58] (Figure 3).
The image was pre-processed using the Fast Line-of-sight Atmospheric Analysis of Hypercubes (FLAASH) method [59,60,61]. This correction process requires the luminance image and generates a reflectance corrected image. Subsequently, we calculated the band ratios “Bands Ratios” related to the depth of the absorption band “RBD” which is a technique that has been used for many years in remote sensing for mapping hydrothermal alteration minerals [7,15,62,63,64,65,66]. In the present study, four alteration mineral assemblage domains were calculated: (i) clay alteration (kaolinite and montmorillonite), (ii) phyllic alteration (sericite and illite), (iii) propylitic alteration (epidote, chlorite and carbonates), and (iv) alteration ferric iron uptake (hematite, goethite and jarosite) (Figure 3).

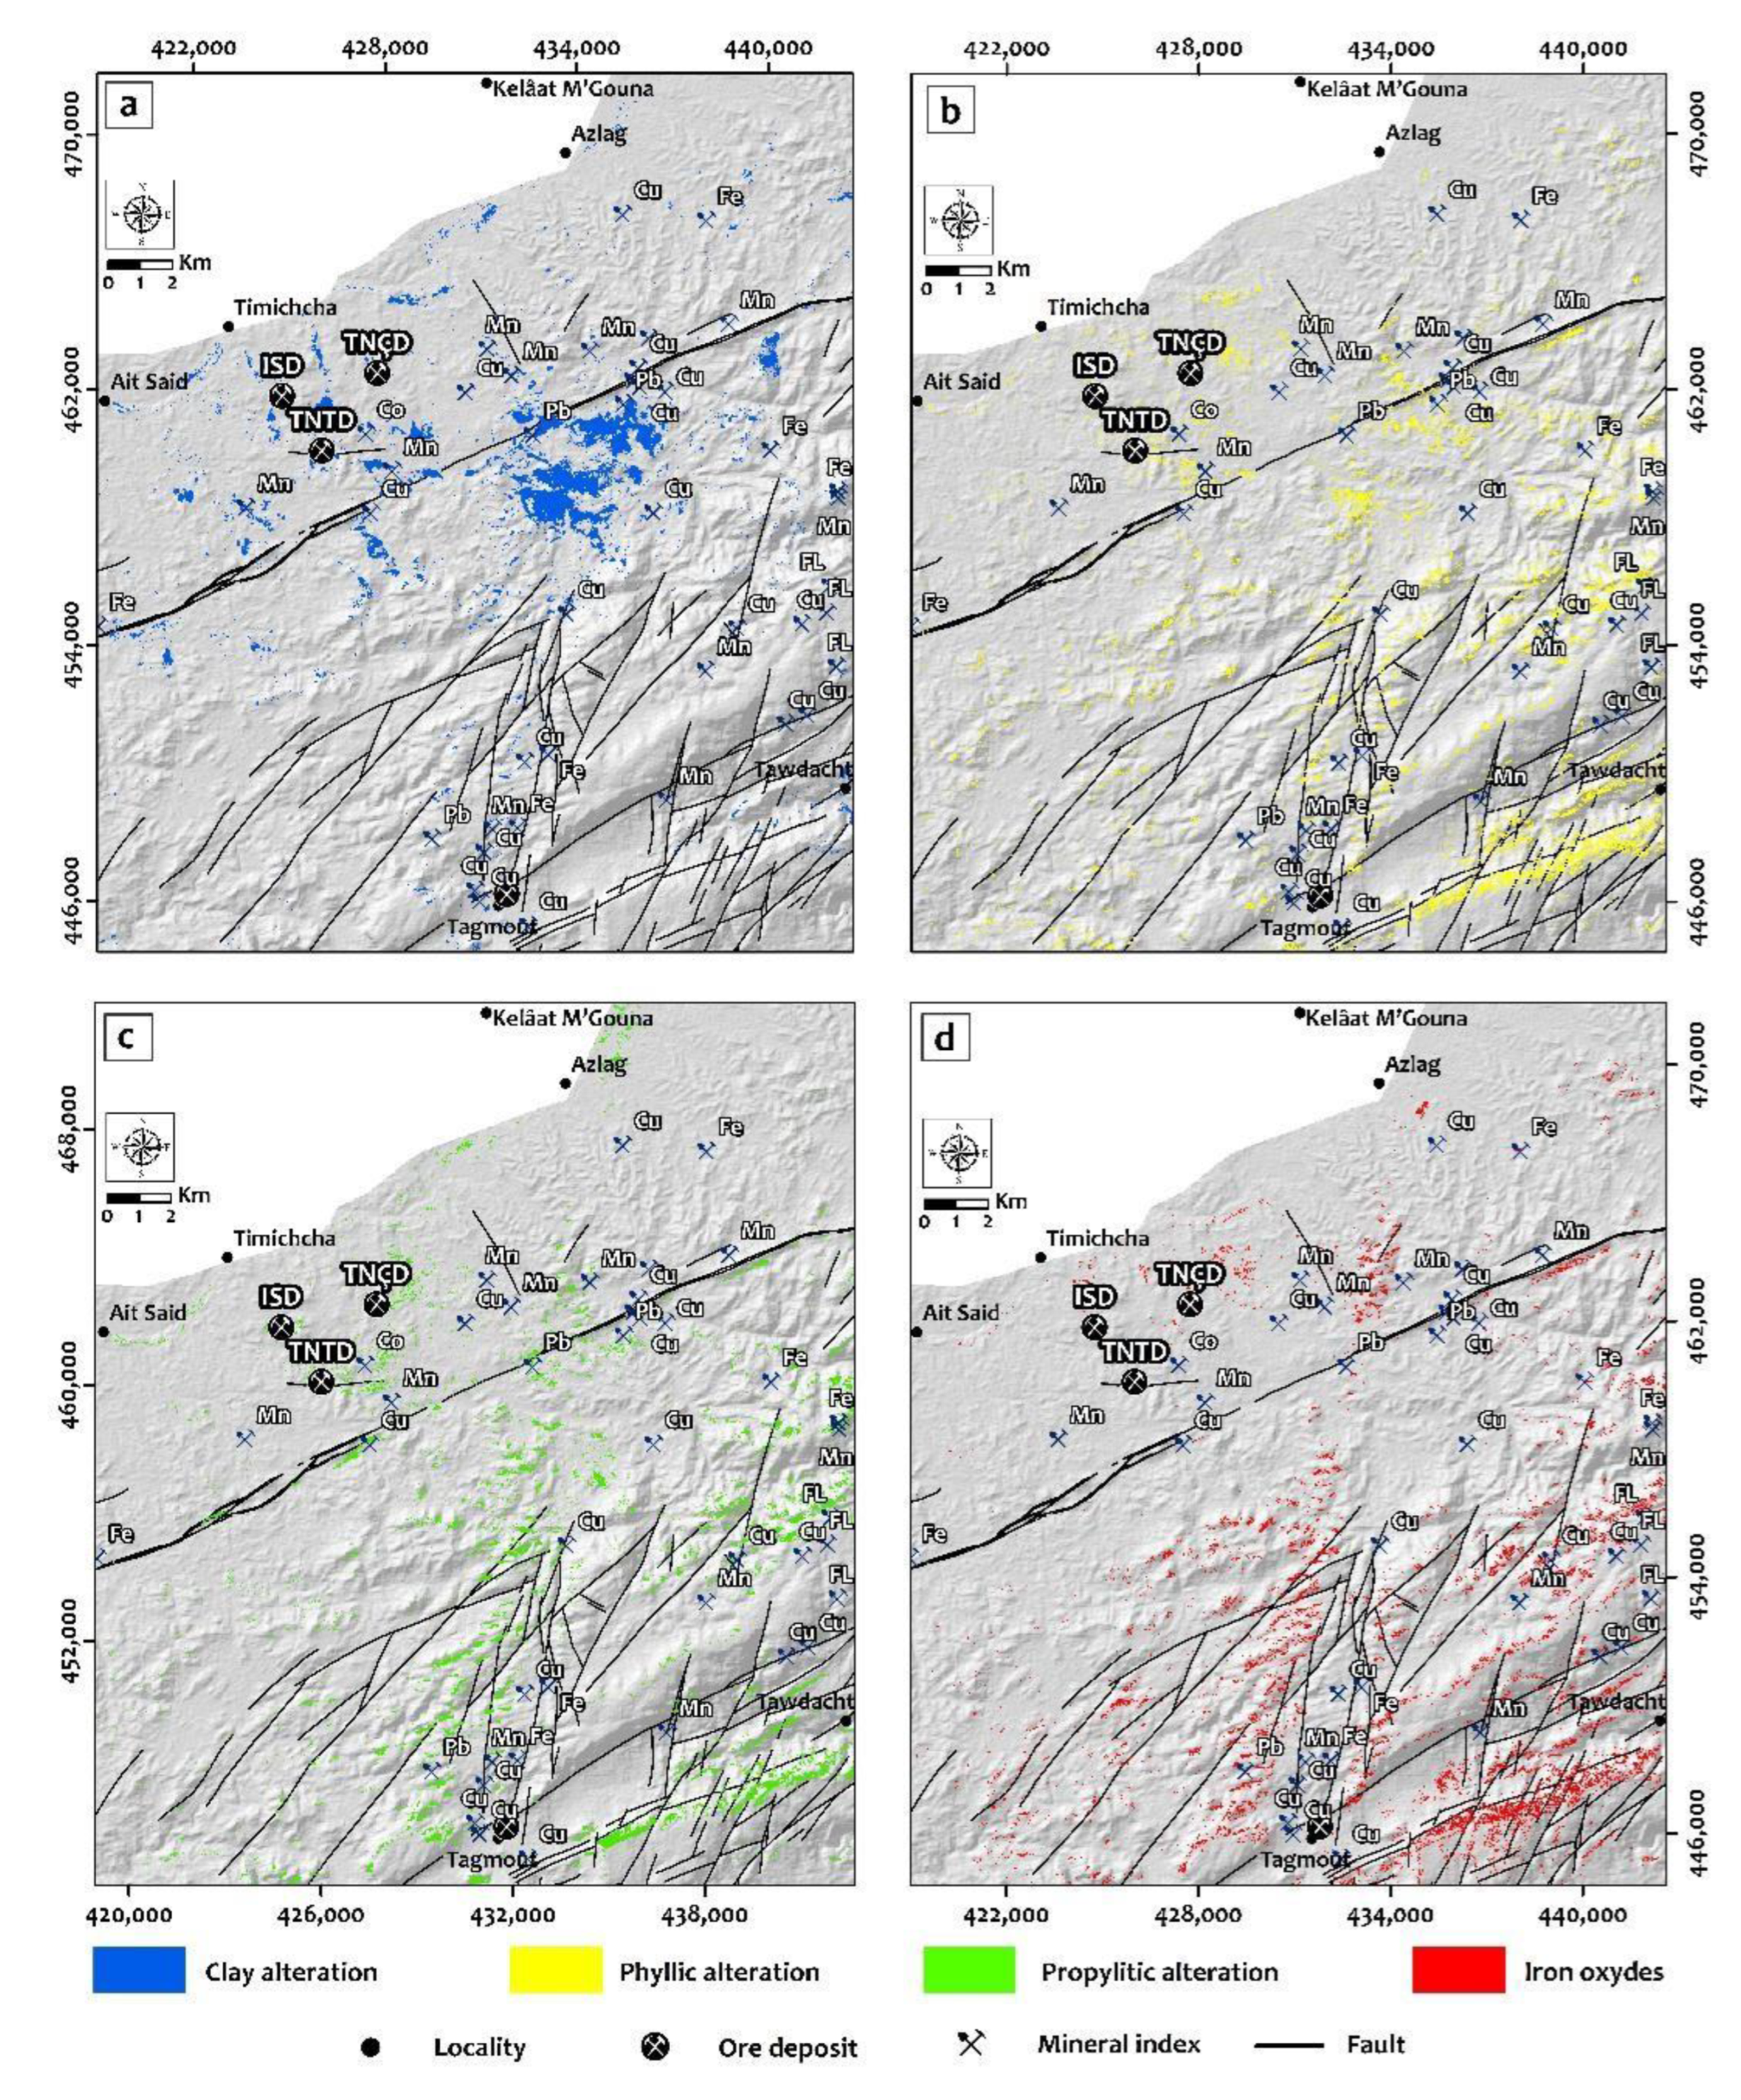
2.4.2. ASTER Satellite Imagery

The space remote sensing data used in this study correspond to an ASTER sensor image acquired on 9 September 2003, with a cloud cover of the order of 0%. Its spectral resolution makes it possible to map alteration minerals related to mineralization processes since it contains six spectral bands in the short wave infrared region ranging from 1.60 to 2.430 μm [13]. Other characteristics and features of the Aster sensor are presented in Table 2.

2.4.3. Fuzzy Logic Modelling of Radiometric and ASTER Satellite Imagery

Fuzzy logic modelling is a widely and successfully used technique in mining mapping and mainly for the development of mineral prospectivity maps [8,66,68,69,70]. Mathematically, it is a form of multi-valued logic based on the fuzzy set theory where the real values of the variables are included in the interval [0–1]; zero corresponds to non-membership, and 1 corresponds to full membership [71]. This method was first proposed in 1965 by Zadeh and is defined as follows:
A i j = {   ( x i j ,   µ A   ) /   X i j X i   } ,   0     µ A     1  
where μA is called the degree of membership function of x in A and X corresponds to a set of layers Xi (i = 1, 2, 3, …, n), and each layer to r classes defined as (j = 1, 2, 3, …, r).
The degree of membership μ A plays in the interval [0–1], so: If 0 ≤ μA < 0.5: xij is not conducive to mineralization; if μA = 0.5: we cannot determine is xij conducive to mineralization or not; if 0.5 < μA ≤ 1 it means that xij is conducive to mineralization.
In this study, we applied this analysis to produce mineral prospectivity maps following the methodological approach presented in the Figure 3. The first map combines the four layers corresponding to the band ratios extracted from the ASTER image (Table 3). Meanwhile, the second map combines the geophysical data corresponding to the K, K/eTh ratio and K/eU ratio layers. These layers were fuzzified individually using the linear membership function. Then the fuzzy gamma operator was applied to combine our thematic layers. The choice of this operator is based on the fact that it is a compromise between the fuzzy algebraic sum and its product [72]. In addition, it is possible to develop improvements on the input of the resulting maps [73]. After several trials, we took 0.72 as the value of parameter γ. The fuzzification parameters used for the input data are represented in the Table 4.

3. Results

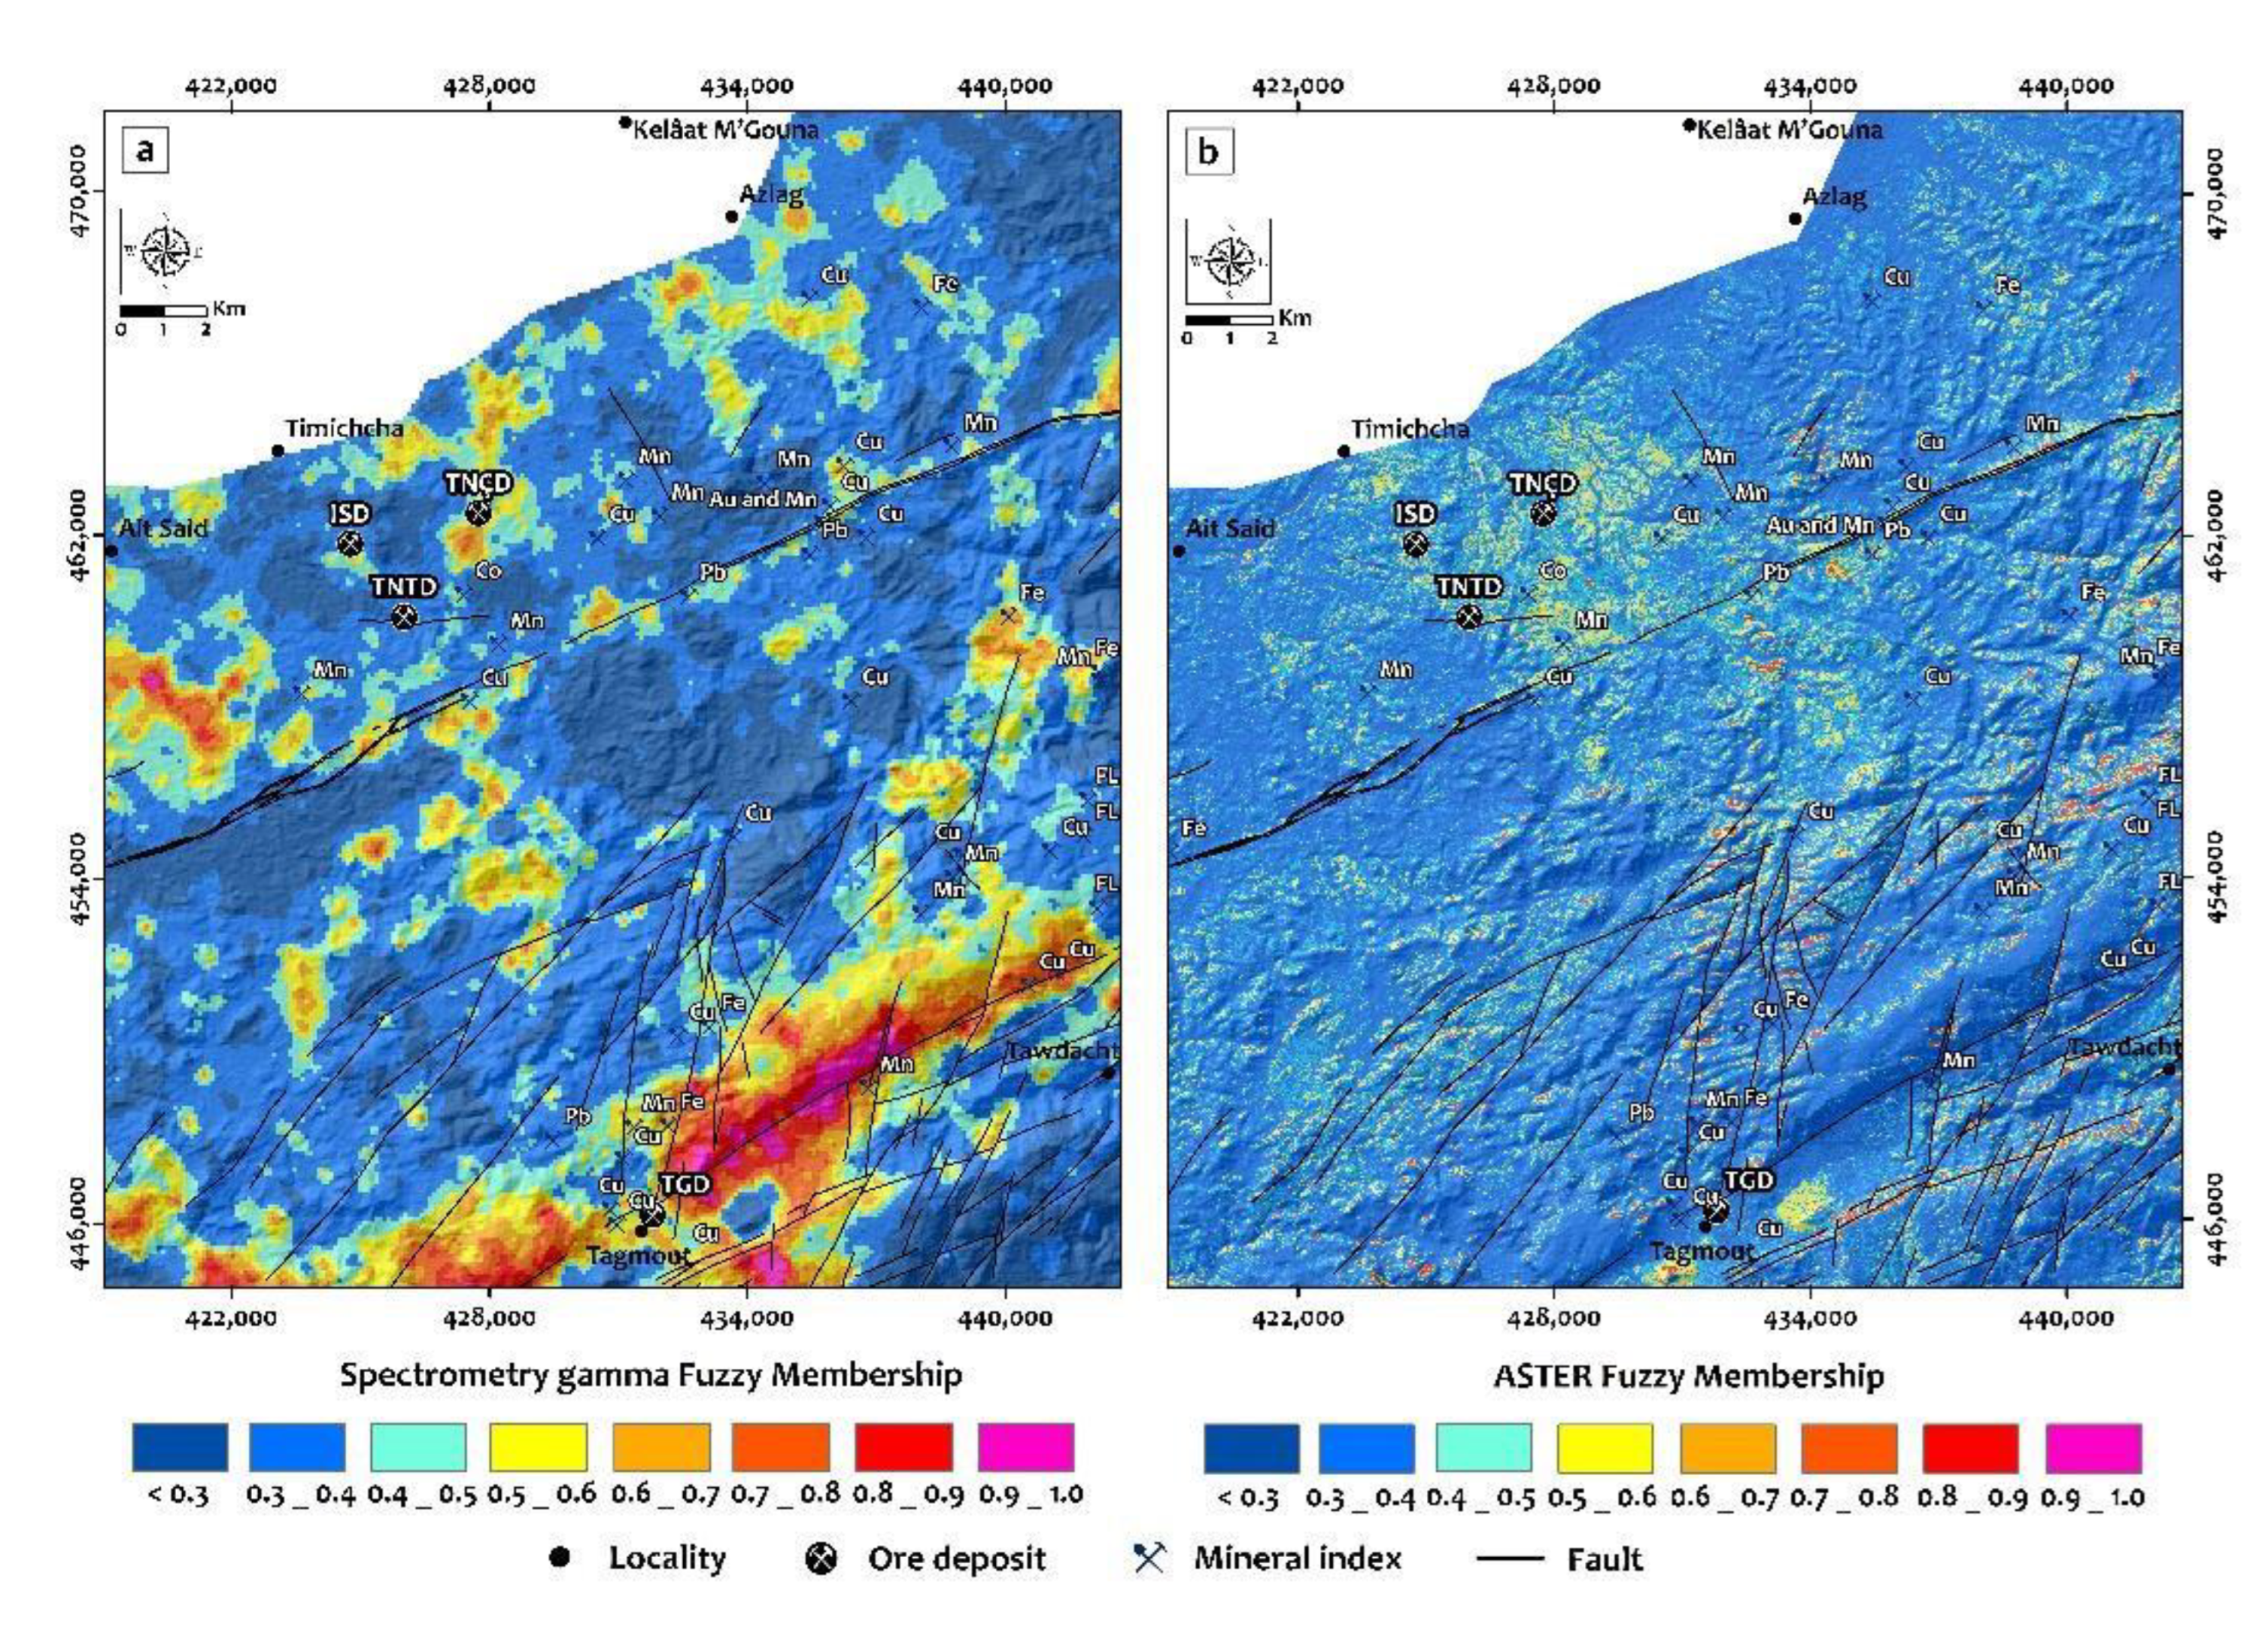
3.1. Mapping of Hydrothermal Alteration Zones

3.1.1. Contribution of the Radiometry

The resulting radiometric maps provide a synthetic view of the heterogeneities of the geological formations encountered based on the radiometric signature of the different rock units and the structural trends that affect them. The highest concentrations of radioactive elements (more than 5.70% K, 15.80 ppm eTh and 8.30 ppm eU) are concentrated in the SSE part of the map (Figure 4), which could be related to the presence of a large granitic massif called “pink granites of Isk n’Alla” (Figure 2). This contrast sequence is also marked by low to moderate amounts observed, especially if we go towards the North of the study area (0.20 to 0.45% K, 5.25 to 7.24 ppm Th and 0.91 to 1.29 ppm U) (Figure 4). The geological map in Figure 2 and radioelement contents in the main rock categories (Table 1) were used to geologically interpret the spatial distributions of potassium, thorium and uranium.
At a too detailed scale, the overall spatial distribution of relative Potassium concentrations suggests that the Lower Cryogenic turbiditic metavolcanic and the Quaternary and Miocene formations show low levels (0.70–2.20%), while intermediate values (2.70–3.70%) are associated with the oldest granites (Wawitcht Granite). High levels (up to 6%) were obtained in NE-trending fault and fracture zones and are related to granites (Figure 4a). The Thorium map reveals that the youngest granites and the Upper Ediacaran rhyolites have the highest values of 16 and 13 ppm, respectively, in which their boundaries are evident (Figure 4b). Lower levels are observed in wadi sediments, metasediments and Cryogenian metavolcanic where concentrations are lower than 6.5 ppm (Figure 4b). The Uranium map can also be subdivided into three levels. The first level extends to 8 ppm, associated with the youngest granites, the volcano-sedimentary complex and the Upper Ediacaran rhyolites. The intermediate level ranges from 4 to 6 ppm, associated mainly with the Ediacaran rhyodacites and rhyolites. The last level decreases to 3 ppm as a minimum value on the Miocene sedimentary formations and the Wadi sediments (Figure 4c).

3.1.2. Contribution of the K/eTh Ratio

In addition to three radiometric maps, a K/eTh ratio was calculated to highlight locations with higher Potassium content (Figure 4d). High concentrations of this element may reveal possible areas of hydrothermal alteration and mineralization [25,29,56,74]. View that Potassium is more mobile than thorium in terms of element mobility during chemical alteration processes [75,76]. The K/eTh ratio is often considered the best indicator of Potassium enrichment zones related to hydrothermal alteration. The authors of [77] show that the Potassium/Thorium ratio is nearly constant in most rocks and generally ranges from 0.17 to 0.2 (K/eTh). Values of the k/eTh ratio that exceed this range could be due to hydrothermal alteration processes associated with the emplacement of magmatic-hydrothermal mineralization. In the case of the study area, the resulting K/eTh values allow us to distinguish seven anomalous potassium domains (Figure 4d). Domain 1 presents extremely high K/eTh values reaching 0.65, associated with alteration zones probably linked to mineralized zones. Indeed, this domain is characterized by the outcrop of several showings, namely copper, manganese, silver, etc… (Figure 4d). Domains 2, 3 and 5 are respectively associated with young granites “pink granite of Isk n’Alla,” rhyolites and rhyodacites of lower Ediacaran and granites of Wawitcht whose ratio values exceed 0.4 (Figure 4d). Furthermore, domain 4 is related to the Sidi Flah fault zone, which hosts several mineralized showings such as gold, copper, lead and manganese (Figure 4d). Domain 6 is related to gold occurrences closely related to the Wawitcht granite and is characterized by high values of K/eTh ratios (>0.35). To the north of the study area is domain 7, where K/eTh values vary considerably and sometimes reach 3.35. This area is associated with the Azlag granite, which hosts a copper occurrence (Figure 2 and Figure 4d).

3.1.3. Contribution of Aster Data

The results of the extracted band ratios for mapping clay alteration minerals (kaolinite, alunite and montmorillonite), phyllite alteration (sericite, muscovite and illite), propylitic alteration (epidote, chlorite and carbonates) and iron oxide alteration (hematite, goethite and jarosite) are shown in Figure 5.
The band ratio (b4 + b6)/b5 shows the spatial distribution of clay alteration minerals (blue pixels), which are mostly mapped in the Lower Cryogenian turbidites, in the Upper Cryogenian units, in the Lower Ouarzazate Group units and very locally in the Quaternary unit along the Oueds (Figure 4a).
The band ratio (b5 + b7)/b6 illustrates the surface distribution of phyllic alteration minerals in yellow pixels (Figure 4b), which are mapped in the Upper Cryogenian conglomerate and pelite units with intercalations of cinerites, rhyolites and andesites and the Lower Ouarzazate Group granite unit. These bands are mapped because of their mineralogical composition’s high content of sericite, muscovite, and illite. The band ratio (b7 + b9)/b8, corresponds to the propylitic alteration mineral index shown in green pixels; it shows a distribution more or less similar to the phyllic alteration mineral index and is generally related to the Upper Cryogenian volcano-sedimentary unit and the Lower Ouarzazate Group granite unit (Figure 4c).
The band ratio (b5/b3) + (b1/b2) shows the surface distribution of iron oxides in red pixels (Figure 4d). Compared with the geological map, the high abundance of all these mapped minerals is typically associated with Cryogenian and Lower Ouarzazate Group units. It shows a strong correlation with the mineral occurrences and prospects in the study area.

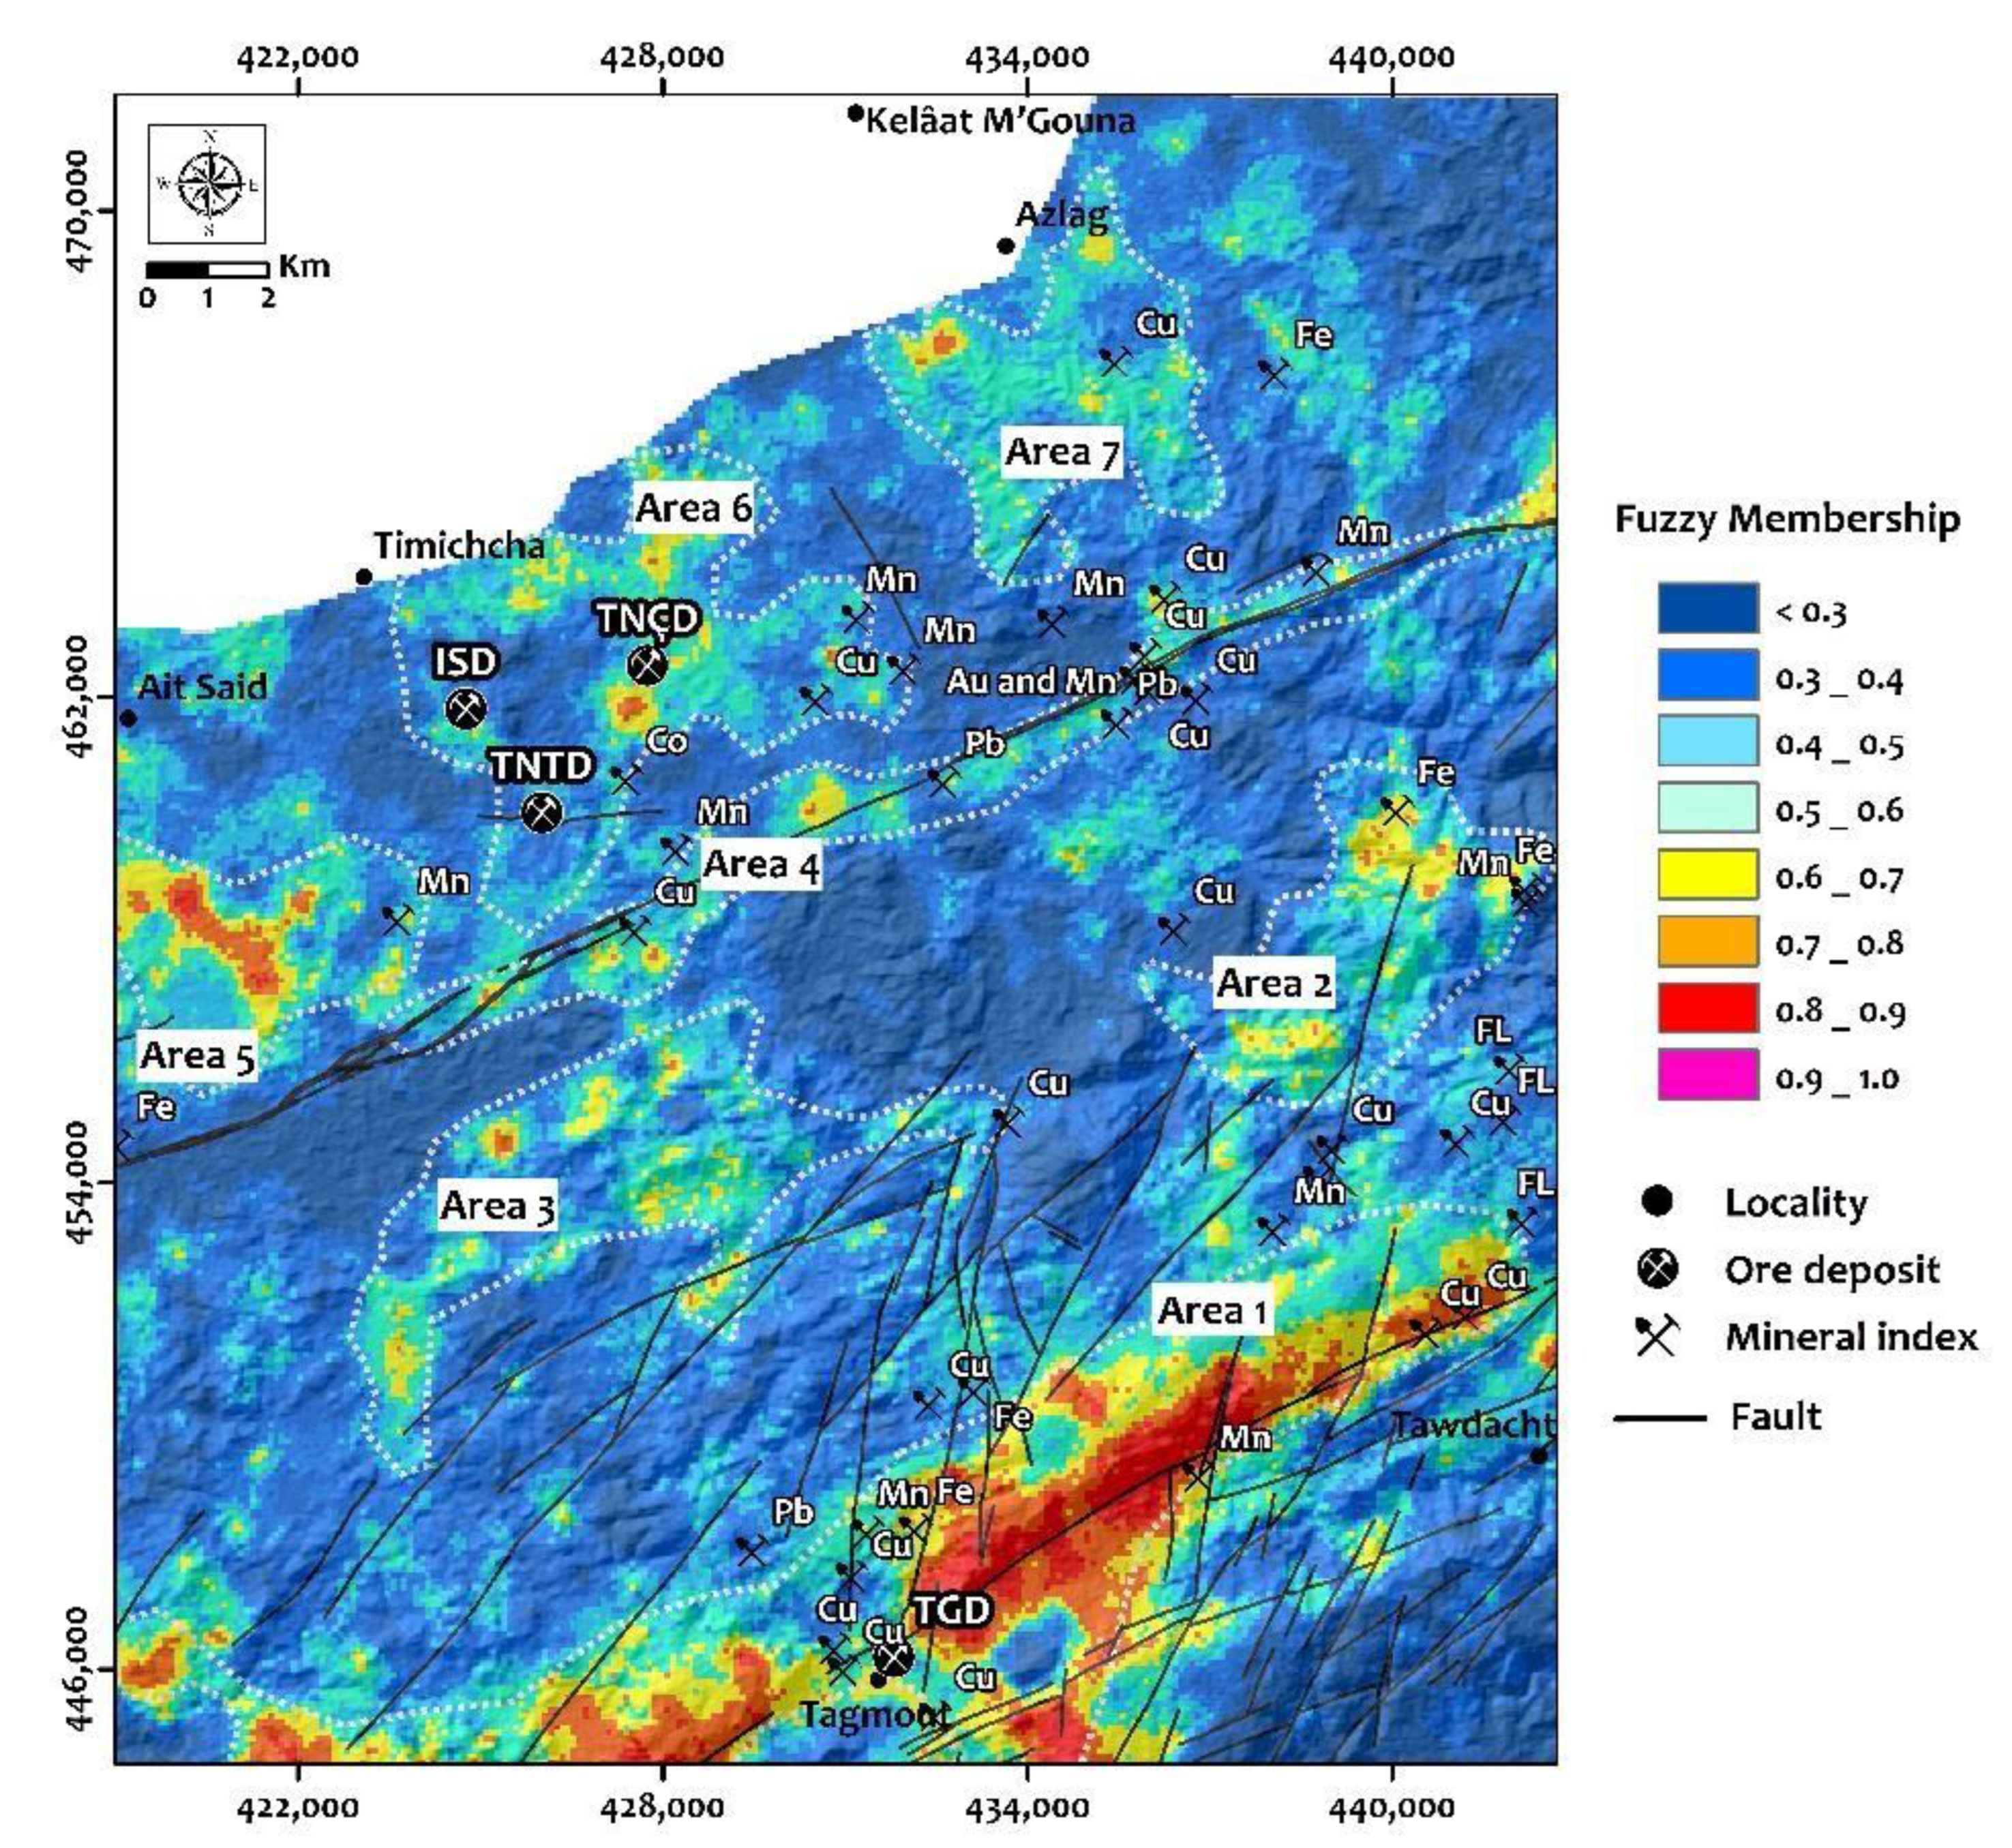
3.1.4. Generating Mineral Prospectivity Maps

The application of fuzzy logic modelling allowed us to map the spatial distribution of true hydrothermal alteration zones (i.e., zones induced during the emplacement of metal deposits). In this regard, three mineral prospectivity maps were created. The first map combines the natural gamma-ray spectrometry data, which are the thematic layers of K, K/eTh ratio and K/eU ratio. The second map uses the thematic layers of band ratios derived from the ASTER image. These thematic layers were selected and then combined by the fuzzy gamma operator (γ = 0.72). The third map is the result of combining the first two mineral prospectivity maps.
Figure 6a shows the mineral prospectivity map derived from the combination of natural gamma-ray spectrometry data. The fuzzy gamma operator (γ = 0.72) merged the K, K/eTh and K/eU thematic layers. Evaluation of the fuzzy membership results shows that the favorability index varies spatially, and high values are associated with certain rocks. High favorability index values are mapped in granites and volcanic rocks, including miarolitic rhyolites, rhyodacites and Lower Ediacaran rhyolites. Most of the prospects and showings already mapped are located in the high-value areas of this showing. The map shows that the Tagmout graben fault zone has the highest value of the favorability index (0.8 to 1.0). The evaluation of the mineral prospectivity map derived from the geophysical data shows several anomalous zones that could be the object of future mining prospecting.
Figure 6b shows the mineral prospectivity map of the study area derived from the combined Aster data. Examination of this map shows that the high favorability index is associated with certain lithological units. Lower Cryogenian volcano-sedimentary turbidites, Lower Ediacaran intrusive rocks and Cambrian units show high favorability index values (0.6 to 1). The altered zones associated with these rocks are the most favorable locations for mineralization. The resulting map shows that the Wawitch and Isk n’Alla granites and faulted zones have the highest favorability index values (0.9 to 1.0).

4. Discussions

The processing of the geophysical and ASTER data used in the present work is a preliminary step of great importance for recognizing new potential targets for mining research at the scale of the Kelâat M’Gouna inlier. The combination of two different data types allowed us to map in detail the hydrothermal alteration zones associated with the metal deposits, especially the gold deposits. Benziane et al., 2008 [31], showed that the three gold prospects in the study area are associated with hydrothermal alteration phenomena. According to these authors, silicification is expressed either by developing quartz stockworks or by dispersion in the host volcano-sedimentary formations, following a general NE-SW direction. Generally, this silicification is accompanied locally by opening zones filled with potassium feldspar and tourmaline. In this respect, ratios of K/eTh and K/eU were calculated to highlight enrichment zones in this element. Chloritization is manifested by the development of large zones in the soft greenish levels of the volcano-sedimentary series. For this purpose, the Aster image band ratio (b7 + b9)/b8 was calculated to map the spatial distribution of high chlorite content zones. Hematization is materialized by the development of iron oxides and hydroxides, following the fracturing planes, which are generally oriented N20°. This type of alteration mineral was mapped using the band ratio (b5/b3) + (b1/b2). Finally, the band ratio (b5 + b7)/b6 was used to map the sericitization in the study area in a subordinate manner [31]. In the form of thematic layers, this database was fuzzified by the fuzzy logic modelling technique by combining the two mineral prospectivity maps, Aster and radiometric. Subsequently, a mineral prospectivity map for the study area was generated. A total of seven prospective value areas were identified (Figure 7), and they are mainly associated with alteration zones:
-
Area 1 is mainly associated with alteration zones in the Ouarzazate Group rhyolitic formations. This elongated area straddles a system of NE-SW and NNE-SSW faults. These faults probably served as flow paths for hydrothermal mineralization. The documented mineral occurrences also show a close spatial relationship with the fault systems in the study area, particularly in the Tagmout copper deposit.
-
Area 2 and 3 are located at the contact zone between the pink granite of Isk n’Alla and the volcanic and rhyodacite formations of the Lower Ouarzazate Group. These formations are crossed by a swarm of rhyolitic dikes of variable direction of the Upper Ouarzazate Group. At outcrop, both zones host some Cu, Mn and Fe showings.
-
Area 4 stakes the ENE-WSW Sidi Flah fault zone, which extends over several kilometers. From a mining point of view, several showings, including Au, Cu, Pb and Mn, have been reported along and near this fault. This type of fault may favor the circulation of mineralizing hydrothermal fluids from a deep source that may enrich the host rocks and tectonic structures [22,23].
-
Area 5 coincides with hydrothermal alteration associated with the Wawitcht granite and volcanic rocks of the Lower Ouarzazate Group.
-
Area 6 is associated with the Cryogenian basement formations or its Ediacaran cover. Minerally, it is a prospective area as it hosts three gold prospects. According to Benzian et al., 2008 [31]; Tuduri et al., 2018 [32], most gold mineralization in the study area is restricted to Precambrian formations such as Cryogenian basement turbid volcano-sedimentary and Ediacaran granites. This indicates that gold prospecting in the areas adjacent to the three indicated prospects is likely to be most successful in the altered zones recognized in basement rocks and its Ediacaran cover.
-
Area 7 concerns an alteration zone associated with the Azlag granite and the volcano-sedimentary cover of the lower Ouarzazate group. Due to Miocene deposits that may hide other mineral occurrences, only one copper showing has been reported. Consequently, a geophysical study will be necessary to follow the rooting of these surface anomalies, which would be related to tectonic structures at depth.

5. Conclusions

The study demonstrates the importance of combining natural gamma-ray spectrometry and ASTER data in the early stages of mineral exploration. This combination was applied to target areas with high mining potential in the Kelâat M’Gouna inlier. The results obtained allowed detailed mapping of hydrothermal alteration zones related to mineralization. Maps of Potassium (K in %), Uranium (eU in ppm), Thorium (eTh in ppm) and ratios of K/eTh and K/eU were generated to delineate the high concentrations of radioactive elements related to the altered zones, particularly in Potassium.
Band ratios extracted from the ASTER image were calculated to visualize the spatial distribution of specific minerals in the alteration zones. Clay, phyllite, propylitic minerals and iron oxides were mapped in some lithologies that host several mineral occurrences.
The mineral prospectivity maps generated by the fuzzy logic modelling allowed us to locate the alteration zones. Seven anomalous zones were then distinguished. The geological data showed that these zones are located in the contact zones between the granitic massifs, especially the Wawitcht, Isk n’Alla and Azlag granites and their host rocks formed by the Ediacaran volcano-sedimentary rocks of the Ouarzazate Group. In addition, most of these zones have been mapped in rocks that host the prospects and, mining showings already indicated, notably those of gold. Other anomalous zones have been mapped in fault zones, mainly in NE-SW and N-S trends, such as the Sidi Flah fault zone and the Tagmout graben zone. To this end, it is recommended to carry out a detailed structural study in conjunction with geophysics to locate, delineate, and follow the deep rooting of the metallic bodies and tectonic structures that may plug the mineralization in the study area.

Author Contributions

Conceptualization, Y.M., A.A. (Ahmed Attou), A.M. (Abdelhalim Miftah) and M.O.; Data curation, Y.M. and M.O.; Formal analysis, Y.M., A.A.(Ahmed Attou) and M.O.; Funding acquisition, Y.M. and A.M. (Anselme Muzirafuti); Investigation, Y.M.; Methodology, Y.M., M.O., B.D. and Y.E.-t.; Project administration, Y.M. and A.A.(Ahmed Attou); Resources, Y.M., G.R., S.L. and A.M. (Anselme Muzirafuti); Software, Y.M., M.O. and L.A.; Supervision, A.A. (Ahmed Attou) and A.M. (Abdelhalim Miftah); Validation, Y.M., A.A. (Ahmed Attou), A.M. (Abdelhalim Miftah), A.A. (Abdelhamid Allaoui), M.B., G.R., S.L., A.M. (Anselme Muzirafuti), M.O. and B.D.; Visualization, Y.M., A.A. (Ahmed Attou), A.M. (Abdelhalim Miftah), A.M. (Anselme Muzirafuti) and M.O.; Writing—original draft, Y.M. and M.O.; Writing—review and editing, Y.M., A.A. (Ahmed Attou), A.M. (Abdelhalim Miftah), M.O., B.D., L.A., Y.E.-t., A.A. (Abdelhamid Allaoui), M.B., G.R., S.L. and A.M. (Anselme Muzirafuti). All authors have read and agreed to the published version of the manuscript.

Funding

This research received no external funding.

Institutional Review Board Statement

Not applicable.

Informed Consent Statement

Not applicable.

Conflicts of Interest

The authors declare no conflict of interest.

References

  1. Abdelnasser, A.; Kumral, M.; Zoheir, B.; Karaman, M.; Weihed, P. REE geochemical characteristics and satellite-based mapping of hydrothermal alteration in Atud gold deposit, Egypt. J. Afr. Earth Sci. 2018, 145, 317–330. [Google Scholar] [CrossRef]
  2. Gabr, S.S.; Hassan, S.M.; Sadek, M.F. Prospecting for new gold-bearing alteration zones at El-Hoteib area, South Eastern Desert, Egypt, using remote sensing data analysis. Ore Geol. Rev. 2015, 71, 1–13. [Google Scholar] [CrossRef]
  3. Mars, J.C.; Rowan, L.C. Spectral assessment of new ASTER SWIR surface reflectance data products for spectroscopic mapping of rocks and minerals. Remote Sens. Environ. 2010, 114, 2011–2025. [Google Scholar] [CrossRef]
  4. Mars, J.C.; Rowan, L.C. ASTER spectral analysis and lithologic mapping of the Khanneshin carbonatite volcano, Afghanistan. Geosphere 2011, 7, 276–289. [Google Scholar] [CrossRef] [Green Version]
  5. Pour, A.B.; Hashim, M.; Park, Y.; Hong, J.K. Mapping alteration mineral zones and lithological units in Antarctic regions using spectral bands of ASTER remote sensing data. Geocarto Int. 2018, 33, 1281–1306. [Google Scholar] [CrossRef]
  6. Rowan, L.C.; Hook, S.J.; Abrams, M.J.; Mars, J.C. Mapping hydrothermally altered rocks at Cuprite, Nevada, using the Advanced Spaceborne Thermal Emission and Reflection Radiometer (ASTER), a new satellite-imaging system. Econ. Geol. 2003, 98, 1019–1027. [Google Scholar] [CrossRef]
  7. Rowan, L.C.; Mars, J.C. Lithologic mapping in the Mountain Pass, California area using advanced spaceborne thermal emission and reflection radiometer (ASTER) data. Remote Sens. Environ. 2003, 84, 350–366. [Google Scholar] [CrossRef]
  8. Sekandari, M.; Masoumi, I.; Pour, A.B.; Muslim, A.M.; Hossain, M.S.; Misra, A. ASTER and WorldView-3 satellite data for mapping lithology and alteration minerals associated with Pb-Zn mineralization. Geocarto Int. 2020, 1–31. [Google Scholar] [CrossRef]
  9. Sheikhrahimi, A.; Pour, A.B.; Pradhan, B.; Zoheir, B. Mapping hydrothermal alteration zones and lineaments associated with orogenic gold mineralization using ASTER data: A case study from the Sanandaj-Sirjan Zone, Iran. Adv. Sp. Res. 2019, 63, 3315–3332. [Google Scholar] [CrossRef]
  10. Zhang, X.; Pazner, M.; Duke, N. Lithologic and mineral information extraction for gold exploration using ASTER data in the south Chocolate Mountains (California). ISPRS J. Photogramm. Remote Sens. 2007, 62, 271–282. [Google Scholar] [CrossRef]
  11. Pour, A.B.; Park, Y.; Park, T.-Y.S.; Hong, J.K.; Hashim, M.; Woo, J.; Ayoobi, I. Regional geology mapping using satellite-based remote sensing approach in Northern Victoria Land, Antarctica. Polar Sci. 2018, 16, 23–46. [Google Scholar] [CrossRef]
  12. Jébrak, M.; Marcoux, E.; Laithier, M. Géologie des Ressources Minérales; Ministère des Ressources Naturelles et de la Faune: Quebec City, QC, Canada, 2008; ISBN 2551237378.
  13. Abrams, M. The Advanced Spaceborne Thermal Emission and Reflection Radiometer (ASTER): Data products for the high spatial resolution imager on NASA’s Terra platform. Int. J. Remote Sens. 2000, 21, 847–859. [Google Scholar] [CrossRef]
  14. Abrams, M.; Yamaguchi, Y. Twenty years of ASTER contributions to lithologic mapping and mineral exploration. Remote Sens. 2019, 11, 1394. [Google Scholar] [CrossRef] [Green Version]
  15. Ninomiya, Y. Mapping quartz, carbonate minerals, and mafic-ultramafic rocks using remotely sensed multispectral thermal infrared ASTER data. In Proceedings of the Thermosense XXIV, Orlando, FL, USA, 1–5 April 2002; International Society for Optics and Photonics: Bellingham, WA, USA, 2002; Volume 4710, pp. 191–202. [Google Scholar]
  16. Safari, M.; Maghsoudi, A.; Pour, A.B. Application of Landsat-8 and ASTER satellite remote sensing data for porphyry copper exploration: A case study from Shahr-e-Babak, Kerman, south of Iran. Geocarto Int. 2018, 33, 1186–1201. [Google Scholar] [CrossRef]
  17. Muzirafuti, A.; Boualoul, M.; Barreca, G.; Allaoui, A.; Bouikbane, H.; Lanza, S.; Crupi, A.; Randazzo, G. Fusion of Remote Sensing and Applied Geophysics for Sinkholes Identification in Tabular Middle Atlas of Morocco (the Causse of El Hajeb): Impact on the Protection of Water Resource. Resources 2020, 9, 51. [Google Scholar] [CrossRef]
  18. Et-Tayea, Y.; Rachid, A.; Attou, A.; Nasri, H.; Mamouch, Y.; El Khazanti, F.; El Azhari, H.; El Haddar, A.; Aziz, A. A new bentonite deposit prospected in the Cap des Trois Fourches area (north-eastern Rif, Morocco) using spectrometry by satellite imagery coupled with mineralogical, chemical, and microstructural investigations. Arab. J. Geosci. 2021, 14, 1–14. [Google Scholar] [CrossRef]
  19. El Azzab, D.; Ghfir, Y.; Miftah, A. Geological interpretation of the rifian foreland gravity anomalies and 3D modeling of their Hercynian granites (Northeastern Morocco). J. Afr. Earth Sci. 2019, 150, 584–594. [Google Scholar] [CrossRef]
  20. Elkhateeb, S.O.; Abdellatif, M.A.G. Delineation potential gold mineralization zones in a part of Central Eastern Desert, Egypt using Airborne Magnetic and Radiometric data. NRIAG J. Astron. Geophys. 2018, 7, 361–376. [Google Scholar] [CrossRef] [Green Version]
  21. Miftah, A.; El Azzab, D.; Attou, A.; Manar, A.; Rachid, A.; Ramhy, H. Geochemical mapping of radioactive elements using helicopter-borne gamma-ray spectrometry (Tiouit, Eastern Anti-Atlas, Morocco): Or occurrence and environmental impact. J. Afr. Earth Sci. 2018, 139, 392–402. [Google Scholar] [CrossRef]
  22. Miftah, A.; El Azzab, D.; Attou, A.; Rachid, A.; Ouchchen, M.; Soulaimani, A.; Soulaimani, S.; Manar, A. Combined analysis of helicopter-borne magnetic and stream sediment geochemical data around an ancient Tiouit gold mine (Eastern Anti-Atlas, Morocco): Geological and mining interpretations. J. Afr. Earth Sci. 2021, 175, 104093. [Google Scholar] [CrossRef]
  23. Ouchchen, M.; Boutaleb, S.; El Azzab, D.; Abioui, M.; Mickus, K.L.; Miftah, A.; Echogdali, F.Z.; Dadi, B. Structural interpretation of the Igherm region (Western Anti Atlas, Morocco) from an aeromagnetic analysis: Implications for copper exploration. J. Afr. Earth Sci. 2021, 176, 104140. [Google Scholar] [CrossRef]
  24. Ranjbar, H.; Masoumi, F.; Carranza, E.J.M. Evaluation of geophysics and spaceborne multispectral data for alteration mapping in the Sar Cheshmeh mining area, Iran. Int. J. Remote Sens. 2011, 32, 3309–3327. [Google Scholar] [CrossRef]
  25. Abd El Nabi, S.H. Role of γ-ray spectrometry in detecting potassic alteration associated with Um Ba’anib granitic gneiss and metasediments, G. Meatiq area, Central Eastern Desert, Egypt. Arab. J. Geosci. 2013, 6, 1249–1261. [Google Scholar] [CrossRef]
  26. Elawadi, E.; Ammar, A.; Elsirafy, A. Mapping surface geology using airborne gamma-ray spectrometric survey data-A case study. In Proceedings of the 7th SEGJ International Symposium, Sendai, Japan, 24–26 November 2004. [Google Scholar]
  27. Grasty, R.L.; Shives, R.B.K. Applications of gamma ray spectrometry to mineral exploration and geological mapping. In Proceedings of the Workshop Presented at Exploration, Houston, TX, USA, 4–5 October 1997; Volume 97. [Google Scholar]
  28. Maden, N.; Akaryalı, E. Gamma ray spectrometry for recognition of hydrothermal alteration zones related to a low sulfidation epithermal gold mineralization (eastern Pontides, NE Türkiye). J. Appl. Geophys. 2015, 122, 74–85. [Google Scholar] [CrossRef]
  29. Shives, R.B.K.; Charbonneau, B.W.; Ford, K.L. The detection of potassic alteration by gamma-ray spectrometry—recognition of alteration related to mineralization. Geophysics 2000, 65, 2001–2011. [Google Scholar] [CrossRef] [Green Version]
  30. Youssef, M.A.S.; Elkhodary, S.T. Utilization of airborne gamma ray spectrometric data for geological mapping, radioactive mineral exploration and environmental monitoring of southeastern Aswan city, South Eastern Desert, Egypt. Geophys. J. Int. 2013, 195, 1689–1700. [Google Scholar] [CrossRef] [Green Version]
  31. Benziane, F.; Yazidi, A.; Saadane, A.; Yazidi, M.; EL Fahssi, A.; Stone, B.D.; Walsh, G.; Burton, W.C.; Aleinikoff, J.N.; Ejjaouani, H.; et al. Carte géologique du Maroc au 1/50 000, feuille KELÂAT M’GOUNA–Notice explicative. Notes Mémoires Serv. Géologique Maroc 2008, 468, 136. [Google Scholar]
  32. Tuduri, J.; Chauvet, A.; Barbanson, L.; Bourdier, J.-L.; Labriki, M.; Ennaciri, A.; Badra, L.; Dubois, M.; Ennaciri-Leloix, C.; Sizaret, S. The jbel saghro au (–ag, cu) and ag–hg metallogenetic province: Product of a long-lived ediacaran tectono-magmatic evolution in the moroccan anti-atlas. Minerals 2018, 8, 592. [Google Scholar] [CrossRef] [Green Version]
  33. Thiéblemont, D.; Chêne, F.; Liégeois, J.P.; Ouabadi, A.; Le Gall, B.; Maury, R.C.; Jalludin, M.; Ouattara Gbélé, C.; Tchaméni, R.; Fernandez-Alonso, M. Geological Map of Africa at 1: 10 Million Scale. In Proceedings of the 35th International Geology Congress, Cape Town, South Africa, 28 August–2 September 2016. [Google Scholar]
  34. Gasquet, D.; Ennih, N.; Liégeois, J.-P.; Soulaimani, A.; Michard, A. The pan-african belt. In Continental Evolution: The Geology of Morocco; Springer: Berlin/Heidelberg, Germany, 2008; pp. 33–64. [Google Scholar]
  35. Thomas, R.J.; Chevallier, L.P.; Gresse, P.G.; Harmer, R.E.; Eglington, B.M.; Armstrong, R.A.; De Beer, C.H.; Martini, J.E.J.; De Kock, G.S.; Macey, P.H. Precambrian evolution of the Sirwa window, Anti-Atlas orogen, Morocco. Precambrian Res. 2002, 118, 1–57. [Google Scholar] [CrossRef]
  36. Hindermeyer, J. Le precambrien-III du sarho. Comptes Rendus Hebd. Séances L’Acad. Sci. 1953, 237, 1024–1026. [Google Scholar]
  37. Ouguir, H.; Macaudiere, J.; Dagallier, G.; Qadrouci, A.; Leistel, J. Cadre structural du gite Ag-Hg d’Imiter (Anti Atlas, Maroc); implication metallogenique. Bull. Soc. Geol. Fr. 1994, 165, 233–248. [Google Scholar]
  38. Leblanc, M. Ophiolites Précambriennes dans le PII de l’Anti-Atlas Central (Maroc). Ph.D. Thesis, University of Paris VI, Paris, France, 1975. [Google Scholar]
  39. El Baghdadi, M.; El Boukhari, A.; Jouider, A.; Benyoucef, A.; Nadem, S. Calc-alkaline arc I-type granitoid associated with S-type granite in the Pan-African belt of eastern Anti-Atlas (Saghro and Ougnat, South Morocco). Gondwana Res. 2003, 6, 557–572. [Google Scholar] [CrossRef]
  40. Baidada, B.; Cousens, B.; Alansari, A.; Soulaimani, A.; Barbey, P.; Ilmen, S.; Ikenne, M. Geochemistry and Sm–Nd isotopic composition of the Imiter Pan-African granitoids (Saghro massif, eastern Anti-Atlas, Morocco): Geotectonic implications. J. Afr. Earth Sci. 2017, 127, 99–112. [Google Scholar] [CrossRef]
  41. Tuduri, J. Processus de Formation et Relations Spatio-Temporelles des Minéralisations à or et Argent en Contexte Volcanique Précambrien (Jbel Saghro, Anti-Atlas, Maroc). Implications sur les Relations Déformation-Magmatisme-Volcanisme-Hydrothermalisme. Ph.D. Thesis, University of Orléans, Orléans, France, 2005. [Google Scholar]
  42. Walsh, G.J.; Benziane, F.; Aleinikoff, J.N.; Harrison, R.W.; Yazidi, A.; Burton, W.C.; Quick, J.E.; Saadane, A. Neoproterozoic tectonic evolution of the jebel Saghro and Bou Azzer—El Graara inliers, eastern and central Anti-Atlas, Morocco. Precambrian Res. 2012, 216, 23–62. [Google Scholar] [CrossRef]
  43. Bajja, A.; Greiling, R.O.; Rocci, G. Pan-African andesites and dacites in the eastern Anti-Atlas: Syn-subduction or post-collisional? Z. Dtsch. Geol. Ges. 1998, 1–12. [Google Scholar] [CrossRef]
  44. Clauer, N. Géochimie Isotopique du Strontium des Milieux Sédimentaires. Application à la Géochronologie de la Couverture du Craton Ouest-Africain; Persée-Portail des Revues Scientifiques en SHS: Aubervilliers, France, 1976; Volume 45. [Google Scholar]
  45. Ezzouhairi, H. Etude Pétrographique, Géochimique et Structurale des Formations Plutoniques du Précambrien II de la Boutonnière de Bouskour (Sarhro Occidental Anti-Atlas, Maroc). Ph.D. Thesis, University of Marrakech, Marrakech, Morocco, 1989. [Google Scholar]
  46. Nerci, K. La Boutonnière Protérozoique de Sidi Flah (Saghro, Anti-Atlas, Maroc): Contribution à L’étude de ses Minéralisations à Pb, Zn, Cu, Ag et de Cadre Géologique. Ph.D. Thesis, University of Rabat, Rabat, Morocco, 1988; 222p. [Google Scholar]
  47. Rjimati, E.C.; Derre, C.; Lecolle, M.; Lillie, F.; Nerci, K. Caractéristiques de la tectonique pan-africaine dans le Jbel Saghro (Anti-Atlas), Notes et mémoires du Service géologique. 1992; 387–394.
  48. Elsass, P. Analyse Tectonique du Graben de Tagmout-Tine Ouayour (Jbel Sarhro, Maroc). Notes Mem. 1977, 268, 23. [Google Scholar]
  49. Hawkins, M.P.; Beddoe-Stephens, B.; Gillespie, M.R.; Loughlin, S.; Barron, H.F.; Barnes, R.P.; Powell, J.H.; Waters, C.N.; Williams, M. Carte géologique du Maroc au 1/50 000, feuille Tiwit, Notes et Mémoires du Service Géologique du Maroc. 2001; Volume 404.
  50. Henares Romero, J.; López Casado, C.; Sanz de Galdeano, C.; Delgado, J.; Peláez Montilla, J.A. Stress fields in the Iberian-Maghrebi region. J. Seismol. 2003, 7, 65–78. [Google Scholar] [CrossRef]
  51. Derré, C.; Lécolle, M. Altérations hydrothermales dans le Protérozoïque supérieur du Saghro (Anti-Atlas oriental). Relations avec les minéralisations, Chronique de la Recherche Miniére. 1999; 39–63.
  52. Dickson, B.L.; Scott, K.M. Interpretation of aerial gamma-ray surveys-adding the geochemical factors. AGSO J. Aust. Geol. Geophys. 1997, 17, 187–200. [Google Scholar]
  53. Erdi-Krausz, G.; Matolin, M.; Minty, B.; Nicolet, J.P.; Reford, W.S.; Schetselaar, E.M. Guidelines for Radioelement Mapping Using Gamma Ray Spectrometry Data: Also as Open Access e-Book; International Atomic Energy Agency (IAEA): Vienna, Austria, 2003; ISBN 9201083033. [Google Scholar]
  54. Minty, B.R.S. Fundamentals of airborne gamma-ray spectrometry. AGSO J. Aust. Geol. Geophys. 1997, 17, 39–50. [Google Scholar]
  55. Wilford, J. Airborne gamma-ray spectrometry. Geophys. Remote Sens. Methods Regloith Explor. 2002, 46–52. [Google Scholar]
  56. El-Sadek, M.A. Radiospectrometric and magnetic signatures of a gold mine in Egypt. J. Appl. Geophys. 2009, 67, 34–43. [Google Scholar] [CrossRef]
  57. Ghoneim, S.M.; Abd El Nabi, S.H.; Yehia, M.A.; Salem, S.M. Using air-borne gamma ray spectrometry and remote sensing data for detecting alteration zones around Wadi Saqia area, Central Eastern Desert, Egypt. J. Afr. Earth Sci. 2021, 178, 104181. [Google Scholar] [CrossRef]
  58. Ribeiro, V.B.; Mantovani, M.S.M. Gamma spectrometric and magnetic interpretation of Cabaçal copper deposit in Mato Grosso (Brazil): Implications for hydrothermal fluids remobilization. J. Appl. Geophys. 2016, 135, 223–231. [Google Scholar] [CrossRef]
  59. Adler-Golden, S.; Berk, A.; Bernstein, L.S.; Richtsmeier, S.; Acharya, P.K.; Matthew, M.W.; Anderson, G.P.; Allred, C.L.; Jeong, L.S.; Chetwynd, J.H. FLAASH, a MODTRAN4 atmospheric correction package for hyperspectral data retrievals and simulations. In Proceedings of the 7th Annual JPL Airborne Earth Science Workshop, Pasadena, CA, USA, 12–16 January 1998; JPL Publication: La Cañada Flintridge, CA, USA, 1998; Volume 97, pp. 9–14. [Google Scholar]
  60. Adler-Golden, S.M.; Matthew, M.W.; Bernstein, L.S.; Levine, R.Y.; Berk, A.; Richtsmeier, S.C.; Acharya, P.K.; Anderson, G.P.; Felde, J.W.; Gardner, J.A. Atmospheric correction for shortwave spectral imagery based on MODTRAN4. In Proceedings of the Imaging Spectrometry V, Denver, CO, USA, 18–23 July 1999; International Society for Optics and Photonics: Bellingham, WA, USA, 1999; Volume 3753, pp. 61–69. [Google Scholar]
  61. Matthew, M.W.; Adler-Golden, S.M.; Berk, A.; Richtsmeier, S.C.; Levine, R.Y.; Bernstein, L.S.; Acharya, P.K.; Anderson, G.P.; Felde, G.W.; Hoke, M.L. Status of atmospheric correction using a MODTRAN4-based algorithm. In Proceedings of the Algorithms for Multispectral, Hyperspectral, and Ultraspectral Imagery VI, Orlando, FL, USA, 24–28 April 2000; International Society for Optics and Photonics: Bellingham, WA, USA, 2000; Volume 4049, pp. 199–207. [Google Scholar]
  62. Crosta, A.P.; De Souza Filho, C.R.; Azevedo, F.; Brodie, C. Targeting key alteration minerals in epithermal deposits in Patagonia, Argentina, using ASTER imagery and principal component analysis. Int. J. Remote Sens. 2003, 24, 4233–4240. [Google Scholar] [CrossRef]
  63. Mia, B.; Fujimitsu, Y. Mapping hydrothermal altered mineral deposits using Landsat 7 ETM+ image in and around Kuju volcano, Kyushu, Japan. J. Earth Syst. Sci. 2012, 121, 1049–1057. [Google Scholar] [CrossRef] [Green Version]
  64. Ninomiya, Y. Rock type mapping with indices defined for multispectral thermal infrared ASTER data: Case studies. In Proceedings of the Remote Sensing for Environmental Monitoring, GIS Applications, and Geology II, Crete, Greece, 23–27 September 2002; International Society for Optics and Photonics: Bellingham, WA, USA, 2003; Volume 4886, pp. 123–132. [Google Scholar]
  65. Ninomiya, Y. A stabilized vegetation index and several mineralogic indices defined for ASTER VNIR and SWIR data. In Proceedings of the IGARSS 2003. 2003 IEEE International Geoscience and Remote Sensing Symposium. Proceedings (IEEE Cat. No. 03CH37477), Toulouse, France, 21–25 July 2003; Volume 3, pp. 1552–1554. [Google Scholar]
  66. Zhang, N.; Zhou, K. Mineral prospectivity mapping with weights of evidence and fuzzy logic methods. J. Intell. Fuzzy Syst. 2015, 29, 2639–2651. [Google Scholar] [CrossRef] [Green Version]
  67. Yamaguchi, Y.; Kahle, A.B.; Tsu, H.; Kawakami, T.; Pniel, M. Overview of advanced spaceborne thermal emission and reflection radiometer (ASTER). IEEE Trans. Geosci. Remote Sens. 1998, 36, 1062–1071. [Google Scholar] [CrossRef] [Green Version]
  68. Carranza, E.J.M.; Hale, M. Geologically constrained fuzzy mapping of gold mineralization potential, Baguio district, Philippines. Nat. Resour. Res. 2001, 10, 125–136. [Google Scholar] [CrossRef]
  69. Ghanbari, Y.; Hezarkhani, A.; Ataei, M.; Pazand, K. Mineral potential mapping with fuzzy models in the Kerman–Kashmar Tectonic Zone, Central Iran. Appl. Geomat. 2012, 4, 173–186. [Google Scholar] [CrossRef]
  70. Zhang, N.; Zhou, K.; Du, X. Application of fuzzy logic and fuzzy AHP to mineral prospectivity mapping of porphyry and hydrothermal vein copper deposits in the Dananhu-Tousuquan island arc, Xinjiang, NW China. J. Afr. Earth Sci. 2017, 128, 84–96. [Google Scholar] [CrossRef]
  71. Zadeh, L.A. Fuzzy logic, neural networks, and soft computing. In Fuzzy Sets, Fuzzy Logic, and Fuzzy Systems: Selected Papers by Lotfi A Zadeh; World Scientific: Singapore, 1996; pp. 775–782. [Google Scholar]
  72. Zimmermann, H.-J.; Zysno, P. Latent connectives in human decision making. Fuzzy Sets Syst. 1980, 4, 37–51. [Google Scholar] [CrossRef]
  73. Kim, Y.-H.; Choe, K.-U.; Ri, R.-K. Application of fuzzy logic and geometric average: A Cu sulfide deposits potential mapping case study from Kapsan Basin, DPR Korea. Ore Geol. Rev. 2019, 107, 239–247. [Google Scholar] [CrossRef]
  74. Galbraith, J.H.; Saunders, D.F. Rock classification by characteristics of aerial gamma-ray measurements. J. Geochem. Explor. 1983, 18, 49–73. [Google Scholar] [CrossRef]
  75. Fall, M.; Baratoux, D.; Ndiaye, P.M.; Jessell, M.; Baratoux, L. Multi-scale distribution of Potassium. Thorium and Uranium in Paleoproterozoic granites from eastern Senegal. J. Afr. Earth Sci. 2018, 148, 30–51. [Google Scholar] [CrossRef]
  76. Fall, M.; Baratoux, D.; Jessell, M.; Ndiaye, P.M.; Vanderhaeghe, O.; Moyen, J.F.; Baratoux, L.; Bonzi, W.M.-E. The redistribution of thorium, uranium, potassium by magmatic and hydrothermal processes versus surface processes in the Saraya Batholith (Eastern Senegal): Insights from airborne radiometrics data and topographic roughness. J. Geochem. Explor. 2020, 219, 106633. [Google Scholar] [CrossRef]
  77. Hoover, D.B.; Heran, W.D.; Hill, P.L. The Geophysical Expression of Selected Mineral Deposit Models; CiteseerX: Princeton, NJ, USA, 1992. [Google Scholar]
Figure 1. (a) Location of the Moroccan Anti-Atlas Range relative to the West African Craton [33]. (b) General geological map of the Anti-Atlas showing its main Precambrian inliers [34,35], modified. (c) Geological map of the Saghro Massif with its main metalliferous deposits (IMD: Imeter Deposit; TGHD: Taghassa Deposit; KMD: Kelâat M’Gouna Deposits; ISFD: Issarfane; BSD: Bouskour Deposit; AMD: Amzwaro Deposit; TMD: Tizi Moudou Deposit; AFD: Asfalou Deposit; TWD: Tiwit Deposit; TGMD: Tagmout Deposit; SFD: Sidi Flah Deposit). In addition, their rose diagrams showing the trends of faults on the left and dykes on the right. The study area is marked by the red polygon [36,37], modified.
Applsci 12 00957 g001
Figure 2. Geological map of the study area extracted from the geological map 1:50,000 of Kelâat M’Gouna, showing its main ore deposits (ISD: Ismlal gold Deposit; TNÇD: Taourirt-n-Çwalh gold Deposit; TNTD: Talat-n-Tbarought gold Deposit; TGD: Tagmout copper Deposit).
Applsci 12 00957 g002
Figure 3. The methodological flowchart used in this study.
Applsci 12 00957 g003
Figure 4. Maps of natural gamma-ray spectrometry showing the distribution of Potassium (a), Thorium (b), Uranium (c), and the ratio K/eTh (d).
Applsci 12 00957 g004
Figure 5. Band ratio maps derived from the ASTER image showing the distribution of anomalous clay minerals (a), phyllic minerals (b), propylitic minerals (c), and iron oxides (d).
Applsci 12 00957 g005
Figure 6. Mineral prospectivity maps: (a) mineral prospectivity map derived from natural gamma spectrometry data. (b) Mineral prospectivity map derived from ASTER image.
Applsci 12 00957 g006
Figure 7. Combination of mineral prospectivity maps.
Applsci 12 00957 g007
Table 1. Radioelement concentrations in main categories of rocks [53,56].
Rock TypePotassium (%)Uranium (ppm)Thorium (ppm)
RangeMeanRangeMeanRangeMean
Acid Extrusives1.0–6.23.10.8–16.44.11.1–41.011.9
Acid Intrusives1.0–7.63.40.1–30.04.50.1–253.125.7
Intermediate Extrusives0.01–2.51.10.2–2.61.10.4–6.42.4
Intermediate Intrusives0.1–6.22.10.1–23.43.20.4–106.012.2
Basic Extrusives0.06–2.40.70.03–3.30.80.05–8.82.2
Basic Intrusives0.01–2.60.80.01–5.70.80.03–15.02.3
Ultrabasic0–0.80.30–1.60.30–7.51.4
Chemical Sedimentary Rocks0.02–8.40.60.03–26.73.60.03–132.014.9
Carbonates0.01–3.50.30.03–18.020.03–10.81.3
Detrital Sedimentary Rocks0.01–9.71.50.1–80.04.80.2–362.012.4
Metamorphosed Igneous Rocks0.1–6.12.50.1–148.540.1–104.214.8
Metamorphosed Sedimentary Rocks0.01–5.32.10.1–53.430.1–91.412
Table 2. Characteristics and performance of the ASTER sensor [67].
SubsystemBand No.Spectral Range (μm)Radiometric
Resolution
Absolute AccuracySpatial
Resolution (m)
Signal
Quantization (Bits)
VNIR10.52–0.60NEΔρ ≤ 0.5%≤±4%158
20.63–0.69
30.78–0.86
3N0.78–0.86
SWIR41.60–1.70NEΔρ ≤ 0.5%≤±4%308
52.145–2.185NEΔρ ≤ 1.3%
62.185–2.225NEΔρ ≤ 1.3%
72.235–2.285NEΔρ ≤ 1.3%
82.295–2.365NEΔρ ≤ 1.0%
92.360–2.430NEΔρ ≤ 1.3%
TIR108.125–8.475NEΔT ≤ 0.3 K≤3 K (200–240 K)9012
118.475–8.825≤2 K (240–270 K)
128.925–9.275≤1 K (270–340 K)
1310.25–10.95≤2 K (340–370 K)
1410.95–11.65
Table 3. Band ratios used in this analysis for mapping weathering zones in the study area.
Bands RatiosEquationsTarget Minerals
CLMI(band 4 + band 6)/band 5Alunite/kaolinite/montmorillonite
PHMI(band 5 + band 7)/band 6Sericite/muscovite/illite/smectite
PRMI(band 7 + band 9)/band 8Epidote/chlorite/carbonates
IOI(band 5/band 3) + (band 1/band 2)Hematite/goethite/jarosite
Table 4. Fuzzy membership parameters used for input layers.
Data OriginInput LayerMembership TypeFuzzy Operator
Aster DatasetArgilicLineareγ = 0.72
PhyllicLineare
PropyliticLineare
Iron oxydesLineare
Spectrometry gamma DatasetKLineareγ = 0.72
K/eThLineare
K/eULineare
Publisher’s Note: MDPI stays neutral with regard to jurisdictional claims in published maps and institutional affiliations.

