
The Assessment of COVID-19 Vulnerability Risk for Crisis Management


Institute of Geospatial Engineering and Geodesy, Faculty of Civil Engineering and Geodesy, Military University of Technology (WAT), 00-908 Warsaw, Poland
*
Author to whom correspondence should be addressed.
Appl. Sci. 2022, 12(8), 4090; https://0-doi-org.brum.beds.ac.uk/10.3390/app12084090
Submission received: 21 February 2022
/
Revised: 12 April 2022
/
Accepted: 14 April 2022
/
Published: 18 April 2022
(This article belongs to the Special Issue Big Data for eHealth Applications)
Abstract
:The subject of this article is to determine COVID-19 vulnerability risk and its change over time in association with the state health care system, turnover, and transport to support the crisis management decision-making process. The aim was to determine the COVID-19 Vulnerability Index (CVI) based on the selected criteria. The risk assessment was carried out with methodology that includes the application of multicriteria analysis and spatiotemporal aspect of available data. Particularly the Spatial Multicriteria Analysis (SMCA) compliant with the Analytical Hierarchy Process (AHP), which incorporated selected population and environmental criteria were used to analyse the ongoing pandemic situation. The influence of combining several factors in the pandemic situation analysis was illustrated. Furthermore, the static and dynamic factors to COVID-19 vulnerability risk were determined to prevent and control the spread of COVID-19 at the early stage of the pandemic situation. As a result, areas with a certain level of risk in different periods of time were determined. Furthermore, the number of people exposed to COVID-19 vulnerability risk in time was presented. These results can support the decision-making process by showing the area where preventive actions should be considered.
1. Introduction
The end of 2019 brought the outbreak of SARS-CoV-2 followed by introducing a global state of emergency that affected the lives of people around the world [1,2]. For this reason, it became a popular subject of research for scientists from various disciplines. The spatial nature of the pandemic determines the increasing number of articles with the use of spatial data. Among them, the discussion on new challenges in operational crisis management and the role of spatial information and spatial technologies is visible [3].
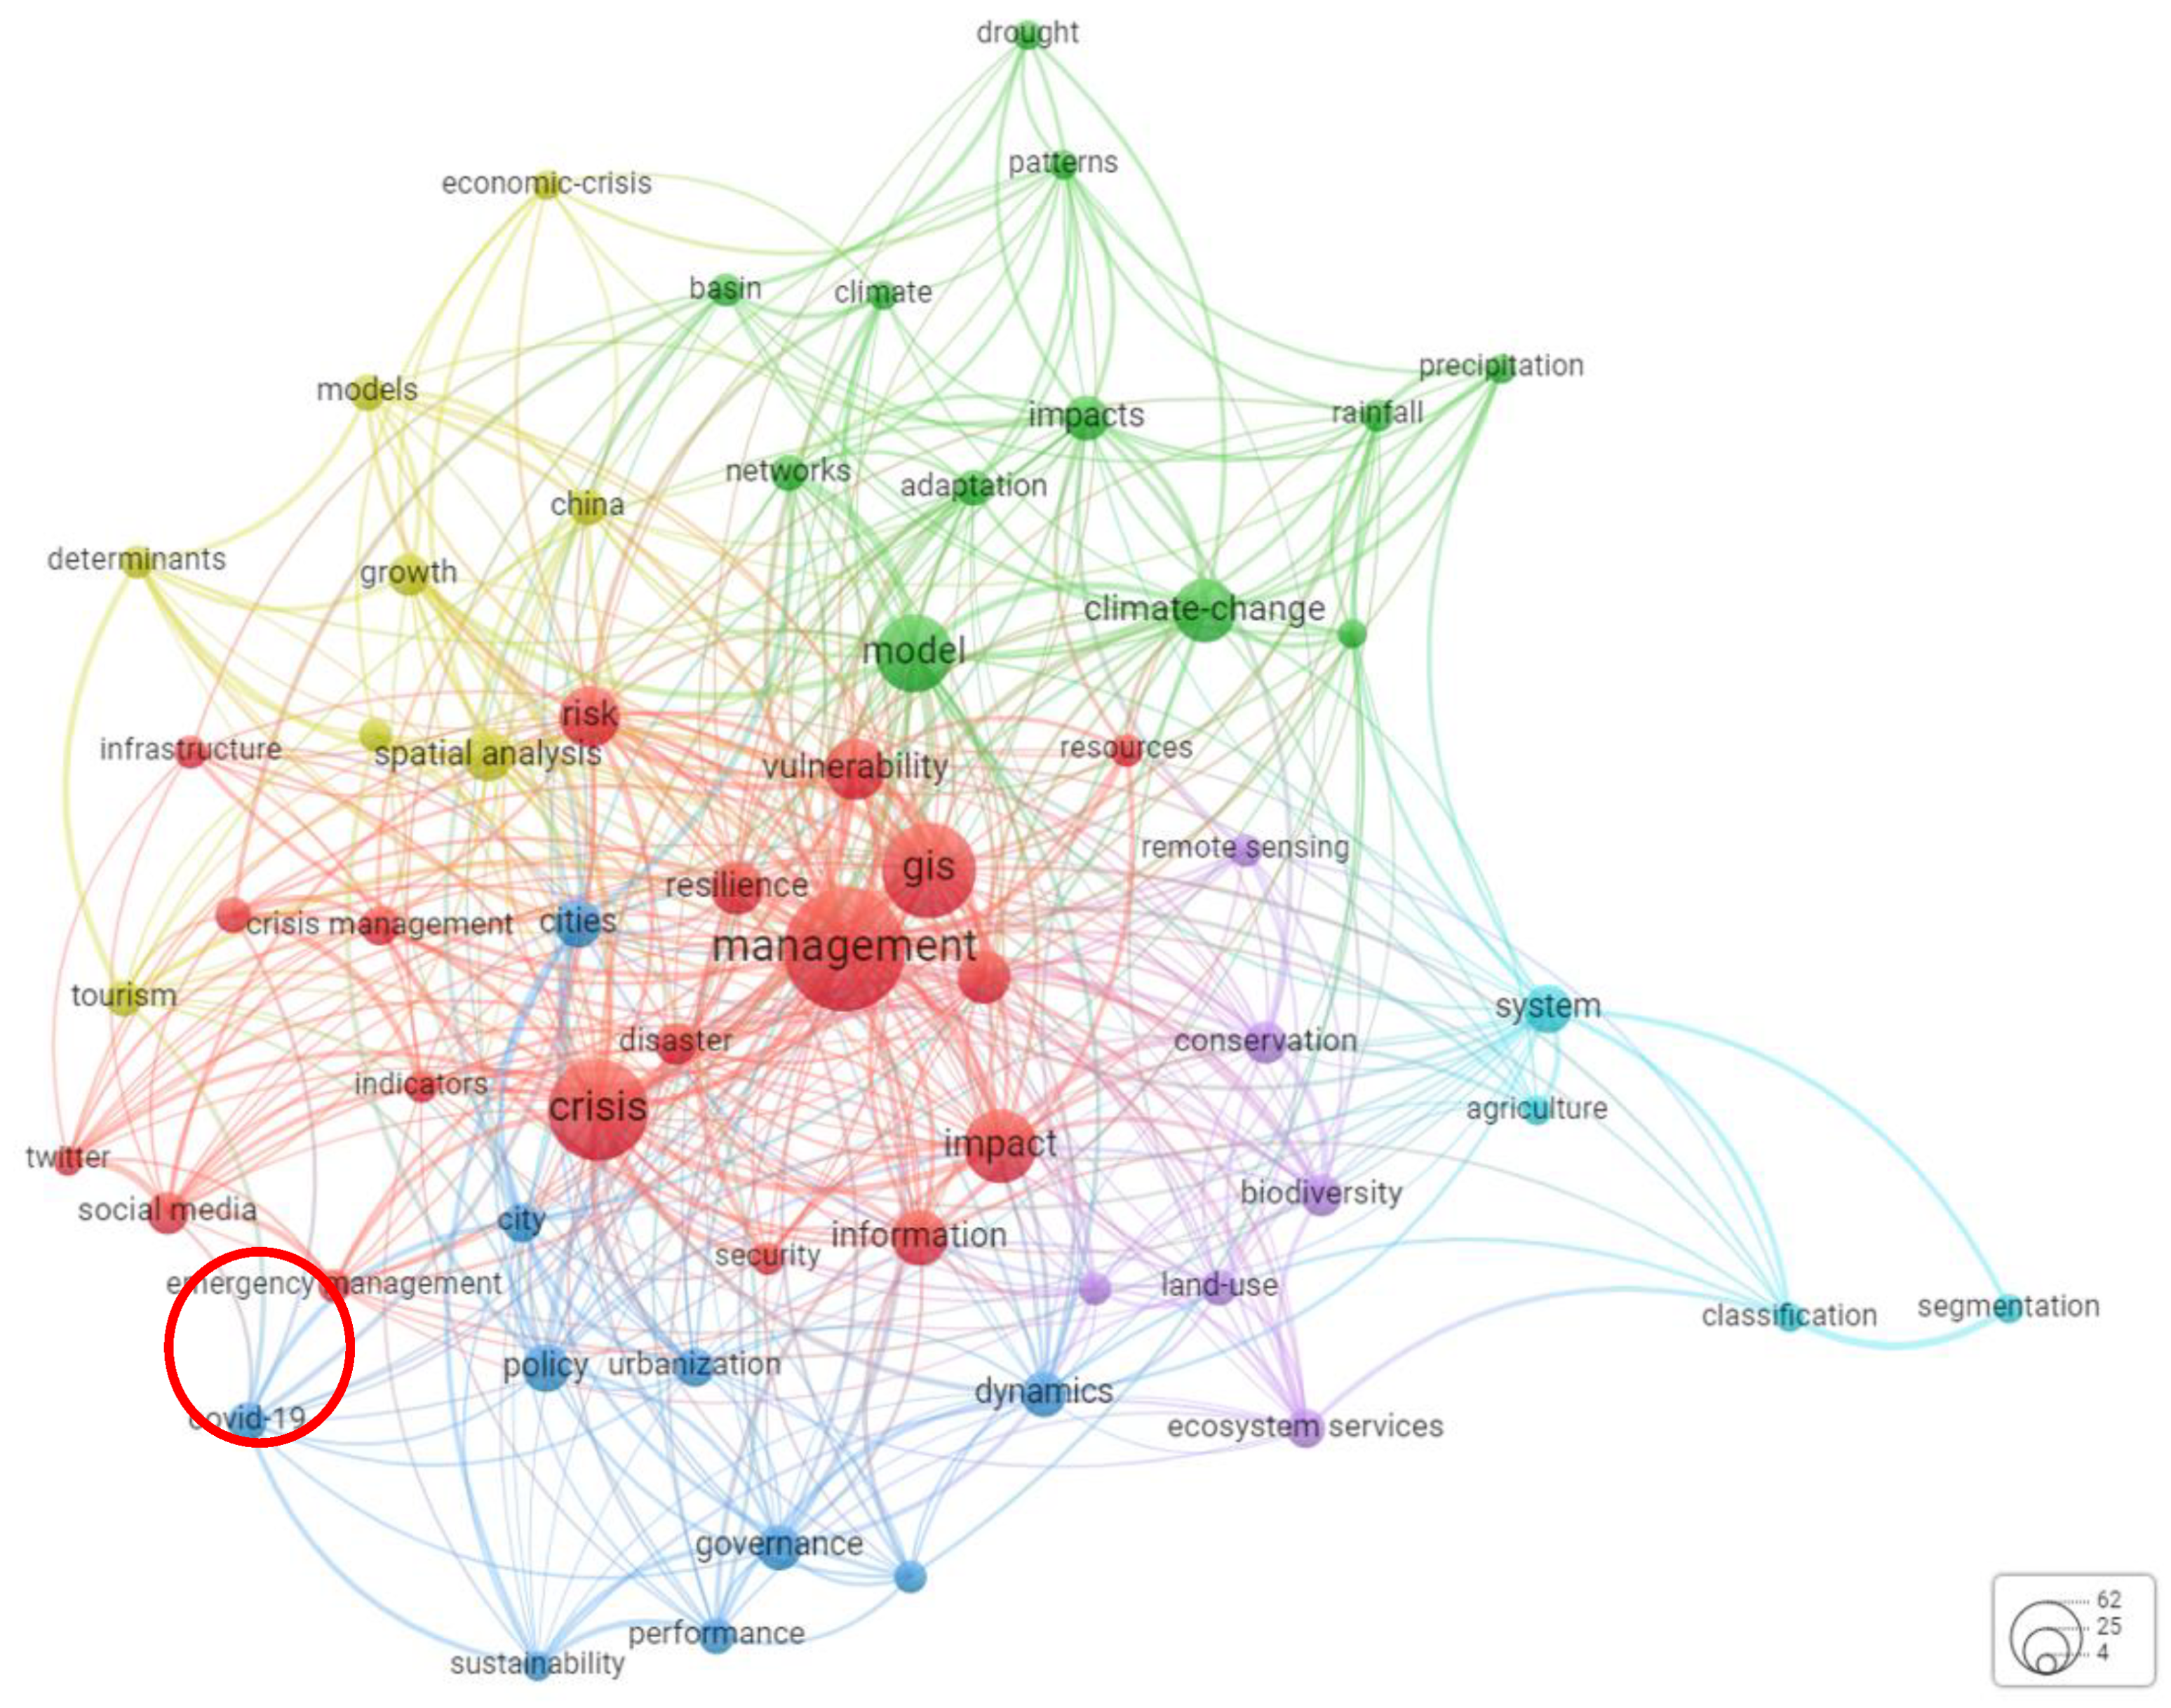
The search performed on the “crisis management” phrase only in the Web of Science database (WoS) resulted in 59,138 research items (as of 20 October 2021), 5620 of them have been published in 2021, and 4424 were related to the pandemic of COVID-19. This leads to the conclusion that the problem of crisis management is a hot topic of science. In order to identify the ongoing trends in literature, “crisis management spatial analysis” research was performed and the obtained results were presented with the use of Weighted Network Visualization (WNV) shown in Figure 1.
The WNV was prepared with the use of the fractionalization method for normalizing the strength of the links between items [4]. The bigger the label, the higher the weight of certain terms. The colours are determined by the cluster to which the term belongs, while lines represent links: the closer two terms appear, the stronger the correlation between them. For example, Geographic Information System (GIS) is strongly related to “vulnerability”, “model”, “framework” etc. The homonyms joining were not performed.
The WNV shows a strong presentation of management, crisis, model, and GIS in the body of literature. Also, well-established trends on the possible applications of spatial analysis and SMCA (the analyses take into consideration a group of variable factors and assess their changes over time) were noticeable in broadly understood decision process and decision management with: suitability map [5,6,7,8,9], scenario evaluation method [10,11,12], resources allocation [13], transportation and vehicle routing [14,15,16,17,18], impact assessment [19,20,21], location migration and allocation [13,20,22,23], risk management and natural hazards occurrence can be noted [2,24,25,26,27,28,29,30,31,32]. This state according to [30,33,34,35] will persist, driven by the new applications of spatial analysis in GIS, and will include crisis management aspects.
More detailed analysis shows the use of the GIS environment [36,37,38] with recently developed methodologies to support the decision-making process in crisis management at the local level [29,39] and it is emphasized that its essential part was the visualisation of crisis progress, shown with the use of interactive, realistic, large-scale simulations [40].
The results of analyses may be used in several crisis situations like flooding, landslides [24,41] or for vulnerability or risk index estimation of selected areas or infrastructure elements [40,42,43,44] in order to provide the recommendation for the administrative strategies to minimize the social and economic effects of crisis situations [32,45,46,47].
According to the authors, the vulnerability index [31], susceptibility models, or susceptibility maps [48,49] should be determined with the use of different methods [50], depending on the area and crisis situation in order to ensure optimal performance and reliable results [51,52]. Reliability of results depends on the accuracy of data which is one of the crucial problems revealed in publications on spatial data next to the techniques for information extraction [24,41,53,54]. Those are followed with conclusions on the use of heterogeneous data sources and remotely sensed data to improve the analysis results, [53,55,56], furthermore, authors show that the potential improvement in the accuracy of GIS-based analysis can be achieved by applying a dedicated approach, for example, neural network [54], integrated uncertainty-sensitivity analysis approach, and attributed model of criteria weights [56].
Pandemic situation publications are considering the causes and potential effects of COVID-19. Researchers show the positive associations between new COVID-19 cases and death cases linked to several factors: public transport usage [15,23,46,47,48,49,50,51,52,53,54,55,56,57,58,59,60], temperature and humidity [21,61], age, sex, blood group, had influenza [50,62,63], poverty [64], and socio-cultural factors [65]. Furthermore, the juxtaposition of virus transmission acceleration in several countries in relation to the global policy and government responses, human mobility, environmental impact, socioeconomic, lockdown, migration, and vaccination was delivered [20,59,66,67] based on the developed spatiotemporal data matrix of factors and open data sources. The above leads to the determination of the most significant factors, enabling the prediction and modelling of the spatial patterns of virus spread. The researchers commonly use spatial statistic tools such as linear and non-linear regression [50], Bayesian Belief Networks [68], Adaboost algorithm [69], Potential Model [70], Joinpoint analysis [71], machine learning [50,72] in modelling COVID-19 spatial pattern. As a result, it is possible to forecast the COVID spread and to deliver an effective response in cluster containment for crisis situations with intelligent computing [20,62,70,73,74].
Publications considering the effects of the pandemic show the use of socioeconomic data collection on daily new COVID-19 cases to link them to real gross domestic product, unemployment rate, housing prices, export and import, energy system environment [73,75,76,77,78,79].
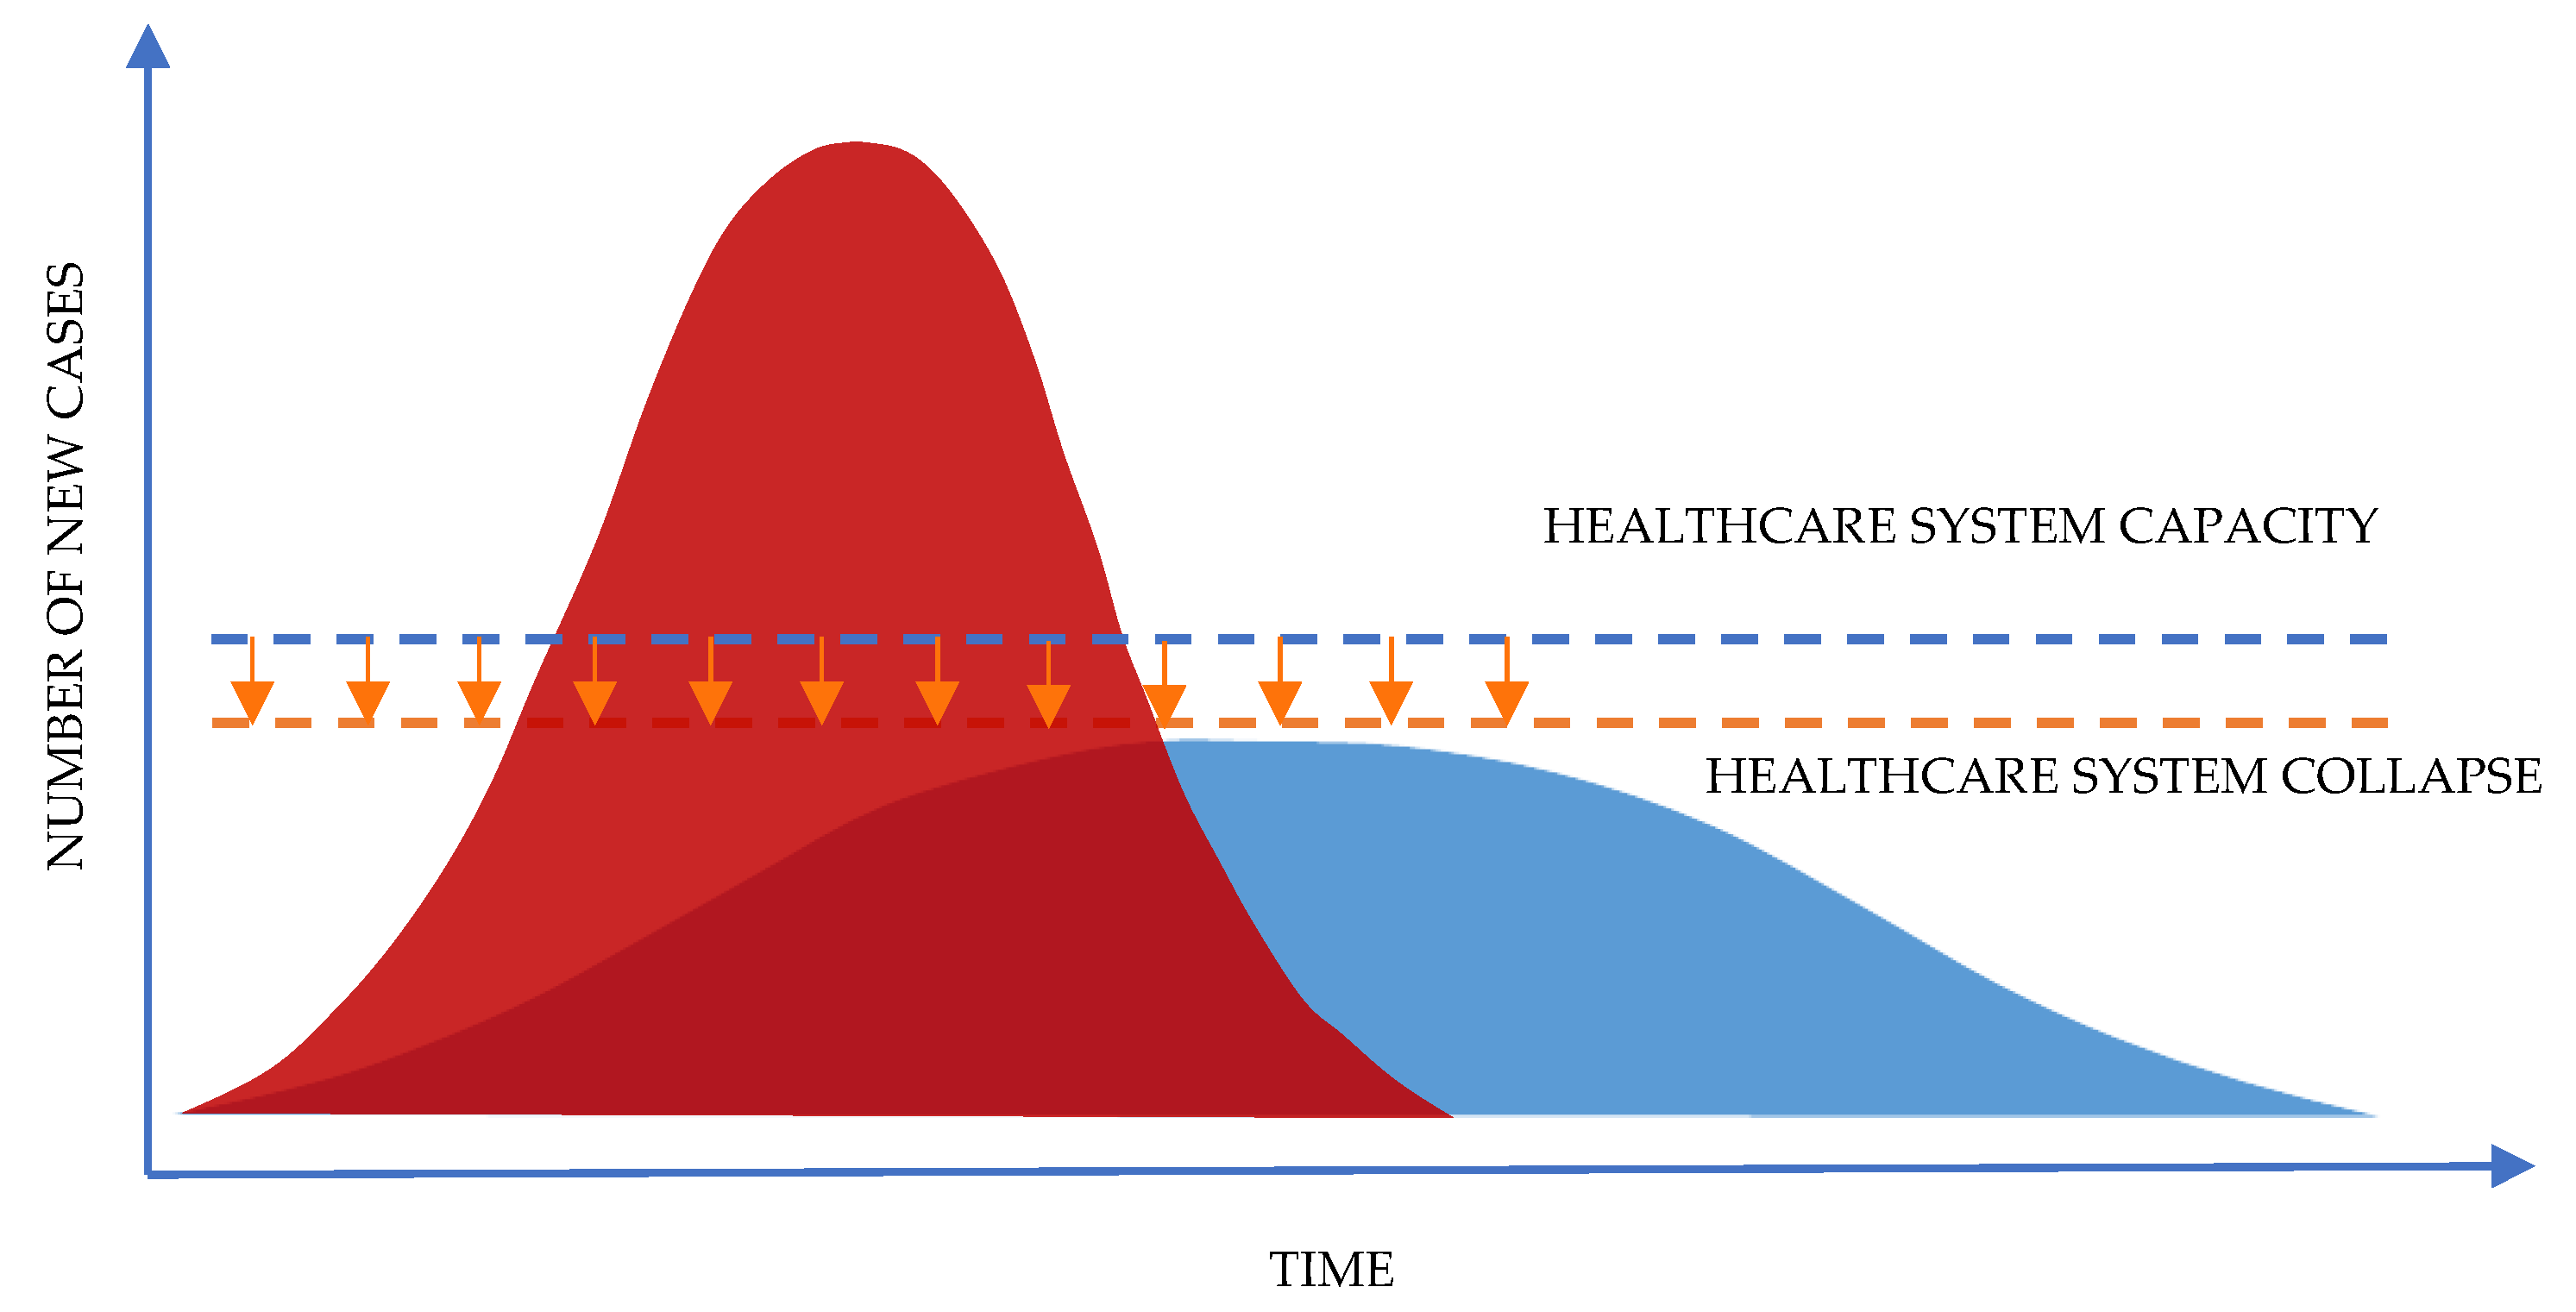
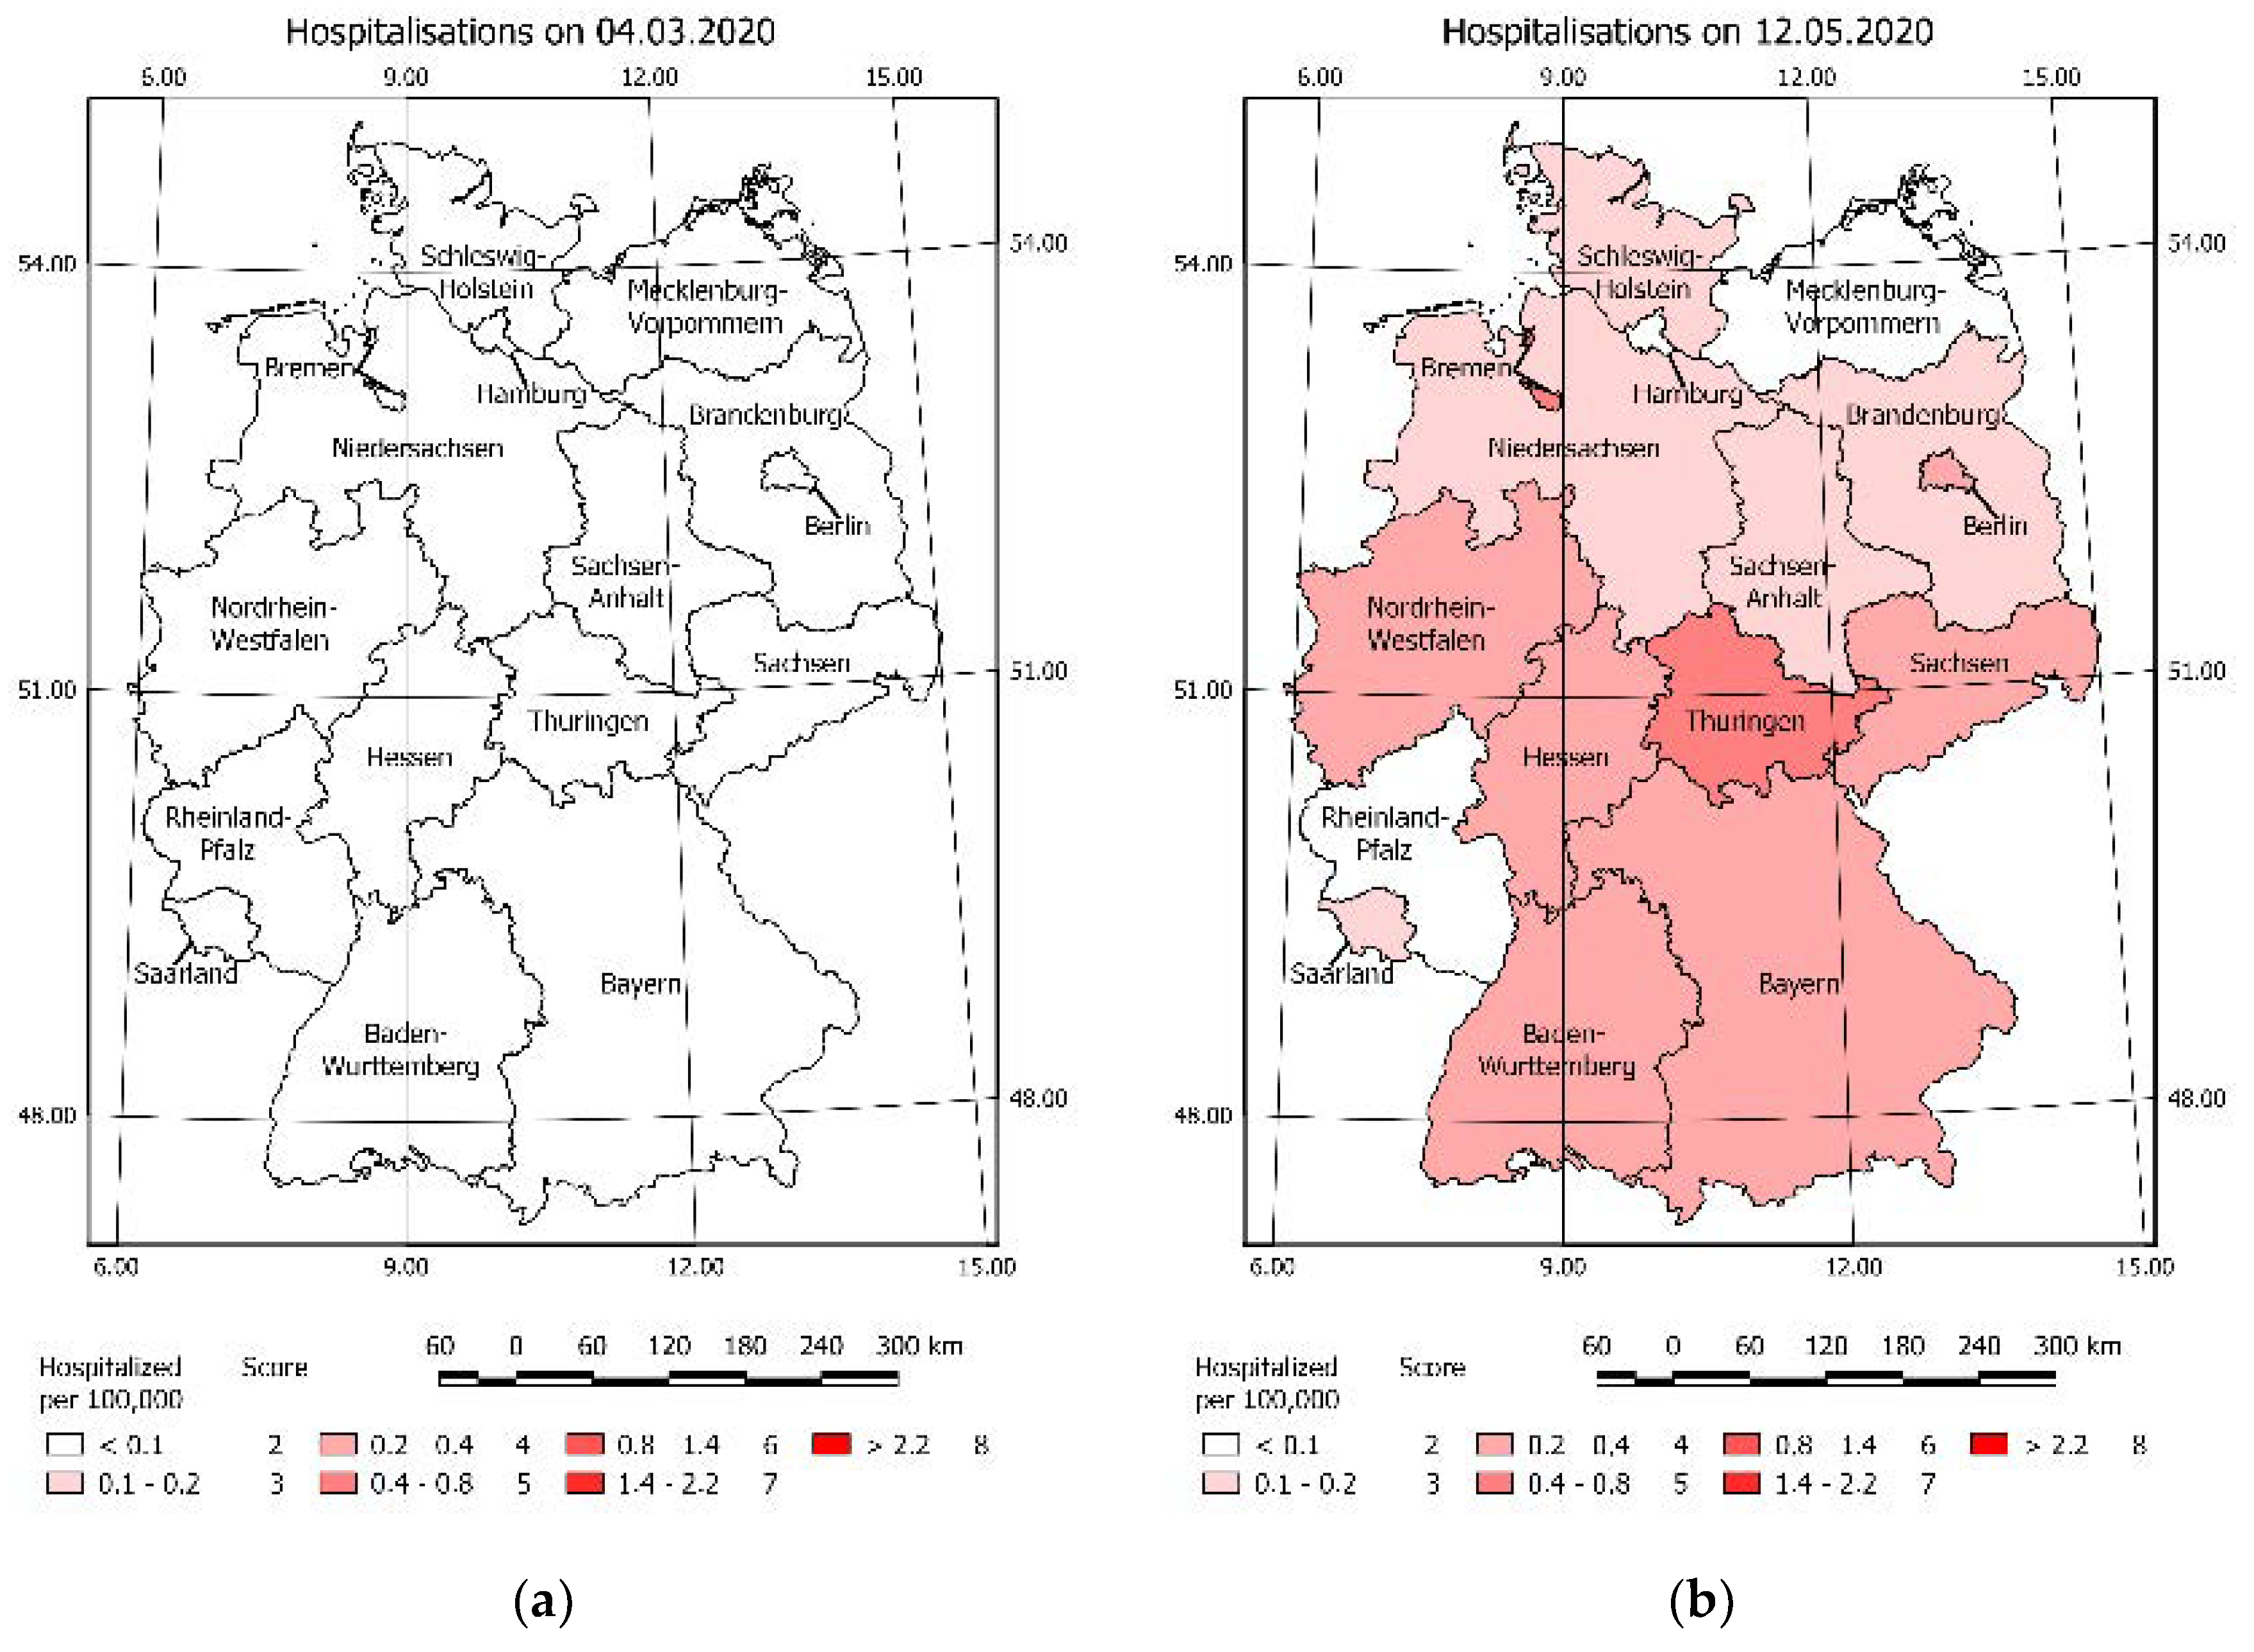
In the analysed publications on the subject of crisis management, the following problems are considered: the definition of risk, vulnerability, and hazard [80], the analysis of the existing crisis situation, and the management process [2,32,38,65,81,82,83]. The pivotal role of crisis management is to ensure public safety, in the matter of a pandemic, it is closely related to the capacity of the healthcare system [44,84,85,86]. Therefore, crisis management has to eliminate the possibility of an overload of the healthcare system, so that the number of new hospitalisations does not exceed the capacity of the healthcare system in a given area, as shown in Figure 2. Therefore, it is necessary to efficiently manage the available forces (medical staff, volunteers, services) and resources (infrastructure, equipment, equipment, and material reserves, restrictions, vaccinations) in time.
Thus, it was assumed that the essential knowledge on the pandemic situation and COVID-19 vulnerability should be considered in a spatiotemporal approach. This determined the aim of our research: to estimate the vulnerability index based on selected criteria along with the determination of its change over time in order to assess the threat caused by COVID-19 in the given area. This will extend the approach presented [31].
Based on a comprehensive analysis of the literature, the aim of this article was to answer the following questions:
- What information can a study of the spatiotemporal vulnerability and risk provide?
- What is the influence of selected criteria on the final value of the COVID-19 vulnerability?
- What direction of changes over time can be observed in the distribution and concentration of vulnerability risk?
- What decisions can be made based on the result of the spatiotemporal vulnerability map?
The novelty of our approach is the use of spatiotemporal multicriteria analysis for COVID-19 situation vulnerability risk assessment in order to support a quick decision-making process. The solution will be valuable to making decisions on implementing preventive actions in the selected area, especially in the initial period of a pandemic by showing the change of vulnerability risk in the selected area in time. Furthermore, the use of basic data in COVID-19 vulnerability estimation plays a pivotal role by addressing the methodology to the countries where more detailed data are not available.
2. Materials and Methods
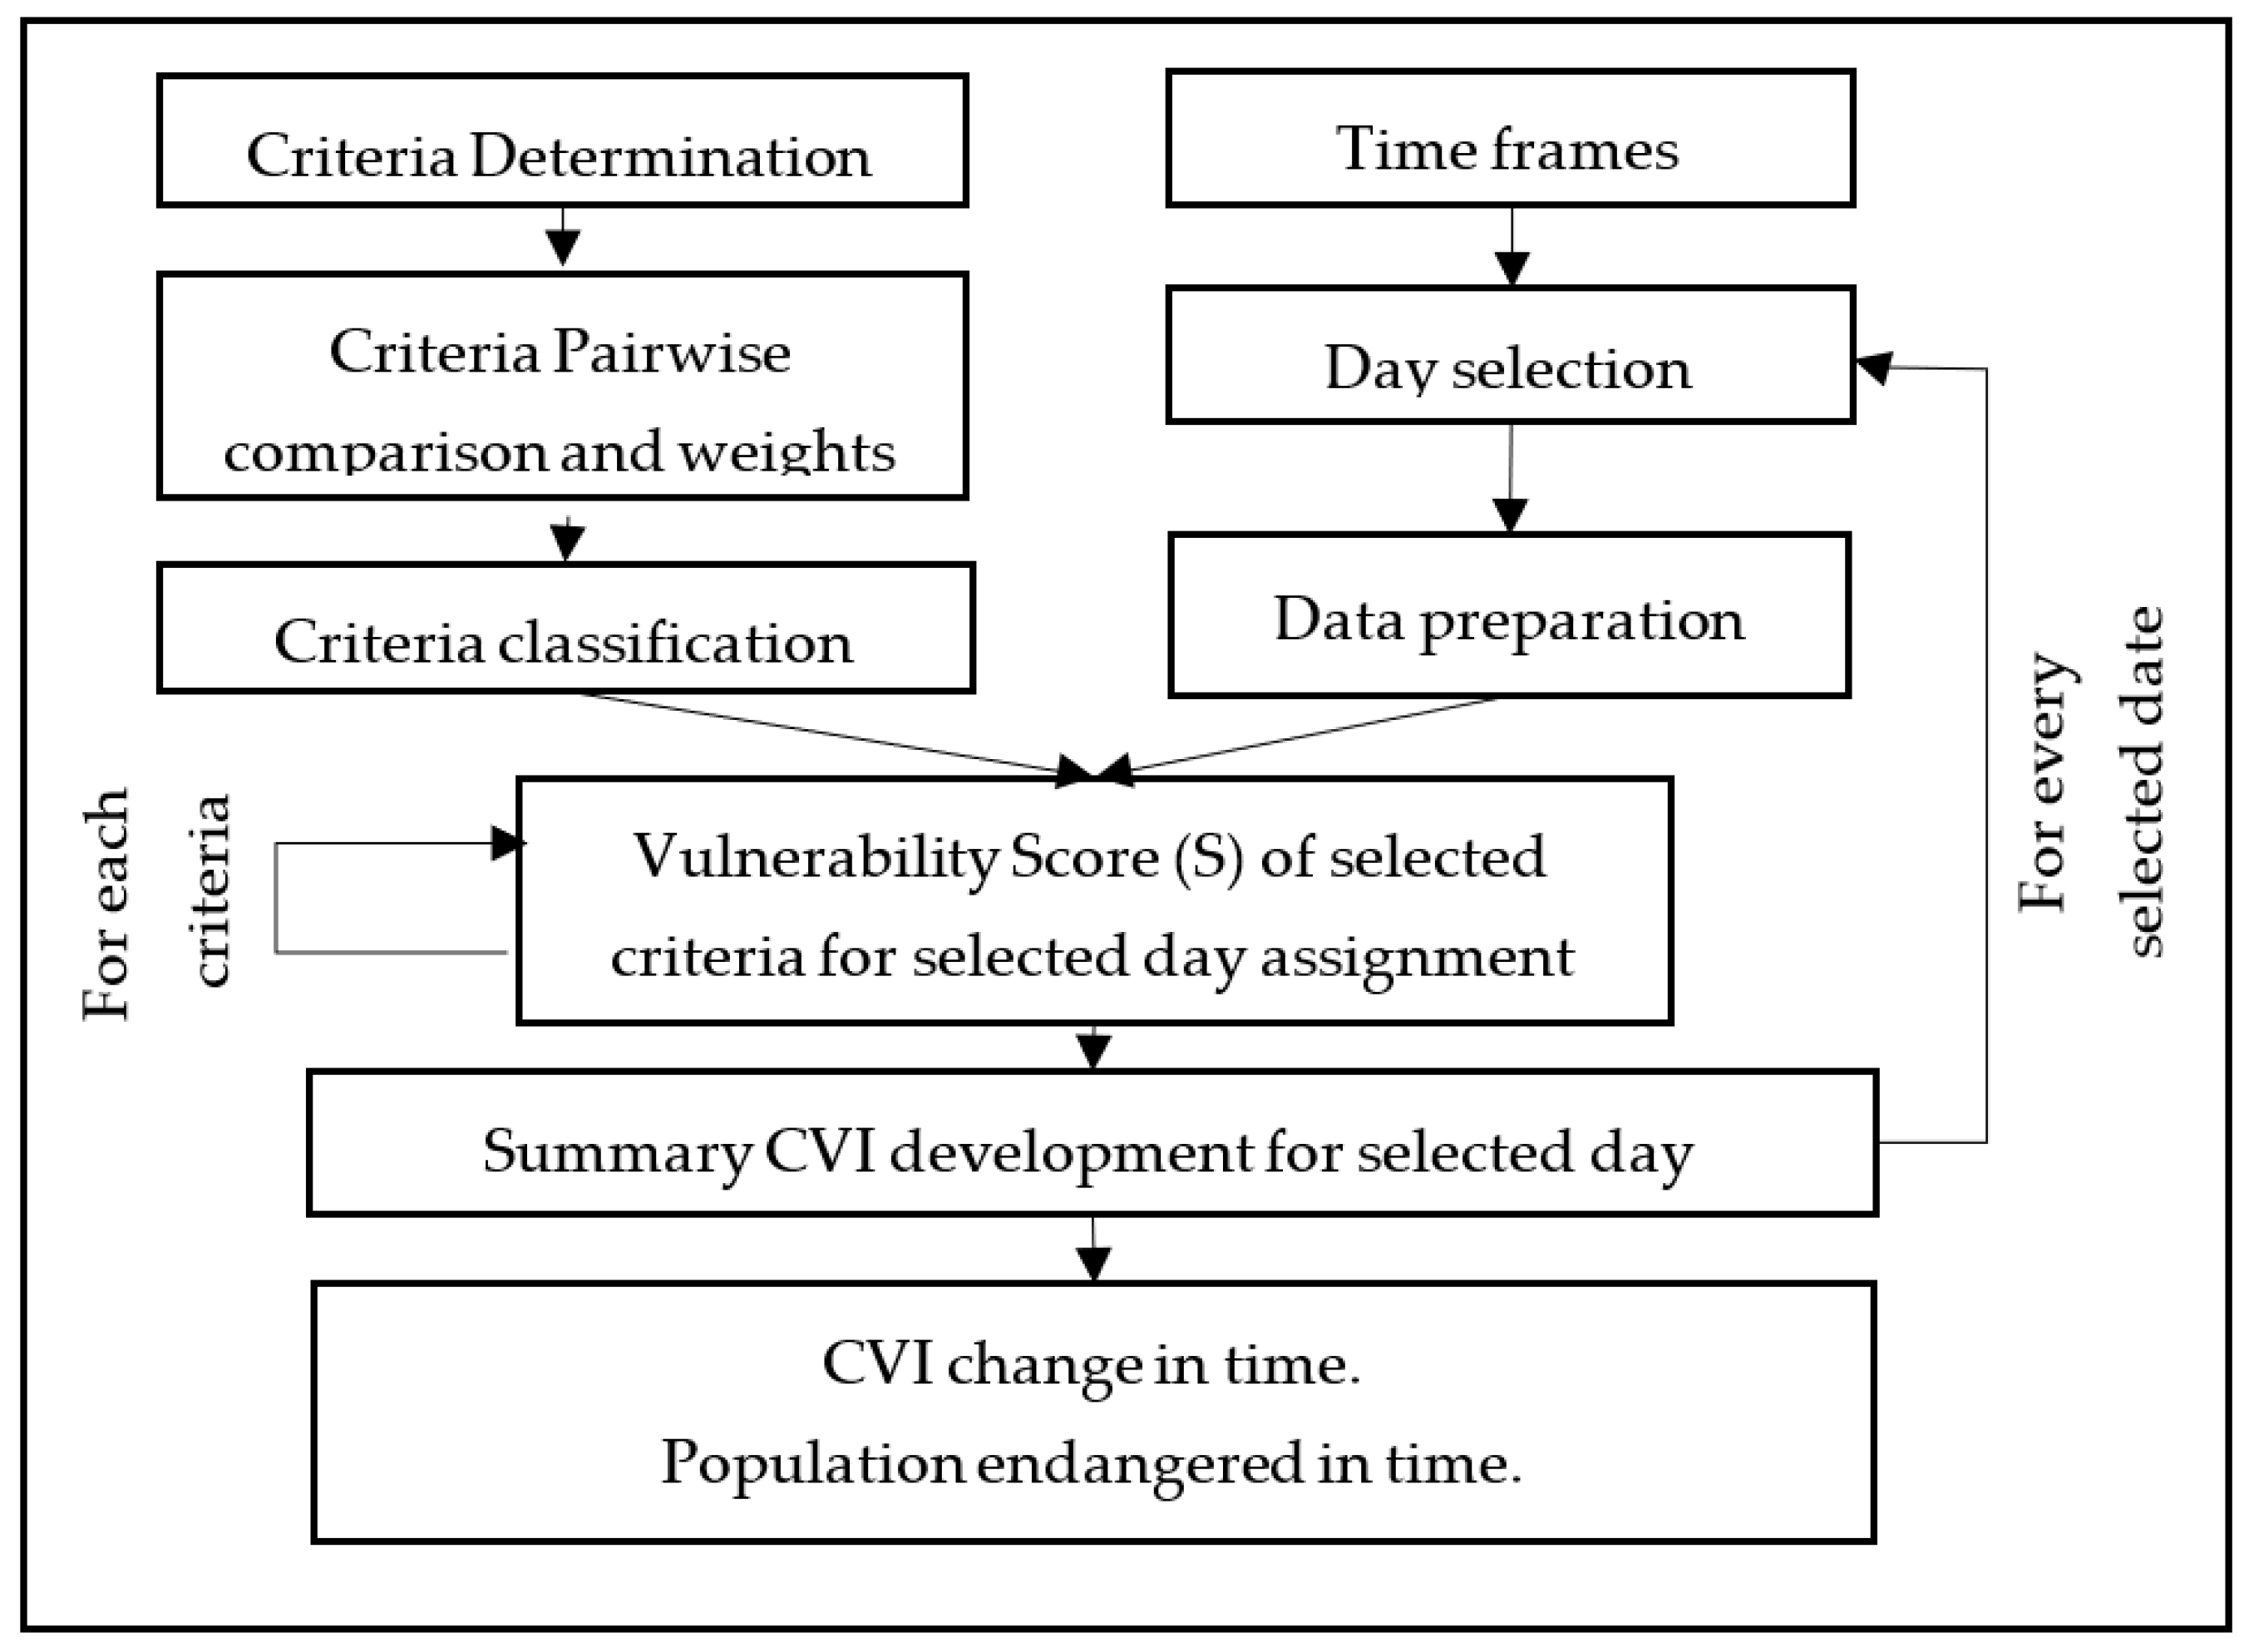
The spatiotemporal analysis approach applied in this research was based on Spatial Multicriteria Analysis (SMCA) with Analytical Hierarchy Process (AHP) for weights calculation described in. The used methodology is presented in Figure 3. The general concept of SMCA was described in [87,88]. In this article, SMCA allows for the determination of COVID-19 Vulnerability risk—defined as a situation where the risk of exposure to the hazard might be increased [89]. The presented approach allows for the estimation of the COVID-19 Vulnerability risk index (CVI) of the selected area and its characteristics over time. The test field of the solution was Germany.
AHP methodology allows for the importance estimation by calculating the weight of selected criteria by means of pairwise comparisons of each evaluation criterion.
The application of the AHP methodology is based on a value-function type and as such requires an estimation of the value function and criterion weights to determine the summary statistics on the selected area as below [87]:
where CVI is COVID-19 Vulnerability Index, Wi is normalized weight, and S is the Vulnerability Score of the area on the selected layer (n) as value function. Value function and weights are obligatory for estimation. The function values in the paper case study were determined by calculation based on the available dataset. The weights were estimated by pairwise comparisons of each evaluation criteria. This determines the relationship strength between the criteria, that was used to rank selected criteria based to the [90].
In this paper CVI calculations were extended by authors with the spatiotemporal analysis to show CVI change in time as follows:
where is the change in time for summary COVID-19 Vulnerability Index for three months’ interval.
Furthermore, based on the value of CVI on the selected area the population number endangered with a certain level of vulnerability in time was estimated. This was performed with the use of GIS systems.
The results validation consists of comparing the values of CVI with new cases over time and this is followed with the calculation of the value of the R-squared, to show the proportion of the variance for confirmed COVID-19 cases and CVI index as dependent variables.
Criteria and Weights
Based on the literature review it was assumed that the criteria needed to determine the CVI were basic country demographic statistics listed in Table 1.
This simple set of criteria enables the implementation of the COVID-19 vulnerability risk assessment algorithm by all, even less advanced countries if needed. The research was based on several open data sources, such as web services that present demographic statistics: destatis.de [91] and the Robert Koch Institute Site [92], were used. Furthermore, to estimate the information on the transport network, selected data from OpenStreetMap were acquired and analysed. [93]. The case study area was limited to Germany, and the analyses were divided by regions.
The listed criteria presented in Table 1 can be grouped into two categories: dynamic (quickly changing in time) and static (slowly changing in time or static).
The criteria determination process was followed by the pairwise comparison that resulted in the importance determination (in accordance with the AHP methodology). The importance of relations can be found in Table 2. The larger the relative importance values were, the stronger the relation that can be assigned to the pair of criteria.
The methodology was used to select and compare the criteria. Pairwise comparisons resulted in the estimation of weights that are presented in Table 3. Validation of calculated weights returns Consistency Ratio (CR), which was 0.10; Consistency Index (CI) 0.15. According to the weights listed in the table, the greatest importance can be assigned to the following criteria: Hos, Hbed, Cas, PDen, Hsp.
Analysis of results in the static and dynamic groups show that the static criteria affected the CVI estimation twice as strongly as the dynamic criteria (static sum weights: 0.66; dynamic sum weights: 0.34).
To calculate the CVI of the region, the criteria vulnerability score was determined based on the categories in Table 4 (the remaining criteria risk score available in Appendix A). The assigned vulnerability score (VSc) takes values in the range from 2 to 8. The high score represents a high vulnerability in the term of the relevant criterion. For example, density—greater than 2000 people per sq. km—corresponds to the vulnerability value of 8.
3. Results and Discussion
3.1. Vulnerability Score Value Analysis for Individual Criteria
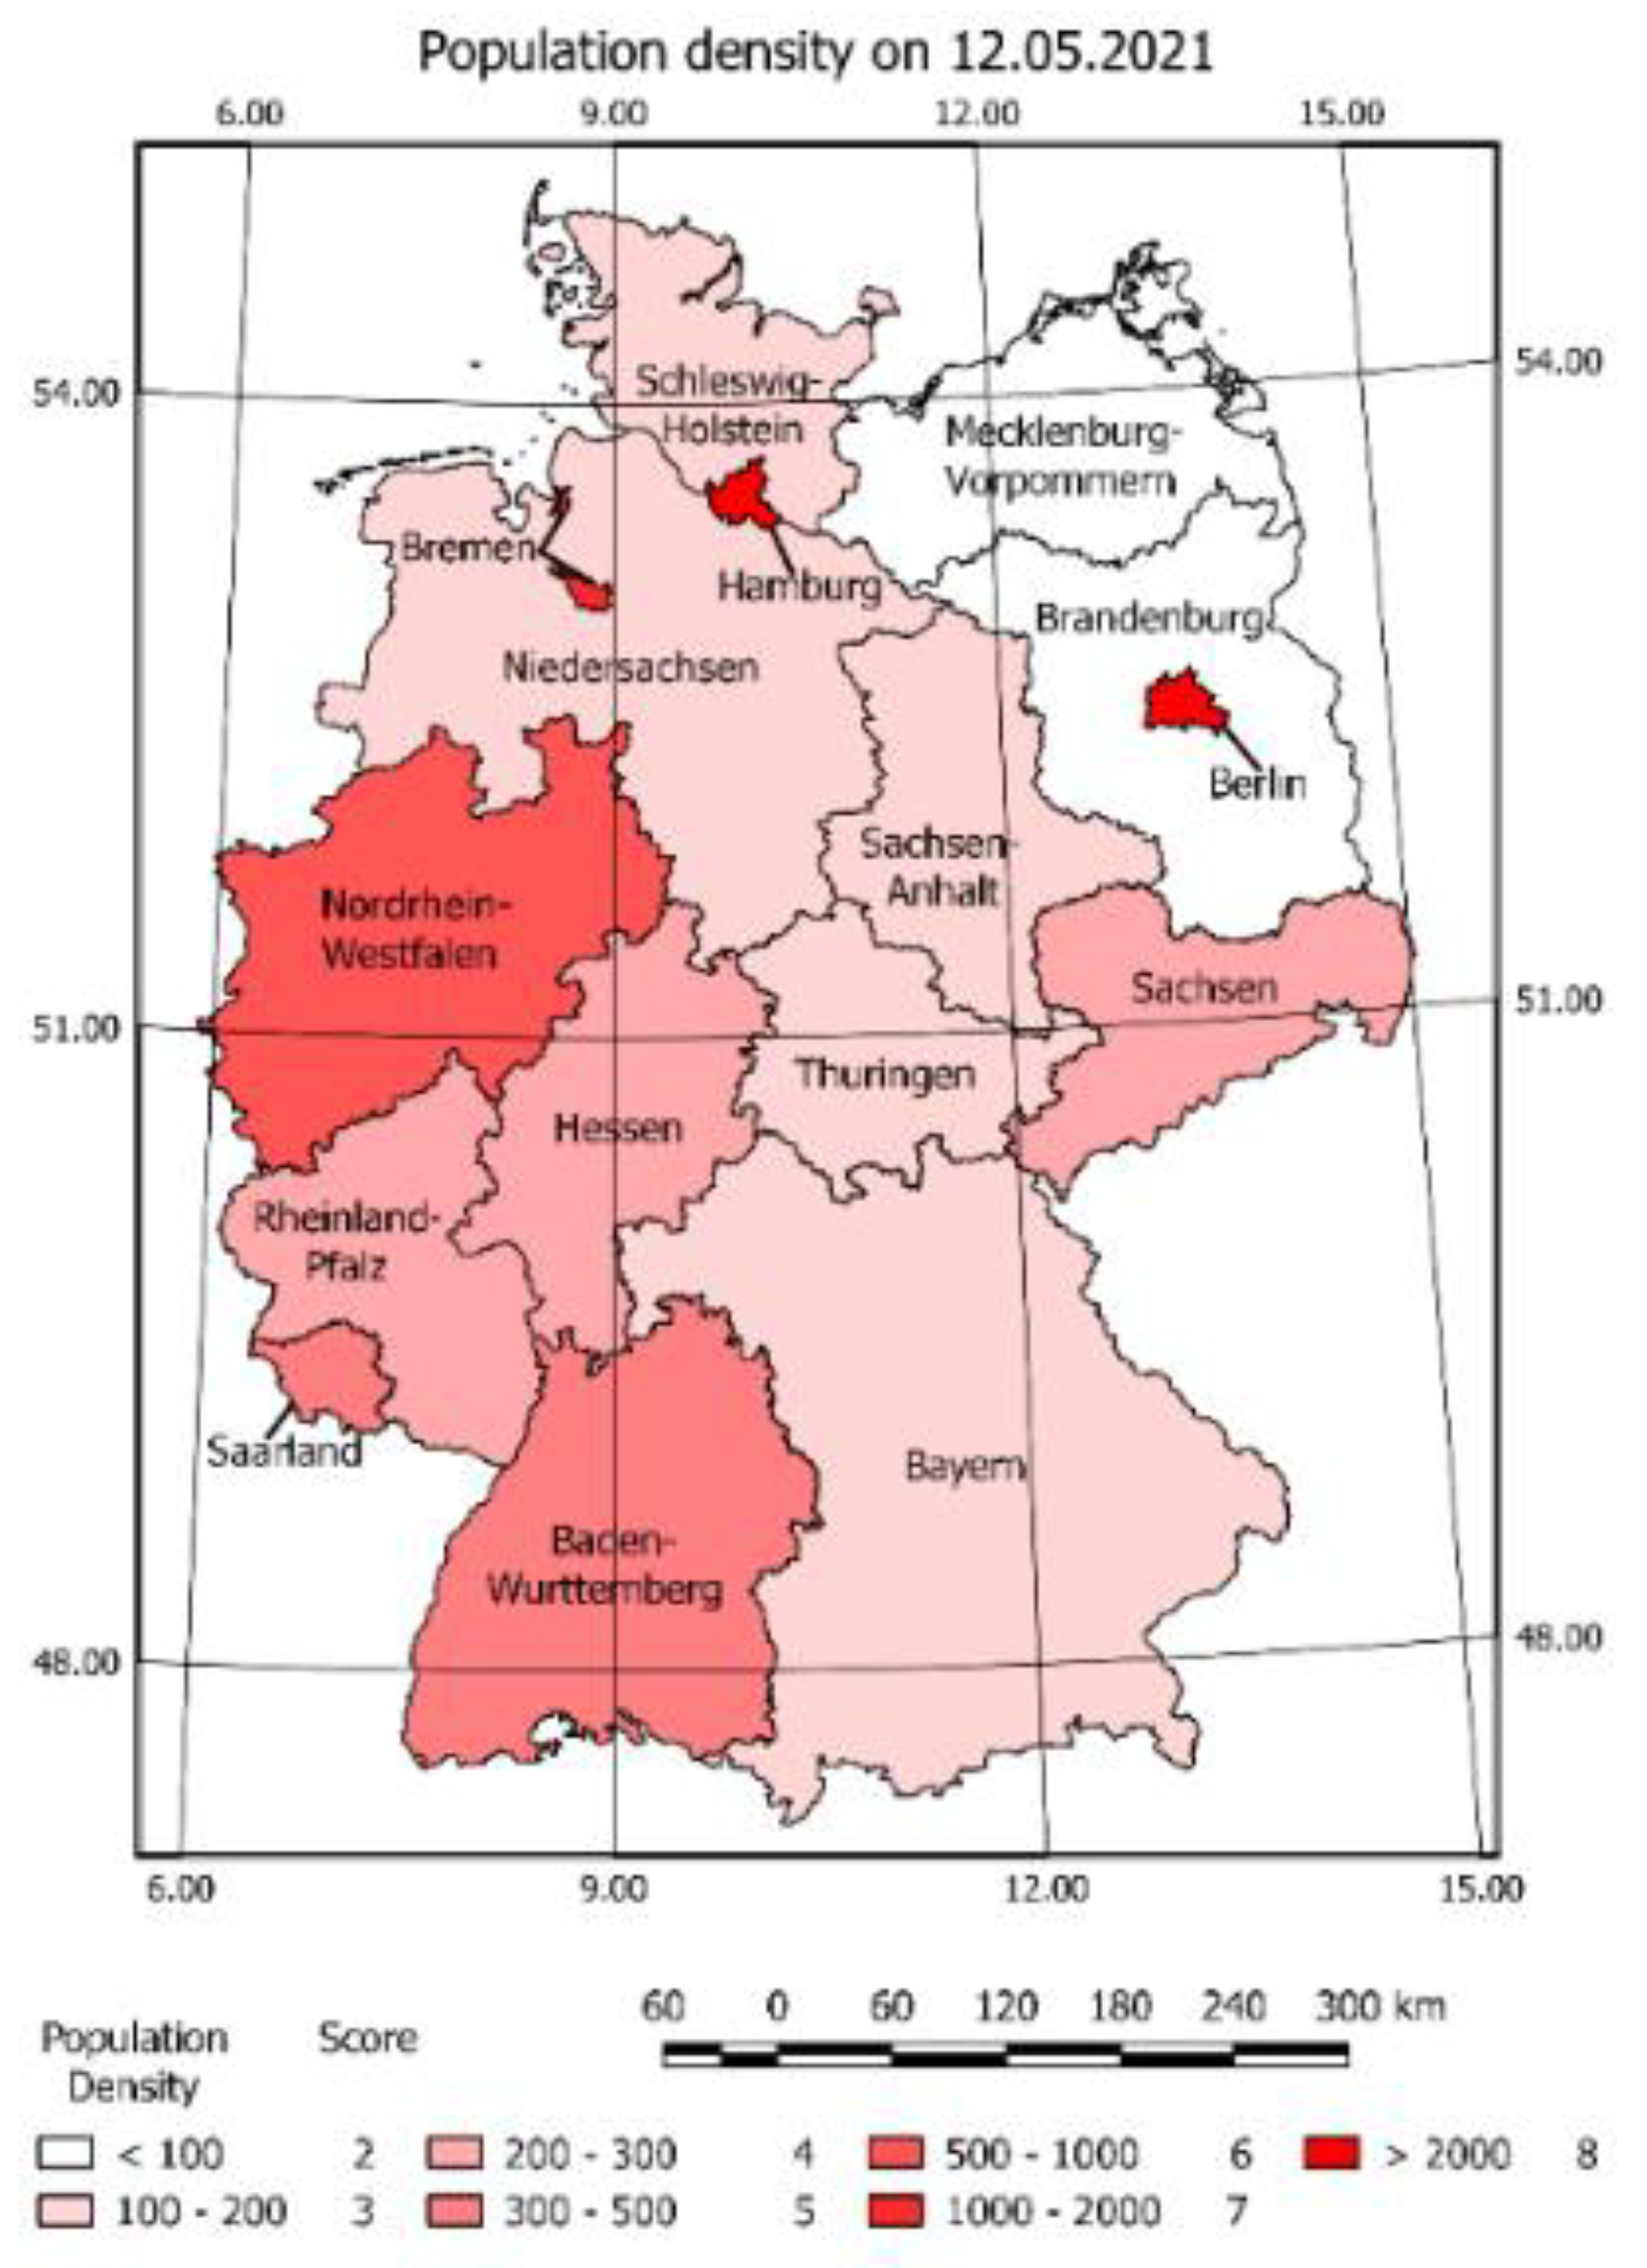
For each criterion, the VSc values were estimated. Next, the VSc map was developed as a choropleth map. The example map is presented in Figure 4.
The map shows the information on a selected day (12 May 2021) and gives the representative vulnerability level in accordance with the selected criteria score related to COVID-19 pandemic and its spatial location.
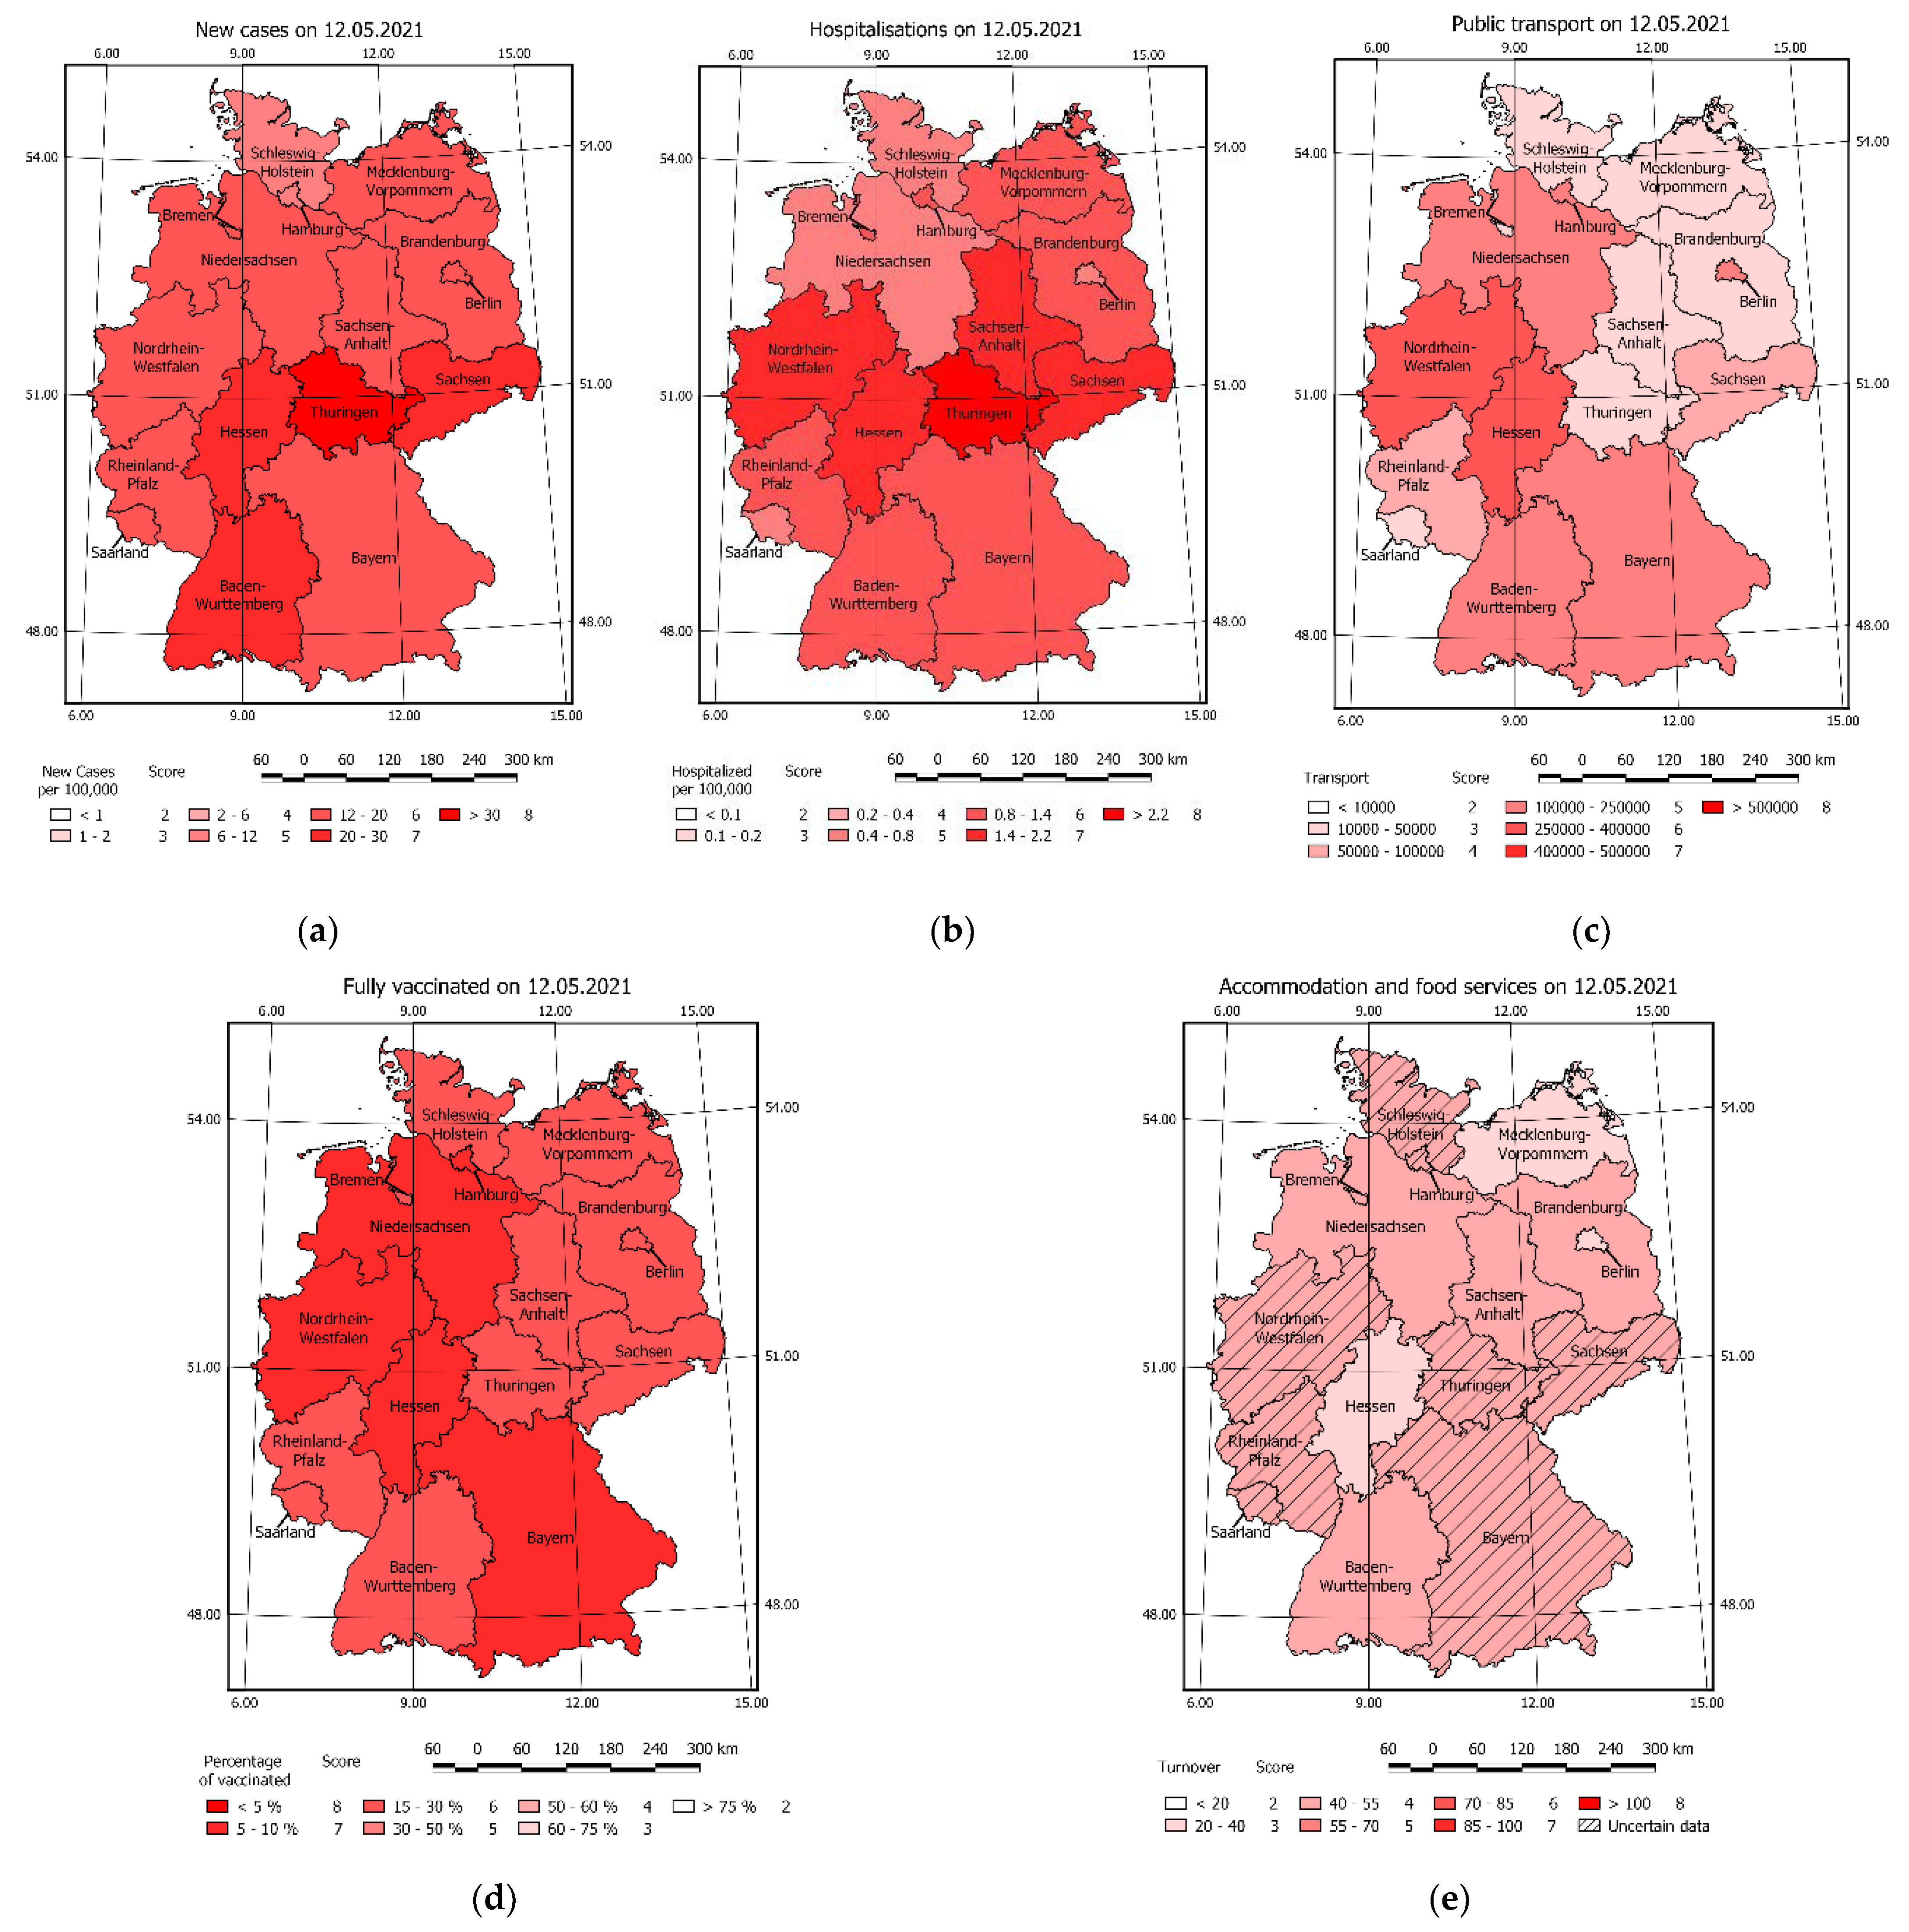
The intensive colours represent large numbers of density and correspond to the high COVID-19 VSc. The light colours represent low populated areas and correspond to a low score of vulnerability for selected criteria. High value can be noticed in Hamburg, Bremen, and Brandenburg. The population density criteria generate vulnerability risk that is constant in time for each region. A similar effect of constant vulnerability can be observed for all static criteria. VSc values of individual criteria can be found in Figure 5 and Figure 6.
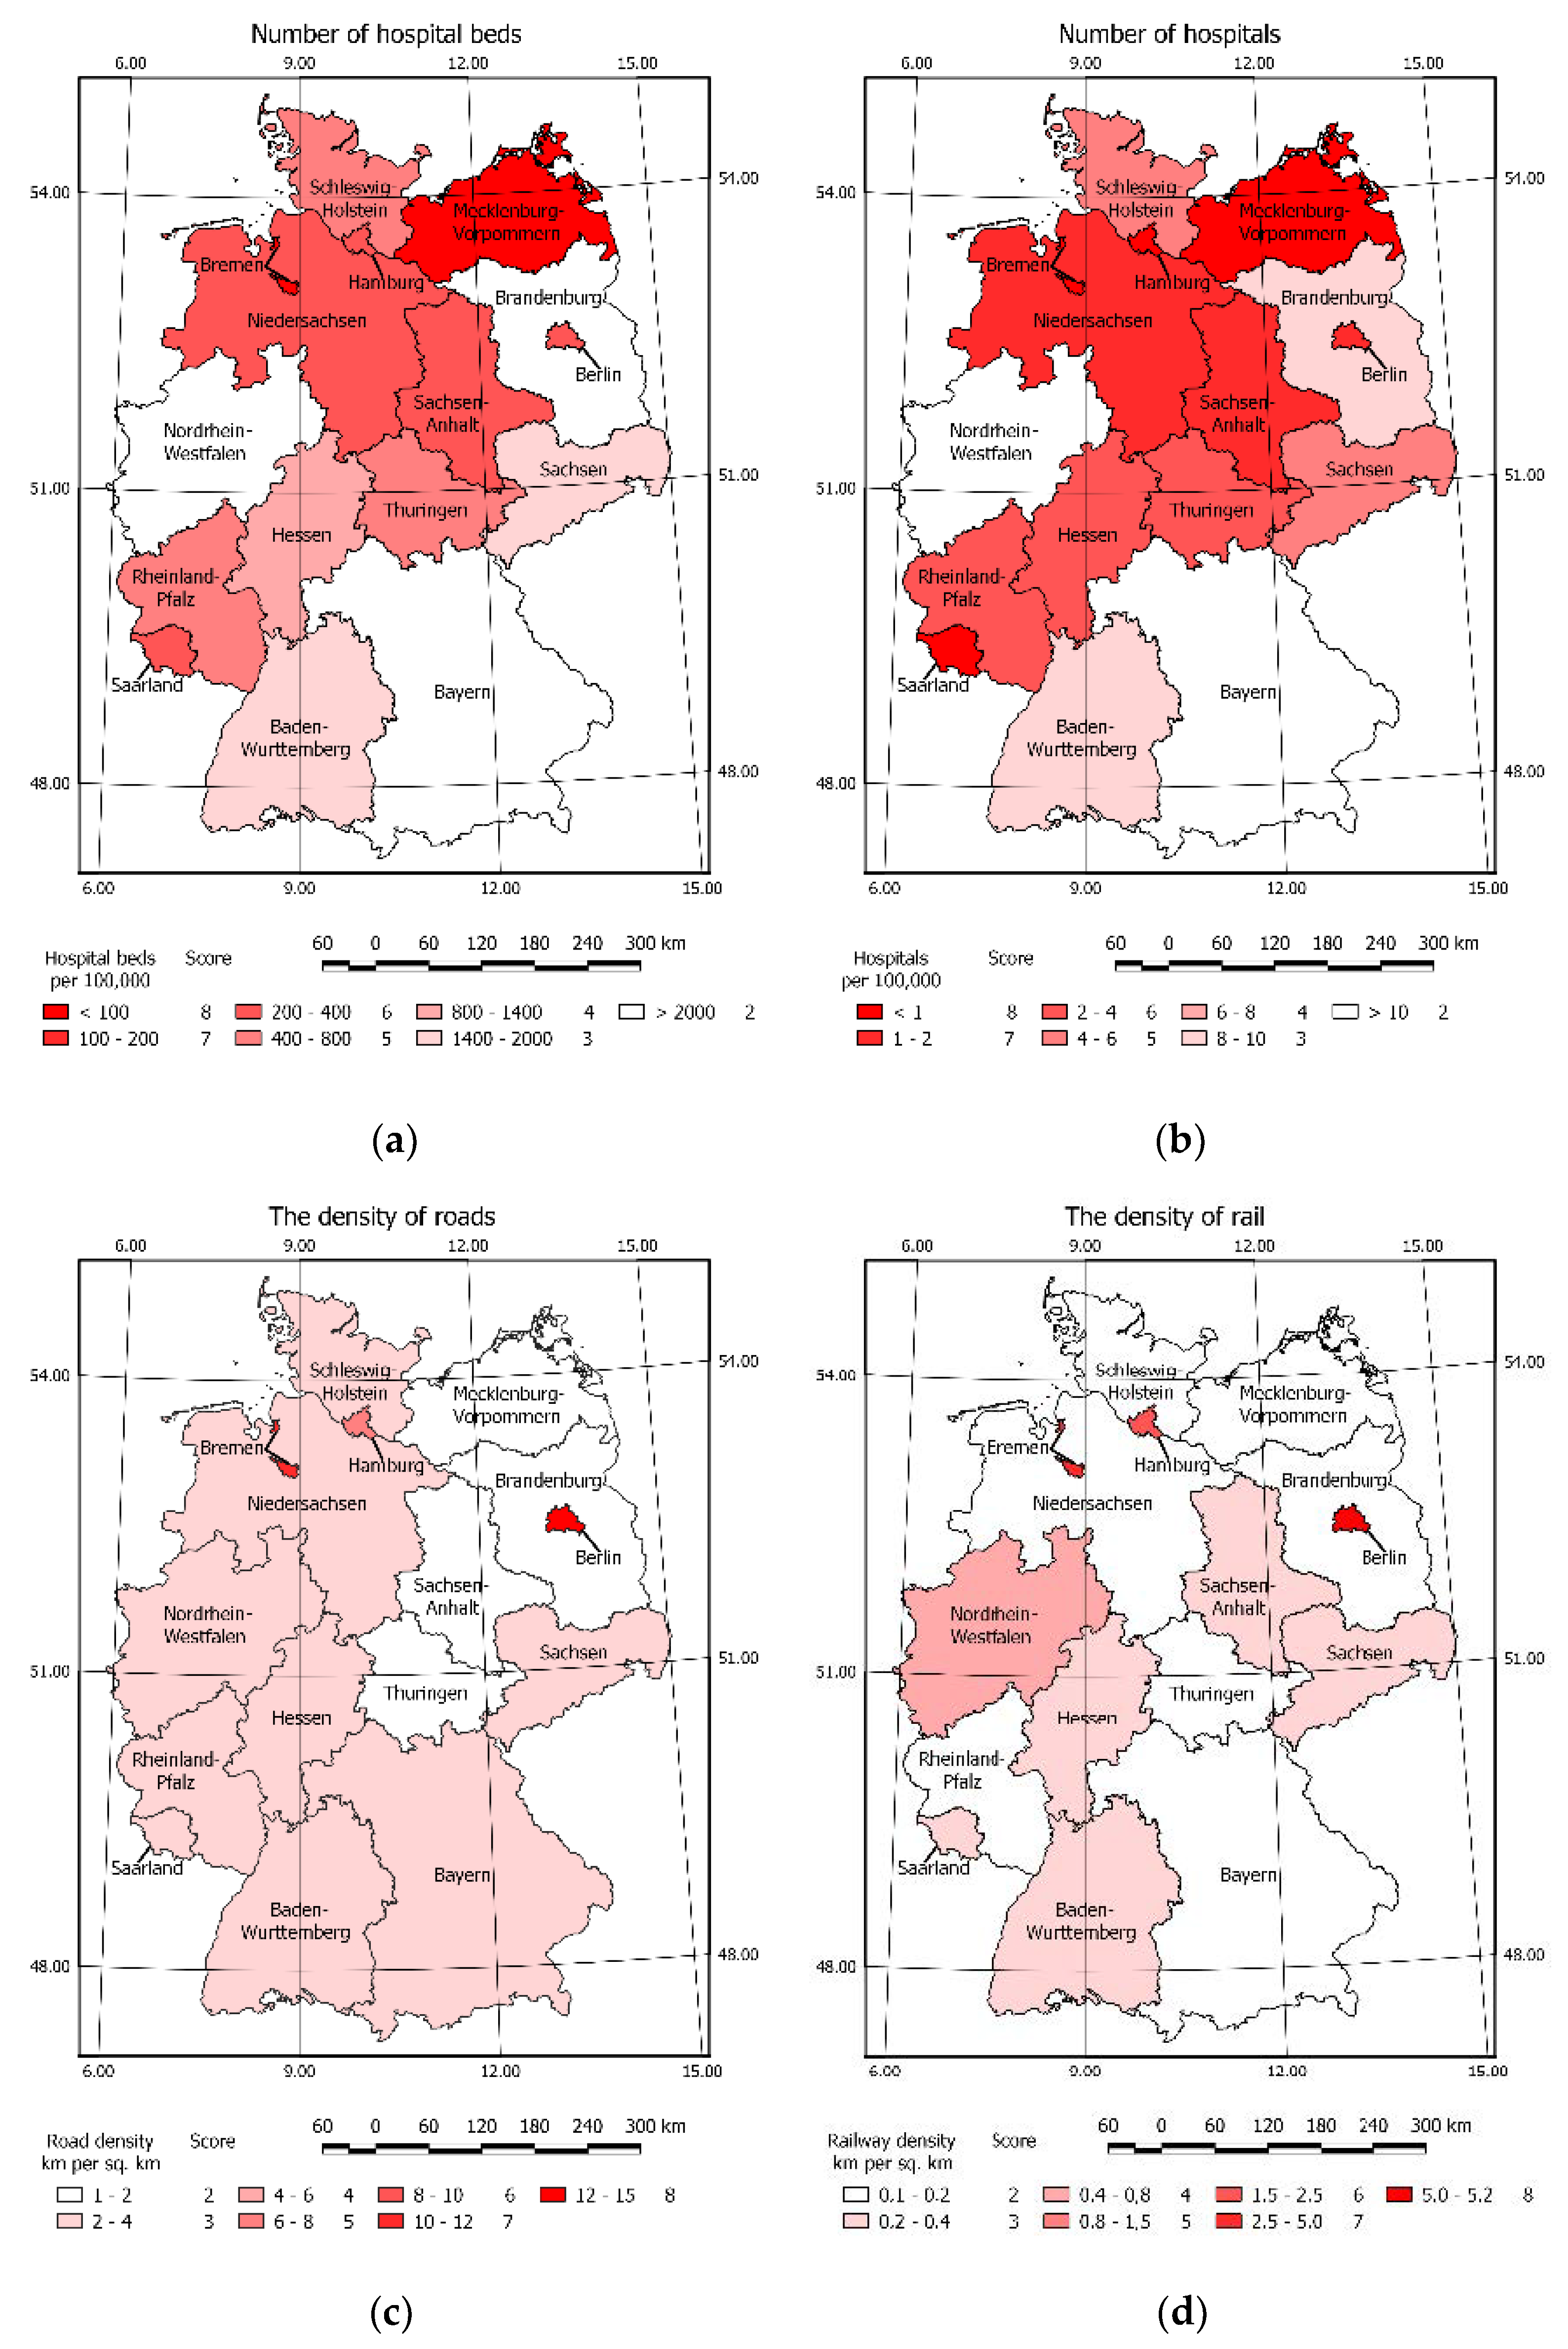
All maps present various VSc. The highest score value of criteria in summary for all regions can be assigned to the numbers of hospitalisations and new cases, the lowest to the railway and road density.
Areas marked with the highest score values may generate potential COVID-19 vulnerability risk so the preventive actions should be there considered.
3.2. COVID-19 Vulnerability Index Analysis
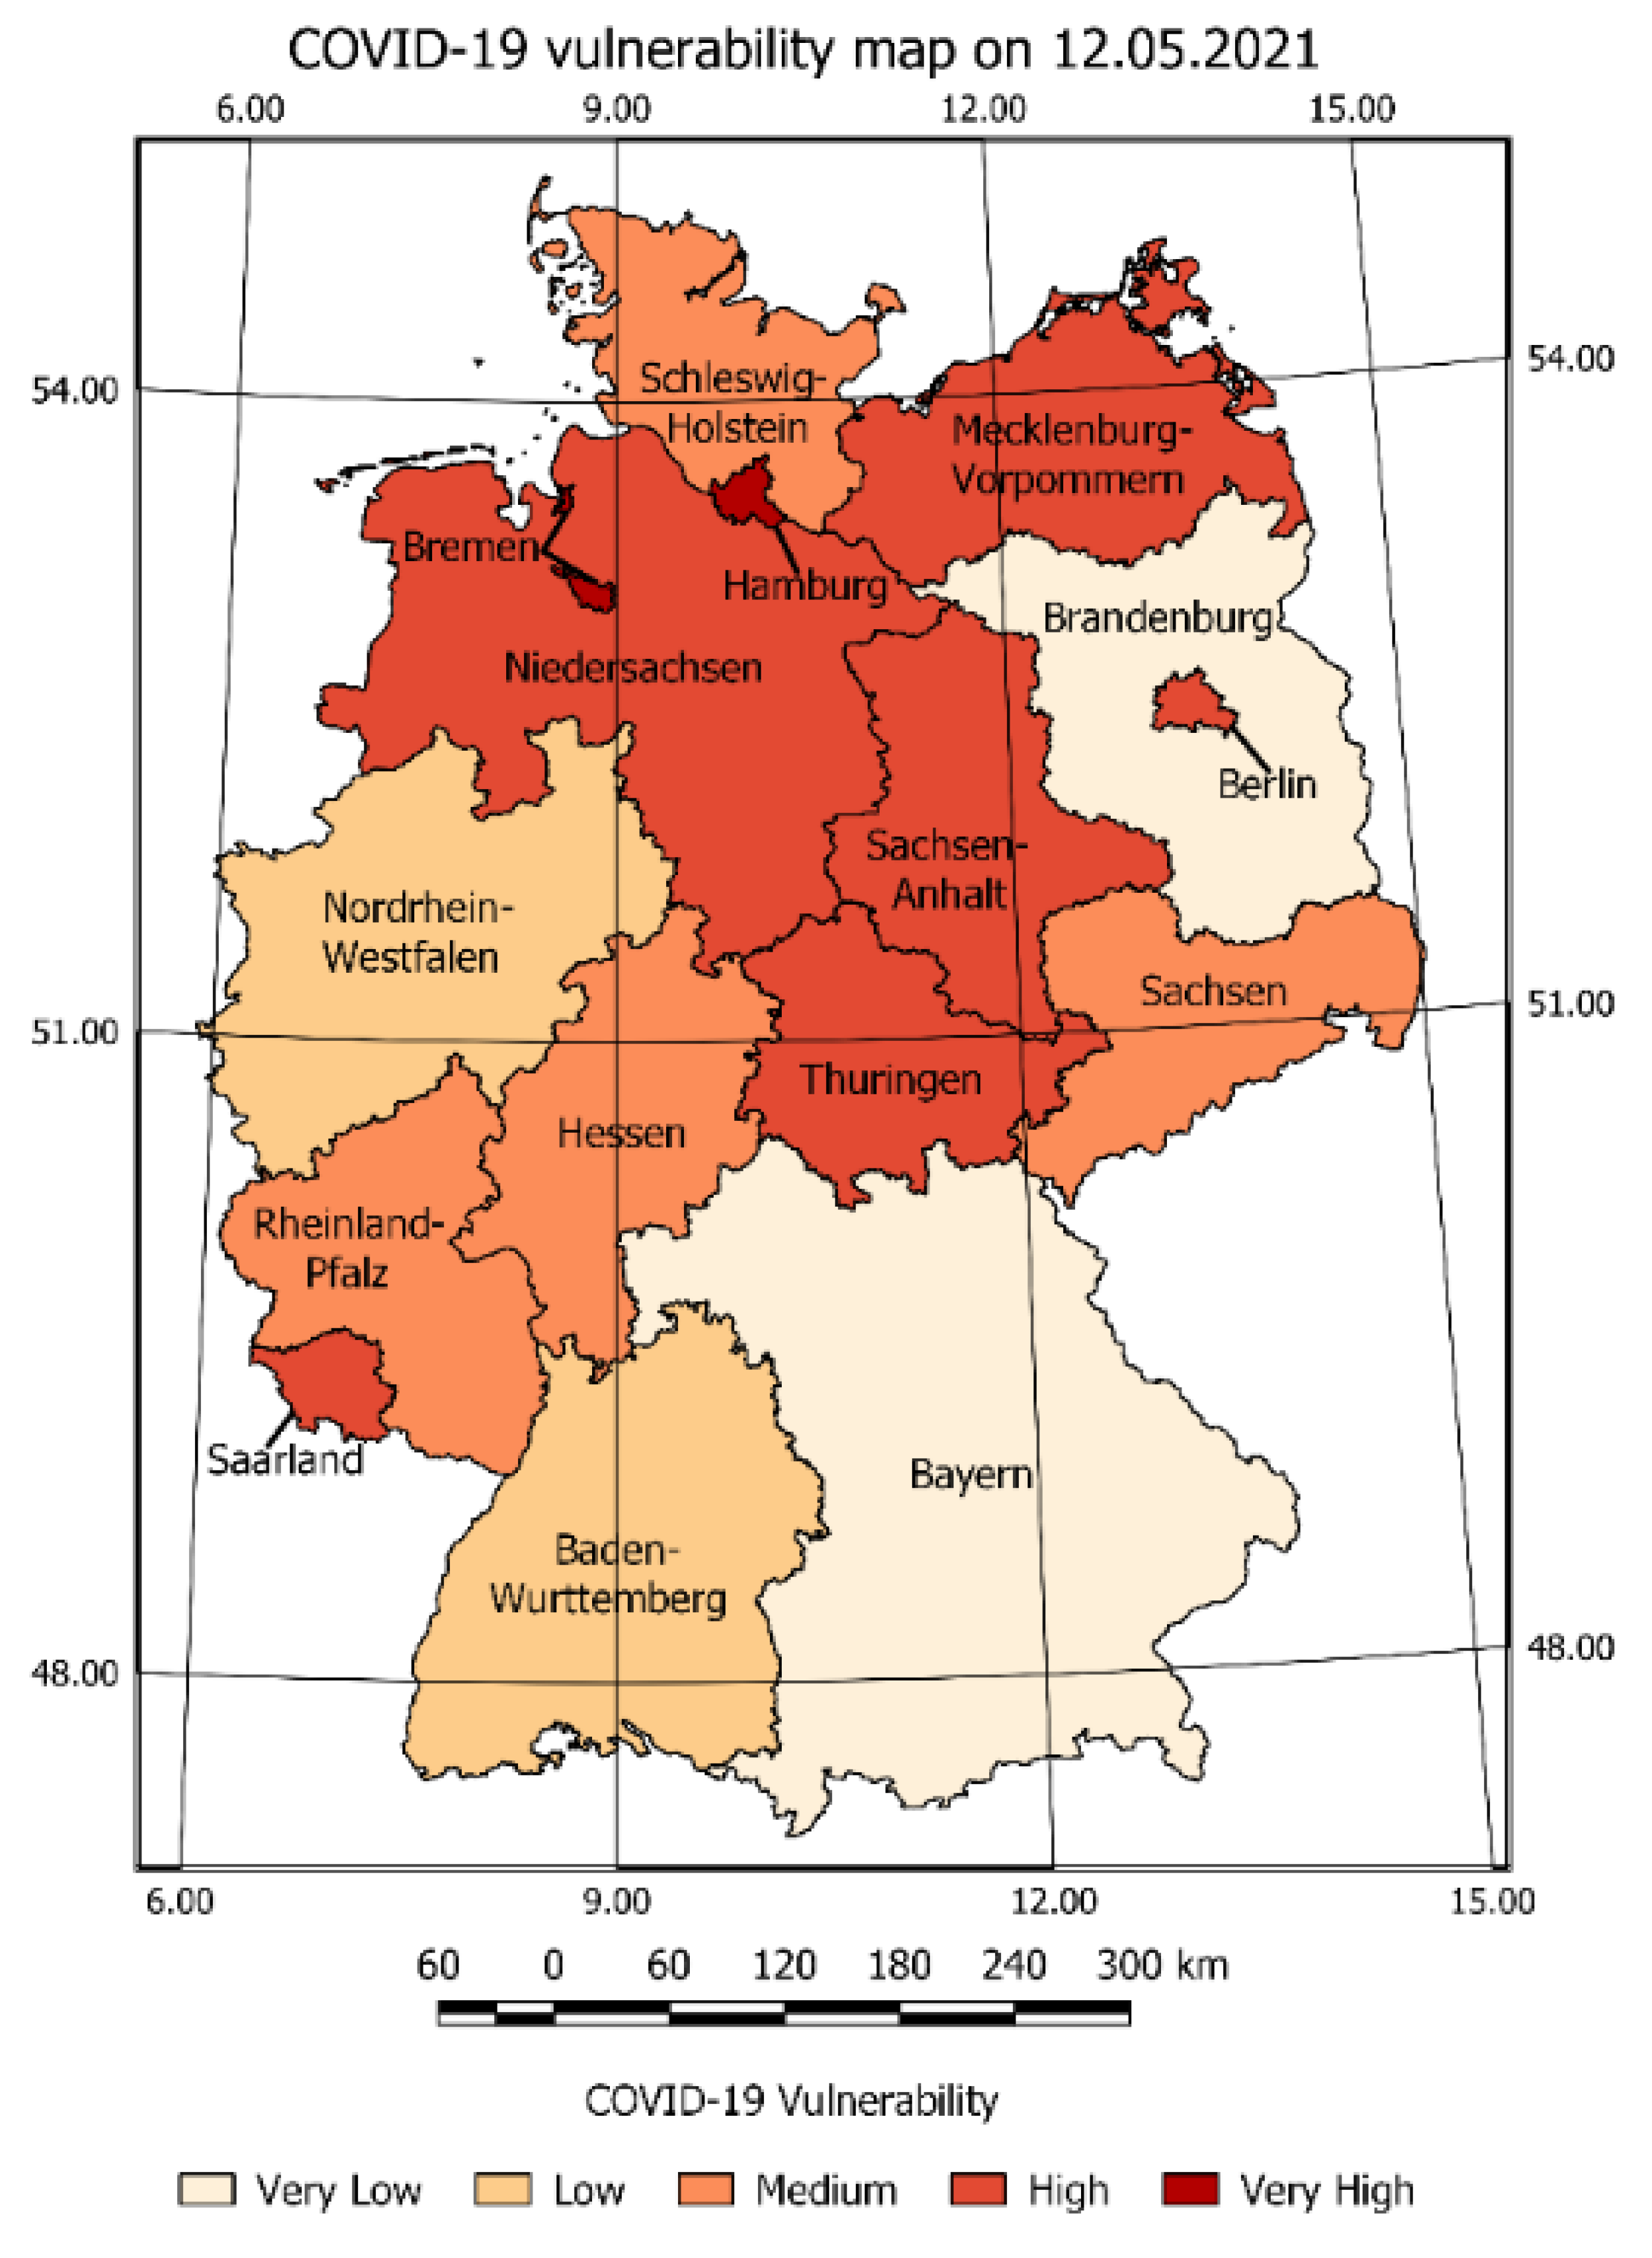
The CVI was a result of summaries of the vulnerability values for each criterion multiplied by their weight. The CVI map in Figure 7 presents the various risks classified into five categories from very low to very high. The highest CVI occurs e.g., in the Hamburg, Bremen, Niedersachsen Mecklenburg-Vorpommern, Berlin, Brandenburg. Bayern and Nordrhein-Westfalen were classified as low CVI. The low value of CVI resulted from the summary weighted VSc of criteria.
Considering the example of Bayern, high VSc values of: new cases, number of hospitals, and number of hospitalisations should result in a high vulnerability risk value; instead the vulnerability of: population density, service turnover, number of vaccinated people, railways, and road lengths caused the occurrence of a low CVI.
The presented CVI analysis may be used in the crisis management process to determine if certain actions (restrictions) have to be taken to prevent further spread of the COVID-19 pandemic. The developed vulnerability risk map allows for measurable assessment of the current situation and determining the risk state of a selected day. The above statements were crucial for research, because the presentation of data on a selected day validates the possibility of the SMCA application in the development of a vulnerability map sequence on selected days and vulnerability change maps over time.
3.3. Criteria Vulnerability Score Analysis in Time
The estimated Vulnerability Score for selected days was presented as a sequence of VSc maps. The example of a selected Vulnerability Score for criteria map on selected days with a three-month interval is shown in Figure 8, Figure 9 and Figure 11. (The number of maps was limited—the remaining maps are provided in Appendix B).
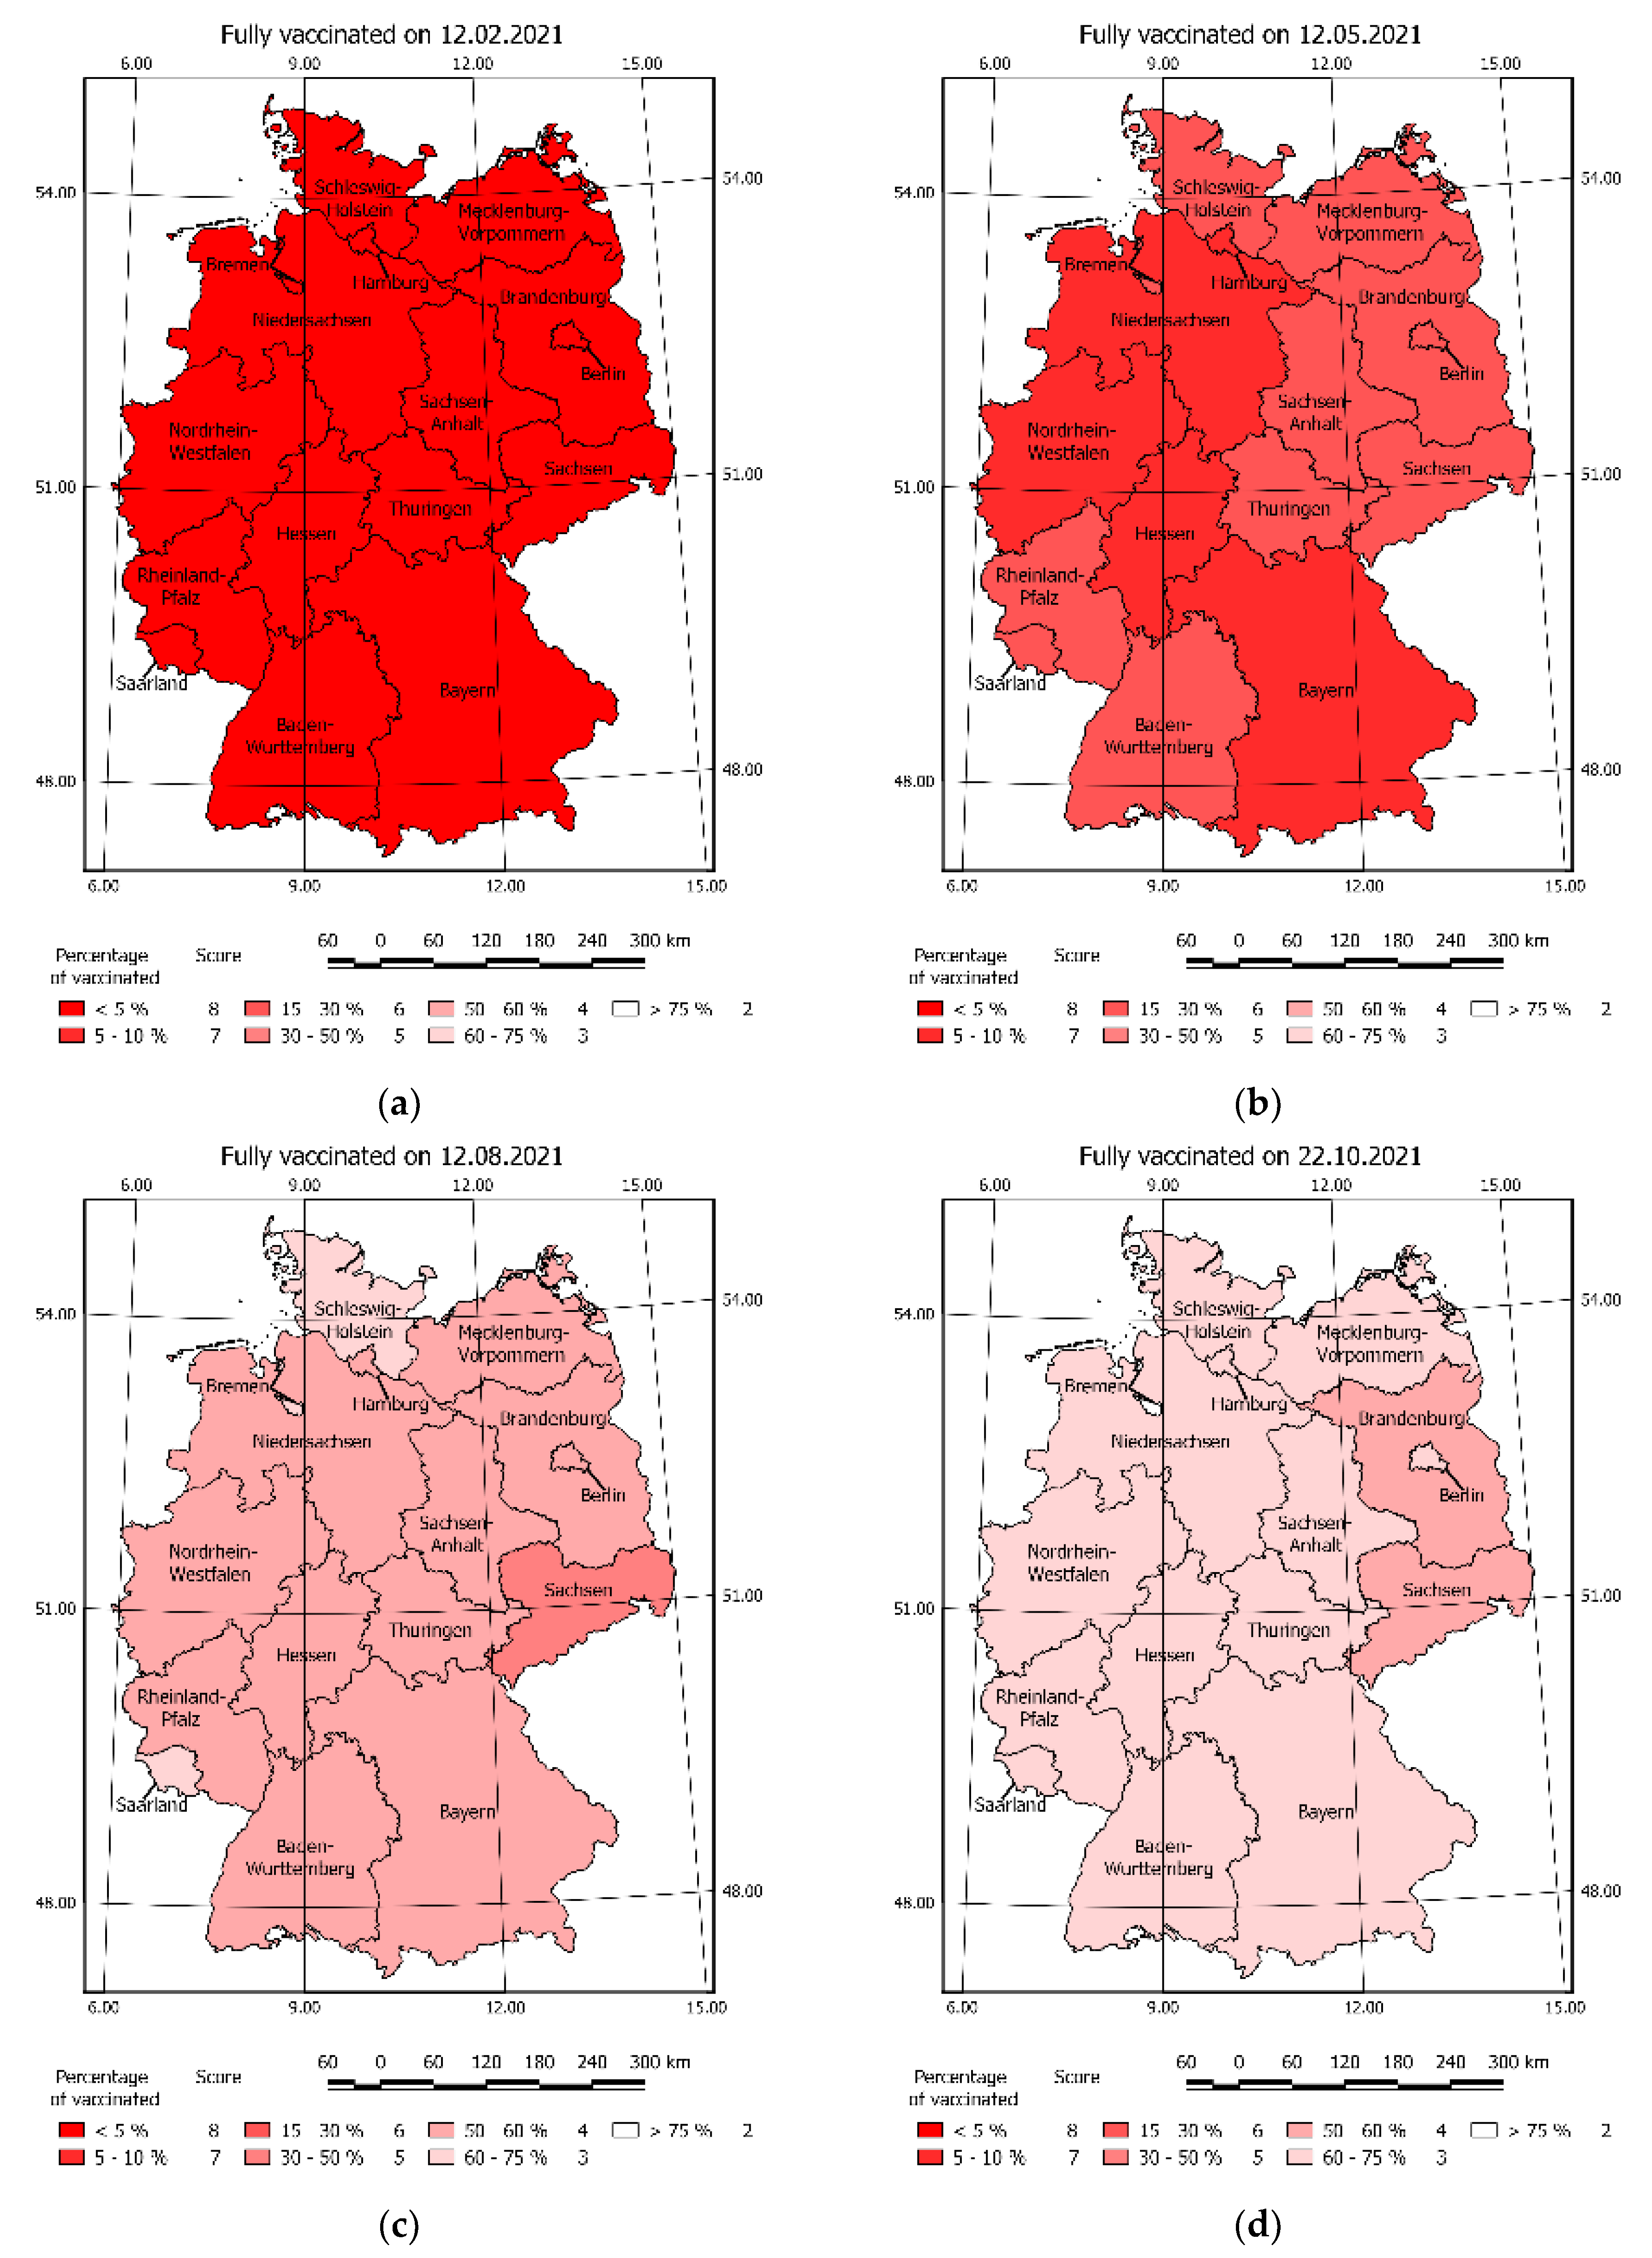
Figure 8 presents the vaccinations vulnerability on selected days. The increase of vaccinated people decreased the risk score. The process of vaccinations began in 2021—all maps before 12 February 2021 present a constant vulnerability risk valued by eight.
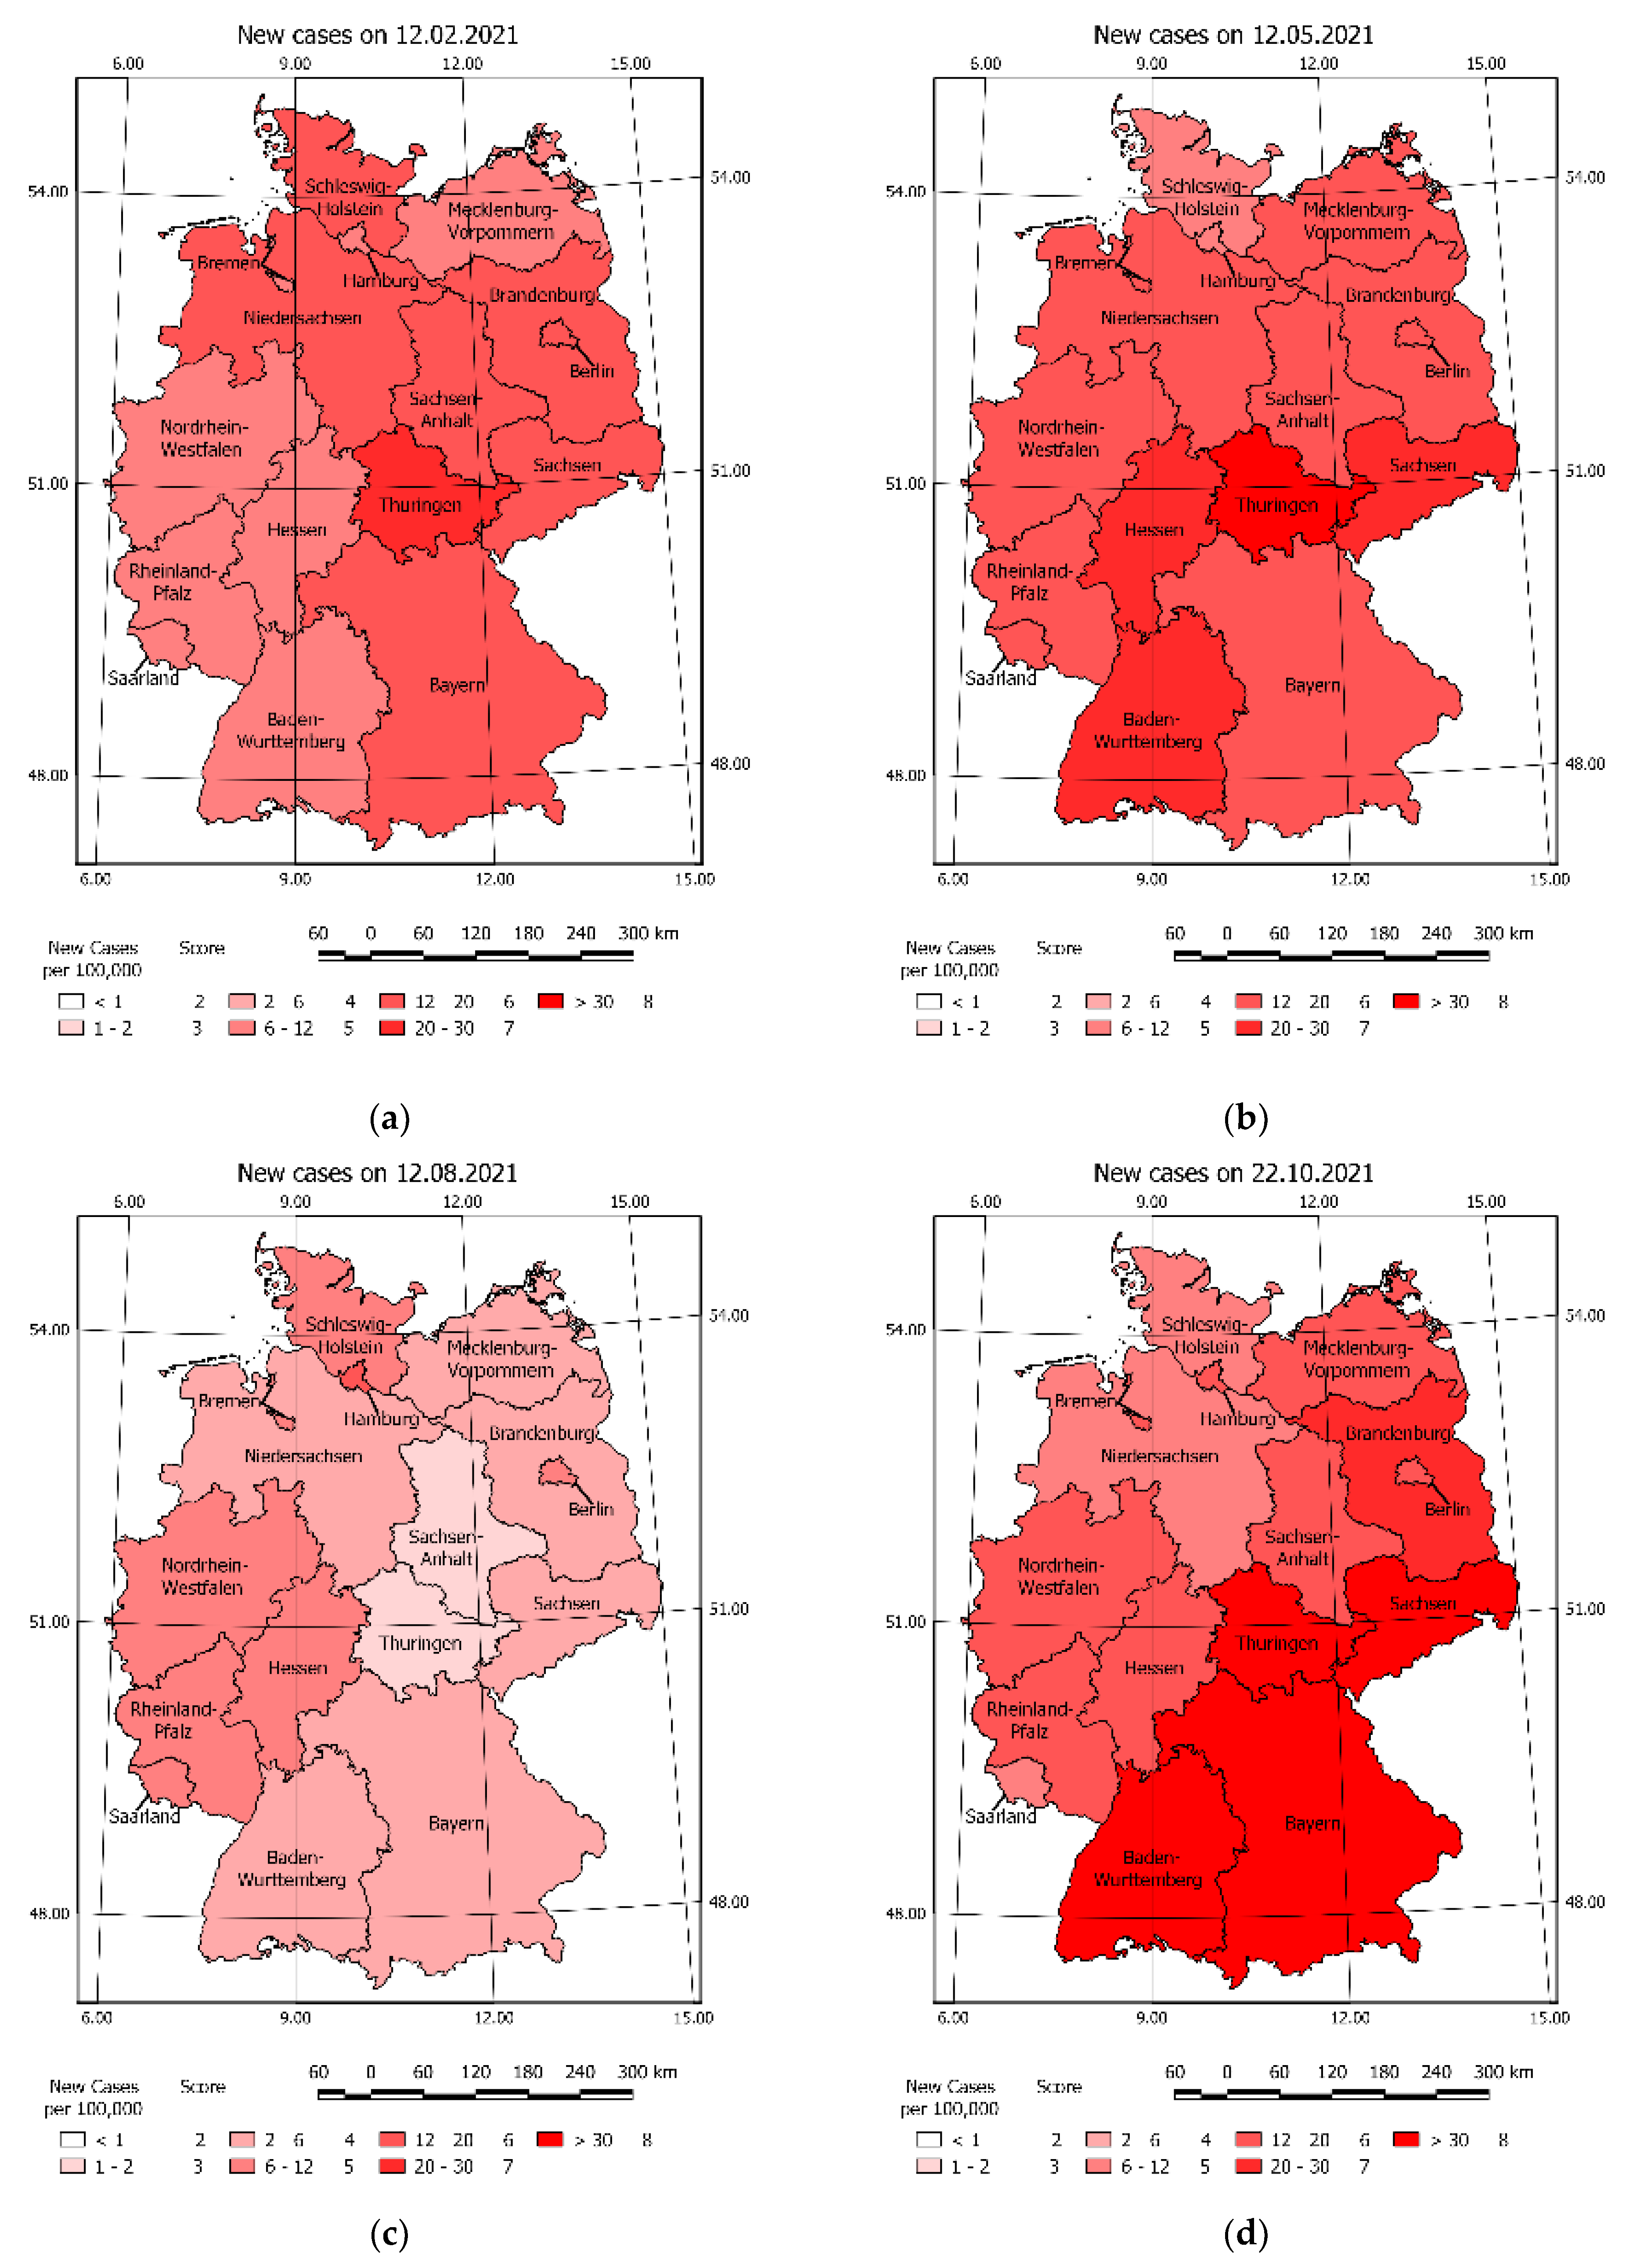
Figure 9 shows vulnerability risk resulting in new cases on selected days of the COVID-19 pandemic.
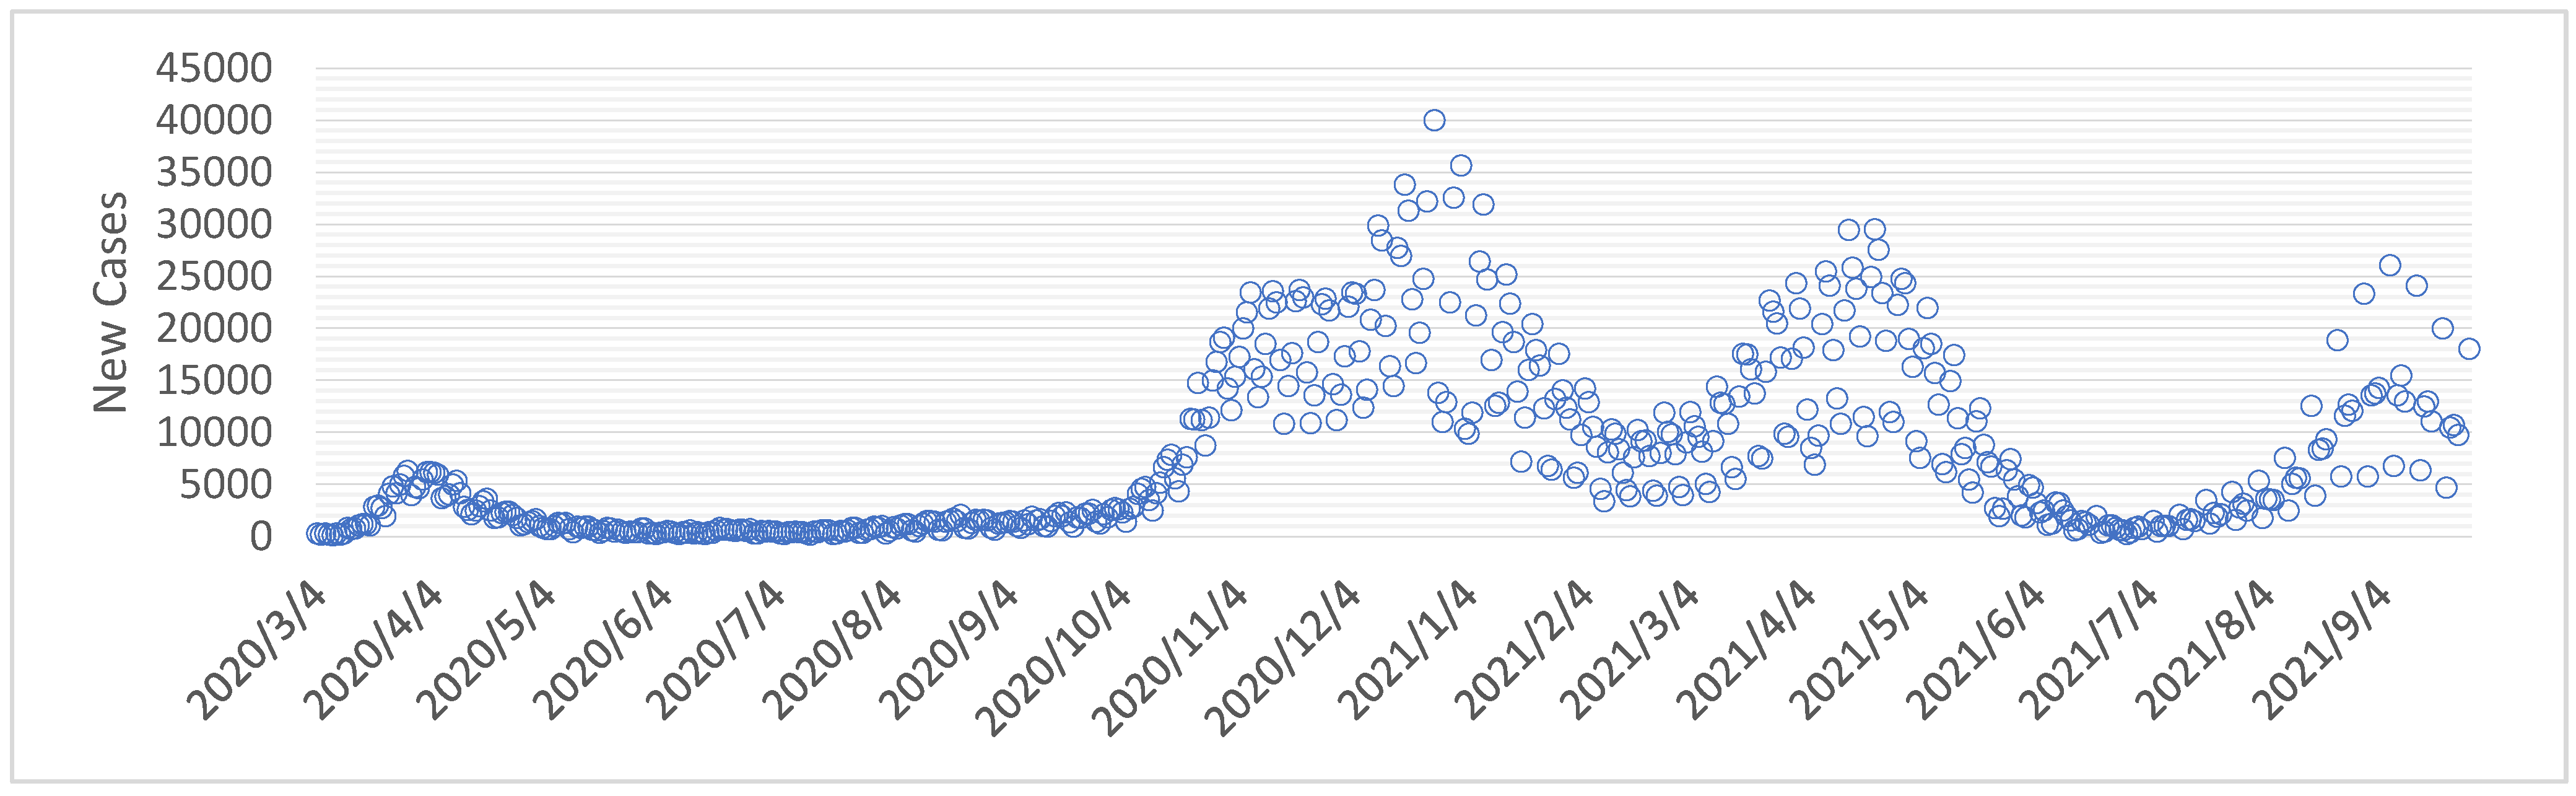
A gradual increase in new cases is noticeable over time. This was confirmed by the chart of new cases according to the data acquired from the Koch Institute (Figure 10).
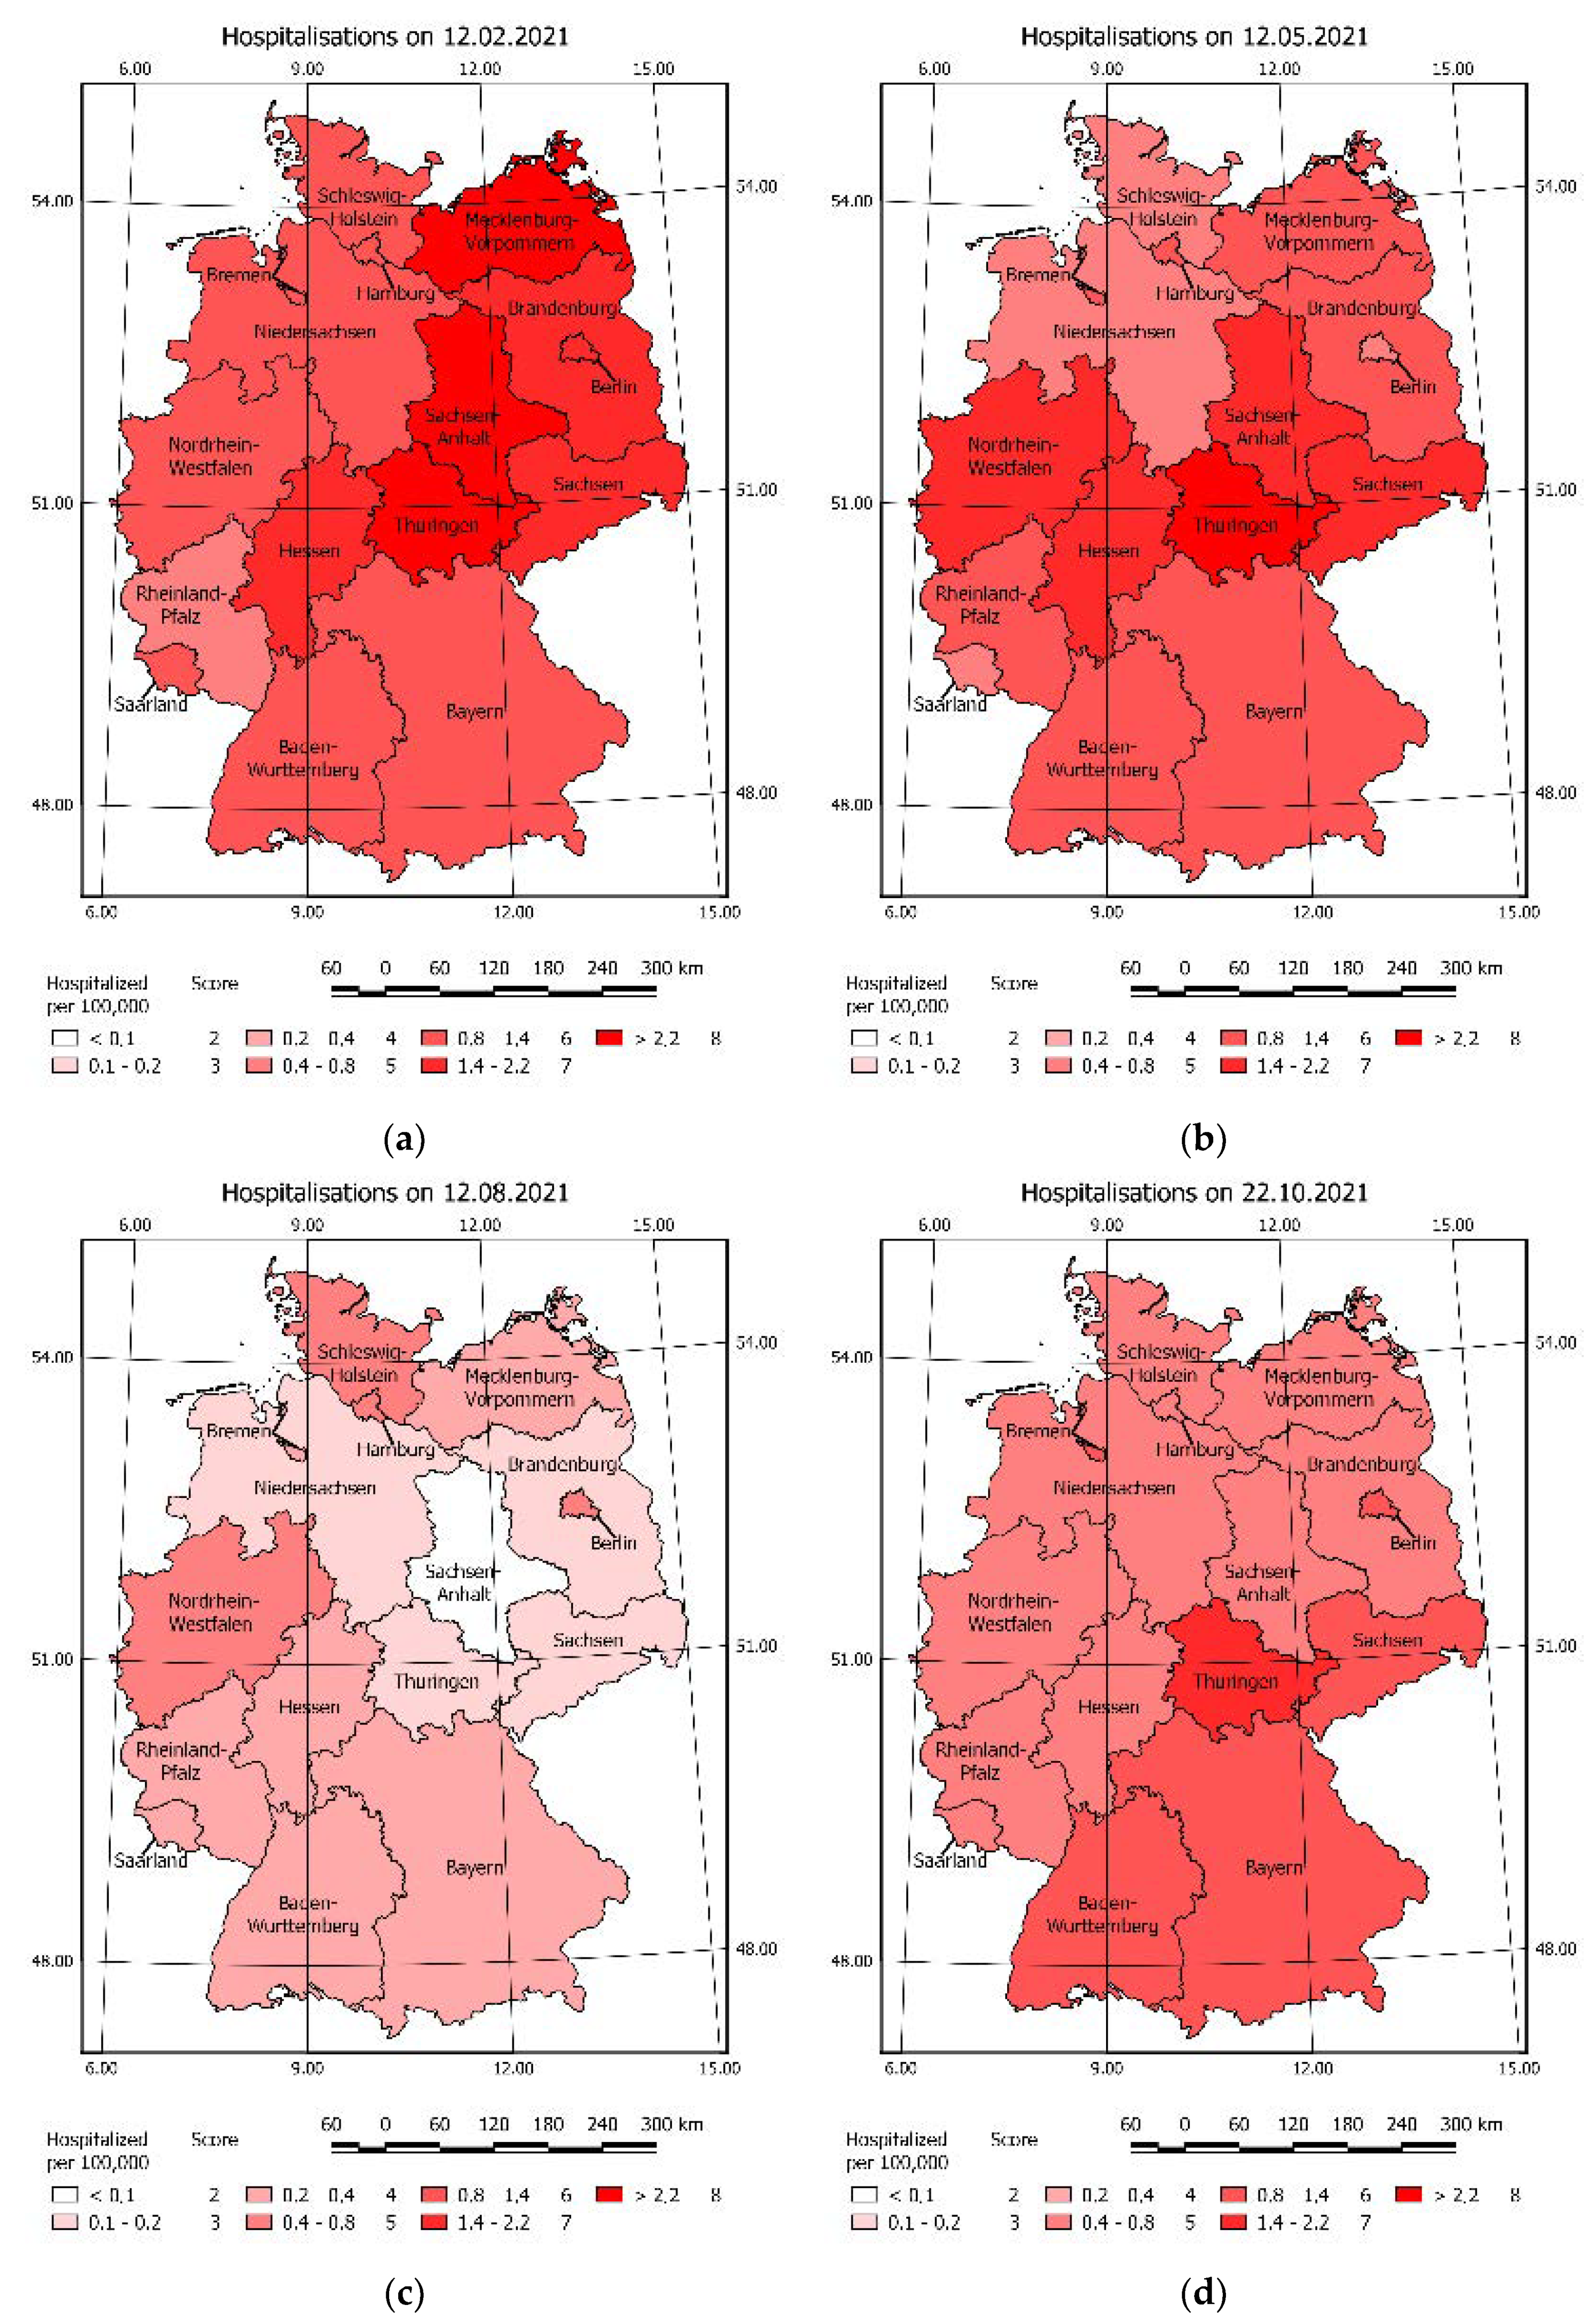
A juxtaposition of the vaccination vulnerability risk maps and new cases caused by the COVID-19 in corresponding days, explains the fact that at the beginning of 2021 the number of new cases decreased. The noticeable slowing down of the pandemic as a result of reaching 50% vaccination rate of the population in the region visible in Figure 8. Similar observation can be taken on hospitalisations change in time caused by COVID-19 (Figure 11).
3.4. COVID-19 Vulnerability Index in Time
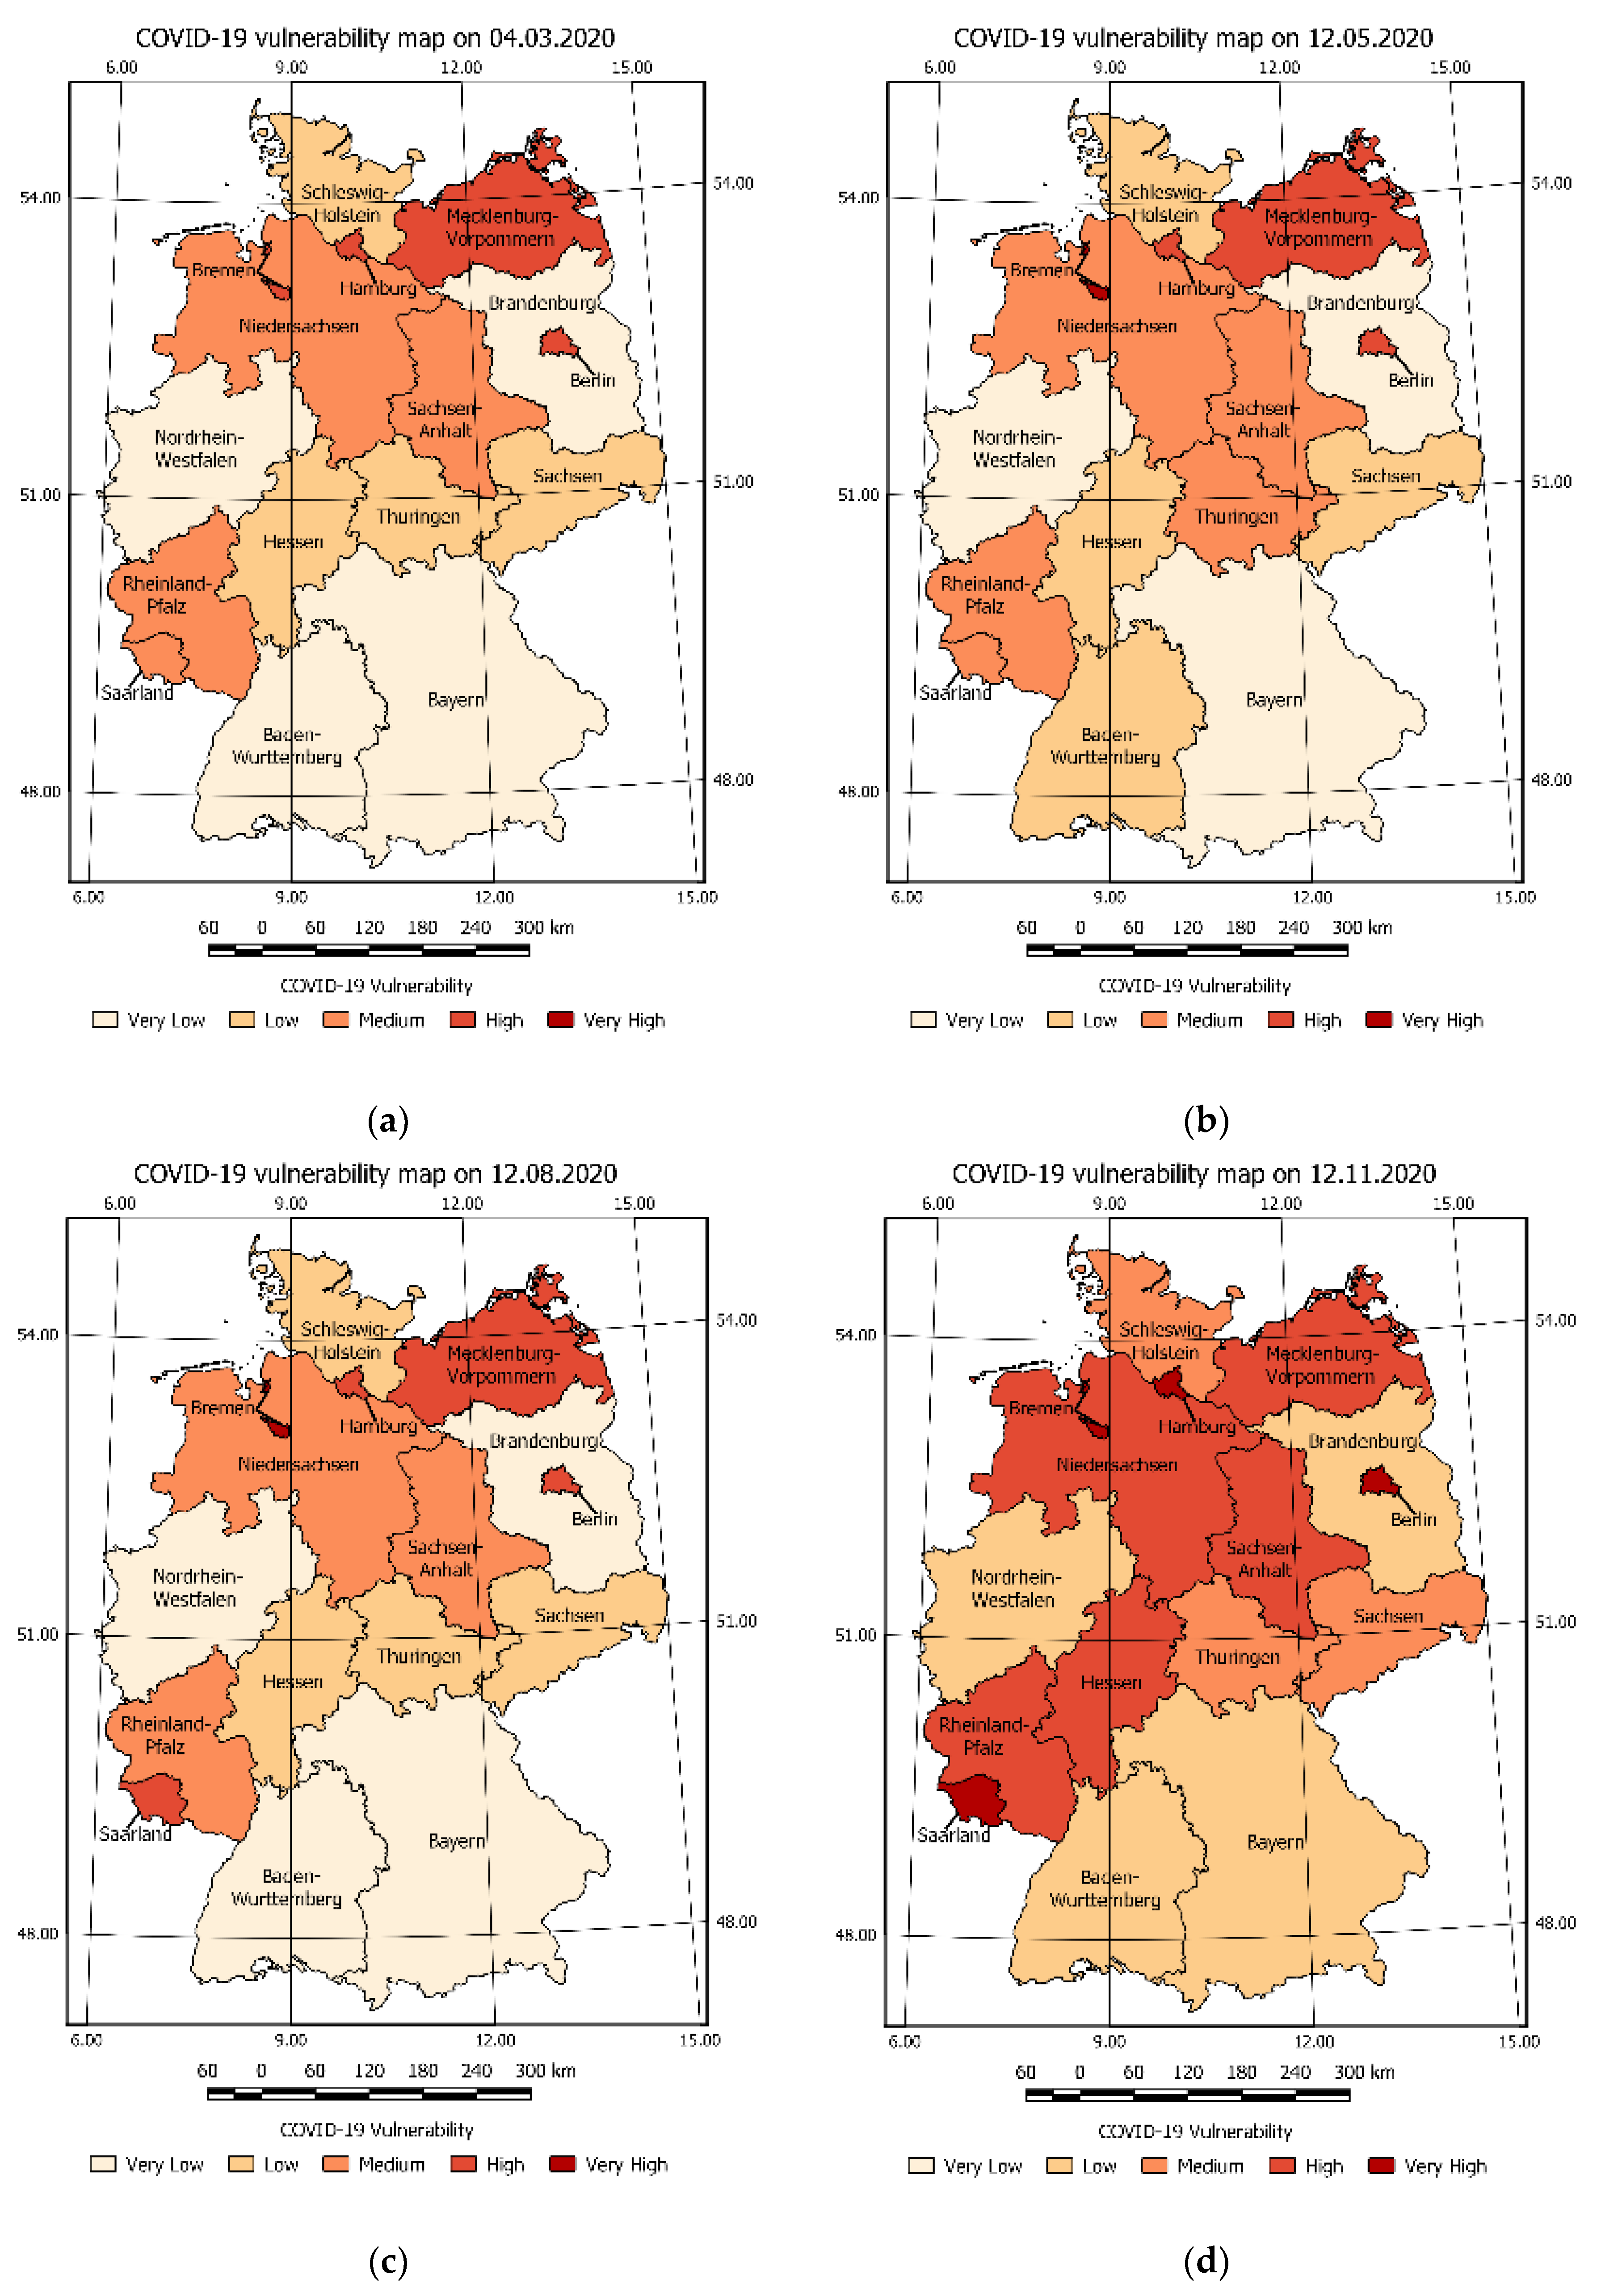
Based on the Vulnerability Score summaries for selected days, the CVI was calculated. Figure 12 presents the sequence of CVI maps in time. Based on Figure 12a it can be noticed that the federal states: Bremen, Saarland, and Hamburg were classified as high or very high vulnerability risk from the very beginning of the pandemic. This suggests that preventive actions like increasing the number of hospitals beds, preparing field hospitals or restrictions should be considered to ensure public safety in those federal states.
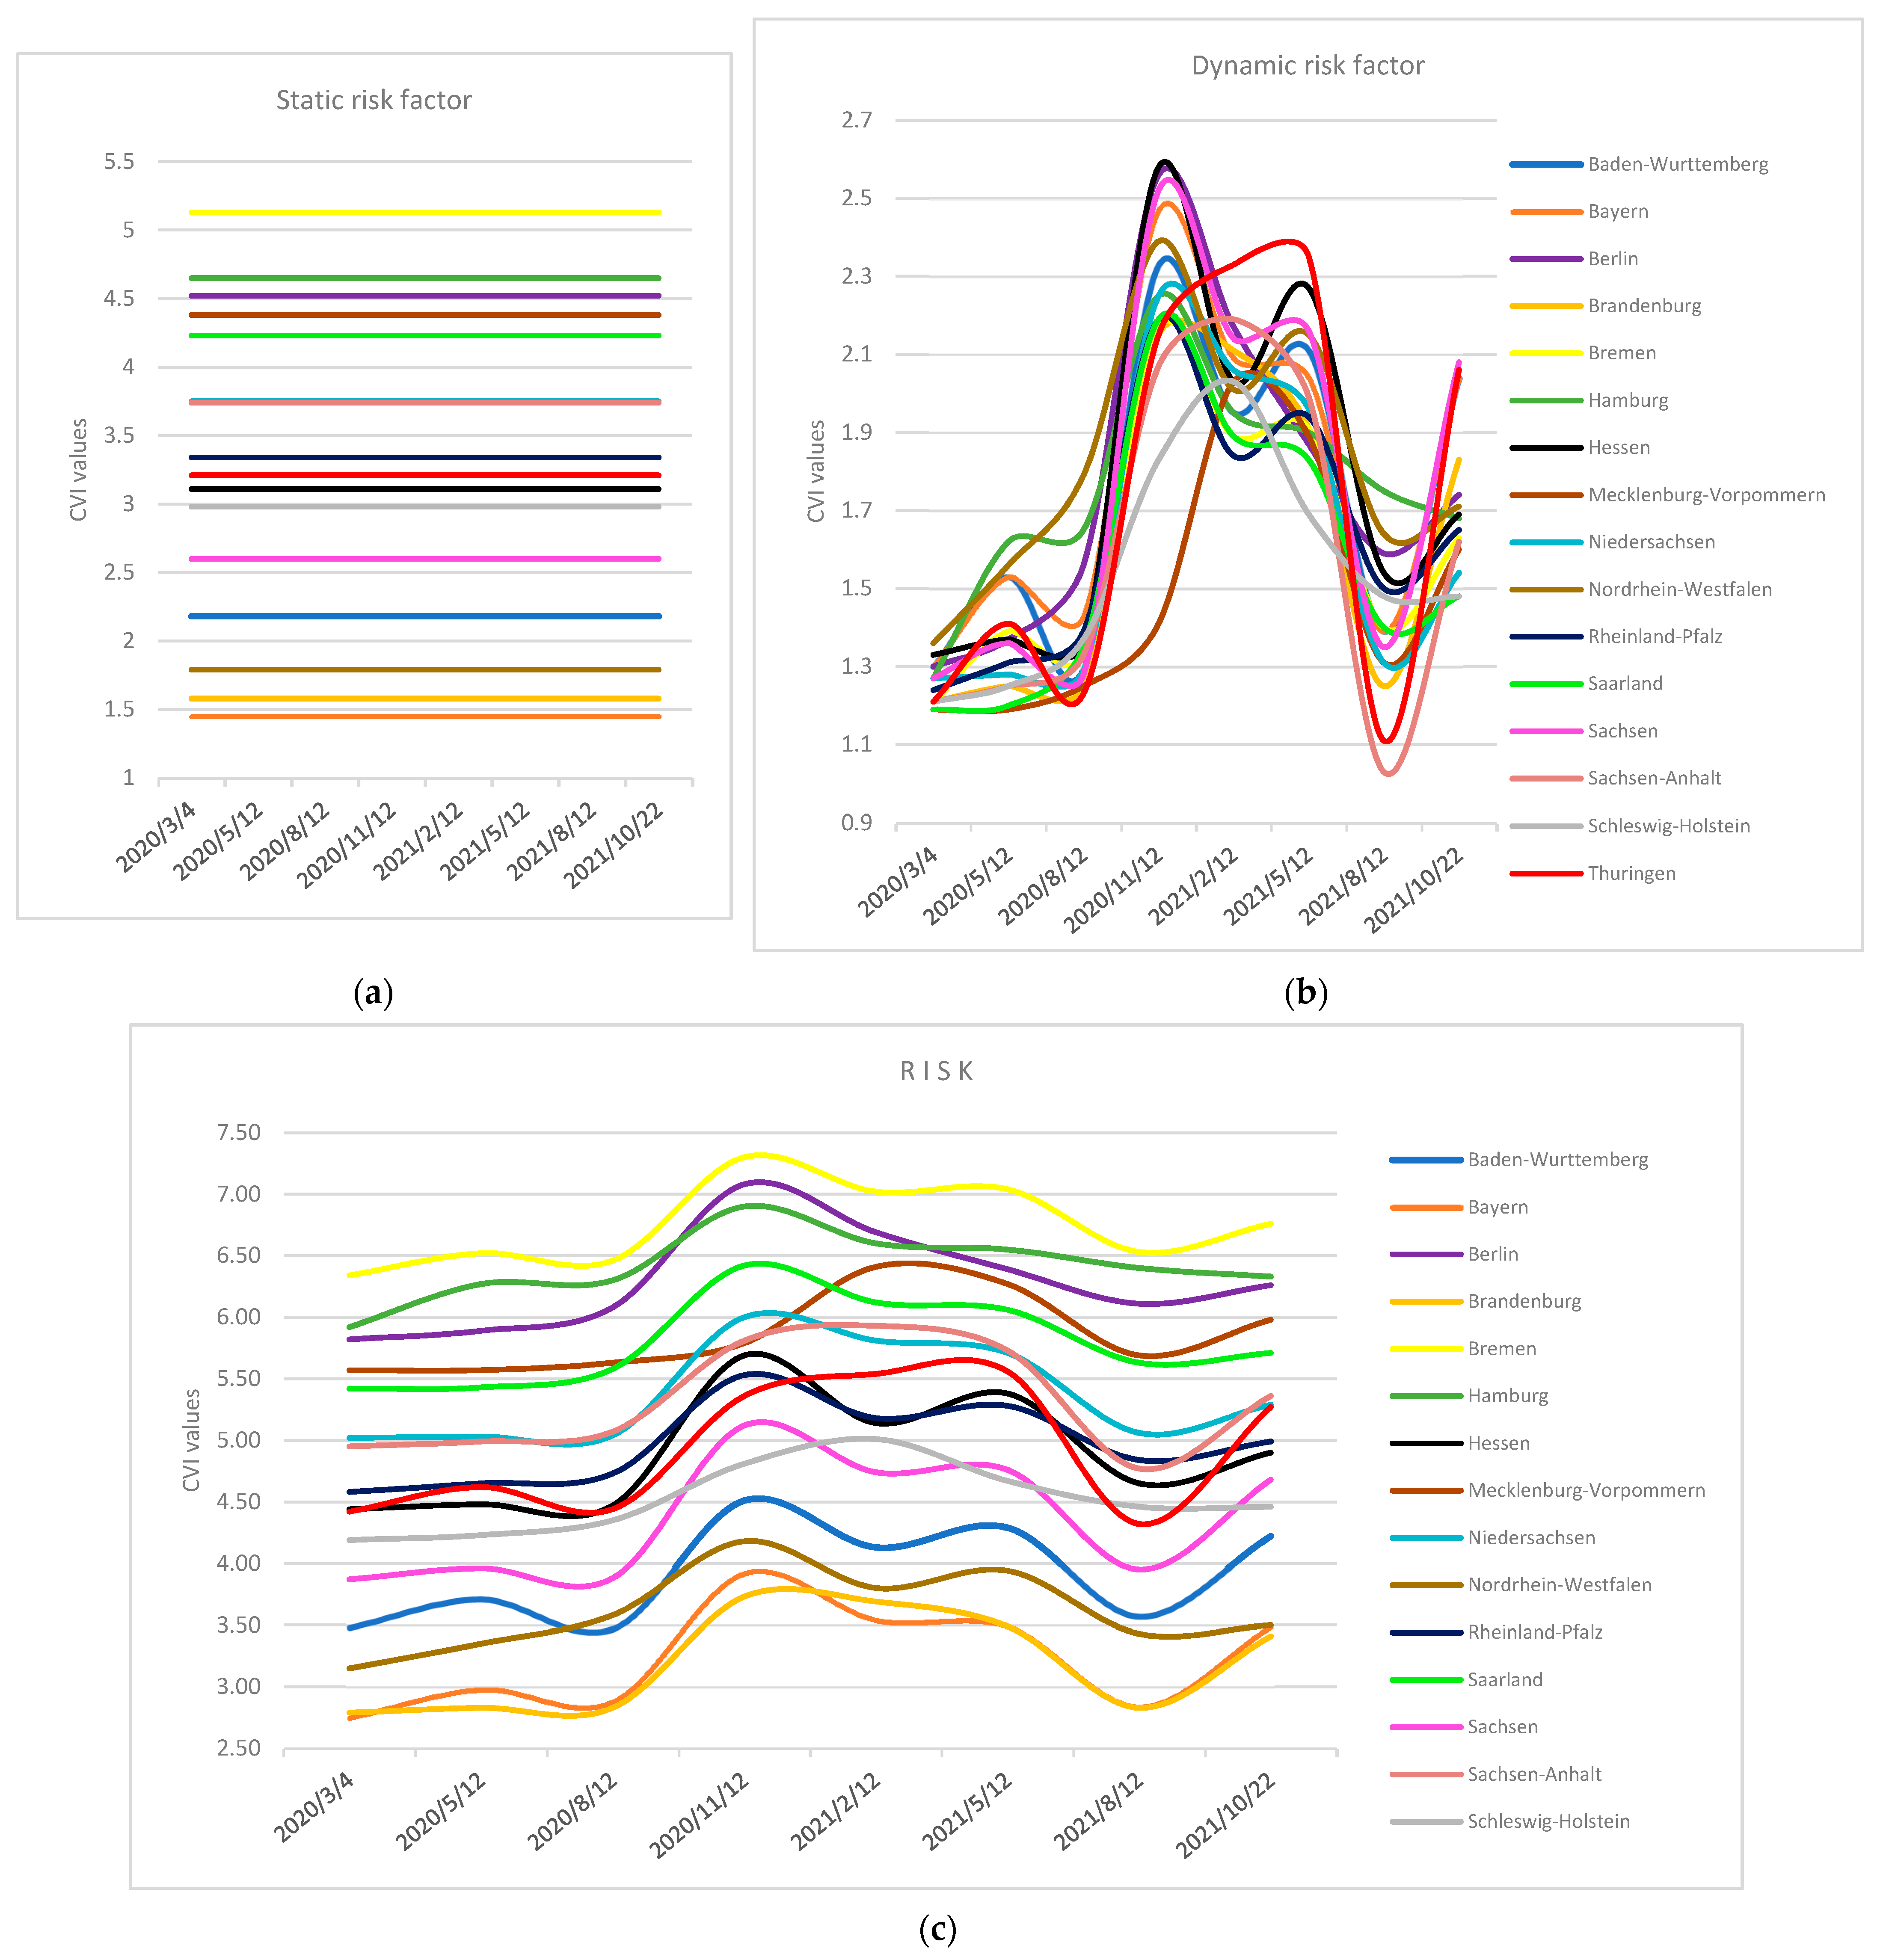
These recommendations, despite the low number of new cases and hospitalisations, were a result of high vulnerability values assigned to static criteria of the listed federal states. The static and dynamic criteria vulnerabilities of selected countries in time are shown in Figure 13.
The high level of static vulnerability increases the overall level of COVID-19 vulnerability as shown in Figure 13a,c. On the other hand, the low level of static vulnerability decreases the final level of COVID-19 vulnerability. In real life scenario, this will correspond to the situation, where the number of hospitals and hospital beds exceeds the number of potential patients.
The analysis in the area of Germany, allows us to estimate the number of people endangered at a certain level of COVID-19 vulnerability in time. Results were presented in Table 5. Pursuant to the above it may be concluded that 22,102,833 population of Germany were at risk of very high COVID-19 vulnerability risk and the number of population endangered changes over time.
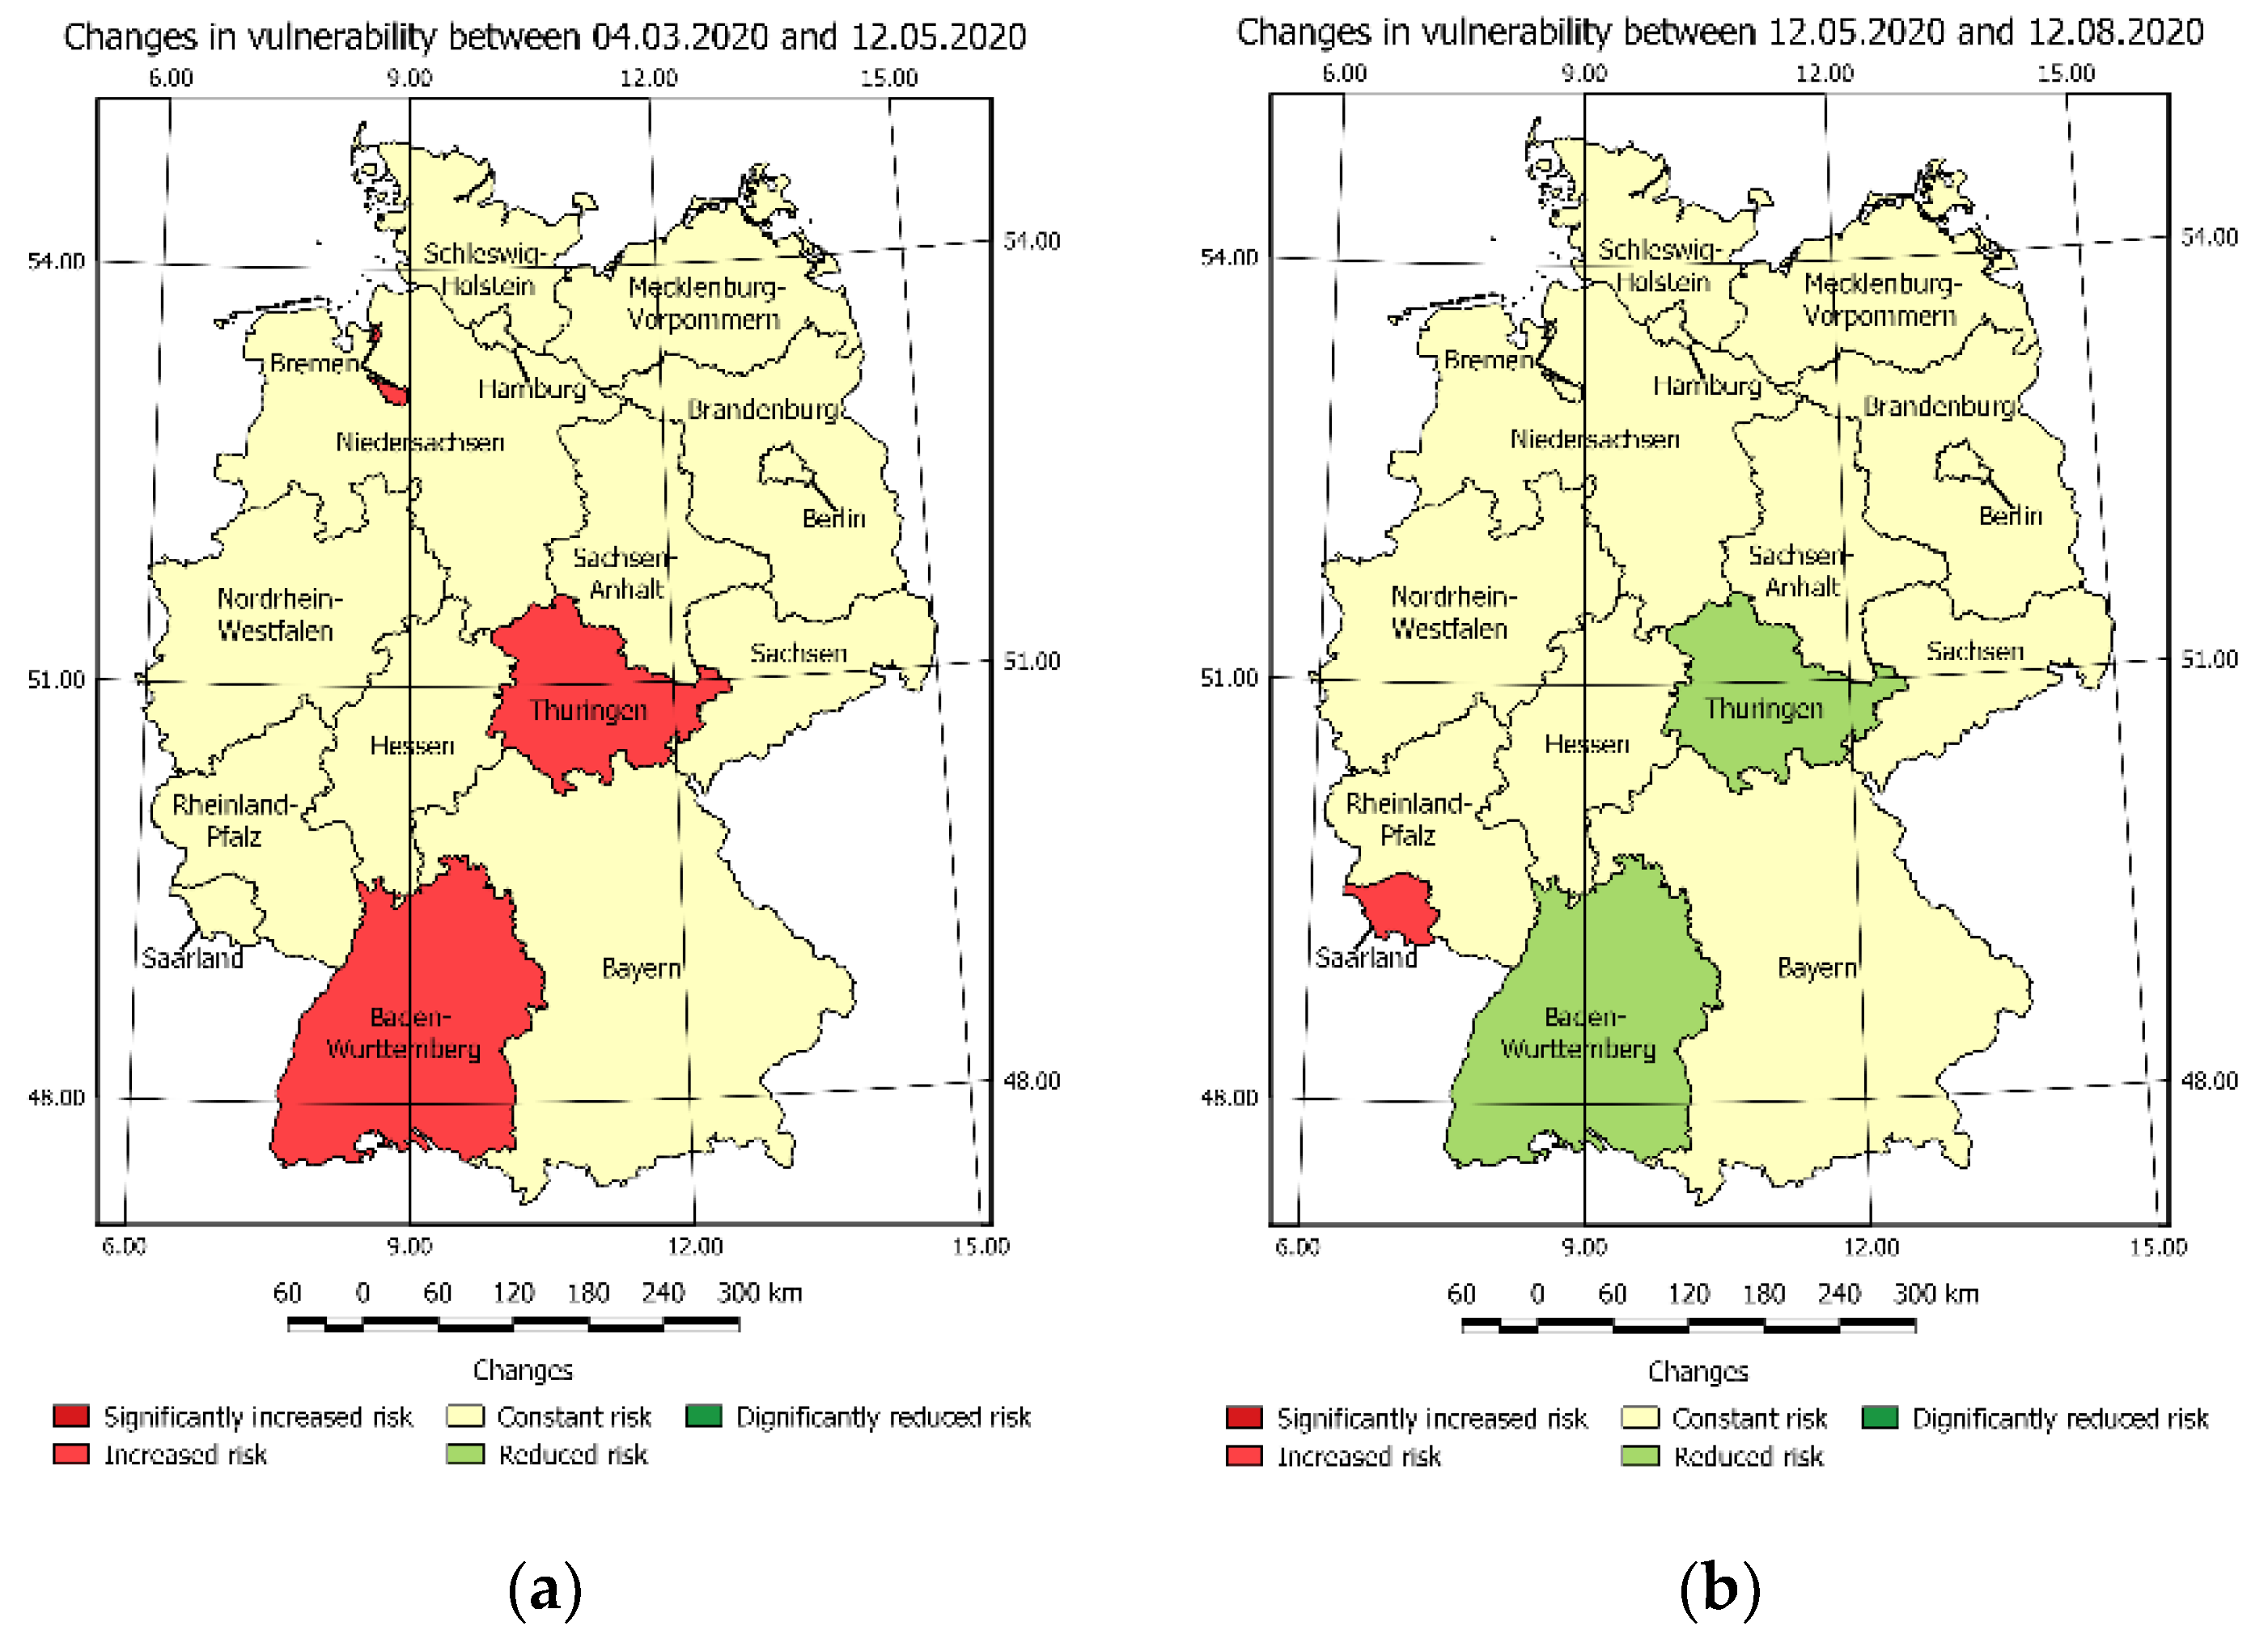
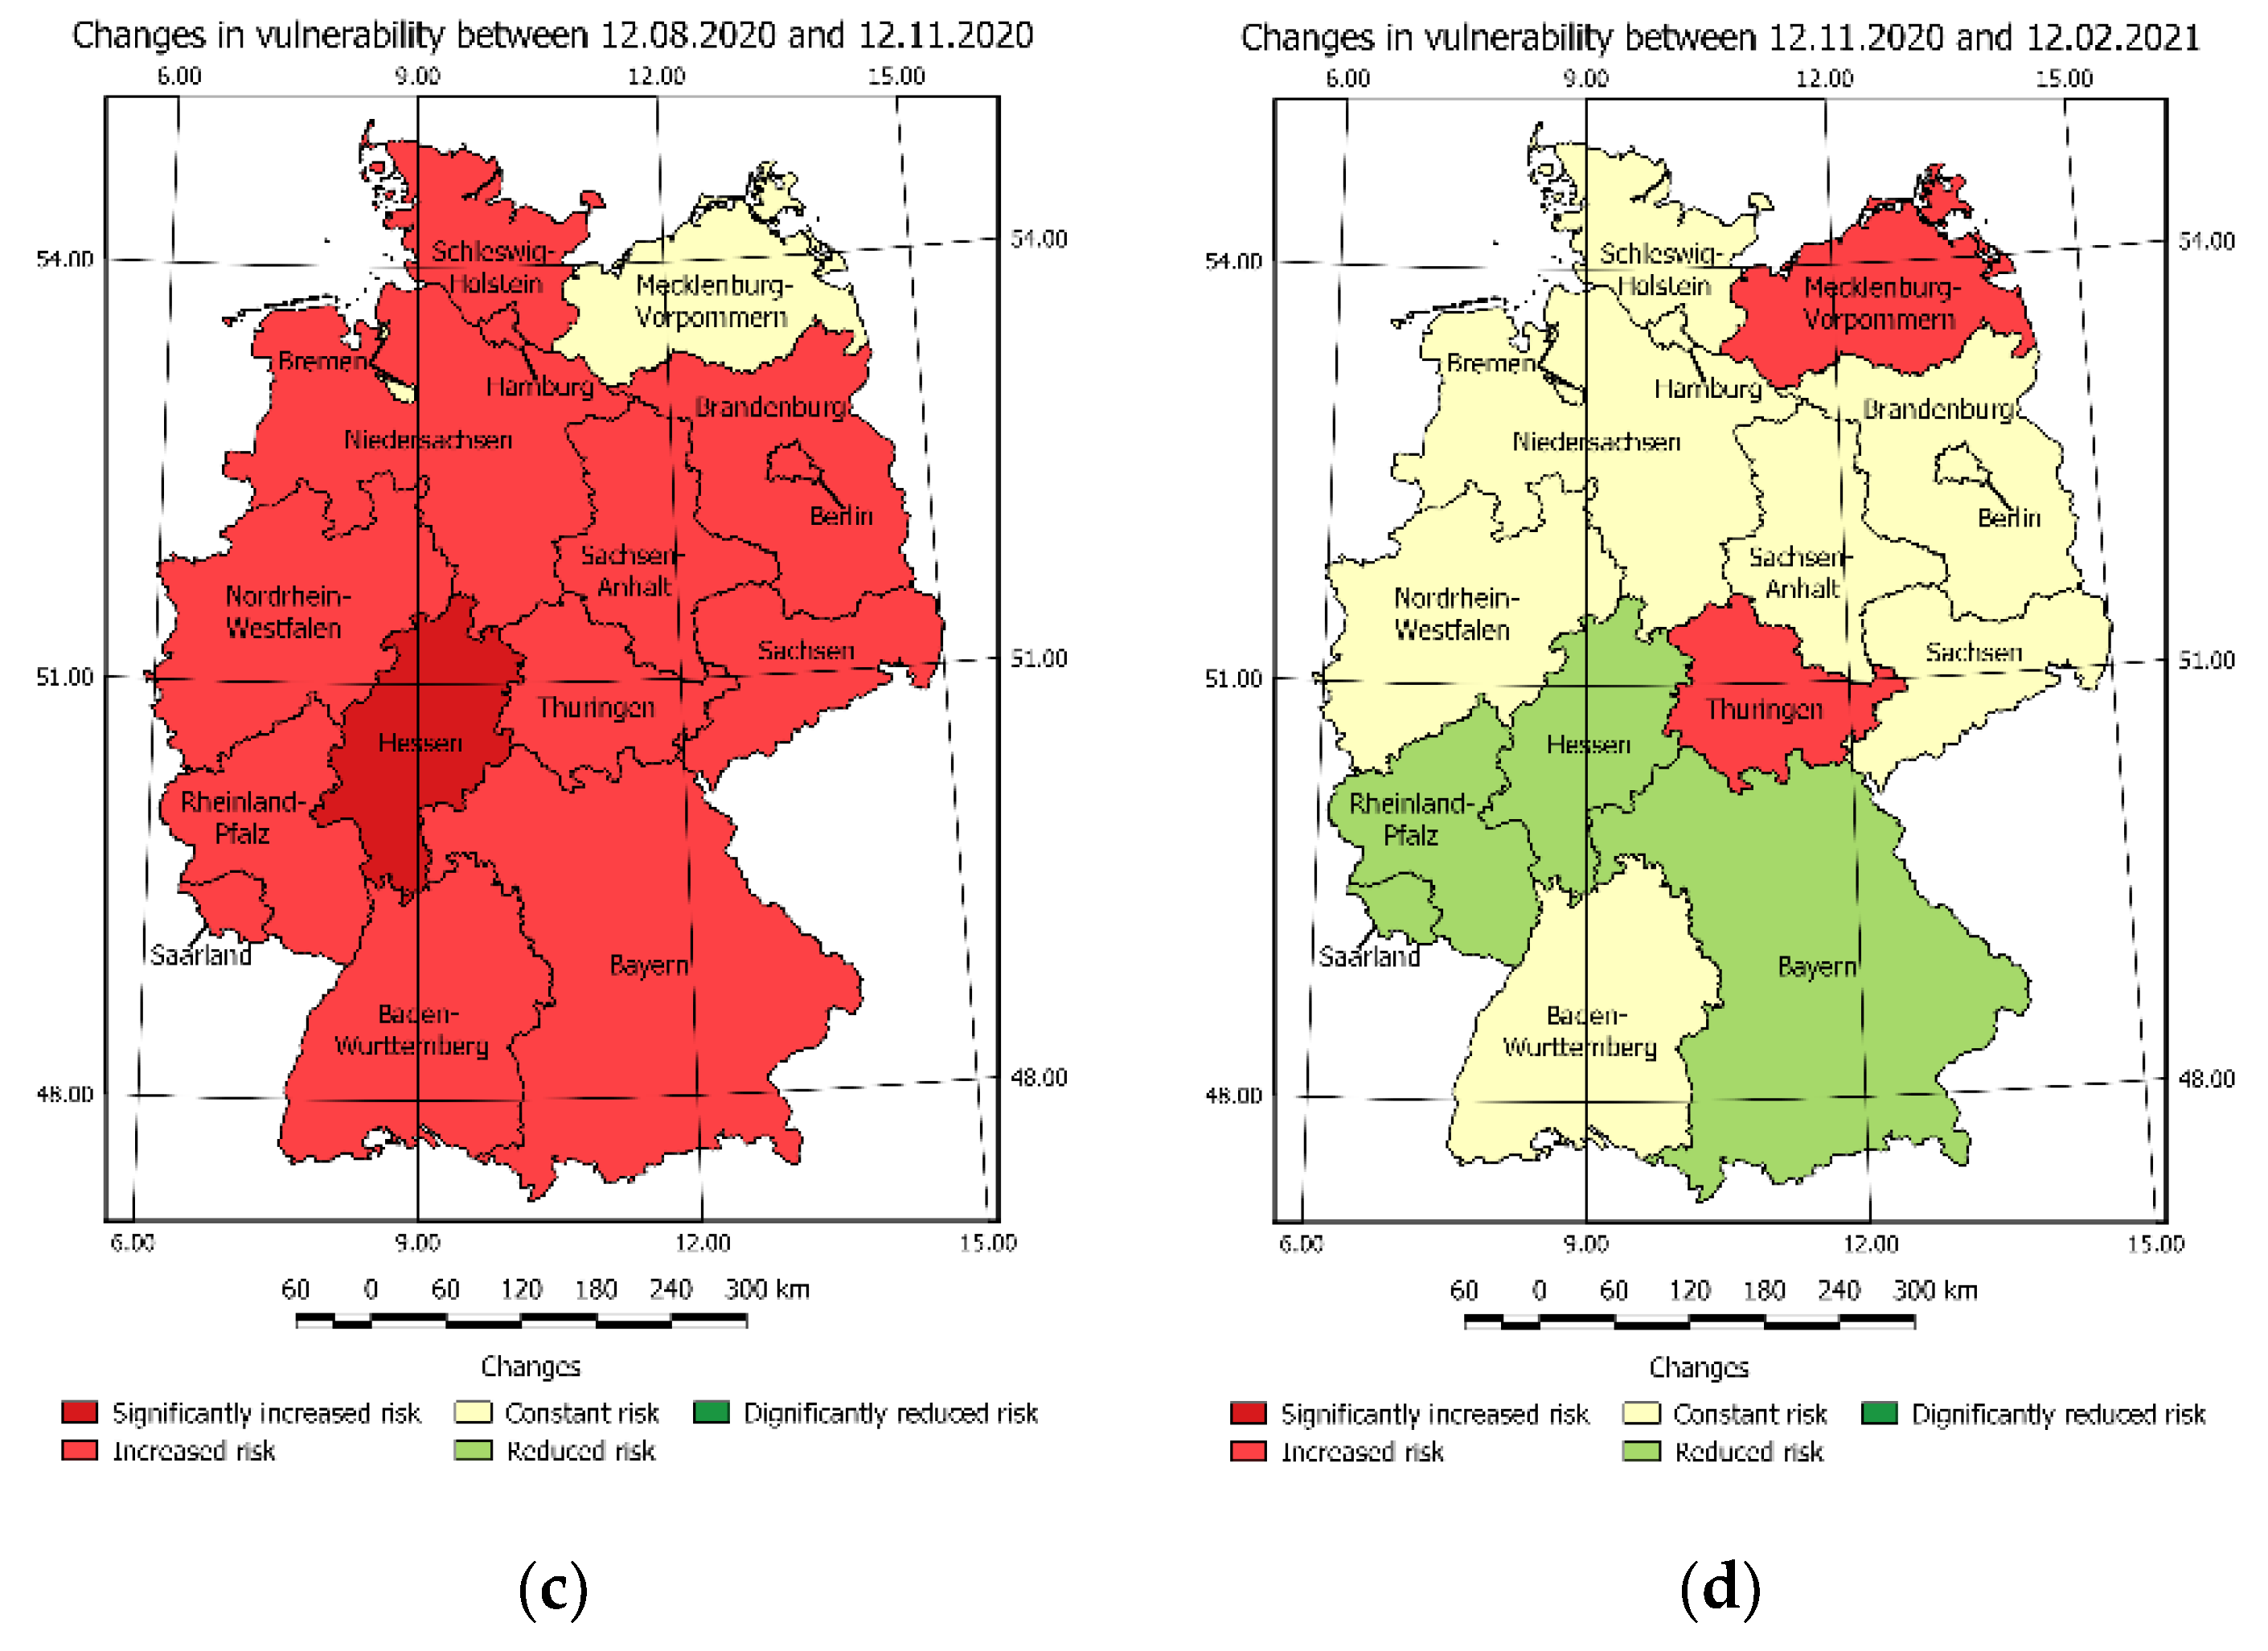
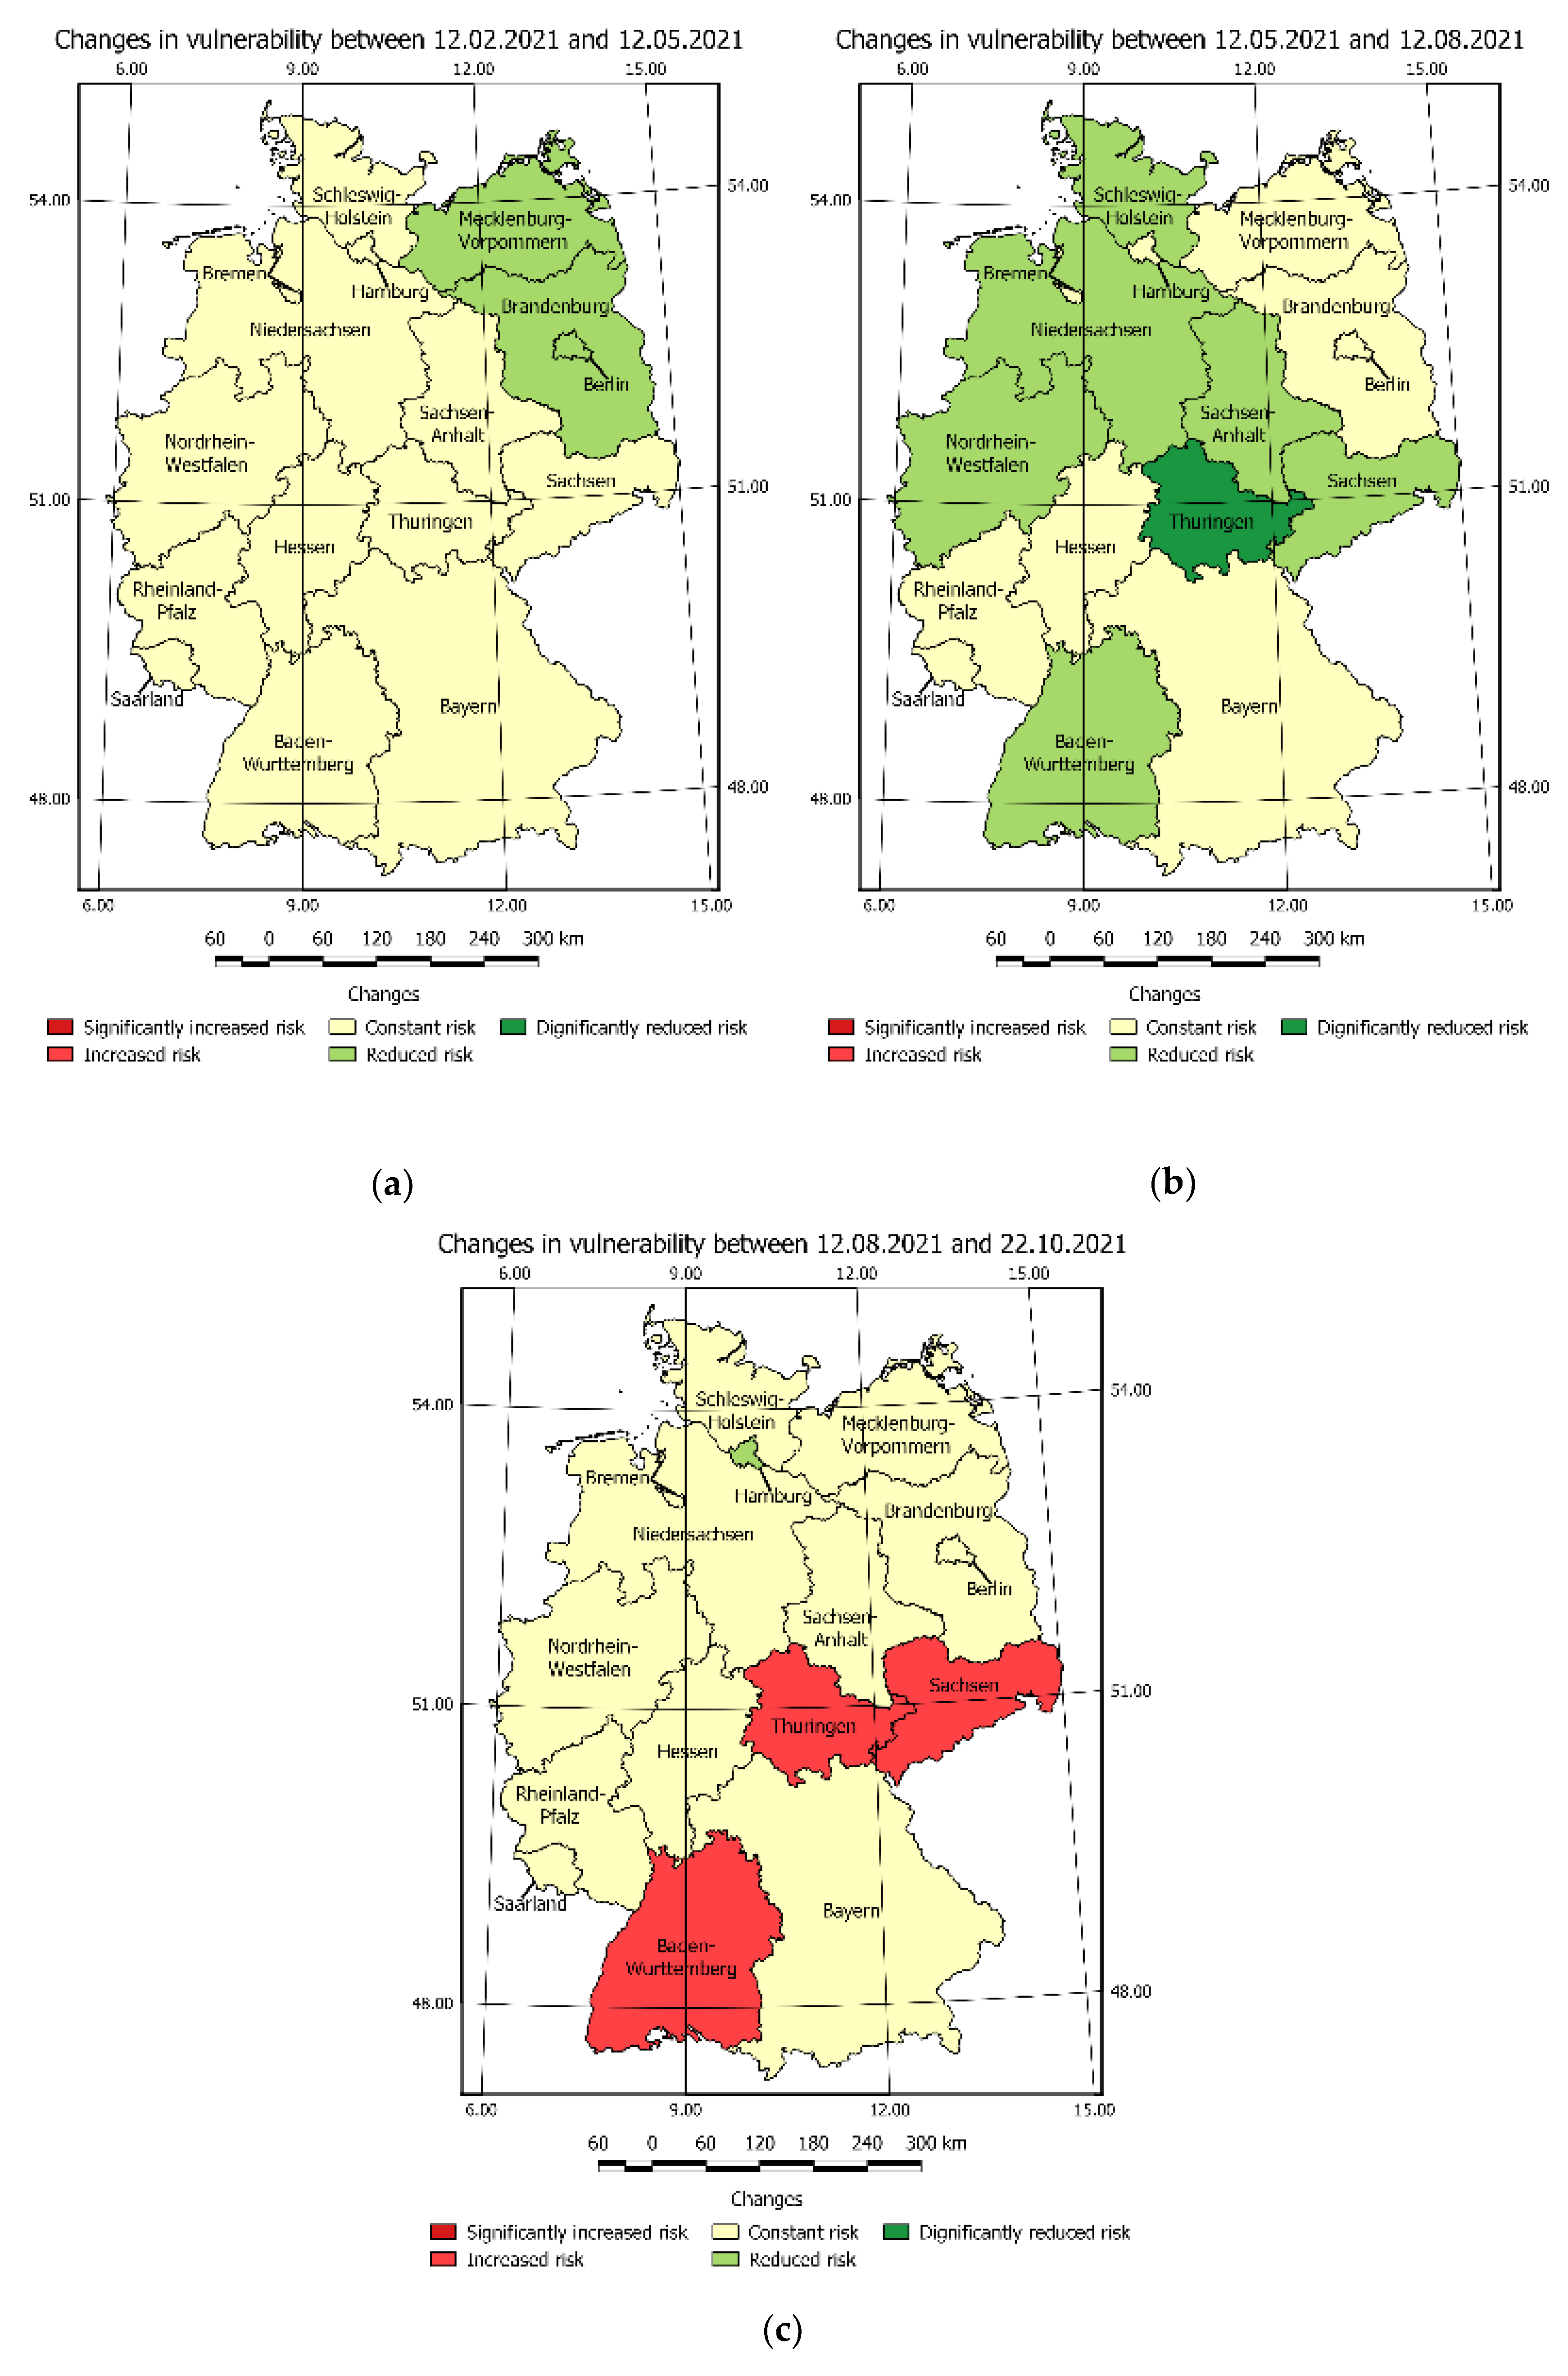
The COVID-19 vulnerability risk maps were used to develop the maps shown in Figure 14, One may be easily noticed in which area the pandemic situation has changed.
In this regard, Figure 14c shows the increase in vulnerability caused by post-holiday returns and the re-opening of schools. Figure A4b presents the general decrease in the risk caused by a significant increase in the number of fully vaccinated people. This was followed by another increase in vulnerability Figure A4c.
3.5. Validation
The validation of results was performed in two stages: the first stage was the juxtaposition of CVI and confirmed cases in the time presented. The second stage was the comparison of CVI and COVID-19 active cases. The validation was performed according to the data from Table 6.
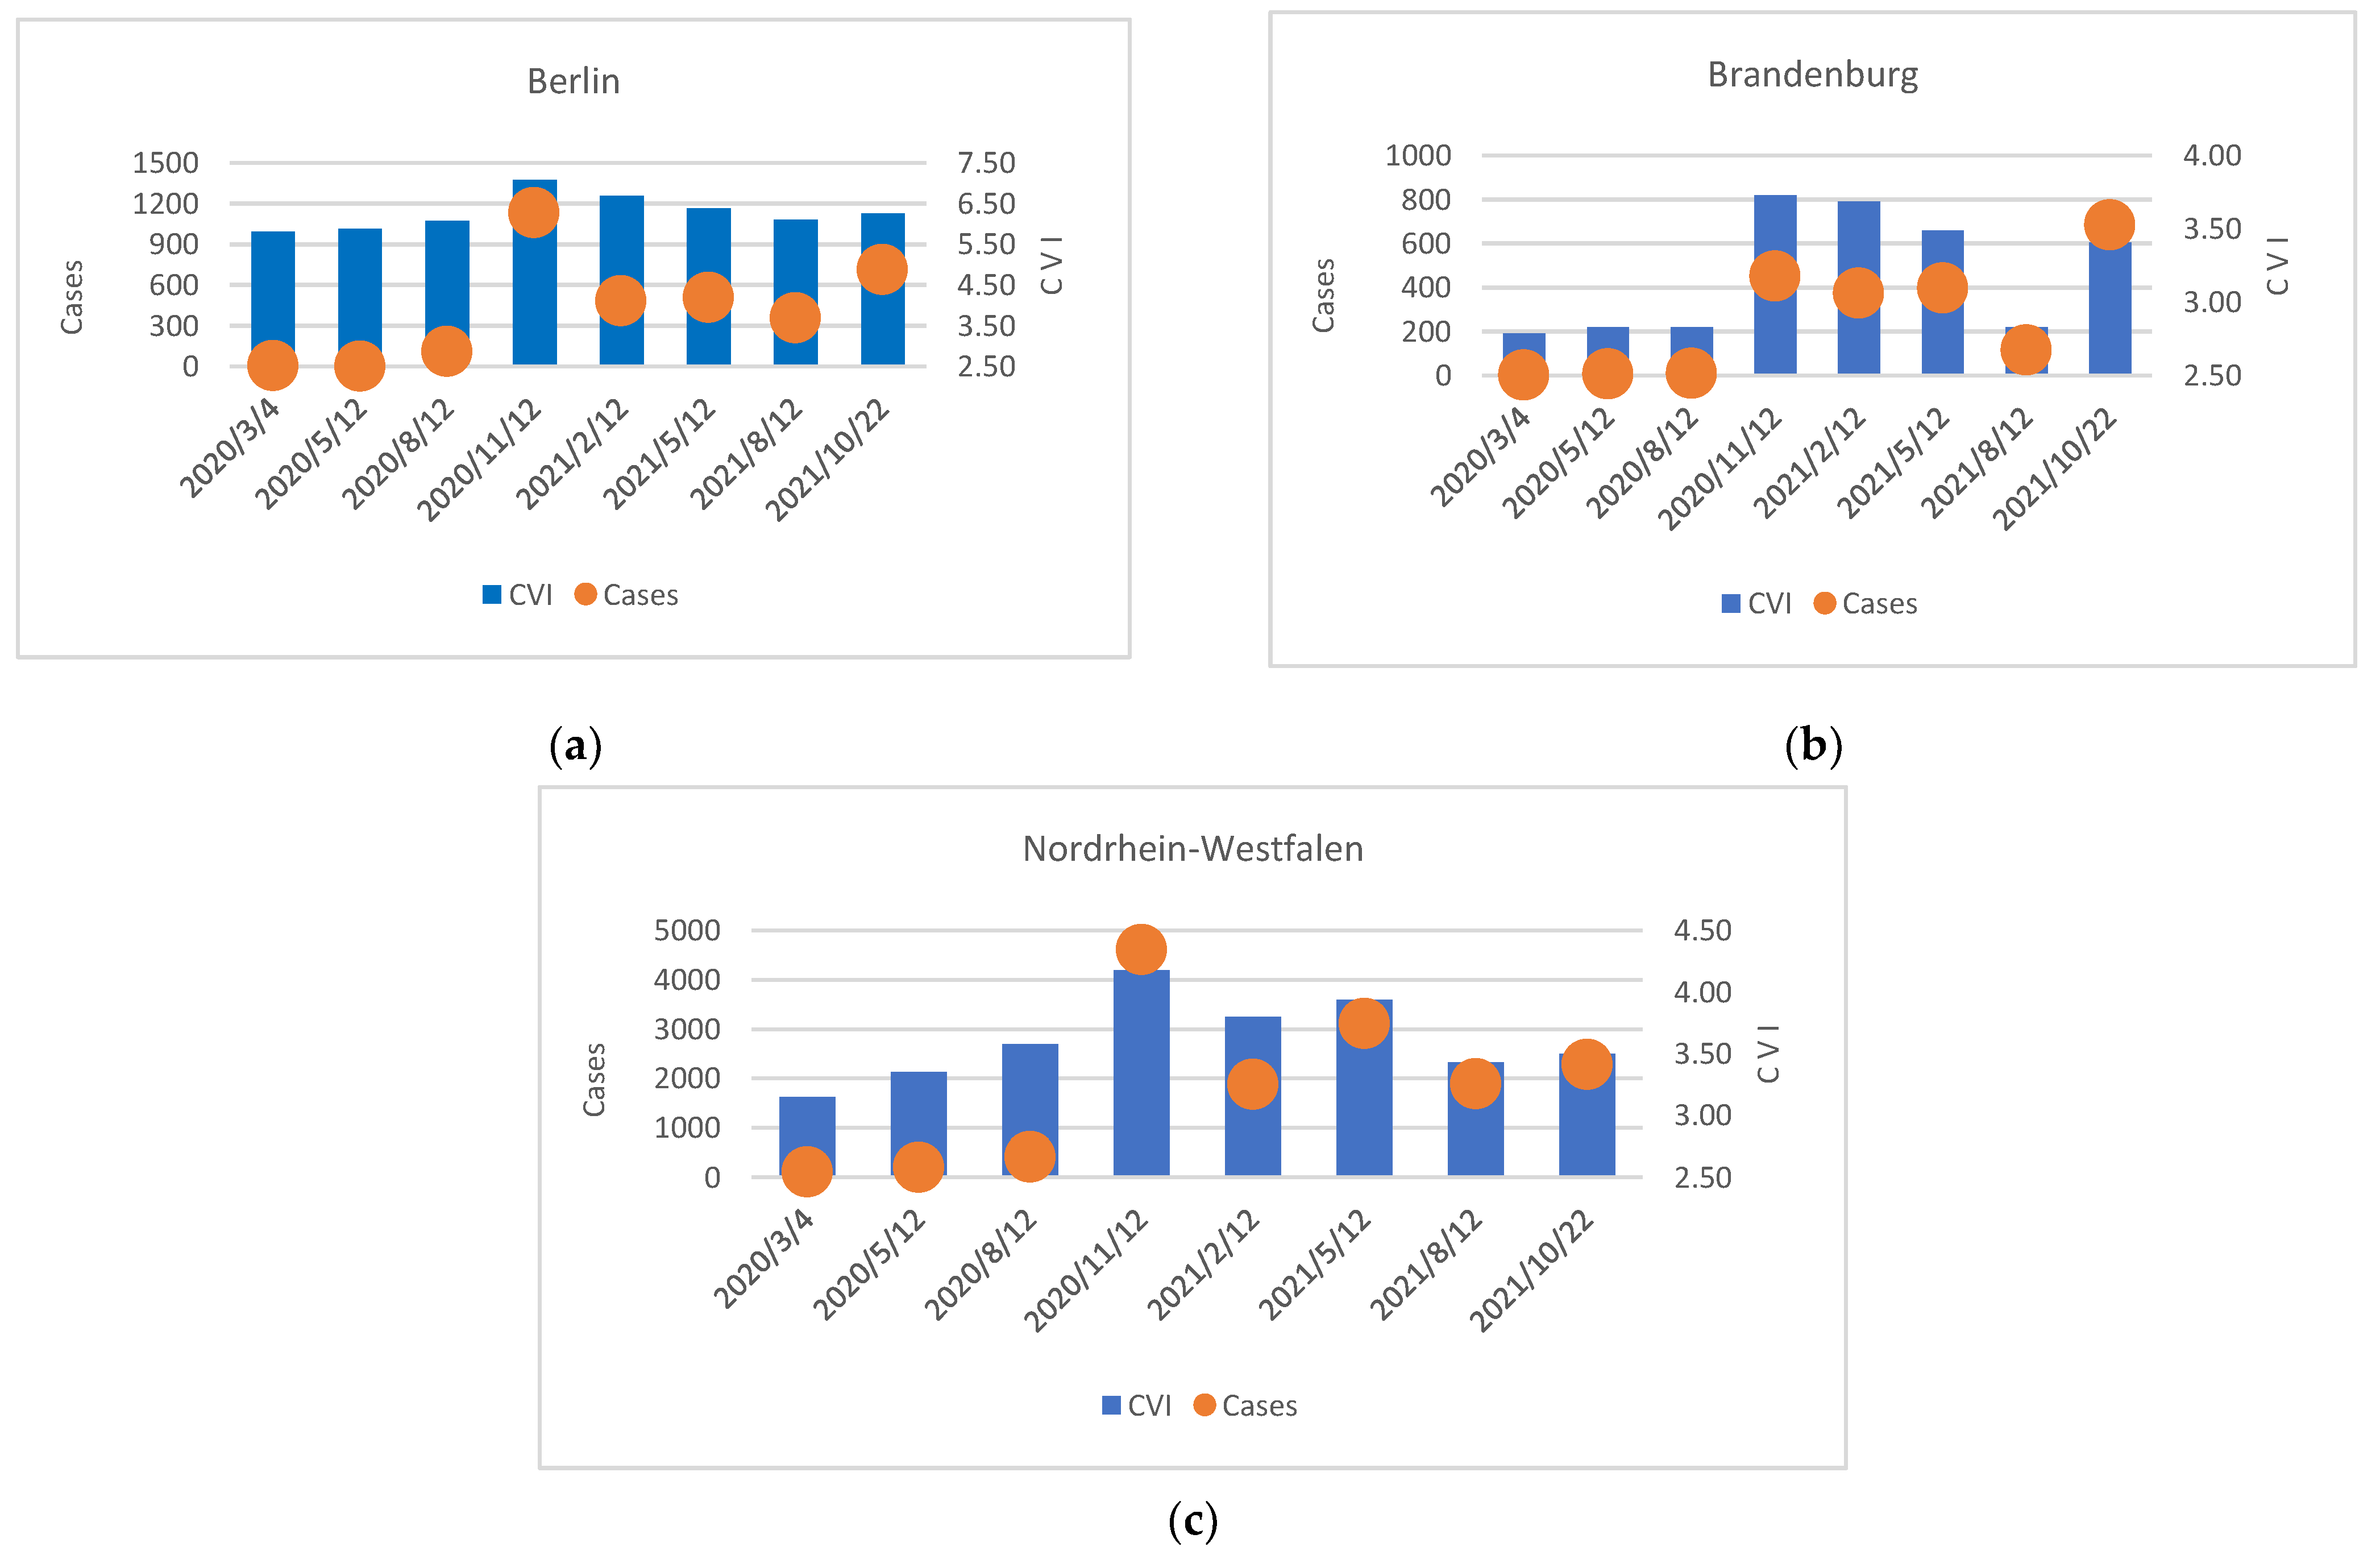
Figure 14 shows the CVI and confirmed cases in selected days on Berlin, Brandenburg, Nordrhein-Westfalen. According to Figure 14 the COVID-19 vulnerability risk in Berlin and Brandenburg, Nordrhein-Westfalen on the first three bars (4 March 2020, 12 May 2020, and 12 August 2020) was growing constantly and this, despite the constant number of new cases, suggests that some actions or preventive steps should be taken in order to reduce the large increase in COVID-19 infections that occurred on the following days: 12 November 2020, 12 February 2021, and 12 May 2021. The above shows that the growing or high value of the COVID-19 vulnerability risk index predicts an upcoming pandemic wave that can be foreseen in a short period of time.
Figure 15 shows the CVI and confirmed cases in selected days on Berlin, Brandenburg, Nordrhein-Westfalen.
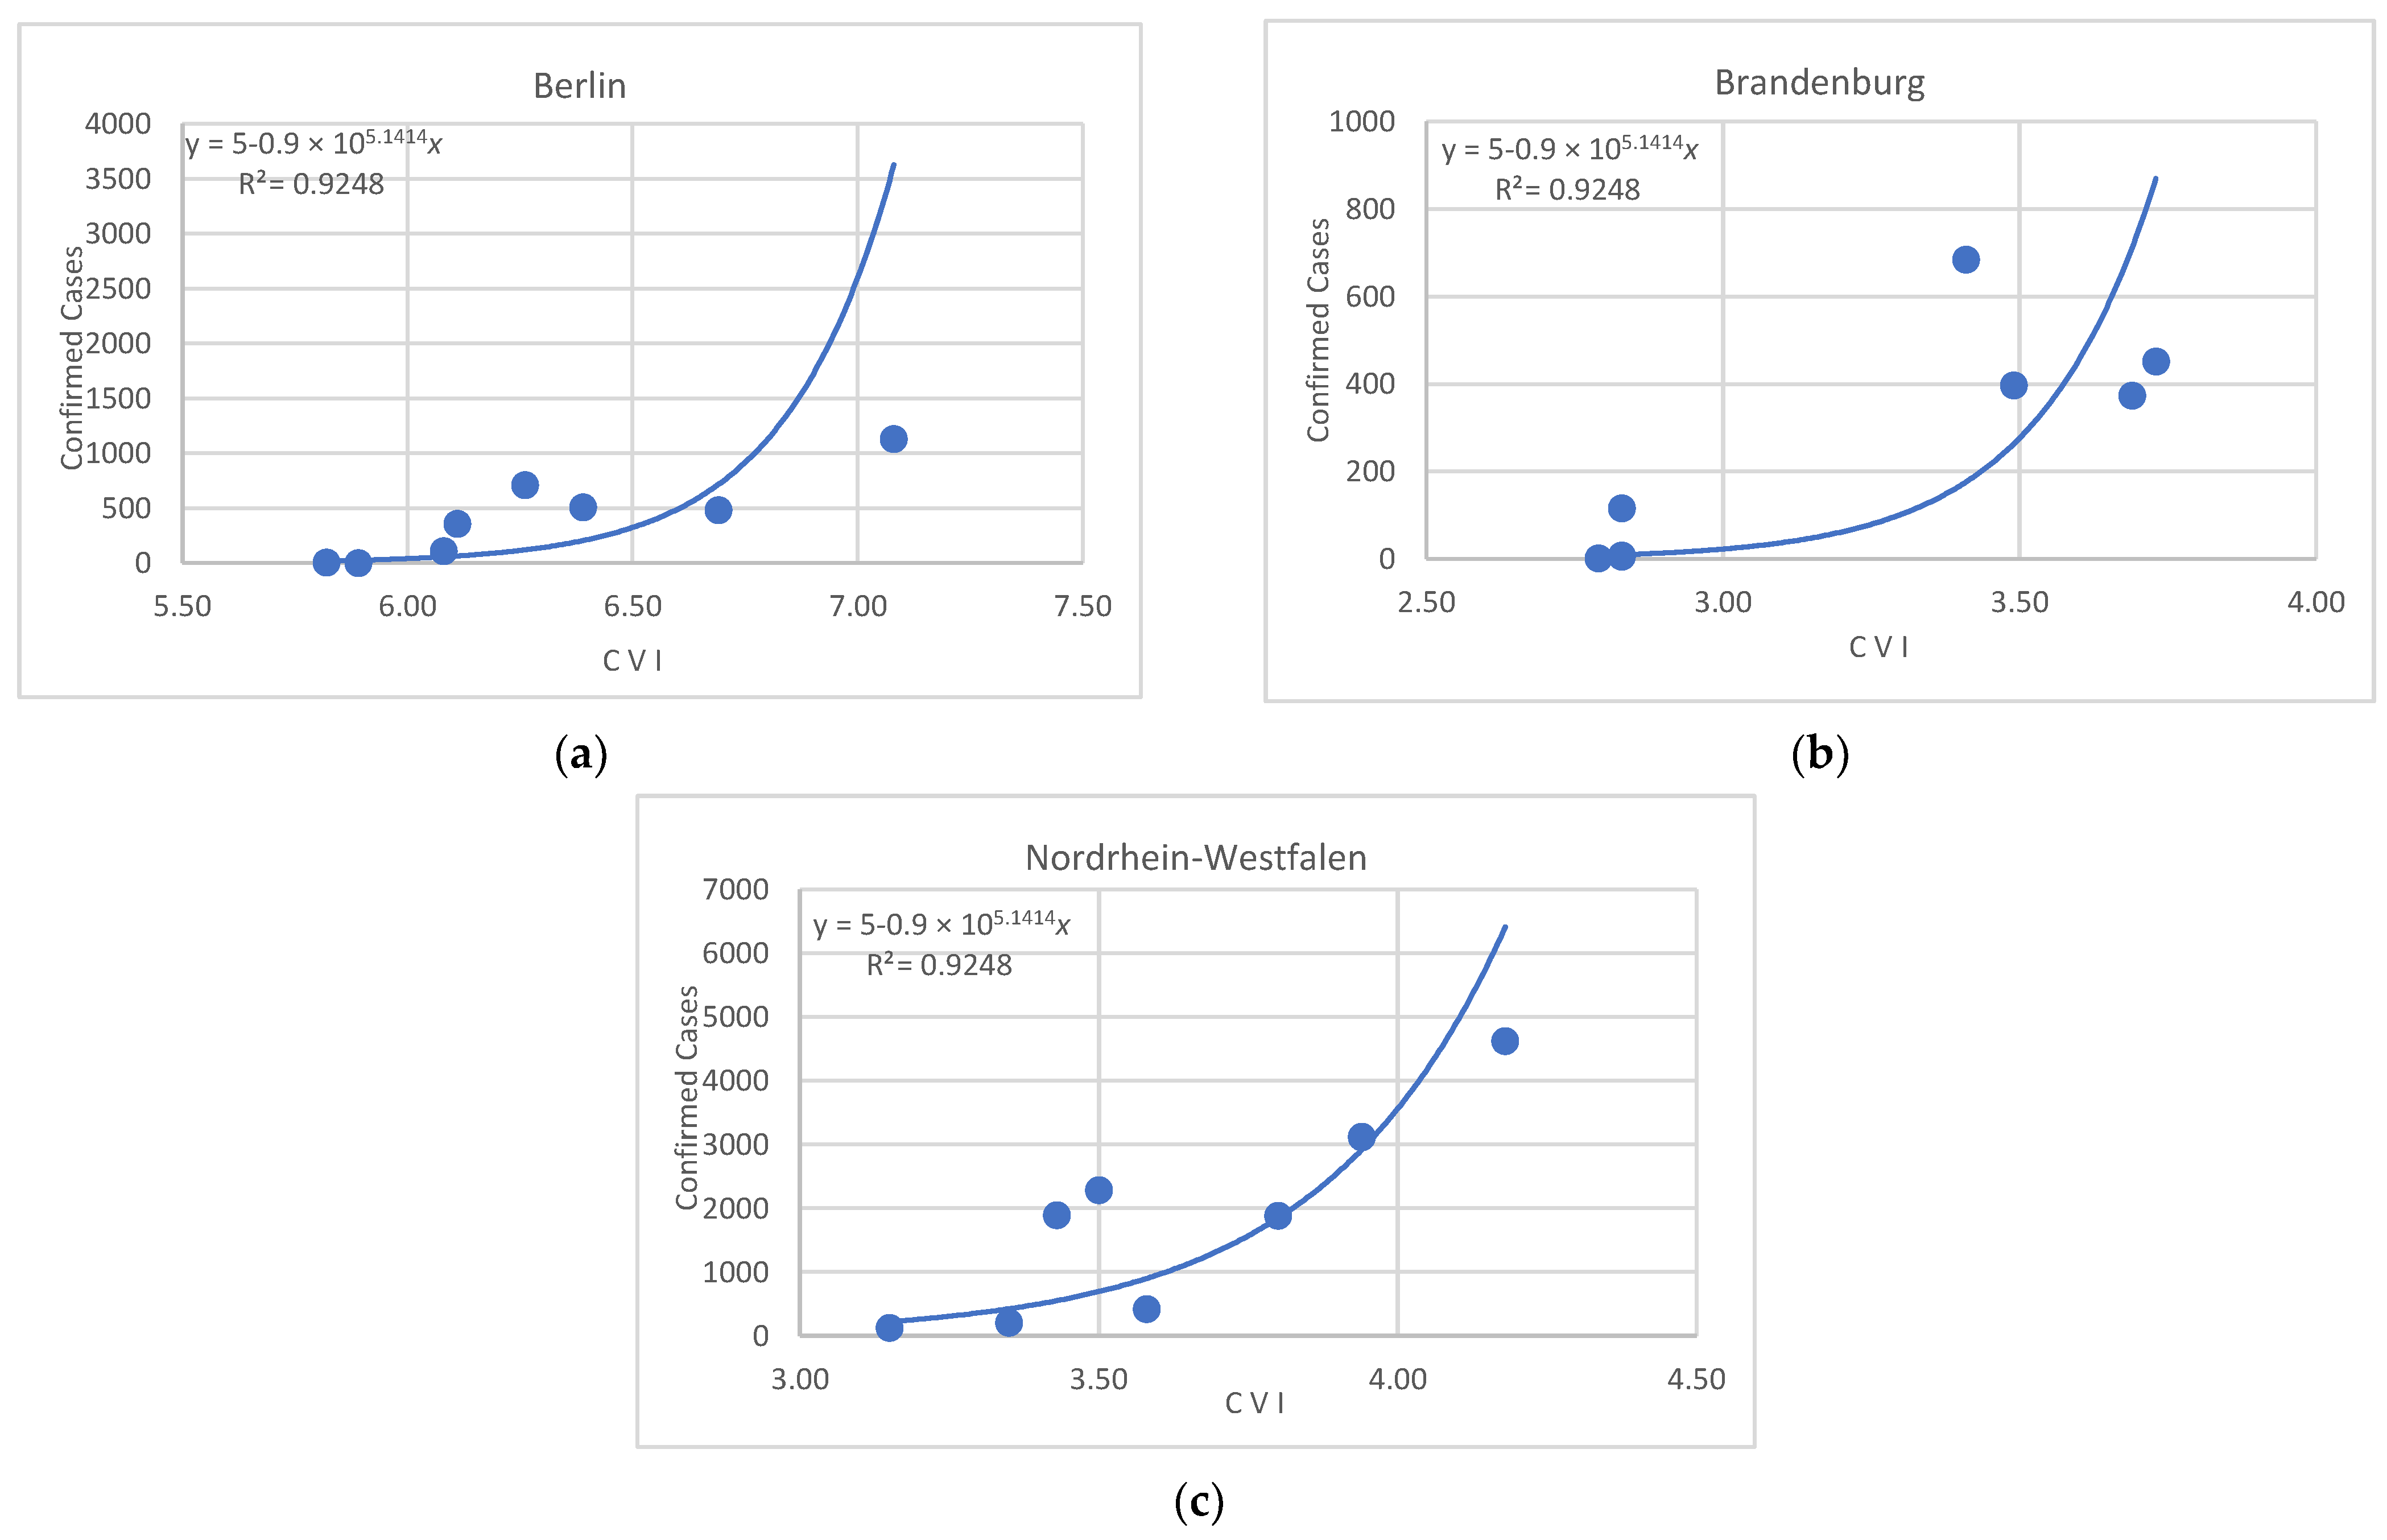
The chart analysis reveals a positive exponential trend between CVI and the number of confirmed cases with the R2 value of 0.92 respectively (Figure 16).
The study has the following known limitations:
- Weights summary estimation was based on the AHP method. In this regard, it is essential to pay attention to the problem of criteria selection key and criteria quantity. The increase in criteria quantity would result in a more precise view of the situation in terms of several factors. However, more criteria will cause difficulties in performing analysis due to the lack of available data. If the number of criteria will be decreased—the analysis would be more general, but the data acquisition problem will be less probable.
- Criteria proposed by the authors, and calculated weights create a perspective, focused on health care state image and selected population statistics. This excludes the possibility of insight and of estimating the influence of other factors on pandemic situation. The presented approach and selected criteria include the static criteria groups that allow for early vulnerability risk detection (e.g., in risk of shortage of hospital beds) and furthermore dynamic criteria group for tracking the progress of pandemic in time (new cases).
- The performed analysis was limited to the inference at the strategic level, which results from the limited detailed data access. Obtaining the data in subregions division would allow for more precise identification of pandemic vulnerability risk and would result in appropriate crisis response ensuring public safety. The authors argued that there is quite an immerse gap in the possibilities of conducting spatiotemporal analysis caused to the lack of accurate data. More detailed data are required to prepare recommendations for the selected subregion.
The comparison of the obtained results with the results of works by other authors reveals that those criteria that provide a thematic direction for the analysis results and data are important for the results. As far as the proposed methodology is concerned, data obtained from open data sources were used. What distinguishes the proposed approach from others is the use of both static and dynamic criteria are used, which enable making decisions related to hospital infrastructure and the available resources in the given area. Most studies on COVID-19 involve the modelling of the influence of selected factors, while the proposed approach focuses on modelling the risk connected to the SARS-CoV-2 virus.
4. Conclusions
The outbreak of SARS-CoV-2 caused a pandemic situation and affected the lives of people around the world. For this reason, it became crucial to provide an appropriate crisis response based on research, allowing for the determination of the hazards it implies. The studies on the COVID-19 vulnerability risk index as a result of a weighted summary of the determined individual criteria risk score show the dynamics of threat change in time in the selected area. This allows for tracking the increase of vulnerability risk, caused by the virus spreading and delivering appropriate crisis response.
In terms of the impact of individual criteria on the value of vulnerability risk, it was found that each of the criteria had a different influence on the final value of the CVI coefficient. Furthermore, the division of criteria into static and dynamic ones enabled us to identify factors that were causing a certain level of vulnerability risk to COVID-19 spread even in the early stages of the pandemic. This could help to provide an early reaction, which may prevent the rapid increase of pandemic threat.
The directions of vulnerability risk changes over time were different in each region. However, there is a visible correlation between the CVI change in time and certain, typical events in the annual life cycle e.g., return to school and work from vacation (visible increase) and with such preventive actions as reaching a high level of vaccination (visible decrease), can be noted.
Taking the above into consideration, based on the spatiotemporal vulnerability risk analysis, the decisions on taking actions at an early stage of a pandemic, e.g., relocation of equipment, forces, and resources, are available. Moreover, the conducted analysis illustrates the level of threat better than the number of new cases, which makes it a relevant source of information to identify the areas where restrictions should be introduced.
Furthermore, the performed spatiotemporal analysis allows backward and current modelling of COVID-19 vulnerability risk. The precision of the model of vulnerability risk in the time presented in the case study is low due to the limited number of days taken for the temporal analysis in the article. The increase in time model precision could be obtained as a result of setting smaller time intervals between the COVID-19 vulnerability risk maps. However, this would result in an increased number of maps that would be impossible to be included in the article due to its limited length. Therefore, only the concept and the methodology of the research were presented.
The analysis provided in the case study focused on revealing the COVID-19 vulnerability from the point of view of the healthcare system demonstrated that the spatial data enables the determination of the impact of a crisis situation in the field and, eventually, allows making decisions on an appropriate crisis response. This signifies the role of spatial analysis and spatial data sources in the decision-making process.
According to the authors, future research in this field should be continued and the application of proposed methods with different time data intervals and the results should be assessed to reveal the optimal interval for maps to detect vulnerability change. Moreover, the authors believe that the use of the determined static criteria of vulnerability in combination with the selected pandemic prediction model would extend the perspective to a specific future period of time. This would be a significant potential advantage of the proposed method.
Author Contributions
Conceptualization, M.W. and M.G.; methodology, M.W. and M.G.; software, M.W., M.G. and M.K.; validation, M.W., M.G., K.P. and M.K.; formal analysis, M.W., M.G., K.P. and M.K.; investigation, M.W., M.G. and M.K.; resources, M.W. and M.G.; data curation, M.W., M.G. and K.P.; writing—original draft preparation, M.W., M.G. and M.K.; writing—review and editing, M.W., M.G., K.P. and M.K.; visualization, M.W., M.G. and M.K.; supervision, M.W. All authors have read and agreed to the published version of the manuscript.
Funding
This research was funded by Military University of technology Faculty of Civil Engineering and Geodesy Institute of Geospatial Engineering and Geodesy Statutory Research Founds No. 871/2021.
Acknowledgments
The authors would like to thank Albina Mościcka from MUT Warsaw for comments and supervision while writing this article that greatly improved the research.
Conflicts of Interest
The authors declare no conflict of interest.
Appendix A

Table A1.
The remaining criteria scores.
| Criteria/Score | Hsp | Mb | Rd | Rs |
|---|---|---|---|---|
| 2 | <0.1 | <10 K | 1–2 | 0.1–0.2 |
| 3 | 0.1–0.2 | 10 K–50 K | 2–4 | 0.2–0.4 |
| 4 | 0.2–0.4 | 50 K–100 K | 4–6 | 0.4–0.8 |
| 5 | 0.4–0.8 | 100 K–250 K | 6–8 | 0.8–1.5 |
| 6 | 0.8–1.4 | 250 K–400 K | 8–10 | 1.5–2.5 |
| 7 | 1.4–2.2 | 400 K–500 K | 10–12 | 2.5–5.0 |
| 8 | >2.2 | >500 K | 12–15 | 5.0–5.2 |
Appendix B
Figure A1.
New cases of COVID-19 on selected days: (a) 4 March 2020 (b) 12 May 2020 (c) 12 August 2020 (d) 12 November 2020.
Figure A1.
New cases of COVID-19 on selected days: (a) 4 March 2020 (b) 12 May 2020 (c) 12 August 2020 (d) 12 November 2020.

Figure A2.
COVID-19 Hospitalisations on selected days: (a) 12 February 2021 (b) 12 May 2021 (c) 12 August 2021, (d) 22 October 2021.
Figure A2.
COVID-19 Hospitalisations on selected days: (a) 12 February 2021 (b) 12 May 2021 (c) 12 August 2021, (d) 22 October 2021.

Figure A3.
Sequence of CVI estimated in selected days: (a) 12 February 2021 (b) 12 May 2021 (c) 12 August 2021 (d) 22 October 2021.
Figure A3.
Sequence of CVI estimated in selected days: (a) 12 February 2021 (b) 12 May 2021 (c) 12 August 2021 (d) 22 October 2021.

Figure A4.
Vulnerability risk change over time. (a) 12 February 2021–12 May 2021 (b) 12 May 2021–12 August 2021 (c) 12 August 2021–22 October 2021.
Figure A4.
Vulnerability risk change over time. (a) 12 February 2021–12 May 2021 (b) 12 May 2021–12 August 2021 (c) 12 August 2021–22 October 2021.

References
- Zheng, J. SARS-CoV-2: An Emerging Coronavirus That Causes a Global Threat. Int. J. Biol. Sci. 2020, 16, 1678–1685. [Google Scholar] [CrossRef] [PubMed] [Green Version]
- Wise, T.; Zbozinek, T.D.; Michelini, G.; Hagan, C.C.; Mobbs, D. Changes in Risk Perception and Protective Behavior during the First Week of the COVID-19 Pandemic in the United States. R. Soc. Open Sci. 2020, 7, 200742. [Google Scholar] [CrossRef] [PubMed]
- Al-Khudhairy, D.H.A. Geo-Spatial Information and Technologies in Support of EU Crisis Management. Int. J. Digit. Earth 2010, 3, 16–30. [Google Scholar] [CrossRef]
- Van Eck: VOSviewer Manual: Version 1.6. 5—Google Scholar. Available online: https://0-scholar-google-com.brum.beds.ac.uk/scholar_lookup?title=VOSviewer+Manual,+Version+1.6.9&author=van+Eck,+N.J.&author=Waltman,+L.&publication_year=2018 (accessed on 19 November 2021).
- Arabsheibani, R.; Kanani Sadat, Y.; Abedini, A. Land Suitability Assessment for Locating Industrial Parks: A Hybrid Multi Criteria Decision-Making Approach Using Geographical Information System. Geogr. Res. 2016, 54, 446–460. [Google Scholar] [CrossRef]
- Joerin, F.; Thériault, M.; Musy, A. Using GIS and Outranking Multicriteria Analysis for Land-Use Suitability Assessment. Int. J. Geogr. Inf. Sci. 2001, 15, 153–174. [Google Scholar] [CrossRef]
- Bathrellos, G.D.; Skilodimou, H.D.; Chousianitis, K.; Youssef, A.M.; Pradhan, B. Suitability Estimation for Urban Development Using Multi-Hazard Assessment Map. Sci. Total Environ. 2017, 575, 119–134. [Google Scholar] [CrossRef]
- Akpoti, K.; Kabo-bah, A.T.; Zwart, S.J. Review—Agricultural Land Suitability Analysis: State-of-the-Art and Outlooks for Integration of Climate Change Analysis. Agric. Syst. 2019, 173, 172–208. [Google Scholar] [CrossRef]
- Wu, C.; Ding, Y.; Zhou, X.; Lu, G. A Grid Algorithm Suitable for Line and Area Feature Label Placement. Environ. Earth Sci. 2016, 75, 1368. [Google Scholar] [CrossRef]
- Parry, J.T. Terrain Evaluation, Military Purposesterrain Evaluation, Military Purposes. In Applied Geology; Finkl, C.W., Ed.; Encyclopedia of Earth Sciences Series; Kluwer Academic Publishers: Dordrecht, The Netherlands, 1984; Volume 3, pp. 570–581. ISBN 978-0-442-22537-7. [Google Scholar]
- Sarnowski, Ł.; Podgórski, Z.; Brykała, D. Planning a Greenway Based on an Evaluation of Visual Landscape Attractiveness; Biblioteka Uniwersytetu Kazimierza Wielkiego: Bydgoszcz, Poland, 2016. [Google Scholar]
- Carver, S.J. Integrating Multi-Criteria Evaluation with Geographical Information Systems. Int. J. Geogr. Inf. Syst. 1991, 5, 321–339. [Google Scholar] [CrossRef] [Green Version]
- Scala, A.; Facchini, A.; Perna, U.; Basosi, R. Portfolio Analysis and Geographical Allocation of Renewable Sources: A Stochastic Approach. Energy Policy 2019, 125, 154–159. [Google Scholar] [CrossRef]
- Kim, T.J.; Choi, K. GIS for Transportation. In Springer Handbook of Geographic Information; Kresse, W., Danko, D.M., Eds.; Springer Handbooks; Springer: Berlin/Heidelberg, Germany, 2012; pp. 503–521. ISBN 978-3-540-72680-7. [Google Scholar]
- Zhao, S.; Zhuang, Z.; Ran, J.; Lin, J.; Yang, G.; Yang, L.; He, D. The Association between Domestic Train Transportation and Novel Coronavirus (2019-NCoV) Outbreak in China from 2019 to 2020: A Data-Driven Correlational Report. Travel Med. Infect. Dis. 2020, 33, 101568. [Google Scholar] [CrossRef] [PubMed]
- Alexander, D.; Gilbert, R. Infrastructure Assessment Decision Making During a Crisis. Transp. Res. Rec. 2009, 2093, 93–98. [Google Scholar] [CrossRef]
- Ahmed, S.; Ibrahim, R.; Hefny, H. An Efficient Ambulance Routing System for Emergency Cases Based on Dijkstra’s Algorithm, AHP, and GIS. Int. J. Intell. Eng. Syst. 2018, 11, 252–260. [Google Scholar]
- Choosumrong, S.; Raghavan, V.; Bozon, N. Multi-Criteria Emergency Route Planning Based on Analytical Hierarchy Process and PgRouting. Jpn. Soc. Geoinform. 2012, 23, 159–168. [Google Scholar] [CrossRef] [Green Version]
- Pelgrum, H. Spatial Aggregation of Land Surface Characteristics: Impact of Resolution of Remote Sensing Data on Land Surface Modelling; Wageningen University and Research ProQuest Dissertations Publishing: Wageningen, The Netherlands, 2000. [Google Scholar]
- Jithesh, P.K. A Model Based on Cellular Automata for Investigating the Impact of Lockdown, Migration and Vaccination on COVID-19 Dynamics. Comput. Methods Programs Biomed. 2021, 211, 106402. [Google Scholar] [CrossRef]
- Shi, P.; Dong, Y.; Yan, H.; Li, X.; Zhao, C.; Liu, W.; He, M.; Tang, S.; Xi, S. The Impact of Temperature and Absolute Humidity on the Coronavirus Disease 2019 (COVID-19) Outbreak-Evidence from China. MedRxiv 2020. [Google Scholar] [CrossRef] [Green Version]
- Pokonieczny, K. Using Artificial Neural Networks to Determine the Location of Wind Farms. Miedzna District Case Study. J. Water Land Dev. 2016, 30, 101–111. [Google Scholar] [CrossRef]
- Chen, Z.-L.; Zhang, Q.; Lu, Y.; Guo, Z.-M.; Zhang, X.; Zhang, W.-J.; Guo, C.; Liao, C.-H.; Li, Q.-L.; Han, X.-H.; et al. Distribution of the COVID-19 Epidemic and Correlation with Population Emigration from Wuhan, China. Chin. Med. J. 2020, 133, 1044–1050. [Google Scholar] [CrossRef]
- French, S.; Argyris, N.; Haywood, S.; Hort, M.; Smith, J. Communicating Geographical Risks in Crisis Management: The Need for Research. Risk Anal. 2019, 39, 9–16. [Google Scholar] [CrossRef] [Green Version]
- Ai, F.; Comfort, L.K.; Dong, Y.; Znati, T. A Dynamic Decision Support System Based on Geographical Information and Mobile Social Networks: A Model for Tsunami Risk Mitigation in Padang, Indonesia. Saf. Sci. 2016, 90, 62–74. [Google Scholar] [CrossRef]
- Ahola, T.; Virrantaus, K.; Krisp, J.M.; Hunter, G.J. A Spatio-temporal Population Model to Support Risk Assessment and Damage Analysis for Decision-making. Int. J. Geogr. Inf. Sci. 2007, 21, 935–953. [Google Scholar] [CrossRef]
- Teodoro, A.C.; Duarte, L. Forest Fire Risk Maps: A GIS Open Source Application—A Case Study in Norwest of Portugal. Int. J. Geogr. Inf. Sci. 2013, 27, 699–720. [Google Scholar] [CrossRef]
- Ejigu, B.A.; Wencheko, E.; Moraga, P.; Giorgi, E. Geostatistical Methods for Modelling Non-Stationary Patterns in Disease Risk. Spat. Stat. 2020, 35, 100397. [Google Scholar] [CrossRef]
- Leone, F.; Colas, A.; Garcin, Y.; Eckert, N.; Jomelli, V.; Gherardi, M. The Snow Avalanches Risk on Alpine Roads Network Assessment of Impacts and Mapping of Accessibility Loss. Rev. Geogr. Alp.-J. Alp. Res. 2014, 102. [Google Scholar] [CrossRef] [Green Version]
- de Brito, M.M.; Evers, M. Multi-Criteria Decision-Making for Flood Risk Management: A Survey of the Current State of the Art. Nat. Hazards Earth Syst. Sci. 2016, 16, 1019–1033. [Google Scholar] [CrossRef] [Green Version]
- Shadeed, S.; Alawna, S. GIS-Based COVID-19 Vulnerability Mapping in the West Bank, Palestine. Int. J. Disaster Risk Reduct. 2021, 64, 102483. [Google Scholar] [CrossRef]
- Doorga, J.R.S.; Magerl, L.; Bunwaree, P.; Zhao, J.; Watkins, S.; Staub, C.G.; Rughooputh, S.D.D.V.; Cunden, T.S.M.; Lollchund, R.; Boojhawon, R. GIS-Based Multi-Criteria Modelling of Flood Risk Susceptibility in Port Louis, Mauritius: Towards Resilient Flood Management. Int. J. Disaster Risk Reduct. 2022, 67, 102683. [Google Scholar] [CrossRef]
- Geneletti, D.; Scolozzi, R.; Adem Esmail, B. Assessing Ecosystem Services and Biodiversity Tradeoffs across Agricultural Landscapes in a Mountain Region. Int. J. Biodivers. Sci. Ecosyst. Serv. Manag. 2018, 14, 188–208. [Google Scholar] [CrossRef] [Green Version]
- Gonzalez, A.; Enríquez-de-Salamanca, Á. Spatial Multi-Criteria Analysis in Environmental Assessment: A Review and Reflection on Benefits and Limitations. J. Environ. Assess. Policy Manag. 2018, 20, 1840001. [Google Scholar] [CrossRef]
- Argyris, N.; Ferretti, V.; French, S.; Guikema, S.; Montibeller, G. Advances in Spatial Risk Analysis. Risk Anal. 2019, 39, 1–8. [Google Scholar] [CrossRef] [Green Version]
- Majlingova, A.; Buzalka, J. Crisis Management Based on GIS—Case Study. In Proceedings of the Fire Protection, Safety and Security 2017, Zvolen, Slovakia, 3–5 May 2017; Majlingova, A., VelKova, V., Eds.; pp. 340–350. [Google Scholar]
- Becker, T.; Konig, G. Generalized Cartographic and Simultaneous Representation of Utility Networks for Decision-Support Systems and Crisis Management in Urban Environments. In Proceedings of the International Geoinformation Conference, Kuala Lumpur, Malaysia, 28–30 October 2015; Rahman, A., Isikdag, U., Castro, F., Eds.; Volume II–2, pp. 19–28. [Google Scholar]
- Reeves, J.J.; Hollandsworth, H.M.; Torriani, F.J.; Taplitz, R.; Abeles, S.; Tai-Seale, M.; Millen, M.; Clay, B.J.; Longhurst, C.A. Rapid Response to COVID-19: Health Informatics Support for Outbreak Management in an Academic Health System. J. Am. Med. Inf. Assoc. 2020, 27, 853–859. [Google Scholar] [CrossRef] [PubMed] [Green Version]
- Ernst, V.; Ostrovskii, M. Intelligent Cartographic Presentations for Emergency Situations; Loffler, J., Klann, M., Eds.; Springer: Berlin/Heidelberg, Germany, 2007; Volume 4458, pp. 77–84. [Google Scholar]
- Kehl, C.; de Haan, G. Interactive Simulation and Visualisation of Realistic Flooding Scenarios; Zlatanova, S., Dilo, A., Peters, R., Scholten, H., Eds.; Springer: Berlin/Heidelberg, Germany, 2013; pp. 79–93. [Google Scholar]
- Dilo, A.; Zlatanova, S. Spatiotemporal Data Modeling for Disaster Management in The Netherlands. In Proceedings of the Joint ISCRAM-CHINA and GI4DM Conference, Harbin, China, 4 August 2008. [Google Scholar]
- The Use of Subjective-Objective Weights in GIS-Based Multi-Criteria Decision Analysis for Flood Hazard Assessment: A Case Study in Mazandaran, Iran-Web of Science Core Collection. Available online: https://www-1webofscience-1com-100003exr00f6.han.wat.edu.pl/wos/woscc/full-record/WOS:000617914700020 (accessed on 7 November 2021).
- Chen, W.; Zhang, S.; Li, R.; Shahabi, H. Performance Evaluation of the GIS-Based Data Mining Techniques of Best-First Decision Tree, Random Forest, and Naive Bayes Tree for Landslide Susceptibility Modeling. Sci. Total Environ. 2018, 644, 1006–1018. [Google Scholar] [CrossRef] [PubMed]
- Bezerra, É.C.D.; dos Santos, P.S.; Lisbinski, F.C.; Dias, L.C. Análise espacial das condições de enfrentamento à COVID-19: Uma proposta de Índice da Infraestrutura da Saúde do Brasil. Ciênc. Saúde Coletiva 2020, 25, 4957–4967. [Google Scholar] [CrossRef] [PubMed]
- Water Crisis Analysis Using GIS; Case Study: Nishabur Plain, Iran. Available online: https://scialert.net/fulltext/?doi=ajps.2007.884.891 (accessed on 9 December 2021).
- Budzynski, M.; Luczkiewicz, A.; Szmaglinski, J. Assessing the Risk in Urban Public Transport for Epidemiologic Factors. Energies 2021, 14, 4513. [Google Scholar] [CrossRef]
- Davidovsky, A. System Analysis and Forecasting of the Relationship between Economic Factors and the Epidemic Process COVID-19 to Optimize International Transport Communications in the Context of a Pandemic; Atlantis Press: Amsterdam, The Netherlands, 2020; pp. 473–479. [Google Scholar]
- Kim, J.-C.; Lee, S.; Jung, H.-S.; Lee, S. Landslide Susceptibility Mapping Using Random Forest and Boosted Tree Models in Pyeong-Chang, Korea. Geocarto Int. 2018, 33, 1000–1015. [Google Scholar] [CrossRef]
- Pourghasemi, H.R.; Gayen, A.; Edalat, M.; Zarafshar, M.; Tiefenbacher, J.P. Is Multi-Hazard Mapping Effective in Assessing Natural Hazards and Integrated Watershed Management? Geosci. Front. 2020, 11, 1203–1217. [Google Scholar] [CrossRef]
- Pourghasemi, H.R.; Pouyan, S.; Heidari, B.; Farajzadeh, Z.; Fallah Shamsi, S.R.; Babaei, S.; Khosravi, R.; Etemadi, M.; Ghanbarian, G.; Farhadi, A.; et al. Spatial Modeling, Risk Mapping, Change Detection, and Outbreak Trend Analysis of Coronavirus (COVID-19) in Iran (Days between February 19 and June 14, 2020). Int. J. Infect. Dis. 2020, 98, 90–108. [Google Scholar] [CrossRef]
- Feizizadeh, B.; Blaschke, T. GIS-Multicriteria Decision Analysis for Landslide Susceptibility Mapping: Comparing Three Methods for the Urmia Lake Basin, Iran. Nat. Hazards 2013, 65, 2105–2128. [Google Scholar] [CrossRef]
- Pham, B.T.; Bui, D.T.; Pourghasemi, H.R.; Indra, P.; Dholakia, M.B. Landslide Susceptibility Assesssment in the Uttarakhand Area (India) Using GIS: A Comparison Study of Prediction Capability of naïve Bayes, Multilayer Perceptron Neural Networks, and Functional Trees Methods. Theor. Appl. Climatol. 2017, 128, 255–273. [Google Scholar] [CrossRef]
- Mohamed, S.; El-Raey, M. Vulnerability Assessment for Flash Floods Using GIS Spatial Modeling and Remotely Sensed Data in El-Arish City, North Sinai, Egypt. Nat. Hazards 2020, 102, 707–728. [Google Scholar] [CrossRef]
- Jena, R.; Pradhan, B.; Al-Amri, A.; Lee, C.W.; Park, H.-J. Earthquake Probability Assessment for the Indian Subcontinent Using Deep Learning. Sensor 2020, 20, 4369. [Google Scholar] [CrossRef] [PubMed]
- Web-Based Geospatial Multiple Criteria Decision Analysis Using Open Software and Standards-Web of Science Core Collection. Available online: https://www-1webofscience-1com-100003exr00f6.han.wat.edu.pl/wos/woscc/full-record/WOS:000374902300010 (accessed on 7 November 2021).
- Feizizadeh, B.; Jankowski, P.; Blaschke, T. A GIS Based Spatially-Explicit Sensitivity and Uncertainty Analysis Approach for Multi-Criteria Decision Analysis. Comput. Geosci. 2014, 64, 81–95. [Google Scholar] [CrossRef] [PubMed] [Green Version]
- Warren, M.S.; Skillman, S.W. Mobility Changes in Response to COVID-19. arXiv 2020, arXiv:2003.14228. [Google Scholar]
- Yang, C.; Sha, D.; Liu, Q.; Li, Y.; Lan, H.; Guan, W.W.; Hu, T.; Li, Z.; Zhang, Z.; Thompson, J.H.; et al. Taking the Pulse of COVID-19: A Spatiotemporal Perspective. Int. J. Digit. Earth 2020, 13, 1186–1211. [Google Scholar] [CrossRef]
- Zheng: Spatial Transmission of COVID-19 via Public…—Google Scholar. Available online: https://0-scholar-google-com.brum.beds.ac.uk/scholar_lookup?title=Spatial+transmission+of+COVID-19+via+public+and+private+transportation+in+China&author=Zheng,+R.&author=Xu,+Y.&author=Wang,+W.&author=Ning,+G.&author=Bi,+Y.&publication_year=2020&journal=Travel+Med.+Infect.+Dis.&volume=34&pages=101626&doi=10.1016/j.tmaid.2020.101626 (accessed on 27 November 2021).
- Ma, Y.; Zhao, Y.; Liu, J.; He, X.; Wang, B.; Fu, S.; Yan, J.; Niu, J.; Zhou, J.; Luo, B. Effects of Temperature Variation and Humidity on the Death of COVID-19 in Wuhan, China. Sci. Total Environ. 2020, 724, 138226. [Google Scholar] [CrossRef] [PubMed]
- Shakhovska, N.; Izonin, I.; Melnykova, N. The Hierarchical Classifier for COVID-19 Resistance Evaluation. Data 2021, 6, 6. [Google Scholar] [CrossRef]
- Liu, Q.; Liu, W.; Sha, D.; Kumar, S.; Chang, E.; Arora, V.; Lan, H.; Li, Y.; Wang, Z.; Zhang, Y.; et al. An Environmental Data Collection for COVID-19 Pandemic Research. Data 2020, 5, 68. [Google Scholar] [CrossRef]
- Ferreira, M.C. Spatial Association between the Incidence Rate of COVID-19 and Poverty in the São Paulo Municipality, Brazil. Geospat. Health 2020, 15. [Google Scholar] [CrossRef]
- Dryhurst, S.; Schneider, C.R.; Kerr, J.; Freeman, A.L.J.; Recchia, G.; van der Bles, A.M.; Spiegelhalter, D.; van der Linden, S. Risk Perceptions of COVID-19 around the World. J. Risk Res. 2020, 23, 994–1006. [Google Scholar] [CrossRef]
- Carcione, J.M.; Santos, J.E.; Bagaini, C.; Ba, J. A Simulation of a COVID-19 Epidemic Based on a Deterministic SEIR Model. Front. Public Health 2020, 8, 230. [Google Scholar] [CrossRef]
- Chen: Transmission Dynamics of a Two-City SIR Epidemic…—Google Scholar. Available online: https://0-scholar-google-com.brum.beds.ac.uk/scholar_lookup?title=Transmission+dynamics+of+a+two-city+SIR+epidemic+model+with+transport-related+infections&author=Chen,+Y.&author=Yan,+M.&author=Xiang,+Z.&publication_year=2014&journal=J.+Appl.+Math.&volume=2014&doi=10.1155/2014/764278 (accessed on 27 November 2021).
- Pagano, A.; Pluchinotta, I.; Giordano, R.; Petrangeli, A.; Fratino, U.; Vurro, M. Dealing with Uncertainty in Decision-Making for Drinking Water Supply Systems Exposed to Extreme Events. Water Resour. Manag. 2018, 32, 2131–2145. [Google Scholar] [CrossRef]
- Epidemic Analysis of COVID-19 in Italy Based on Spatiotemporal Geographic Information and Google Trends-Niu-2021-Transboundary and Emerging Diseases—Wiley Online Library. Available online: https://0-onlinelibrary-wiley-com.brum.beds.ac.uk/doi/10.1111/tbed.13902 (accessed on 19 November 2021).
- Mościcka, A.; Araszkiewicz, A.; Wabiński, J.; Kuźma, M.; Kiliszek, D. Modeling of Various Spatial Patterns of SARS-CoV-2: The Case of Germany. J. Clin. Med. 2021, 10, 1409. [Google Scholar] [CrossRef] [PubMed]
- Wang, Y.; Liu, Y.; Struthers, J.; Lian, M. Spatiotemporal Characteristics of the COVID-19 Epidemic in the United States. Clin. Infect. Dis. 2021, 72, 643–651. [Google Scholar] [CrossRef] [PubMed]
- Javidan, N.; Kavian, A.; Pourghasemi, H.R.; Conoscenti, C.; Jafarian, Z.; Rodrigo-Comino, J. Evaluation of Multi-Hazard Map Produced Using MaxEnt Machine Learning Technique. Sci. Rep. 2021, 11, 6496. [Google Scholar] [CrossRef]
- Sha, D.; Malarvizhi, A.S.; Liu, Q.; Tian, Y.; Zhou, Y.; Ruan, S.; Dong, R.; Carte, K.; Lan, H.; Wang, Z.; et al. A State-Level Socioeconomic Data Collection of the United States for COVID-19 Research. Data 2020, 5, 118. [Google Scholar] [CrossRef]
- Swapnarekha, H.; Behera, H.S.; Nayak, J.; Naik, B. Role of Intelligent Computing in COVID-19 Prognosis: A State-of-the-Art Review. Chaos Solitons Fractals 2020, 138, 109947. [Google Scholar] [CrossRef]
- Zhang, Z.; Cheshmehzangi, A.; Ardakani, S.P. A Data-Driven Clustering Analysis for the Impact of COVID-19 on the Electricity Consumption Pattern of Zhejiang Province, China. Energies 2021, 14, 8187. [Google Scholar] [CrossRef]
- Nagaj, R.; Žuromskaitė, B. Tourism in the Era of COVID-19 and Its Impact on the Environment. Energies 2021, 14, 2000. [Google Scholar] [CrossRef]
- Navon, A.; Machlev, R.; Carmon, D.; Onile, A.E.; Belikov, J.; Levron, Y. Effects of the COVID-19 Pandemic on Energy Systems and Electric Power Grids—A Review of the Challenges Ahead. Energies 2021, 14, 1056. [Google Scholar] [CrossRef]
- Polikarpov, I.; Al-Yamani, F.; Petrov, P.; Saburova, M.; Mihalkov, V.; Al-Enezi, A. Phytoplankton Bloom Detection during the COVID-19 Lockdown with Remote Sensing Data: Using Copernicus Sentinel-3 for North-Western Arabian/Persian Gulf Case Study. Mar. Pollut. Bull. 2021, 171, 112734. [Google Scholar] [CrossRef]
- Nayak, J.; Mishra, M.; Naik, B.; Swapnarekha, H.; Cengiz, K.; Shanmuganathan, V. An Impact Study of COVID-19 on Six Different Industries: Automobile, Energy and Power, Agriculture, Education, Travel and Tourism and Consumer Electronics. Expert Syst. 2022, 39, e12677. [Google Scholar] [CrossRef] [PubMed]
- Chretien: Influenza Forecasting in Human Populations:…—Google Scholar. Available online: https://0-scholar-google-com.brum.beds.ac.uk/scholar_lookup?title=Influenza%20forecasting%20in%20human%20populations%3A%20a%20scoping%20review&publication_year=2014&author=J.P.%20Chretien&author=D.%20George&author=J.%20Shaman&author=R.A.%20Chitale&author=F.E.%20McKenzie (accessed on 27 December 2021).
- Collins, A.; Florin, M.-V.; Renn, O. COVID-19 Risk Governance: Drivers, Responses and Lessons to Be Learned. J. Risk Res. 2020, 23, 1073–1082. [Google Scholar] [CrossRef]
- Board: A World at Risk—Google Scholar. Available online: https://0-scholar-google-com.brum.beds.ac.uk/scholar_lookup?hl=en&publication_year=2019&author=Global+Preparedness+Monitoring+Board&title=A+World+at+Risk%3A+Annual+Report+on+Global+Preparedness+for+Health+Emergencies. (accessed on 19 November 2021).
- Alharbi, R. A GIS-Based Decision Support System for Reducing Air Ambulance Response Times: A Case Study on Public Schools in Jeddah City. J. Geogr. Inf. Syst. 2015, 07, 384. [Google Scholar] [CrossRef] [Green Version]
- Chopra, V.; Toner, E.; Waldhorn, R.; Washer, L. How Should US Hospitals Prepare for Coronavirus Disease 2019 (COVID-19)? Ann. Intern. Med. 2020, 172, 621–622. [Google Scholar] [CrossRef] [Green Version]
- Swerdlow, D.L.; Finelli, L. Preparation for Possible Sustained Transmission of 2019 Novel Coronavirus: Lessons From Previous Epidemics. JAMA-J. Am. Med. Assoc. 2020, 323, 1129–1130. [Google Scholar] [CrossRef]
- Liu, Q.; Luo, D.; Haase, J.E.; Guo, Q.; Wang, X.Q.; Liu, S.; Xia, L.; Liu, Z.; Yang, J.; Yang, B.X. The Experiences of Health-Care Providers during the COVID-19 Crisis in China: A Qualitative Study. Lancet Glob. Health 2020, 8, E790–E798. [Google Scholar] [CrossRef]
- Malczewski, J. GIS-based Multicriteria Decision Analysis: A Survey of the Literature. Int. J. Geogr. Inf. Sci. 2006, 20, 703–726. [Google Scholar] [CrossRef]
- Malczewski, J.; Jankowski, P. Emerging Trends and Research Frontiers in Spatial Multicriteria Analysis. Int. J. Geogr. Inf. Sci. 2020, 34, 1257–1282. [Google Scholar] [CrossRef]
- Flanagan, B.E.; Hallisey, E.J.; Adams, E.; Lavery, A. Measuring Community Vulnerability to Natural and Anthropogenic Hazards: The Centers for Disease Control and Prevention’s Social Vulnerability Index. J. Environ. Health 2018, 80, 34–36. [Google Scholar]
- Saaty, T.L. The Analytic Hierarchy Process: Planning, Priority Setting, Resource Allocation; RWS: Chalfont Saint Peter, UK, 1990; ISBN 978-0-9620317-2-4. [Google Scholar]
- Corona-Pandemie Führt zu Übersterblichkeit in Deutschland. Available online: https://www.destatis.de/DE/Presse/Pressemitteilungen/2021/12/PD21_563_12.html (accessed on 1 February 2022).
- RKI-COVID-19-COVID-19. Available online: https://www.rki.de/EN/Content/infections/epidemiology/outbreaks/COVID-19/COVID19.html (accessed on 1 February 2022).
- OpenStreetMap. Available online: https://www.openstreetmap.org/ (accessed on 1 February 2022).
- COVID-19-Trends in Deutschland Im Überblick. Available online: https://www.rki.de/DE/Content/InfAZ/N/Neuartiges_Coronavirus/Situationsberichte/COVID-19-Trends/COVID-19-Trends.html?__blob=publicationFile#/home (accessed on 25 November 2021).
Figure 1.
Weighted network visualisation of associations between terms within “crisis management spatial analysis” keyword relations (own study).
Figure 1.
Weighted network visualisation of associations between terms within “crisis management spatial analysis” keyword relations (own study).

Figure 2.
Healthcare system capacity and possible new cases.

Figure 3.
The methodology of spatiotemporal index estimation performed in research (own study).

Figure 4.
VSc map for population density.

Figure 5.
Maps of VSc for selected dynamic criteria on 12 May 2021 (a) new cases (b) hospitalisations (c) public transport (d) fully vaccinated (e) turnover from food and accommodation services.
Figure 5.
Maps of VSc for selected dynamic criteria on 12 May 2021 (a) new cases (b) hospitalisations (c) public transport (d) fully vaccinated (e) turnover from food and accommodation services.

Figure 6.
Maps of VSc for selected static criteria on 12 May 2021 (a) number of hospital beds (b) number of hospitals (c) density of roads (d) density of railways.
Figure 6.
Maps of VSc for selected static criteria on 12 May 2021 (a) number of hospital beds (b) number of hospitals (c) density of roads (d) density of railways.

Figure 7.
COVID-19 Vulnerability risk map.

Figure 8.
Cumulative COVID-19 Vaccinations on selected days: (a) 12 February 2021 (b) 12 May 2021 (c) 12 August 2021 (d) 22 October 2021.
Figure 8.
Cumulative COVID-19 Vaccinations on selected days: (a) 12 February 2021 (b) 12 May 2021 (c) 12 August 2021 (d) 22 October 2021.

Figure 9.
New cases of COVID-19 on selected days: (a) 4 March 2020 (b) 12 May 2020 (c) 12 August 2020 (d) 12 November 2020 remaining maps available in Figure A1.
Figure 9.
New cases of COVID-19 on selected days: (a) 4 March 2020 (b) 12 May 2020 (c) 12 August 2020 (d) 12 November 2020 remaining maps available in Figure A1.

Figure 10.
COVID-19 new cases in time chart [93].
Figure 10.
COVID-19 new cases in time chart [93].

Figure 11.
COVID-19 Hospitalisations on selected days: (a) 4 March 2020 (b) 12 May 2020 (c) 12 August 2020 (d) 12 November 2020 remaining maps available in Figure A2.
Figure 11.
COVID-19 Hospitalisations on selected days: (a) 4 March 2020 (b) 12 May 2020 (c) 12 August 2020 (d) 12 November 2020 remaining maps available in Figure A2.


Figure 12.
Sequence of CVI estimated in selected days: (a) 4 March 2020 (b) 12 May 2020 (c) 12 August 2020 (d) 12 November 2020 remaining maps available in Figure A3.
Figure 12.
Sequence of CVI estimated in selected days: (a) 4 March 2020 (b) 12 May 2020 (c) 12 August 2020 (d) 12 November 2020 remaining maps available in Figure A3.

Figure 13.
The static (a) dynamic (b) static and (c) summary vulnerability risk for each federal state on selected days.
Figure 13.
The static (a) dynamic (b) static and (c) summary vulnerability risk for each federal state on selected days.

Figure 14.
Vulnerability risk changes over time. (a) 4 March 2020–12 May 2020 (b) 12 May 2020–12 August 2020 (c) 12 August 2020–12 November 2020 (d) 12 November 2020–12 February 2021 remaining maps are available in Figure A4.
Figure 14.
Vulnerability risk changes over time. (a) 4 March 2020–12 May 2020 (b) 12 May 2020–12 August 2020 (c) 12 August 2020–12 November 2020 (d) 12 November 2020–12 February 2021 remaining maps are available in Figure A4.


Figure 15.
CVI and COVID-19 confirmed cases in (a) Berlin, (b) Brandenburg and (c) Nordrhein-Westfalen.
Figure 15.
CVI and COVID-19 confirmed cases in (a) Berlin, (b) Brandenburg and (c) Nordrhein-Westfalen.

Figure 16.
The CVI and new cases relation in the (a) Berlin, (b) Brandenburg and (c) Nordrhein-Westfalen.
Figure 16.
The CVI and new cases relation in the (a) Berlin, (b) Brandenburg and (c) Nordrhein-Westfalen.

Table 1.
SMCA criteria and criteria data sources (own study).
| Criteria | Criteria Explanation | Data Source | Criteria Type |
|---|---|---|---|
| Cas | Number of COVID cases per 100,000 inhabitants | rki.de | Dynamic |
| Serv | Turnover rate for accommodation and food services in relation to the period before the pandemic | destatis.de | |
| Mb | The estimation of population movement | destatis.de | |
| Hsp | Number of COVID hospitalisations per 100,000 inhabitants | rki.de | |
| Vacc | Population percentage of two doses vaccinated | rki.de | |
| Hos | Number of hospitals in the region per 100,000 inhabitants | destatis.de | Static |
| Hbed | Total number of hospital beds on region per 100,000 inhabitants | destatis.de | |
| PDen | Population density per sq. km | destatis.de | |
| Rd | Total length of roads in the region | OSM | |
| Rs | Total length of railways in the region | OSM |
Table 2.
Determination of relative importance based on own study [90].
Table 2.
Determination of relative importance based on own study [90].
| Relative Importance | Definition | Explanation |
|---|---|---|
| 1 | Equal importance | Two activities contribute equally to objective |
| 3 | Weak importance | Experience and judgement slightly favour one activity over another |
| 5 | Strong importance | Experience and judgement strongly favour one activity over another |
| 7 | Demonstrated importance | One activity is strongly favoured and demonstrated in practice |
| 9 | Extreme importance | The evidence favouring one activity over another is of the highest possible order of affirmation |
| 2, 4, 6, 8 | Intermediate values | When compromise is needed between two adjacent judgments |
Table 3.
AHP pairwise comparison matrix with calculated weights (own study based the [90]).
Table 3.
AHP pairwise comparison matrix with calculated weights (own study based the [90]).
| PDen | Serv | Hos | Hbed | Cas | Vacc | Hsp | Mb | Rd | Rs | Criteria Weight | |
|---|---|---|---|---|---|---|---|---|---|---|---|
| PDen | 1.00 | 6.00 | 0.25 | 0.25 | 0.50 | 2.00 | 3.00 | 4.00 | 3.00 | 4.00 | 0.10 |
| Serv | 0.16 | 1.00 | 0.11 | 0.11 | 0.14 | 0.25 | 0.25 | 0.33 | 0.50 | 0.33 | 0.02 |
| Hos | 4.00 | 9.00 | 1.00 | 2.00 | 3.00 | 4.00 | 3.00 | 8.00 | 8.00 | 8.00 | 0.26 |
| Hbed | 4.00 | 9.00 | 0.50 | 1.00 | 4.00 | 4.00 | 6.00 | 8.00 | 8.00 | 8.00 | 0.25 |
| Cas | 2.00 | 7.00 | 0.33 | 0.25 | 1.00 | 3.00 | 3.00 | 6.00 | 6.00 | 6.00 | 0.14 |
| Vacc | 0.50 | 4.00 | 0.25 | 0.25 | 0.33 | 1.00 | 0.25 | 5.00 | 4.00 | 5.00 | 0.07 |
| Hsp | 0.33 | 4.00 | 0.33 | 0.16 | 0.33 | 4.00 | 1.00 | 4.00 | 3.00 | 4.00 | 0.08 |
| Mb | 0.25 | 3.00 | 0.13 | 0.13 | 0.16 | 0.20 | 0.25 | 1.00 | 2.00 | 2.00 | 0.03 |
| Rd | 0.33 | 2.00 | 0.13 | 0.13 | 0.16 | 0.25 | 0.33 | 0.50 | 1.00 | 2.00 | 0.03 |
| Rs | 0.25 | 3.00 | 0.13 | 0.13 | 0.16 | 0.20 | 0.25 | 0.50 | 0.50 | 1.00 | 0.02 |
Table 4.
The selected criteria scores (own study based on [90]).
Table 4.
The selected criteria scores (own study based on [90]).
| Criteria/VSc | PDen | Serv | Hos | Hbed | Cas | Vacc |
|---|---|---|---|---|---|---|
| 2 | <100 | <20 | >10 | >2000 | <1 | >75 |
| 3 | 100–200 | 20–40 | 8–10 | 1400–2000 | 1–2 | 60–75 |
| 4 | 200–300 | 40–55 | 6–8 | 800–1400 | 2–6 | 50–60 |
| 5 | 300–500 | 55–70 | 4–6 | 400–800 | 6–12 | 30–50 |
| 6 | 500–1000 | 70–85 | 2–4 | 200–400 | 12–20 | 15–30 |
| 7 | 1000–2000 | 85–100 | 1–2 | 100–200 | 20–30 | 5–15 |
| 8 | >2000 | >100 | <1 | <100 | >30 | <5 |
Table 5.
Number of the German population endangered with a certain level of vulnerability over time.
Table 5.
Number of the German population endangered with a certain level of vulnerability over time.
| 4 March 2020 | 12 May 2020 | 12 August 2020 | 12 November 2021 | 12 February 2021 | 12 May 2021 | 12 August 2021 | 22 October 2021 | |
|---|---|---|---|---|---|---|---|---|
| Very Low | 44,717,994 | 33,610,761 | 44,717,994 | 0 | 13,142,063 | 15,671,946 | 44,717,994 | 33,610,761 |
| Low | 15,391,927 | 24,374,711 | 15,391,927 | 44,717,994 | 31,575,931 | 29,046,048 | 9,097,291 | 14,017,604 |
| Medium | 15,273,831 | 17,398,280 | 14,288,686 | 9,097,292 | 17,366,538 | 17,366,538 | 20,583,322 | 26,770,242 |
| High | 7,810,535 | 7,129,840 | 8,114,985 | 22,194,140 | 13,299,220 | 18,577,079 | 6,263,004 | 8,114,985 |
| Very High | 0 | 680,695 | 680,695 | 7,184,861 | 7,810,535 | 2,532,676 | 2,532,676 | 680,695 |
Table 6.
CVI and new COVID-19 Cases in time for Berlin, Brandenburg, Nordrhein-Westfalen.
| 4 March 2020 | 12 May 2020 | 12 August 2020 | 12 November 2020 | 12 February 2021 | 12 May 2021 | 12 August 2021 | 22 October 2021 | ||
|---|---|---|---|---|---|---|---|---|---|
| Berlin | Cases | 7 | 2 | 111 | 1132 | 485 | 510 | 358 | 713 |
| CVI | 5.52 | 5.67 | 5.86 | 6.34 | 6.03 | 5.95 | 5.67 | 5.74 | |
| Brandenburg | Cases | 1 | 5 | 8 | 452 | 374 | 397 | 116 | 685 |
| CVI | 3.09 | 3.13 | 3.21 | 3.59 | 3.63 | 3.43 | 3.13 | 3.43 | |
| Nordrhein-Westfalen | Cases | 115 | 201 | 413 | 4615 | 1881 | 3108 | 1886 | 2284 |
| CVI | 3.59 | 3.81 | 3.82 | 4.56 | 4.26 | 4.32 | 3.81 | 3.82 |
Publisher’s Note: MDPI stays neutral with regard to jurisdictional claims in published maps and institutional affiliations. |
© 2022 by the authors. Licensee MDPI, Basel, Switzerland. This article is an open access article distributed under the terms and conditions of the Creative Commons Attribution (CC BY) license (https://creativecommons.org/licenses/by/4.0/).
Share and Cite
MDPI and ACS Style
Wyszyński, M.; Grudziński, M.; Pokonieczny, K.; Kaszubowski, M. The Assessment of COVID-19 Vulnerability Risk for Crisis Management. Appl. Sci. 2022, 12, 4090. https://0-doi-org.brum.beds.ac.uk/10.3390/app12084090
AMA Style
Wyszyński M, Grudziński M, Pokonieczny K, Kaszubowski M. The Assessment of COVID-19 Vulnerability Risk for Crisis Management. Applied Sciences. 2022; 12(8):4090. https://0-doi-org.brum.beds.ac.uk/10.3390/app12084090
Chicago/Turabian StyleWyszyński, Marek, Michał Grudziński, Krzysztof Pokonieczny, and Marek Kaszubowski. 2022. "The Assessment of COVID-19 Vulnerability Risk for Crisis Management" Applied Sciences 12, no. 8: 4090. https://0-doi-org.brum.beds.ac.uk/10.3390/app12084090
Note that from the first issue of 2016, this journal uses article numbers instead of page numbers. See further details here.