
GAIA: Great-Distribution Artificial Intelligence-Based Algorithm for Advanced Large-Scale Commercial Store Management

Astrea Consulting srl—R&D Department, Via F. Bruno, Petralia Soprana, 90026 Palermo, Italy
*
Author to whom correspondence should be addressed.
Appl. Sci. 2022, 12(9), 4798; https://0-doi-org.brum.beds.ac.uk/10.3390/app12094798
Submission received: 28 March 2022
/
Revised: 4 May 2022
/
Accepted: 7 May 2022
/
Published: 9 May 2022
(This article belongs to the Special Issue Advanced Deep Learning Methods for Large-Scale Food Distribution)
Abstract
:Today, the intelligent management of market stores in the large distribution field represents one of the most difficult tasks to address, considering the various problems to be managed. Specifically, from the classic issues of managing out-of-stock to the reconstruction of customer sentiment and the optimal management of shelves, scientific research has placed considerable effort on producing robust and efficient solutions to the aforementioned problems. In this context, modern deep learning techniques have allowed for the development of intelligent and adaptive systems capable of automating and significantly improving the management of a large-scale distribution market. Specifically, the authors have designed and implemented an innovative full pipeline that integrates modern deep learning technologies. More in detail, an innovative pipeline embedding a visual AI-based engine for customer sentiment assessment merged with a deep framework for stock management and market store cashflow monitoring is proposed. The innovative proposed system has been tested and validated in a large-scale distribution supermarket, confirming the effectiveness of the proposed solution. Specifically, in the performed testing sessions, the designed pipeline was able to show ad hoc visual customer sentiment assessment with an accuracy of 95% as well as intelligent stock monitoring with an accuracy of 93% in cross validation.
1. Introduction
Modern artificial intelligence (AI) techniques have recently been used effectively to improve solutions in multiple application fields, to name a few: the medical field, industrial field, automotive, and so on [1,2,3].
Recently, AI-based approaches have also been applied in applications in the field of large-scale distribution [1,2]. Specifically, the scientific community is currently investigating the development of intelligent solutions capable of making the management of large-scale food supermarkets easier, providing an effective out-of-stock issue, customer sentiment monitoring, etc. [1,2]. Through the use of modern approaches based on AI or an AI-cloud, the modern advanced solutions for the management of large-scale distribution offer a high level of customization of business processes to create an “intelligent agent” capable of increasing profits, reducing inefficiencies and optimizing warehouse stock [2,3,4]. According to a recent study, the out-of-stock phenomenon together with the classic inefficiencies of large-scale market stores cause an average loss of about EUR 110 billion for European retailers every year [1,2,3,4], a fact that becomes more impactful in the case of the food industry, to which is added the waste resulting from expired products. These uncorrected inefficiencies, in addition to causing a reduction in turnover linked to the loss of sales, can generate important repercussions to customer satisfaction.
Therefore, the problem that will be addressed by the authors in this scientific contribution specifically concerns the management of stock in warehouses and the correct monitoring of out-of-stock phenomena or inventory surplus. These aspects do not depend exclusively on the dynamics of purchase orders but rather on the study of the dynamics of customers in the market store (purchasing habits, purchasing methods, seasonality, in general what the authors defined as “sentiment of the customer” in this work). In addition to this, the financial flow of daily purchases and the visual monitoring of the various shelves of the market store actively contribute to characterizing the dynamics of the stock in the warehouse. Furthermore, by cross-referencing the data of the financial flows of product purchases with the sentiment reconstructed by the system herein proposed, the authors will be able to reconstruct—for each category of products monitored—the actual “interest or sentiment” of customers for those specific products.
In order to address the aforementioned issues, the authors, in the context of the R&D activity dedicated to this market field, have designed and implemented a complete novel system named GAIA (Great-distribution Artificial Intelligence-based Algorithms) which provides an intelligent solution to the inefficiencies described above. Specifically, the GAIA system is a composite pipeline capable of monitoring warehouse stock by means of a visual assessment of the customer′s purchase sentiment in the store combined with an intelligent assessment of purchase financial flows.
Basically, GAIA enables a system that always guarantees the presence of products in the market warehouse according to the level of customer demand characterized by the proposed “sentiment analysis” crossed with financial flows and order dynamics. At the same time, we also want to avoid warehouse “over-ordering” phenomena in order to minimize waste. Finally, through the out-of-stock risk classification performed by the downstream control panel embedded in GAIA, we can determine the main issues of the market store, and then we can enable such recovery actions such as promotions, product price change, and so on.
The paper herein proposed is structured as follows: In Section 2, a survey of the state-of-the-art will be disclosed, while in Section 3, the proposed pipeline will be presented with a description of the single subsystems. Finally, in Section 4, the experimental results will be reported, while in Section 5, a conclusive discussion and future works analysis will be outlined.
2. Related Works
As introduced in the previous section, several researchers have investigated the usage of deep learning in the large-scale distribution field. In [5], the authors proposed a supervised deep pipeline for out-of-stock (OOS) detection based on visual assessment of the retail shelves. Intelligent downstream classifiers are used to detect predictive labels of the OOS cases. As a classification approach, the authors proposed a support vector machines method. The collected experimental results showed an accuracy of 84.5% for OOS and a sensitivity of 86.6% for label detection. In [6], an interesting approach has been proposed. The authors implemented an efficient pipeline for solving OOS problems inside commercial refrigerators. Through visual features extracted by cameras inside the refrigerators, deep Faster R-CNN and Single Shot Multibox (SSD) models were used as object detectors. After object detection, the K-mean clustering algorithm was used to group objects on the same shelves. The distance between objects on the same shelf was used as a metric for assessing the OOS. In [7], the authors proposed a solution for managing new commercial products. This solution will help businesses: automatically assign the new products to the right category while performing sales predictions even with almost no transactional history. A semantic-based deep learning pipeline will be used to assess product demand forecasting. The interesting results are detailed in [7].
In [8], an interesting shopping management system was proposed. The authors of [8] described a novel shopping recommendation system based on deep learning, combined with an ad hoc designed recommendation algorithm. The system extracts the characteristics of users and commercial products through an artificial intelligence (AI)-based approach, proposing a coupled recommendation system based on user characteristics and product similarity. The results collected in [8] confirmed the effectiveness of the implemented approach. In [9], the authors presented a deep learning-based model for product purchase time forecast. Experimental results confirmed the robustness of the designed predictive pipeline.
In [10], a novel approach was introduced. In [10], Sarwar et al. proposed a smart shopping cart with self-checkout, called iCart, to improve customer experience at retail stores. The method is based on the usage of cloud computing and deep learning architectures. In iCart, the video events of the market were captured and sent to the cloud-based analyzer, which performs classification and segmentation of the video frames, extracting the shopping details to be analyzed. The system has been evaluated using real-world checkout video, showing an accuracy of 97% in shopping product detection. Further research efforts have been deployed to the development of such solutions suitable to reconstruct customer sentiment or to improve customer shopping methods.
In [11], the authors proposed a novel approach to shopping style. The proposed approach needs the customer to install a mobile app. Customer behavior is tracked both at the entrance and at the exit of the market shop. For more details, see [11]. In [12], a sentiment weighted multi-classification method was proposed. The authors implemented an approach in which the sentiment is represented by vocabulary, entity and nodes. Directed weighted links represent the sentiment similarity between two nodes of entities with attributes and are determined by the direct correlation calculation between them. The paths are all connected. Each different path is a different sentiment expression, which represents a different customer sentiment expression. An interesting evaluation of transformer-based architecture BERT has been made by the author in order to analyze the vocabulary. Experiments and analysis confirmed that the proposed approach can classify the review sentiments with good accuracy and high efficiency. The authors applied their approach in the e-commerce scenario, but that method can be extended in other shopping scenarios. Other similar approaches for customer sentiment retrieval can be found in [13,14,15]. An interesting survey on indoor shopping market management is reported in [16]. Rogojanu et al. analyzed in [16] several technologies that can be used for indoor shopping management and for improving customer experience. The target of the analysis performed in [16] was to reduce the time that customers spend paying for products and to customize their shopping behavior. The authors proposed NLP (Natural Language Processing) together with AI-based pipelines to retrieve sentiment data and data-context of the shop market environment. The authors conclude their examination, confirming that smart shop management solutions can address most of the common issues of shopping-based commercial markets. For more details, see [16]. Further interesting solutions in the field of machine learning for a large-scale distribution market have been proposed in [17,18,19,20,21].
3. Methods and Materials: The Proposed Pipeline
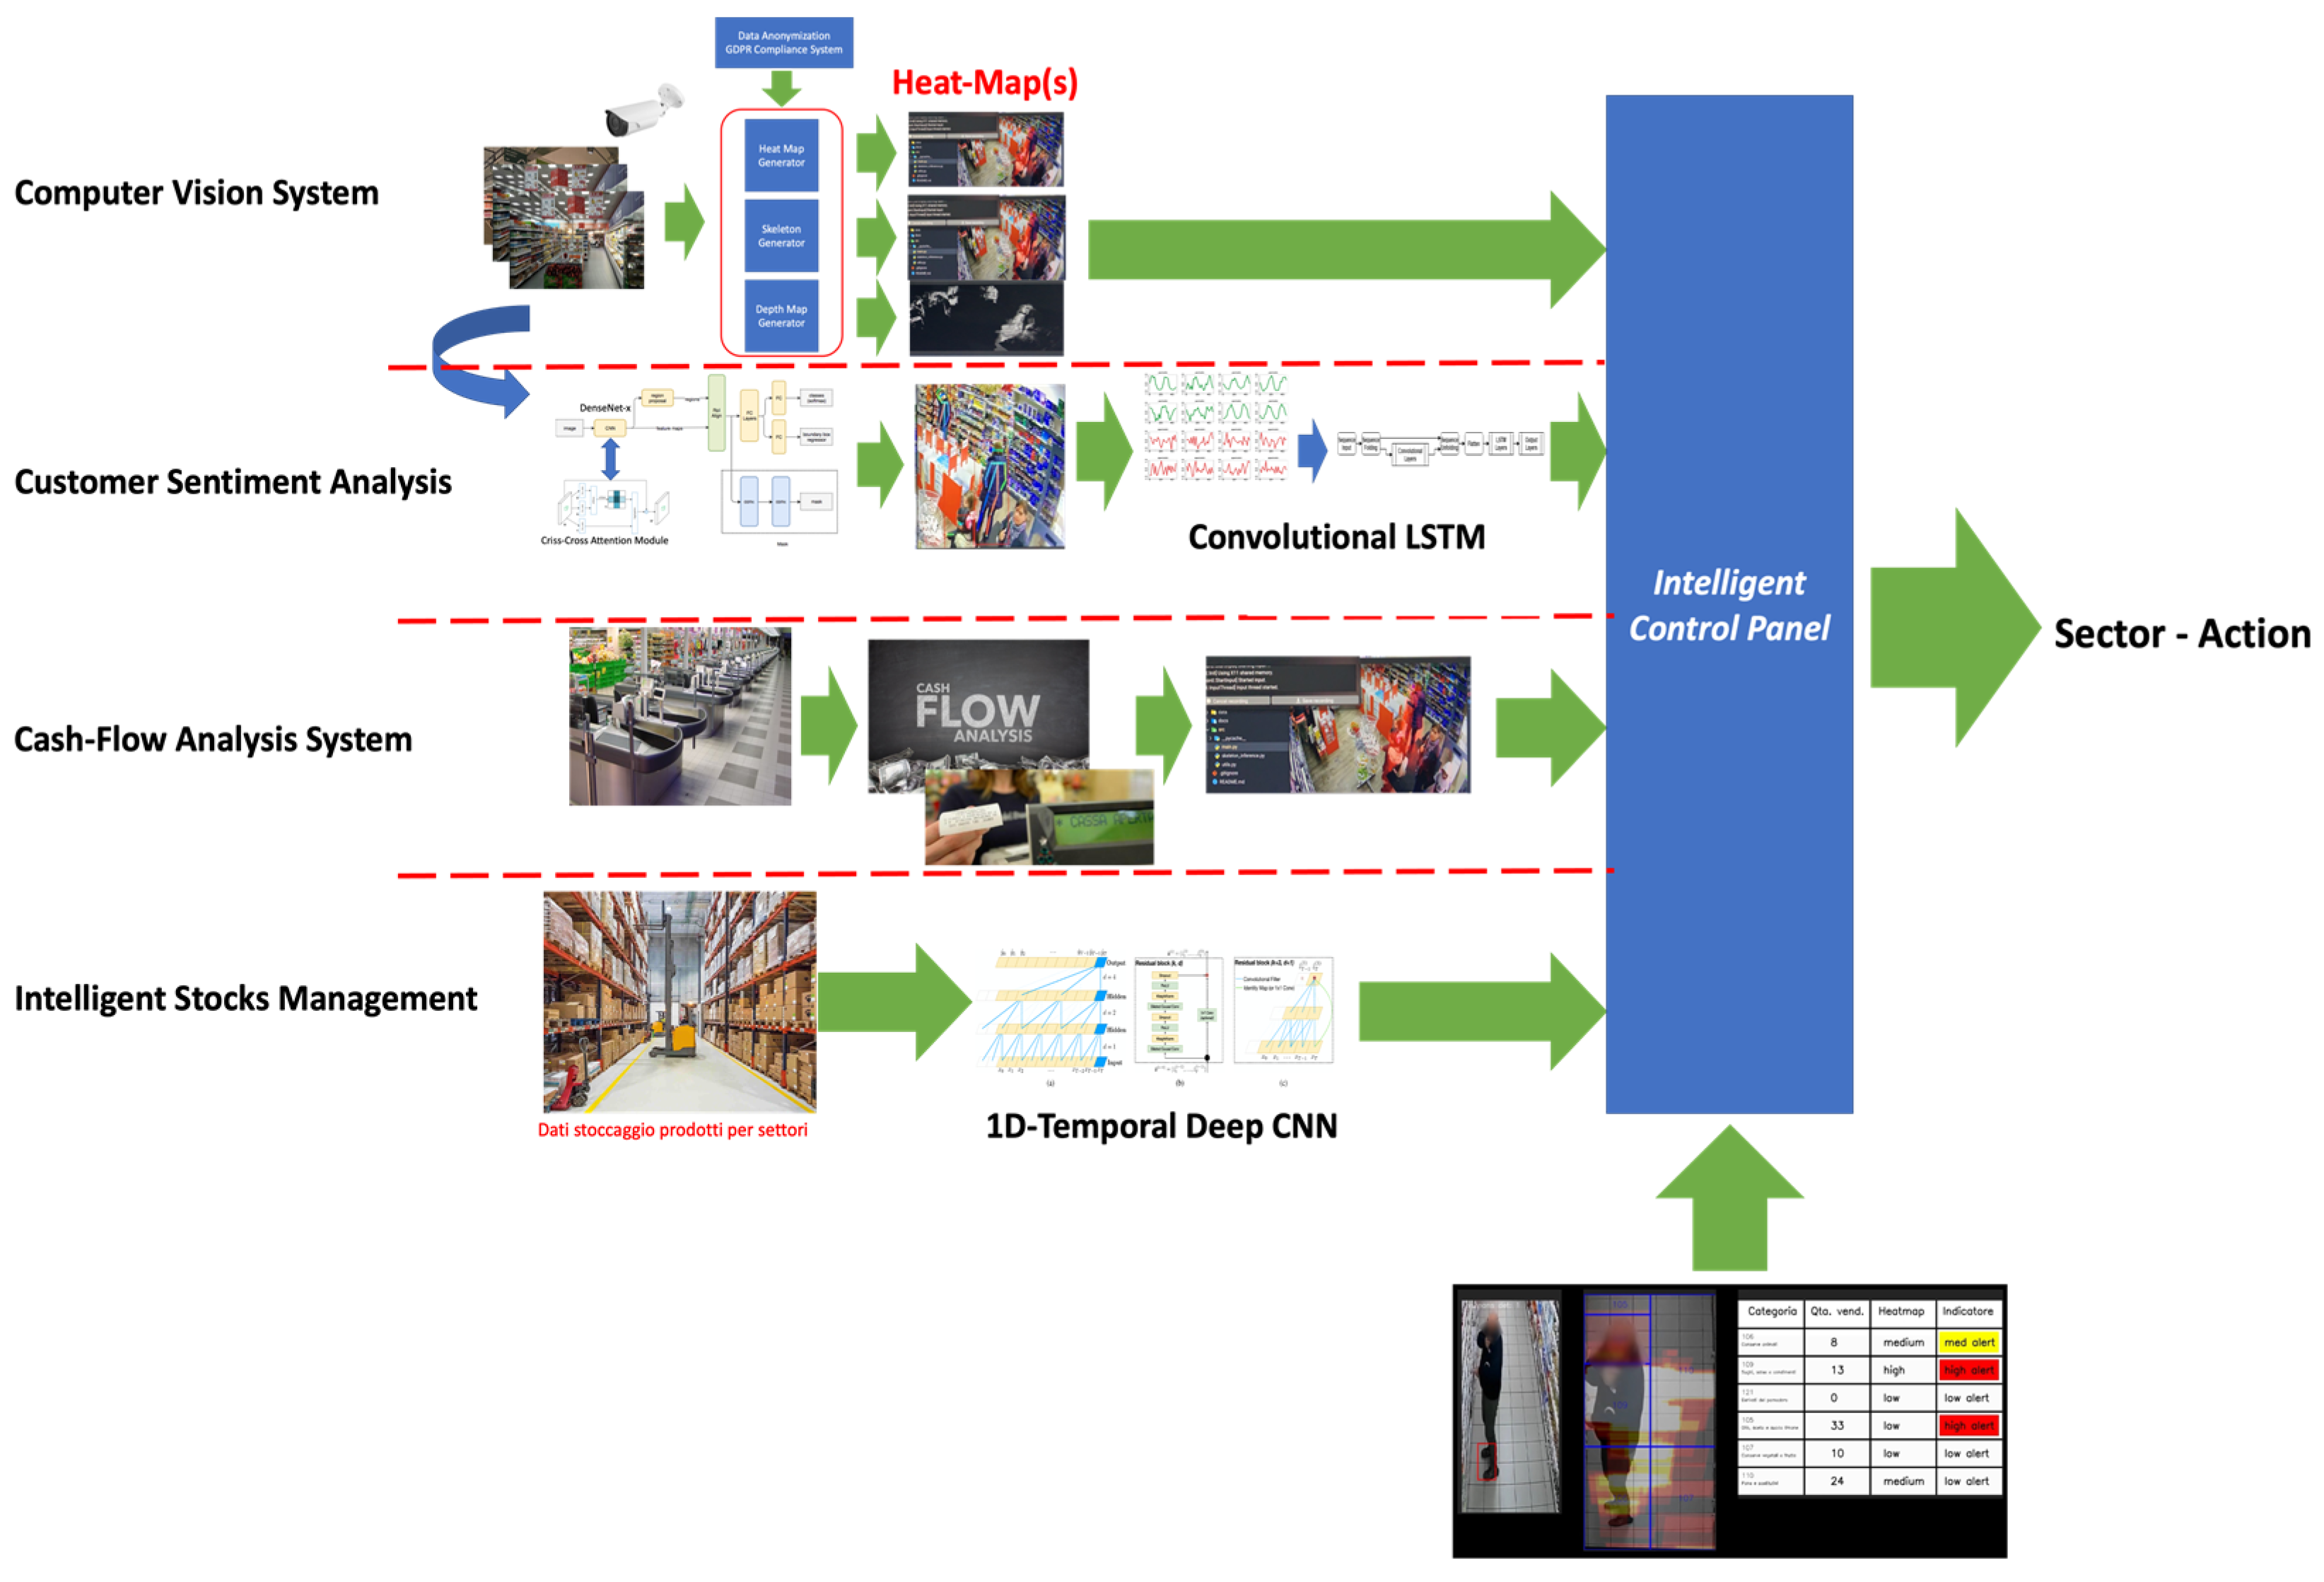
As introduced, in this section, the proposed pipeline will be described. In Figure 1, the full overview of the proposed GAIA (Great distribution Artificial Intelligence-based Algorithms) pipeline is reported.
As detailed in Figure 1, GAIA is composed of different subsystems that feed the related output to the downstream intelligent control panel, which elaborates the overall market store management risk assessment to be applied in order to optimize the order/storage of the stock, market cashflow, products sales, etc. We briefly introduce the various subsystems of GAIA. As explained in the introductory part, the aim of the designed system is the intelligent characterization of inventory problems in large-scale distribution market stores. We have correlated this problem not only with the dynamics of orders for stock but rather with the characterization of customer purchase sentiment, with the dynamics of financial flow and with the dynamics of orders. Therefore, the GAIA system contains two subsystems (the computer vision system and customer sentiment analysis subsystem), which will be responsible for characterizing the customer acquisition sentiment in the various areas of the market store. Using the cashflow and intelligent stock management subsystems, the GAIA pipeline will be responsible for characterizing the financial flow of the store and the orders for stock. Through the intelligent control panel, it will be possible to correlate the outputs of each of these subsystems in order to generate a single assessment for the market store that characterizes the risk of out-of-stock/stock surplus by specifying the level of risk and thus equipping the store with a dynamic and efficient risk assessment tool.
Therefore, although in Figure 1, the GAIA pipeline seems to be composed of four independent subsystems, it is the four subsystems that characterize the same market store but that process different inputs (visuals, time series, financial flow, orders) and producing a risk assessment that effectively performs an intelligent merge of the output of each subsystem. Each of the subsystems reported in Figure 1 will be described in detail in the next sections.
3.1. GAIA: Computer Vision Subsystem
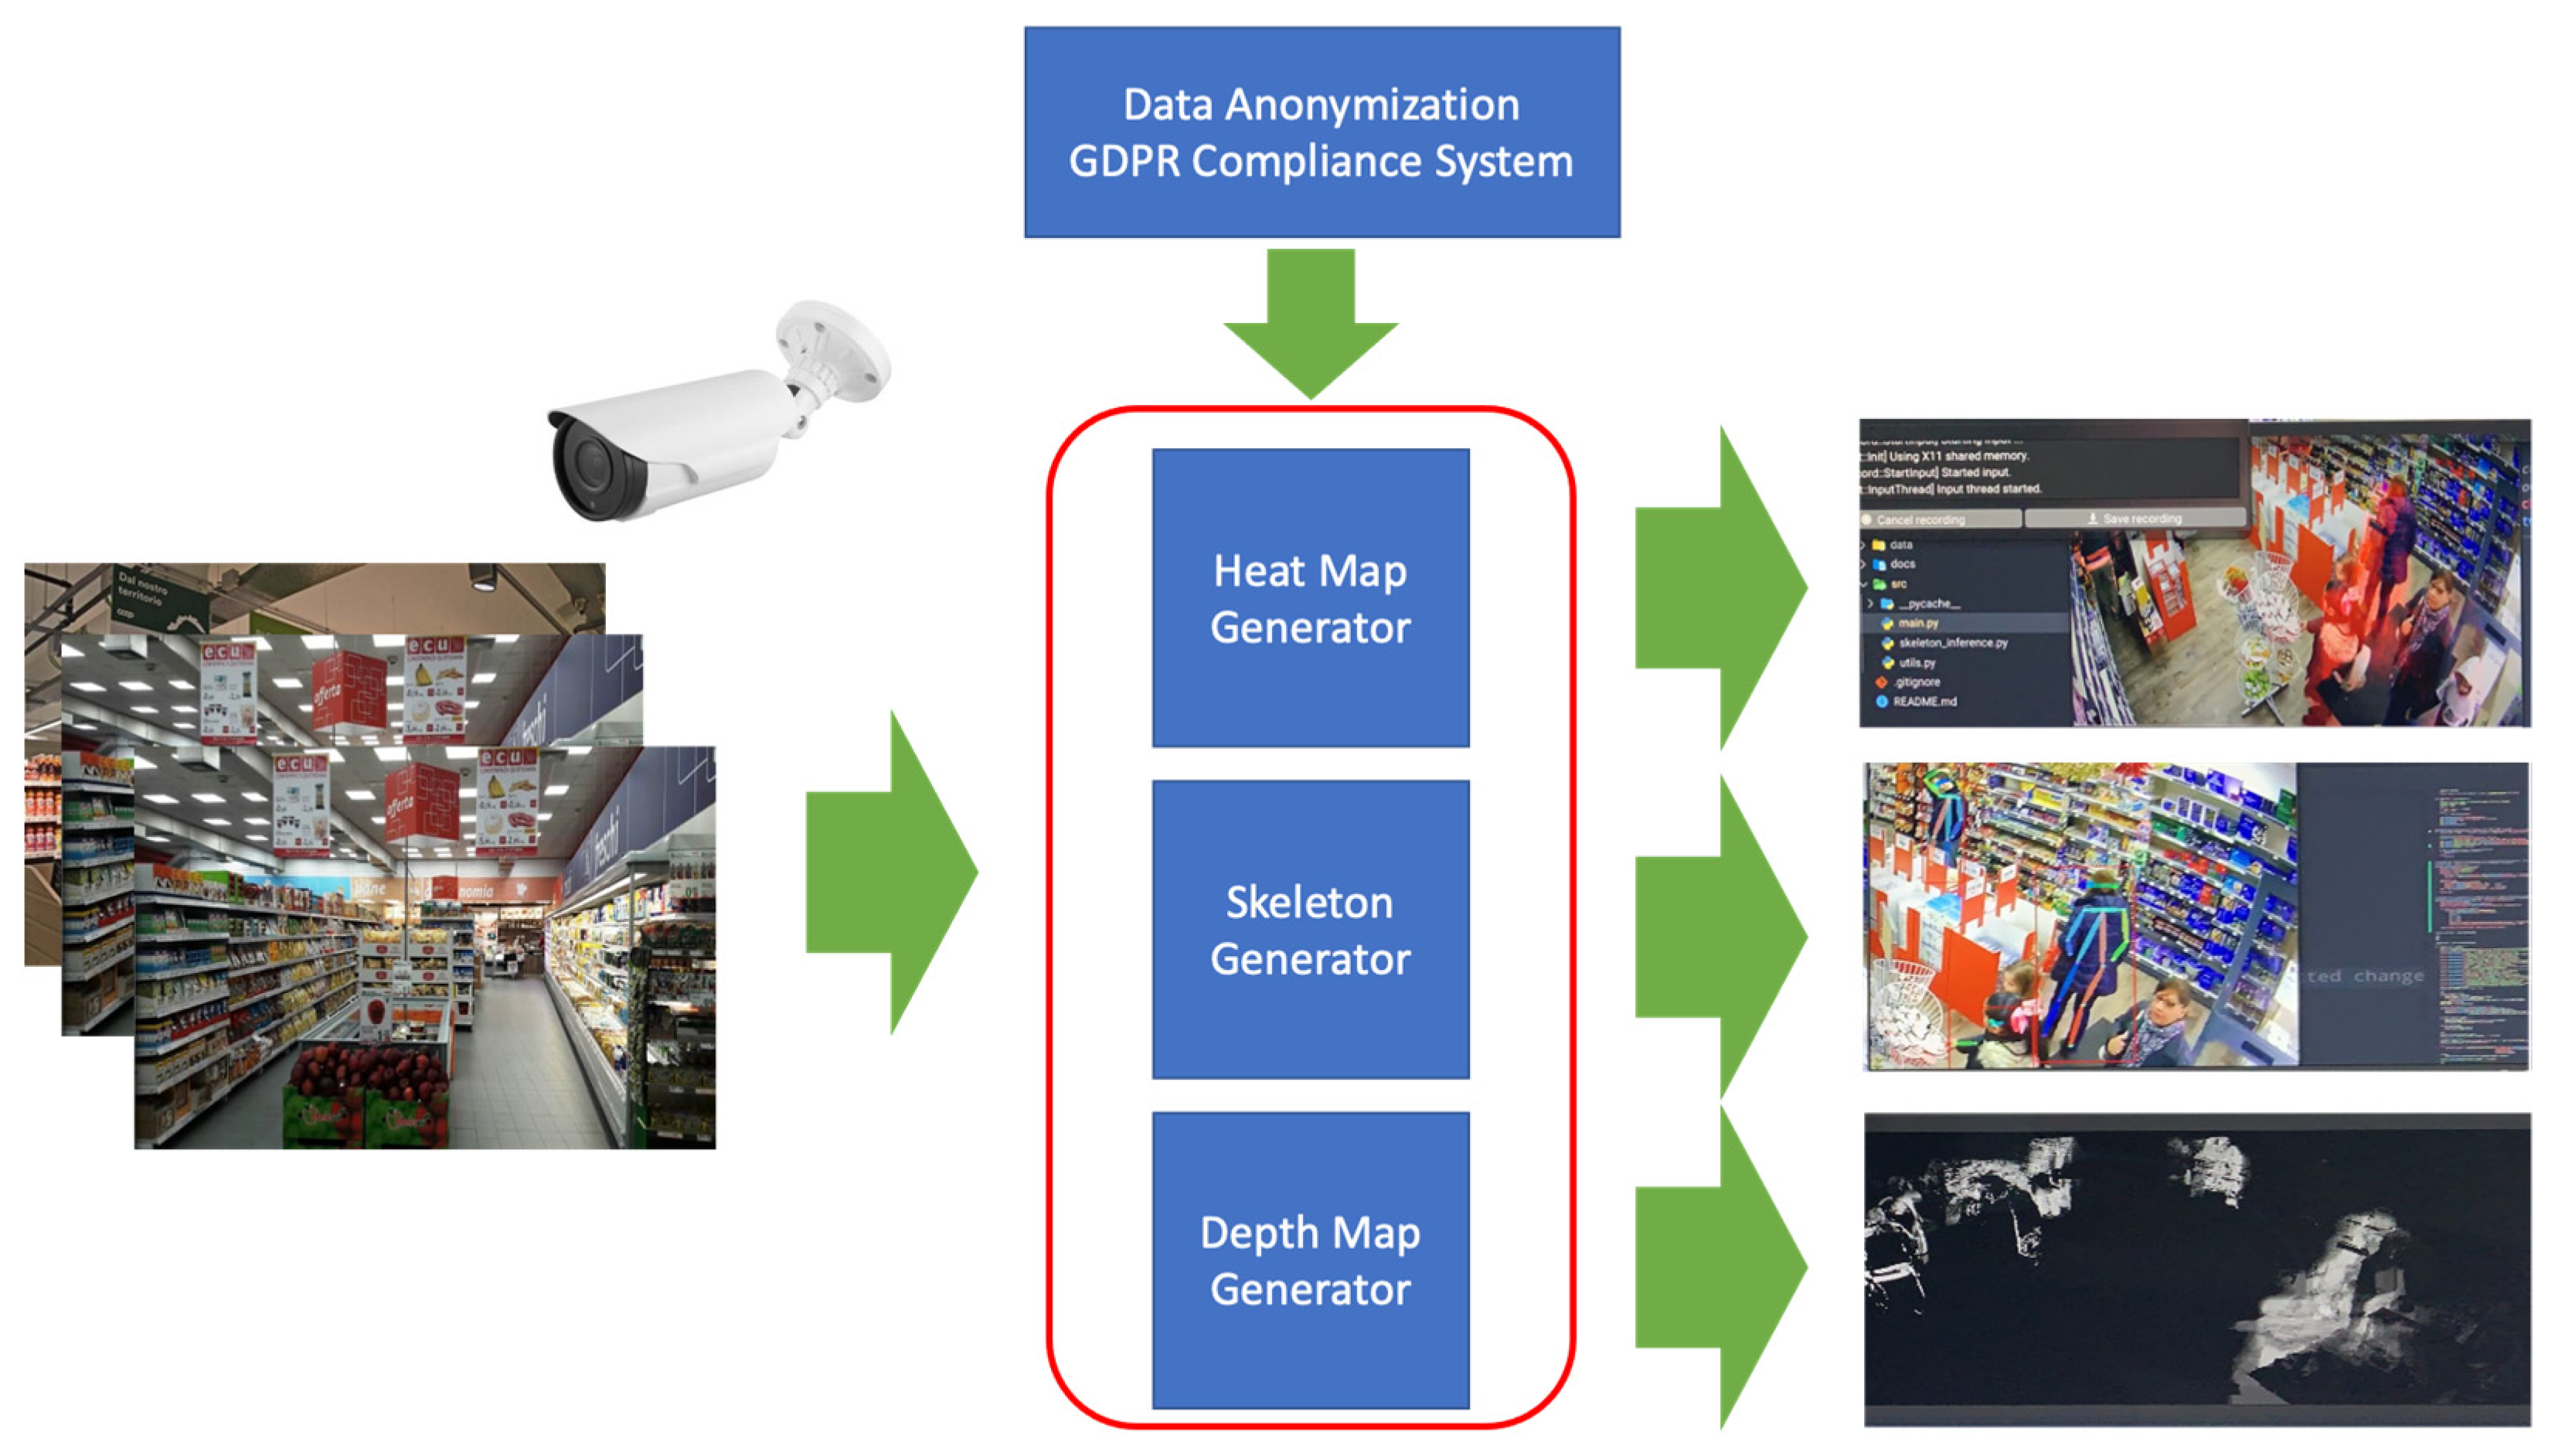
The target of this subsystem is the reconstruction of the dynamic sentiment of customers against the various spatial sectors of the commercial store. In Figure 2, a detailed description of this subsystem is reported.
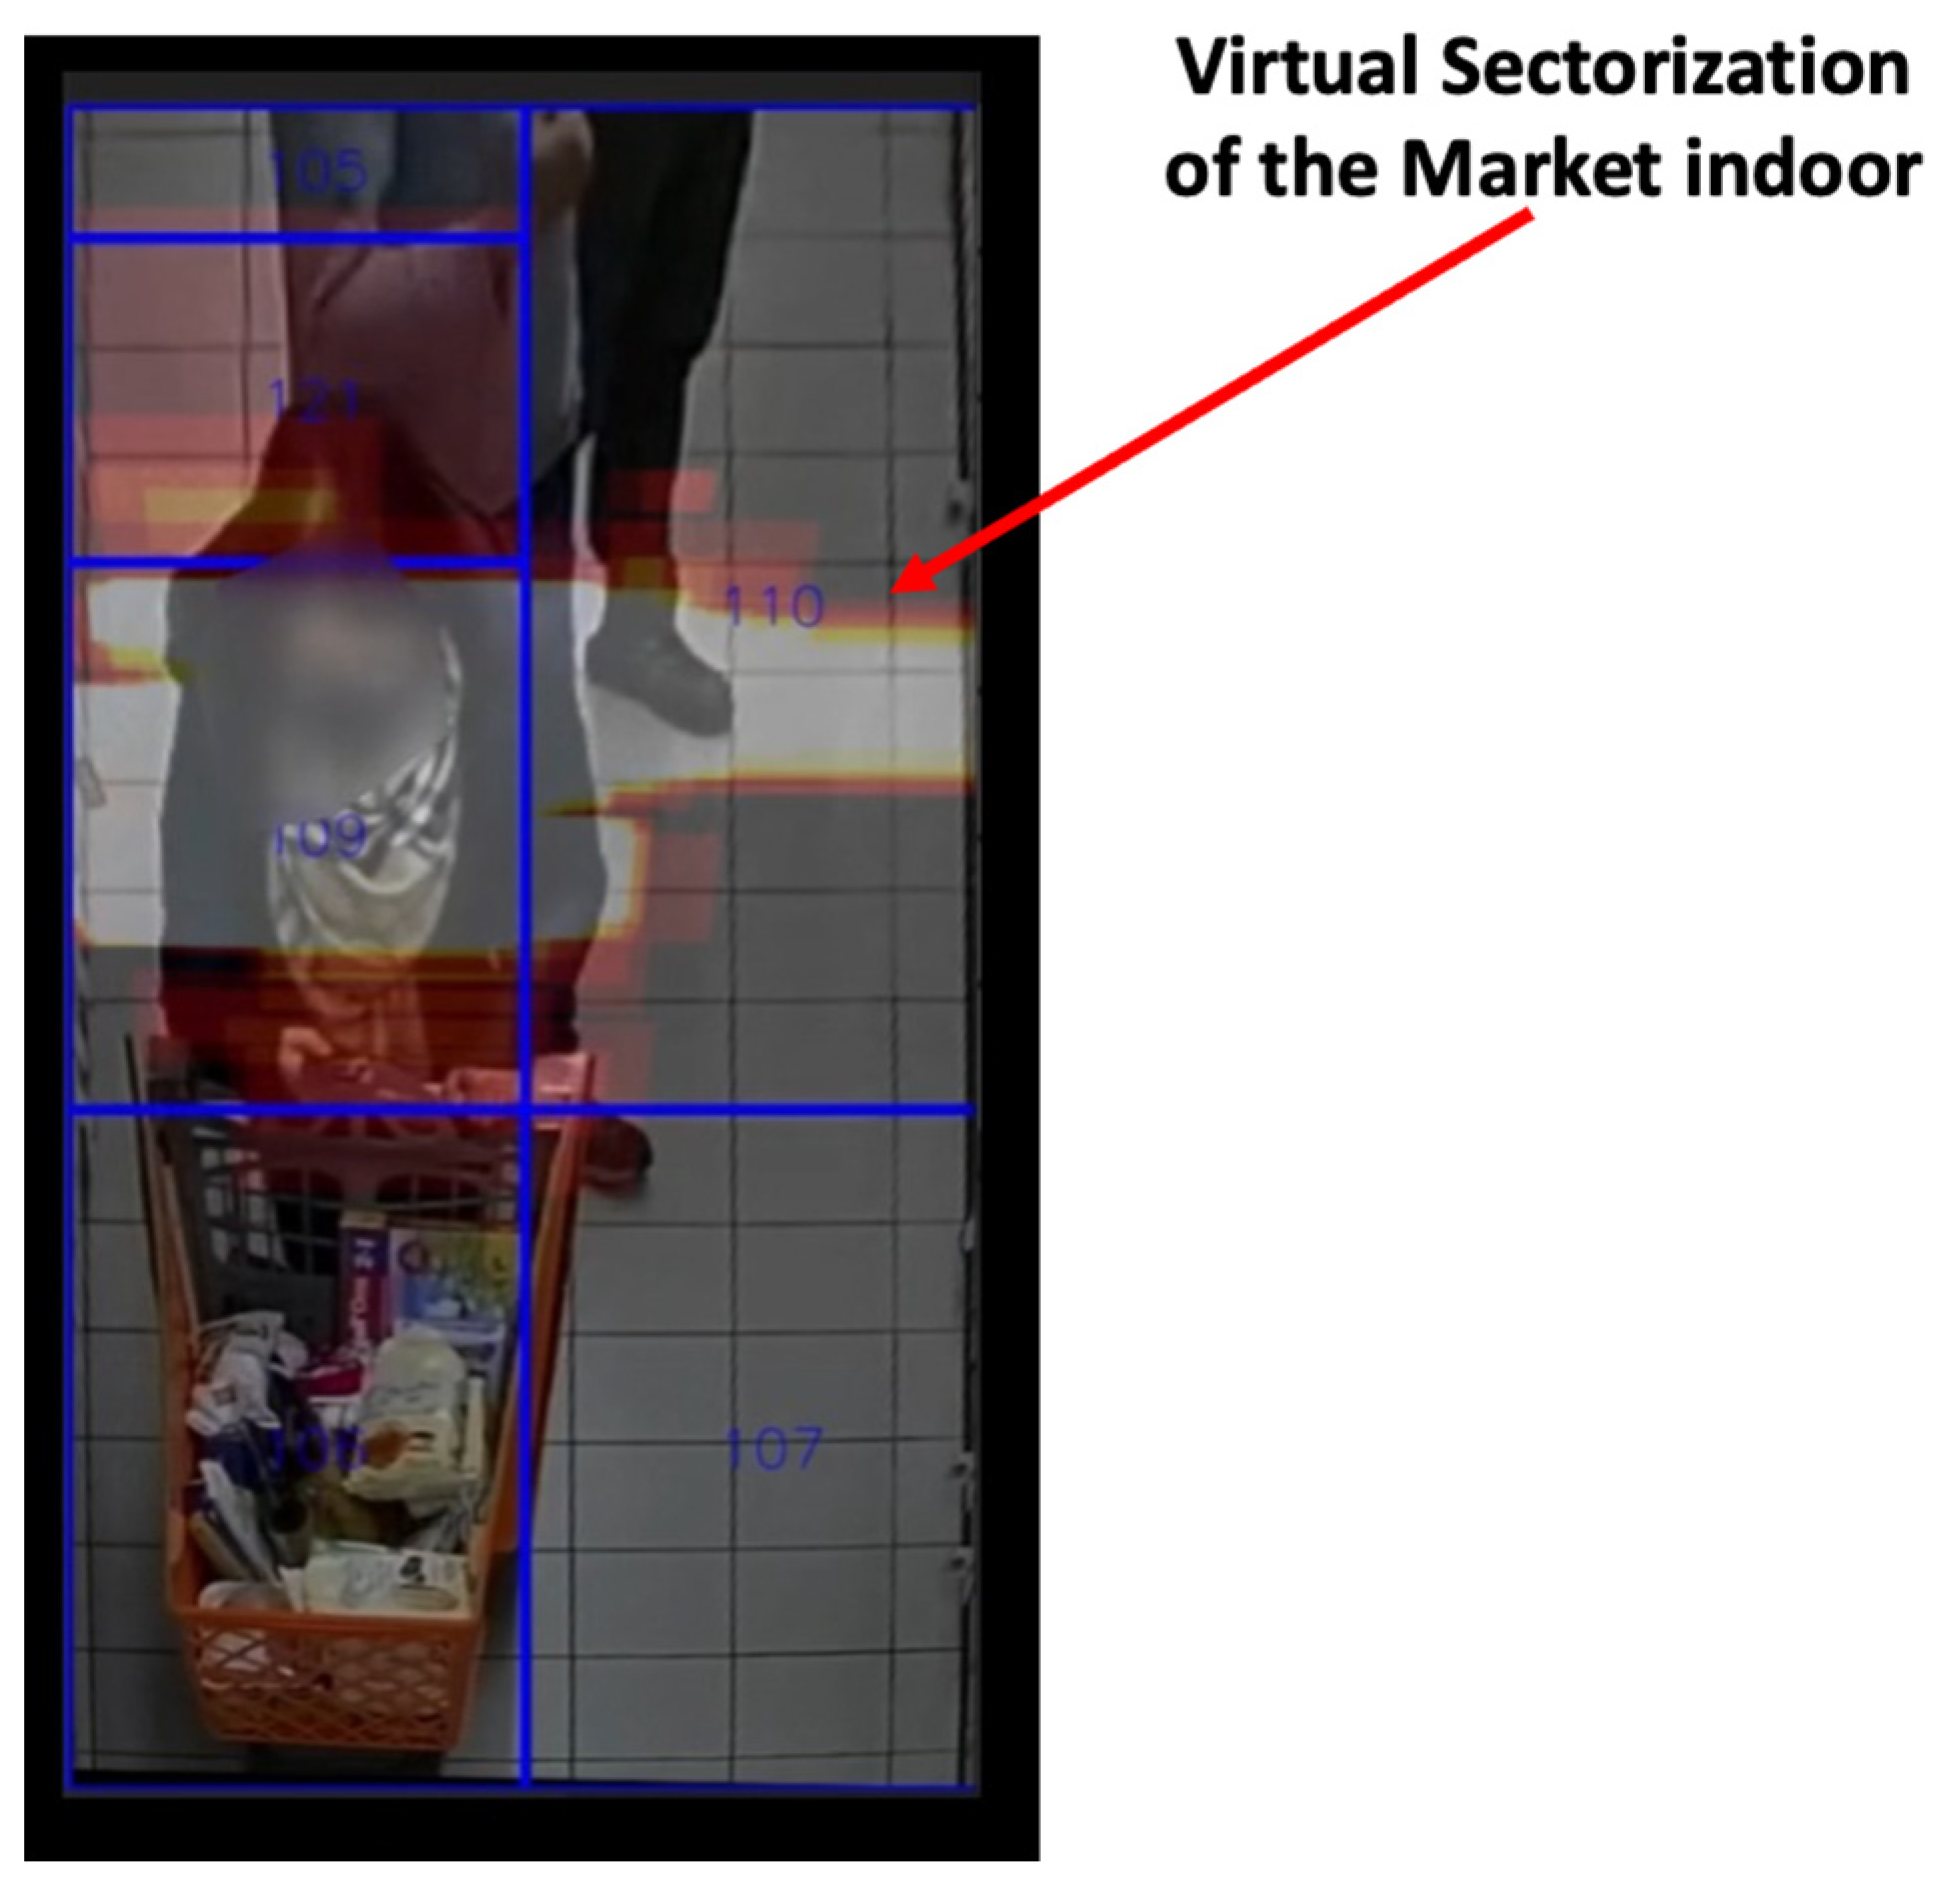
As reported in Figure 2, the Computer Vision Subsystem (CVSS) is composed of a video-sensing framework suitable to capture video frames from different sectors of the market store. Specifically, the market indoor will be divided into sectors (usually pertaining to product sectors), and a video acquisition device will be combined for each of these sectors to be monitored. An example of virtual sectorization and contextual acquisition from the corresponding video sensing system is shown in Figure 3.
Specifically, the CVSS does not require any kind of spatial prerequisite for the spatial distribution inside the store. The only constraint concerns the spatial aiming system of the vision camera. The used video-cameras can be positioned in front of the store-monitored area, laterally or even on the ceiling. Through ad hoc preprocessing and calibration algorithms properly applied to the sampled video frames, perspective visual transformations are applied in order to improve the processing of downstream deep architectures [22,23,24]. More in detail, the visual transformations carried out by the CVSS are described below. If we indicate with f(x, y, t) the spatial frame (x, y) acquired at instant t, the calibrated frame used by subsequent systems will be the following:
where Γ () represents the spatial calibration function of the original visual frame f(x, y, t), while pi represents the projection parameters used to perform the spatial transformation. In the pipeline herein proposed, several spatial projection calibration algorithms have been tested [21,22,23,24] without any relevant differences in terms of performance in the overall pipeline. For these reasons, a simple classical camera calibration approach has been used in order to retrieve optimal performance with a lower computational complexity. Specifically, a simple matrix transformation algorithm of visual frame projection has been applied to the source input video frames:
where Mp represents a spatial transformation tensor in order of the rotation of the visual frame f(x, y, t), while T is a spatial transformation tensor in order of the translation of the original visual frame. The coefficients of Mp and T have been determined by optimizing the overall performance of the downstream deep system through genetic algorithms as implemented in [21,22,23,24]. The optimal perspective transformation will be reconstructed; therefore, formally:
where the optimal coefficients of the tensors Mp and T will be determined by creating a projection of the map that maximizes the sales rate μ and at the same time the optimal storage rate of the stock λ. Initially, the GAIA system should be configured with a heuristically defined calibration setup. This initial calibration will then be dynamically optimized through an ad hoc genetic algorithm with fitness correlated to the set (μ, λ). Nevertheless, reinforcement learning or other learning-on-the-job approaches can be used and will be analyzed in the next release of the proposed GAIA system.
As reported in Figure 2, the first block of the CVSS is the heat map generator. In Figure 3, an instance of the visual frame processed by the CVSS is reported. As can be seen from Figure 3, a heat map is generated in correspondence with the presence of customers in the various sectors of the store. For the reconstruction of the space–time heat map, the CVSS uses an ad hoc designed heat map generator. Basically, this heat map generator is an algorithmic system that superimposes a visual “heat map” layer of equal spatial size on each input video frame. Through the deep network described below (YOLOv5 backbone [25]), the heat map generator algorithm will increase the intensity of the pixels of the “heat map” layer in correspondence with the spatial areas where human subjects are detected by the downstream deep YOLOv5 trained for this purpose [25]. In this way, by means of a trivial overlay, between the sampled calibrated input frames and the “heat map” layer thus determined, we will obtain a dynamic heat map as shown in Figure 3. Specifically, through a robust human-detection algorithm (having as input the calibrated frames I(x, y, t)), the implemented heat map generator produces a space–time assessment of the customers permanence (spatial and temporal) in the various sectors of the commercial store.
As introduced, the human subject detector is based on a deep architecture with q YOLOv5 backbone [25] trained for this task. More details about the designed YOLOv5-based human detector are discussed in the next paragraphs.
The output of the heat map generator consists of the same input-calibrated frames overlayed with the generated heat map associated with the tracking bounding box of the detected customer subject. For the sake of mathematical formalization, the heat map generator works as follows: given the i-th customer Pi falling in the (pre-)calibrated frame I(x, y, t), he/she will be identified by the following function:
where tk represents the time range of observation (N time instants of observation) and monitoring, while is the dynamic bounding box of the tracked subject, having initial spatial coordinates (x(tk), y(tk))1. The computation of the space–time heat map and the dynamic intensity corresponding to the person Pi can be calculated according to the following equation:
where ℵ () represents a space–time heat map function and is a dynamic intensity function of the space–time heat map. In addition to the space–time heat map, we can also generate the contextual depth map , which may be used for further applications/extensions of this contribution depending on the user’s needs. The depth map generator, although it is foreseen in the design of GAIA (Figure 3), is not currently used, and there are plans to integrate it into the next extensions of the pipeline.
In this way, by means of the functions ℵi () and , we will be able to characterize the space–time variation (in intensity) of the heat map associated with each i-th tracked subject in the input-sampled calibrated frame I(x, y, t).
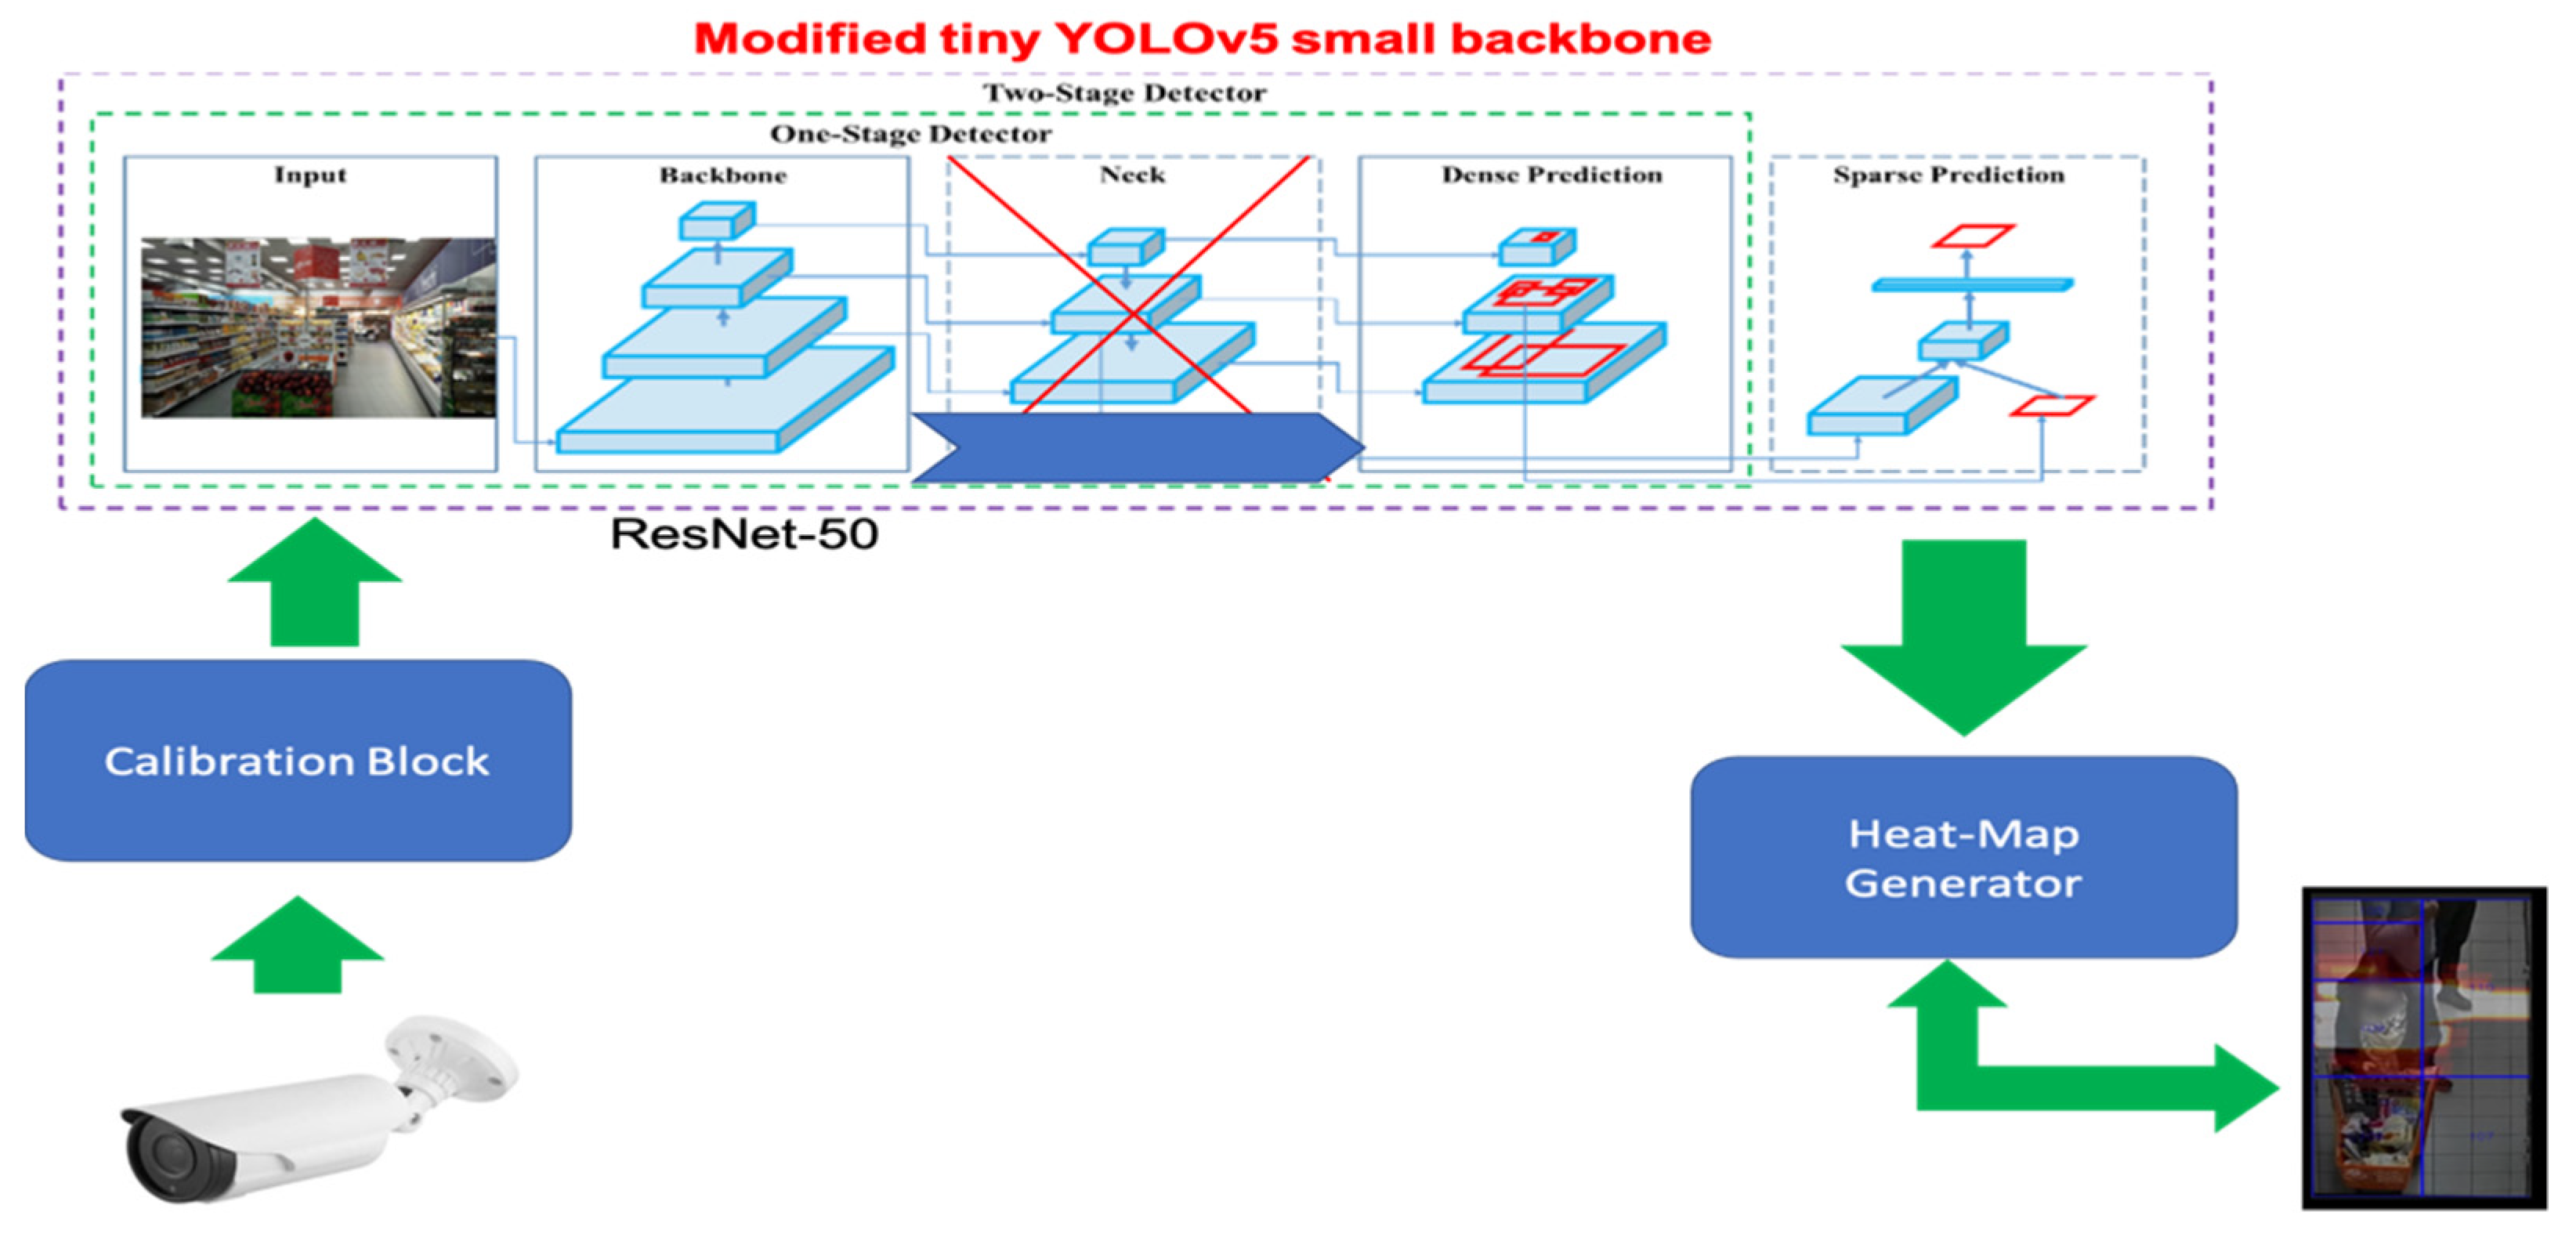
As introduced, the CVSS is able to generate the heat map by means of a space–time intensity assessment of the detected and tracked customer (bounding box segmentation) embedded in the sampled calibrated video frames of the indoor market. More details about the deep backbone are embedded in the designed subject detector pipeline. The authors proposed a subject detection algorithm based on a modified version of deep architecture embedding a YOLOv5 backbone [25]. Specifically, a modified solution is implemented with respect to the backbone reported in [25]. In the innovative deep network-embedding YOLOv5 architecture version “small” [25], the “NECK” layer block has been removed. In particular, the designed backbone of the modified YOLOv5 small that needed to extract the visual features from the calibrated frames is a ResNet-50 [26]. The visual features extracted from ResNet-50 are directly passed to the dense prediction and sparse prediction block, which will have the target of generating the bounding box embedding the customer subjects, which will then be monitored for the heat map generation. The following Figure 4 shows the proposed enhanced YOLOv5 small deep network as the detector for the heat map generator block of the CVSS.
Therefore, this is a modified and distinct YOLOv5 small deep network that obtains excellent performance with a significantly reduced computational load. The input of this modified YOLOv5 small will be the calibrated frames I(x, y, t). The output of the network will be the bounding box embedding the detected and tracked customers, which will be used by the heat map generator to provide the corresponding space–time heat map as described previously. Each sector intended to be monitored by the GAIA system will therefore have a block of the heat map generator embedding a modified YOLOv5 small architecture as described.
3.2. GAIA: The Customer Sentiment Analysis System
As reported in Figure 3, the proposed GAIA system also embeds a skeleton generator block. Subsequently, through a deep hybrid network (recurrent–convolutive), the time series of the junction points of the skeleton associated with each traced customers will be learned in order to characterize their “sentiment”. Preliminarily, the innovative human skeleton generator is described.
Several researchers have proposed a solution to build a skeleton map of the human subject for pose estimation, robotic applications, computer vision, activities recognition, etc. [27,28,29,30,31,32,33,34]. The authors for this application propose a novel method to extract the skeleton of the human subject embedded in the input calibrated frames I(x, y, t). The proposed skeleton generator is based on the usage of Mask-R-CNN [35] architecture properly enhanced by means of the Criss-Cross attention block [36]. Other authors have used Mask-R-CNN for skeleton and human pose estimation [37] but the architecture we designed is completely different with respect to ones reported in the scientific literature as an embedded ad hoc self-attention mechanism to improve the performance of the overall deep network. In the following Figure 5, a detailed diagram of the skeleton generator based on the implemented Criss-Cross Mask-R-CNN is reported.
As reported in Figure 5, the Mask-R-CNN backbone of the proposed solution has been modified according to our development. Specifically, the embedded convolutional architecture (“CNN” clock of the diagram reported in Figure 5) is based on the ResNet-101 [26] backbone in which we have interpolated a Criss-Cross attention layer [36] as per Figure 5. This block is needed to extract the visual features of the input video frames to be passed to the downstream layer of the Mask-R-CNN, which will be able to generate the skeleton of the tracked human as well as the related bounding box segmentation mask. More details about the modified ResNet-101 are included in the Criss-Cross attention layer (which we have named as “ResNet-CC”). The pre-calibrated input frame I(x, y, t) is preprocessed by the input layer of the ResNet-CC, and the visual features are extracted from the residual layers of the deep network. If we define with H the visual features extracted from the residual layers of the so-designed deep architecture, the features extraction enhanced by the Criss-Cross attention processing, performed by ResNet-CC, can be formalized as follows.
Given a space of visual features , is the original number of channels, while W × H represents the spatial dimension of the features of the feature map generated through the convolutional layers of the ResNet-101 backbone. The Criss-Cross processing layer preliminary applies two 1 × 1 convolutional blocks to H to generate two feature maps F1 and F2, which belong to , where C′ represents the reduced number of channels due to the dimensional reduction performed by convolutional blocks. After that, we defined an “Affinity” function suitable to generate the feature attention map . After that, for each position u in the spatial dimension of F1, a vector F(1,u) ∈ RC′ is extracted, and the set Ωu ∈ R[(H+W−1)×C′] is defined by extracting characteristic vectors from F2 for each position u ∈ F2, such that Ω(i,u) ∈ R C′ is the i-th element of Ωu. At this point, the Affinity function can be defined as follow:
where with D ∈ R[(H+W−1)×(W×H)] is the so-introduced Affinity function, i.e., the degree of correlation between the characteristics F(1,u) and Ω(i,u). The weight w1,u is learned during the training session of the ResNet-CC network. After that, a further 1 × 1 kernel convolutional layer will be applied in order to adapt of the spatial dimension according to the next attention function, i.e., the “Aggregation” suitable to generate the augmented contextual feature map H’ as follows:
where Hu′ is a characteristic vector in H′ ∈ RC×W×H in position u, is a scalar value in AM, while the term wH,u represents a learnable weight coefficient. The attention contextual enhanced feature map H’ will be used in the region proposal and alignment for the skeleton generation and bounding box segmentation. More details about the Mask-R-CNN backbone and the Criss-Cross attention processing are discussed in [35,36].
The reconstruction of the customer sentiment is now described. For each tracked client, the enhanced Mask-R-CNN previously introduced will also associate with the skeleton. In the overlayed matrices of the processed visual frame that superimposes the skeleton structure, it is possible to identify the “junction points” corresponding to the upper and lower human body joints. Specifically, we focused on all the human body junction points. The following Figure 6 shows an example of a skeleton with highlighted junction points JiP.
As reported in Figure 6, the skeleton structure provided by the upstream enhanced Mask-R-CNN will be post-processed for retrieving the junction points JiP for each of the detected and tracked customers embedded in the sampled calibrated video frames. The spatial position dynamic of the collected junction points will be mapped into a time series Ti(k) over the indoor market sampling time. Specifically, each spatial coordinate set of the i-th junction points JiP(x,y) (embedded in the captured indoor store video frame) will be mapped with a time variant scalar computed as follows:
In this way, each of the junction points will be associated with a scalar . The spatial change due to the posture of each customer inside the store (and therefore of the respective junction points) will contribute to forming a time series of computed scalars as per Equation (8), which will then be normalized and compacted in a 16 × 224 embedding that is 16 time series each containing 224 samples. Embedding will be obtained by applying bicubic padding and resizing to the time series of the junction points previously described. The so-computed data will be used as input of the downstream deep network. We have designed a convolutional long-short-term memory (ConvLSTM) [38,39,40] as a downstream deep classifier of the junction-generated time series embedded as 16 × 224 embedding. As reported in Figure 6, the input sequences of the 16 × 224 tensor will be fed to the sequence input layer. To extract features from the input sequences, such convolutional operations will be applied in the “sequence folding layer” followed by the “convolutional layers”. To restore the sequence structure and reshape the output to vector sequences, a sequence unfolding layer and a flattened layer will be used. The so-flattened feature time series will be fed as input of the deep LSTM block followed by a SoftMax and classification layers for the sentiment classes we want to discriminate. Specifically, the so-designed architecture will be able to classify the following three classes of customer sentiment: “customers interested”; “customers not interested”; “customers undecided”. The details of the implemented ConvLSTM backbone as well the training/testing dataset and hyperparameters configuration are described in the Section 4.
3.3. GAIA: The Cashflow Analysis System
The target of this subsystem is the analysis of the cashflow that comes from the cash-desks of the market store. Specifically, through an automated classification system, the cashflow of sales will be analyzed, extracting the following parameters for each sale, as shown in Table 1.
By means of the stock identification code, the management system supplied to all market stores can retrieve the type of sold stock, therefore the market store spatial sector on which the stock is positioned on the shelf. In this way, for each of the virtual subdivision sectors of the market store (previously embedded in the computer vision system of GAIA), there is a continuous monitoring of the sold product. Therefore, for each type of product, we will receive from the informatic management system of the market store specific information on the stock and related quantity that has been sold, defined as Sp, that is, the quantity “S” of the sold “p-th” product.
3.4. GAIA: The Intelligent Stock Management System
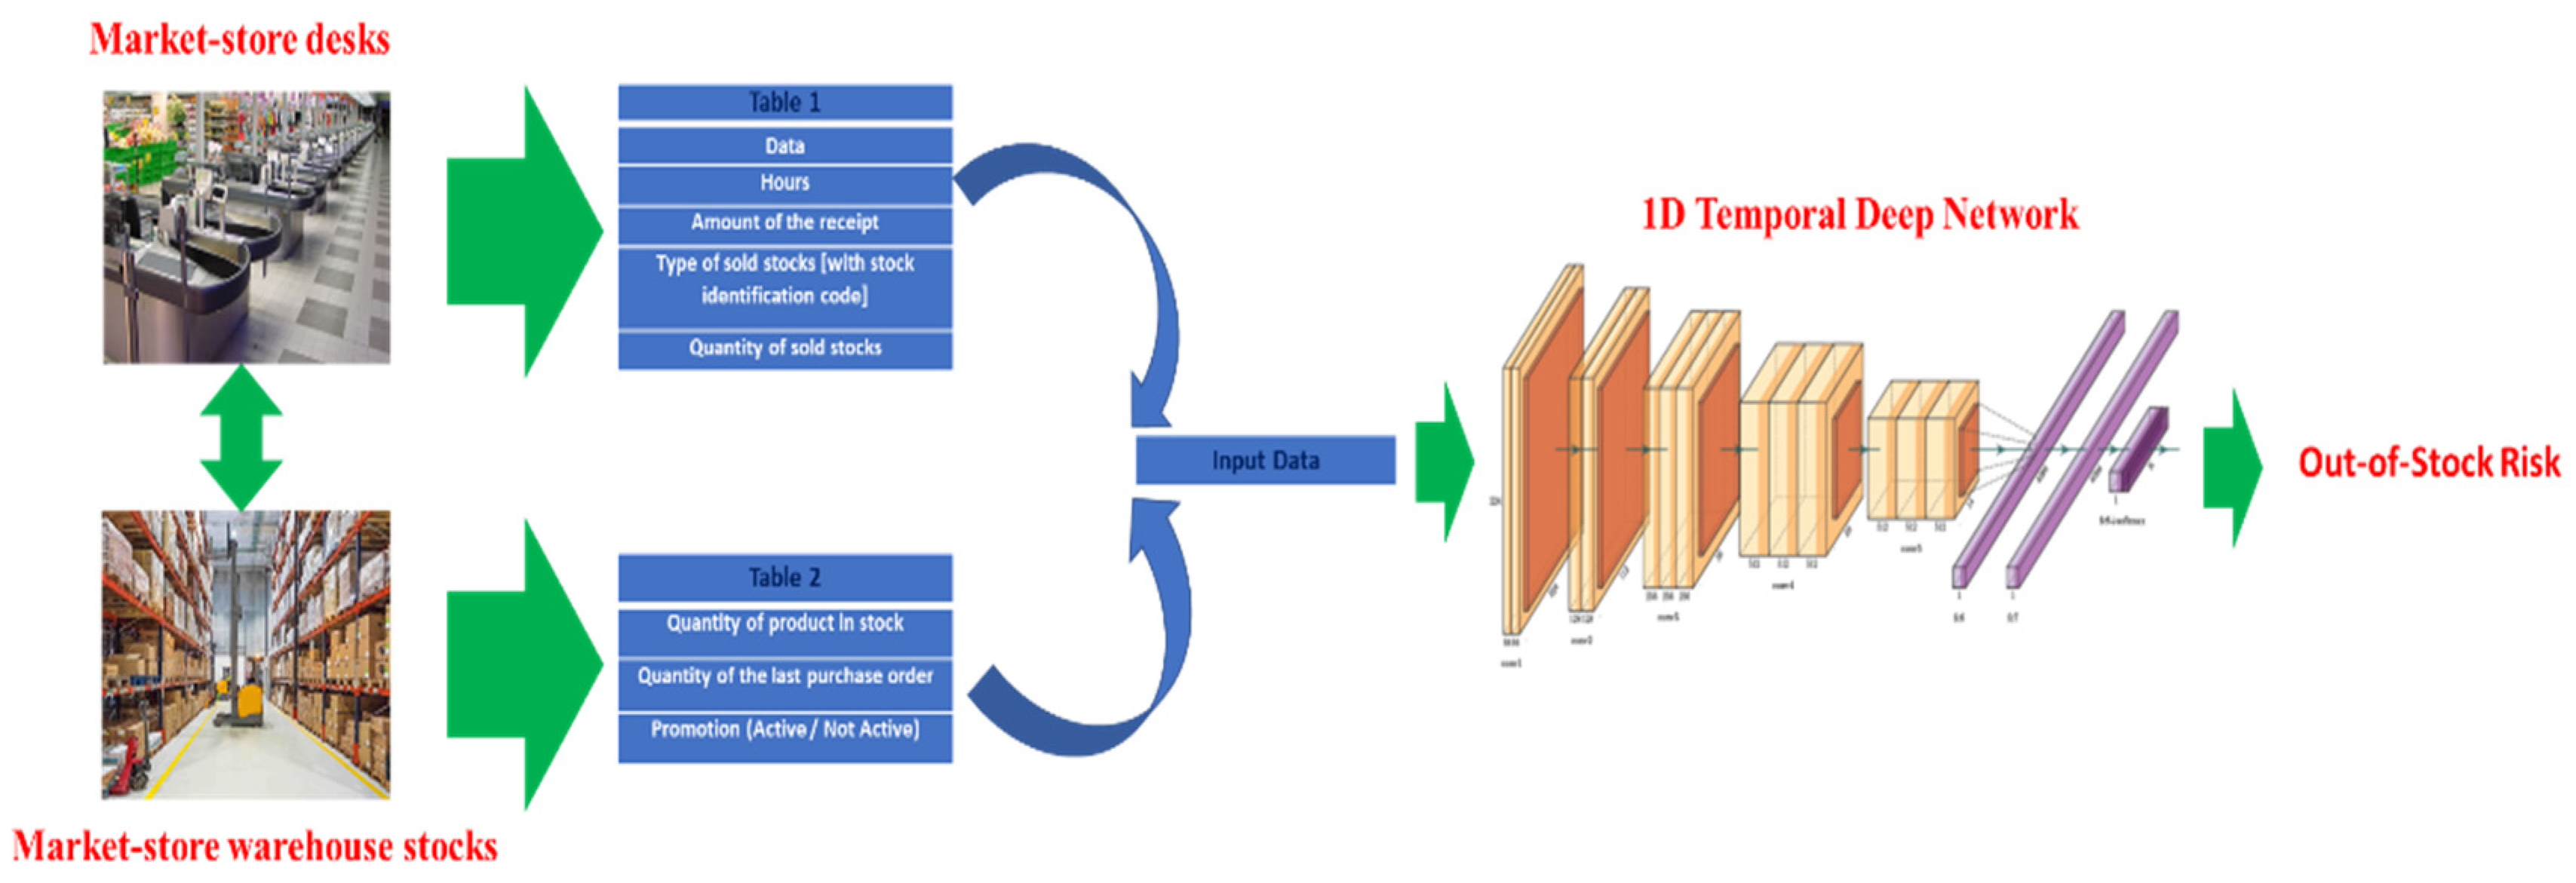
The target of this subsystem is the monitoring and related prediction of the out-of-stock issue in the characterization of warehouse stock. More in detail, with a pre-fixed sampling rate, the informatic stock management system of the market store provides to the GAIA system the following information for each of the stock categories.
Therefore, with an update frequency that can be set at the user′s discretion, GAIA will be informed (by the informatic management system of the market store) of the real amount—for each type—of the warehouse stock. In order to avoid out-of-stock or surplus stock, issues from the data are shown in Table 1 and Table 2, which have been arranged in a single data vector for each type of stock and have been processed by a capable predictive deep learning system to predict the risk of out-of-stock and therefore impact accordingly on the supply orders of the store. More in detail, the fields in Table 1 and Table 2 are arranged in a vector and are normalized. An ad hoc temporal convolutional deep neural network has been designed for learning the optimal order dynamic embedded in the historical management of the warehouse stock. The proposed pipeline for this subsystem is reported in Figure 7.
As reported in Figure 7, the combined 1D input data will be fed into the 1D temporal deep convolutional neural network (1D-TCNN) [41,42,43]. As described in [41,42,43], the convolutional neural networks can significantly improve the recurrent network’s performance due to better parallelism, receptive field management, memory footprint and so on. Moreover, the architecture herein proposed embeds a dilated causal convolution layer that provides an independent unit activation with respect to the future time steps. As introduced in this section, the output of the designed 1D-TCNN classifier will entail three risk classes: “high risk of out-of-stock”, “medium risk of out-of-stock”, “low risk of out-of-stock”. This risk characterization will then be sent to the intelligent control panel. Regarding the learning paradigm, the 1D-TCNN architecture layout and the dataset management, see the following Section 4.
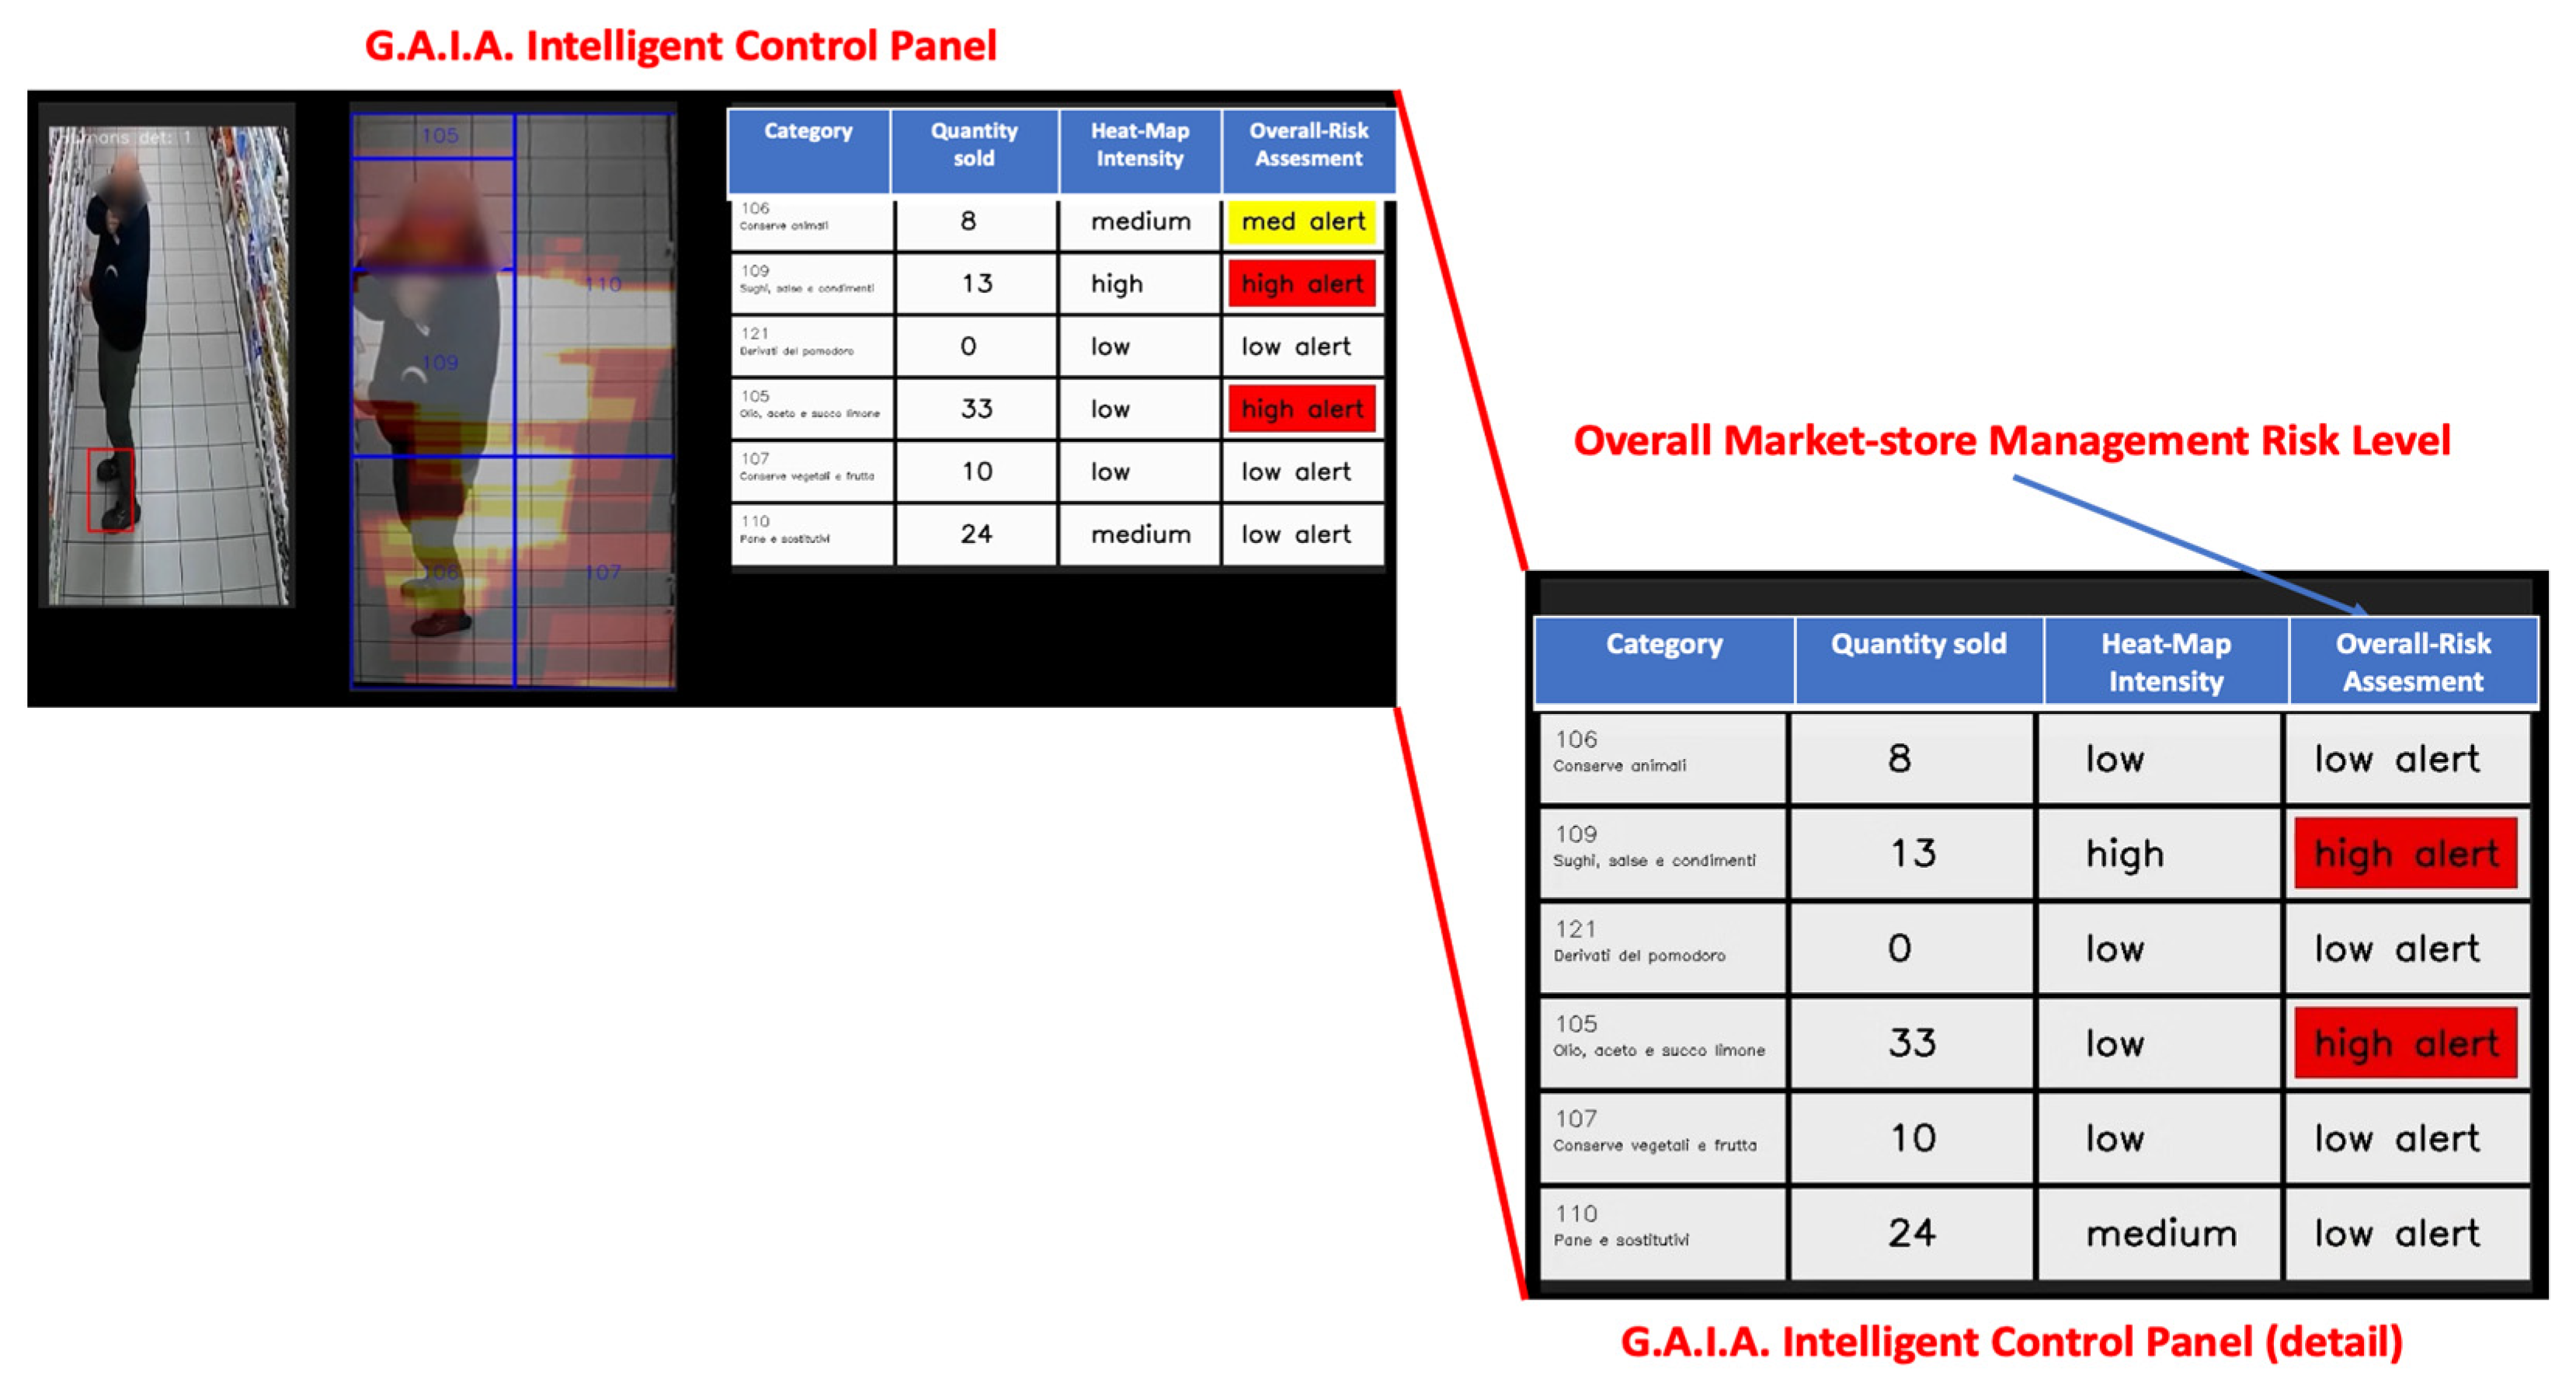
3.5. GAIA: The Intelligent Control Panel
The target of this intelligent control panel (IPC) is to collect all the outputs from the previous subsystems of GAIA in order to determine an overall level of market store management risk and therefore, consequently, take appropriate recovery actions. Specifically, the IPC embeds a decision tree based on variable and expandable IF–THEN–ELSE rules that estimate three possible levels of market store management risk: “high risk”, that is, there are significant inconsistencies in the input data from the various subsystems of GAIA; “medium risk”, that is, there are inconsistencies in the input data coming from the various subsystems of GAIA; “low risk”, that is, there are some aspects to pay attention to in reference to the input data coming from the various subsystems of GAIA, but they are not such as to generate a significant level of risk. To define the risk levels of the input data, thresholds are heuristically defined, which will then be dynamically varied according to the needs of the user and of each market store. To give some examples of market store management risk level, each risk assessment refers to the category of products monitored and associated with a specific sector of the market store.
Case A: For category “x”:
- IF OCVSS > ThCVSS AND “customer interested” AND OCashflow < ThCashflow AND “medium risk of out-of-stock” THEN “high-risk assessment”;
Case B: For category “y”:
- IF OCVSS < ThCVSS AND “customer undecided” AND OCashflow > ThCashflow AND “low risk of out-of-stock” THEN “low-risk assessment”
Basically, in “Case A”, there is a significant heat map (as the average intensity of the heat map for that sector is higher than the pre-established threshold ThCVSS); therefore, there is a significant number of customers who frequent that sector of the market store. In addition, the other subsystems of GAIA confirmed, from the study of the skeleton and posture, that a certain customers interest against a low sales rate (the output of the cashflow monitoring system below the threshold) show medium risk for out-of-stock. Therefore, it is a scenario that reveals how, in the face of high customer interest, little is sold and how the inventories can run out. Therefore, for that particular sector, immediate action must be taken because it is a scenario of high store management risk. Conversely, the “Case B” relating to sector “y”, has a low heat map—undecided customers but a sale of products within the norm and a low level of risk of stock exhaustion. This scenario does not reveal a significant management risk and therefore does not require timely recovery actions. The following Figure 8 shows an instance of the GAIA intelligent control panel.
In Figure 8, we have reported details of the GAIA intelligent control panel highlighting the part in which the market indoor sector is defined, the heat map indicator, the quantity sold, and finally the overall risk assessment of the market store management.
4. Experimental Results
The proposed full pipeline has been tested in a real market store, but each of the designed subsystems have been validated both using a custom dataset as well as through a public database. We have validated the “intelligent core” of the GAIA as follows.
The first subsystem we have validated is the computer vision subsystem as per the pipeline reported in Figure 4. Specifically, we have tested the performance of our proposed modified version of YOLOv5 small. The used enhanced YOLOv5 small is configured as follows: input frame dimension (227 × 227 × 3), N-Anchors: 6; learning rate: 0.001; Batch-size: 8; L2 regularization factor: 0.0005; penalty threshold: 0.5, dropout enabled. The used sensing camera is a classical low framerate (60 fps), high-definition resolution and high dynamic range. The calibration parameters of the 800 × 600 tensor Mp were determined by the genetic algorithm as per Equation (3), while the parameter T was fixed heuristically (after several tests) to 1.55.
The input frame will be resized via a bicubic algorithm. The dataset is composed of parts from [44] and is partly generated locally in the tested market stores. The deep network was trained by the SGDM algorithm, while the dataset was split as 70% for training, while the remaining 15% was for validation and 15% for testing. A k-fold (k = 5) cross-validation approach was used. The following Table 3 reports the cross-validated test set benchmarks compared with other classical deep networks.
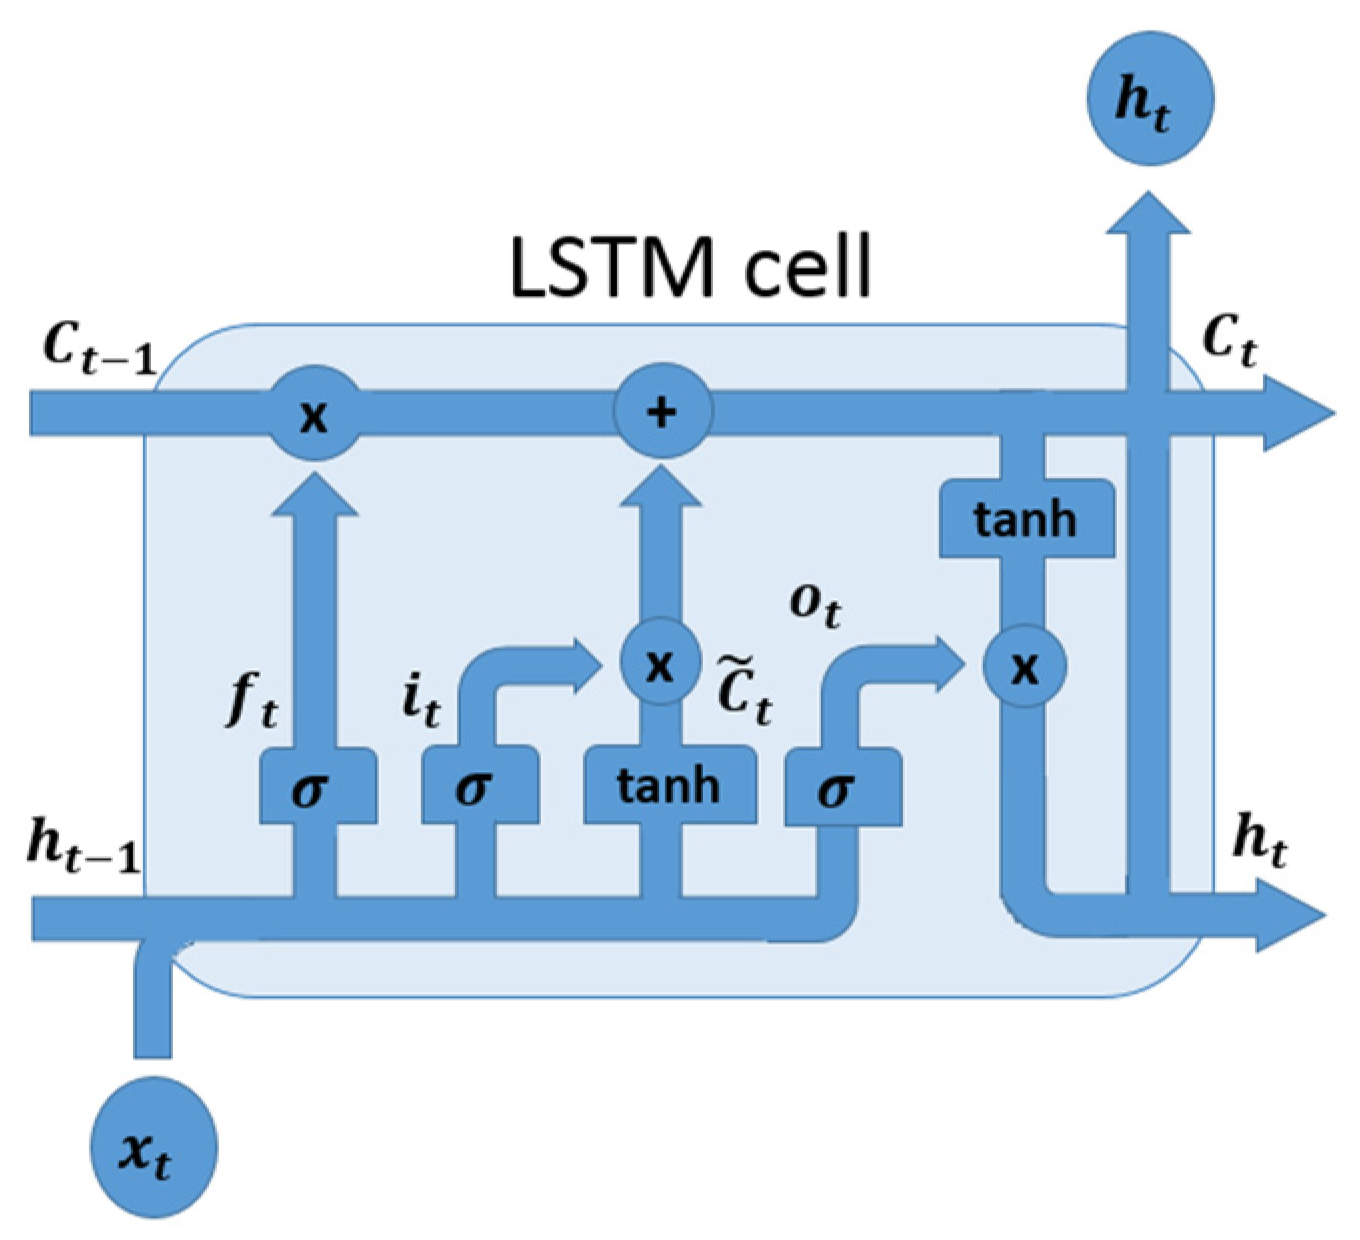
Regarding the customer sentiment analysis subsystem, we have tested the proposed Mask-R-CNN embedding a ResNet-101 with Criss-Cross backbone. The used configuration and learning hyperparameters are the following: input frame dimension (227 × 227 × 3); learning rate: 0.001; batch size: 16; L2 regularization factor: 0.0002; penalty threshold: 0.5, dropout enabled. As the downstream classifier of the tracked customer–skeleton junction points time series, we implemented a convolutional LSTM. Specifically, we have designed an input layer of 16 × 224 (as described in the relevant section of this paper). For the convolutive blocks, we opted for a backbone based on VGG19 embedding the convolutional and activation layers up to the fully connected (excluded) stacks of this architecture. In the unfolding and flattened sequence block, we have adapted the dimensions with further convolutional blocks and therefore passed the so-computed features to a deep LSTM composed of six hidden layers of 100 vanilla LSTM basic vanilla units (see Figure 9 for unit structure). The LSTM cell is able to select which information to discard or store. In order to produce effective results in real applications, this selective method requires three different mechanisms to read, store and discard information by taking advantage of specific selectors called “gates”. Basically, the “input gate”, “output gate” and “forget gate” processing is implemented via activation functions suitable to define if such information is relevant or not. More in detail, given xt as the input vector, ht−1 as the previous cell output, Ct−1 as the previous cell memory, ht as the current cell output and Ct as the current cell memory, we defined Equations (9)–(11) to determine which information to store. Finally, we generated the output of LSTM by updating the old cell state as per Equation (12) and merging the previous output, input and bias vector of Equations (13) and (14).
The diagram of classical vanilla LSTM unit is reported in Figure 9.
The used sensing camera is the same as described in the previous paragraph. The input frame will be resized through a bicubic algorithm. The dataset is composed of classical gesture recognition NTU-60/NTU-120 datasets [45] extended with locally generated ones in the indoor market stores. The deep network was trained by the SGDM algorithm, while the dataset was split as 70% for training, with the remaining 15% for validation and 15% for testing. A k-fold (k = 3) cross-validation approach was used. The following tables reported the benchmarks comparison with other classical deep networks.
As reported in Table 4 and Table 5, our proposed solution outperformed the others for the enhanced NTU-60 dataset but underperformed in the enhanced NTU-120 dataset.
This drop in performance with respect to the 3D architecture is probably due to the fact that for a large dataset, a temporal correlation in the input data could improve the discriminative features. Finally, we tested the deep architecture embedded in the intelligent stock management system. Basically, we designed the 1D-TCNN as follows: input layer of 1 × 300 dimension; 12 main convolutional blocks; L2-regularization factor: 0.0005; penalty threshold: 0.25; dropout enabled; batch size: 10. Each of the convolutional blocks is composed of a 3 × 3 dilated convolutional layer followed by normalization, spatial dropout, 5 × 5 dilated causal convolutional layer, normalization, ReLU activation and spatial dropout. Each block shows residual gradient propagation with a 1 × 1 convolutional layer for adapting the dimension of the features. The dilation factor starts from 2 and moves to 16 with increments of 2 for each convolutional block. The dataset is composed of a vector of elements composed of the fields included in Table 1 and Table 2 (the vector length was 8), for each stock’s category. We collected 5 years of historical data as per Table 1 and Table 2 from a local market store backlog for different categories for a total amount of input instances. We divided this dataset as follows: 65% as a training set, with the remaining 30% for validation and testing. K-fold (k = 3) cross-validation was used. We labeled the data, assigning the “high-risk out-of-stock” as scenario in which the related stock was sold out despite requests; “medium-risk out-of-stock” was the scenario in which the related stock covered 60% of the real requests; “low-risk out-of-stock” was the scenario in which the related stock covered all the requests made by the customer. The following table reported the benchmark comparison with other classical deep networks.
As reported in Table 6, we compared our architecture with ones based on deep LSTM, multi-layer perceptron (classical backpropagation MLP with one hidden layer of 200 neurons) and with a classification based on support vector machine (SVM). Our proposed solution outperforms the other machine learning approaches, confirming the effectiveness of the designed pipeline.
In order to validate the whole pipeline and the contribution of each block in achieving the target of the GAIA system, we proceeded to execute an ablation session, removing individual subsystems of the GAIA system and validating the system′s ability to correctly calculate risk assessment. In reference to the dataset used in this testing, we used a short data history of a sales point of a local holding in the large-scale food distribution sector (see Acknowledgments section). Throughout the history of data, both video clips, and financial flow and orders, we simulated a real scenario by obtaining real risk assessments. In detail, we selected some products from the store and structured the dataset by cataloging the input data (video frames of the area of the store where these products are located, financial flows related to the purchases of these products, dynamics of orders executed). Then, the risk assessments were calculated by evaluating, for each time, if there had been a significant out-of-stock or surplus of stock (high risk) or if such phenomena occurred in a moderate (medium risk) or negligible (low risk) form. To discriminate between the three classes, we used thresholds related to the quantity of residual stock. Having constructed the dataset in this way, we proceeded to validate the GAIA system both in integral form and by removing individual subsystems in order to validate its specific contribution. We collected 2 weeks of historical data with a sampling rate of data of 15 min for each day. The collected data were split into 65% for training and 35% for validation and testing. K-fold (k = 3) cross validation has been applied.
The collected performance results (including ablation study) are reported in Table 7.
As evident from Table 7, the GAIA system without each of the specific subsystems of which the full pipeline is composed of significantly degrades in performance both in reference to the visual part and in reference to the analytical part composed of financial flow and orders (stock management). Therefore, the need to equip the GAIA pipeline with each designed subsystem in order to maximize the performance of the entire solution remains confirmed. All the mentioned experimental sessions, including training, validation and testing of the single deep models as well as the full pipeline, have been executed over a server INTEL MultiCores embedding a GPU RTX 2080 with 24 GB of video memory and in Pytorch/Matlab rev. 2021 frameworks.
5. Discussion and Conclusions
In this paper, the contribution developed entirely by the authors and called GAIA is disclosed. It is an innovative system based on artificial intelligence for the management of a commercial store. Specifically, GAIA manages the market store in various areas, from the dynamic reconstruction of customer sentiment, to the anomalies in the management of warehouse stock and to the reconstruction of the correlation of cashflow with respect to the real interest of customers in the store. Using sophisticated deep learning techniques that include attention mechanisms and multi-modal analysis of input data, GAIA allows for an efficient monitoring of the market store combined with a robust management of the classic issue of out-of-stock that usually affects large-scale commercial distribution. By means of an intelligent control panel and with real-time updates, the GAIA system is able to monitor the various sectors of the market store both through computer vision systems that characterize the sentiment and interest of customers and through convolutional temporal deep networks for the predictive and efficient estimation of warehouse orders. From a benchmark comparison with similar deep learning models, GAIA′s AI backbone shows greater performance compared to the state-of-the-art, both in relation to the computer vision part and in relation to the predictive and understanding part of customer sentiment. Through the designed self-attention mechanisms embedded in the deep architectures implemented in the GAIA framework, the discriminating capacity of the features map has been significantly increased, thus allowing for high performance indicators in terms of accuracy and average precision. By means of the virtual sectorization supported by the GAIA system, it is possible to define the level of granularity of the product sector to be monitored. Finally, for the application of GAIA, no special hardware equipment is required at the commercial point, but the normally supplied security video cameras with the financial and warehouse flow management systems can be used. The GAIA system is currently being integrated into some market stores. Specifically, the integration is quite simple and does not require high costs. As regards the visual part (therefore the computer vision and sentiment reconstruction systems based on the analysis of the customer–skeletons), the framework of security cameras that the market stores are already equipped with was used. Using the calibration system, we adopted the frames according to the characteristics specified in this paper. As for the part of the analysis of the financial flows of purchases and orders, we interfaced through a simple software wrapper with the management system that the market stores are usually equipped with. As for the computational part, we used a server as described in the previous section containing the experimental results. Therefore, the integration of the GAIA system in any market store is quite simple and does not require particular costs, as it integrates perfectly into the hardware and software frameworks that market stores are usually equipped with.
Future works intend to further expand GAIA with additional control modules of the commercial point for optimal waste management, optimal customer profiling, as well as for the characterization of promotions tailored to customers.
6. Patents
Aziz Chamas, Cettina Giaconia, “GAIA: Great-Distribution Artificial Intelligence Algorithms”, IT Patent Nr. 101022000002828, 16 February 2022.
Author Contributions
Conceptualization, C.G. and A.C.; methodology, C.G. and A.C.; software, A.C.; validation, C.G. and A.C.; formal analysis, C.G. and A.C.; investigation, C.G. and A.C.; resources, C.G. and A.C.; data curation, A.C.; writing—original draft preparation, C.G. and A.C.; writing—review and editing, C.G. and A.C.; visualization, C.G. and A.C.; supervision, C.G. and A.C.; project administration, C.G. and A.C.; funding acquisition, C.G. All authors have read and agreed to the published version of the manuscript.
Funding
This research received no external funding.
Institutional Review Board Statement
Not applicable.
Informed Consent Statement
Informed consent was obtained from all subjects involved in the study. GDPR compliant anonymization has been applied in the sampled video frames.
Data Availability Statement
Not applicable.
Acknowledgments
The authors thank the “Giaconia srl” commercial market holding for having supported this work by sharing a commercial store for the collection of data needed for the training of GAIA and for allowing the actual testing of the system.
Conflicts of Interest
The authors declare no conflict of interest.
References
- Oyekanlu, E.; Scoles, K. Towards Low-Cost, Real-Time, Distributed Signal and Data Processing for Artificial Intelligence Applications at Edges of Large Industrial and Internet Networks. In Proceedings of the 2018 IEEE First International Conference on Artificial Intelligence and Knowledge Engineering (AIKE), Laguna Hills, CA, USA, 26–28 September 2018; pp. 166–167. [Google Scholar] [CrossRef]
- Priya, S.N.; Swadesh, G.; Thirivikraman, K.; Ali, M.V.; Kumar, M.R. Autonomous Supermarket Robot Assistance using Machine Learning. In Proceedings of the 2021 7th International Conference on Advanced Computing and Communication Systems (ICACCS), Coimbatore, India, 19–20 March 2021; pp. 996–999. [Google Scholar] [CrossRef]
- Paik, S.; Rim, S. Demand Control Chart. In Proceedings of the 2006 IEEE International Conference on Service Operations and Logistics, and Informatics, Shanghai, China, 21–23 June 2006; pp. 587–592. [Google Scholar] [CrossRef]
- Mitsukuni, K.; Tsushima, I.; Komoda, N. Evaluation of optimal ordering method for coupling point production system. In Proceedings of the 1999 7th IEEE International Conference on Emerging Technologies and Factory Automation, Proceedings ETFA ‘99 (Cat. No.99TH8467), Barcelona, Spain, 18–21 October 1999; Volume 2, pp. 1469–1474. [Google Scholar] [CrossRef]
- Rosado, L.; Goncalves, J.; Costa, J.; Ribeiro, D.; Soares, F. Supervised learning for Out-of-Stock detection in panoramas of retail shelves. In Proceedings of the 2016 IEEE International Conference on Imaging Systems and Techniques (IST), Chania, Greece, 4–6 October 2016; pp. 406–411. [Google Scholar] [CrossRef]
- Šećerović, L.; Papić, V. Detecting missing products in commercial refrigerators using convolutional neural networks. In Proceedings of the 2018 14th Symposium on Neural Networks and Applications (NEUREL), Belgrade, Serbia, 20–21 November 2018; pp. 1–4. [Google Scholar] [CrossRef]
- Damian, A.I.; Piciu, L.; Marinescu, C.; Tapus, N. ProVe—Self-supervised pipeline for automated product replacement and cold-starting based on neural language models. In Proceedings of the 2021 23rd International Conference on Control Systems and Computer Science (CSCS), Bucharest, Romania, 26–28 May 2021; pp. 98–105. [Google Scholar] [CrossRef]
- Haihan, L.; Guanglei, Q.; Nana, H.; Xinri, D. Shopping Recommendation System Design Based On Deep Learning. In Proceedings of the 2021 6th International Conference on Intelligent Computing and Signal Processing (ICSP), Xi’an, China, 9–11 April 2021; pp. 998–1001. [Google Scholar] [CrossRef]
- Utku, A.; Akcayol, M.A. A New Deep Learning-Based Prediction Model for Purchase Time Prediction. In Proceedings of the 2021 6th International Conference on Computer Science and Engineering (UBMK), Ankara, Turkey, 15–17 September 2021; pp. 6–9. [Google Scholar] [CrossRef]
- Sarwar, M.A.; Daraghmi, Y.-A.; Liu, K.-W.; Chi, H.-C.; Ik, T.-U.; Li, Y.-L. Smart Shopping Carts Based on Mobile Computing and Deep Learning Cloud Services. In Proceedings of the 2020 IEEE Wireless Communications and Networking Conference (WCNC), Seoul, Korea, 25–28 May 2020; pp. 1–6. [Google Scholar] [CrossRef]
- Shekokar, N.; Kasat, A.; Jain, S.; Naringrekar, P.; Shah, M. Shop and Go: An innovative approach towards shopping using Deep Learning and Computer Vision. In Proceedings of the 2020 Third International Conference on Smart Systems and Inventive Technology (ICSSIT), Tirunelveli, India, 20–22 August 2020; pp. 1201–1206. [Google Scholar] [CrossRef]
- Zhang, S.; Zhang, D.; Zhong, H.; Wang, G. A Multiclassification Model of Sentiment for E-Commerce Reviews. IEEE Access 2020, 8, 189513–189526. [Google Scholar] [CrossRef]
- Liu, B. Sentiment Analysis: Mining Opinions Sentiments and Emotions; Cambridge University Press: New York, NY, USA, 2015. [Google Scholar]
- Liu, B. Sentiment analysis and subjectivity. In Handbook of Natural Language Processing; CRC Press: Boca Raton, FL, USA, 2010. [Google Scholar]
- Cambria, E. Affective computing and sentiment analysis. IEEE Intell. Syst. 2016, 31, 102–107. [Google Scholar] [CrossRef]
- Rogojanu, I.; Suciu, G.; Ditu, M.-C.; Pasat, A. Smart Shopping Technologies for Indoor Markets. In Proceedings of the 2018 IEEE International Conference on Computational Science and Engineering (CSE), Bucharest, Romania, 29–31 October 2018; pp. 99–103. [Google Scholar] [CrossRef]
- Hu, T.-L. Mobile Shopping Website Interaction Consumer Shopping Behaviour and Website App Loyalty—An Empirical Investigation of the Nine Mobile Shopping Website App. Available online: http://globalbizresearch.org/Singapore_Conference2015/pdf/S567.pdf (accessed on 25 April 2022).
- Pironti, M.; Bagheri, M.; Pisano, P. Can proximity technologies impact on organisation business model—An empirical approach. Int. J. Technol. Transf. Commer. 2017, 15, 19–37. [Google Scholar] [CrossRef]
- Puccinelli, N.; Goodstein, R.C.; Grewal, D.; Price, R.; Raghubir, P.; Stewart, D. Customer Experience Management in Retailing: Understanding the Buying Process. J. Retail. 2009, 85, 15–30. [Google Scholar] [CrossRef]
- Lin, X.Y.; Ho, T.W.; Fang, C.C.; Yen, Z.S.; Yang, B.J.; Lai, F. A mobile indoor positioning system based on iBeacon technology. In Proceedings of the Engineering in Medicine and Biology Society (EMBC) 2015 37th Annual International Conference of the IEEE, Milan, Italy, 25–29 August 2015; pp. 4970–4973. [Google Scholar]
- Vochin, M.; Vulpe, A.; Suciu, G.; Boicescu, L. Intelligent Displaying and Alerting System Based on an Integrated Communications Infrastructure and Low-Power Technology. In World Conference on Information Systems and Technologies; Springer: Cham, Switzerland, 2017; pp. 135–141. [Google Scholar]
- Dong, Y.; Ye, X.; He, X. A novel camera calibration method combined with calibration toolbox and genetic algorithm. In Proceedings of the 2016 IEEE 11th Conference on Industrial Electronics and Applications (ICIEA), Hefei, China, 5–7 June 2016; pp. 1416–1420. [Google Scholar] [CrossRef]
- Liu, P.; Zhang, J.; Guo, K. A Camera Calibration Method Based on Genetic Algorithm. In Proceedings of the 2015 7th International Conference on Intelligent Human-Machine Systems and Cybernetics, Hangzhou, China, 26–27 August 2015; pp. 565–568. [Google Scholar] [CrossRef]
- Lu, L.; Li, H. Study of camera calibration algorithm based on spatial perpendicular intersect. In Proceedings of the 2010 2nd International Conference on Signal Processing Systems, Dalian, China, 5–7 July 2010; pp. V3-125–V3-128. [Google Scholar] [CrossRef]
- Tan, S.; Lu, G.; Jiang, Z.; Huang, L. Improved YOLOv5 Network Model and Application in Safety Helmet Detection. In Proceedings of the 2021 IEEE International Conference on Intelligence and Safety for Robotics (ISR), Tokoname, Japan, 4–6 March 2021; pp. 330–333. [Google Scholar] [CrossRef]
- He, K.; Zhang, X.; Ren, S.; Sun, J. Deep Residual Learning for Image Recognition. In Proceedings of the 2016 IEEE Conference on Computer Vision and Pattern Recognition (CVPR), Las Vegas, NV, USA, 27–30 June 2016; pp. 770–778. [Google Scholar] [CrossRef] [Green Version]
- Chen, X.; Zhou, Z.; Ying, Y.; Qi, D. Real-time Human Segmentation using Pose Skeleton Map. In Proceedings of the 2019 Chinese Control Conference (CCC), Guangzhou, China, 27–30 July 2019; pp. 8472–8477. [Google Scholar] [CrossRef]
- Xu, C.; Yu, X.; Wang, Z.; Ou, L. Multi-View Human Pose Estimation in Human-Robot Interaction. In Proceedings of the IECON 2020 The 46th Annual Conference of the IEEE Industrial Electronics Society, Singapore, 18–21 October 2020; pp. 4769–4775. [Google Scholar] [CrossRef]
- Lie, W.-N.; Lin, G.-H.; Shih, L.-S.; Hsu, Y.; Nguyen, T.H.; Nhu, Q.N.Q. Fully Convolutional Network for 3D Human Skeleton Estimation from a Single View for Action Analysis. In Proceedings of the 2019 IEEE International Conference on Multimedia & Expo Workshops (ICMEW), Shanghai, China, 8–12 July 2019; pp. 1–6. [Google Scholar] [CrossRef]
- Chen, N.; Chang, Y.; Liu, H.; Huang, L.; Zhang, H. Human Pose Recognition Based on Skeleton Fusion from Multiple Kinects. In Proceedings of the 2018 37th Chinese Control Conference (CCC), Wuhan, China, 25–27 July 2018; pp. 5228–5232. [Google Scholar] [CrossRef]
- Sajjad, F.; Ahmed, A.F.; Ahmed, M.A. A Study on the Learning Based Human Pose Recognition. In Proceedings of the 2017 9th IEEE-GCC Conference and Exhibition (GCCCE), Manama, Bahrain, 8–11 May 2017; pp. 1–8. [Google Scholar] [CrossRef]
- Ding, M.; Fan, G. Articulated and Generalized Gaussian Kernel Correlation for Human Pose Estimation. IEEE Trans. Image Process. 2016, 25, 776–789. [Google Scholar] [CrossRef] [PubMed]
- Wibawa, I.P.D.; Machbub, C.; Rohman, A.S.; Hidayat, E.M.I. Improving Dynamic Bounding Box using Skeleton Keypoints for Hand Pose Estimation. In Proceedings of the 2020 6th International Conference on Interactive Digital Media (ICIDM), Bandung, Indonesia, 14–15 December 2020; pp. 1–7. [Google Scholar] [CrossRef]
- Ryu, H.; Kim, S.-H.; Hwang, Y. Skeleton-based Human Action Recognition Using Spatio-Temporal Geometry (ICCAS 2019). In Proceedings of the 2019 19th International Conference on Control, Automation and Systems (ICCAS), Jeju, Korea, 15–18 October 2019; pp. 329–332. [Google Scholar] [CrossRef]
- He, K.; Gkioxari, G.; Dollár, P.; Girshick, R. Mask R-CNN. In Proceedings of the 2017 IEEE International Conference on Computer Vision (ICCV), Venice, Italy, 22–29 October 2017; pp. 2980–2988. [Google Scholar] [CrossRef]
- Zilong, H.; Wang, X.; Huang, L.; Huang, C.; Wei, Y.; Liu, W. CCNet: Criss-Cross Attention for Semantic Segmentation. In Proceedings of the 2019 IEEE/CVF International Conference on Computer Vision (ICCV), Seoul, Korea, 27 October–2 November 2019; pp. 603–612. [Google Scholar] [CrossRef] [Green Version]
- Jingyao, W.; Naigong, Y.; Firdaous, E. Gesture recognition matching based on dynamic skeleton. In Proceedings of the 2021 33rd Chinese Control and Decision Conference (CCDC), Kunming, China, 22–24 May 2021; pp. 1680–1685. [Google Scholar] [CrossRef]
- Liu, J.; Zhang, T.; Gou, Y.; Wang, X.; Li, B.; Guan, W. Convolutional LSTM networks for seawater temperature prediction. In Proceedings of the 2019 IEEE International Conference on Signal, Information and Data Processing (ICSIDP), Chongqing, China, 11–13 December 2019; pp. 1–5. [Google Scholar] [CrossRef]
- Zhu, G.; Zhang, L.; Yang, L.; Mei, L.; Shah, S.A.A.; Bennamoun, M.; Shen, P. Redundancy and Attention in Convolutional LSTM for Gesture Recognition. IEEE Trans. Neural Netw. Learn. Syst. 2020, 31, 1323–1335. [Google Scholar] [CrossRef] [PubMed]
- Sambrekar, P.; Chickerur, S. Movie Frame Prediction Using Convolutional Long Short Term Memory. In Proceedings of the 2019 2nd International Conference on Intelligent Computing, Instrumentation and Control Technologies (ICICICT), Kannur, India, 5–6 July 2019; pp. 1–5. [Google Scholar] [CrossRef]
- Bai, S.; Kolter, J.Z.; Koltun, V. An Empirical Evaluation of Generic Convolutional and Recurrent Networks for Sequence Modeling. arXiv 2018, arXiv:1803.01271. Available online: https://arxiv.org/abs/1803.01271 (accessed on 25 April 2022).
- Oord, A.V.D.; Dieleman, S.; Zen, H.; Simonyan, K.; Vinyals, O.; Graves, A.; Kalchbrenner, N.; Senior, A.; Kavukcuoglu, K. WaveNet: A Generative Model for Raw Audio. arXiv 2016, arXiv:1609.03499. Available online: https://arxiv.org/abs/1609.03499 (accessed on 25 April 2022).
- Tompson, J.; Goroshin, R.; Jain, A.; LeCun, Y.; Bregler, C. Efficient Object Localization Using Convolutional Networks. In Proceedings of the 2015 IEEE Conference on Computer Vision and Pattern Recognition (CVPR), Boston, MA, USA, 7–12 June 2015; pp. 648–656. [Google Scholar] [CrossRef] [Green Version]
- Shao, S.; Zhao, Z.; Li, B.; Xiao, T.; Yu, G.; Zhang, X.; Sun, J. CrowdHuman: A Benchmark for Detecting Human in a Crowd. arXiv 2018, arXiv:1805.00123. [Google Scholar]
- Duan, H.; Zhao, Y.; Chen, K.; Shao, D.; Lin, D.; Dai, B. Revisiting Skeleton-based Action Recognition. arXiv 2021, arXiv:2104.13586. [Google Scholar]
Figure 1.
The fully designed GAIA pipeline overview.

Figure 2.
GAIA: the computer vision subsystem.

Figure 3.
An instance of virtual sectorization (blue lines with numerical assignment) of the indoor market shop with generated heat map.
Figure 3.
An instance of virtual sectorization (blue lines with numerical assignment) of the indoor market shop with generated heat map.

Figure 4.
The modified YOLOv5 small backbone embedded in the CVSS of the GAIA system.

Figure 5.
The designed Criss-Cross Mask-R-CNN used for human skeleton generator.

Figure 6.
The designed customer sentiment analysis pipeline.

Figure 7.
The proposed intelligent stock management deep system.

Figure 8.
A detail of the proposed GAIA intelligent control panel.

Figure 9.
Convolutional LSTM: LSTM basic unit.


Table 1.
Descriptive fields that will be extracted from a single receipt after a sale.
| Receipt Fields |
|---|
| Data |
| Hours |
| Amount of the receipt |
| Type of sold stock (with stock identification code) |
| Quantity of sold stock |
Table 2.
Descriptive fields that will be provided from each of the treated stock.
| Receipt Fields |
|---|
| Quantity of product in stock |
| Quantity of the last purchase order |
| Product promotion (active/not active) |
Table 3.
Computer vision subsystem (enhanced YOLOv5 small) benchmark comparison.
| Deep Network | AP (Average Precision) | mIoU |
|---|---|---|
| Faster-R-CNN (ResNet backbone) | 93.75% | 80.09% |
| Mask-R-CNN (DenseNet backbone) | 93.91% | 83.22% |
| YOLOv5 | 94.05% | 83.17% |
| Proposed | 95.33% | 85.07% |
Table 4.
Customer sentiment analysis system (Mask-R-CNN with ResNet-101 Criss-Cross) benchmark comparison—enhanced NTU-60 dataset (1-clip).
Table 4.
Customer sentiment analysis system (Mask-R-CNN with ResNet-101 Criss-Cross) benchmark comparison—enhanced NTU-60 dataset (1-clip).
| Deep Network | Accuracy |
|---|---|
| Graph-Convolutional Network | 91.31% |
| 3D-CNN | 92.07% |
| Faster-R-CNN | 89.65% |
| Mask-R-CNN | 90.83% |
| Proposed | 92.91% |
Table 5.
Customer sentiment analysis system (Mask-R-CNN with ResNet-101 Criss-Cross) benchmark comparison—enhanced NTU-120 dataset (1-clip).
Table 5.
Customer sentiment analysis system (Mask-R-CNN with ResNet-101 Criss-Cross) benchmark comparison—enhanced NTU-120 dataset (1-clip).
| Deep Network | Accuracy |
|---|---|
| Graph-Convolutional Network | 83.80% |
| 3D-CNN | 84.88% |
| Faster-R-CNN | 77.87% |
| Mask-R-CNN | 79.02% |
| Proposed | 82.01% |
Table 6.
Intelligent stock management system (Mask-R-CNN with ResNet-101 Criss-Cross)—NTU-120 dataset (1-clip).
Table 6.
Intelligent stock management system (Mask-R-CNN with ResNet-101 Criss-Cross)—NTU-120 dataset (1-clip).
| Deep Network | Accuracy |
|---|---|
| Deep LSTM | 91.25% |
| MLP | 90.96% |
| SVM | 87.91% |
| Proposed | 94.32% |
Table 7.
Ablation analysis of the GAIA system.
| GAIA System Structure | High Risk | Medium Risk | Low Risk |
|---|---|---|---|
| full pipeline | 91.42% | 93.54% | 90.00% |
| without computer vision block | 85.71% | 87.09% | 86.66% |
| without customer sentiment block | 82.85% | 90.32% | 83.33% |
| without cashflow analyzer block | 80.09% | 80.64% | 83.33% |
| without intelligent stock management | 85.71% | 87.09% | 83.33% |
Publisher’s Note: MDPI stays neutral with regard to jurisdictional claims in published maps and institutional affiliations. |
© 2022 by the authors. Licensee MDPI, Basel, Switzerland. This article is an open access article distributed under the terms and conditions of the Creative Commons Attribution (CC BY) license (https://creativecommons.org/licenses/by/4.0/).
Share and Cite
MDPI and ACS Style
Giaconia, C.; Chamas, A. GAIA: Great-Distribution Artificial Intelligence-Based Algorithm for Advanced Large-Scale Commercial Store Management. Appl. Sci. 2022, 12, 4798. https://0-doi-org.brum.beds.ac.uk/10.3390/app12094798
AMA Style
Giaconia C, Chamas A. GAIA: Great-Distribution Artificial Intelligence-Based Algorithm for Advanced Large-Scale Commercial Store Management. Applied Sciences. 2022; 12(9):4798. https://0-doi-org.brum.beds.ac.uk/10.3390/app12094798
Chicago/Turabian StyleGiaconia, Cettina, and Aziz Chamas. 2022. "GAIA: Great-Distribution Artificial Intelligence-Based Algorithm for Advanced Large-Scale Commercial Store Management" Applied Sciences 12, no. 9: 4798. https://0-doi-org.brum.beds.ac.uk/10.3390/app12094798
Note that from the first issue of 2016, this journal uses article numbers instead of page numbers. See further details here.