Review

Tunable Multicolored Femtosecond Pulse Generation Using Cascaded Four-Wave Mixing in Bulk Materials

1
Advanced Ultrafast Laser Research Center, University of Electro-Communications, 1-5-1 Chofugaoka, Chofu, Tokyo 182-8585, Japan
2
Japan Science and Technology Agency (JST), Core Research for Evolutional Science and Technology (CREST), 5 Sanbancho, Chiyoda-ku, Tokyo 102-0075, Japan
3
State Key Laboratory of High Field Laser Physics, Shanghai Institute of Optics and Fine Mechanics, Chinese Academy of Science, 390 Qinghe Rd., Jiading, Shanghai 201800, China
4
Department of Electrophysics, National Chiao-Tung University, 1001 Ta Hsinchu Rd., Hsinchu 300, Taiwan
5
Institute of Laser Engineering, Osaka University, 2-6 Yamada-oka, Suita, Osaka 565-0971, Japan
*
Author to whom correspondence should be addressed.
Submission received: 4 June 2014 / Revised: 22 July 2014 / Accepted: 12 August 2014 / Published: 22 September 2014

Abstract

:
This paper introduces and discusses the main aspects of multicolored femtosecond pulse generation using cascaded four-wave mixing (CFWM) in transparent bulk materials. Theoretical analysis and semi-quantitative calculations, based on the phase-matching condition of the four-wave mixing process, explain the phenomena well. Experimental studies, based on our experiments, have shown the main characteristics of the multicolored pulses, namely, broadband spectra with wide tunability, high stability, short pulse duration and relatively high pulse energy. Two-dimensional multicolored array generation in various materials are also introduced and discussed.

1. Introduction

Tunable, ultrashort laser pulses in different spectral ranges are powerful tools with applications in scientific research including ultrafast time-resolved spectroscopy [1,2,3,4,5,6,7], nonlinear microscopy [8,9,10,11,12,13,14] and laser micro-machining [15,16,17,18]. In the case of ultrafast time-resolved spectroscopy, which is widely used in the investigation of electronic and vibrational dynamics in molecules, the absorption peaks vary from sample to sample, and some of the molecular dynamics under investigation take place in less than 100 fs. As a result, sub-20 fs pulses with a time resolution high enough to observe real-time vibrational quantum beat and that are wavelength tunable in a wide range will play a key role. Nonlinear microscopy, such as two- or three-photon and second- or third-harmonic generation (SHG/THG) microscopy, are technologies widely used in biological research. Two-photon microscopy can be used in tissue imaging with a depth of several hundred μm [8,9], and three-photon microscopy can image to a depth of 1.4 mm [10]. SHG/THG microscopy can be used to image some biological tissues without the need for fluorescent proteins or staining with dyes, and can achieve imaging depths of several hundred μm due to its use of long excitation wavelengths [11,12,13,14]. The pump laser sources used in nonlinear microscopy have pulse widths of ~100 fs or shorter, and a visible to middle-IR spectral range [8,9,10,11,12,13,14]. Some spectroscopy and microscopy experiments, such as the multicolor pump-probe experiment [19], two-dimensional spectroscopy [20], or multicolor nonlinear microscopy [21,22,23] require ultrashort pulses with several colors.
Conventionally-used ultrashort laser sources have a spectral range of 650–950 nm (Ti:sapphire laser), 1000–1100 nm (Yb-/Nd-doped solid-state laser or fiber laser), or 1550 nm (Er-doped fiber laser). Great efforts have been made to extend the spectral range using nonlinear processes [24,25,26,27,28,29,30,31,32,33,34,35,36,37,38,39,40]. Optical parametric amplifier (OPA) and optical parametric oscillator (OPO) technologies are among the most successful methods for generating μJ-level pulses with spectral ranges from UV to mid-IR [32,33,34,35]. Spectrally tunable few-cycle pulses can be generated using a noncollinear optical parametric amplifier (NOPA) [36,37,38,39,40]. Commercial NOPA setups are available from several companies, although the price is still too high for many research groups. Pulses with broadband spectra from visible to IR (known as super continuum white light) also can be generated through filamentation in gases, bulk media, or fibers [41,42,43,44,45], although there are problems with the stability of the supercontinuum laser pulses [46,47,48].
Recently, four-wave mixing (FWM) has been studied as new method for the generation of ultrashort pulses, including few-cycle pulses, with a spectral range from deep-UV (DUV) to mid-IR [49,50,51,52,53,54,55,56,57,58,59,60,61,62,63,64,65,66]. Among these results, the multicolored laser pulses that can be generated using cascaded four-wave mixing (CFWM) in transparent bulk materials are particularly attractive, due to their ultra-broadband spectral range, large wavelength tunable range and compact configurations [54,55,56,57,58,59,60,61,62,63,64,65,66]. Multicolored laser pulses generated by CFWM were first shown in semiconductor lasers in the 1980s [67]. Highly efficient multicolor (>4 color) signals were generated in a nearly degenerate intracavity FWM experiment in a GaAs/GaAlAs semiconductor laser with a dye laser as the pump source for both the semiconductor laser and the FWM process. This was used as a method for quantitative determination of the third-order nonlinear optical susceptibility of the semiconductor. Eckbreth then generated multicolored light (>4) with a coherent anti-Stokes Raman scattering process in several gases, and the light was used for hydrogen-fueled scramjet applications [68]. Harris and Sokolov showed that more than 13 sidebands with a spectral range from 195 nm to 2.94 μm were generated in D2 gas by using a Raman process [69]. In 2000, Crespo and his co-workers reported multicolored (>11 color) sideband generation using a cascaded highly nondegenerate FWM process in common glass [54]. Since then, studies have been conducted using other materials, such as sapphire plate [55,56], BBO crystal [57,58], fused silica glass [59], CaF2 [60], BK7 glass [60], and diamond [61,62]. These studies have carefully investigated the mechanism and characteristics of multicolored laser pulses. The phase-matching condition of CFWM has also been discussed and used to explain the generation of multicolored sidebands with two noncollinear pump laser pulses [60]. Our experiment has shown that more than 15 spectral upshifted sidebands and two spectral downshifted pulses can be obtained with a spectral width broader than 1.8 octaves, covering the range from UV to near-IR [55,56,57,59,60]. The spectra of the multicolored sidebands can also be tuned in the broadband spectral range by adjusting the cross-angle of the two pump beams or simply by replacing the nonlinear media [59,60]. The pulse duration of different sidebands can be shorter than 50 fs without any extra dispersion compensation components [55,56,57,59,60], and sub-20 fs pulses can be obtained when the pump pulse chirp is carefully optimized [63]. Weigand and his co-workers also tried to recombine and synthesize all of the sidebands, and found that few-cycle visible-UV pulses were feasible [64,65]. The pulse energy of the first sideband can be higher than 1 μJ, with an energy conversion efficiency of around 10% [66]. A low pump threshold for multicolored sideband generation was reported when materials with high nonlinear refractive indices, such as diamond [62] or nanoparticle-doped materials [70], were used as the nonlinear medium in the experiment. A compact experimental setup for multicolored laser pulse generation was also constructed [62]. Aside from the one-dimensional multicolored sidebands discussed above, a two-dimensional (2-D) multicolor sideband array can be generated when the pump intensity is increased in various materials such as a sapphire [55,56], diamond [62], and BBO [71,72]. Characteristically, more than 10 arrays could be generated with pump energies of several to several tens of μJ [55,56,62]. CFWM, together with beam breakup due to ellipticity of pump beams or anisotropy of nonlinear media, are thought to be the main mechanisms behind this new phenomenon [62,71]. However, simulations based on the nonlinear Schrödinger equation are still needed for the phenomenon to be fully understood.
The remainder of this paper is organized as follows. In Section 2, the theoretical analysis for multicolored pulse generation is presented. In Section 3, the characteristics of multicolored pulses are shown. The experimental setups are shown in Section 3.1. In Section 3.2, the spectral characteristics are introduced, i.e., the spectral range of the sidebands, the spectral width of each sideband, and the wavelength tunability of each sideband. The characterization of pulses is described in Section 3.3. Then, the pulse energy/output power and power stability are given in Section 3.4. Multicolored pulse generation with low pump threshold is discussed in Section 3.5. In Section 4, 2-D multicolored sideband arrays are introduced and discussed. Finally, conclusions and some prospects for future research directions are given in Section 5. This article is written as a summary of recent publications reported by the authors.

2. Theoretical Analysis

2.1. FWM Process

FWM was found in the first decade of the laser epoch, and it has rapidly developed in the last twenty years. FWM is a third-order optical parametric process, in which four waves interact with each other through third-order optical nonlinearity [73]. Three waves form a nonlinear polarization at the frequency of the fourth wave during the FWM process. The wave functions of the four waves can be expressed as:
E j (r,t) = A j (r) exp [i( k j r ω j t)] (j = 1 , 2 , 3 , 4)
where, ωj and kj are frequencies and wave vectors of the four waves, and A j (r) = | A j (r) | exp [iϕ(r)] is the complex amplitude.
There are two possible roadmaps of the FWM process that satisfy the conservation of photon energies and momenta. The phase-matching condition or conservation of photon energies and momenta can be written as: (i) ω4 = ω1 + ω2 + ω3, k4 = k1 + k2 + k3; (ii) ω4 + ω3 = ω1 + ω2, k4 + k3 = k1 + k2.
The case (i) involves THG and third-order sum frequency generation. We are more interested in the FWM in case (ii), where the nonlinear polarization at frequency ω4 can be written as:
P (3) ( ω 4 ) = 3 ε 0 χ eff (3) E 1 ( ω 1 ) E 2 ( ω 2 ) E 3 * ( ω 3 ) exp [i( Δ k r )]
where χ eff (3) is the effective third-order nonlinear optical susceptibility, and Δ k = k 1 + k 2 + k 3 k 4 is the wave vector phase-mismatching in the process. By solving the coupled-wave equations for FWM shown as follows:
d E 4 ( ω 4 ) d r = i ω 4 2 ε 0 c n ( ω 4 ) P (3) ( ω 4 ) exp [ k r ]
we can get the optical field, E 4 ( ω 4 ) , of the newly generated signal.

2.2. CFWM Process

The theoretical analysis of CFWM processes for multicolored laser pulse generation is given in [60]. The schematic of CFWM processes is shown in Figure 1a. Two vectors, k1 and k2, correspond to the two input beams with frequencies of ω1 and ω2 (ω1 > ω2) respectively. The mth-order anti-Stokes (spectrally blue-shifted) and Stokes (spectrally red-shifted) sidebands are marked as ASm and Sm (m = 1, 2, 3…). Figure 1b–e show the phase-matching geometries for generating the first three anti-Stokes sidebands (AS1, AS2, AS3) and the first Stokes sideband (S1). Based on these phase-matching geometries, the phase-matching condition for the mth-order anti-Stokes sideband can be written as: kASm = kAS(m–1) + k(m)1k(m)2 ≈ (m + 1)k(1)1 − mk(1)2, ωASm ≈ (m + 1)ω1(1) − mω2(1). Since the two input beams are never single-frequency lasers, k(m)1 and k(m)2 are used instead of k1 and k2. The values of ω1(m), ω2(m), |k(m)1|, and |k(m)2| may be different for every step of the m FWM processes. Similarly, with k(-m)1 and k(-m)2 used instead of k1 and k2, the mth-order Stokes sideband will have the following phase-matching condition: kSm = kS(m1) + k(−m)2k(−m)1 ≈ (m + 1)k(−1)2 − mk(−1)1, ωSm ≈ (m + 1)ω2(−1) − mω1(−1). As the lower-order signals will participate in the generation of adjacent higher-order signals as pump pulses, this process is called CFWM.
Figure 1. Schematic of multicolored sidebands generation using CFWM process. The phase-matching geometries for (a) AS1–AS3 and S1; (b) AS1; (c) AS2; (d) AS3, and (e) S1 [60].
Applsci 04 00444 g001
Based on the phase-matching condition we have expressed above, the output parameters, such as wavelength and output angle, of the generated sidebands can be calculated to explain and inform experimental work. In our experiments, the wavelength range of the two pump beams were 660–740 nm (Beam 1) and 800 nm (Beam 2). The nonlinear medium was assumed to be fused silica plate with a thickness of 1 mm. The simulations were performed under these conditions. The wavelength dependence of Beam 1 for optimal phase-matching on the order number at different cross-angles is shown in Figure 2a. To fulfill the phase-matching condition, the wavelength of Beam 1 should redshift for higher order anti-Stokes sidebands. The wavelengths of generated sidebands for different cross-angles are shown in Figure 2b, which clearly shows that the wavelengths of same order sidebands can be tunable by changing the cross-angle of the two pump beams, and the tuning range covered the wavelength gap between adjacent sidebands. The exit angles of the generated sidebands are plotted against the order number at different cross-angles in Figure 2c. The difference in exit angle between the multicolored sidebands was large enough for easy separation, even for adjacent sidebands. The dependence of the exit angle on the center wavelength of the generated sidebands at different cross-angles in different materials is shown in Figure 2d. The phase mismatching for the first four anti-Stokes sidebands at two different angles, 1.87° and 2.34°, are shown in Figure 2e. The increase of the slope of the curves with the order numbers means the reduction of the gain bandwidth for the sidebands, which was confirmed by our experiment. The calculations based on the phase-matching condition of CFWM agree with the experimental results, which will be given in next section.
Figure 2. Calculated output parameters of generated sidebands. Dependence of (a) central wavelength of Beam 1 for minimum phase-mismatching; (b) the wavelength; and (c) the exit angles of generated sidebands on the order number at different crossing angles; (d) Dependence of exit angle of the generated sidebands on the center wavelength at three different cross-angles, 1.40°, 1.87°, and 2.57°, in different nonlinear media; (e) Phase mismatching of the sidebands from AS1 to AS4 at 1.87° and 2.34° in 1 mm fused silica [60].
Applsci 04 00444 g002

3. Experimental Characteristics of Multicolored Pulses

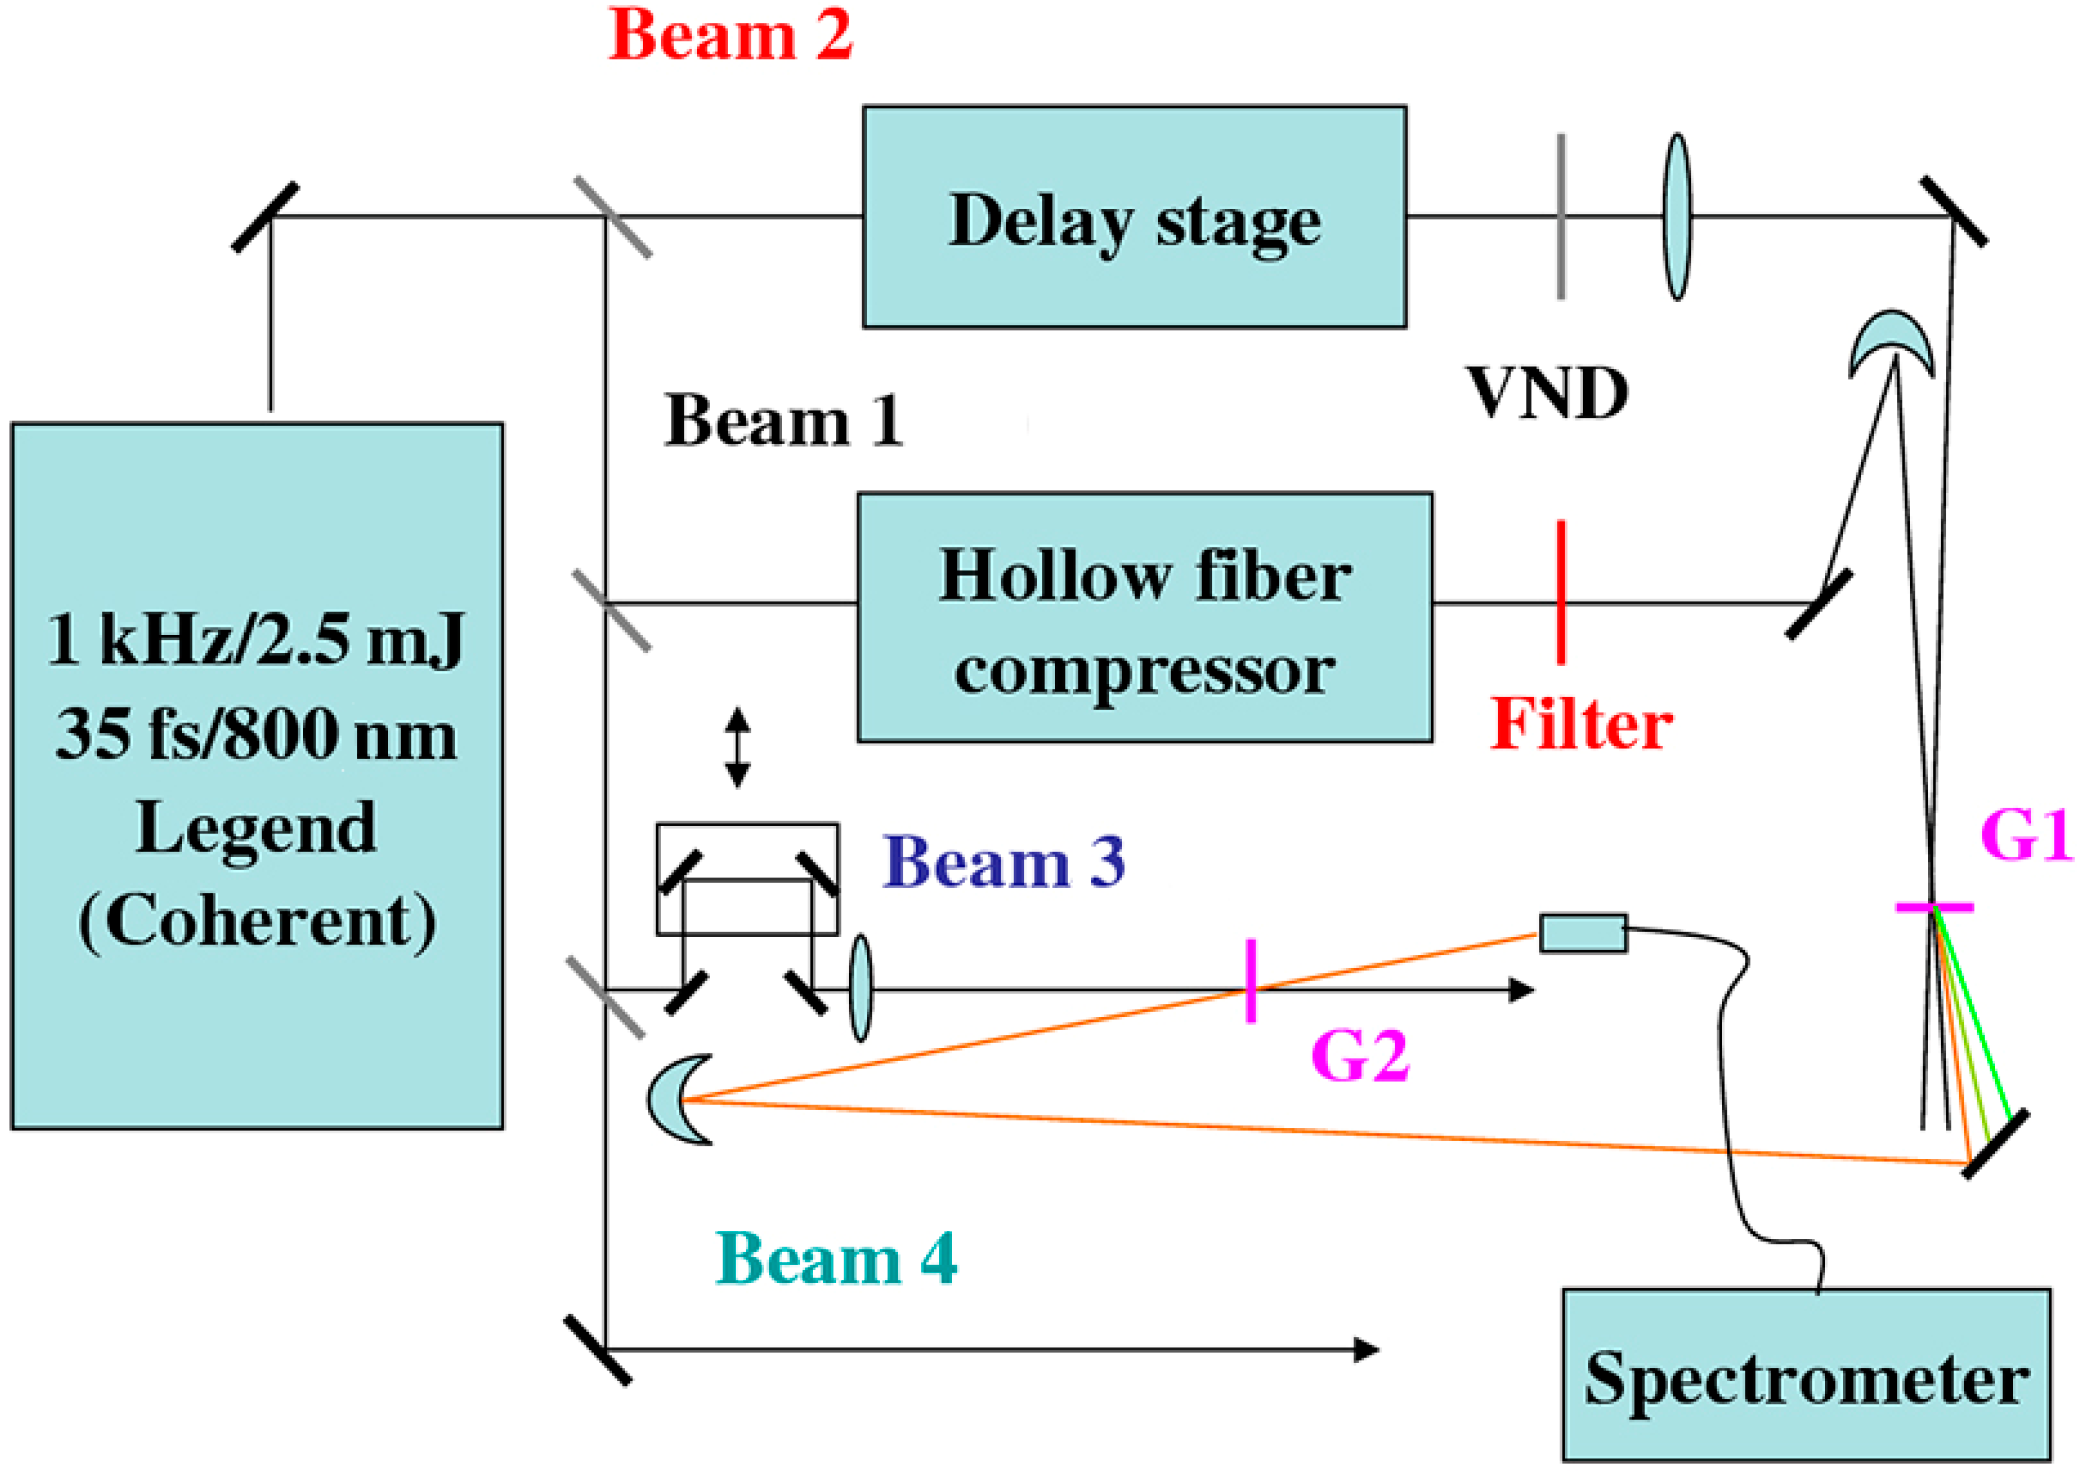
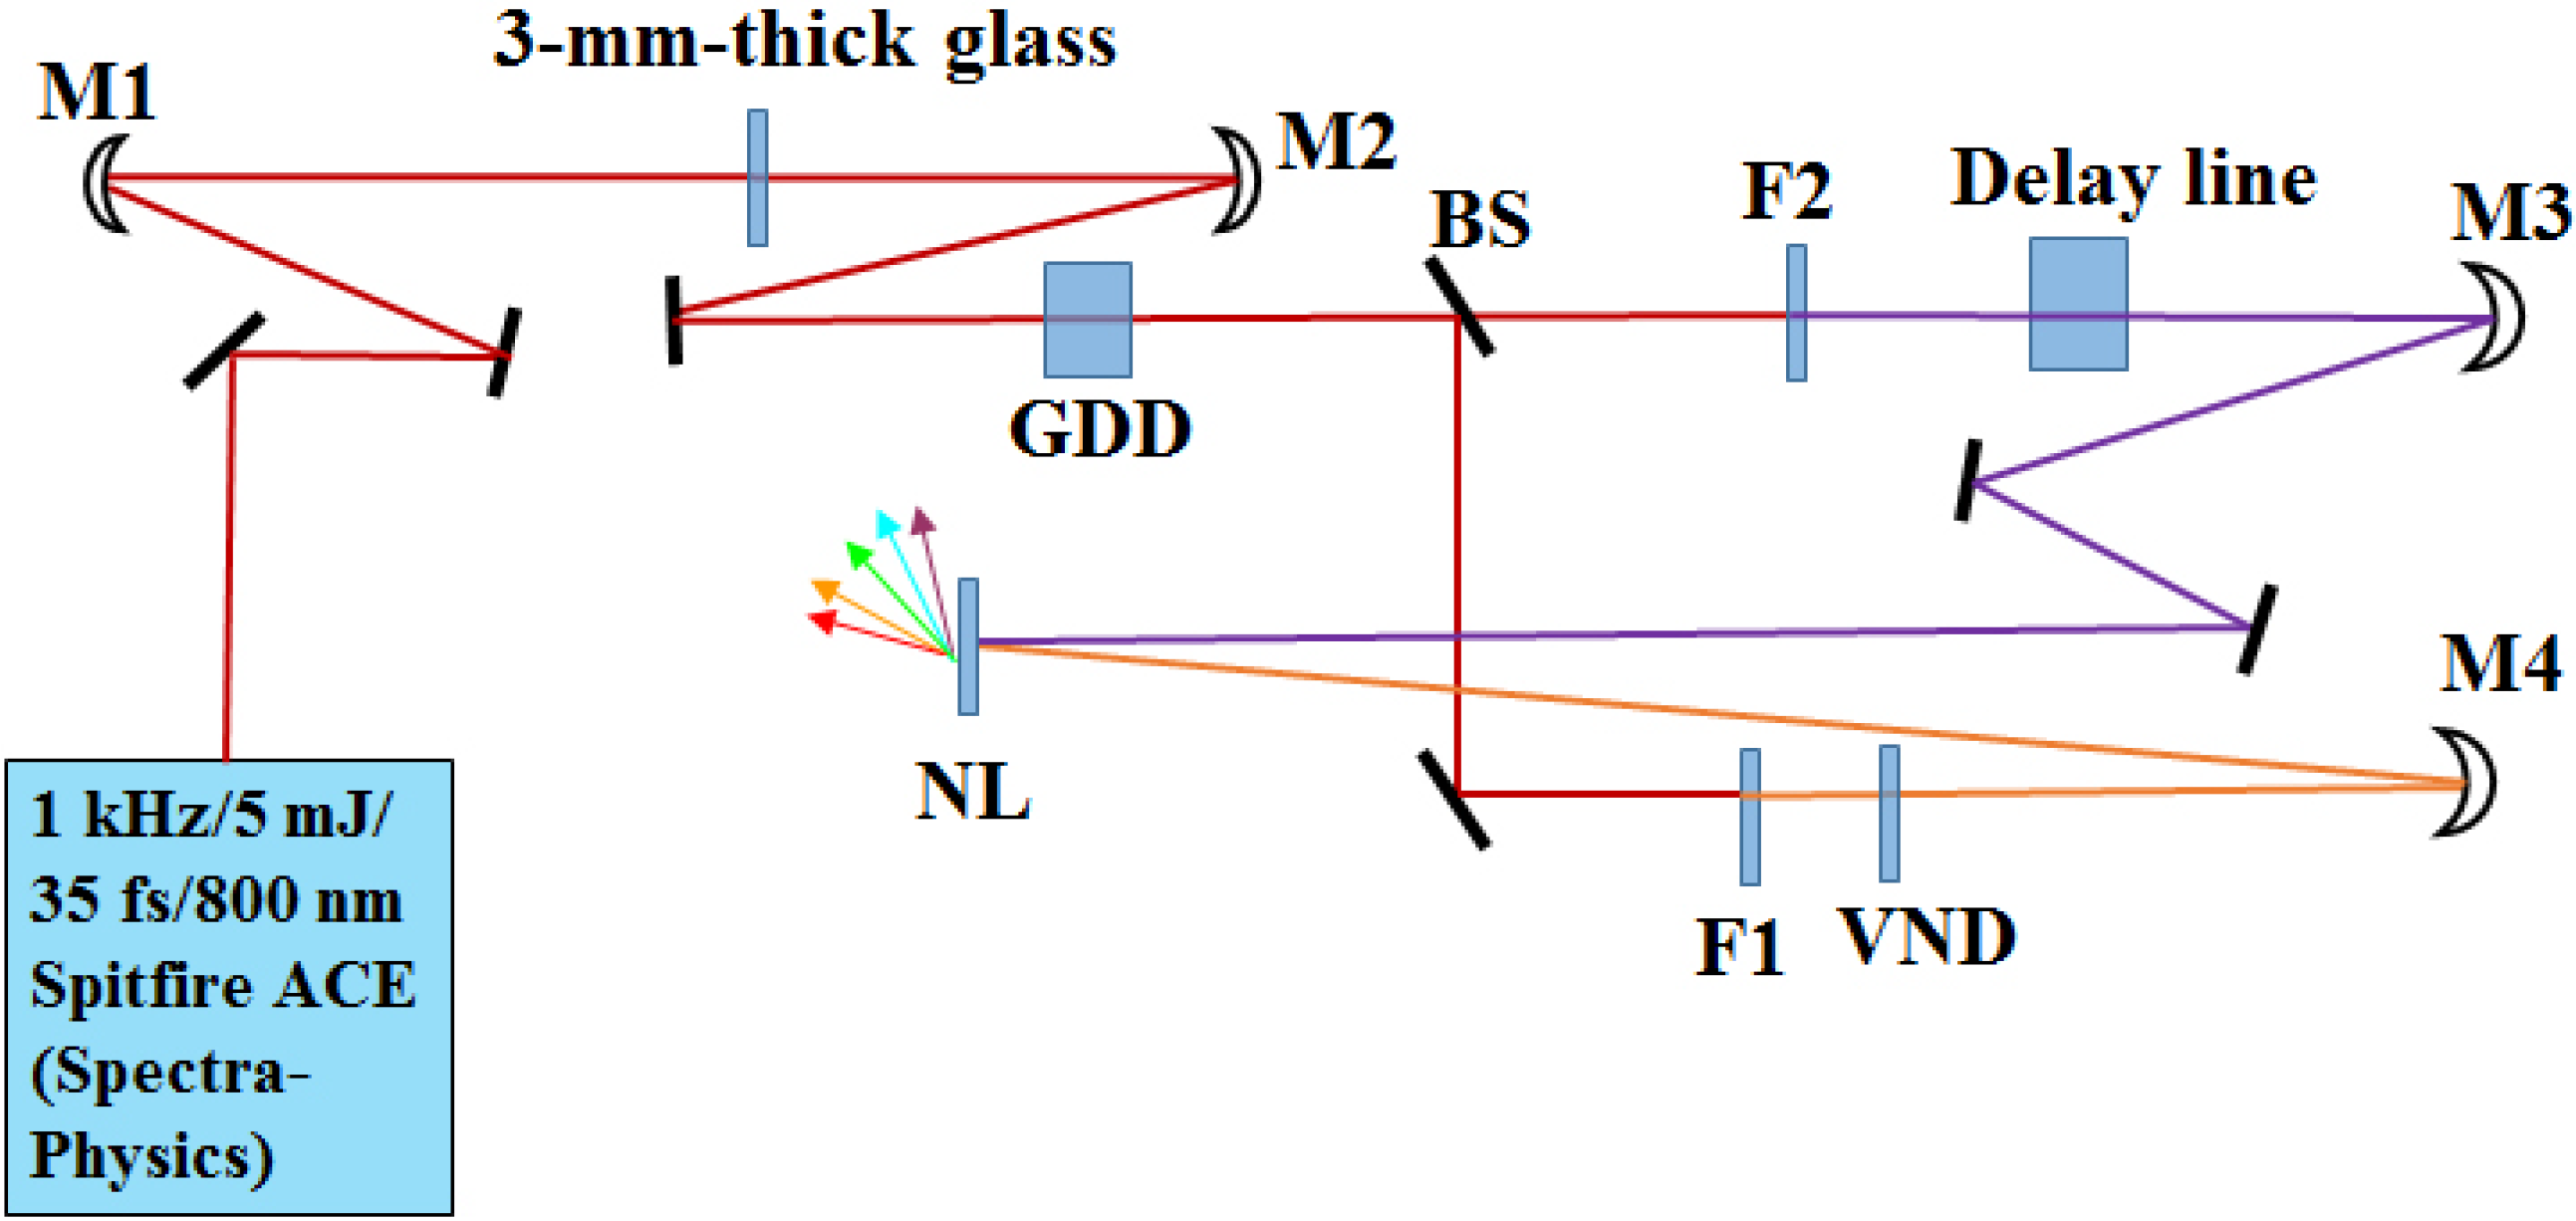
3.1. Experimental Setups

Various experimental setups for multicolored laser pulse generation have been reported in the literature. The main differences between these setups are the methods for preparing the two pump laser beams. Crespo and his coworkers used two femtosecond pulses from a dye-laser amplifier system, with Beam 1 (561 nm, 40 fs) and Beam 2 (618 nm, 80 fs), and a pulse energy of 20 μJ for each beam [54]. Zhi used two OPA systems, pumped with a commercial Ti:sapphire amplifier [61]. The SHG signals of the signal and idler pulses from the two OPAs were used as the pump pulses for the generation of multicolored sidebands. The central wavelength and pulse energy of the two pump beams were 630 nm/1–3 μJ and 584 nm/1–3 μJ. There were also some other differences, including the Ti:sapphire amplifier pulse, and the supercontinuum generated in bulk materials [58].
We have used two experimental setups for multicolored pulse generation. As shown in Figure 3, we used Type-1 experimental setup for most of our work. The pump source was a 1 kHz Ti:sapphire regenerative amplifier laser system (35 fs/2.5 mJ/1 kHz/800 nm, Micra + Legend-USP, Coherent, Santa Clara, CA, USA). The pump laser was split into four beams for different uses. One beam (Beam 1), with energy of 300 μJ, was focused into a krypton-gas-filled hollow-core fiber with inner and outer diameters of 250 μm and 3 mm, and a length of 60 cm. The spectrum of Beam 1 broadened to a range extending from 600 to 950 nm after transmission through the hollow-core fiber, while the pulse energy decreased to about 190 μJ, due to coupling and propagation loss. A pair of chirped mirrors and two glass wedges were applied to compensate for the chirp of Beam 1 with broadband spectrum. A nearly transform-limited pulse, with a pulse duration of ~10 fs, was obtained by changing the bounce times on the chirped mirrors and the insertion of the glass wedges. Negatively and positively chirped pulses also can be obtained for different experiments. Beam 1 was then spectrally filtered with band-pass filters (BPF) short-wavelength-pass filters (SPF), or long-wavelength-pass filters (LPF) in different experiments. A concave mirror with a focal length of 600 cm was used to focus Beam 1 into the nonlinear medium (G1). Beam 2 was focused into the nonlinear medium by a lens with a focal length of 1 m. The fourth beam (Beam 4) was used to characterize the generated multicolored pulses with the cross-correlation frequency-resolved optical gating (XFROG) technique [74] in a 10 μm-thick BBO crystal.
Figure 3. Type-1 experimental setup. VND: variable neutral-density filter. G1: nonlinear medium for multicolored sidebands generation. G2: nonlinear medium for pulse measurement with an X-FROG system [74].
Applsci 04 00444 g003
Figure 4 shows the schematic of Type-2 setup, which was used for the generation of low-threshold multicolored sidebands and 2-D multicolored arrays in a diamond plate. Another Ti:sapphire laser system (35 fs/2.5 mJ/1 kHz/800 nm, Spitfire ACE, Spectra-Physics) was used as the pump source, and a beam with pulse energy of 150 μJ was used in the experiment. A BK7 glass plate with a thickness of 3 mm was used to spectrally broaden the laser pulse using a self-phase modulation (SPM) process. After that, a pair of chirped mirrors (GDD) was used to compensate for the dispersion induced by the BK7 glass and other components. Then, the laser beam was split into two parts, Beam 1 and Beam 2, with a beamsplitter (BS). Beam 1 first propagated through a short-pass filter (F1, cut-off wavelength of 800 nm), was then focused into the nonlinear medium by a concave mirror (M4) with a focal length of 500 mm. Beam 2 was spectrally filtered with a long-pass filter (F2, cut-on wavelength of 800 nm), and then focused into the nonlinear medium by another concave mirror (M3) with a focal length of 500 mm. The beam diameters of both Beam 1 and Beam 2 were ~300 μm on the 1 mm thick diamond plate. As no hollow fiber or gas chamber is used, the Type-2 experimental setup occupied half the space of a Type-1 setup.
Figure 4. Type-2 experimental setup. Focal lengths of concave mirrors, M1, M3, and M4 are 500 mm, while that of M2 is 250 mm. GDD: chirped mirrors. F1: longpass filter with a cut-off wavelength of 800 nm. F2: short-pass filter with a cut-off wavelength of 800 nm. BS: beamsplitter. VND: variable neutral-density filter. NL: nonlinear medium for multicolor pulse generation.
Applsci 04 00444 g004
In the experiment, the diameters of the incident beams at the position of the nonlinear media were measured using a CCD camera (BeamStar FX33, Ophir Optronics: Jerusalem, Israel). The pulses were characterized using the XFROG or SHG-FROG technique and retrieved with a commercial software package (FROG 3.0, Femtosoft Technologies: Chennai, India). The spectra of the pulses were measured with a commercial spectrometer (USB4000, Ocean Optics: Dunedin, FL, USA). To avoid optical damage, the intensities of the two pump beams on the surface of nonlinear media surface were set at least one order of magnitude lower than the damage threshold for all the media used. Neither damage nor supercontinuum generation were observed in any experiment.

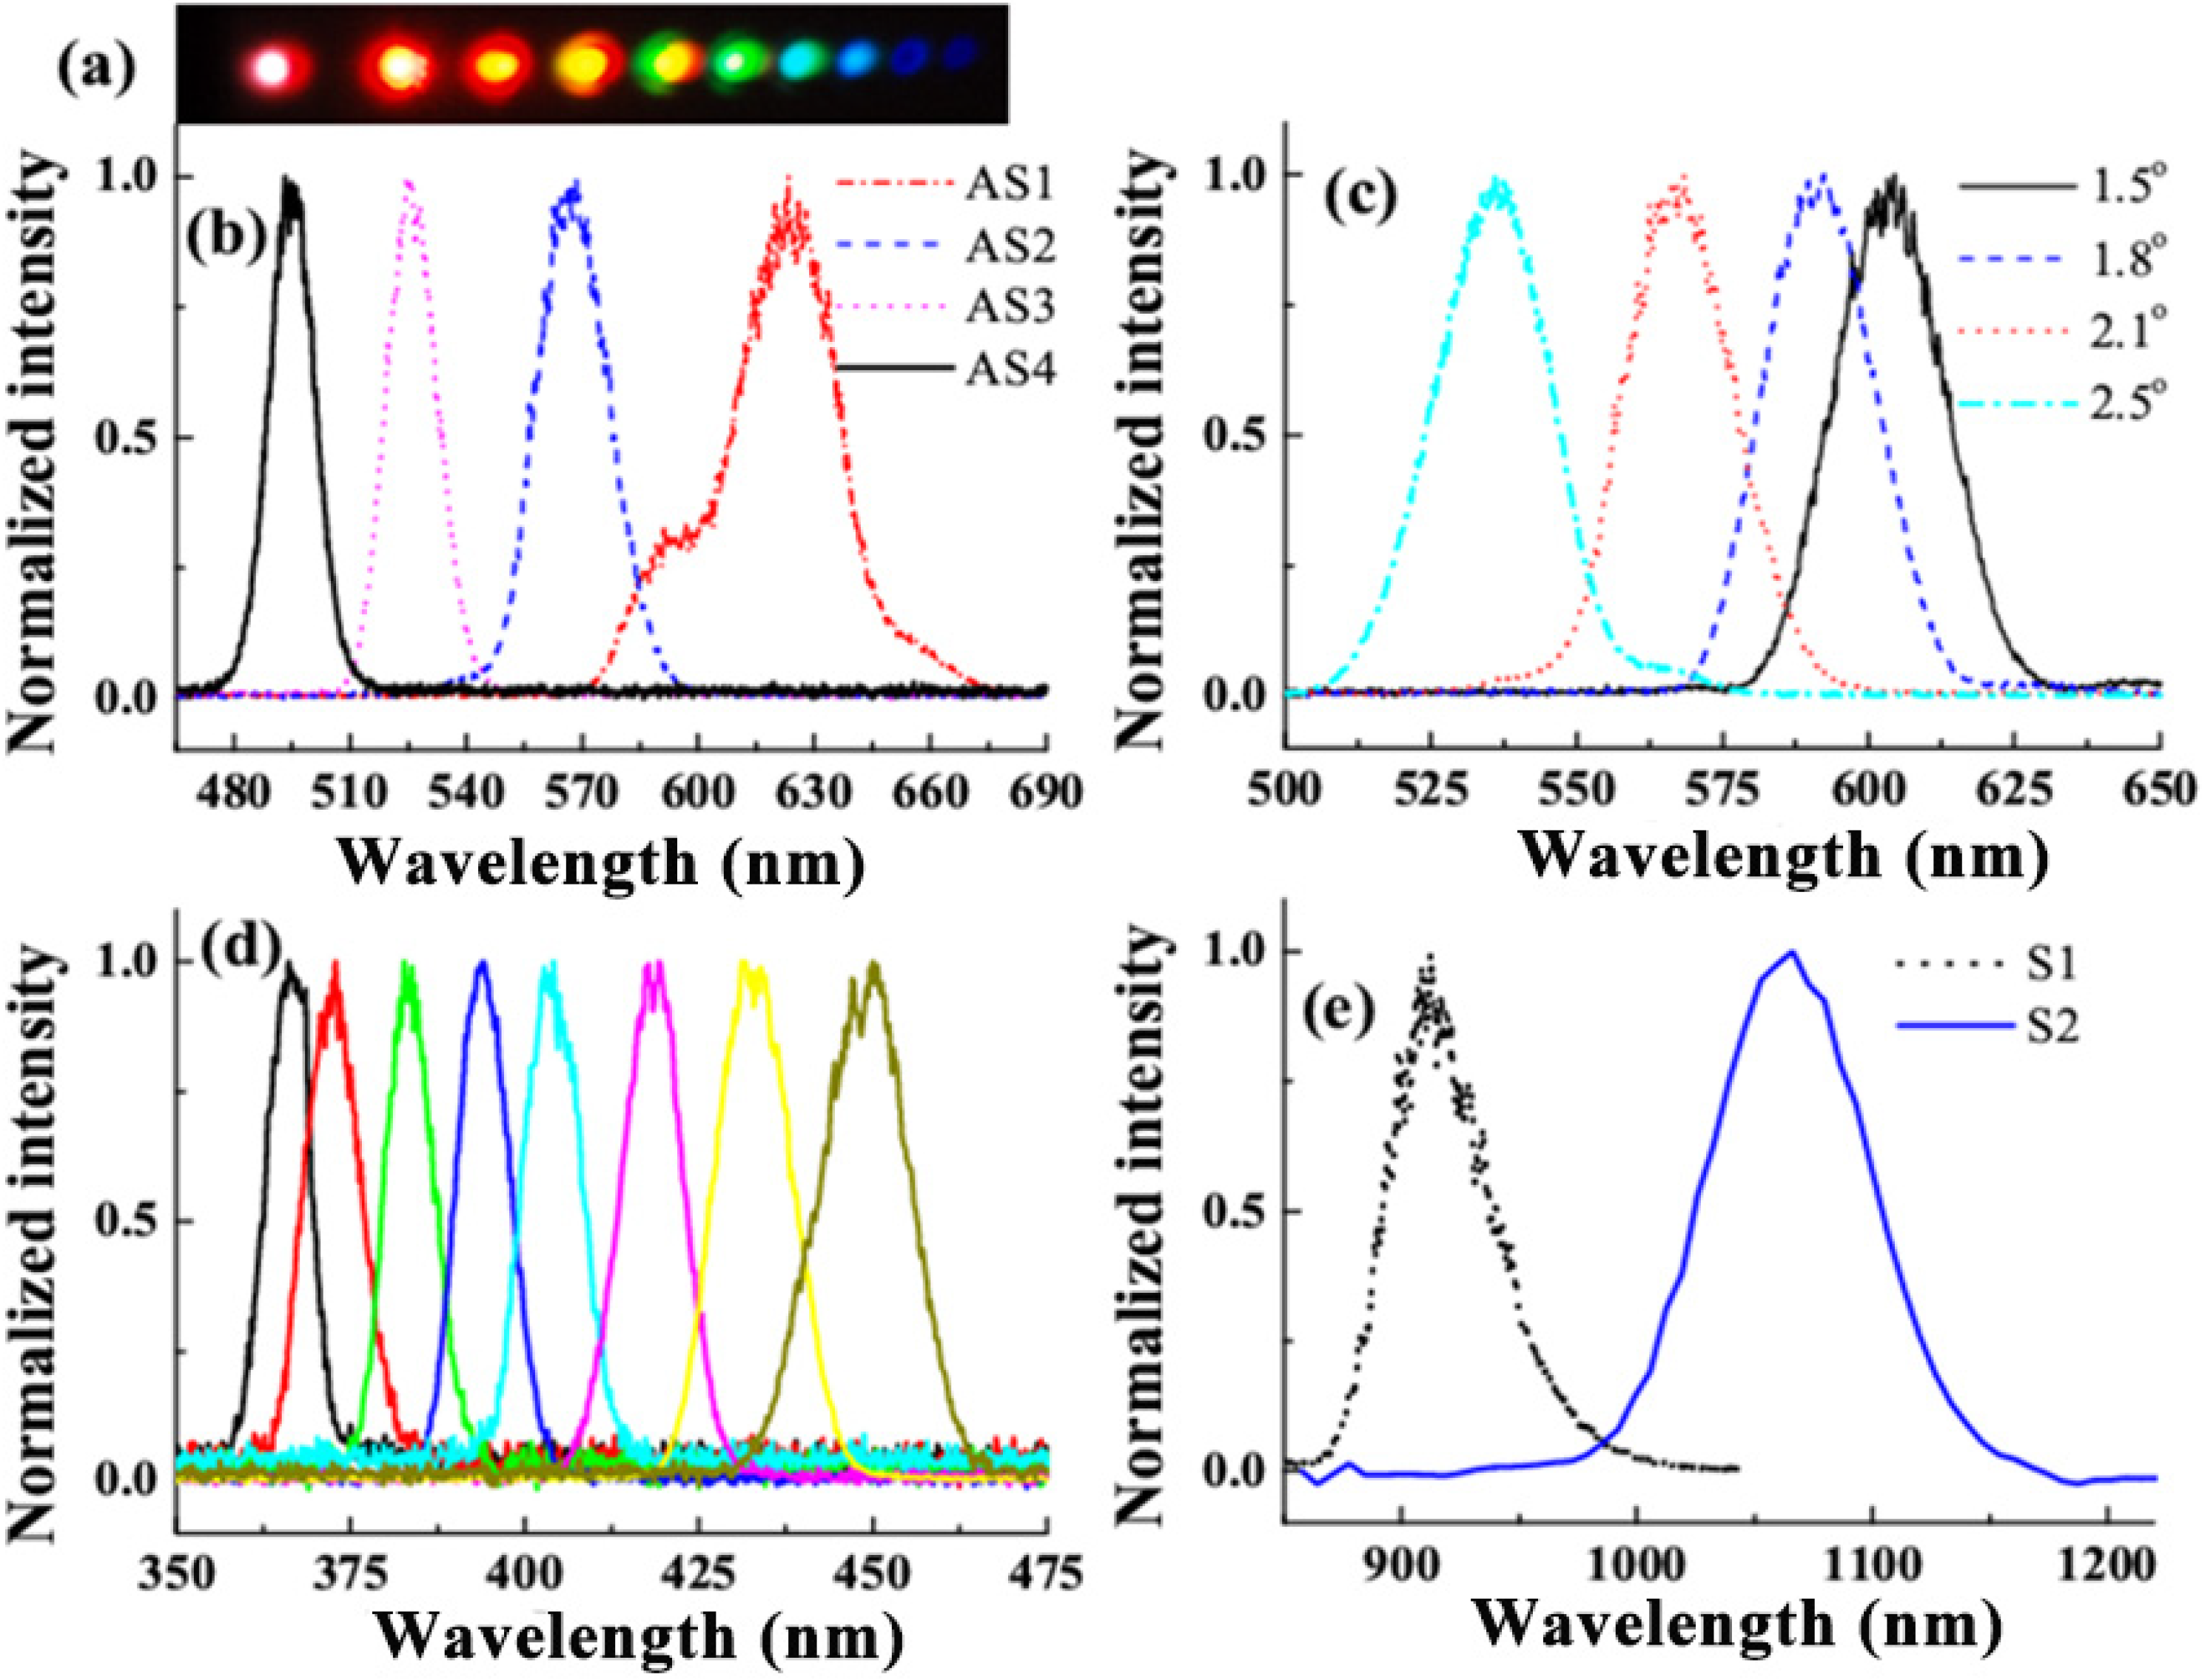
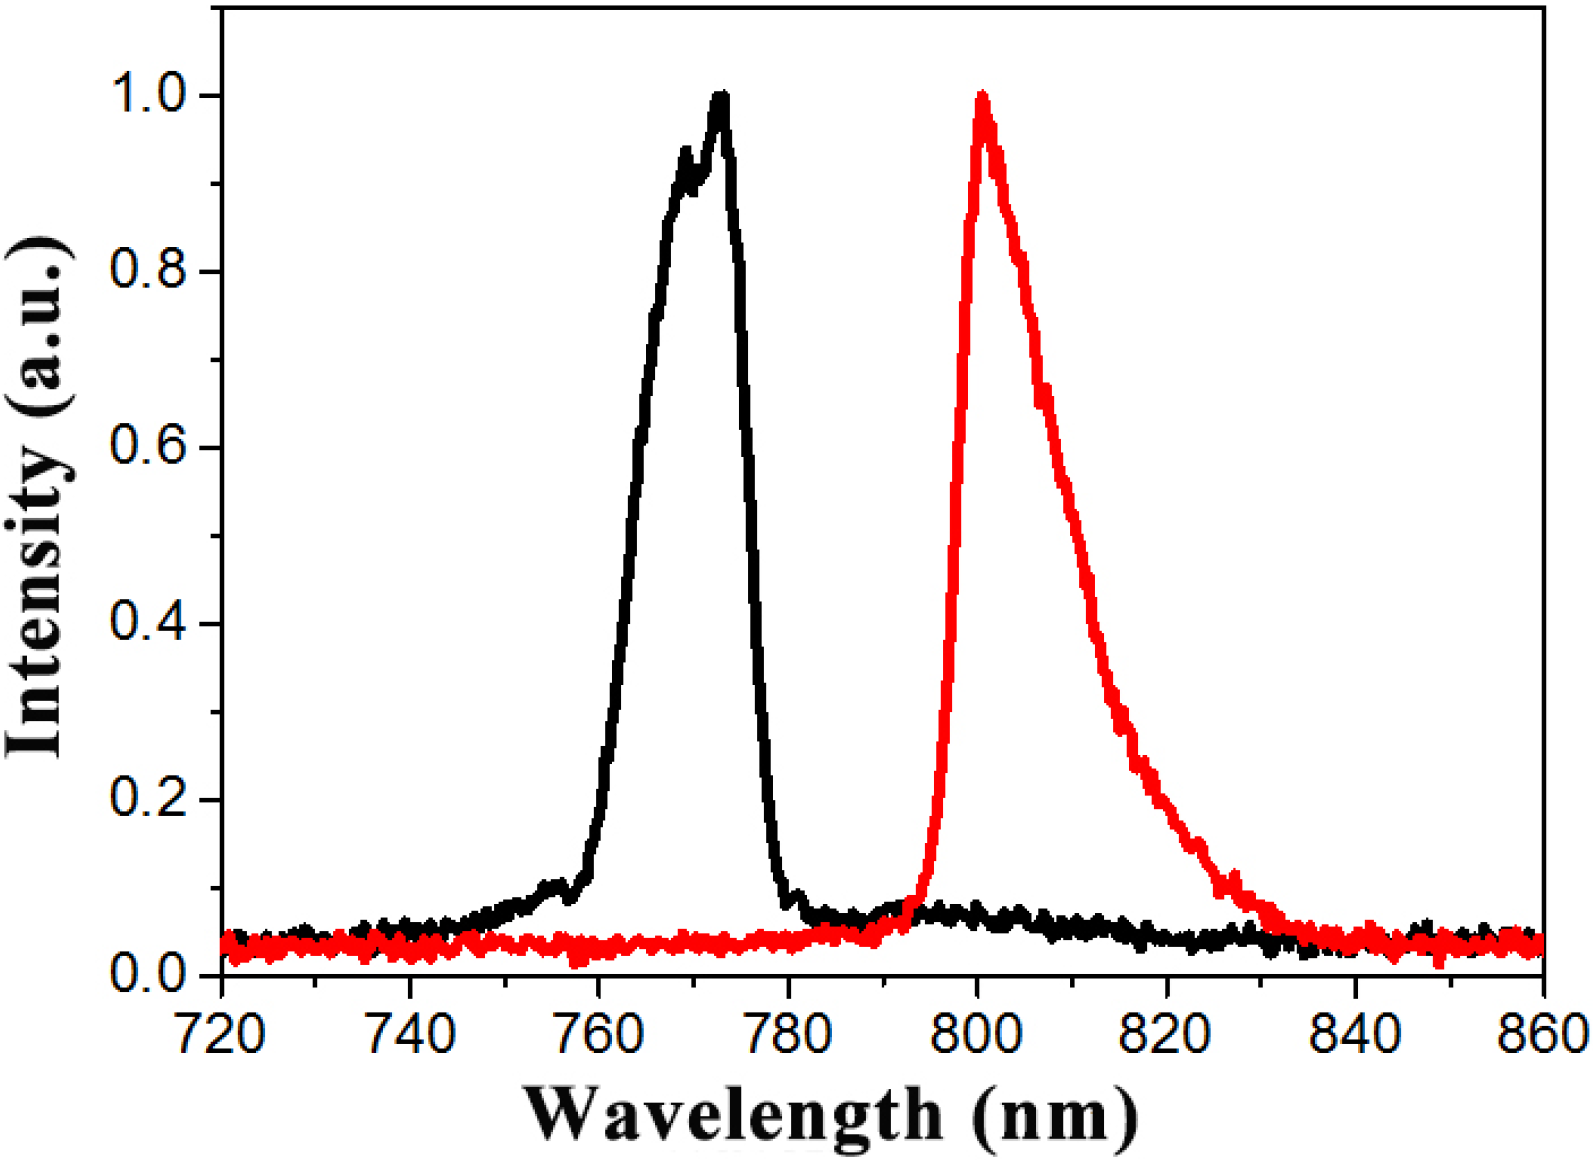
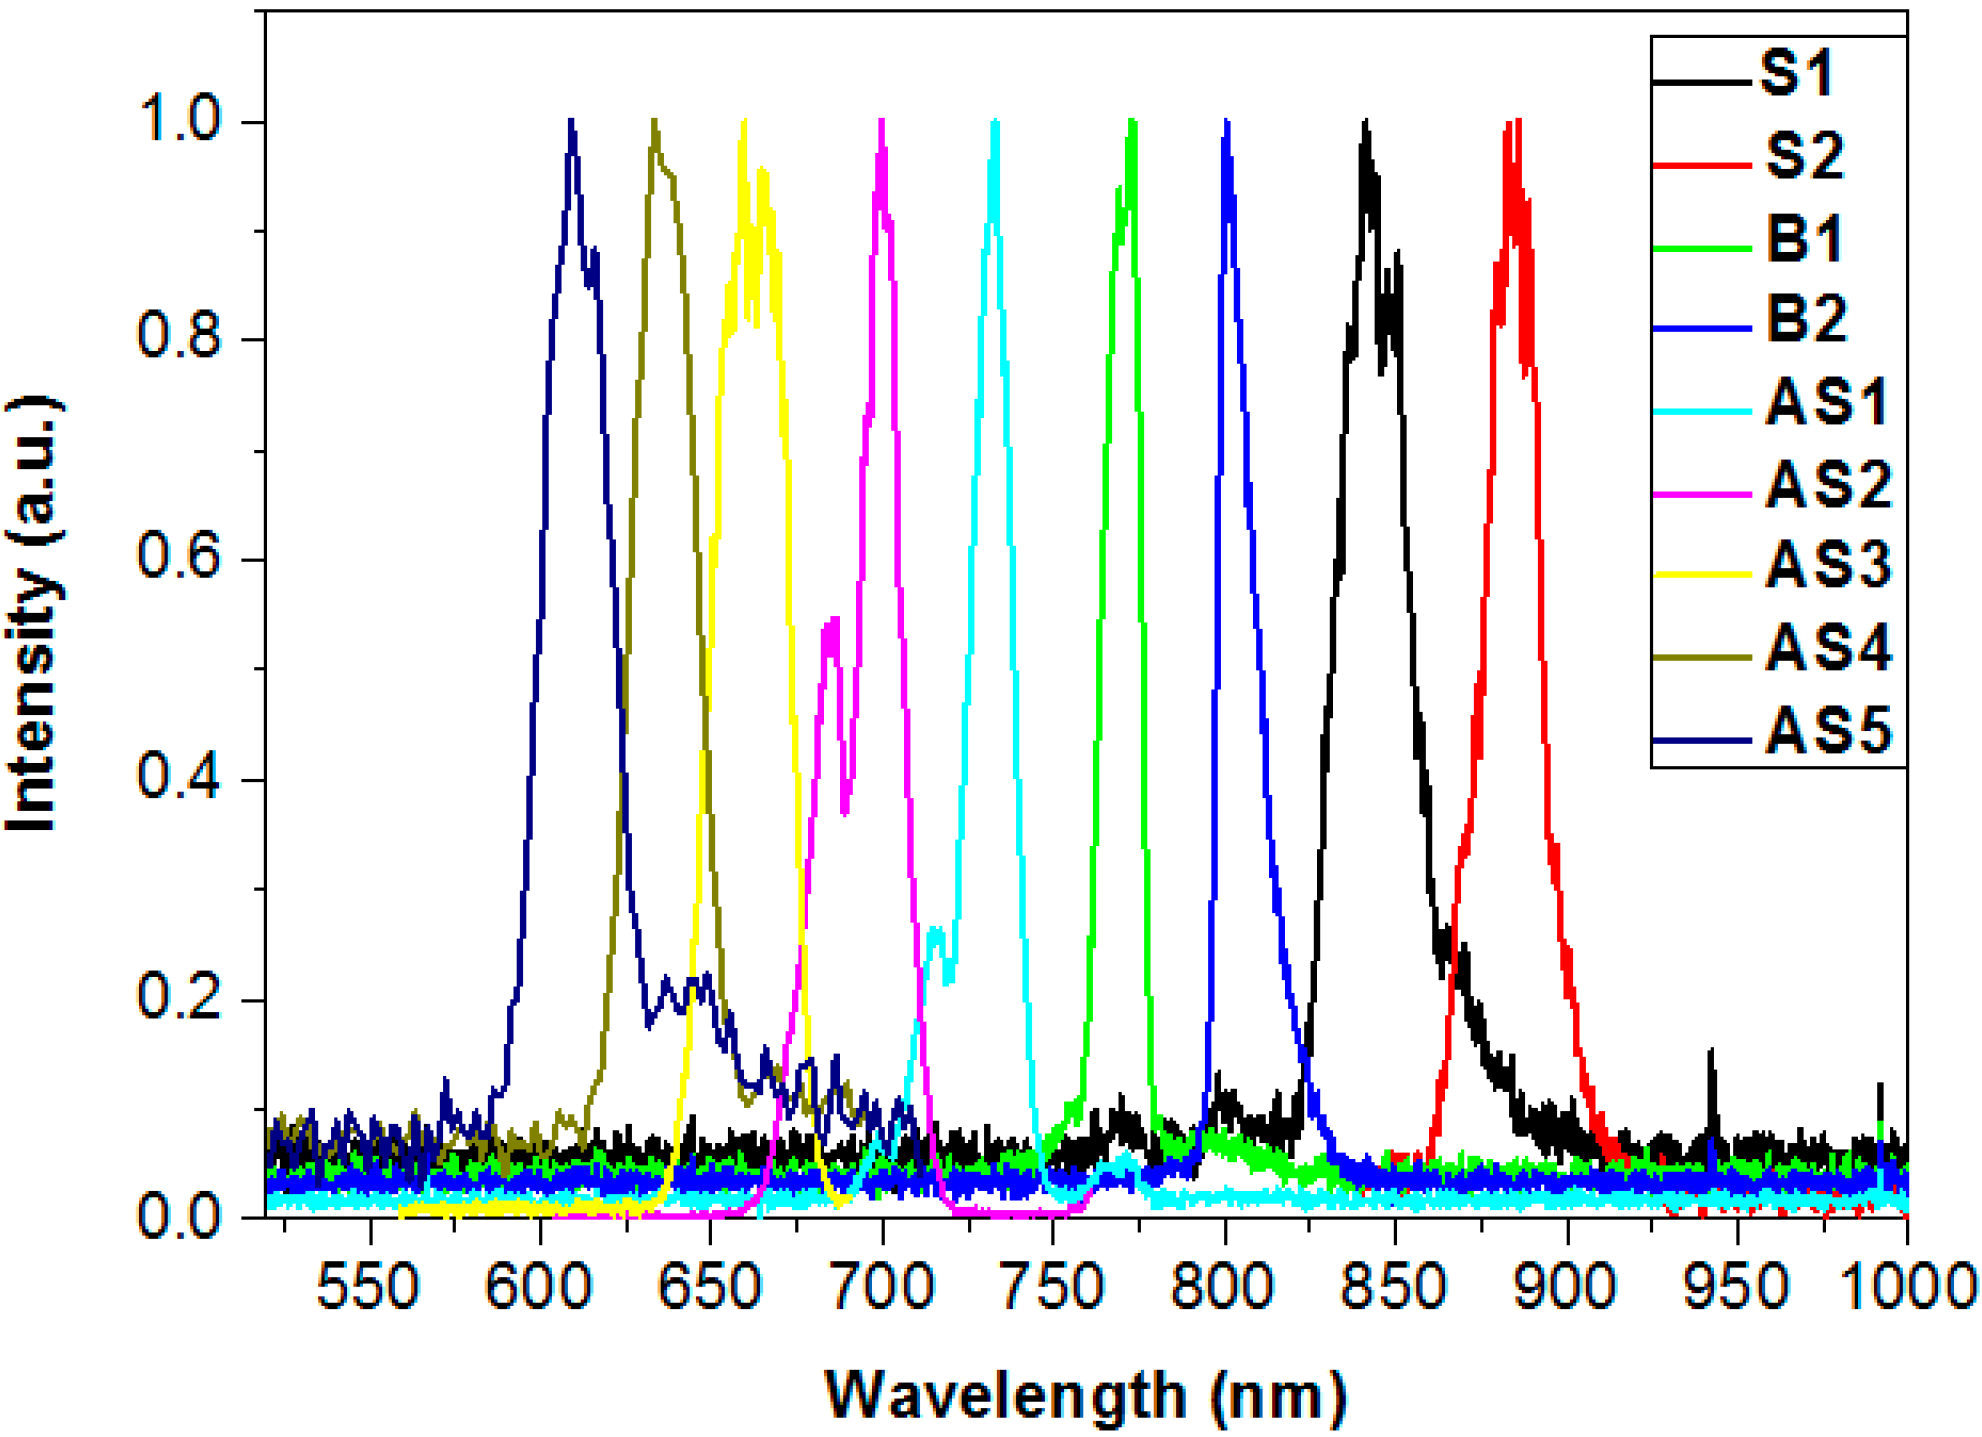
3.2. Spectra and Wavelength Tuning of Multicolored Sidebands

3.2.1. Tuning the Wavelength of Sidebands by Changing Cross-Angle

The Type-1 experimental setup was applied, and a short-pass filter with cut-off wavelength of 800 nm was used to eliminate the red components of Beam 1. As a result, the spectra of the two pump pulses were as in Figure 5. The input powers of Beam 1 and Beam 2 were 11 and 19 mW, respectively.
Figure 5. The spectra of the two pump beams, Beam 1 (black curve) and Beam 2 (blue curve) [75].
Applsci 04 00444 g005
Figure 6. (a) Photograph of the first ten anti-Stokes sidebands on a white paper set 1 m far from the nonlinear medium; (b) The spectra of AS1-AS4 with cross-angle of 2.1° for two pump beams; (c) The spectra of AS2 with different cross-angles; Spectra of (d) AS8-AS15 and (e) two Stokes signals S1 and S2 with cross-angle of two pump beams set as 1.5° [59].
Applsci 04 00444 g006
Multicolored sidebands were obtained when the input beams overlapped well both spatially and temporally, as shown in Figure 6a. These sidebands were in the same plane as the pump beams, but separated with different exit angles. Figure 6b depicts the spectra of the lowest four-order red-shifted sidebands, AS1-AS4, when the pump beam cross-angle was 2.1°. The spectral width decreased with an increase in the order number of the sidebands, as was predicted by the calculations, shown in Figure 2e. Figure 6c shows the central wavelength of AS2 with different pump beam cross-angles. The central wavelength of AS2 shifted from 500 nm to 625 nm, and the cross-angle increased from 1.5° to 2.5°. This tuning range successfully surpassed the wavelength gap between AS1 and AS3, as shown in Figure 6b. Therefore, it was possible to tune the wavelength continuously by simple angle tuning, without a gap between the neighboring order sidebands. The spectra of AS8-AS15 are shown in Figure 6d. The spectra of S1 and S2 are shown in Figure 6e. The whole wavelength range obtained by angle tuning of all sidebands covered the near UV-visible-near IR range from 360 nm to 1.2 μm, corresponding to more than 1.8 octaves. These broadband spectra and large tunability are very attractive and useful from the viewpoints of application and creating simple tuning mechanisms.

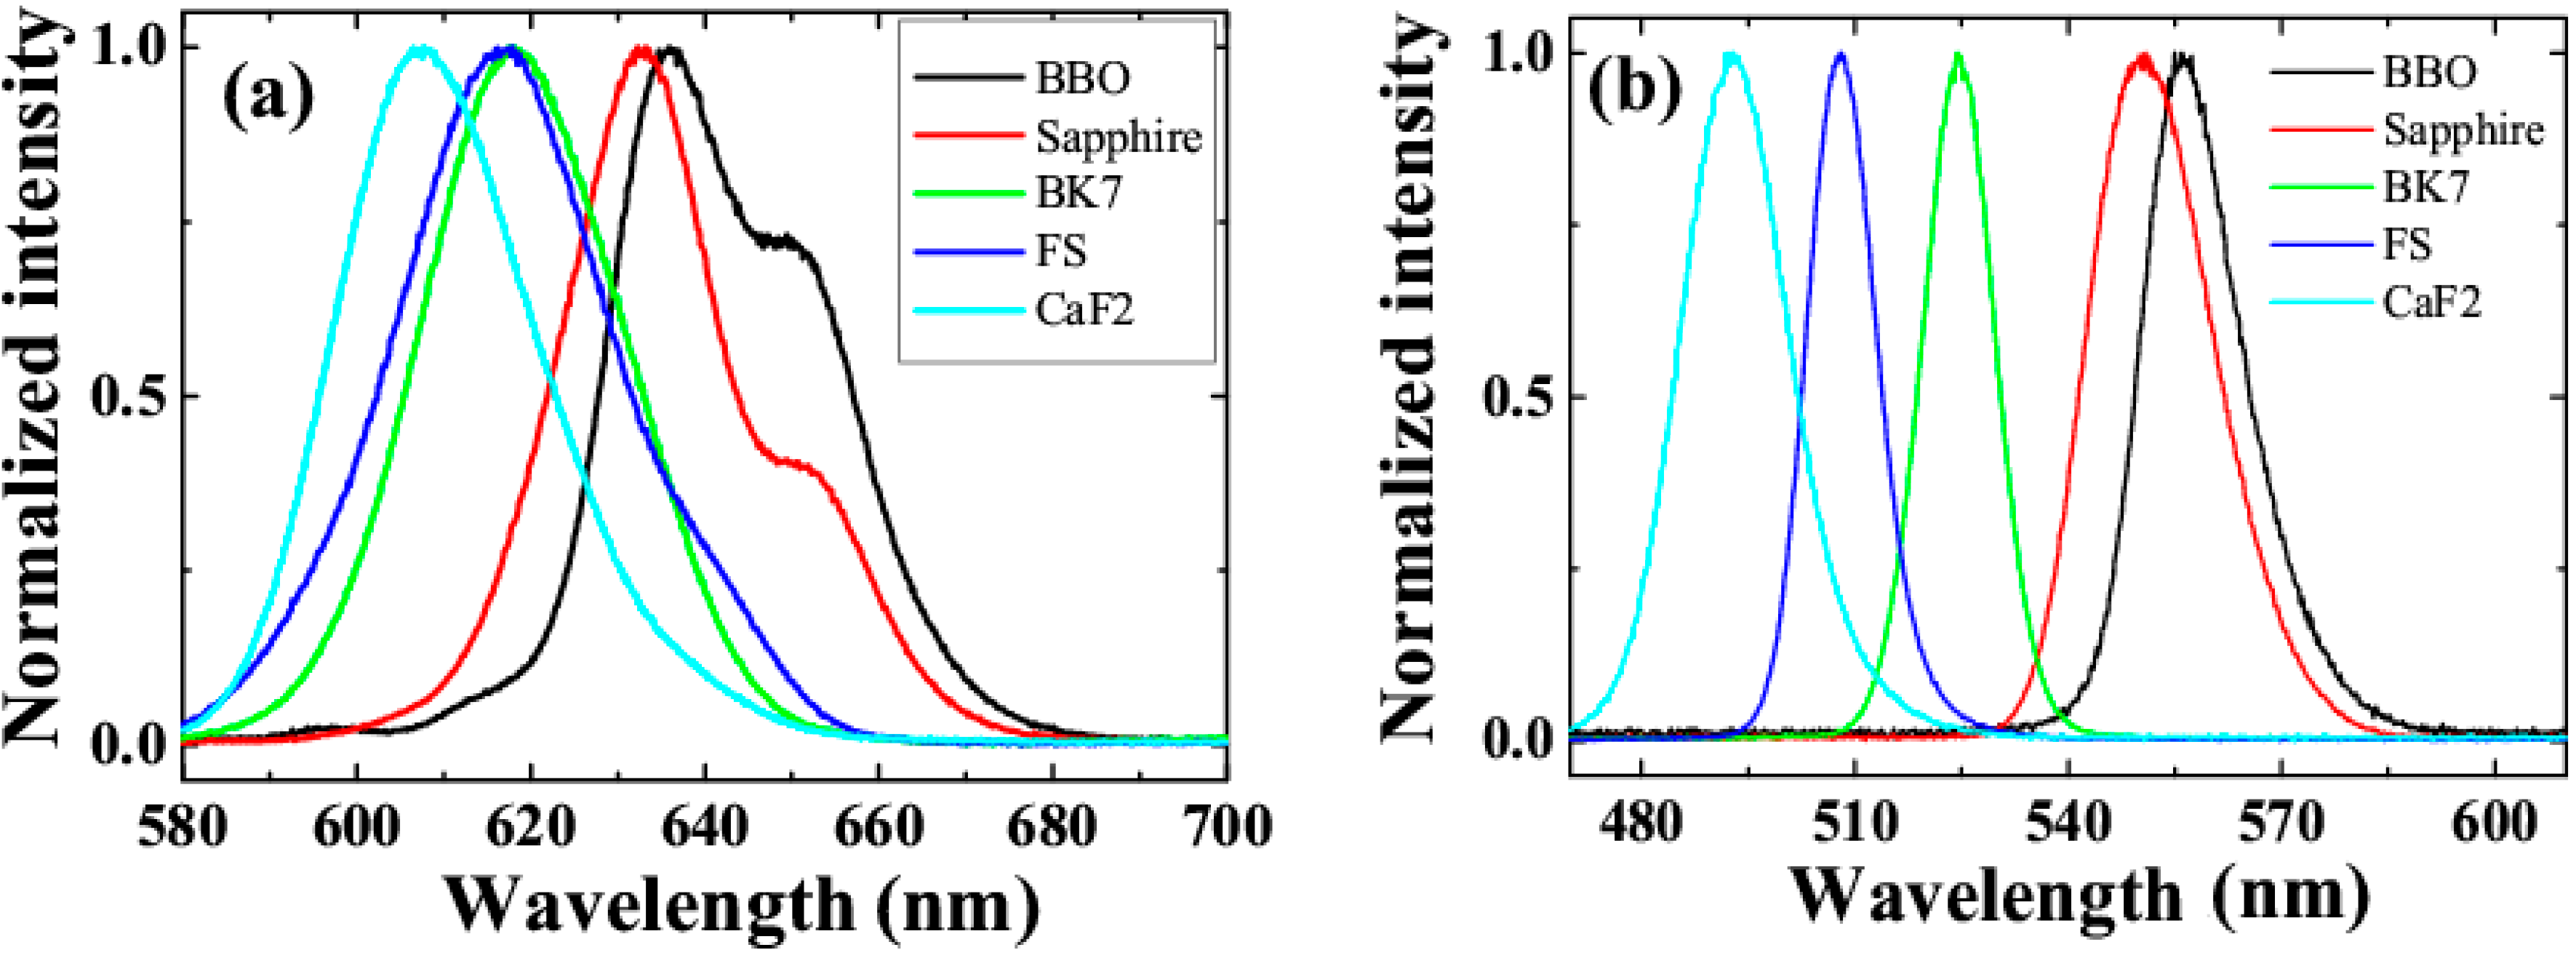
3.2.2. Tuning the Wavelength of Sidebands by Changing Nonlinear Media

The phase-matching condition for CFWM is kSm = kS(m–1) + k(−m)2k(−m)1 ≈ (m + 1)k(−1)2 − mk(−1)1, ωSm ≈ (m + 1)ω2(−1) − mω1(−1), as discussed in Section 2. The wave vectors k can be written as k = n × k0, where n is the linear refractive index of the nonlinear medium and k0 is the wave vector in vacuum. This means that the refractive index (dispersion curve) of the medium will also influence the phase-matching conditions. The refractive index (dispersion curve) can be adjusted by replacing the medium with different optical properties. Figure 7 shows the spectra of AS1 and AS3 for nonlinear media (CaF2 plate, fused silica plate, BK7 glass plate, sapphire plate, and BBO crystal) with a fixed pump beam cross-angle of 1.8°. By changing the media, the central wavelength of AS1 could be tuned from 640 nm to 610 nm, while the central wavelength of AS3 was adjusted correspondingly from 490 nm to 560 nm. The spectrum of AS3 in the BBO crystal overlapped with the spectrum of AS1 in the CaF2 crystal, which means that spectral gaps between neighboring sidebands can be bridged simply by replacing the nonlinear medium.
Figure 7. Spectra of (a) AS1 and (b) AS3 of five different materials with cross-angle of 1.8° [60].
Applsci 04 00444 g007

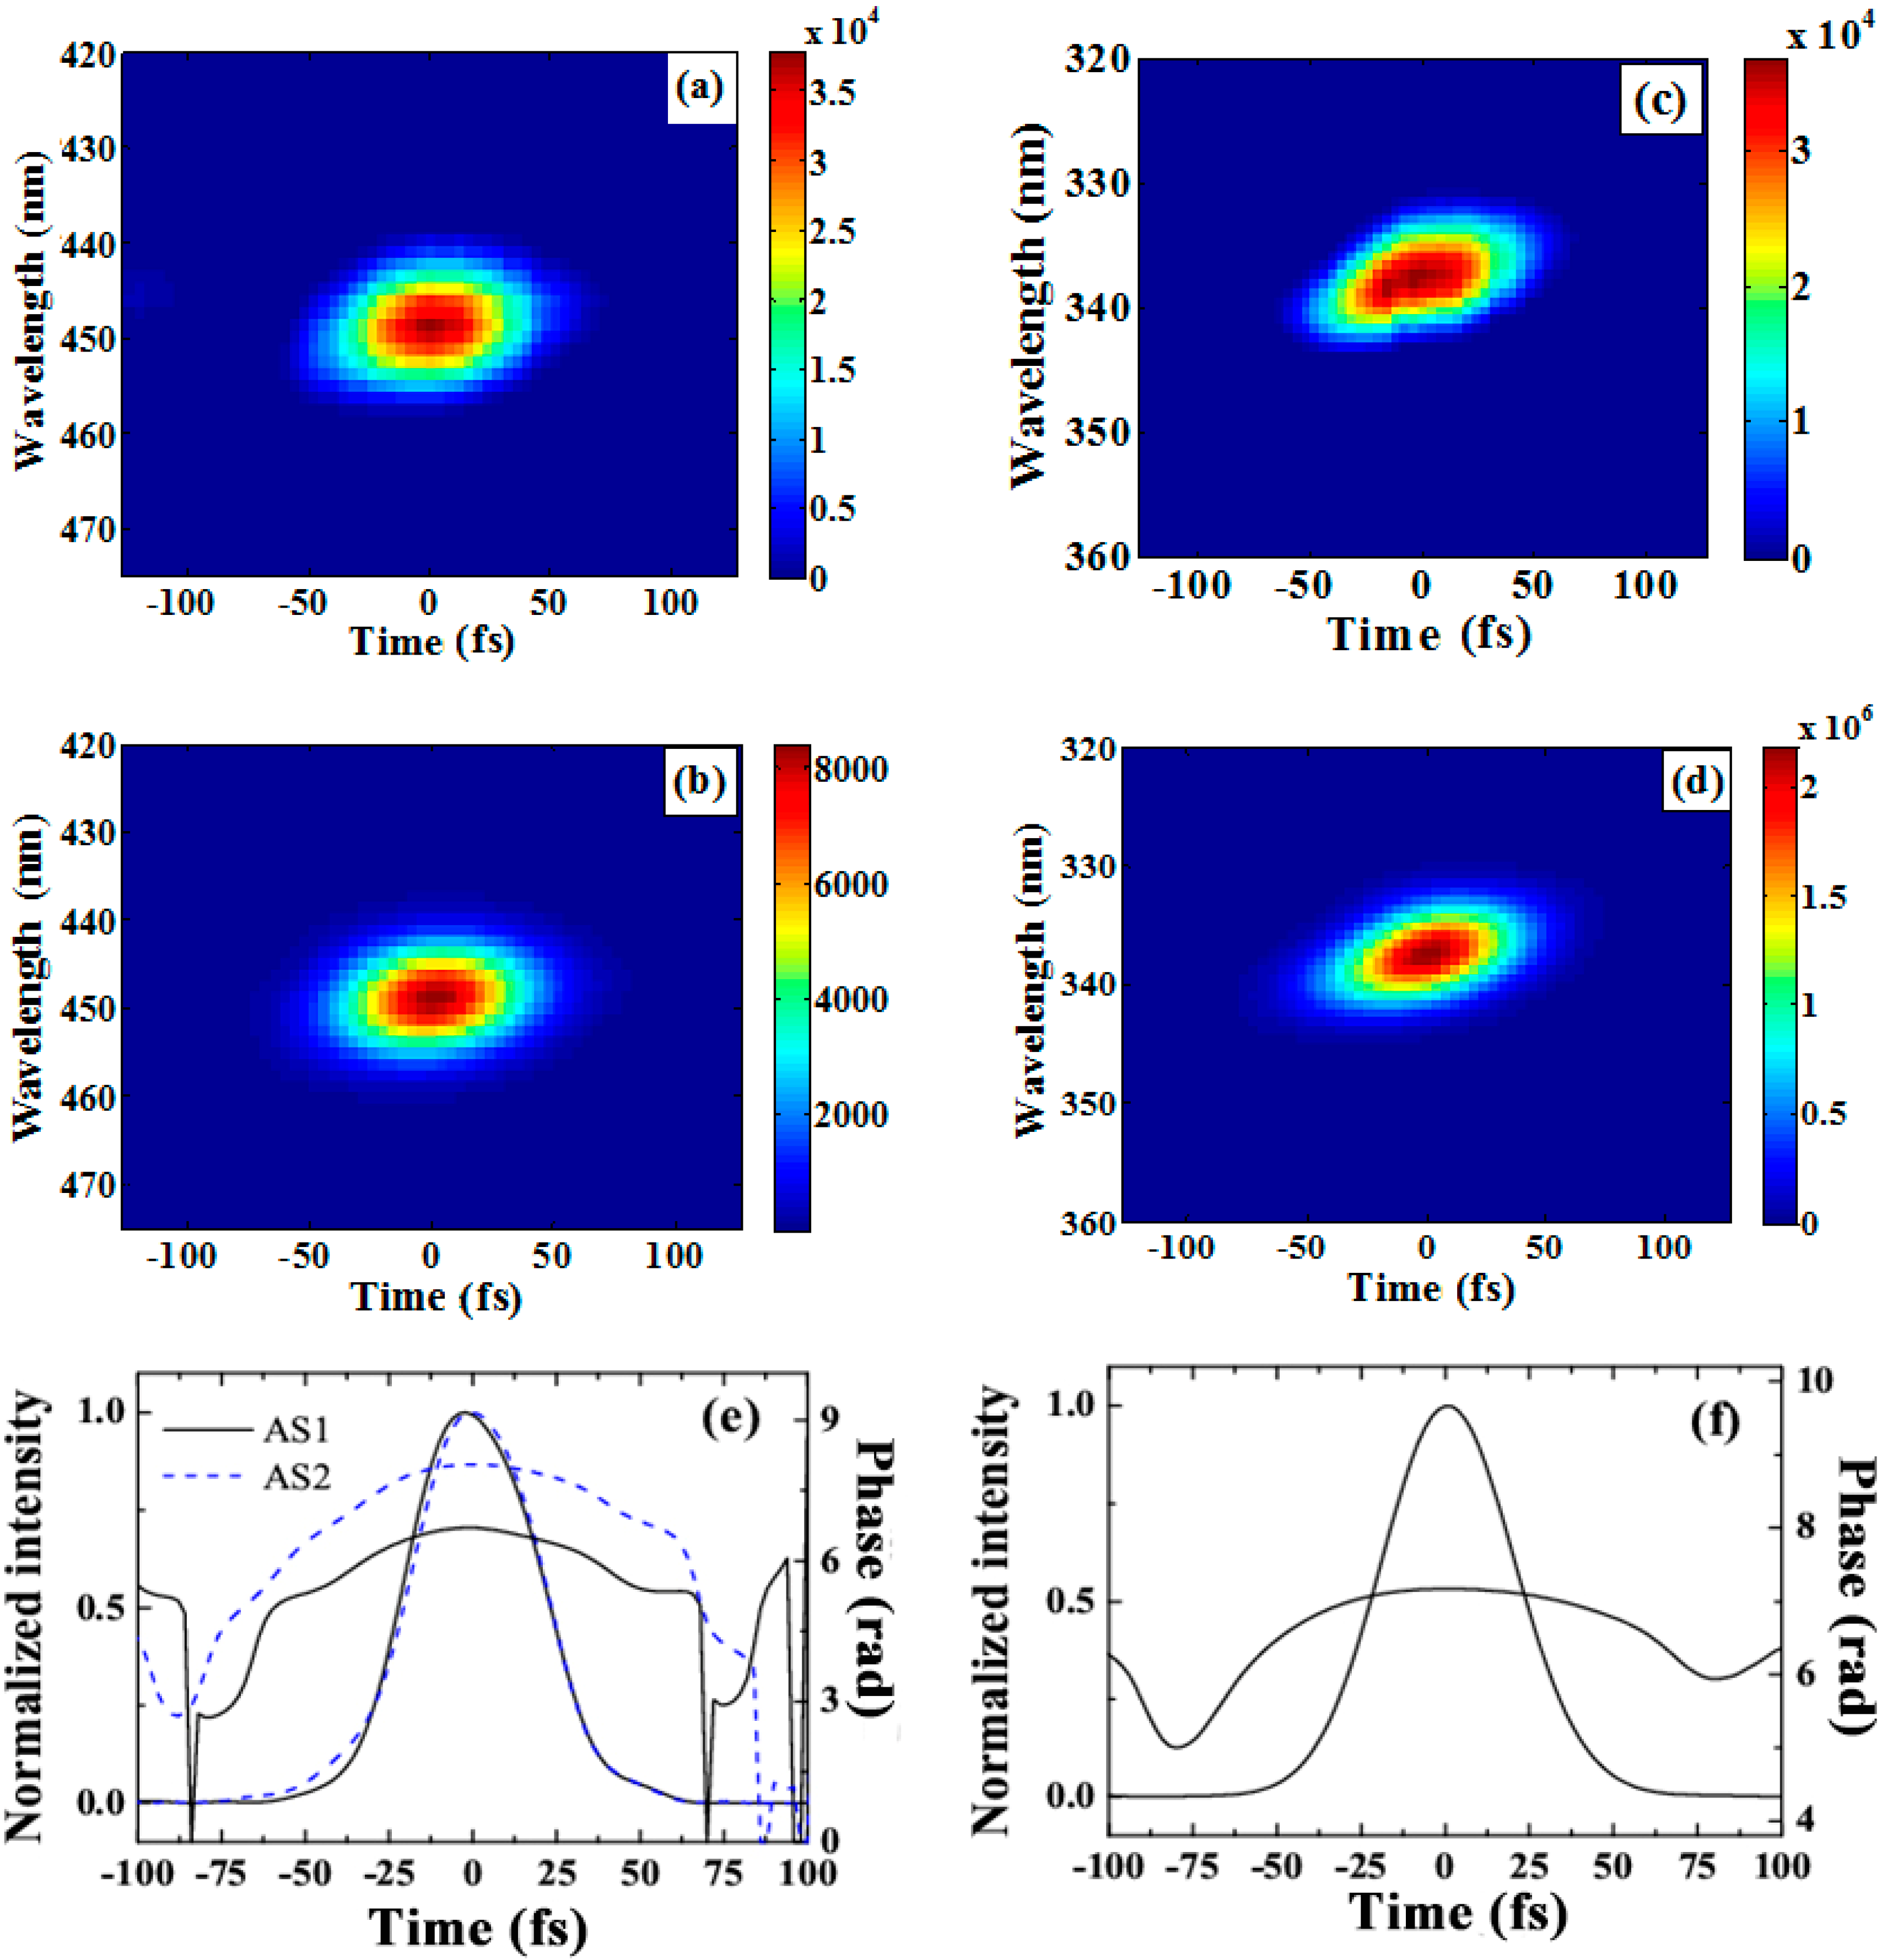
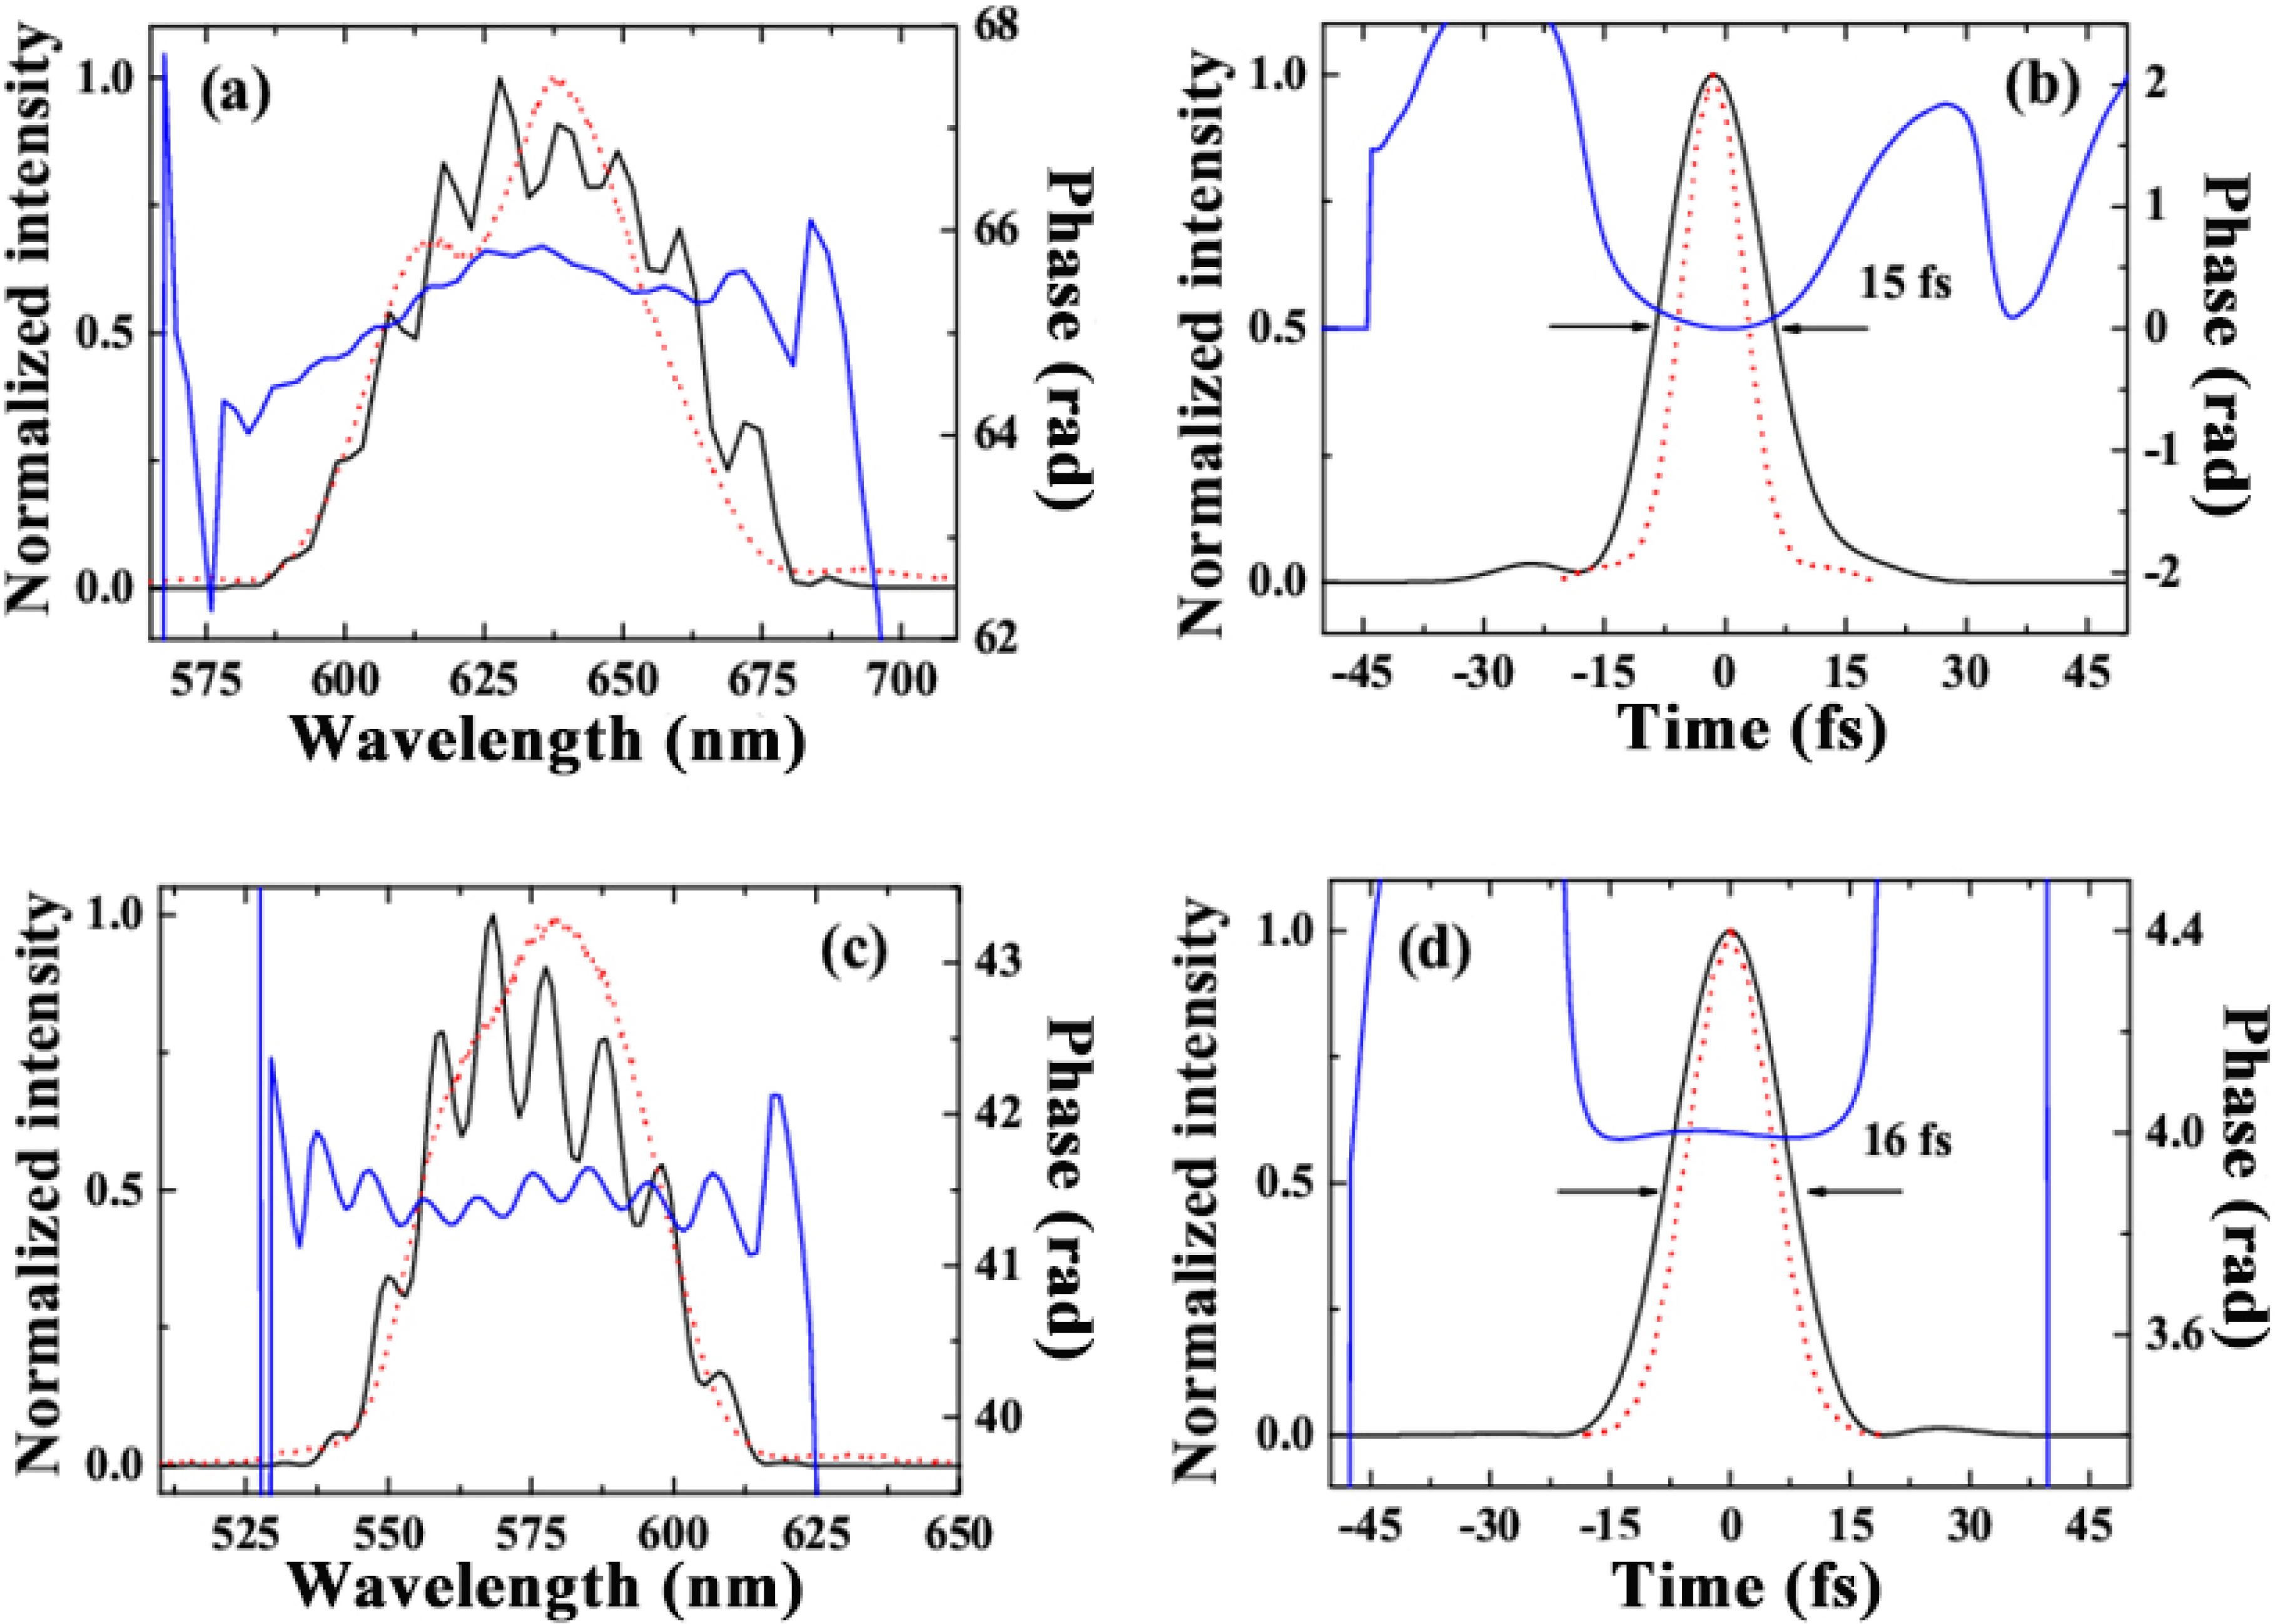
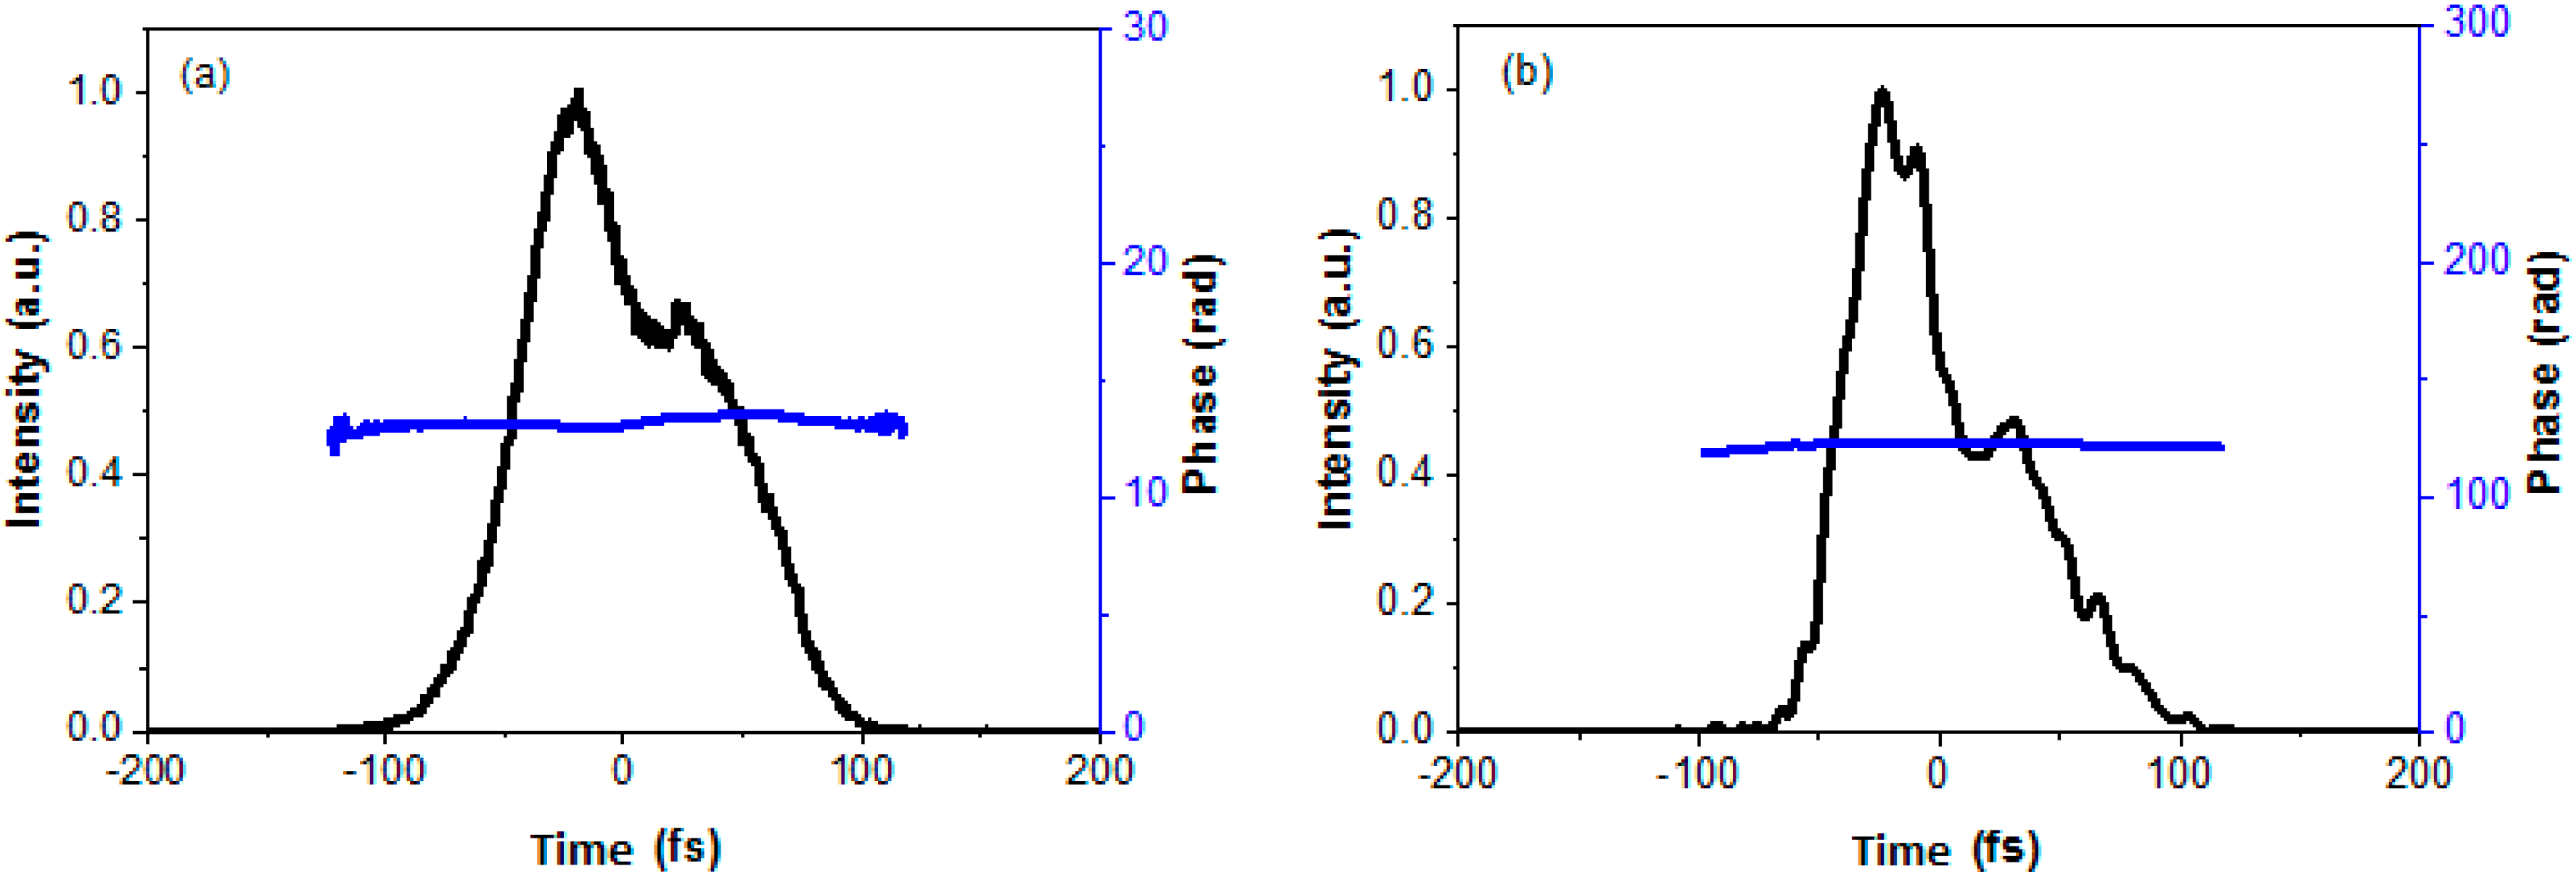
3.3. Temporal Characteristics of Multicolored Pulses

The pulse durations of Beam 1 and Beam 2 were measured to be 40 fs and 55 fs, respectively. The characteristics of the sidebands, S1, AS1, and AS2, which were generated using these two pump pulses are shown in Figure 8. The pulse durations of AS1, AS2, and S1 were calculated to be 45 fs, 44 fs, and 46 fs, respectively. The retrieved phase showed that these pulses were all positively chirped, and that the positive chirp induced by material dispersion of the nonlinear medium prevented shorter pulses from being obtained.
Figure 8. (a) Measured and (b) retrieved XFROG traces of S1; (c) measured and (d) retrieved XFROG traces of AS2 when the cross-angle was 1.87°. Retrieved temporal intensity profiles and phases of (e) AS1 (solid line), AS2 (dashed line) and (f) S1 [66].
Applsci 04 00444 g008
As discussed in [63], chirped pump pulses can be used for pre-compensation of the positive chirp of the sidebands, resulting in even shorter pulse durations. The principle of the process can be explained in the following way. In the CFWM process, the m-th-order anti-Stokes sideband has the phase matching condition: kASm = kAS(m–1) + k1k2 = (m + 1)k1 − mk2, ωASm ≈ (m + 1)ω1 − mω2. The m-th (m > 0) order anti-Stokes signal can be expressed as follows, if the electric field of two incident pulses are given as: Ej(t) ∝ exp {ij0t + ϕj(t)]}, j = 1, 2
EASm(t) ∝ exp {i[((m + 1)ω10 − mω20)t + ((m + 1)ϕ1(t) − mϕ2(t))]}
If Beam 1 is negatively chirped ( 2 ϕ 1 ( t ) / t 2 < 0 ) and Beam 2 is positively chirped ( 2 ϕ 2 ( t ) / t 2 > 0 ), we can obtain:
2 ϕ ASm ( t ) / t 2 = ( m + 1 ) 2 ϕ 1 ( t ) / t 2 m 2 ϕ 2 ( t ) / t 2 < 0
This means that the m-th order blued-shifted field, EASm, can be negatively chirped. As such, a nearly transform-limited pulse can be achieved, if the negative chirp of the ASm field is precisely adjusted to correctly compensate for the dispersion induced by the nonlinear media and other optical components used in the processes of pulse generation and characterization. By this method, the pulse durations of AS1 and AS2 were compressed to 15 fs and 16 fs, respectively, as shown in Figure 9. Further optimization of the dispersion, including higher-order dispersion, is needed to obtain truly transform-limited pulses.

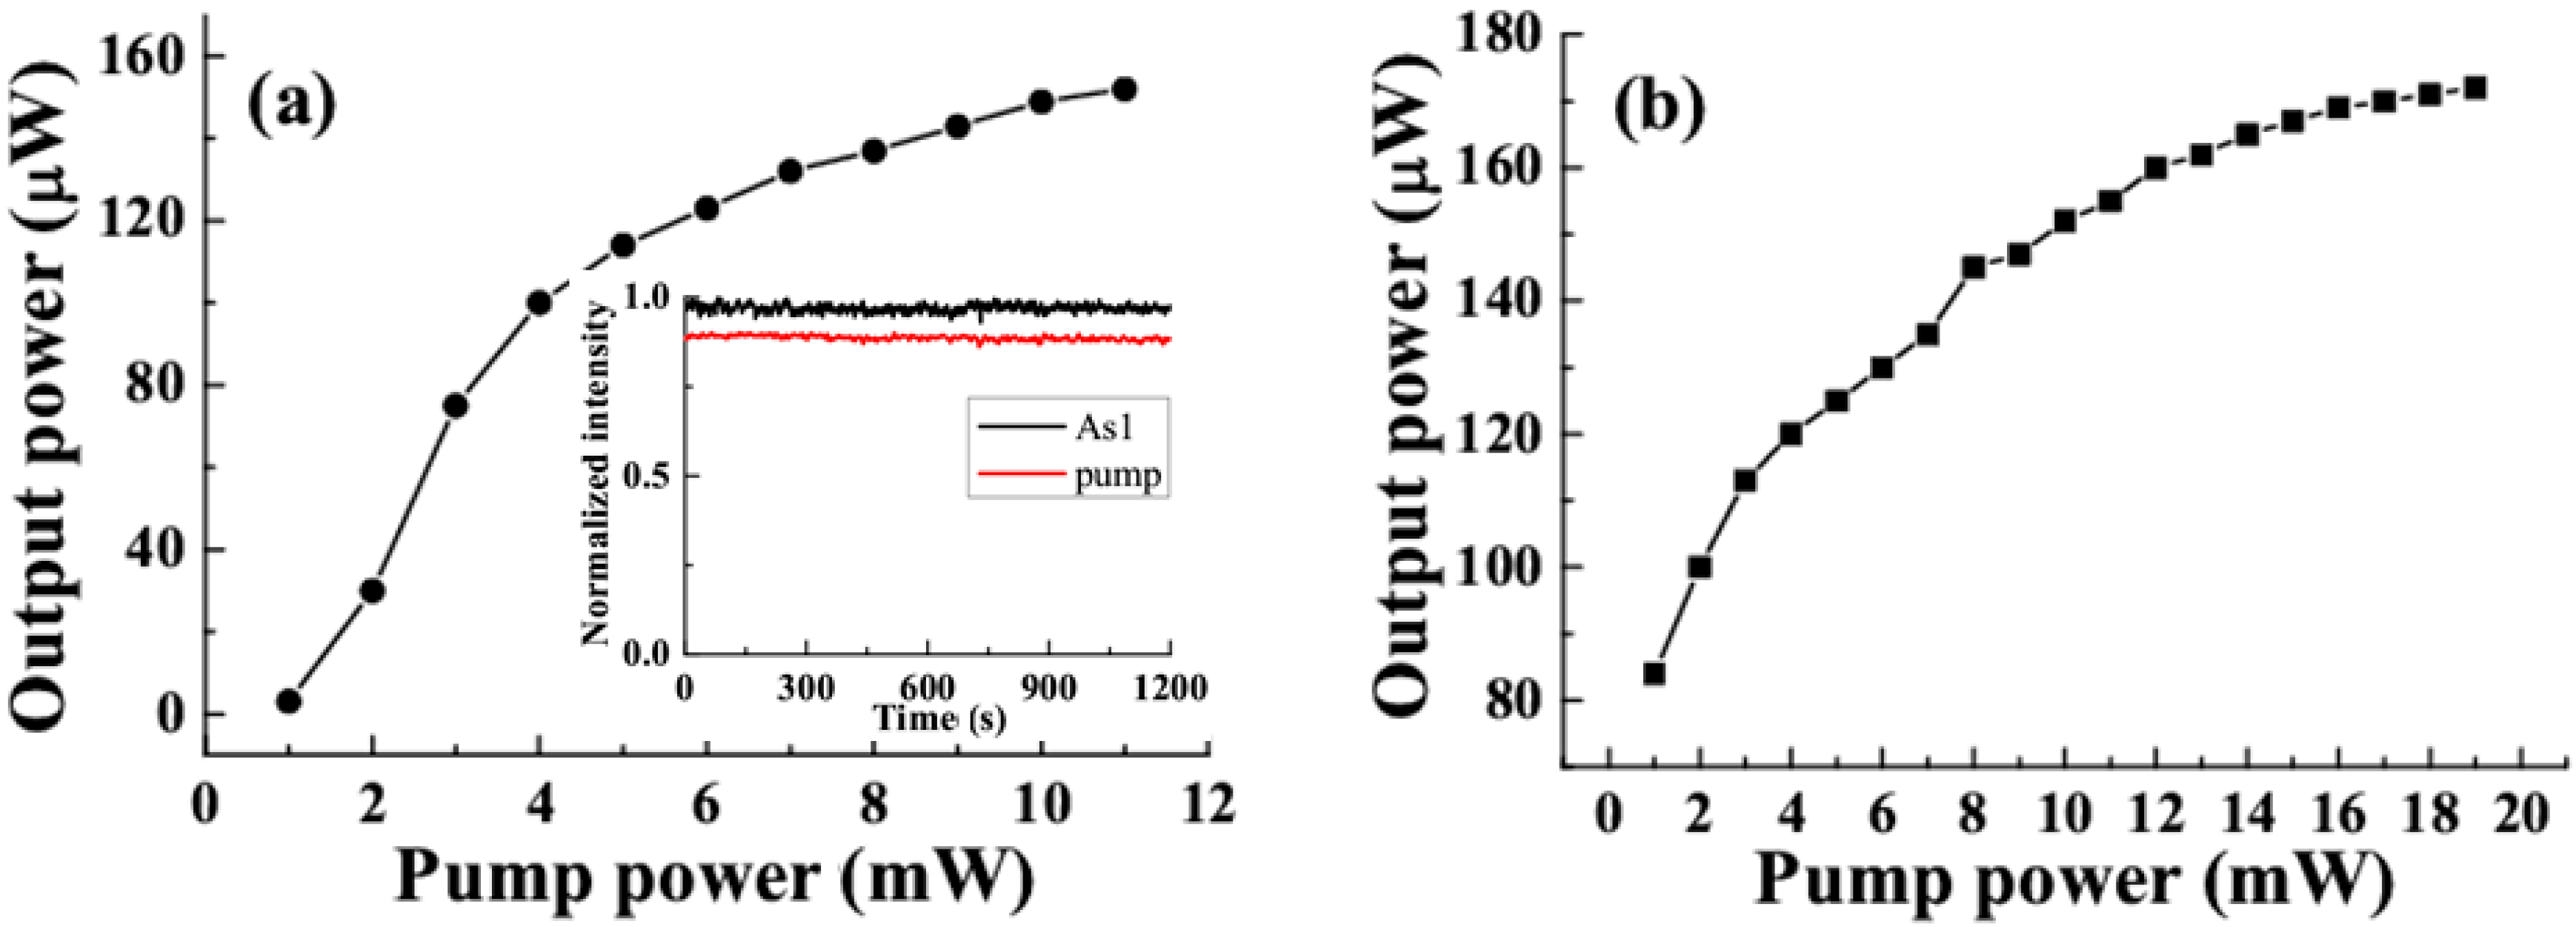
3.4. Output Power/Energy of Multicolored Pulses

Table 1 shows the average power of AS1-AS3 obtained with five different bulk media. The external cross-angle of the two pump beams was 1.8°, while the input powers of Beam 1 and Beam 2 were set at 6.5 and 25 mW respectively. CaF2 had the highest AS1 output power, and the lowest AS3 output power of all five media. Conversely, in BBO crystal, the powers of the sidebands decreased the most rapidly with increasing order number. This phenomenon can be explained by the different phase-matching conditions and dispersion properties of the five materials.
Figure 9. (a) Measured (red), retrieved (black) spectral intensity profile and retrieved spectral phase (blue) of AS1; (b) Retrieved temporal intensity profile (black), temporal phase (blue), and calculated transform-limited temporal intensity profile (red) of AS1; (c) Measured (red), retrieved (black) spectral intensities and retrieved spectral phase (blue) of AS2; (d) Retrieved temporal intensity profile (black), phase (blue), and calculated transform-limited temporal intensity profile (red) of AS2 [63].
Applsci 04 00444 g009
Table 1. The output power of AS1-AS3 with five commonly used third-order nonlinear media. The external cross-angle of two pump beams is 1.8°, while the input powers of Beam 1 and Beam 2 are 7 mW and 25 mW, respectively [60].
μWCaF2Fused SilicaBK7Sapphire PlateBBO
AS1480700715750780
AS2210315295210135
AS312590604010
Figure 10a shows the power dependence of AS1 on the power of Beam 1, with the power of Beam 2 fixed at 19 mW and the cross-angle set at 1.8°. The output power of AS1 was sensitive to the pump power with a low pump rate, and saturation occurred when the power of Beam 1 increased to about 11 mW. Similarly, when the power of Beam 1 was set to 11 mW and Beam 2 had a high pump power, saturation of the output power of AS1 appeared, as shown in Figure 10b. This saturation may have helped to obtain sidebands with high stability. The power stability of AS1 and Beam 1 were 0.95% and 0.62% in RMS, respectively, as shown in the inset of Figure 10a.
Figure 10. The power dependence of AS1 on (a) Beam 1 with power of Beam 2 fixed at 19 mW, and (b) Beam 2 with power of Beam 1 fixed at 11 mW. Power stabilities of AS1 and Beam 1 in twenty minutes are shown as the insertion of (a) [59].
Applsci 04 00444 g010
By optimizing the spatial and temporal overlap of the two pump beams, the maximum pulse energy of S1 and AS1 reached was higher than 1 μJ [66]. An even higher output power was achieved by enlarging the pump beam size and increasing the pump power.

3.5. Multicolored Sidebands Generated with Low Threshold

The polarization at frequency ωAS1 in FWM process generating AS1 can be written as:
P ( 3 ) ( ω AS1 ) χ eff (3) E 2 ( ω 1 ) E * ( ω 2 )
According to the coupled-wave equations in the FWM process, the optical field and polarization at frequency ωAS1 had the following relationship:
d E ( ω AS1 ) d z = i ω AS1 2 ε 0 c n AS1 P ( 3 ) ( ω AS1 ) e i Δ k z
Here, ∆k is the wave vector mismatch in the FWM process. From Equations (3.3) and (3.4), it can be seen that the intensity of AS1 becomes higher, following the proportionality relation with the squared absolute value of the nonlinear optical susceptibility ( | χ e f f ( 3 ) | 2 ) of the material used.
Based on this, diamond, the nonlinear optical susceptibility of which is ~5 time larger than that of sapphire and ~10 times larger than that of CaF2 [73], was used in the experiment to obtain multicolored sidebands with a low threshold.
The experiment was performed with Type-2 setup shown in Section 3.1. The spectra of two pump beams, Beam 1 and Beam 2, are depicted in Figure 11. The two spectral positions were adjusted by tuning the angle between input beams and filters. The retrieved temporal intensity profiles and phases of two pump pulses are shown in Figure 12, where the Beam 1 and Beam 2 pulse durations are 81 fs, and 47 fs, respectively.
Figure 11. The spectra of Beam 1 (black), Beam 2 (red) [62].
Applsci 04 00444 g011
Figure 12. The retrieved intensity profile and phase of (a) Beam 1; (b) Beam 2 [62].
Applsci 04 00444 g012
The average power of Beam 1 was set to 0.855 mW, and the average power of Beam 2 was continuously changed by a VND. Figure 13 shows the multicolored sidebands at different pump levels. The intensities of Beam 1 and Beam 2 on the diamond plate in Figure 13a were calculated to be 14.9 × 10⁹ W/cm2 and 12.3 × 10⁹ W/cm2 respectively. These were much lower than the threshold intensities obtained previously for multicolored sideband generation in a fused silica plate, of 60 × 109 W/cm2 and 8 × 10⁹ W/cm2 [70]. This low pump threshold for multicolored sideband generation is important in the context of an actual experiment, because pump lasers with high repetition frequencies, i.e., several hundred kHz to several MHz, inevitably have a low pulse energy when used with a conventional amplifier system. Compared to the multicolored sidebands generated with a 1 kHz amplifier, pulses with a higher repetition frequency are more useful in nonlinear microscopy. Low repetition frequencies make the image frame times unconventionally long and also lead to high noise levels. Figure 13b–d show the 2D structure obtained by increasing the power of Beam 2, a detailed discussion of which will be given in the next section.
Figure 13. Multicolored pattern generated with different pump levels. (a) Beam 1: 0.855 mW, Beam 2: 0.410 mW; (b) Beam 1: 0.855 mW, Beam 2: 0.856 mW; (c) Beam 1: 0.855 mW, Beam 2: 1.121 mW; (d) Beam 1: 0.855 mW, Beam 2: 1.970 mW [62].
Applsci 04 00444 g013
Figure 14 shows the spectra of generated multicolored sidebands obtained under pump rates of 0.855 mW and 0.856 mW for Beam 1 and Beam 2, respectively. The normalized spectra, AS1-AS5, of the two pump beams, S1 and S2, are shown in Figure 14. The spectral width of these sidebands was broader than 10 nm, which means that a pulse duration of <100 fs was achievable. The spectra of these sidebands could also be continuously tuned by adjusting the cross-angle of Beam 1 and Beam 2.
Figure 14. The normalized spectra of two pump beams, Beam 1 and Beam 2, and several sidebands AS1-AS5, S1, S2 [62].
Applsci 04 00444 g014
Table 2 shows the output power of AS1-AS5 and S1 when the average power of Beam 1 and Beam 2 were set at 0.855 mW and 0.856 mW. The conversion efficiency was about 1.84%, 1.99%, 0.36%, 0.15%, 0.08% and 0.05% for S1, AS1, AS2, AS3, AS4 and AS5 respectively. The power of AS1–AS4 could be increased by increasing the pump rate, as shown in Figure 13c,d.
Table 2. Output power of AS1-AS5 and S1 with average power of 0.855 mW and 0.856 mW for Beam 1 and Beam 2, respectively [62].
SidebandsAS1AS2AS3AS4AS5S1
Power (μW)34.06.12.51.30.831.4

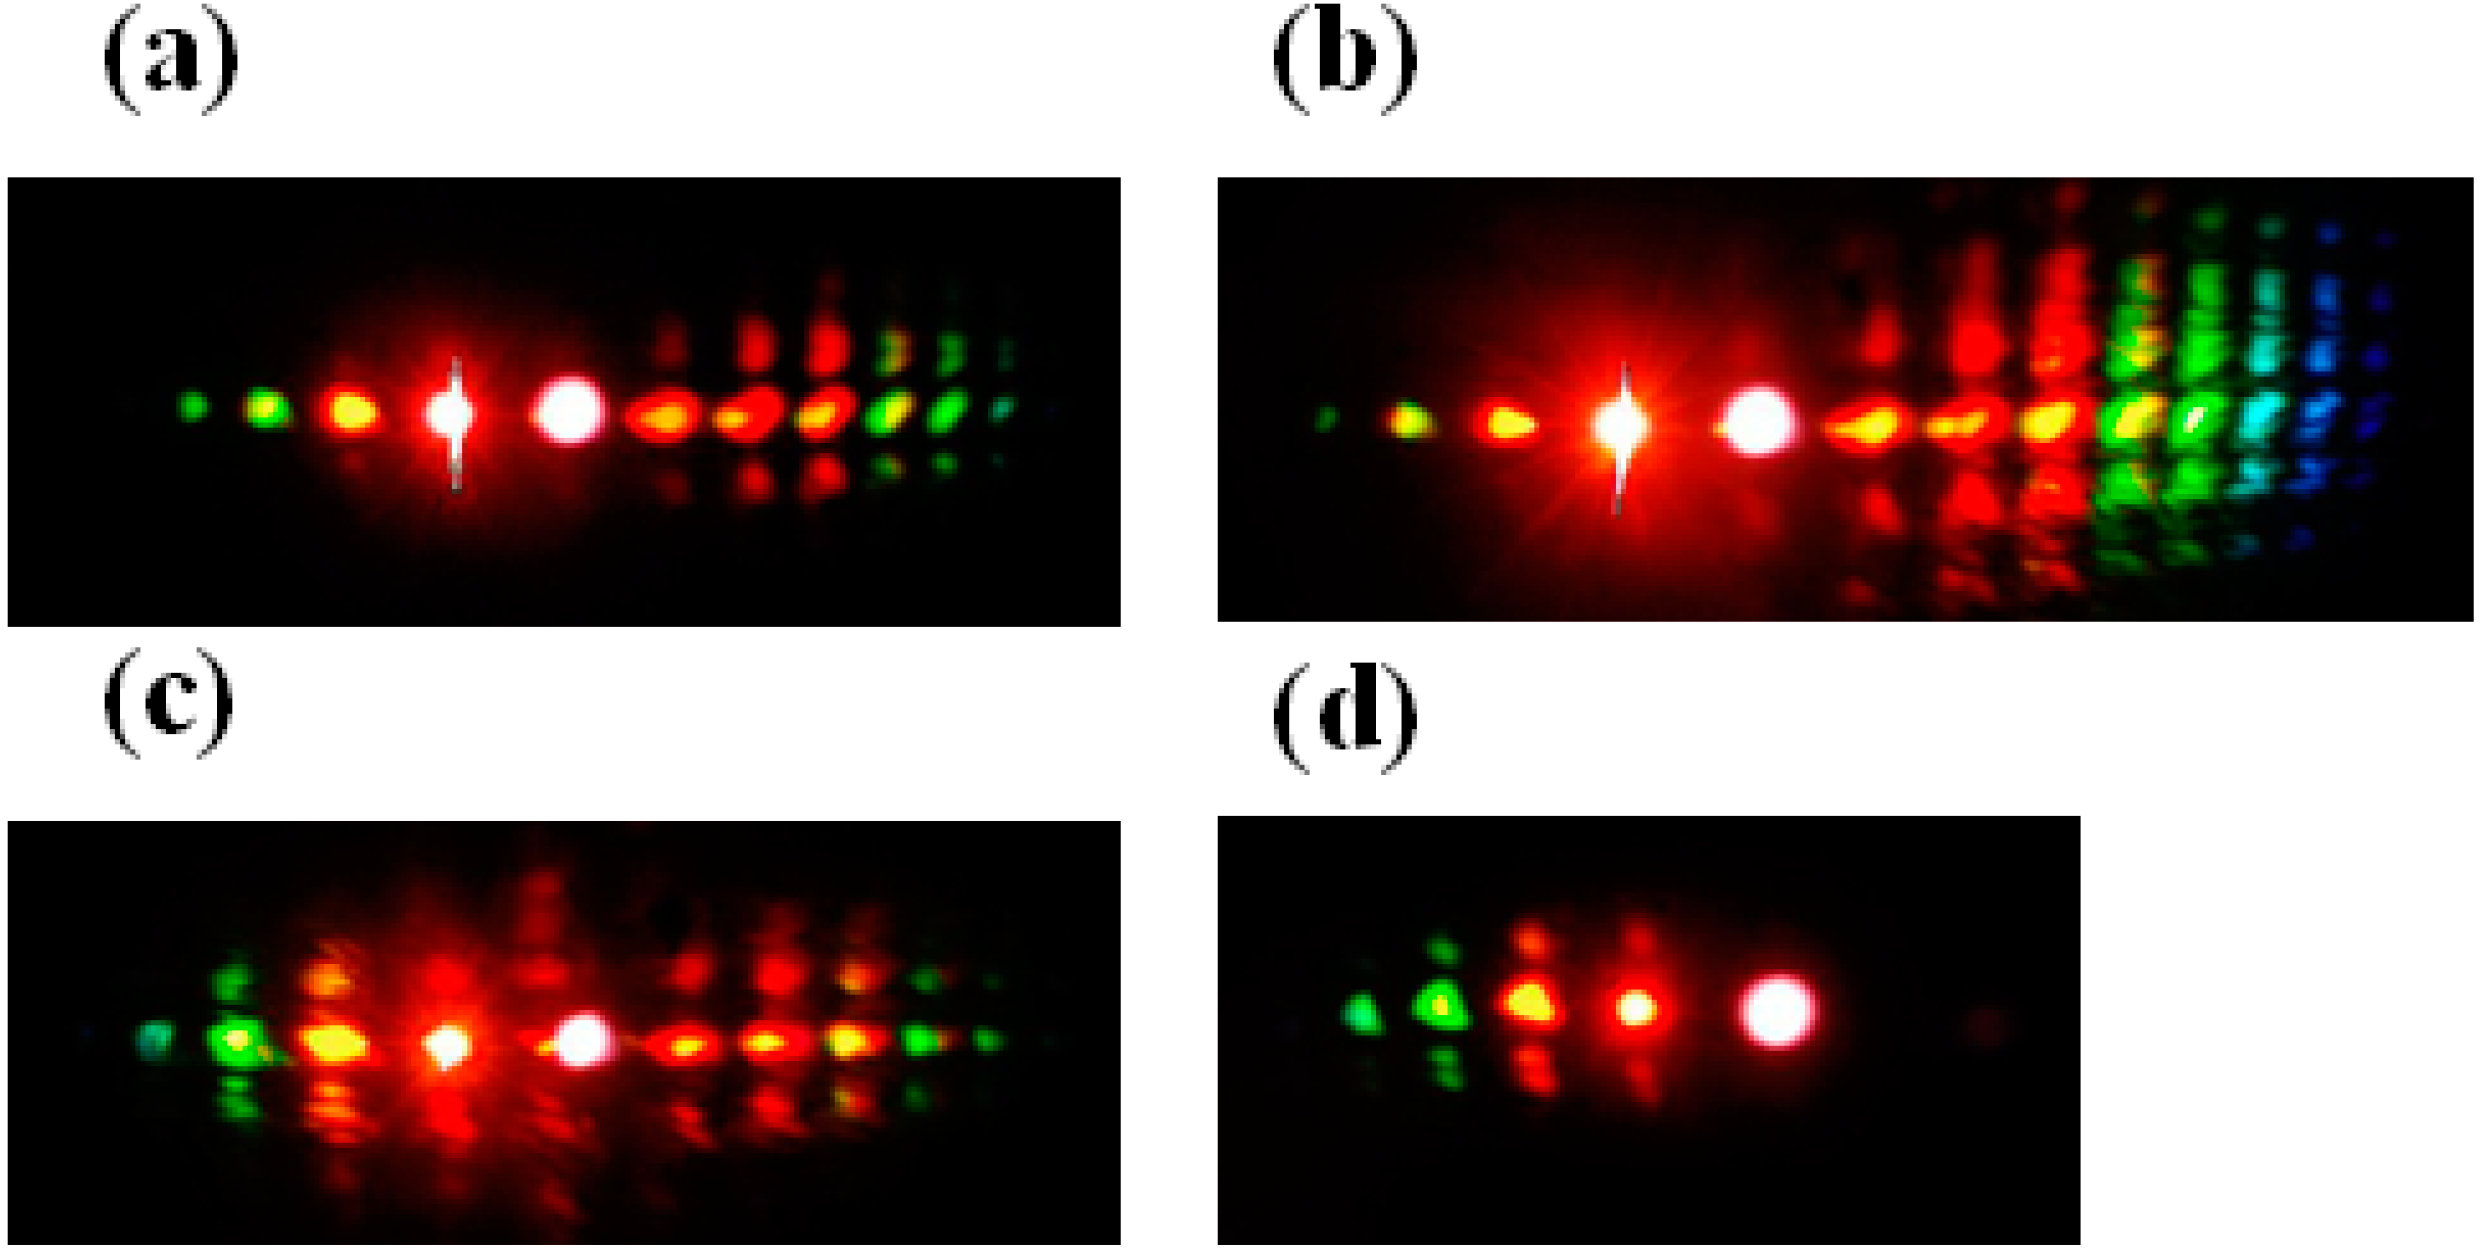
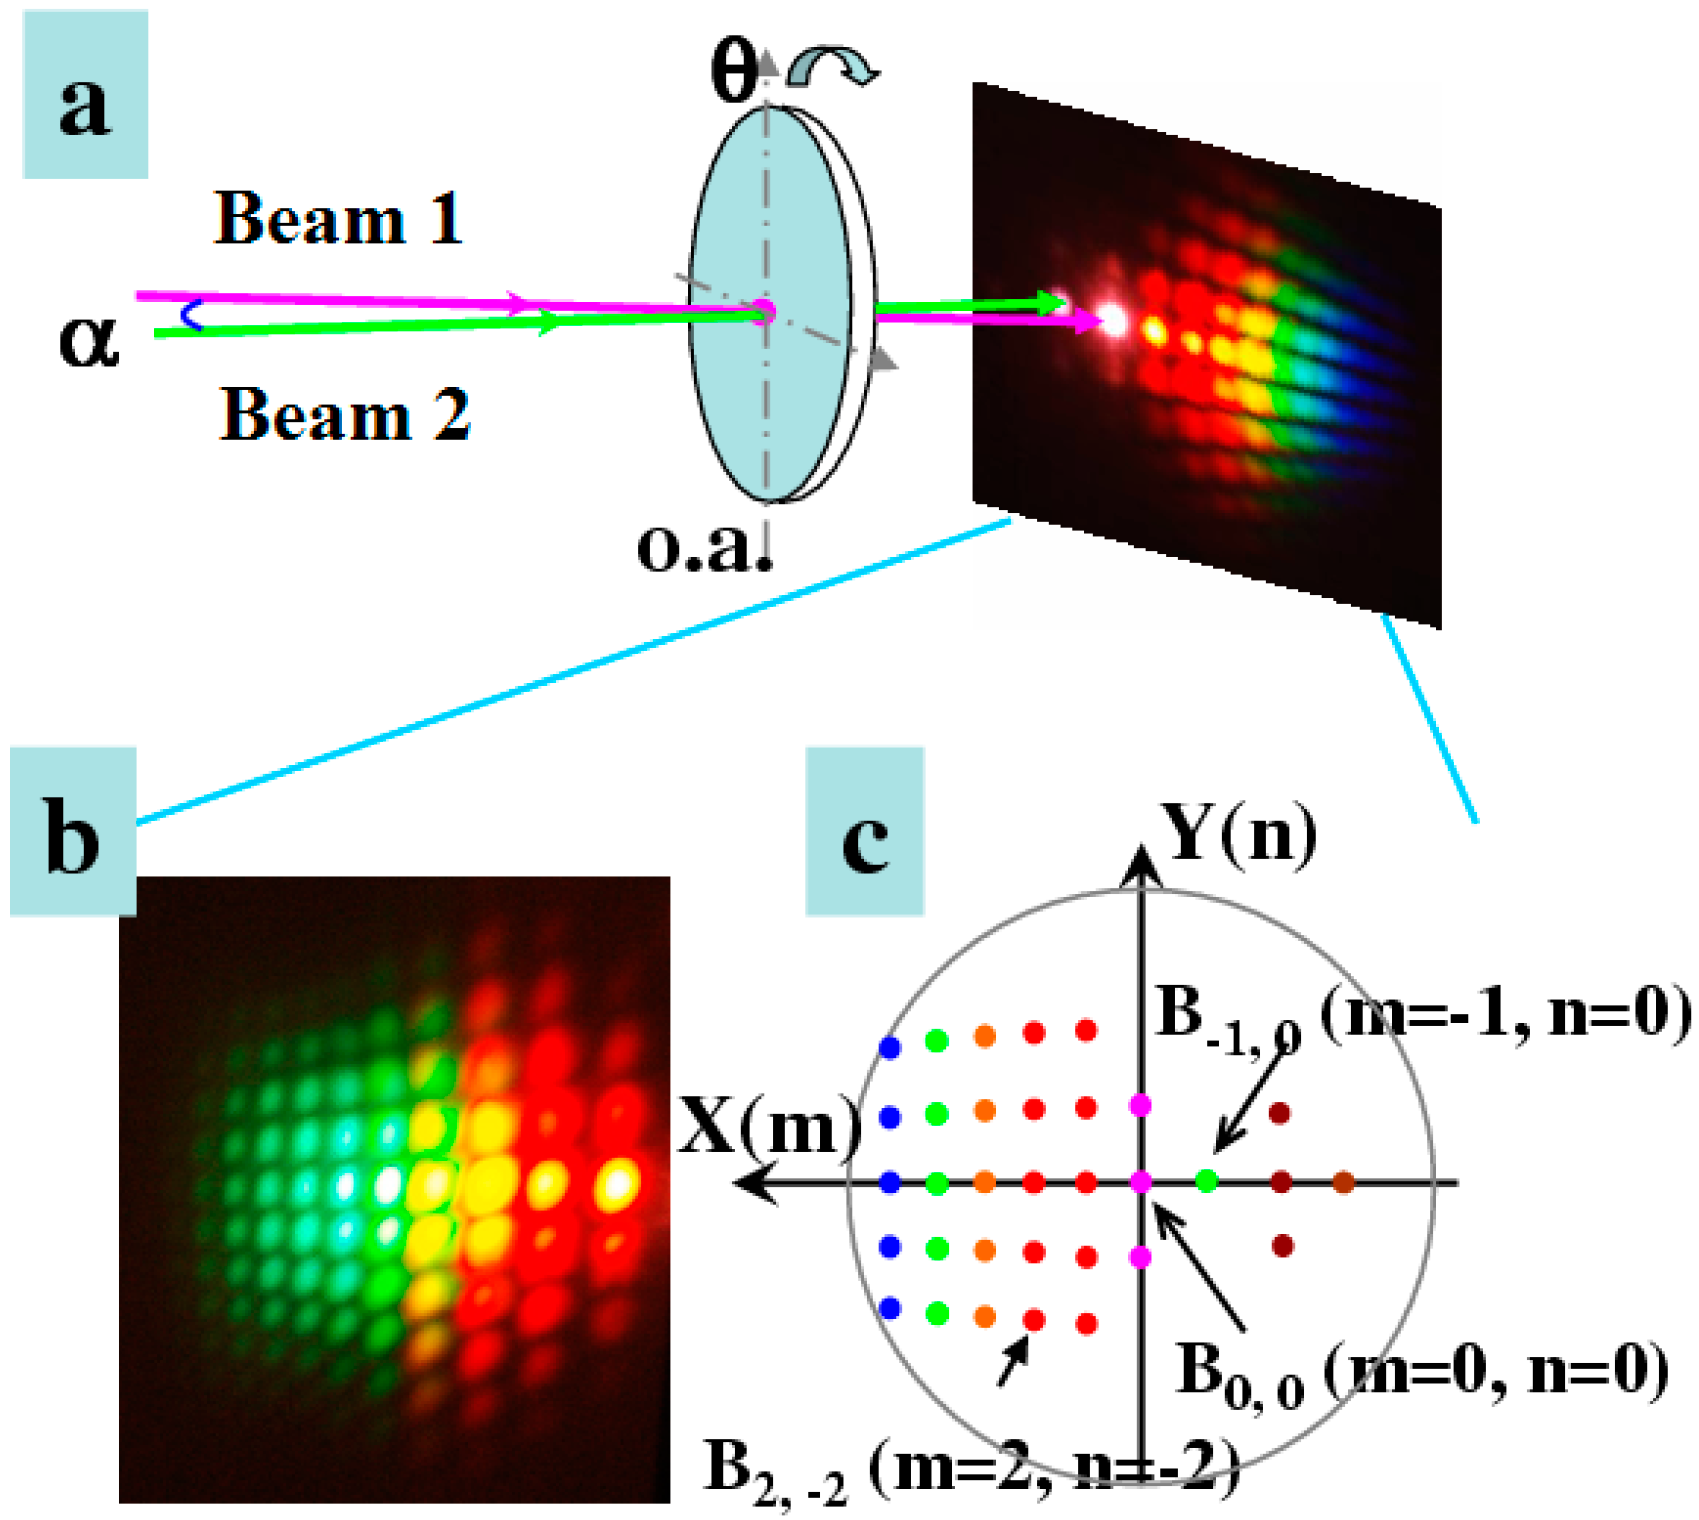
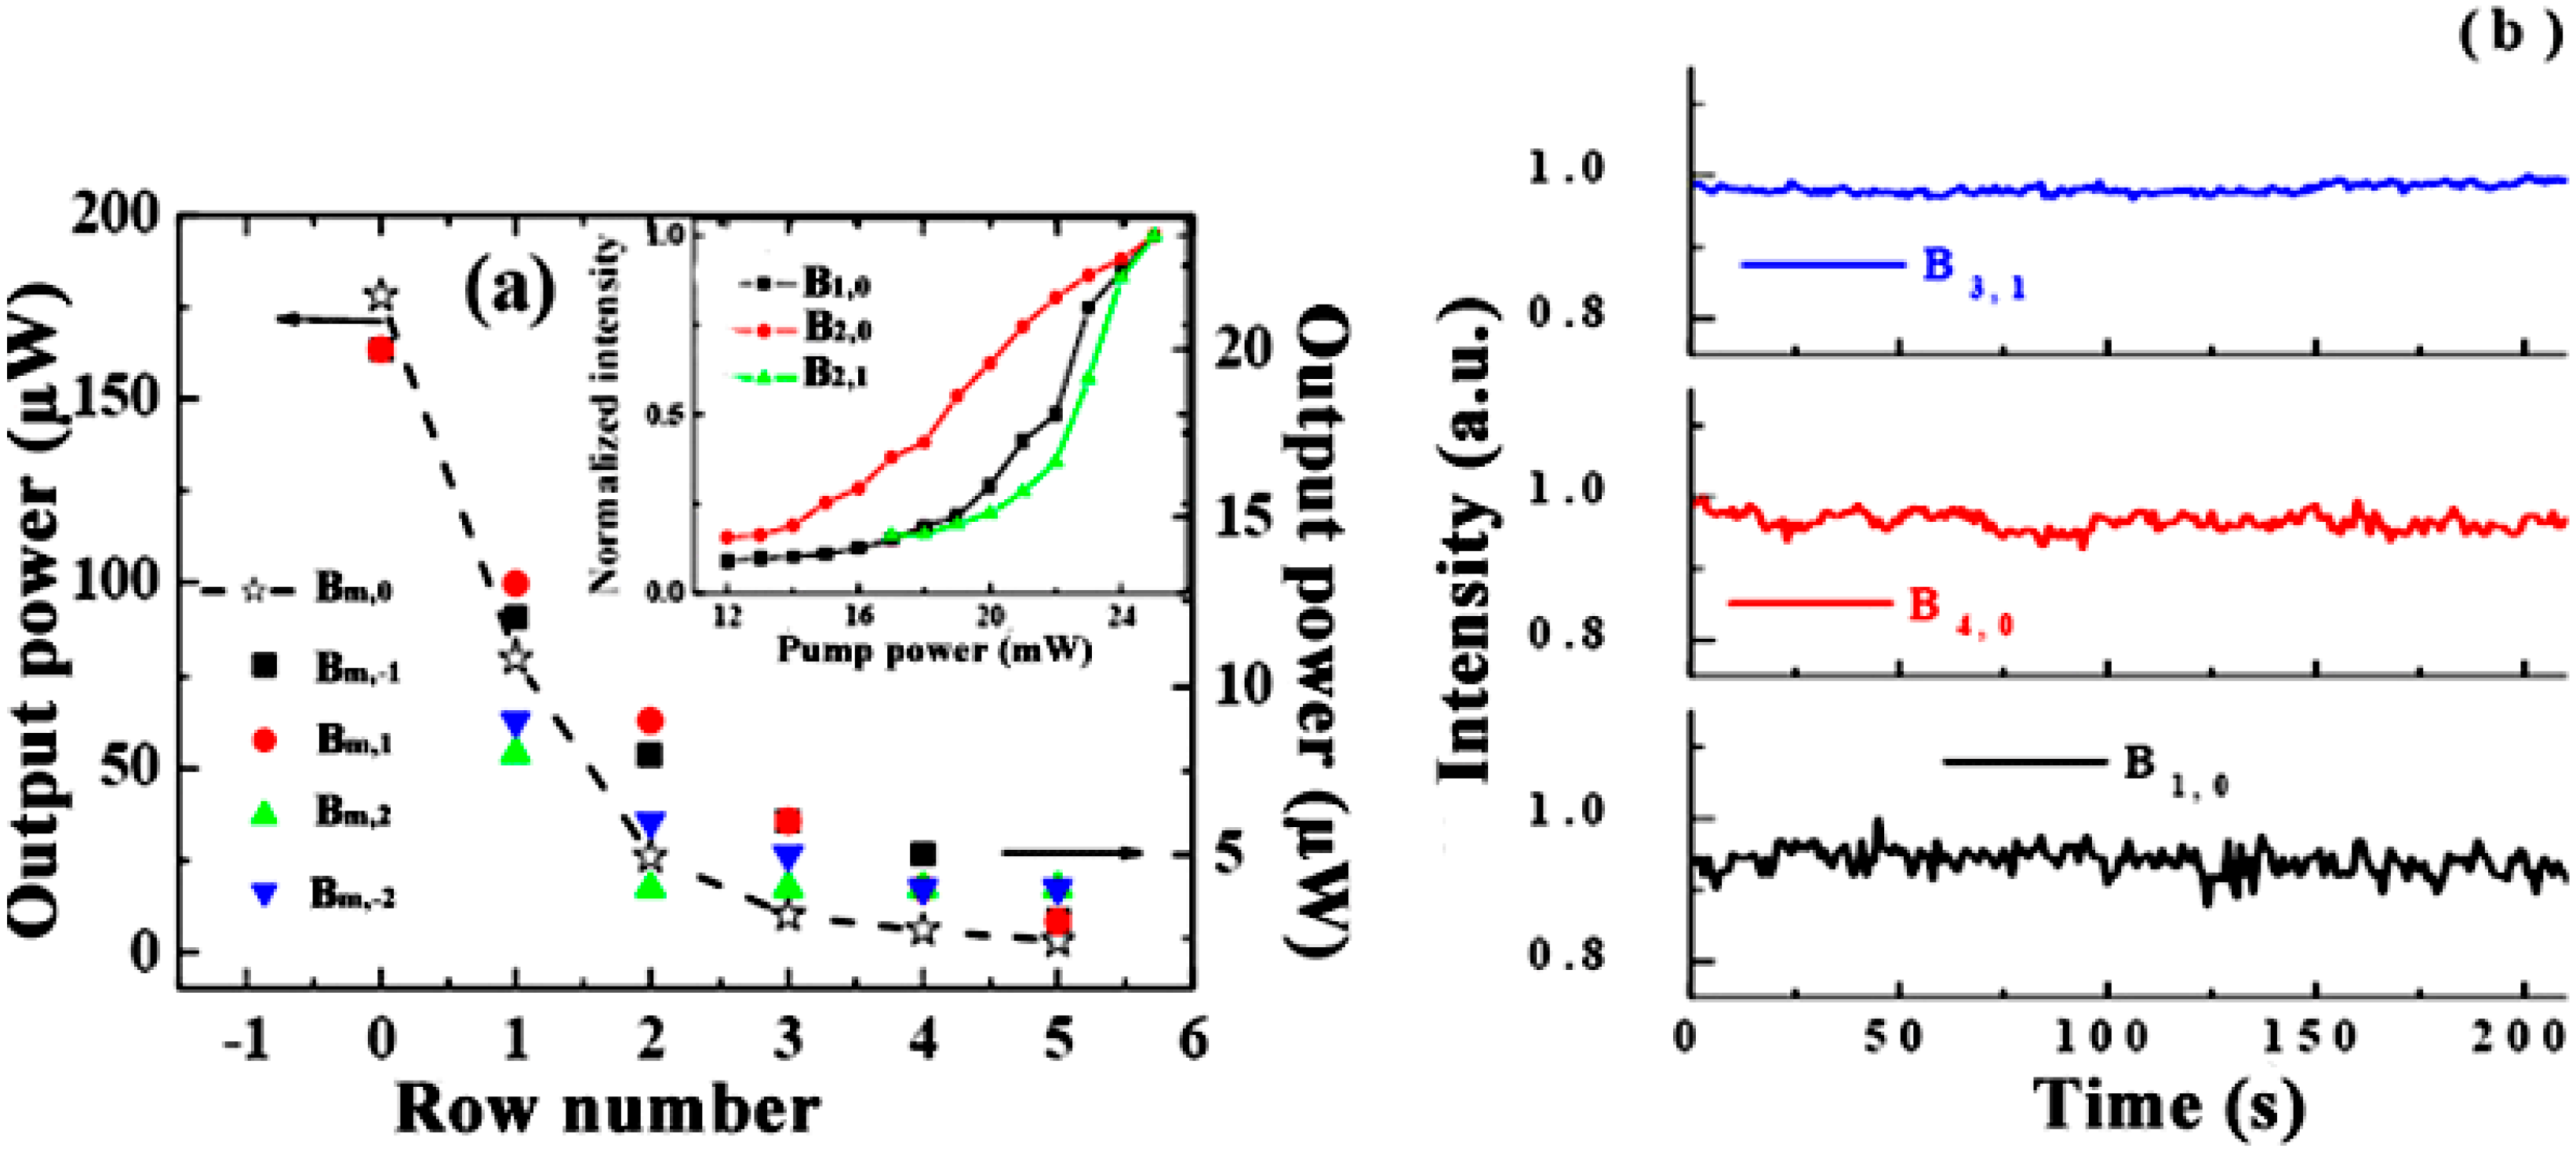
4. 2-D Multicolored Sidebands Arrays

Zeng and his coworkers first observed 2-D multicolored arrays in 2006 in a quadratic nonlinear medium (BBO crystal) with two closely-overlapped femtosecond laser beams from Ti:sapphire amplifier and its SHG signal [71]. The cause of the 2-D pattern was thought to be the cascaded quadratic nonlinear process, together with spatial breakup of the quadratic spatial solitons induced by ellipticity of the input beams. The 2-D structure could also be suppressed by another weak SHG beam.
Zhi also generated 2-D multicolored arrays in diamond plate with three pump beams [61], attributed to the interaction of two different sets of cascaded stimulated Raman scattering processes.
We observed a similar structure in a cubic nonlinear medium, sapphire plate, with only two pump beams in 2008 [55,56]. 2-D multicolored arrays were generated when pump energy was increased. Figure 15 shows the 2-D multicolored arrays generated under various conditions. The 2-D multicolored arrays could be controlled by changing the intensity, delay, or polarization of one input beam.
Figure 15. Photographs of the multicolored arrays generated with (a) pulse energy of beam 2 of 220 μJ, (b) pulse energy of beam 2 of 250 μJ; (c) time delay of two pump beams of 7 fs and pulse energy of beam 2 of 250 μJ; and (d) a short-pass filter cut-off wavelength at 820 nm inserted in the Beam 1 path [55].
Applsci 04 00444 g015
We performed another experiment to study the characteristics of the 2-D multicolored arrays in detail. The schematic of this experiment is shown in Figure 16a. The two pump beams had a cross-angle of 1.8°, and a beam size of 300 μm in sapphire plate. Stable 2-D multicolored arrays were generated when Beam 1 and Beam 2 overlapped in time and space in the sapphire plate, as shown in Figure 16b. Spatially well-separated multicolored sidebands with >10 columns and rows were observed. The columns were approximately normal to the center row while the rows adjacent to the center row were not parallel to each other. The 2-D multicolored array sidebands are defined as Bm,n for convenience, as shown in Figure 16c. B0,0 and B−1,0 stand for the two pump beams, Beam 1 and Beam 2, respectively.
Figure 16. (a) Schematics of the generation of 2-D multicolored arrays; (b) A photograph of the 2-D multicolored arrays generated in sapphire plate; (c) 2-D multicolored arrays are defined as Bm,n, in which B0,0 and B−1,0 refer to Beam 1 and Beam 2 respectively [56]. o.a., optical axis.
Applsci 04 00444 g016
The spectra of the sidebands on the center row Bm,0 and the second column B2,n were measured, as shown in Figure 17. The sidebands on the central row were generated through a CFWM process, which is almost the same as discussed in previous sections. The center wavelengths between neighboring spots on the same column were approximately the same, as shown in Figure 17b. A more accurate experiment using pump beams with narrower spectra will help to confirm these characteristics.
Figure 17. The spectra of sidebands on (a) the center row Bm,0; and (b) the second column B2,n [56].
Applsci 04 00444 g017
The powers of Beam 1 and Beam 2 were set to 0.1 and 25 mW, respectively. The measured powers of some sidebands at this pump rate are shown in Figure 18a. The powers of sidebands on the rows of Bm,0, Bm,1, Bm,−1, Bm,2, Bm,−2 are shown as the star, red circle, black square, green triangle and blue triangle, respectively. We found that the power of the sidebands on Bm,1 and Bm,−1 were approximately the same as the value of m. The sidebands in Bm,2 and Bm,−2 also had this property, showing that the power distribution had mirror symmetry with the central line of Bm,0. The power dependence of three sidebands, B1,0, B2,0, and B2,1, on the input power of Beam 2 are shown in the inset of Figure 18a. During the experiment, the power of Beam 1 was amplified from 0.1 to 0.17 mW, which means that the FWM process could also be used for parametric amplification. The power stability of several sidebands in different arrays, measured with a photodiode, is shown in Figure 18b. The stabilities are all in the range 0.5%–2% in RMS within 200 s.
Figure 18. (a) The output power of sibebands on the Bm,0, Bm,1, Bm,−1, Bm,−2, Bm,2, with pump power of 0.1 mW and 25 mW for Beam 1 and Beam 2, respectively. The inset shows the power dependence of three different sidebands, B1,0, B2,0, and B2,1, on power of Beam 2; (b) The power stabilities of three sidebands B3,1, B4,0 and B1,0 [56].
Applsci 04 00444 g018
In 2013, 2-dimensional multicolored arrays were observed with a low pump rate in a diamond plate, as shown in Figure 13. The experimental setup was the same as the Type-2 setup shown in Section 3.1. Increasing the pulse energy of Beam 2 to 0.856 μJ created 2-D multicolored arrays, as shown in Figure 13b. The threshold energy was much lower than that for a sapphire plate, i.e., <2 μJ for a diamond plate and 25 μJ for a sapphire plate [56,62]. More sidebands, lines and brighter arrays were observed when the energy of Beam 2 was increased further, as shown in Figure 13c,d.
The mechanism for the generation of 2D structure is not yet fully clear, although we have given some explanations based on the CFWM and beam breakup [62]. The detailed simulations of spontaneous breakup of elliptical laser beams were performed by Majus and his coworkers [76]. They attributed this breakup to multistep four-wave and parametric amplification of certain components occurring in the spatial spectrum of the self-focusing laser beam. Interestingly, beam breakup was observed even with a near circular (the ellipticity e = 1.09) input beam when the input power was ~20 times larger than Pcr, which is defined as follows [77]:
Pcr = 3.77λ2/(8πnn2)
Here, λ is the laser wavelength in vacuum, n is the refractive index, and n2 is the nonlinear refractive index. The pump beams have an ellipticity of ~1.2 in the experiment, due to asymmetric focusing with several concave mirrors. The summation of the peak powers of the two input beams is about ~60 Pcr (Pcr = 0.4 MW for diamond plate), and would be large enough for beam breakup [76]. The combination of this beam breakup and CFWM is the main cause of this 2-D multicolor structure.
Beam breakup can also occur when the pump beams are circular. Dergachev has investigated the interaction of two noncollinear femtosecond laser filaments in sapphire both numerically and experimentally [78]. The simulation was based on the nonlinear Schrödinger equation. The experiment was performed with a Ti:sapphire amplifier with a pulse width of 120 fs. The two incident beams, which are all from the same laser source, have a cross-angle of 4.64°. Because of the asymmetric distributions of refractive index changes in the nonlinear material due to the Kerr effect of the pump beams, additional “hot points” or plasma channels arise in the plane oriented perpendicular to the pulse propagation plane with input pulse power above 10 Pcr (corresponding to a pulse energy of 3~4 μJ). Clear beam breakup was observed. The energy distribution of light spots at the output end can be adjusted by tuning the phase between the two input beams.
We are working on simulations based on the nonlinear Schrödinger equation including FWM and other nonlinear processes, such as optical Kerr effect and multiphoton absorption, which are required for full understanding of this phenomenon.

5. Conclusions and Prospects

In conclusion, we have investigated multicolor sideband generation based on CFWM both theoretically and experimentally. Analysis and computer simulation including the effect of phase-matching in FWM reasonably explain the reported experimental results.
The main characteristics of multicolored sidebands obtained in our experiment can be summarized as follows.
(1)
Tunability in a wide spectral region.
Fifteen spectral up-shifted pulses and two spectral down-shifted emissions were obtained simultaneously in a spectra domain that spanned more than 1.8 octaves. The wavelengths of the sidebands could be tuned from near-ultraviolet to near-infrared by adjusting the crossing angle between the two input beams or by replacing the nonlinear bulk medium.
(2)
Ultrashort pulse width.
The pulse width of the sidebands remained nearly unchanged for the Stokes and anti-Stokes pulses. Nearly transform-limited compressed pulses as short as 15 fs could be obtained when one of the two input beams was properly negatively chirped and the other was positively chirped.
(3)
High output energy.
The pulse energy of the sideband could be increased to 1 μJ, a power stability better than 1% RMS. We expect that an even higher output power could be generated by increasing the pump energy and expanding the spot sizes of the two pump beams on the optical medium to avoid saturation.
We have reported the generation of multicolor sidebands consisting of 2-D arrays, and provided some possible explanations. Beam breakup and CFWM are responsible for this interesting phenomenon. Careful investigation using both simulation and experiment are still needed for complete understanding of this new phenomenon.
Future studies into multicolored sidebands extending in the visible and near-IR spectral regions, which are generated with pump lasers with MHz repetition rates, would be useful in numerous applications such as nonlinear microscopy. A pulse energy of 1 μJ for each pump pulse has been confirmed to be enough energy for multicolor sideband generation in a diamond plate. This energy can be reduced further, if the pump beams are tightly focused on a medium with higher third-order nonlinearity. For example, CdSSe-nanoparticle-doped glass has 5.6 times larger third-order susceptibility than a diamond plate, even at wavelengths far from its resonant frequency [73].

Acknowledgments

This work was partly supported by the 21st Century COE program on “Coherent Optical Science”, and partly supported by the grant from the Ministry of Education (MOE) in Taiwan under the ATU Program at National Chiao Tung University. A part of this work was performed as a joint research project with the Laser Engineering group at Osaka University, under contract subject B1-27.

Author Contributions

Jun Liu performed most of the experiments; Jinping He performed part of the experiments and wrote the paper; Takayoshi Kobayashi proposed some of the experiments, discussed with the coauthors, and also revised the paper.

Conflicts of Interest

The authors declare no conflict of interest.

References

  1. Dantus, M.; Rosker, M.J.; Zewail, A.H. Real-time femtosecond probing of “transition states” in chemical reactions. J. Chem. Phys. 1987, 87, 2395. [Google Scholar] [CrossRef]
  2. Bowman, R.M.; Dantus, M.; Zewail, A.H. Femtosecond transition-state spectroscopy of iodine: From strongly bound to repulsive surface dynamics. Chem. Phys. Lett. 1989, 161, 297–302. [Google Scholar] [CrossRef]
  3. Douhal, A.; Kim, S.K.; Zewail, A.H. Femtosecond molecular dynamics of tautomerization in modelbase pairs. Nature 1995, 378, 260–263. [Google Scholar] [CrossRef] [PubMed]
  4. Hertel, V.; Raldoff, W. Ultrafast dynamics in isolated molecules and molecular clusters. Rep. Prog. Phys. 2006, 69, 1897. [Google Scholar] [CrossRef]
  5. Kobayashi, T.; Saito, T.; Ohtani, H. Real-time spectroscopy of transition states in bacteriorhodopsin during retinal isomerization. Nature 2001, 414, 531–534. [Google Scholar] [CrossRef] [PubMed]
  6. Kobayashi, T.; Kida, Y. Ultrafast spectroscopy with sub-10fs deep-ultraviolet pulses. Phys. Chem. Chem. Phys. 2012, 14, 6200–6210. [Google Scholar] [CrossRef] [PubMed]
  7. Middleton, C.T.; Harpe, K.L.; Su, C.; Law, Y.K.; Hernandez, C.E.C.; Kohler, B. DNA excited-state dynamics: From single bases to double Helix. Annu. Rev. Phys. Chem. 2009, 60, 217–239. [Google Scholar] [CrossRef] [PubMed]
  8. Denk, W.; Strickler, J.H.; Webb, W.W. Two-photon laser scanning fluorescence microscopy. Science 1990, 248, 73–76. [Google Scholar] [CrossRef] [PubMed]
  9. Helmchen, F.; Denk, W. Deep tissue two-photon microscopy. Nat. Methods 2005, 2, 932–940. [Google Scholar] [CrossRef] [PubMed]
  10. Horton, N.G.; Wang, K.; Kobat, D.; Clark, C.W.; Wise, F.W.; Schaffer, C.B.; Xu, C. In vivo three-photon microscopy of subcortical structures within an intact mouse brain. Nat. Photon. 2013, 7, 205–209. [Google Scholar] [CrossRef]
  11. Campagnola, P.J.; Loew, L.M. Second-harmonic imaging microscopy for visualizing biomolecular arrays in cells, tissues and organisms. Nat. Biotechnol. 2003, 21, 1356–1360. [Google Scholar] [CrossRef] [PubMed]
  12. Campagnola, P.J.; Clark, H.A.; Mohler, W.A. Second-harmonic imaging microscopy of living cells. J. Biomed. Opt. 2001, 6, 277–286. [Google Scholar] [CrossRef] [PubMed]
  13. Débarre, D.; Supatto, W.; Pena, A.M.; Fabre, A.; Tordjmann, T.; Combettes, L.; Schanne-Klein, M.C.; Beaurepair, E. Imaging lipid bodies in cells and tissues using third-harmonic generation microscopy. Nat. Methods 2006, 3, 47–53. [Google Scholar] [CrossRef] [PubMed]
  14. Barad, Y.; Eisenberg, H.; Horowitz, M.; Silberger, Y. Nonlinear scanning laser microscopy by third harmonic generation. Appl. Phys. Lett. 1997, 70, 922. [Google Scholar] [CrossRef]
  15. Gattass, R.R.; Mazur, E. Femtosecond laser micromachining in transparent materials. Nat. Photon. 2008, 2, 219–225. [Google Scholar] [CrossRef]
  16. Liu, X.; Du, D.; Mourou, G. Laser ablation and micromachining with ultrashort laser pulses. IEEE J. Quant. Electron. 1997, 33, 1706–1716. [Google Scholar] [CrossRef]
  17. Schaffer, C.B.; Brodeur, A.; Garcia, J.F.; Mazur, E. Micromachining bulk glass by use of femtosecond laser pulses with nanojoule enrgy. Opt. Lett. 2001, 26, 93–95. [Google Scholar] [CrossRef] [PubMed]
  18. Huang, M.; Zhao, F.L.; Cheng, Y.; Xu, N.S.; Xu, Z.Z. Origin of laser-induced near-subwavelength ripples: Interference between surface plasmons and incident laser. ACS Nano 2009, 3, 4062–4070. [Google Scholar] [PubMed]
  19. Zgadzaj, R.; Gaul, E.; Matlis, N.H.; Shvets, G.; Downer, M.C. Femtosecond pump-probe study of preformed plasma channels. J. Opt. Soc. Am. B 2004, 21, 1559–1567. [Google Scholar] [CrossRef]
  20. Hochstrasser, R.M. Two-dimensional spectroscopy at infrared and optical frequencies. Proc. Natl. Acad. Sci. USA 2007, 104, 14190–14196. [Google Scholar] [CrossRef] [PubMed]
  21. Dunn, K.W.; Sandoval, R.M.; Kelly, K.J.; Dagher, P.C.; Tanner, G.A.; Atkinson, S.J.; Bacallao, R.L.; Molitoris, B.A. Functional studies of the kidney of living animals using multicolor two-photon microscopy. Am. J. Physiol. Cell Physiol. 2002, 283, 905–916. [Google Scholar] [CrossRef]
  22. Sahai, E.; Wyckoff, J.; Philippar, U.; Segall, J.E.; Gertler, F.; Condeelis, J. Simultaneous imaging of GFP, CFP and collagen in tumors in vivo using multiphoton microscopy. BMC Biotechnol. 2005, 5, 14. [Google Scholar] [CrossRef] [PubMed] [Green Version]
  23. Mahou, P.; Zimmerley, M.; Loulier, K.; Matho, K.S.; Labroille, G.; Morin, X.; Supatto, W.; Livet, J.; Débarre, D.; Beaurepaire, E. Multicolor two-photon tissue imaging by wavelength mixing. Nat. Methods 2012, 9, 815–818. [Google Scholar] [CrossRef] [PubMed]
  24. Frank, P.A.; Hill, A.E.; Peters, C.W.; Weinreich, G. Generation of optical harmonics. Phys. Rev. Lett. 1961, 7, 118–120. [Google Scholar] [CrossRef]
  25. Seifert, F.; Ringling, J.; Noack, F.; Petrov, V.; Kittelmann, O. Generation of tunable femtosecond pulses to as low as 172.7 nm by sum-frequency mixing in lithium triborate. Opt. Lett. 1994, 19, 1538–1540. [Google Scholar]
  26. Liu, J.; Kida, Y.; Teramoto, T.; Kobayashi, T. Generation of stable sub-10fs pulses at 400 nm in a hollow fiber for UV pump-probe experiment. Opt. Express 2010, 18, 4664–4672. [Google Scholar] [CrossRef] [PubMed]
  27. Baum, P.; Lochbrunner, S.; Riedle, E. Tunable sub-10-fs ultraviolet pulses generated by achromatic frequency doubling. Opt. Lett. 2004, 68, 2793–2795. [Google Scholar]
  28. Zhao, B.; Jiang, Y.; Sueda, K.; Miyanaga, N.; Kobayashi, T. Sub-15fs ultraviolet pulses generated by achromatic phase-matching sum-frequency mixing. Opt. Express 2009, 17, 17711–17714. [Google Scholar] [CrossRef] [PubMed]
  29. Aközbek, N.; Iwasaki, A.; Becker, A.; Chin, S.L.; Bowden, C.M. Third-harmonic generation and self-channeling in air using high-power femtosecond laser pulses. Phys. Rev. Lett. 2002, 89, 143901. [Google Scholar] [CrossRef] [PubMed]
  30. Tzankov, P.; Steinkellner, O.; Zheng, J.; Mero, M.; Freyer, W.; Husakou, A.; Babushkin, I.; Herrmann, J.; Noack, F. High-power fifth-harmonic generation of femtosecond pulses in vacuum ultraviolet using a Ti: Sapphire laser. Opt. Express 2007, 15, 6389–6395. [Google Scholar] [CrossRef] [PubMed]
  31. Macklin, J.J.; Kmetec, J.D.; Gordon, C.L. High-order harmonic generation using intense femtosecond pulses. Phys. Rev. Lett. 1993, 70, 766. [Google Scholar] [CrossRef] [PubMed]
  32. Giordmaine, J.A.; Miller, R.C. Tunable coherent parametric oscillation in LiNbO3 at optical frequencies. Phys. Rev. Lett. 1965, 14, 973–976. [Google Scholar] [CrossRef]
  33. Edelstein, D.C.; Wachman, E.S.; Tang, C.L. Broadly tunable high repetition rate femtosecond parametric oscillator. Appl. Phys. Lett. 1989, 54, 1728. [Google Scholar] [CrossRef]
  34. Gale, G.M.; Cavallari, M.; Driscoll, T.J.; Hasche, F. Sub-20-fs tunable pulses in the visible from an 82-MHz optical parametric oscillator. Opt. Lett. 1995, 20, 1562–1564. [Google Scholar] [CrossRef] [PubMed]
  35. Burr, K.C.; Tang, C.L.; Arbore, M.A.; Fejer, M.M. Broadly tunable mid-inrared femtosecond optical parametric oscillator using all-solid-state-pumped periodically poled lithium niobate. Opt. Lett. 1997, 22, 1458–1460. [Google Scholar] [CrossRef] [PubMed]
  36. Wilhelm, T.; Piel, J.; Riedle, E. Sub-20fs tunable across the visible from blue-pumped single-pass nonlinear parametric converter. Opt. Lett. 1997, 22, 1494–1496. [Google Scholar] [CrossRef] [PubMed]
  37. Cerullo, G.; Nisoli, M.; Stagira, S.; de Silvestri, S. Sub-8-fs pulses from an ultrabroadband optical parametric amplifier in the visible. Opt. Lett. 1998, 23, 1283–1285. [Google Scholar] [CrossRef] [PubMed]
  38. Shirakawa, A.; Sakane, I.; Kobayashi, T. Pulse-front-matched optical parametric amplification for sub-10-fs pulse generation tunable in the visible and near infrared. Opt. Lett. 1998, 23, 1292–1294. [Google Scholar] [CrossRef] [PubMed]
  39. Okamura, K.; Kobayashi, T. Octave-spanning carrier-envelope phase stabilized visible pulse with sub-3-fs pulse duration. Opt. Lett. 2011, 36, 226–228. [Google Scholar] [CrossRef] [PubMed]
  40. Shirakawa, A.; Sakane, I.; Takasaka, M.; Kobayashi, T. Sub-5-fs visible pulse generation by pulse-front-matched noncollinear optical parametric amplification. Appl. Phys. Lett. 1999, 74, 2268–2270. [Google Scholar] [CrossRef]
  41. Corkum, P.B.; Rolland, C.; Srinivasan-Rao, T. Supercontinuum generation in gases. Phys. Rev. Lett. 1986, 57, 2268. [Google Scholar] [CrossRef] [PubMed]
  42. Kasparian, J.; Sauerbrey, R.; Mondelain, D.; Niedermeier, S.; Yu, J.; Wolf, J.P.; André, Y.B.; Franco, M.; Prade, B.; Tzortzakis, S.; et al. Infrared extension of super continuum generated by femtosecond terawatt laser pulses propagating in the atmosphere. Opt. Lett. 2000, 25, 1397–1399. [Google Scholar] [CrossRef] [PubMed]
  43. Kandidov, V.P.; Kosareva, O.G.; Golubtsov, I.S.; Liu, W.; Becker, A.; Akozbek, N.; Bowden, C.M.; Chin, S.L. Self-transformation of a powerful femtosecond laser pulse into a white-light laser pulse in bulk optical media(or supercontinuum generation). Appl. Phys. B 2003, 77, 149–165. [Google Scholar] [CrossRef]
  44. Wadsworth, W.J.; Blanch, A.O.; Knight, J.C.; Birks, T.A.; Martin Man, T.P.; Russell, P.S.J. Supercontinuum generation in photonic crystal fibers and optical fiber tapers: A novel light source. JOSA B 2002, 19, 2148–2155. [Google Scholar] [CrossRef]
  45. Xia, C.; Kumar, M.; Kulkarni, O.P.; Islam, M.N.; Terry, F.L.; Freeman, J.M.J.; Poulain, M.; Mazé, G. Mid-infrared supercontinuum generation to 4.5 μm in ZBLAN fluoride fibers by nanosecond diode pumping. Opt. Lett. 2006, 31, 2553–2555. [Google Scholar]
  46. Dunsby, C.; Lanigan, P.M.P.; McGinty, J.; Elson, D.S.; Isidro, J.R.; Munro, I.; Galletly, N.; McCann, F.; Treanor, B.; Önfelt, B.; et al. An electronically tunable ultrafast laser source applied to fluorescence imaging and fluorescence lifetime imaging microscopy. J. Phys. D 2004, 37, 3296–3303. [Google Scholar]
  47. Gu, X.; Xu, L.; Kimmel, M.; Zeek, E.; O’Shea, P.; Shreenath, A.P.; Trebino, R. Frequency-resolved optical gating and single-shot spectral measurements reveal fine structure in microstructure-fiber continuum. Opt. Lett. 2000, 27, 1174–1176. [Google Scholar] [CrossRef]
  48. Dudley, J.M.; Genty, G.; Coen, S. Supercontinuum generation in photonic crystal fiber. Rev. Mod. Phys. 2006, 78, 1135–1184. [Google Scholar] [CrossRef]
  49. Fuji, T.; Horio, T.; Suzuki, T. Generation of 12 fs deep-ultraviolet pulses by four-wave mixing through filamentation in neon gas. Opt. Lett. 2007, 32, 2481–2483. [Google Scholar] [CrossRef] [PubMed]
  50. Okamoto, H.; Tatsumi, M. Generation of ultrashort light pulses in the mid-infrared (3000–800 cm−1) by four-wave mixing. Opt. Commun. 1995, 121, 63–68. [Google Scholar] [CrossRef]
  51. Fuji, T.; Suzuki, T. Generation of sub-two-cycle mid-infrared pulses by four-wave mixing through filamentation in air. Opt. Lett. 2007, 32, 3330–3332. [Google Scholar] [CrossRef] [PubMed]
  52. Kida, Y.; Liu, J.; Teramoto, T.; Kobayashi, T. Sub-10fs deep-ultraviolet pulses generated by chirped-pulse four-wave mixing. Opt. Lett. 2010, 35, 1807–1809. [Google Scholar] [CrossRef] [PubMed]
  53. He, J.; Kobayashi, T. Generation of sub-20fs deep-ultraviolet pulses by using chirped-pulse four-wave mixing in CaF2 plate. Opt. Lett. 2013, 38, 2938–2940. [Google Scholar] [CrossRef] [PubMed]
  54. Crespo, H.; Mendonça, J.T.; Dos Santos, A. Cascaded highly nondegenerate four-wave-mixing phenomenon in transparent isotropic condensed media. Opt. Lett. 2000, 25, 829–831. [Google Scholar] [CrossRef] [PubMed]
  55. Liu, J.; Kobayashi, T. Cascaded four-wave mixing and multicolored arrays generation in a sapphire plate by using two crossing beams of femtosecond laser. Opt. Express 2008, 16, 22119–22125. [Google Scholar] [CrossRef] [PubMed]
  56. Liu, J.; Kobayashi, T.; Wang, Z.G. Generation of broadband two-dimensional multicolored arrays in a sapphire plate. Opt. Express 2009, 17, 9226–9234. [Google Scholar] [CrossRef] [PubMed]
  57. Liu, J.; Zhang, J.; Kobayashi, T. Broadband coherent anti-Stokes Raman scattering light generation in BBO crystal by using two crossing femtosecond laser pulses. Opt. Lett. 2008, 33, 1494–1496. [Google Scholar] [CrossRef] [PubMed]
  58. Liu, W.; Zhu, L.; Fang, C. Observation of sum-frequency-generation-induced cascaded four-wave mixing using two crossing femtosecond laser pulse in a 0.1 mm beta-barium-borate crystal. Opt. Lett. 2012, 37, 3783–3785. [Google Scholar]
  59. Liu, J.; Kobayashi, T. Wavelength-tunable multicolored femtosecond laser pulse generation in fused silica glass. Opt. Lett. 2009, 34, 1066–1068. [Google Scholar] [CrossRef] [PubMed]
  60. Liu, J.; Kobayashi, T. Cascaded four-wave mixing in transparent bulk media. Opt. Comm. 2010, 283, 1114–1123. [Google Scholar] [CrossRef]
  61. Zhi, M.; Wang, X.; Sokolov, A.V. Broadband coherent light generation in diamond driven by femtosecond pulses. Opt. Express 2008, 16, 12139–12147. [Google Scholar] [CrossRef] [PubMed]
  62. He, J.; Du, J.; Kobayashi, T. Low-threshold and compact multicolored femtosecond laser generated by using cascaded four-wave mixing in a diamond plate. Opt. Comm. 2013, 290, 132–135. [Google Scholar] [CrossRef]
  63. Liu, J.; Kobayashi, T. Generation of sub-20-fs multicolor laser pulses using cascaded four-wave mixing with chirped incident pulses. Opt. Lett. 2009, 34, 2402–2404. [Google Scholar] [PubMed]
  64. Weigand, R.; Mendonca, J.T.; Crespo, H. Cascaded nondegenerate four-wave mixing technique for high-power single-cycle pulse synthesis in the visible and ultraviolet ranges. Phys. Rev. A 2009, 79, 063838. [Google Scholar] [CrossRef]
  65. Silva, J.L.; Weigand, R.; Crespo, H. Octave-spanning spectra and pulse synthesis by non-degenerate cascaded four-wave mixing. Opt. Lett. 2009, 34, 2489–2491. [Google Scholar] [CrossRef] [PubMed]
  66. Liu, J.; Kobayashi, T. Generation of μJ-level multicolored femtosecond laser pulses using cascaded four-wave mixing. Opt. Express 2009, 17, 4984–4990. [Google Scholar] [CrossRef] [PubMed]
  67. Nietzke, R.; Fenz, P.; Elsässer, W.; Göbel, E.O. Cascaded fourwave mixing in semiconductor laser. Appl. Phys. Lett. 1987, 51, 1298–1300. [Google Scholar] [CrossRef]
  68. Eckbreth, A.C.; Anderson, T.J.; Dobbs, G.M. Multi-color CARS for Hydrogen-fueled scramjet applications. Appl. Phys. B 1988, 45, 215–223. [Google Scholar] [CrossRef]
  69. Sokolov, A.V.; Walker, D.R.; Yavuz, D.D.; Yin, G.Y.; Harris, S.E. Raman generation by phased and antiphased molecular states. Phys. Rev. Lett. 2000, 85, 562–565. [Google Scholar] [PubMed]
  70. Zhang, H.; Liu, H.; Si, J.; Yi, W.; Chen, F.; Hou, X. Low threshold power density for the generation of frequency up-converted pulses in bismuth glass by two crossing chirped femtosecond pulses. Opt. Express 2011, 19, 12039–12044. [Google Scholar] [CrossRef] [PubMed]
  71. Zeng, H.; Wu, J.; Xu, H.; Wu, K. Generation and weak beam control of two-dimensional multicolored arrays in a quadratic nonlinear medium. Phys. Rev. Lett. 2006, 96, 083902. [Google Scholar] [CrossRef] [PubMed]
  72. Liu, W.; Zhu, L.; Fang, C. In-situ weak-beam and polarization control of multidimensional laser sidebands for ultrafast optical switching. Appl. Phys. Lett. 2014, 104, 111114. [Google Scholar] [CrossRef]
  73. Boyd, R.W. Nonlinear Optics, 3rd ed.; Elsevier: Singapore, 2010. [Google Scholar]
  74. Liu, J.; Kida, Y.; Teramoto, T.; Kobayashi, T. Simultaneous compression and amplification of a laser pulse in a glass plate. Opt. Express 2010, 18, 2495–2502. [Google Scholar] [CrossRef] [PubMed]
  75. Liu, J.; Kobayashi, T. Generation and amplification of tunable multicolored femtosecond laser pulses by using cascaded four-wave mixing in transparent bulk media. Sensors 2010, 10, 4296–4341. [Google Scholar] [CrossRef] [PubMed]
  76. Majus, D.; Jukna, V.; Valiulis, G.; Dubietis, A. Generation of periodic filament arrays by self-focusing of highly elliptical ultrashort pulsed laser beams. Phys. Rev. A 2009, 79, 033843. [Google Scholar] [CrossRef]
  77. Dubietis, A.; Tamosauskas, G.; Fibich, G.; Ilan, B. Multiple filamentation induced by input beam elliticity. Opt. Lett. 2004, 29, 1451–1453. [Google Scholar]
  78. Dergachev, A.A.; Kadan, V.N.; Shlenov, S.A. Interaction of noncolinear femtosecond laser filaments in sapphire. Quant. Electron. 2012, 42, 125–129. [Google Scholar] [CrossRef]

