Optimal Waveform of the Partial-Respond Signal Based on Minimum Out-of-Band Radiation Criterion


1
College of Information and Communication Engineering, Harbin Engineering University, Harbin 150001, China
2
Institute of Physics, Nanotechnology and Telecommunications, St. Petersburg State Polytechnical University, St. Petersburg 195251, Russia
*
Author to whom correspondence should be addressed.
Appl. Sci. 2017, 7(10), 1086; https://0-doi-org.brum.beds.ac.uk/10.3390/app7101086
Submission received: 3 August 2017
/
Revised: 2 October 2017
/
Accepted: 17 October 2017
/
Published: 19 October 2017
Abstract
:This paper presents a novel method designing an optimized waveform with high spectral efficiency based on minimum out-of-band radiation criterion. Introducing the Pan-function model, Fourier series, and constraints, we achieve the numeric solution of the optimized baseband signals. The optimal waveform provides an excellent bandwidth efficiency, and its bit error rate (BER) performance is improved using the minimum cross-correlation function. To verify the proposed model, we present a simulation of the signal modulation and demodulation schemes using MATLAB software. The results are consistent with expected results, verifying the correctness of this method.
1. Introduction
Optimized signal waveform with features, higher utilization rate, lower peak-to-average power ratio (PAPR), and higher main lobe energy can be applied in many significant applications, such as mobile telecommunication, satellite communication, aircraft measurement, tracking, and controlling systems [1,2,3]. Previous studies have provided many effective optimization methods for different scenarios. In order to higher the utilization rate in band limited channel, modulations based on orthogonal frequency division multiplexing (OFDM) and quadrature amplitude modulation (QAM) are provided, both of which suffer from high PAPR [3,4,5]. Nonlinear characteristics of the transmitter amplifier lead to undesirable out-of-band radiation, which restrict the use of OFDM and QAM. Moreover, modulation with high PAPR is not suitable in nonlinear channel, where the signal spectrum could also be extended [1]. Efforts have been made in many studies to reduce the out-of-band radiation. In the work [6], minimum shift keying (MSK) is proposed, which is featured with constant envelope and has less out-of-band radiation compared with quadrature phase shift keying (QPSK). Furthermore, Gaussian filtered minimum shift keying (GMSK) shows better outband reduction compared with MSK, which takes the sacrifice of the constant envelope [7]. Pauli et al. [8] proposed the bandwidth efficient reduction of the crest factor (BERC) method.
In most canonical communication systems featured with constant or quasi-constant envelope, a rectangular base band signal is applied in QPSK, offset QPSK (OQPSK), and frequency-shift-keying (FSK)modulation systems; cosine signal is used in MSK and GMSK after filtering. These kinds of modulation systems show a lesser utilization rate compared with multiple carrier modulation. However, the contradiction between the utilization rate, main lode energy, and PAPR still needs further study. In recent years, there have been few studies giving mathematical optimization models based on certain criteria. In this paper, a novel method to design an optimized base band waveform is proposed based on minimum out-of-band radiation criterion and additional restrictions. In this method, we first give the target Pan-function based on the minimum out-of-band radiation criterion. Then, we construct the boundary function with the restrictions, symbol boundary condition, single-symbol signal energy condition, constant-envelope condition, and minimum cross correlation function. Hence, Lagrange’s equation is derived. After that, the base band waveform is discreted using Fourier series. The optimization problem is transmitted to finding the coefficient of the Fourier series, which could minimize the Lagrange’s equation. To verify the proposed method, a communication system simulation model is set up. The numerical results show that the optimized waveform presents sharper roll-off, small out-of-band radiation, quasi-constant envelope, and good bit error rate (BER) performance.
2. Optimized Mathematical Modeling of the Optimized Waveform
2.1. Minimum Out-of-Band Radiation Criterion
In order to optimize the baseband symbol signals with higher spectral roll-off rate, an optimized mathematical function is established which minimizes the out-of-band radiation criterion [9] as
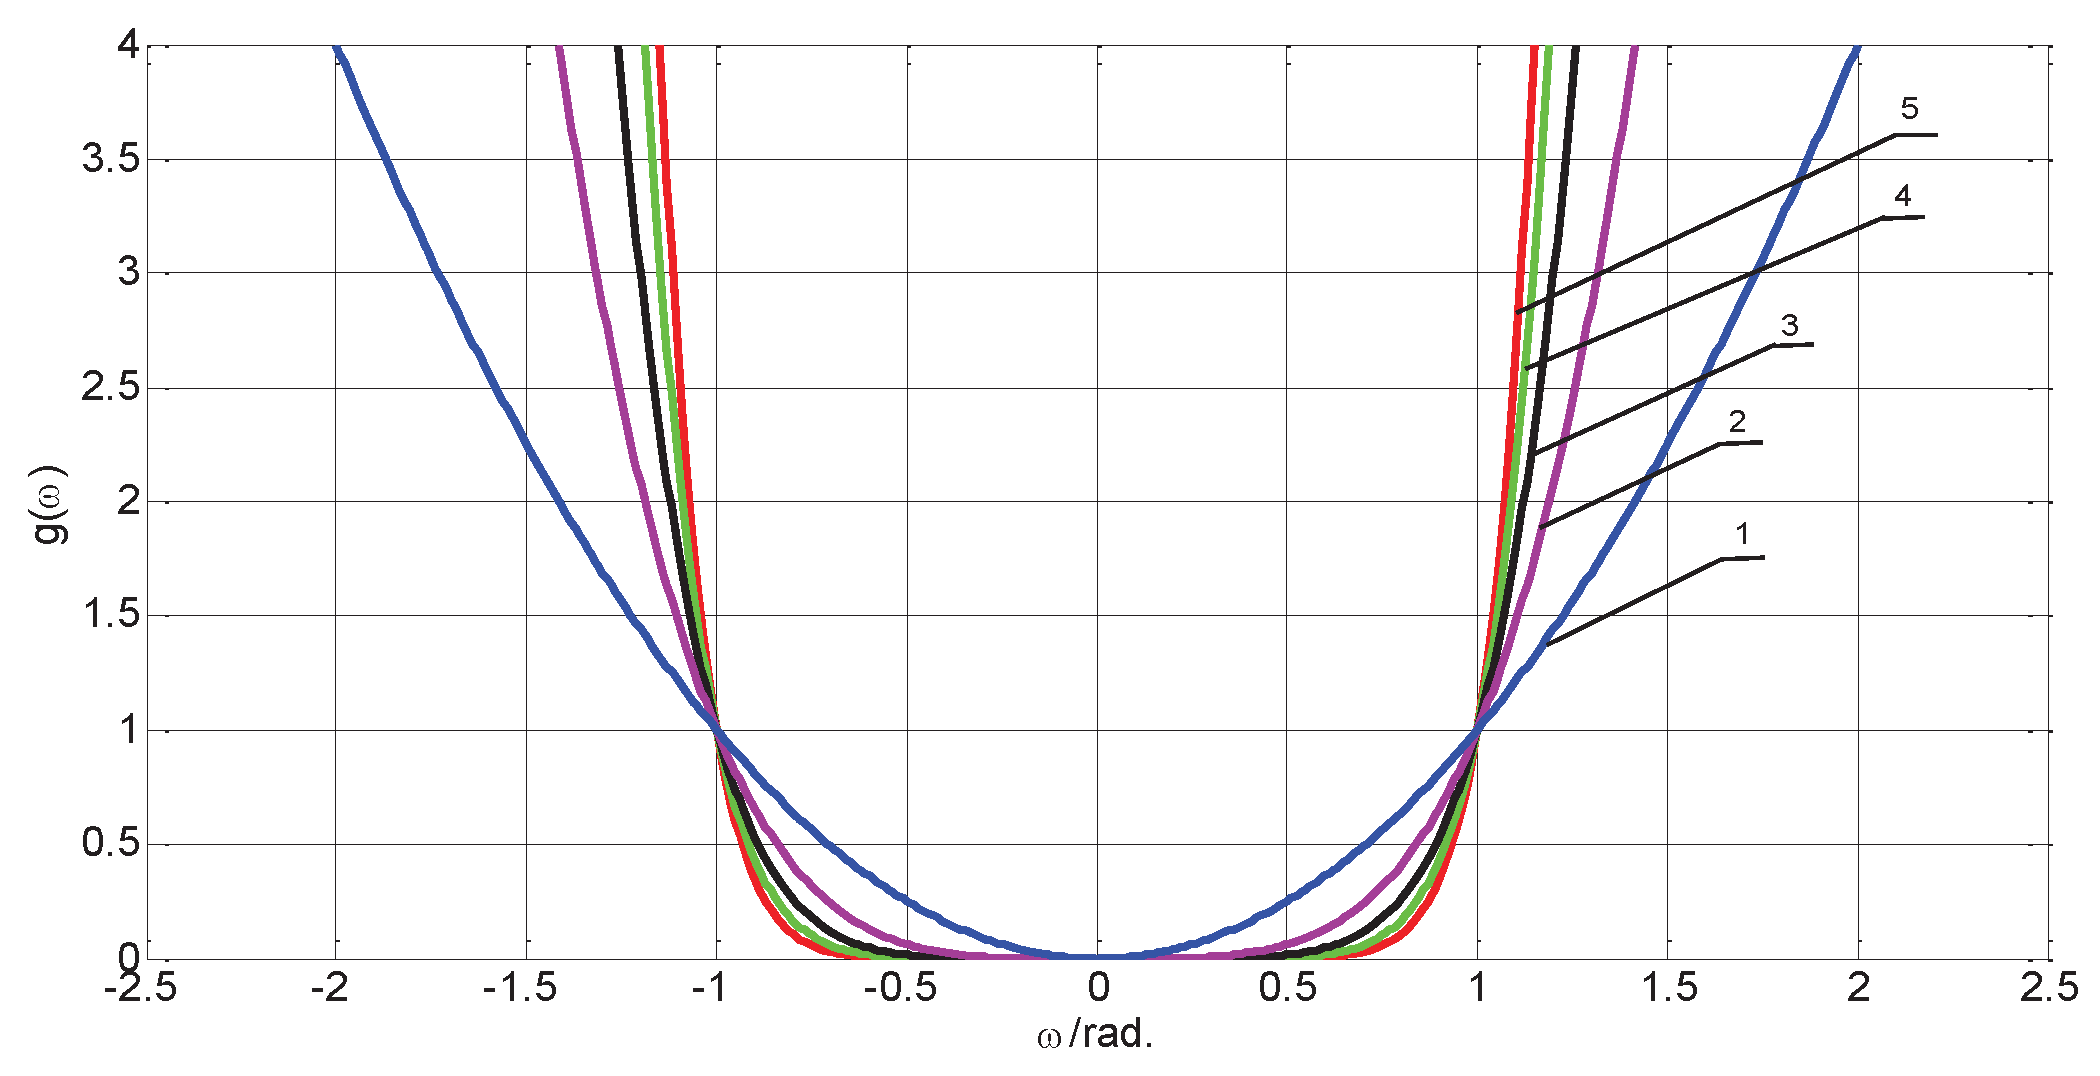
where is the symbol signal waveform. It is an even function in the symbol period . is the power spectrum of , and is an increasing function that determines the roll-off rate of the spectral density function . The value of n determines the degree of suppressed out-of-band radiation. To achieve a convergent and integrable J, the roll-off rate of should be greater than the rate of increase in to limit the roll-off rate of the power spectrum of the signal . Figure 1 plots the increasing function, versus n.
Following a series of mathematical manipulations (including Taylor series expansion [10]), Equation (1) may be written as
where represents the -order derivative of the symbol signal. Equation (2) reveals that the criterion for minimum out-of-band radiation may be transformed into the problem of unraveling the symbol function when minimizing the Pan-functional J.
2.2. Additional Constraints of the Pan-Function
As an example, we consider the partial-response quadrature modulation with a symbol length of 4T. The analytic solution of the optimized mathematical model is fairly complex under restriction of the symbol boundary condition, single-symbol signal energy condition, constant-envelope condition, and minimum cross-correlation function. However, we may obtain the optimized baseband signal waveforms using numerical calculation.
2.2.1. Restriction on the Symbol Boundary Condition
As is shown in [11], if , , , , are continuous without skipping, and is finite, then there is no skipping in the end point of the interval (i.e., the power spectrum of could decay rapidly with the frequency). Herein, assuming that function is within the interval , it should satisfy the following boundary condition [1]:
2.2.2. Restriction on the Single-Symbol Signal Energy Condition
Considering the signal with the length of 4T, the energy per transmission can be expressed as
2.2.3. Restriction on the Constant-Envelope Condition of the Quadrature-Modulated Signal
The constant-envelope modulation represents that the envelope of the modulated wave should be constant, the generated modulation signal is band-limited by the transmitter, and only a small spectrum spreading is produced after the signal passes through the nonlinear processing components [12]. Thus, the following conditions should be satisfied with t in the interval
Since the signal is symmetric, we only need to satisfy Equation (5) for t in the interval . Then, the condition will be satisfied in the rest of the initial interval; i.e., . In this case, the four symbols in the interval are defined as . The baseband signal of and in the interval can be written as
where , , , are the uncorrelated binary data symbols, each taking one of the values . The different conditions are as follows: For , the adjacent baseband symbol signals take the same sign in the I channel.
If , the adjacent baseband symbol signals take the same sign in the Q channel, and to meet the constant-envelope condition, we should introduce the attenuation factor r in , yielding
If , the adjacent baseband symbol signals take opposite signs in the Q channel, we have
The constant value of the envelope is set to be , which is the value of at time , and is also the maximum value of the signal . To ensure that the modulated signal always has a constant envelope in the interval , the constant-envelope condition is rewritten as
Similarly, if , the adjacent baseband symbol signals take the opposite signs in the I channel. The constant envelope conditions may be obtained as
Thus, the constant-envelope conditions in the interval can be expressed as follows:
2.2.4. Restriction on the Minimum Cross-Correlation Function
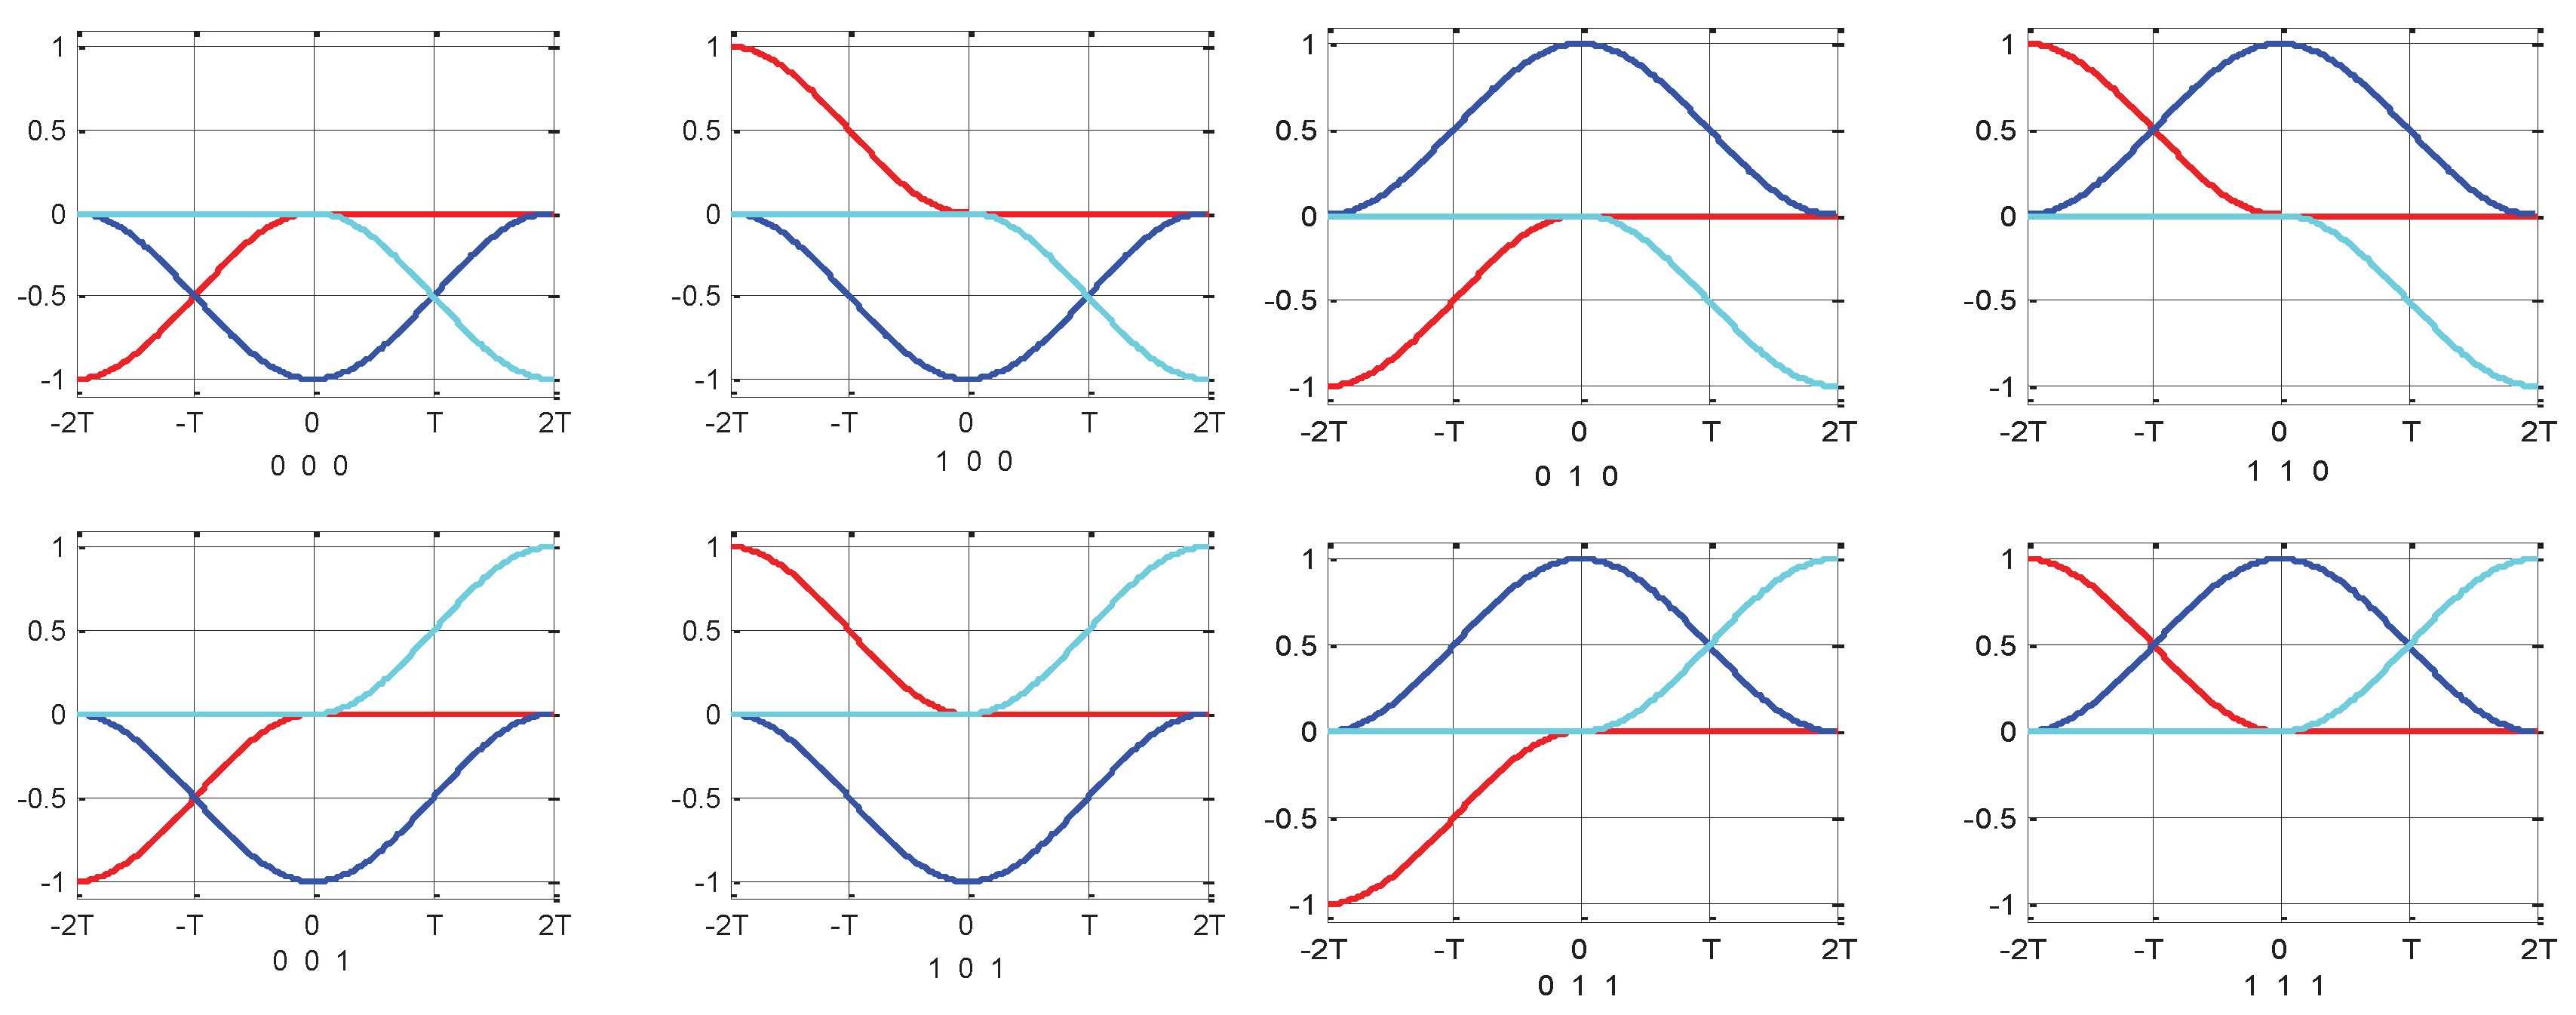
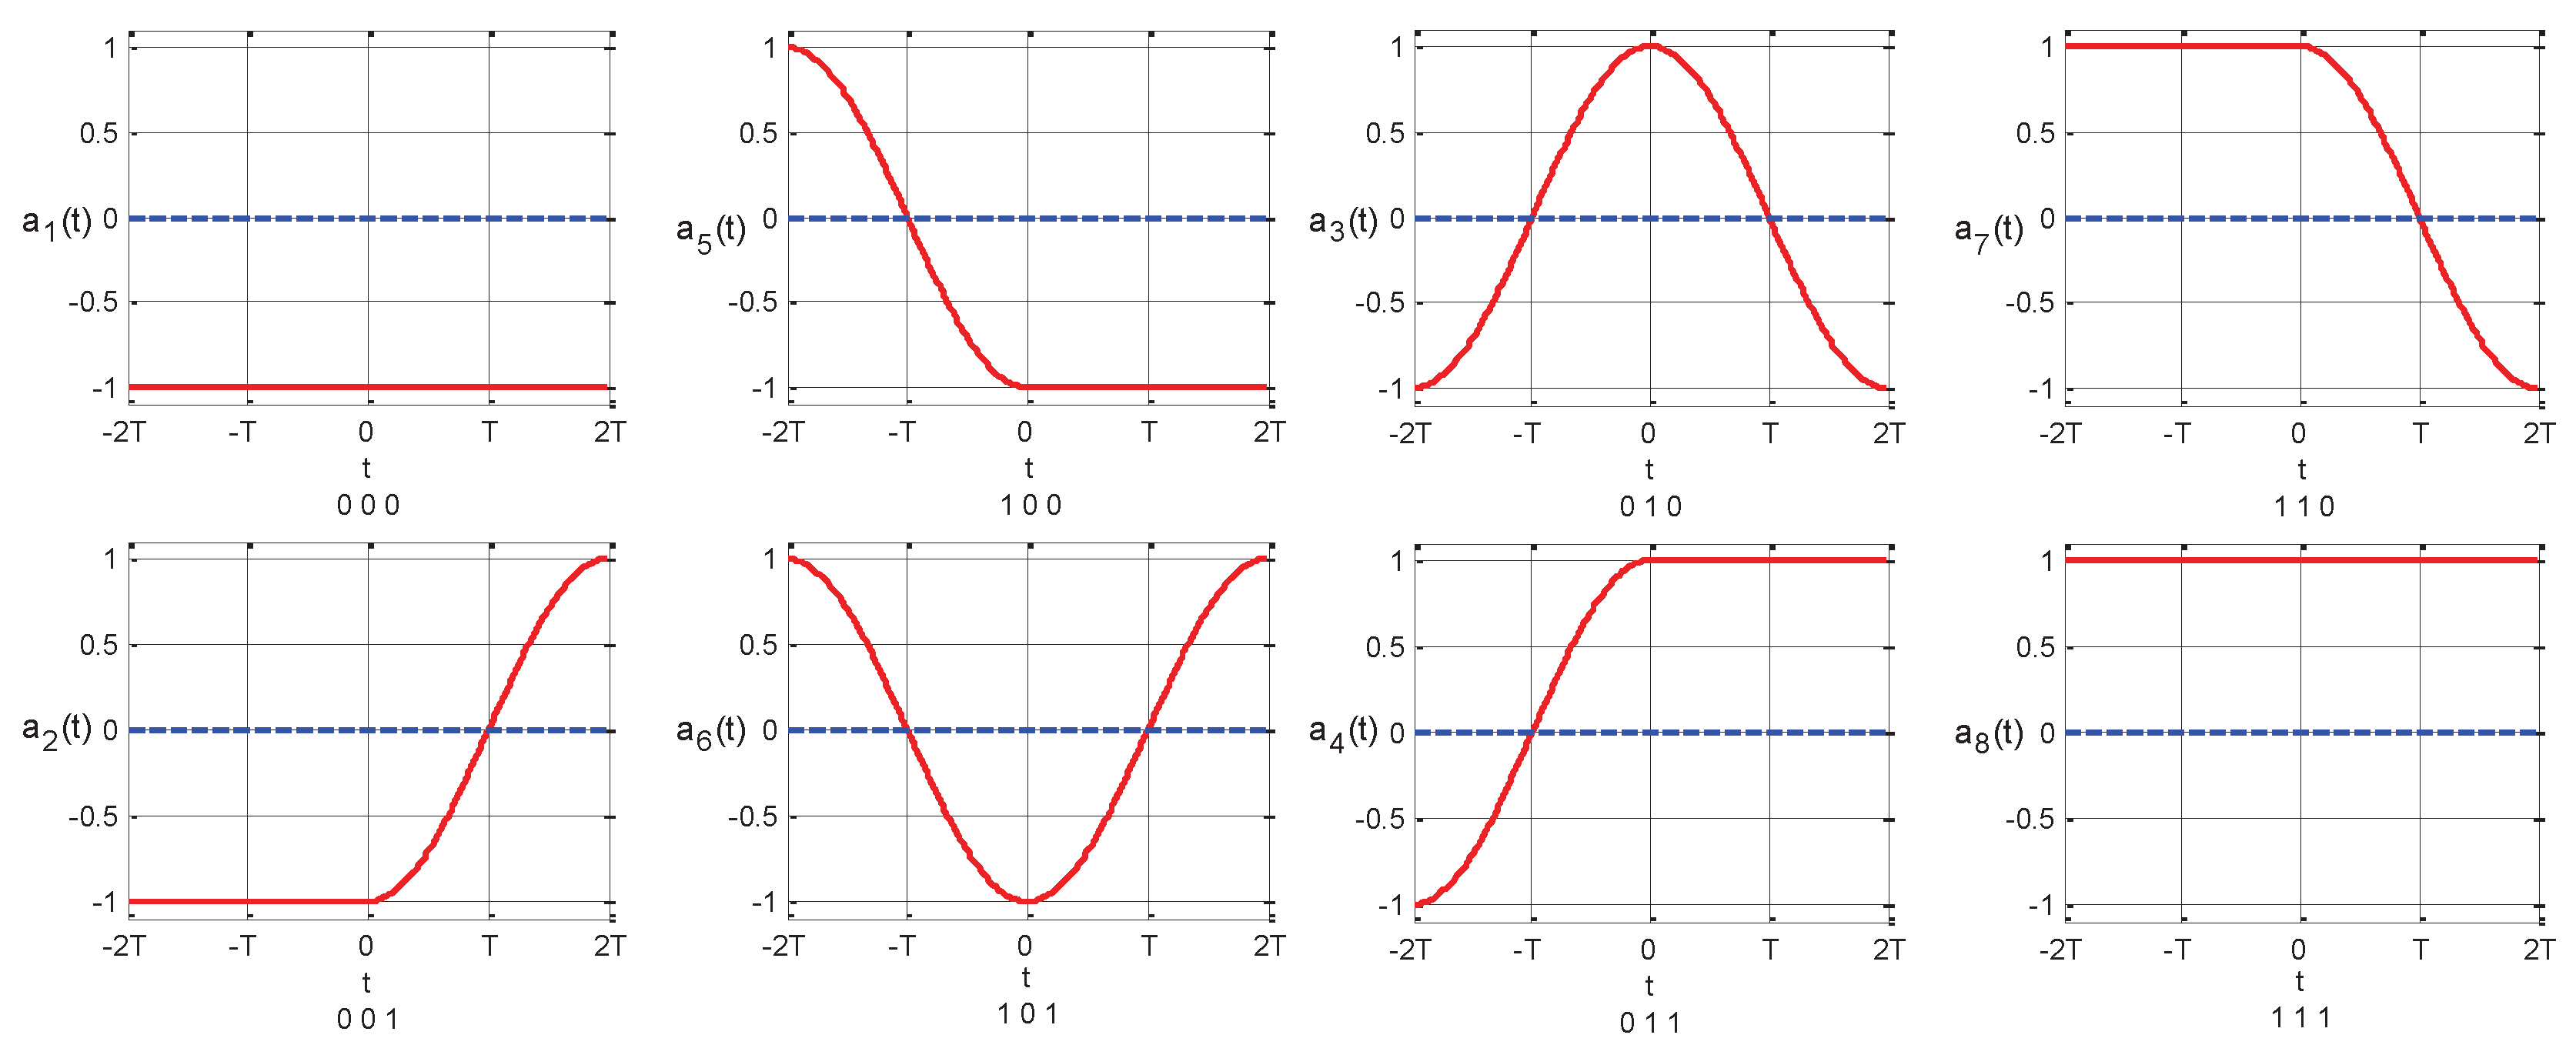
The intersymbol interference (ISI) lowers the correlation performance in a partial-response system, increasing the bit error rate (BER). In order to improve the receiving reliability, additional restrictions are introduced, including single-symbol energy, boundary condition, constant-envelope, and minimum cross-correlation function. Three random baseband symbols and eight types of waveforms exist in the interval , in orthogonal or in-phase channel. Eight different waveforms yield 36 combinations in Euclidean distances. We may express the minimum Euclidean distance between each two waveforms as
where is the waveform in the interval , . Figure 2 shows all possible composed modes of three random baseband symbols in the interval . In contrast, Figure 3 plots the synthetic waveform of three random baseband symbols in the interval . Table 1 lists the Euclidean distance between two waveforms.
We obviously see that decreasing K leads to increasing the minimum Euclidean distance, for a constant symbol energy E. Therefore, the minimum cross-correlation function K may restrict the improvement of the BER performance. The autocorrelation function in can be defined as
we have
Introducing the Fourier series and additional restrictions, single-symbol energy, constant envelope condition after modulation and minimum cross-correlation function, the Pan-function can be expressed as
where ,, and are Lagrange constants. H is the Lagrange function.
2.3. Signal Solving Process Using Fourier Series
A periodic function in the interval may be expressed by Fourier series expansion [13]. Therefore, the efficient spectrum signal —as an even function with the width of —can be written as
where
Based on the extreme value theory of the variational calculus [14], Equation (21) should satisfy the following partial differential equations
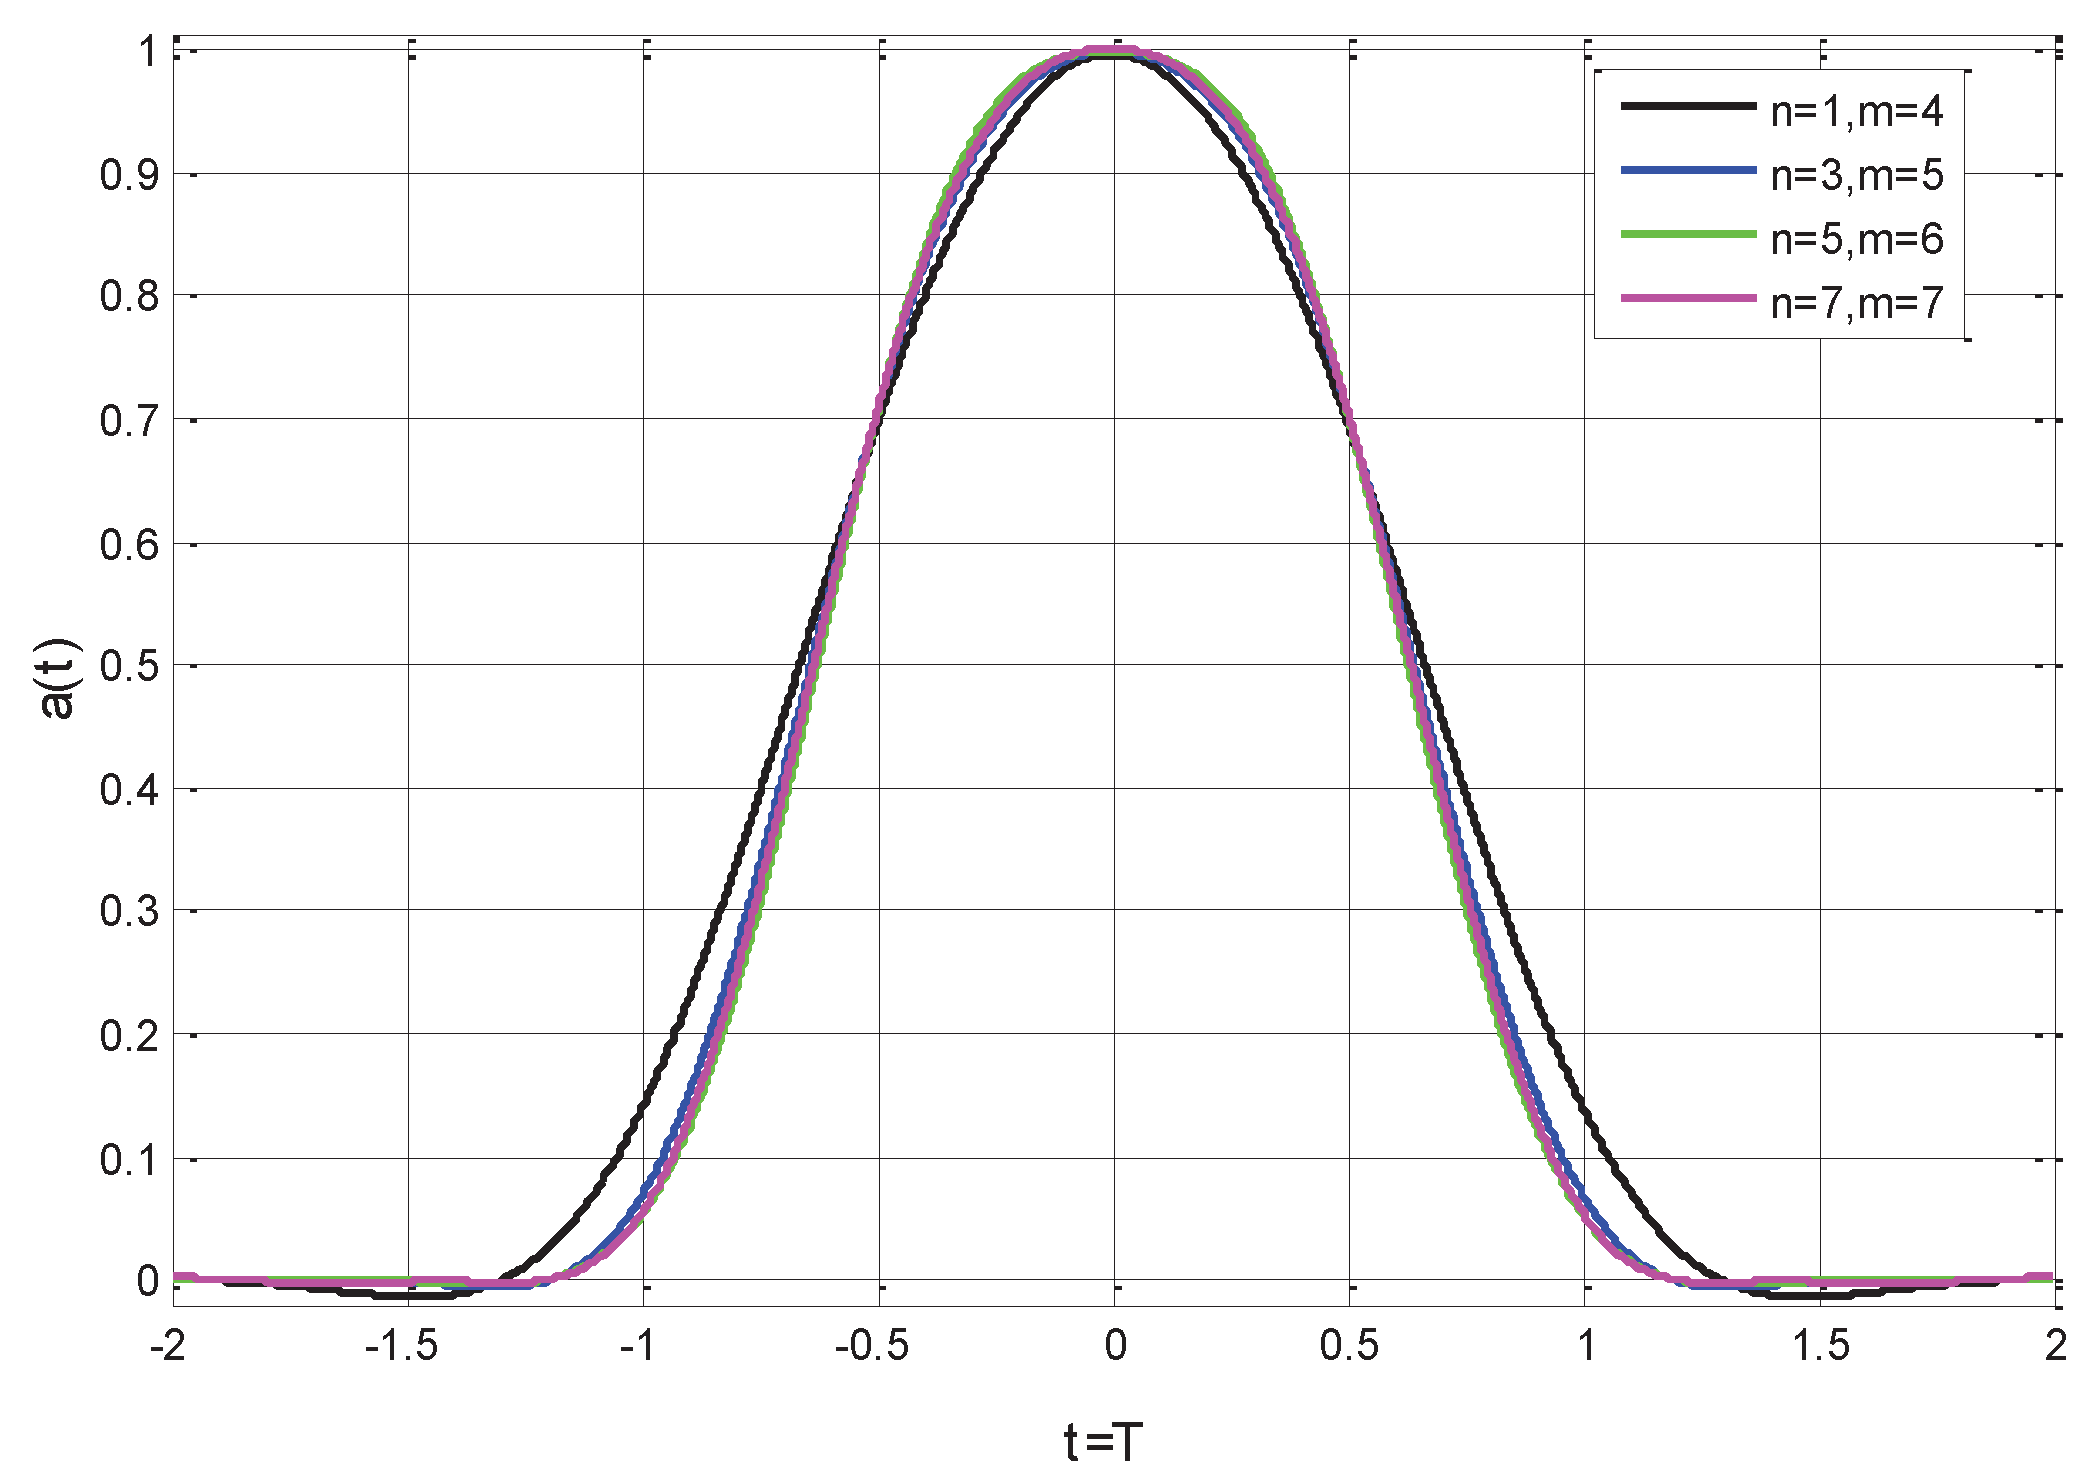
The normalizations are defined as and . Thus, the coefficients, , , …, of the Fourier series, and the Lagrange constants, and , are the unknown parameters. The solution of simultaneous equations is used to determine the values of the unknown coefficients, , , …, of the Fourier series. We introduce envelope fluctuation coefficient to determine the constant envelope properties. The envelope fluctuation coefficient is defined as
where represents the maximum value of the envelope and denotes the average value of the envelope. Table 2 shows the coefficient of the Fourier series for different m and n. Figure 4 shows the corresponding time domain curves.
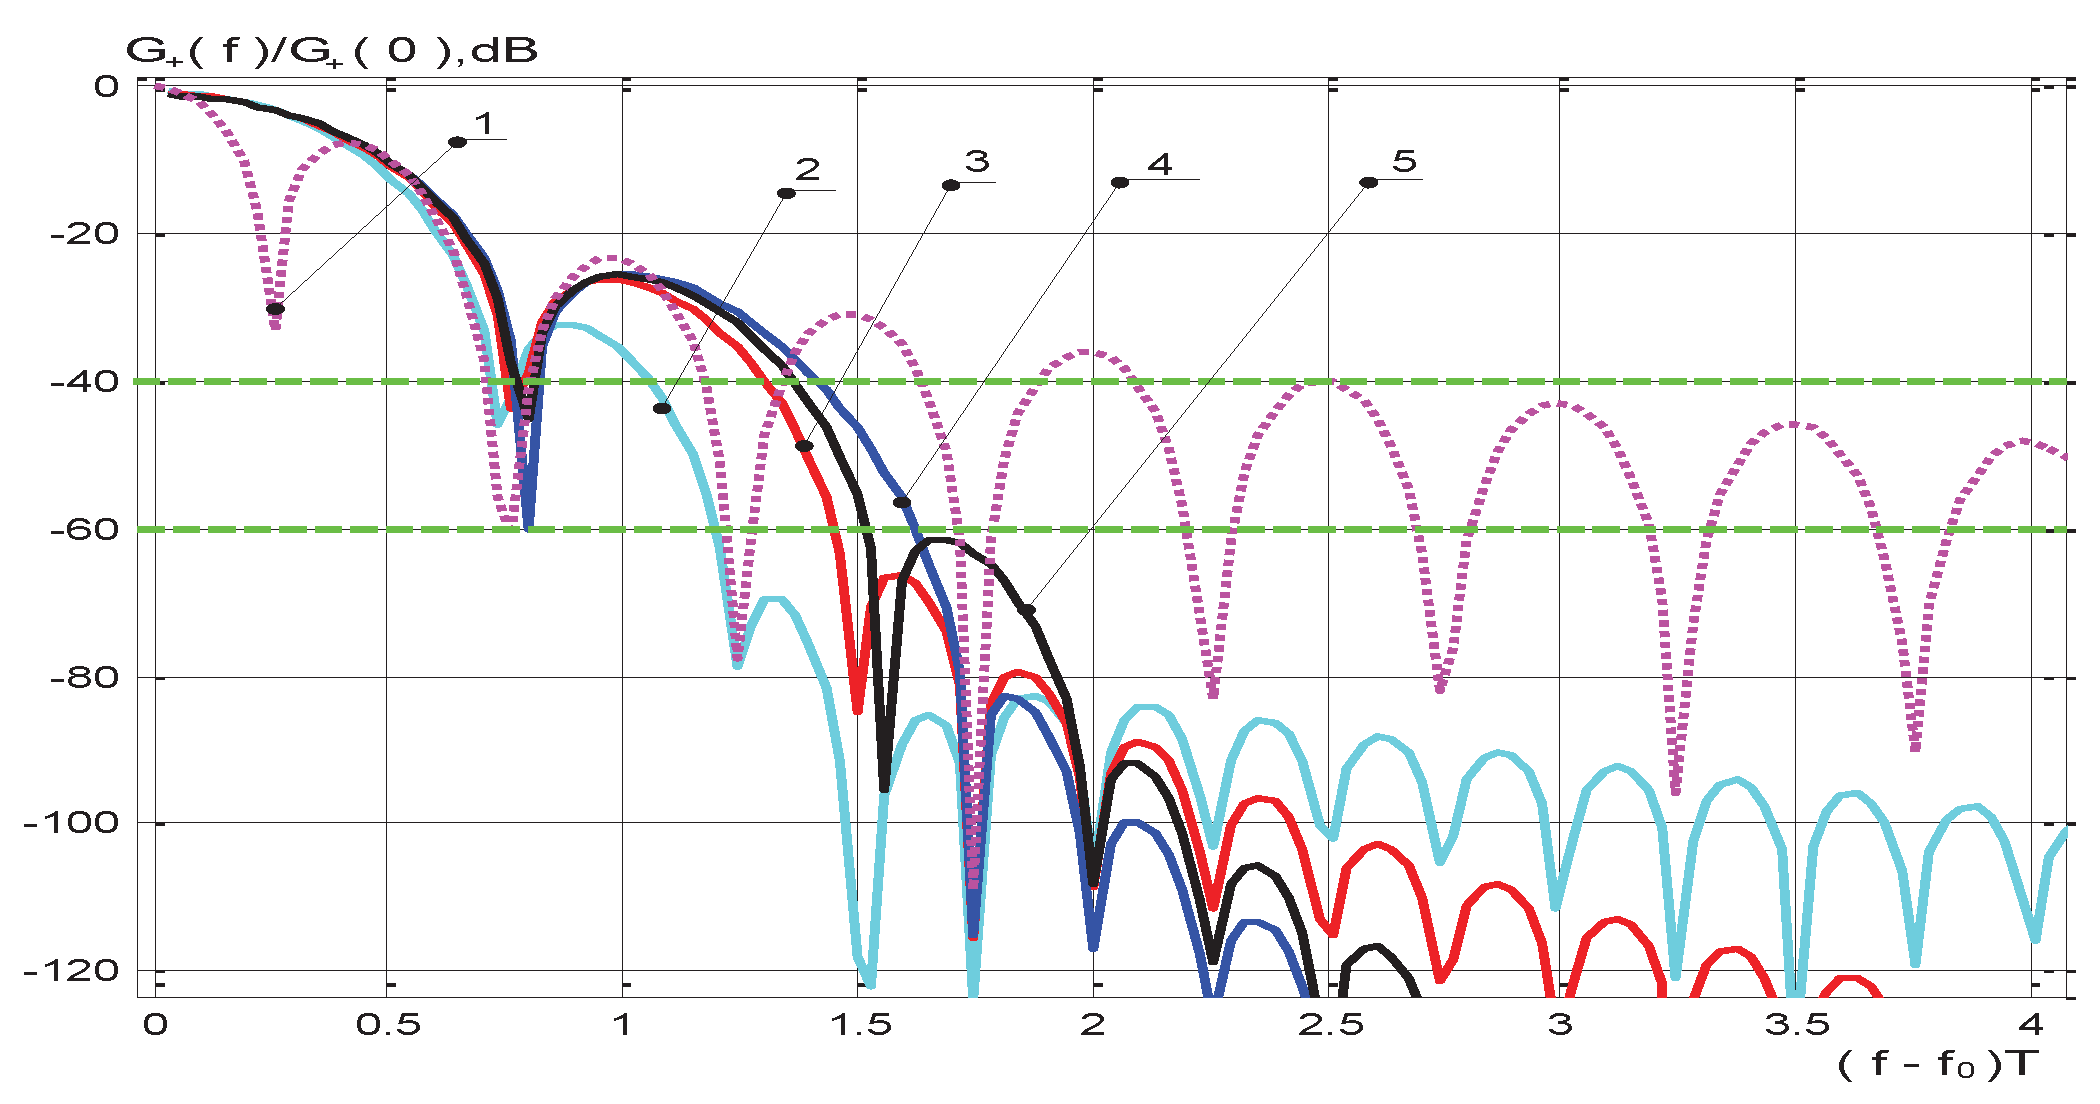
Figure 5 shows the normalized power spectra curves of optimized signal, where curve 1 corresponds to the MSK and curves 2–5 correspond to , , , and , respectively.
Table 3 considers different pairs of n and m, and presents the bandwidth, where the normalized power spectra of the optimized signals decreased as dB () and dB (). Table 3 also lists the value of the bandwidth, where and of the signal energy is achieved (i.e., and , respectively). Besides, the corresponding envelope fluctuation coefficient and the cross-correlation function K of the optimized signal are presented in the last two columns of Table 3.
Figure 5 and Table 3 reveal that for the minimum out-of-band energy radiation criterion with the restrictions, the optimized efficient spectrum signal presents the bandwidth of (for and , calculated according to dB) and (for and , calculated according to dB). Moreover, the bandwidths of and have been decreased to % and % of that of the MSK signal, respectively. This verifies that the signal’s out-of-band radiation is prevented. Applying the optimized efficient spectrum signal as the baseband modulation signal, the modulated signal after the quadrature modulation presents the envelope characteristics. Moreover, the cross-correlation function K of the optimized baseband signal is too small, which reduces the inter-symbol interference and increases the reliability of the receiving.
3. Simulation and Realization of the System
3.1. Scheme of the Modulation and Demodulation Systems
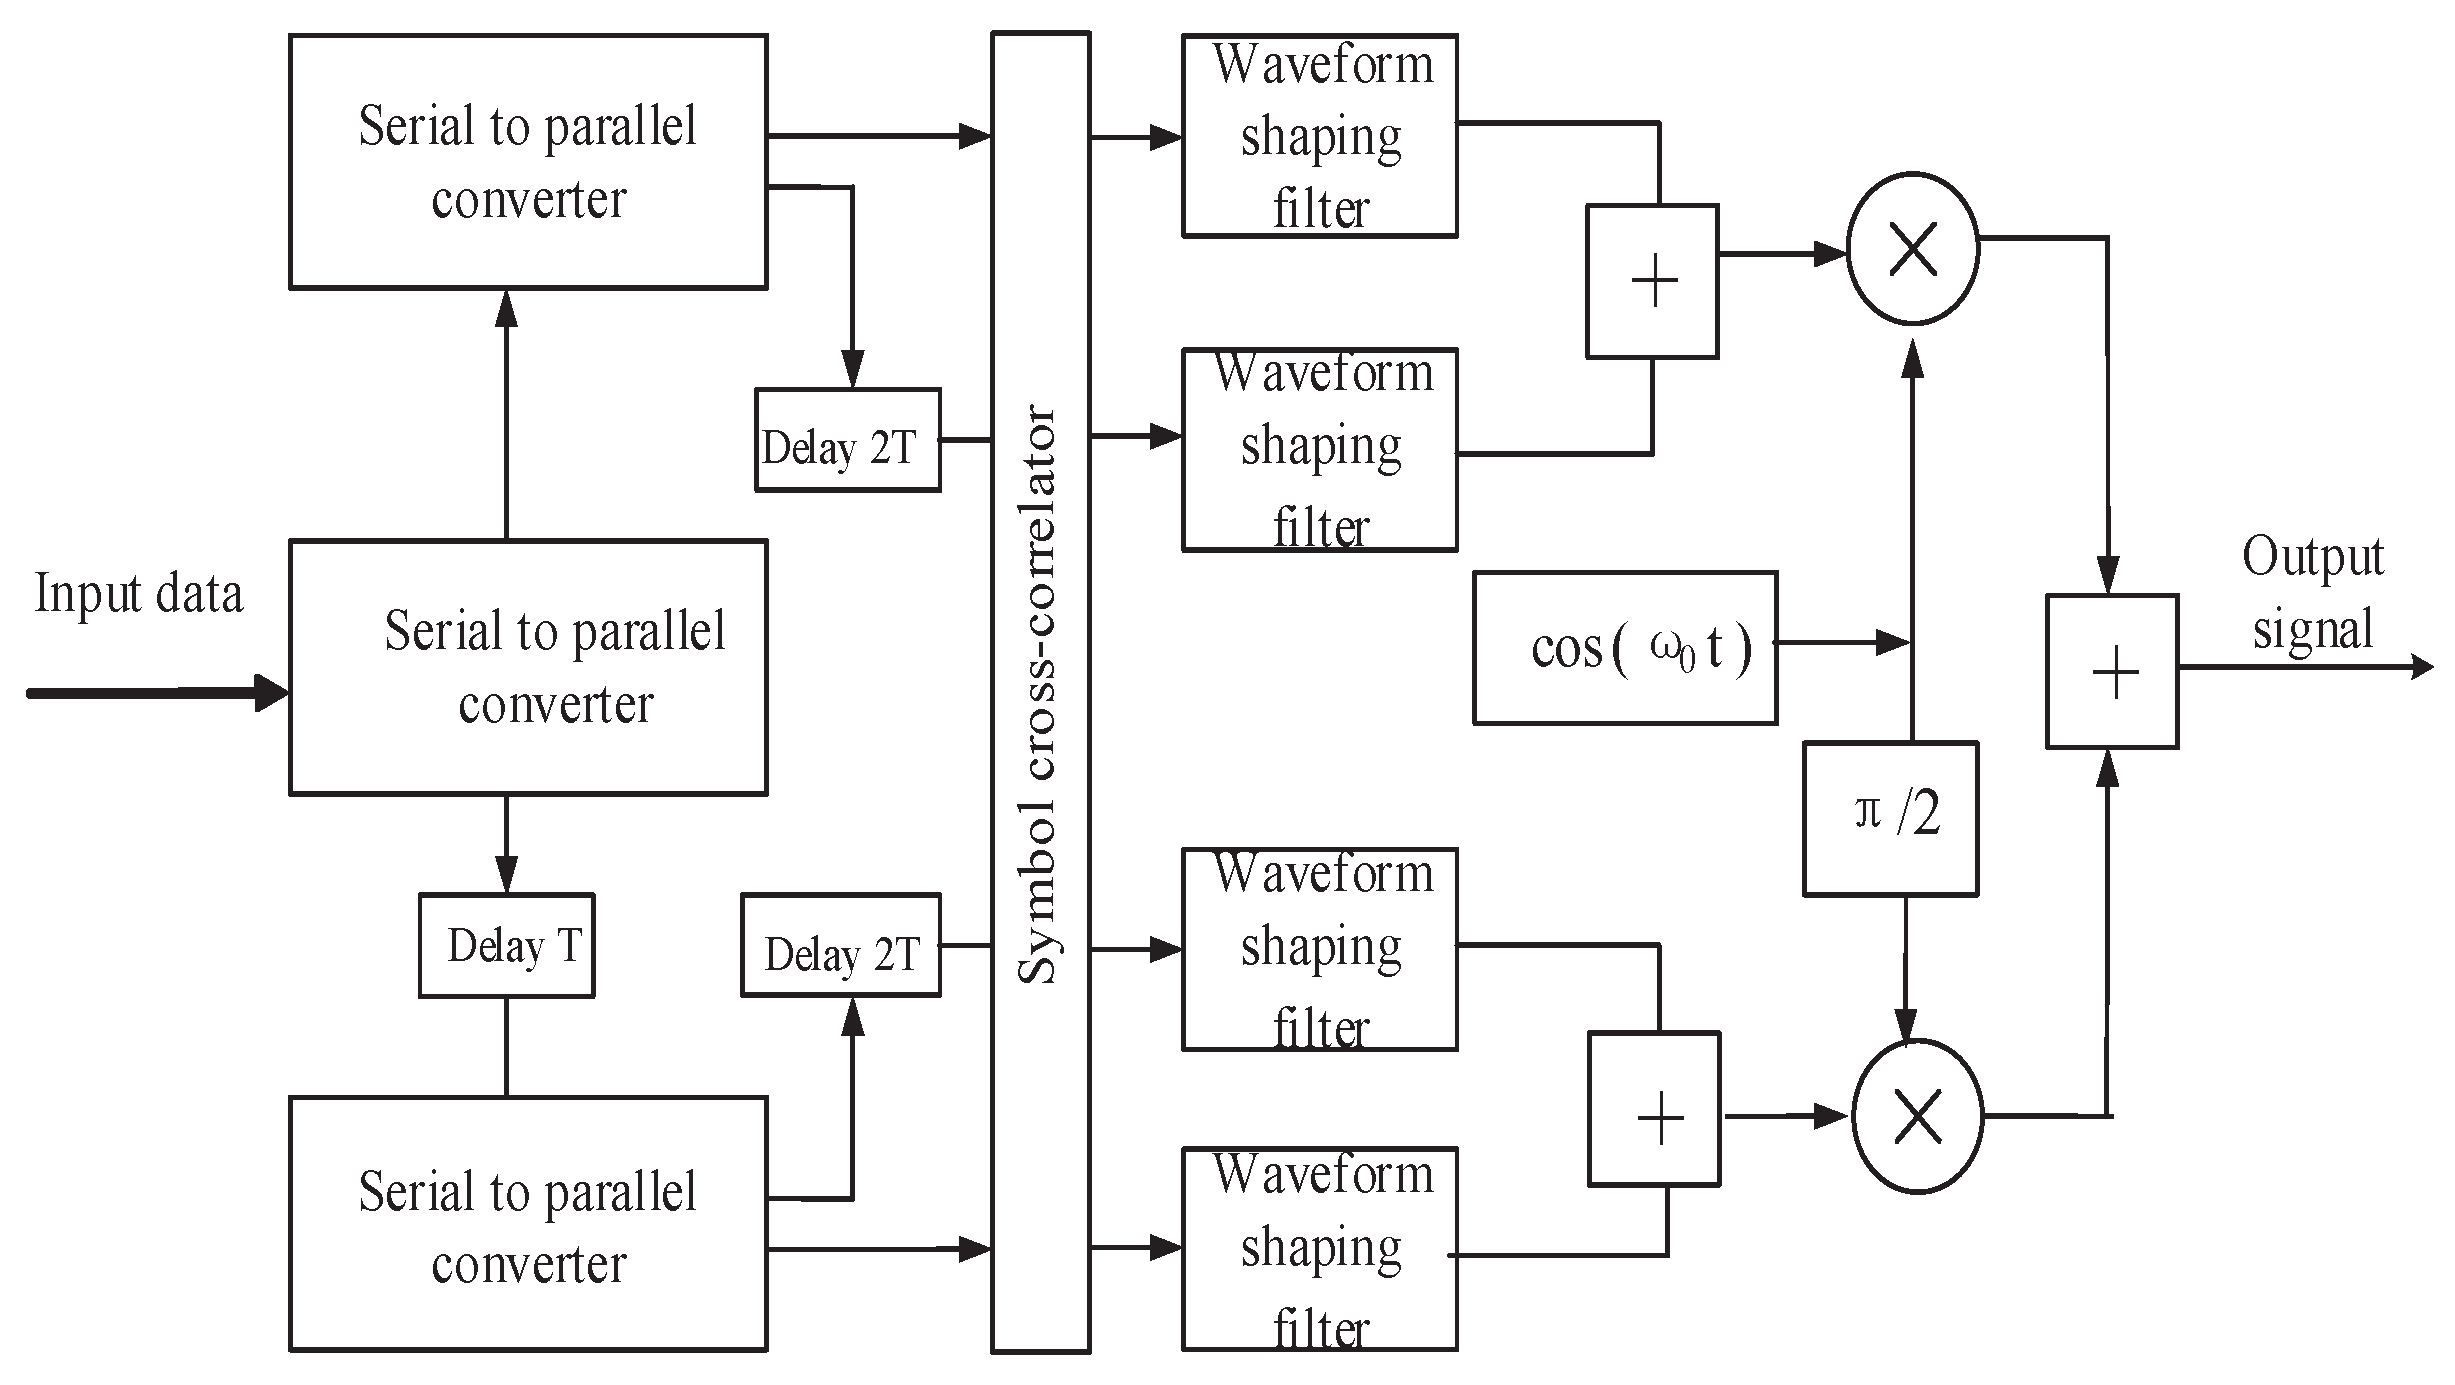
Figure 6 illustrates the block diagram of the adopted partial-respond quadrature modulation scheme. Three serial-to-parallel converters convert the group of symbols , , ∞, with a symbol duration of T into four blocks, each taking one of the values , where the delay time is a different integer multiple of T while the symbol duration has increased to . The symbols enter cross-correlator, and according to the results of the cross-correlation operation, the symbol attenuation factor r was introduced. Then, the output signals of the pulse shaping filter provides the signals and in two channels. The signals and were multiplied to the quadrature carrier and added to achieve the modulated signal.
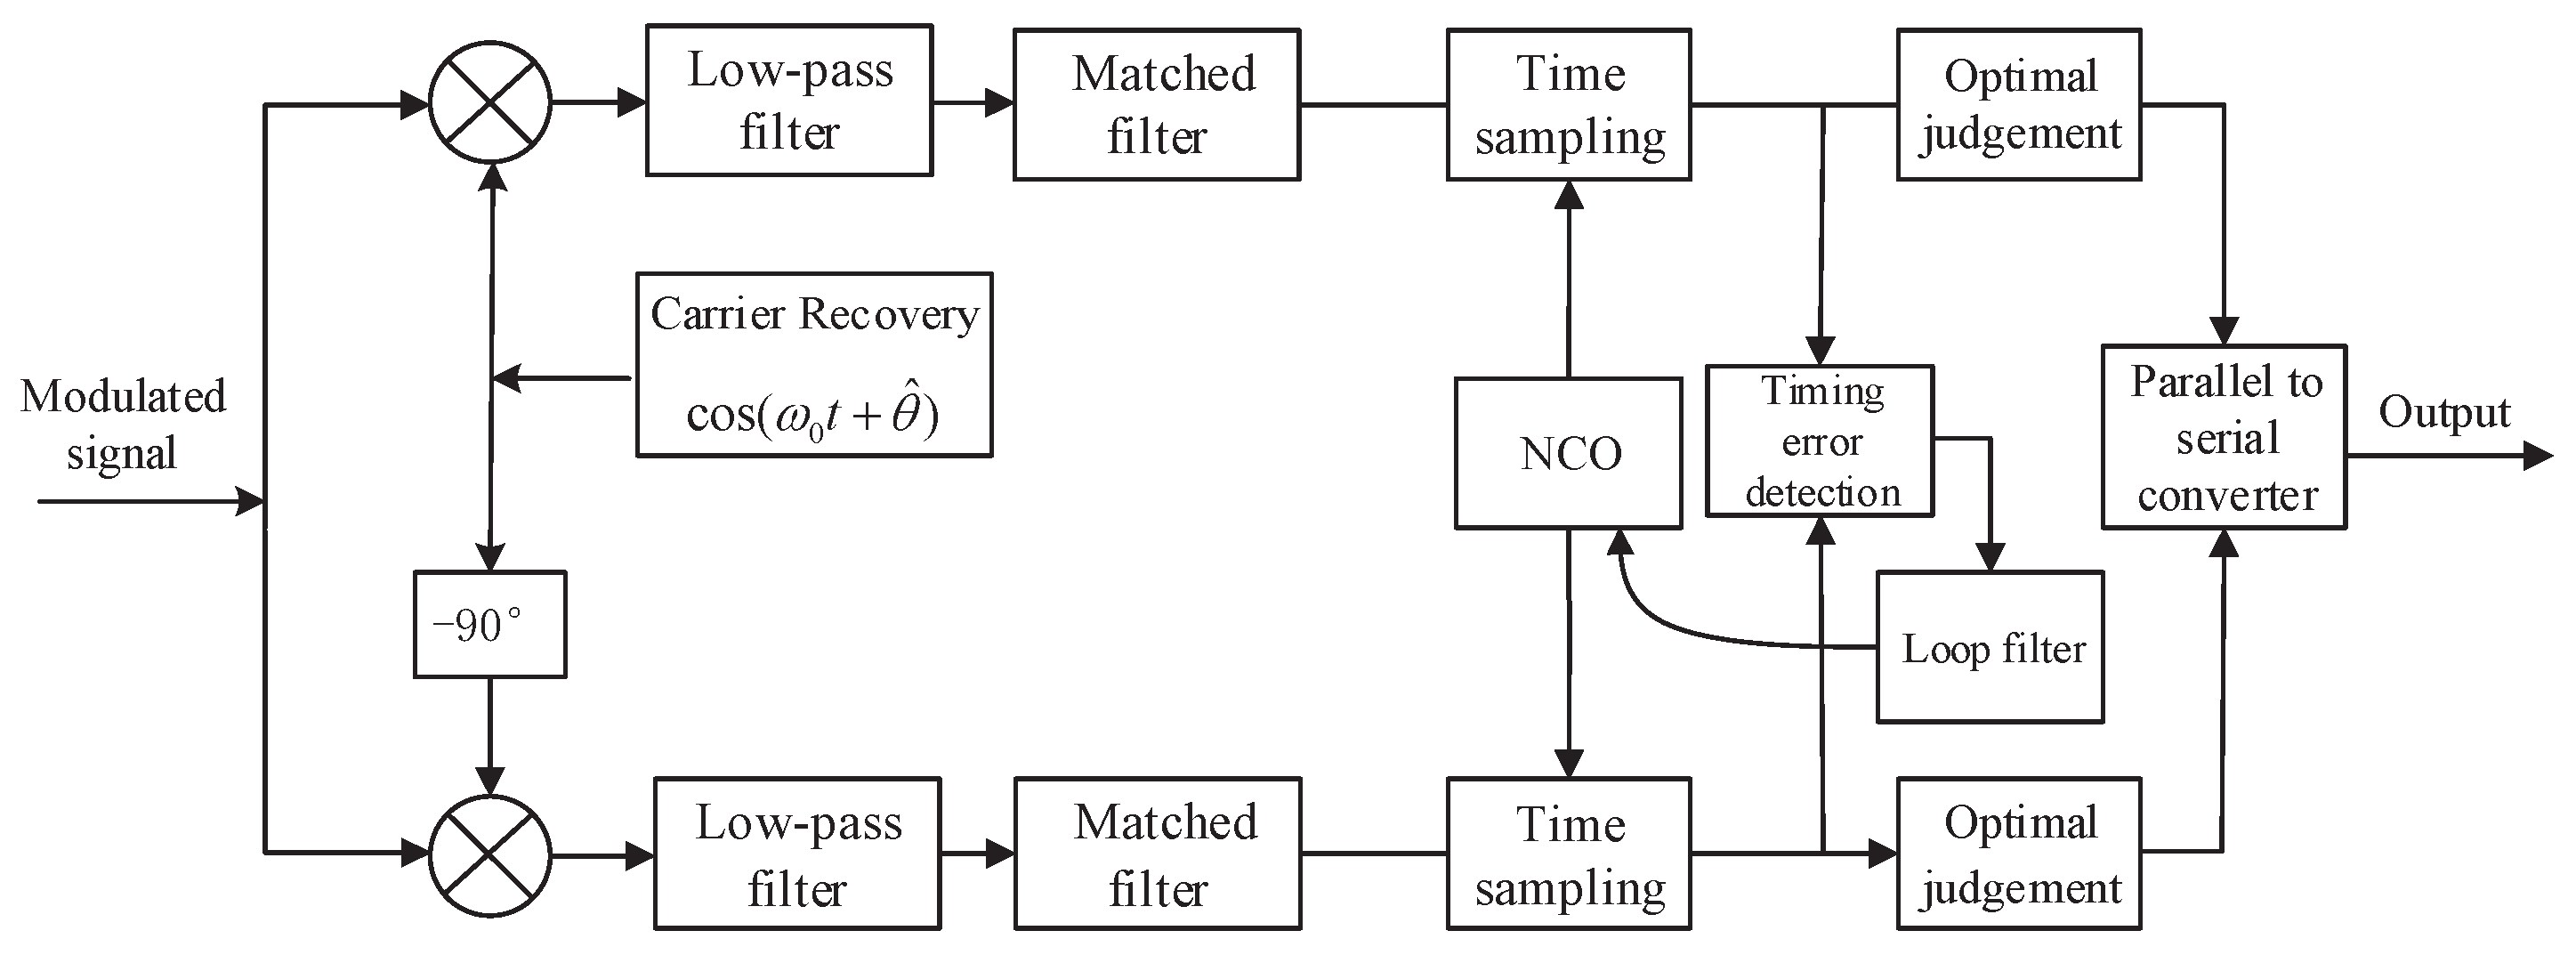
Figure 7 depicts the block diagram representation of the coherent demodulation of the signals. To remove the high-frequency components of the received modulated signal, it is coherently demodulated through the quadrature carriers and the low-pass filters. Since the signal in each channel introduces intersymbol interference, the baseband signal is filtered by a match filter. The signal on each channel is integrated, where the integration time is controlled by the integrator strobe pulse. Finally, the demodulation process follows the sampling, decision, and a converter.
3.2. Simulation Results
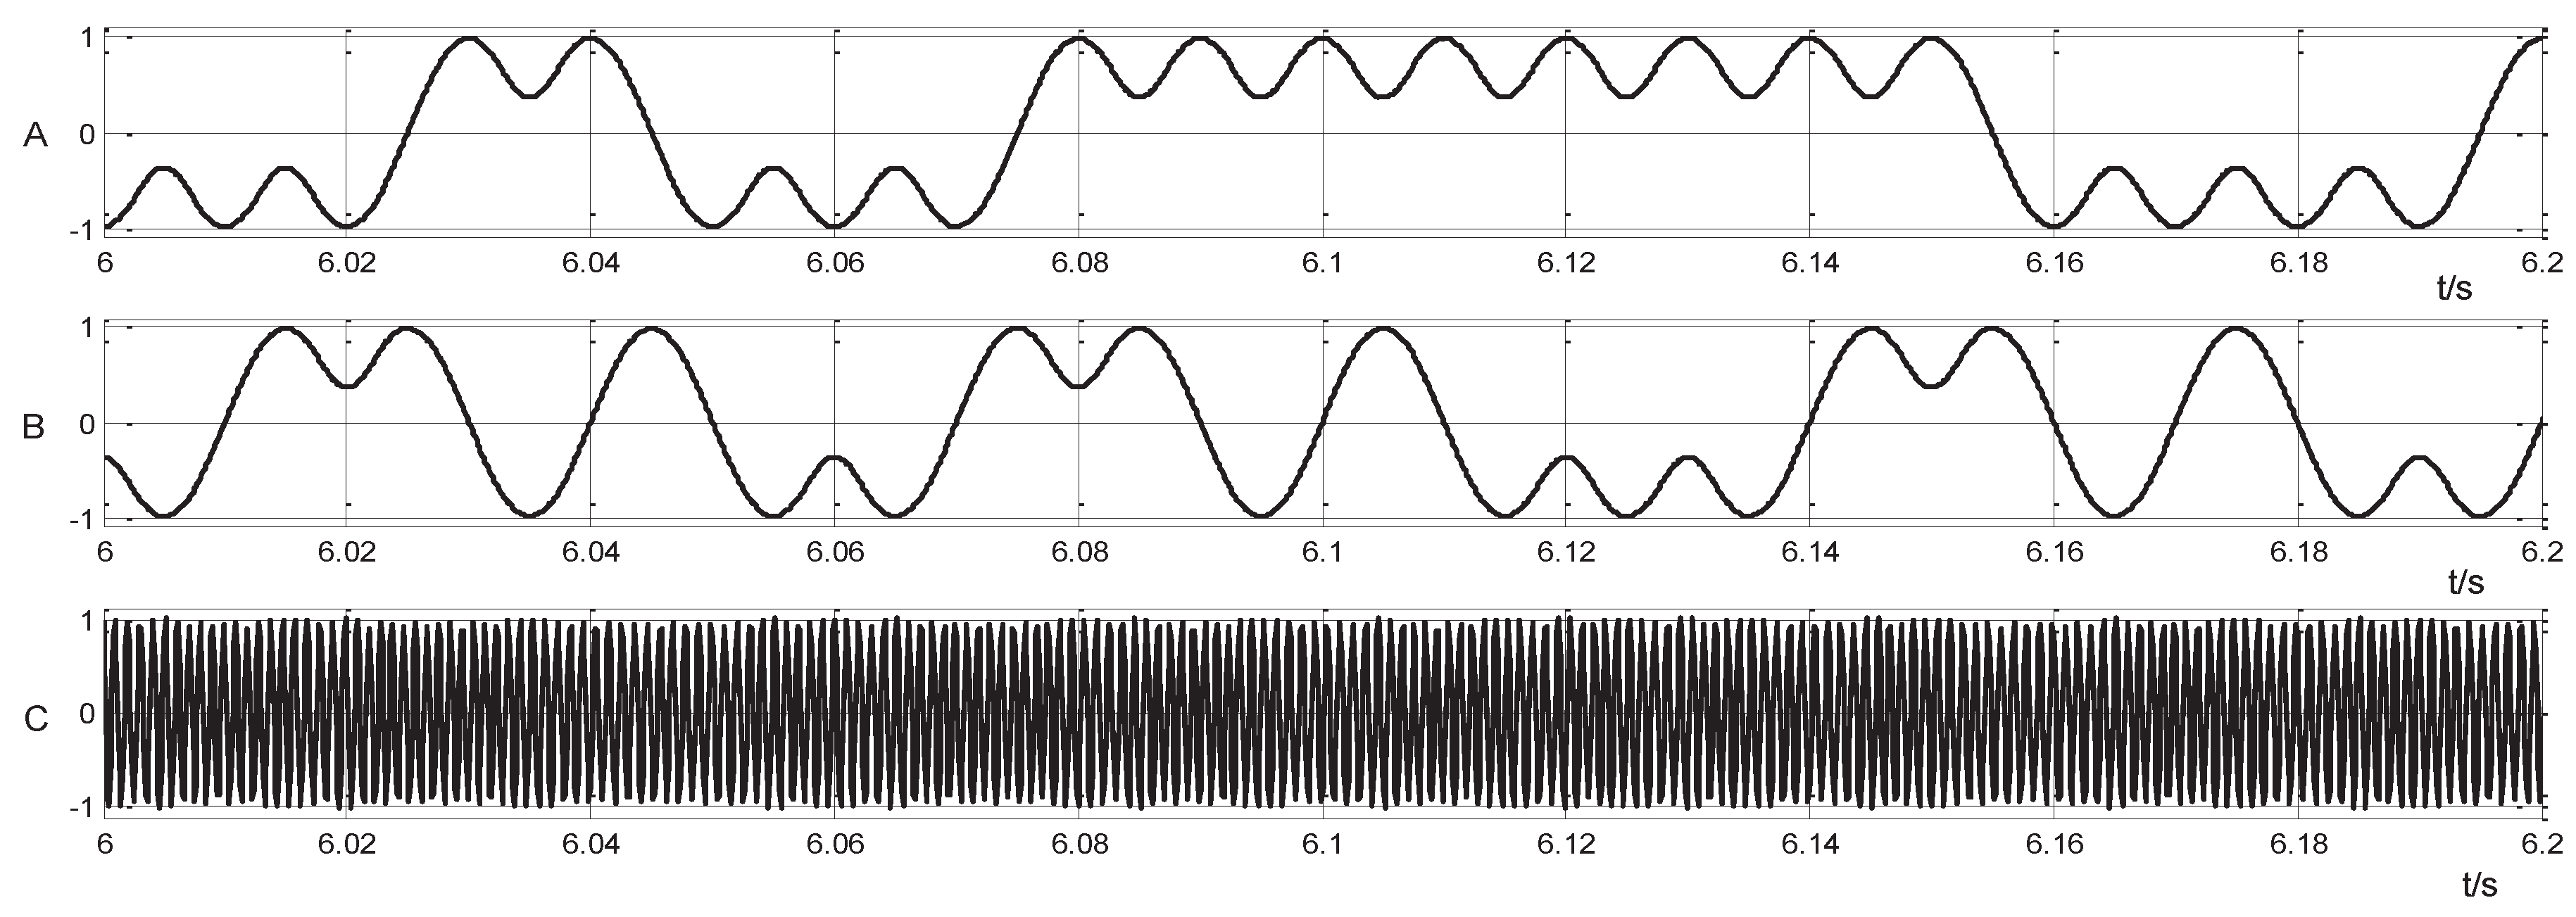
We simulated the quadrature modulation and coherent demodulation using the MATLAB software, where an optimized signal was used for the baseband symbol. Figure 8 presents the simulation results, where A represents the baseband symbol signal transmitted through the in-phase channel, B is the baseband symbol signal transmitted via the orthogonal channel, and C is the quadrature-modulated output signal. The envelope of the output signal after the modulation was found to be constant, and in agreement with the expected results.
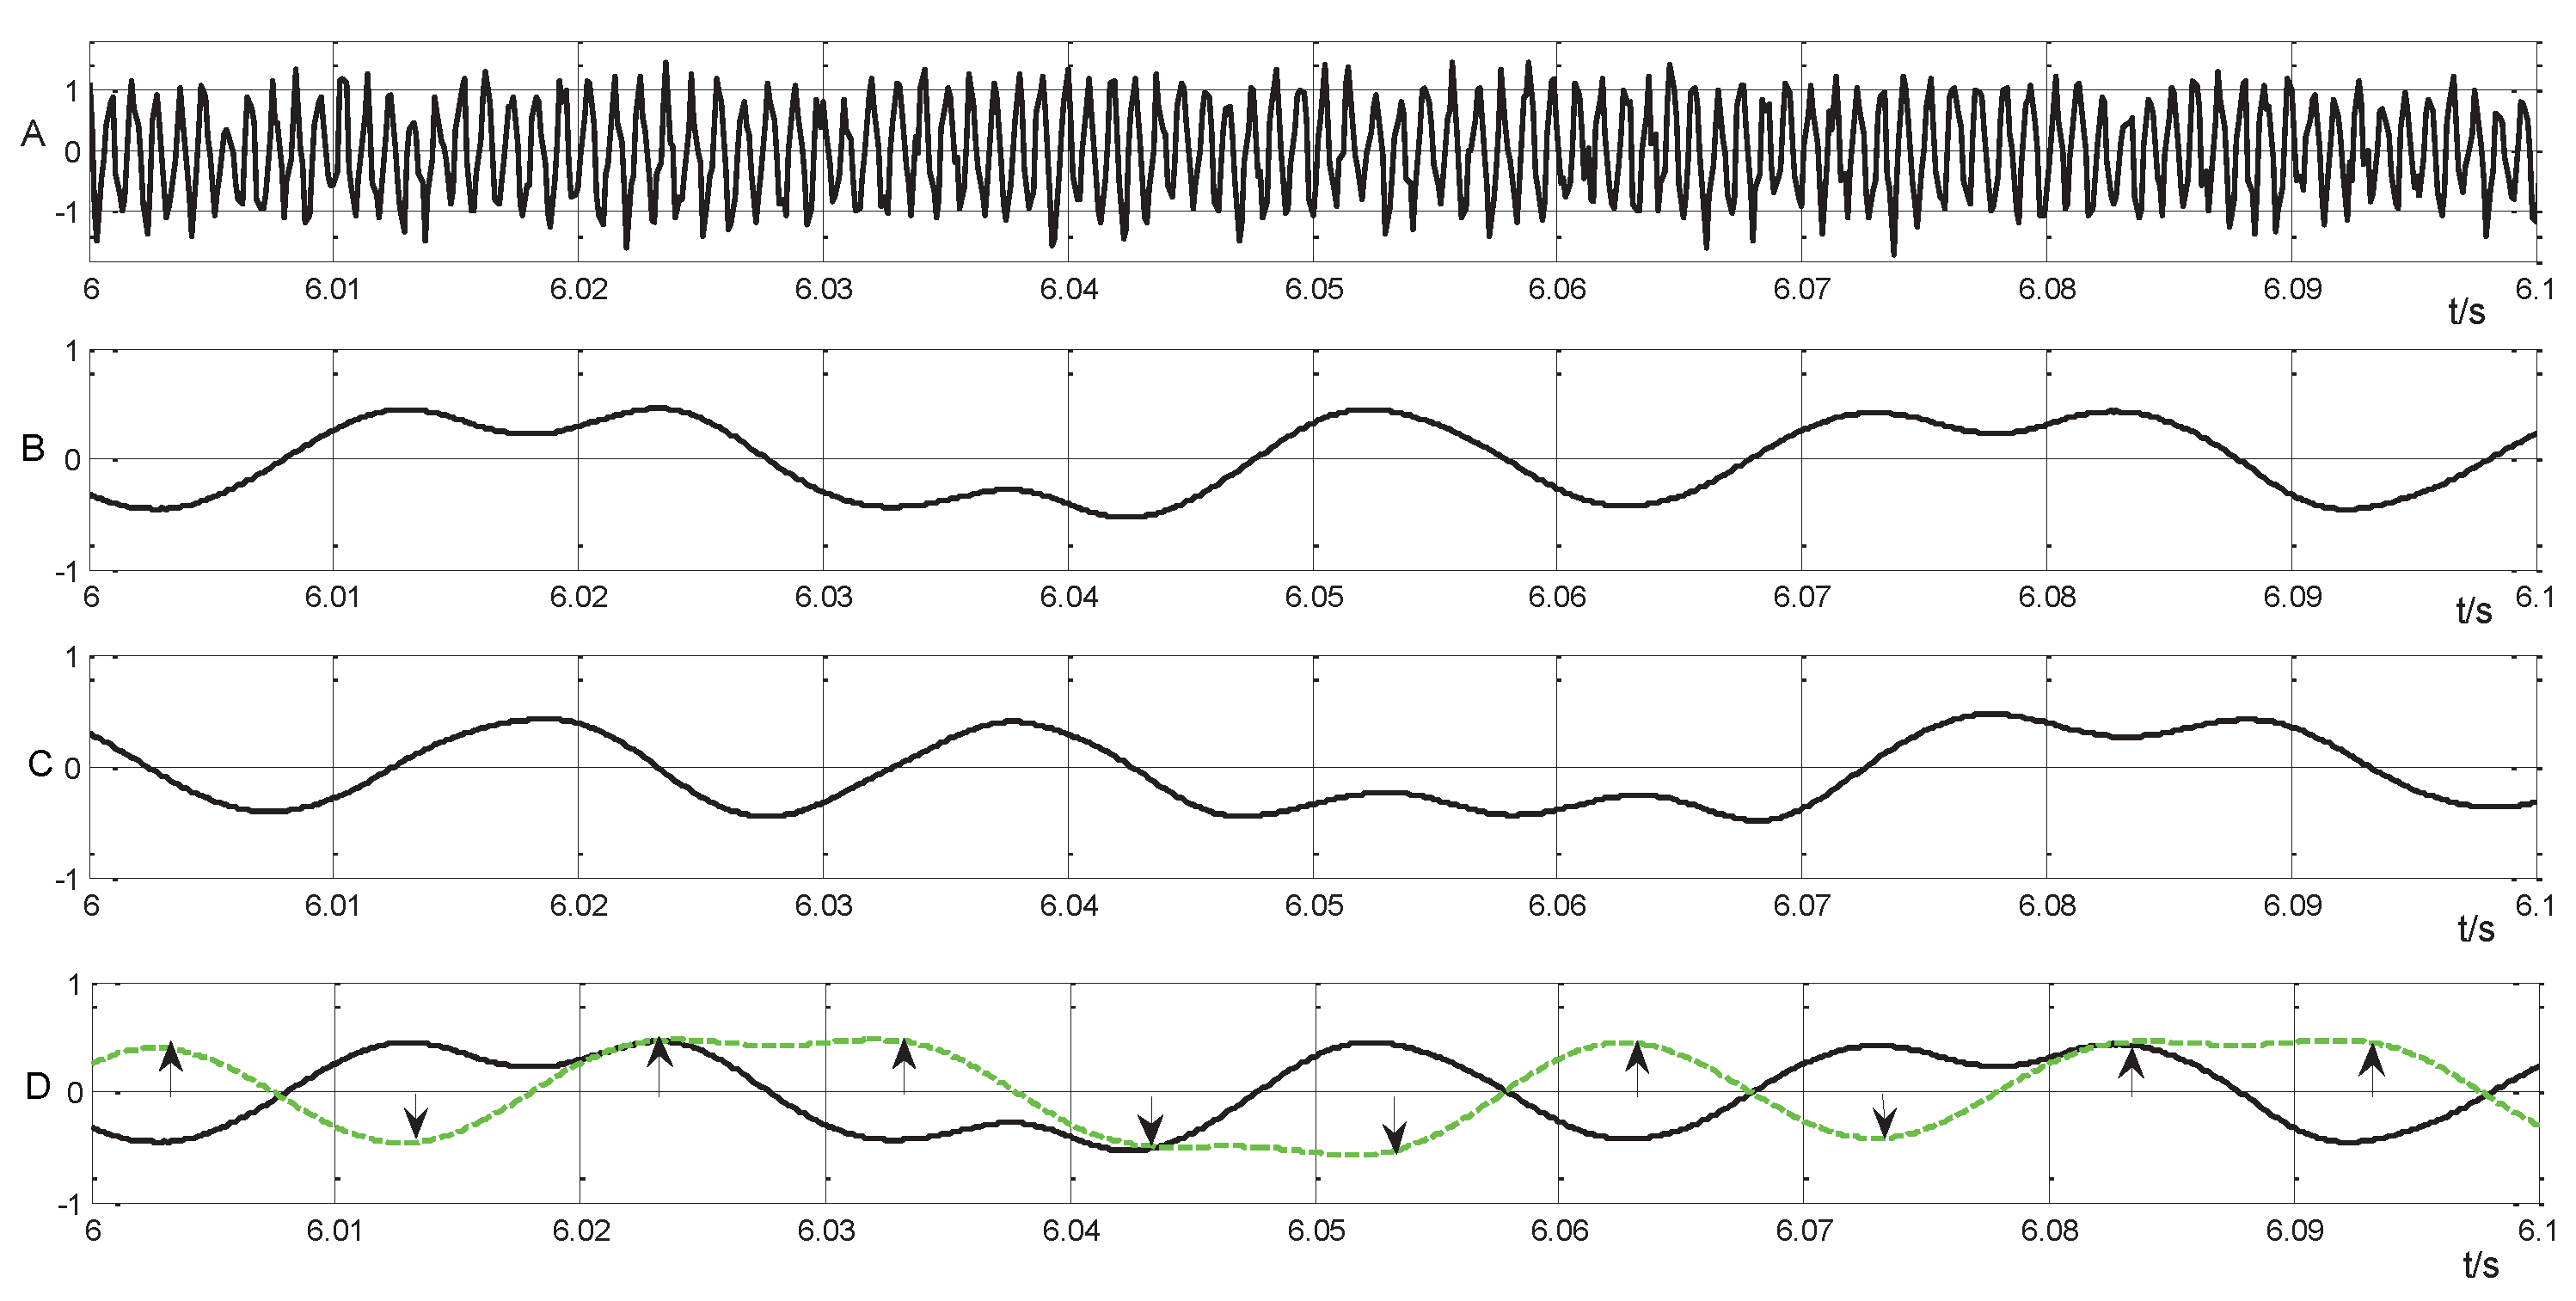
Figure 9 plots the simulation results of the coherent demodulation, where A indicates the transmitted signal corrupted with additive white Gaussian noise (AWGN), which is the input of the receiver, B is the baseband signal demodulated in the in-phase channel, and C is the baseband signal demodulated in the orthogonal channel. The black solid and green dotted lines in D represent the baseband signal demodulated in the in-phase channel and the baseband signal through the matched filter, respectively, while the arrows show the best sampling time [1,15,16].
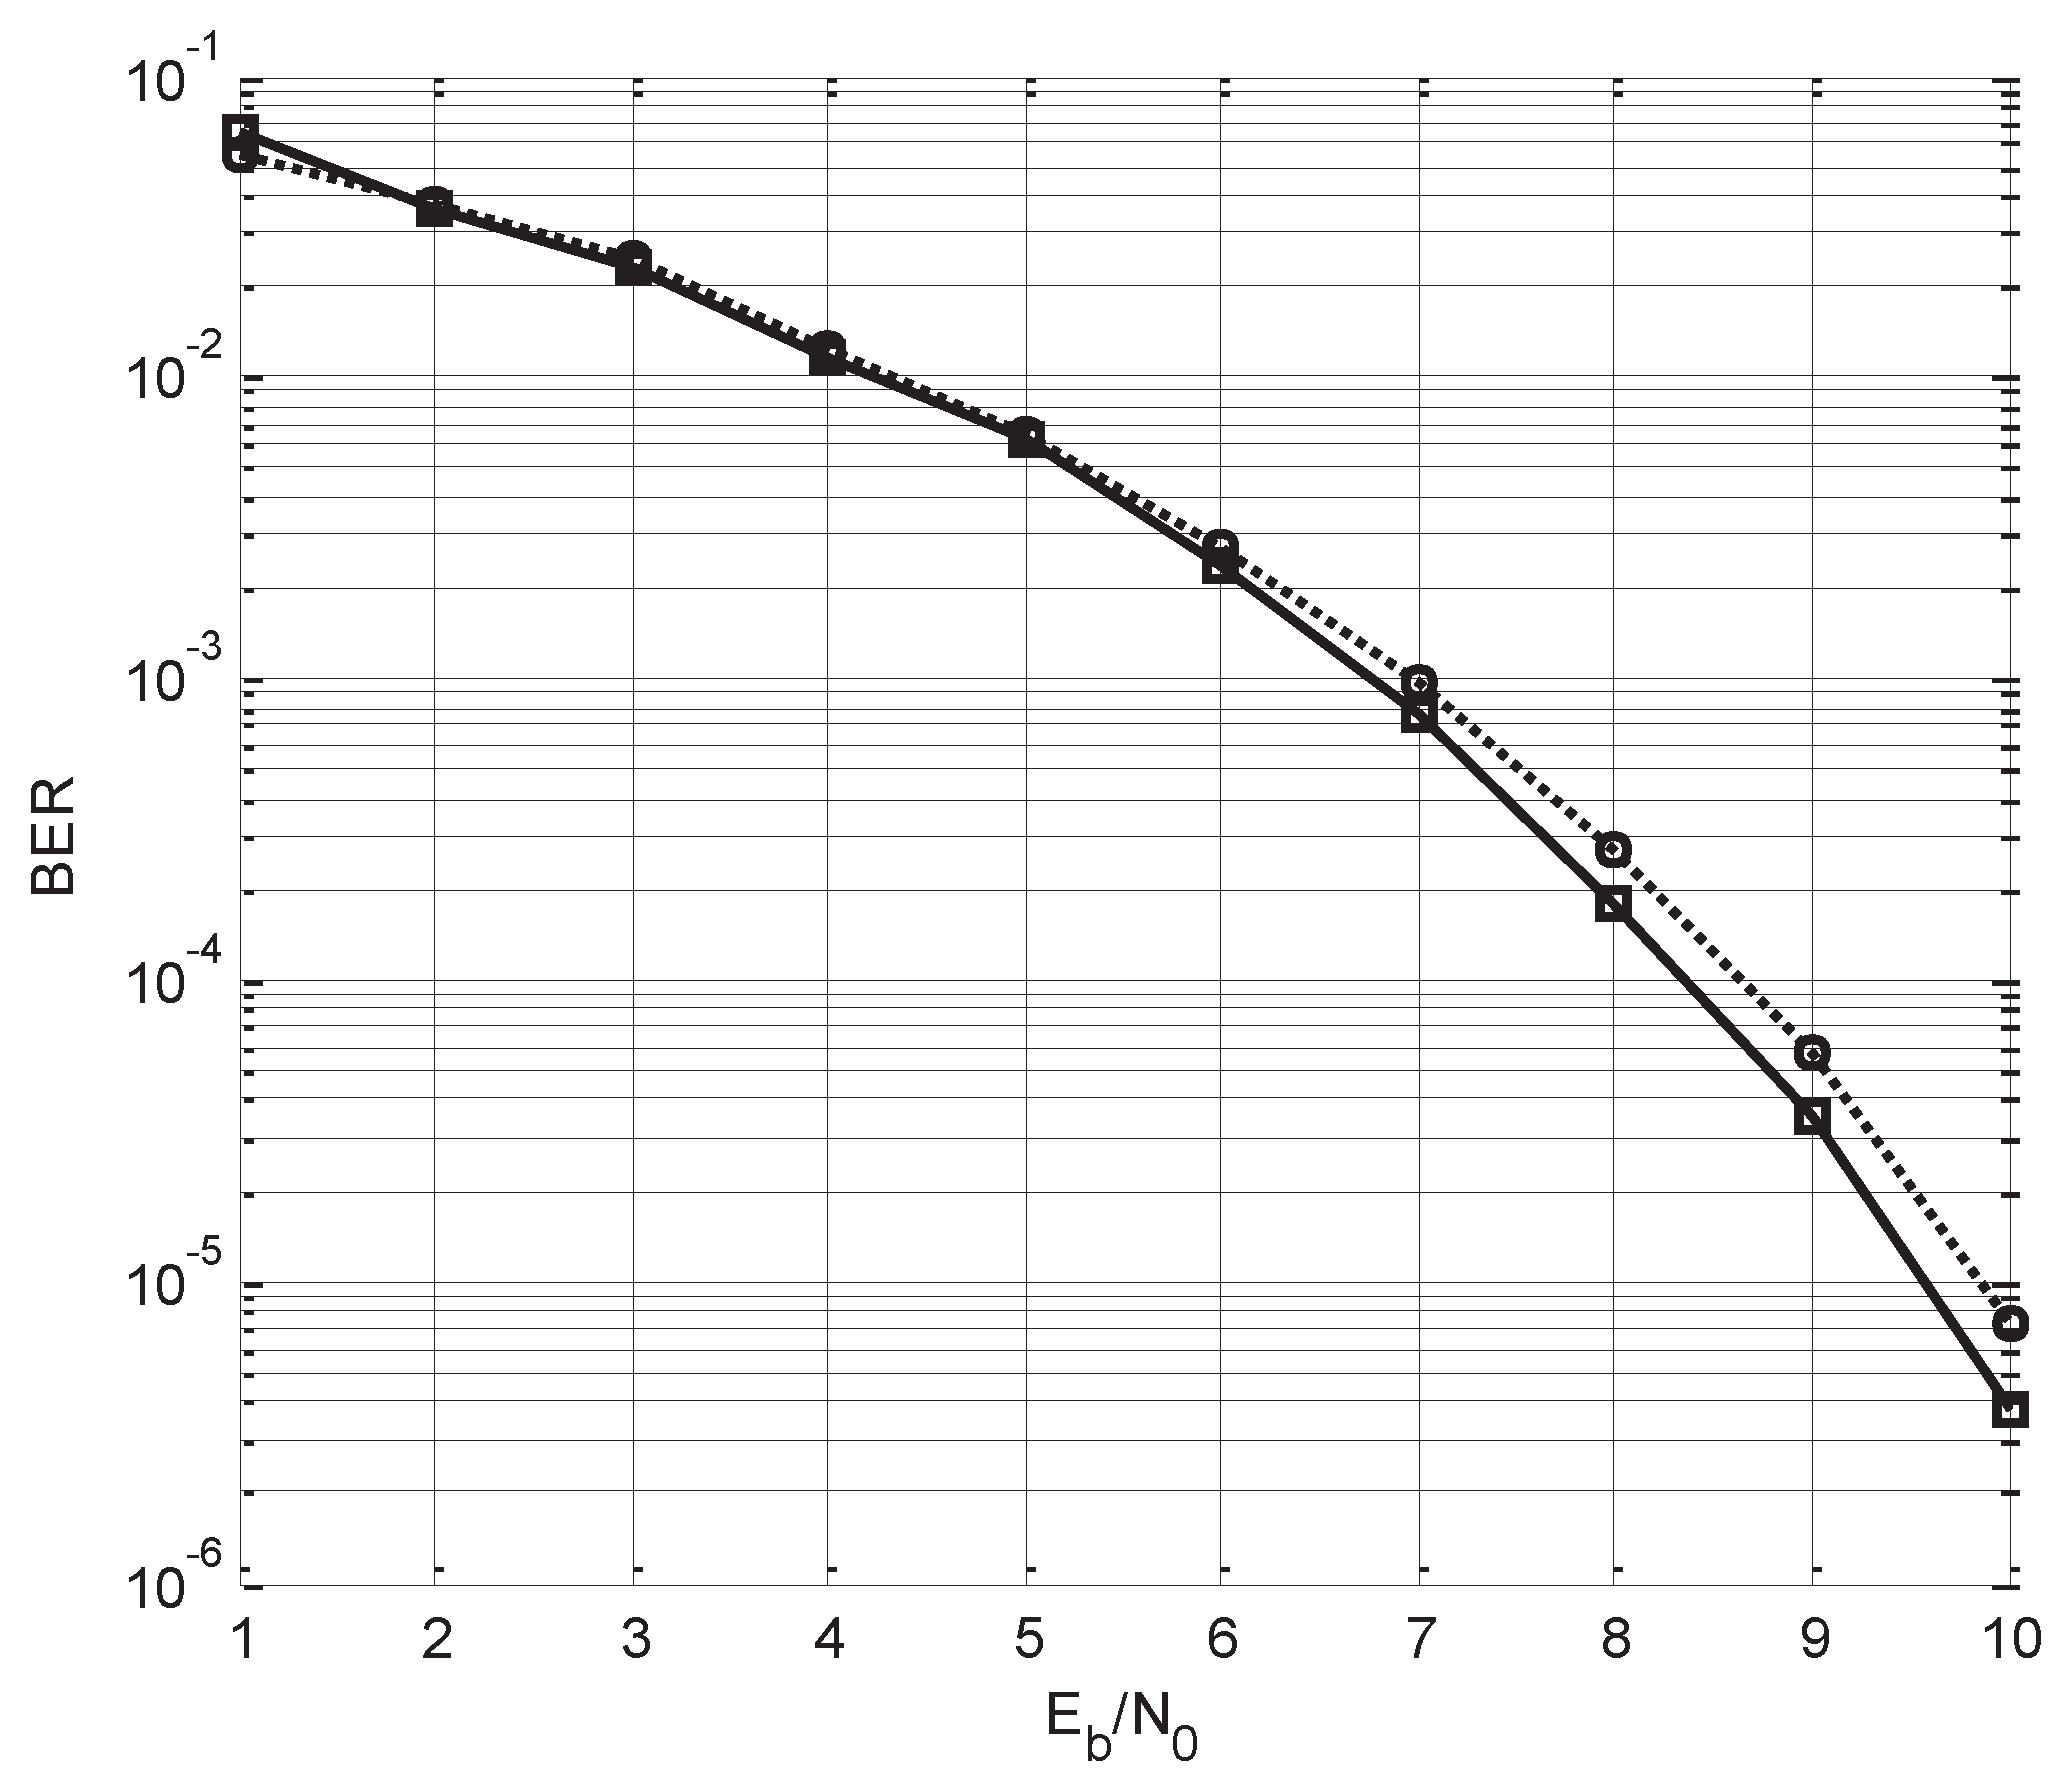
Figure 10 compares the BER performance of the optimized baseband signals achieved with and without minimum cross-correlation function [17]. We may notice from this figure that for small s, the BER performances of the optimized baseband with and without minimum cross-correlation function restriction are close. However, when , the s of the optimized baseband signal with and without minimum cross-correlation function restriction are dB and dB, reducing dB in the requirement of . For, , the s of the optimized baseband signal with and without minimum cross-correlation function restriction are dB and dB, respectively, which reduces dB in the requirement of . The results show that the optimized baseband signals with minimum cross-correlation function have superior spectral efficiency and the BER performance can be improved by introducing the minimum cross-correlation function restriction.
4. Conclusions
A Pan-functional model was established to present optimized efficient spectrum signals based on the minimum out-band energy radiation criterion. The achieved signals provide higher out-band spectral roll-off rate with quasi-constant envelope. This is due to the introduction of the controlled ISI, which are greatly superior to that of the QPSK and MSK signals in frequency spectral. Limiting the minimum Euclidean distance, ISI may slightly affect the adjacent baseband symbol signal reception, and improve the performance of the system. We presented the simulation results of the signal modulation and demodulation schemes with controlled ISI, which have been carried out using the MATLAB software. The results reveal that by taking the restriction of the minimum cross-correlation function into account, for the BER of , the reduces by dB. As a future work, we will investigate how to optimize the multi-frequency signals (e.g., OFDM systems) to further improve the achievable spectral efficiency.
Acknowledgments
This research has been supported by the National Key Research and Development Program of China-Government Corporation Special Program (2016YFE0111100), Fundamental Research Funds for the Central Universities (GK2080260160 and GK2080260166).
Author Contributions
Wenjing Shang did the mathematical modeling and the simulations. She also wrote the draft of the paper. Yidong Xu contributed to the revisions and the discussion of the results. Junwei Qi, Wei Xue and Sergey B. Makarov put forward the idea and checked the simulation of this paper.
Conflicts of Interest
The authors declare no conflict of interest.
References
- Simon, M.K. Bandwidth-Efficient Digital Modulation with Application to Deep-Space Communications; John Wiley & Sons: Hoboken, NJ, USA, 2003; Volume 2. [Google Scholar]
- Han, S.H.; Lee, J.H. An overview of peak-to-average power ratio reduction techniques for multicarrier transmission. IEEE Wirel. Commun. 2005, 12, 56–65. [Google Scholar] [CrossRef]
- Boonkajay, A.; Adachi, F. A blind selected mapping technique for low-PAPR single-carrier signal transmission. In Proceedings of the International Conference on Information, Communications and Signal Processing, Singapore, 2–4 December 2015; pp. 1–5. [Google Scholar]
- Falconer, D. Linear Precoding of OFDMA Signals to Minimize Their Instantaneous Power Variance. In Proceedings of the Wireless Communications and NETWORKING Conference, Sydney, Australia, 18–21 April 2010; pp. 1–6. [Google Scholar]
- Kawamura, T.; Kishiyama, Y.; Higuchi, K.; Sawahashi, M. Comparisons of 16QAM Modulation Schemes Considering PAPR for Single-Carrier FDMA Radio Access in Evolved UTRA Uplink. In Proceedings of the IEEE Ninth International Symposium on Spread Spectrum Techniques and Applications, Manaus-Amazon, Brazil, 28–31 August 2006; pp. 332–336. [Google Scholar]
- Pasupathy, S. Minimum shift keying: A spectrally efficient modulation. IEEE Commun. Mag. 1979, 17, 14–22. [Google Scholar] [CrossRef]
- Goode, S.H. A comparison of Gaussian minimum shift keying to frequency shift keying for land mobile radio. In Proceedings of the 34th IEEE Vehicular Technology Conference, Pittsburgh, PA, USA, 21–23 May 1984; Volume 34, pp. 136–141. [Google Scholar]
- Pauli, M.; Kuchenbecker, P. On the reduction of the out-of-band radiation of OFDM-signals. In Proceedings of the IEEE International Conference on Communications (ICC98), Atlanta, GA, USA, 7–11 June 1998; Volume 3, pp. 1304–1308. [Google Scholar]
- SHKOL’NYY, L.A. The Minimum Out-of-Band Radiation Optimization of Radio Pulse Shape. Radio Technol. 1975, 30, 12–15. [Google Scholar]
- Xue, W.; Ma, W.; Chen, B. A realization method of the optimized efficient spectrum signals using fourier series. In Proceedings of the 2010 6th International Conference on Wireless Communications, Networking and Mobile Computing (WiCOM), Chengdu, China, 23–25 September 2010. [Google Scholar]
- Mason, S.J.; Zimmermann, H.J. Electronic Circuits, Signals and Systems; Wiley: New York, NY, USA, 1960. [Google Scholar]
- Liu, L.; Liang, J. Clipping based MC-CDMA system with lower peak-to-average power ratio. Comput. Eng. Appl. 2007, 43, 129–132. [Google Scholar]
- Haykin, S.; Van Veen, B. Signals and Systems; Wiley: New York, NY, USA, 2002. [Google Scholar]
- Hu, H.; Hu, R. Calculus of Variations; China Architecture and Building Press: Beijing, China, 1987. [Google Scholar]
- He, X.; Pei, C.; Meng, Y. A baseband GMSK signal correlator and its output probability distribution. J. Electron. Inf. Technol. 2009, 32, 2532–2535. [Google Scholar]
- Zhao, H.; Zhao, D.; Hou, C. Design and Implementation of MSK Modem. J. Harbin Univ. Sci. Technol. 2011, 16, 102–106. [Google Scholar]
- Xu, Y.; Xue, W.; Shang, W. A Pan-Function Model for the Utilization of Bandwidth Improvement and PAPR Reduction. Math. Probl. Eng. 2014, 2014. [Google Scholar] [CrossRef]
Figure 1.
Waveforms of for various n (i.e., from 1 to 5).

Figure 2.
Composed modes of three random baseband symbols in the interval .

Figure 3.
Synthetic waveforms of three bits random baseband symbols in the interval .

Figure 4.
Waveform of the optimized baseband signals.

Figure 5.
Normalized power spectra curves of the optimized signals. Curve 1 corresponds to the MSK and curves 2–5 correspond to , , , and , respectively.
Figure 5.
Normalized power spectra curves of the optimized signals. Curve 1 corresponds to the MSK and curves 2–5 correspond to , , , and , respectively.

Figure 6.
Block diagram of the quadrature modulation system.

Figure 7.
Block diagram of the partial-respond coherent demodulation. NCO: numerical control oscillator.
Figure 7.
Block diagram of the partial-respond coherent demodulation. NCO: numerical control oscillator.

Figure 8.
Simulation results of the partial-respond quadrature modulation. (A): The baseband symbol signal transmitted through the in-phase channel; (B): The baseband symbol signal transmitted via the orthogonal channel; (C): The quadrature-modulated output signal.
Figure 8.
Simulation results of the partial-respond quadrature modulation. (A): The baseband symbol signal transmitted through the in-phase channel; (B): The baseband symbol signal transmitted via the orthogonal channel; (C): The quadrature-modulated output signal.

Figure 9.
Simulation results of partial-respond demodulation system. (A): The transmitted signal corrupted with additive white Gaussian noise; (B): The baseband signal demodulated in the in-phase channel; (C): The baseband signal demodulated in the orthogonal channel; (D): The baseband signal through the matched filter and best sampling time.

Figure 10.
Bit error rate (BER) curves of the simulation system.


Table 1.
Euclidean distance between any two waveforms.
| 0 | ||||||||
| - | 0 | |||||||
| - | - | 0 | ||||||
| - | - | - | 0 | |||||
| - | - | - | - | 0 | ||||
| - | - | - | - | - | 0 | |||
| - | - | - | - | - | - | 0 | ||
| - | - | - | - | - | - | - | 0 |
Table 2.
The unknown coefficient of the Fourier series in Equation (20).
Table 2.
The unknown coefficient of the Fourier series in Equation (20).
| n | m | ||||||||
|---|---|---|---|---|---|---|---|---|---|
| 1 | 4 | 0.660 | 0.5000 | 0.1793 | −0.001865 | −0.01111 | - | - | - |
| 3 | 5 | 0.6364 | 0.4998 | 0.2152 | 0.01092 | −0.03402 | −0.01126 | - | - |
| 5 | 6 | 0.6280 | 0.4992 | 0.2266 | 0.02026 | −0.03790 | −0.02006 | −0.003333 | - |
| 7 | 7 | 0.6310 | 0.4995 | 0.2224 | 0.01635 | −0.03726 | −0.01671 | −0.001131 | 0.0004888 |
Table 3.
Comparison of the characteristics of the signals of the energy spectrum and K. MSK: minimum shift keying.
Table 3.
Comparison of the characteristics of the signals of the energy spectrum and K. MSK: minimum shift keying.
| Waveform | ||||||
|---|---|---|---|---|---|---|
| n=1, m=4 | 1.09 | 1.21 | 0.72 | 1.06 | 6.70 | 6.84 |
| n=3, m=5 | 1.30 | 1.44 | 0.78 | 1.17 | 0.74 | −7.52 |
| n=5, m=6 | 1.43 | 1.61 | 0.79 | 1.20 | 0.45 | −2.64 |
| n=7, m=7 | 1.35 | 1.50 | 0.80 | 1.22 | 0.52 | −11.52 |
| MSK | 2.5 | 8.0 | 0.78 | 1.2 | 0.0 | 0.0 |
© 2017 by the authors. Licensee MDPI, Basel, Switzerland. This article is an open access article distributed under the terms and conditions of the Creative Commons Attribution (CC BY) license (http://creativecommons.org/licenses/by/4.0/).
Share and Cite
MDPI and ACS Style
Shang, W.; Xu, Y.; Qi, J.; Xue, W.; Makarov, S.B. Optimal Waveform of the Partial-Respond Signal Based on Minimum Out-of-Band Radiation Criterion. Appl. Sci. 2017, 7, 1086. https://0-doi-org.brum.beds.ac.uk/10.3390/app7101086
AMA Style
Shang W, Xu Y, Qi J, Xue W, Makarov SB. Optimal Waveform of the Partial-Respond Signal Based on Minimum Out-of-Band Radiation Criterion. Applied Sciences. 2017; 7(10):1086. https://0-doi-org.brum.beds.ac.uk/10.3390/app7101086
Chicago/Turabian StyleShang, Wenjing, Yidong Xu, Junwei Qi, Wei Xue, and Sergey B. Makarov. 2017. "Optimal Waveform of the Partial-Respond Signal Based on Minimum Out-of-Band Radiation Criterion" Applied Sciences 7, no. 10: 1086. https://0-doi-org.brum.beds.ac.uk/10.3390/app7101086
Note that from the first issue of 2016, this journal uses article numbers instead of page numbers. See further details here.